Article

Data-Driven Forecasting of Acute and Chronic Hepatitis B in Ukraine with Recurrent Neural Networks

by
Mykola Butkevych
1,
Sergiy Yakovlev
2,3,* and
Dmytro Chumachenko
1,4,5
1
Mathematical Modelling and Artificial Intelligence Department, National Aerospace University “Kharkiv Aviation Institute”, 61070 Kharkiv, Ukraine
2
Institute of Mathematics, Lodz University of Technology, 90-924 Lodz, Poland
3
Institute of Computer Science and Artificial Intelligence, V.N. Karazin Kharkiv National University, 61000 Kharkiv, Ukraine
4
Ubiquitous Health Technology Lab, University of Waterloo, Waterloo, ON N2L 3G1, Canada
5
Balsillie School of International Affairs, Waterloo, ON N2L 6G2, Canada
*
Author to whom correspondence should be addressed.
Appl. Sci. 2025, 15(13), 7573; https://doi.org/10.3390/app15137573
Submission received: 31 May 2025 / Revised: 17 June 2025 / Accepted: 4 July 2025 / Published: 6 July 2025
(This article belongs to the Special Issue Intelligent Medicine and Health Care, 2nd Edition)

Abstract

Reliable short-term forecasts of hepatitis B incidence are indispensable for sizing national vaccine and antiviral procurement. However, predictive modelling is complicated when surveillance streams experience reporting delays and episodic under-reporting, as has occurred in Ukraine since 2022. We address this challenge by training a deliberately compact two-layer long short-term memory (LSTM) network on 72 monthly observations (January 2018–December 2023) drawn from the Public Health Center electronic registry and evaluating performance on a strictly held-out 12-month horizon (January–December 2024). Grid-search optimisation selected a 12-month sliding input window, 64 hidden units per layer, 0.20 dropout, the Adam optimiser, and early stopping. Walk-forward validation showed that the network attained mean squared errors of 411 for acute infection and 76 for chronic infection on the monthly series. When forecasts were aggregated to the cumulative scale, the mean absolute percentage error remained below 1%. This study presents the first peer-reviewed hepatitis B forecasts calibrated on Ukraine’s registry during a period of pronounced reporting instability, demonstrating that robust accuracy is attainable without missing-value imputation.

1. Introduction

Hepatitis B virus (HBV) is a hepatotropic, partially double-stranded DNA virus of the Hepadnaviridae family [1]. Infection can present as an acute, self-limited disease lasting <6 months or progress to a chronic state defined by the persistence of hepatitis B surface antigen (HBsAg) for ≥6 months [2]. Acute infection is often subclinical in adults but may cause fulminant hepatitis. In contrast, chronic infection follows a dynamic course of immune-tolerant, immune-active, and inactive carrier phases [3]. It may culminate in cirrhosis or hepatocellular carcinoma decades after the initial exposure [4]. Age at infection is the principal determinant of chronicity; >90% of perinatally infected infants become chronic carriers compared with <5% of immunocompetent adults [5].
Despite the availability of an effective vaccine since 1982, HBV remains a leading cause of preventable liver disease [6]. The latest World Health Organization (WHO) update estimated 254 million people living with chronic HBV in 2022 and 1.2 million new infections annually [7]. HBV-related complications caused ~820,000 deaths in 2019, surpassing tuberculosis and rivalling HIV mortality trajectories [8]. Progress toward the WHO’s 2030 elimination targets has stalled; in 2022, only 13% of people with chronic HBV were diagnosed, and a mere 3% received antiviral therapy [7]. The burden is unevenly distributed; the African and Western Pacific Regions account for >75% of prevalent cases, yet health system coverage of birth dose vaccination and nucleotide therapy remains sub-optimal [9].
HBV is also a pressing public health concern for Ukraine. A joint European Centre for Disease Prevention and Control (ECDC) and WHO assessment placed the adult HBsAg prevalence at 1% in 2020, categorising the country as having low-to-moderate endemicity [10]. Vaccination coverage, however, lags behind elimination benchmarks; infant three-dose coverage was 80.9% in 2020, and catch-up immunisation has been inconsistent. Coverage of opioid agonist therapy, critical for preventing parenteral transmission among people who inject drugs (PWID), remains below 6% [10]. Disruptions linked to the ongoing Russian invasion—population displacement, strained laboratory capacity, and interruptions in routine immunisation—risk reversing recent gains, underscoring the need for data-driven surveillance and forward-looking resource allocation.
Data-driven public health leverages digital epidemiology, routine health information systems, and large-scale analytics to transform granular data into actionable insights, enabling a shift from reactive to proactive disease control [11]. For HBV, electronic case-based surveillance, laboratory information management systems, and geospatial vaccination dashboards can identify micro-regions of low coverage and guide targeted birth dose campaigns [12]. Yet translating raw data into policy requires robust analytic frameworks capable of correcting reporting delays, assimilating heterogeneous data streams, and quantifying forecast uncertainty.
Simulation modelling is a cornerstone of modern infectious disease forecasting. Compartmental models (e.g., Susceptible–Exposed–Infectious–Recovered frameworks), agent-based simulations, and increasingly, deep-learning architectures can estimate unobserved transmission parameters, test intervention scenarios, and generate short-term incidence forecasts [13]. A recent review of post-COVID-19 research highlights how big data-enabled simulation combines mobility, social media, and electronic health record data to anticipate epidemic waves [14]. HBV-specific modelling studies, ranging from deterministic systems incorporating vaccination, treatment, and age structure to hybrid SARIMA-neural-network time-series predictors, demonstrate that simulation can quantify the long-term impact of scaling antiviral therapy or improving vaccine uptake [15,16].
Given HBV’s substantial morbidity, Ukraine’s unique epidemiologic context, and the strategic imperative for anticipatory public health planning during the protracted conflict, there is an urgent need for reliable, locally calibrated forecasting tools. This study, therefore, develops and validates a deep recurrent neural network model to predict monthly trajectories of acute and chronic HBV in Ukraine, providing quantitative evidence to inform vaccination catch-up, diagnostic outreach, and antiviral procurement strategies.
Building on these motivations, the present study makes two distinct contributions. First, it delivers the first conflict-calibrated, data-driven forecast of acute and chronic HBV for Ukraine. It shows that a mid-depth recurrent neural network can retain predictive value even when the national notification system is periodically interrupted by war-related shocks. Second, it introduces a dual-scale evaluation protocol that simultaneously assesses monthly and cumulative targets. It clarifies which forecast granularity is fit for tactical outbreak warning and which is adequate for longer-range procurement decisions, a distinction rarely examined in earlier HBV modelling work.
The current research is part of a comprehensive information system for assessing the impact of emergencies on the spread of infectious diseases described in [17].

2. Current Research Analysis

A rapid convergence of biological insight, statistical learning, and policy evaluation characterises current modelling research on hepatitis B. Researchers draw on high-resolution surveillance data, increasingly granular clinical knowledge of viral kinetics, and computational power advances to construct frameworks ranging from stochastic differential systems to deep learning predictors. These efforts aim to forecast incidence with greater precision and test the impact of vaccination, treatment, and behavioural interventions under plausible real-world constraints. By integrating mechanistic detail with data-driven calibration, the field is shifting from retrospective description to prospective decision support, laying the groundwork for adaptive public health strategies in both stable and crisis settings.
Side et al. [18] extended classical compartmental modelling of hepatitis B by introducing a five-state Susceptible–Exposed–Infectious–Recovered–Infectious (SEIRI) framework and coupling it with a graph-theoretical procedure to derive the basic reproduction number. The authors established disease-free and endemic equilibria, proved local stability through Jacobian eigenvalue analysis, and approximated long-term dynamics for Makassar, Indonesia, by numerically integrating the system with assumed parameter sets in Maple. Their simulations suggest that hepatitis B incidence can either wane or persist depending on small shifts in transmission and recovery parameters. This underscores the sensitivity of control outcomes to vaccination and treatment coverage.
Fang et al. [16] addressed the persistently high hepatitis B burden in Hainan, China, by coupling classical time-series analysis with machine learning. Using provincial surveillance data (2017–2020), they decomposed monthly incidence into trend and seasonality and estimated separate seasonal ARIMA and GM(1,1) grey models. Then, they integrated the ARIMA output into a back-propagation neural network to capture residual nonlinear structure. Validation against 2021 data showed that the hybrid SARIMA-BPNN specification achieved the lowest error (MAPE = 0.087) and thus provided the most reliable basis for forward projection, forecasting a province-wide decline in 2022 with the sharpest drop in March.
Focusing on translational modelling rather than bench virology, Boivin-Champeaux et al. [19] delivered a tutorial-style synthesis of how mathematical representations capture the natural history of acute and chronic HBV. After a concise review of viral entry, replication and biomarker kinetics, the authors dissected successive generations of models that embedded key biological mechanisms such as non-cytolytic clearance, adaptive immunity, hepatocyte proliferation, and intracellular cccDNA turnover, commenting on their assumptions, stability properties, and clinical interpretability. Parameter tables, code listings, and two interactive R Shiny apps allow readers to experiment with seven exemplar models, revealing how structural choices and parameter values shift predicted viral and ALT trajectories and illustrating best practices when coupling disease progression engines to pharmacokinetic–pharmacodynamic analyses.
Li et al. [20] present a data-driven study in which the authors developed an attention-enhanced long short-term memory (A-LSTM) neural network to forecast monthly new hepatitis B infections in mainland China from 2004 to 2017 and evaluated its performance against a back-propagation neural network (BPNN). Using surveillance counts from the Chinese Public Health Science Data Center, the authors trained two-layer A-LSTM models with varying hidden-unit sizes, selected the configuration with five units based on error minimisation, and reported markedly lower RMSE (1780) and MAPE (1.79%) than the best BPNN alternative (RMSE = 3519; MAPE = 3.86%). The attention mechanism captures temporal dependencies more effectively than traditional sequence-to-sequence baselines, yielding closer alignment between predicted and observed incidence for most months in the 2018 hold-out period.
Xu et al. [21] expanded traditional SEIR-style hepatitis B frameworks by adding a distinct “potentially infectious” compartment to represent latent carriers and fitting the resulting seven-class differential equation model to China’s 2003–2021 surveillance data. Parameter estimation combined nonlinear least squares with a genetic algorithm, yielding a control reproduction number Rc = 1.741 and an estimate of roughly 450,000 latent carriers. Sensitivity and scenario analyses showed that vaccination failure, baseline transmissibility, and the latent-to-carrier conversion rate drive Rc. Simulations further indicated that boosting adult vaccination coverage and improving vaccine efficacy would curb incidence.
Ma J. and Ma S. [22] formulated and analysed a four-compartment stochastic hepatitis B model that couples saturated, nonlinear transmission with a media coverage function that dampens effective contact as public awareness rises. Environmental variability was introduced through independent Gaussian white noise perturbations assigned to each state variable, and the authors derived threshold conditions for almost-sure extinction and the existence of a unique ergodic stationary distribution. Numerical experiments calibrated to Chinese Center for Disease Control surveillance data (2005–2021) reproduced the historical incidence trajectory and suggested that, under current control intensity, nationwide rates will stabilise at roughly 50–60 cases per 100,000 people.
The study by Zhao et al. [23] analysed eight years of monthly hepatitis B case counts from 31 provinces in mainland China (2013–2020) and showed that incidence displays a clear annual cycle with troughs in February and peaks in March. After confirming stationarity through logarithmic transformation and seasonal differencing, the authors identified SARIMA(1,0,0)(0,1,1) as the best fitting model, verified that its residuals formed white noise, and demonstrated good in-sample agreement between fitted and observed values. Validation against 2021 data indicated that all forecast points fell within the 95% confidence band. This suggests that a simple seasonal ARIMA specification can provide reliable short-term national surveillance and resource planning projections.
De Villiers et al. [24] conducted a head-to-head comparison of the Imperial HBV model and the CDA Foundation’s PRoGReSs model, feeding both with harmonised demographic, prevalence, and vaccination-coverage inputs for Ethiopia, India, Nigeria, and Pakistan to explore how scaling the infant three-dose series and the timely birth dose to 95% coverage would influence hepatitis B trajectories to 2099. Despite similar baseline fits, the models diverged once interventions were varied; PRoGReSs projected larger gains from expanding the infant series because it allowed that schedule to block a substantial share of perinatal infections, whereas Imperial attributed greater benefit to the birth dose, owing to its assumption that perinatal transmission was curtailed only by vaccination in the first 24 h. This structural contrast yielded a ten-fold difference in estimated cases, and deaths averted in some scenarios. It illustrates how policy conclusions can hinge on unobserved mechanisms embedded in simulation frameworks.
El Koufi and Rao [25] developed a stochastic hepatitis B transmission model that coupled continuous environmental noise with discrete regime changes governed by a finite-state Markov chain. The framework partitioned the population into susceptible, acutely infected, chronically infected, and recovered classes; added multiplicative white-noise perturbations to each equation; and allowed key parameters (e.g., transmission, vaccination, mortality) to switch between alternative environmental states. The authors established solutions’ global existence, uniqueness, and positivity; derived a threshold Rsw that determined whether the infection persisted around a unique ergodic stationary distribution or died out almost surely; and confirmed their analytical results with Milstein-scheme simulations that illustrated persistence and extinction scenarios.
Cheng et al. [26] constructed an age-heterogeneous SEICR transmission model for hepatitis B in China that split adults into three cohorts (15–25, 25–70, ≥70 years), embedded preferential mixing between age groups, and explicitly represented vaccination as a flow from the susceptible to the recovered class. Model parameters were fitted to national cumulative case counts from 2004 to 2018 by nonlinear least squares. Then, Latin-hypercube/PRCC sensitivity analysis, contact rate perturbations, and a suite of vaccination coverage scenarios were explored. The simulations showed that incidence is driven chiefly by the 25–70-year-old cohort. Reducing average contact rates alone has limited impact, whereas scaling booster vaccination in the 15–70-year-old population to 90% can lower cumulative infections by roughly 60% and flatten the projected epidemic curve enough to meet the WHO’s 2030 morbidity reduction target.
A brief analysis of the current state of research is presented in Table 1.
The current literature shows that forecast accuracy and policy relevance depend as much on transparent structural assumptions and robust calibration as on algorithmic sophistication. Machine learning models excel at short-term prediction, whereas mechanistic simulators remain indispensable for exploring counterfactual scenarios. Few studies bridge these strengths in a single tool or address data disruptions typical of conflict-affected contexts such as Ukraine. Moreover, discrepancies between leading vaccination models underscore persistent structural uncertainty, and limited attention to latent carriers, adult booster programmes, and adherence dynamics leaves important questions unanswered. The present study advances by developing recurrent neural networks to forecast acute and chronic hepatitis B in Ukraine under conditions of ongoing disruption.

3. Materials and Methods

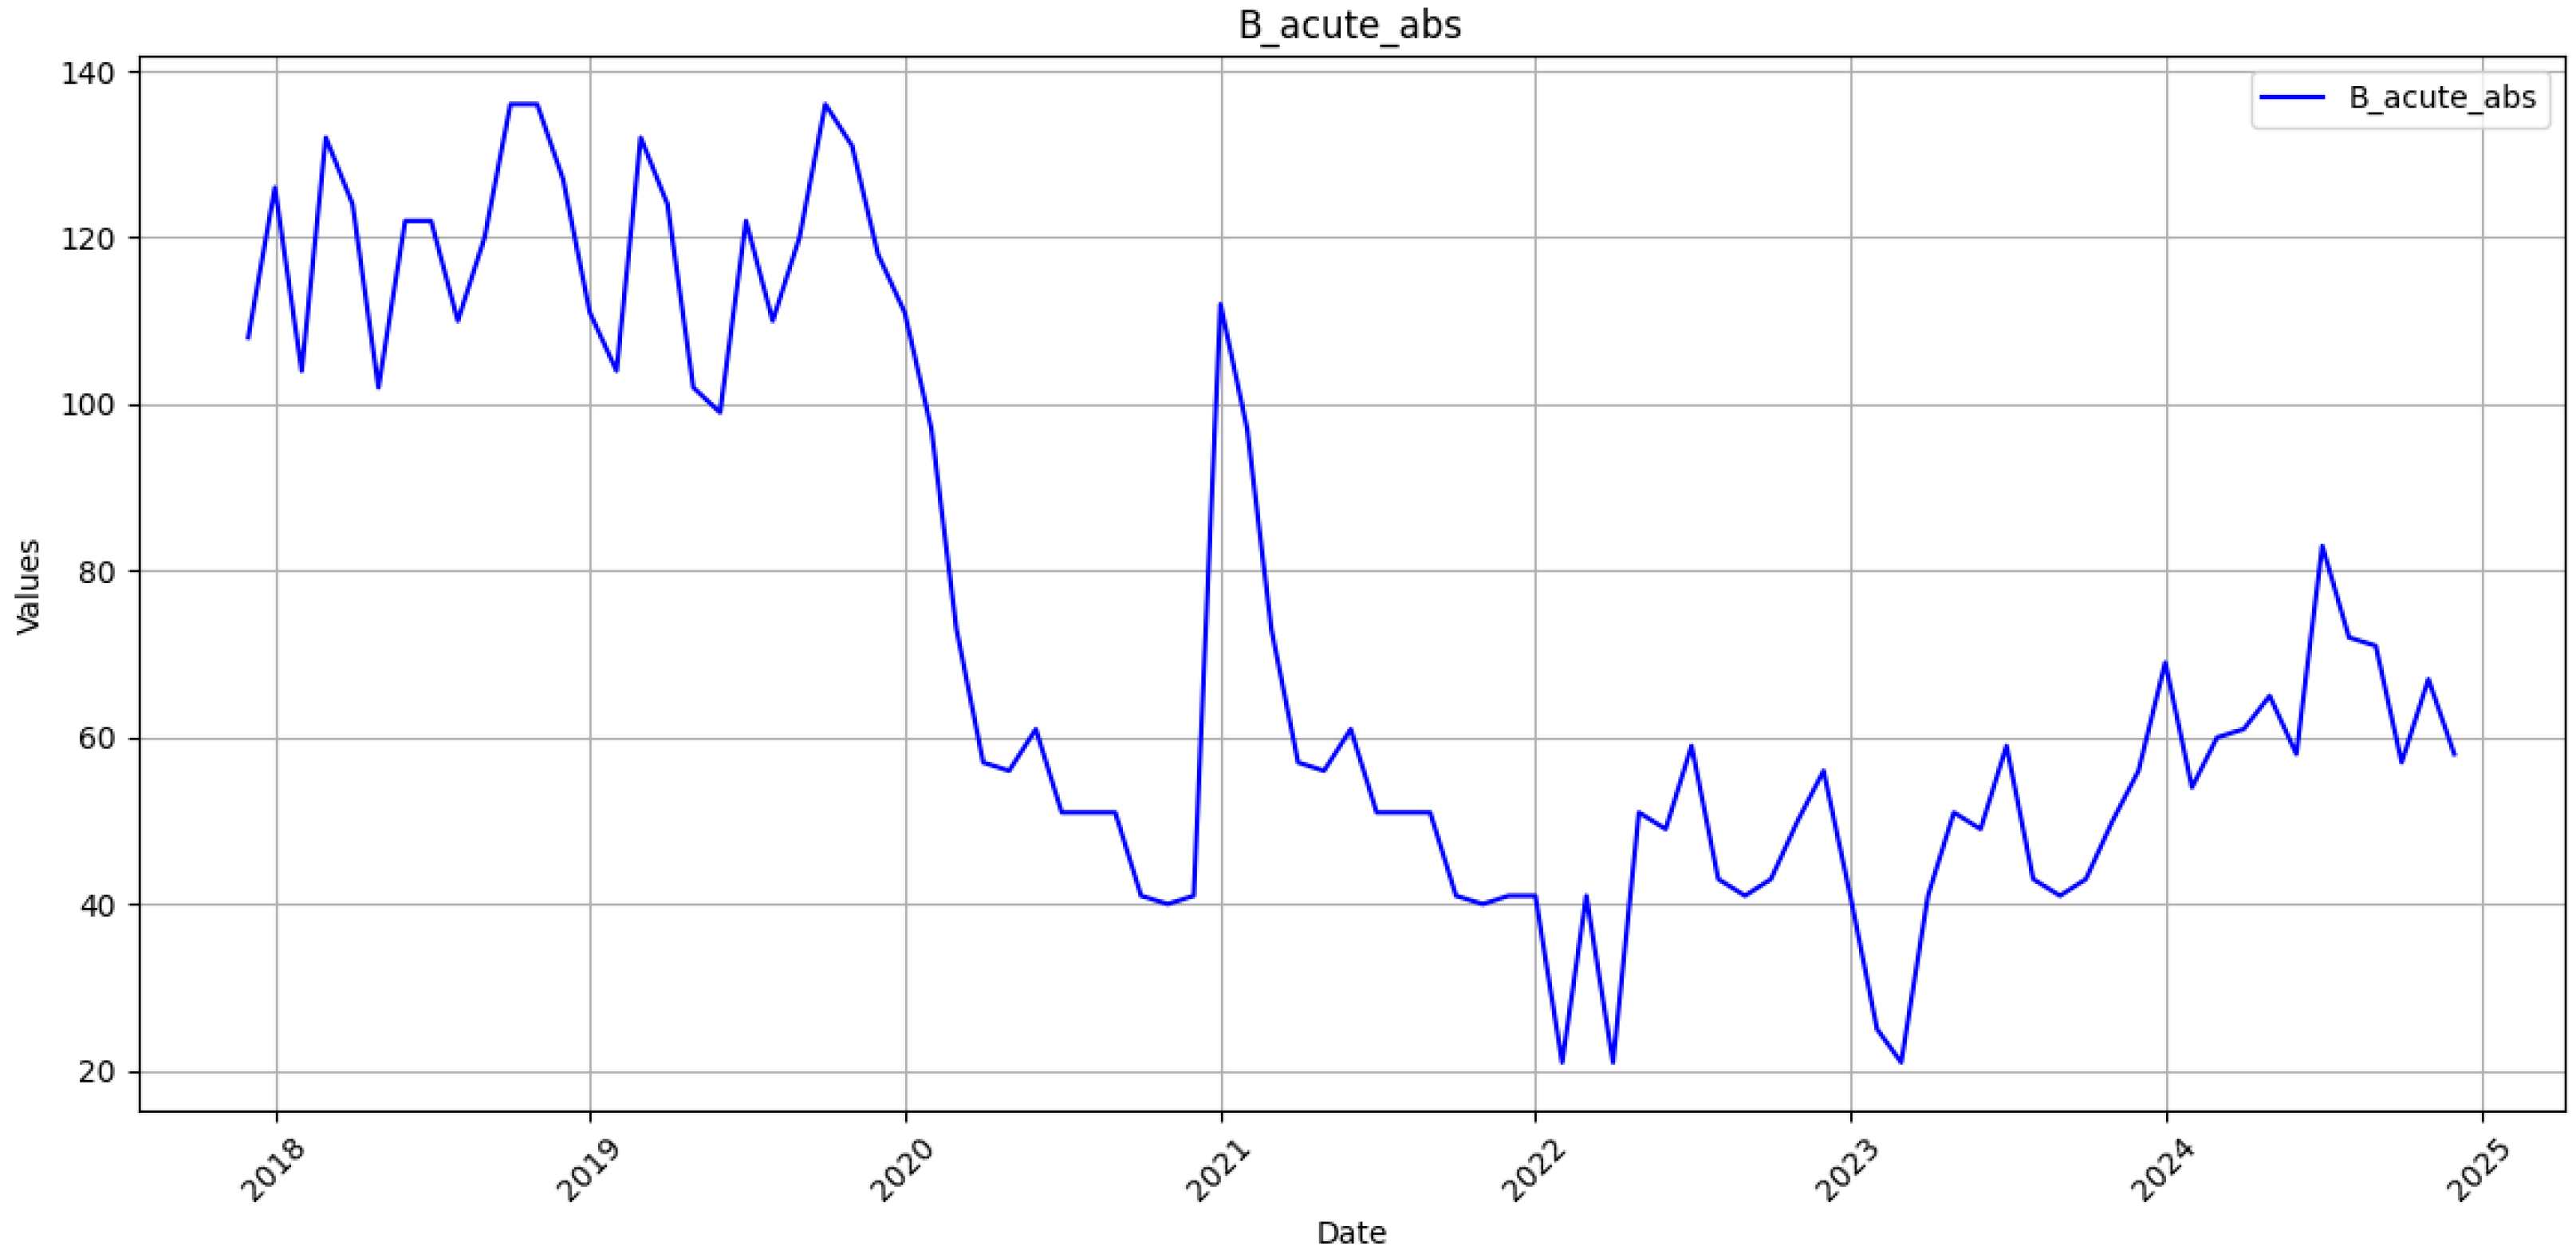
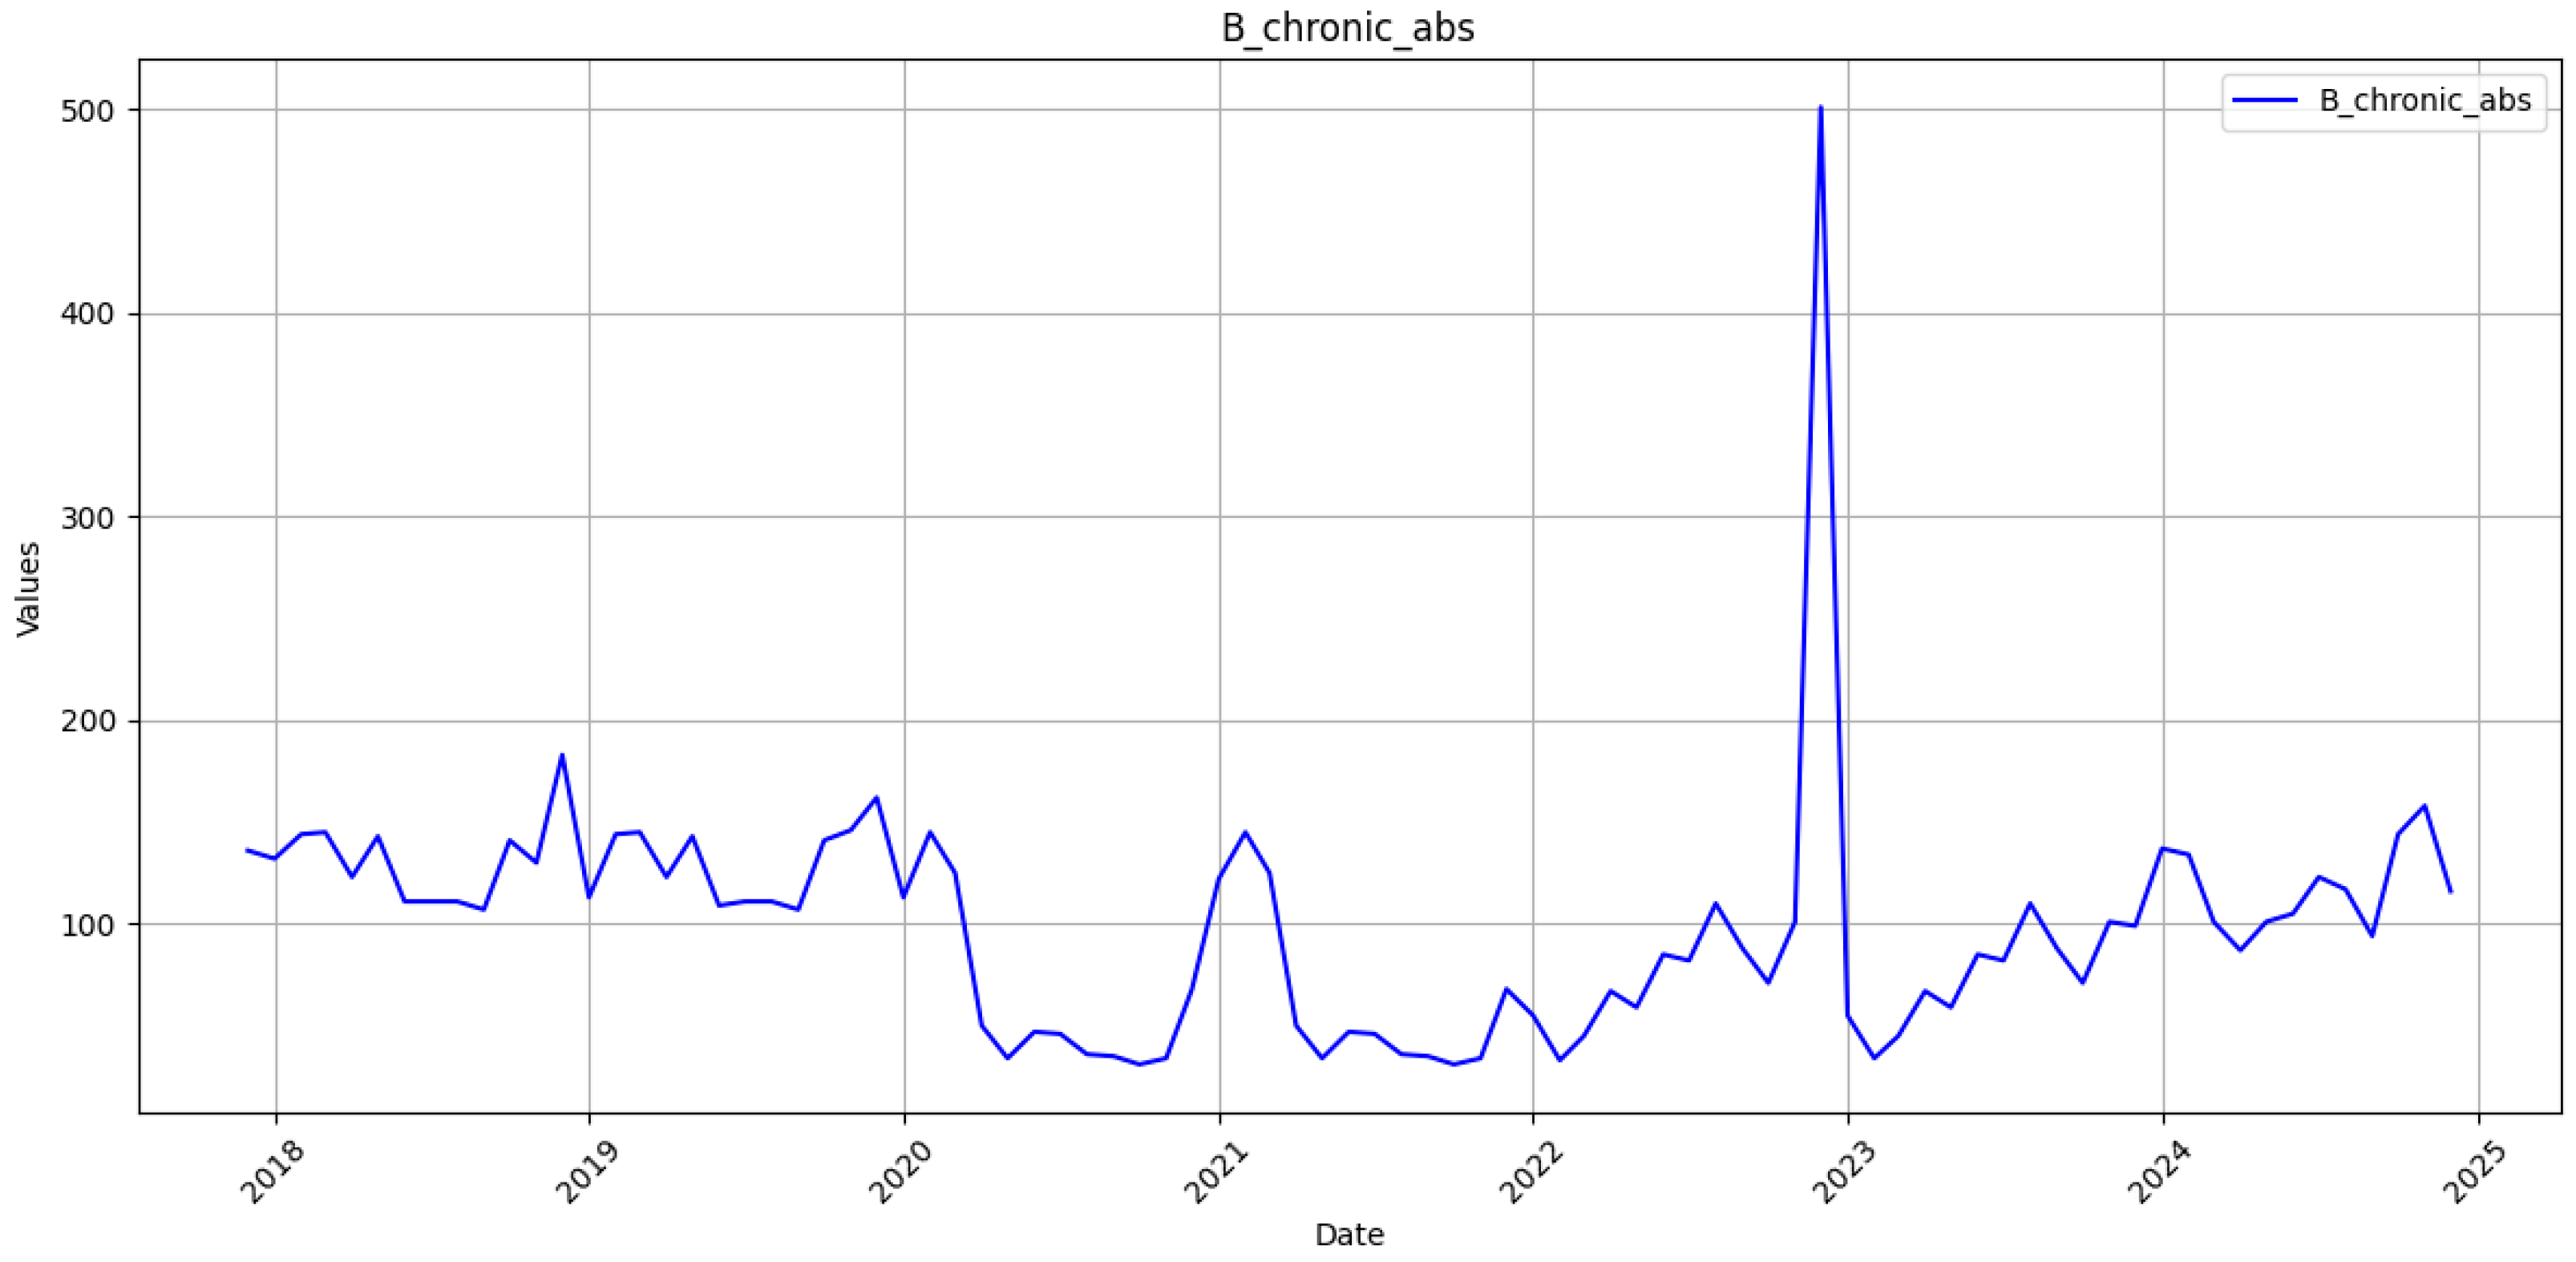
The monthly incidence of laboratory-confirmed acute and chronic hepatitis B was obtained from the open reporting system of the Public Health Center of the Ministry of Health of Ukraine [
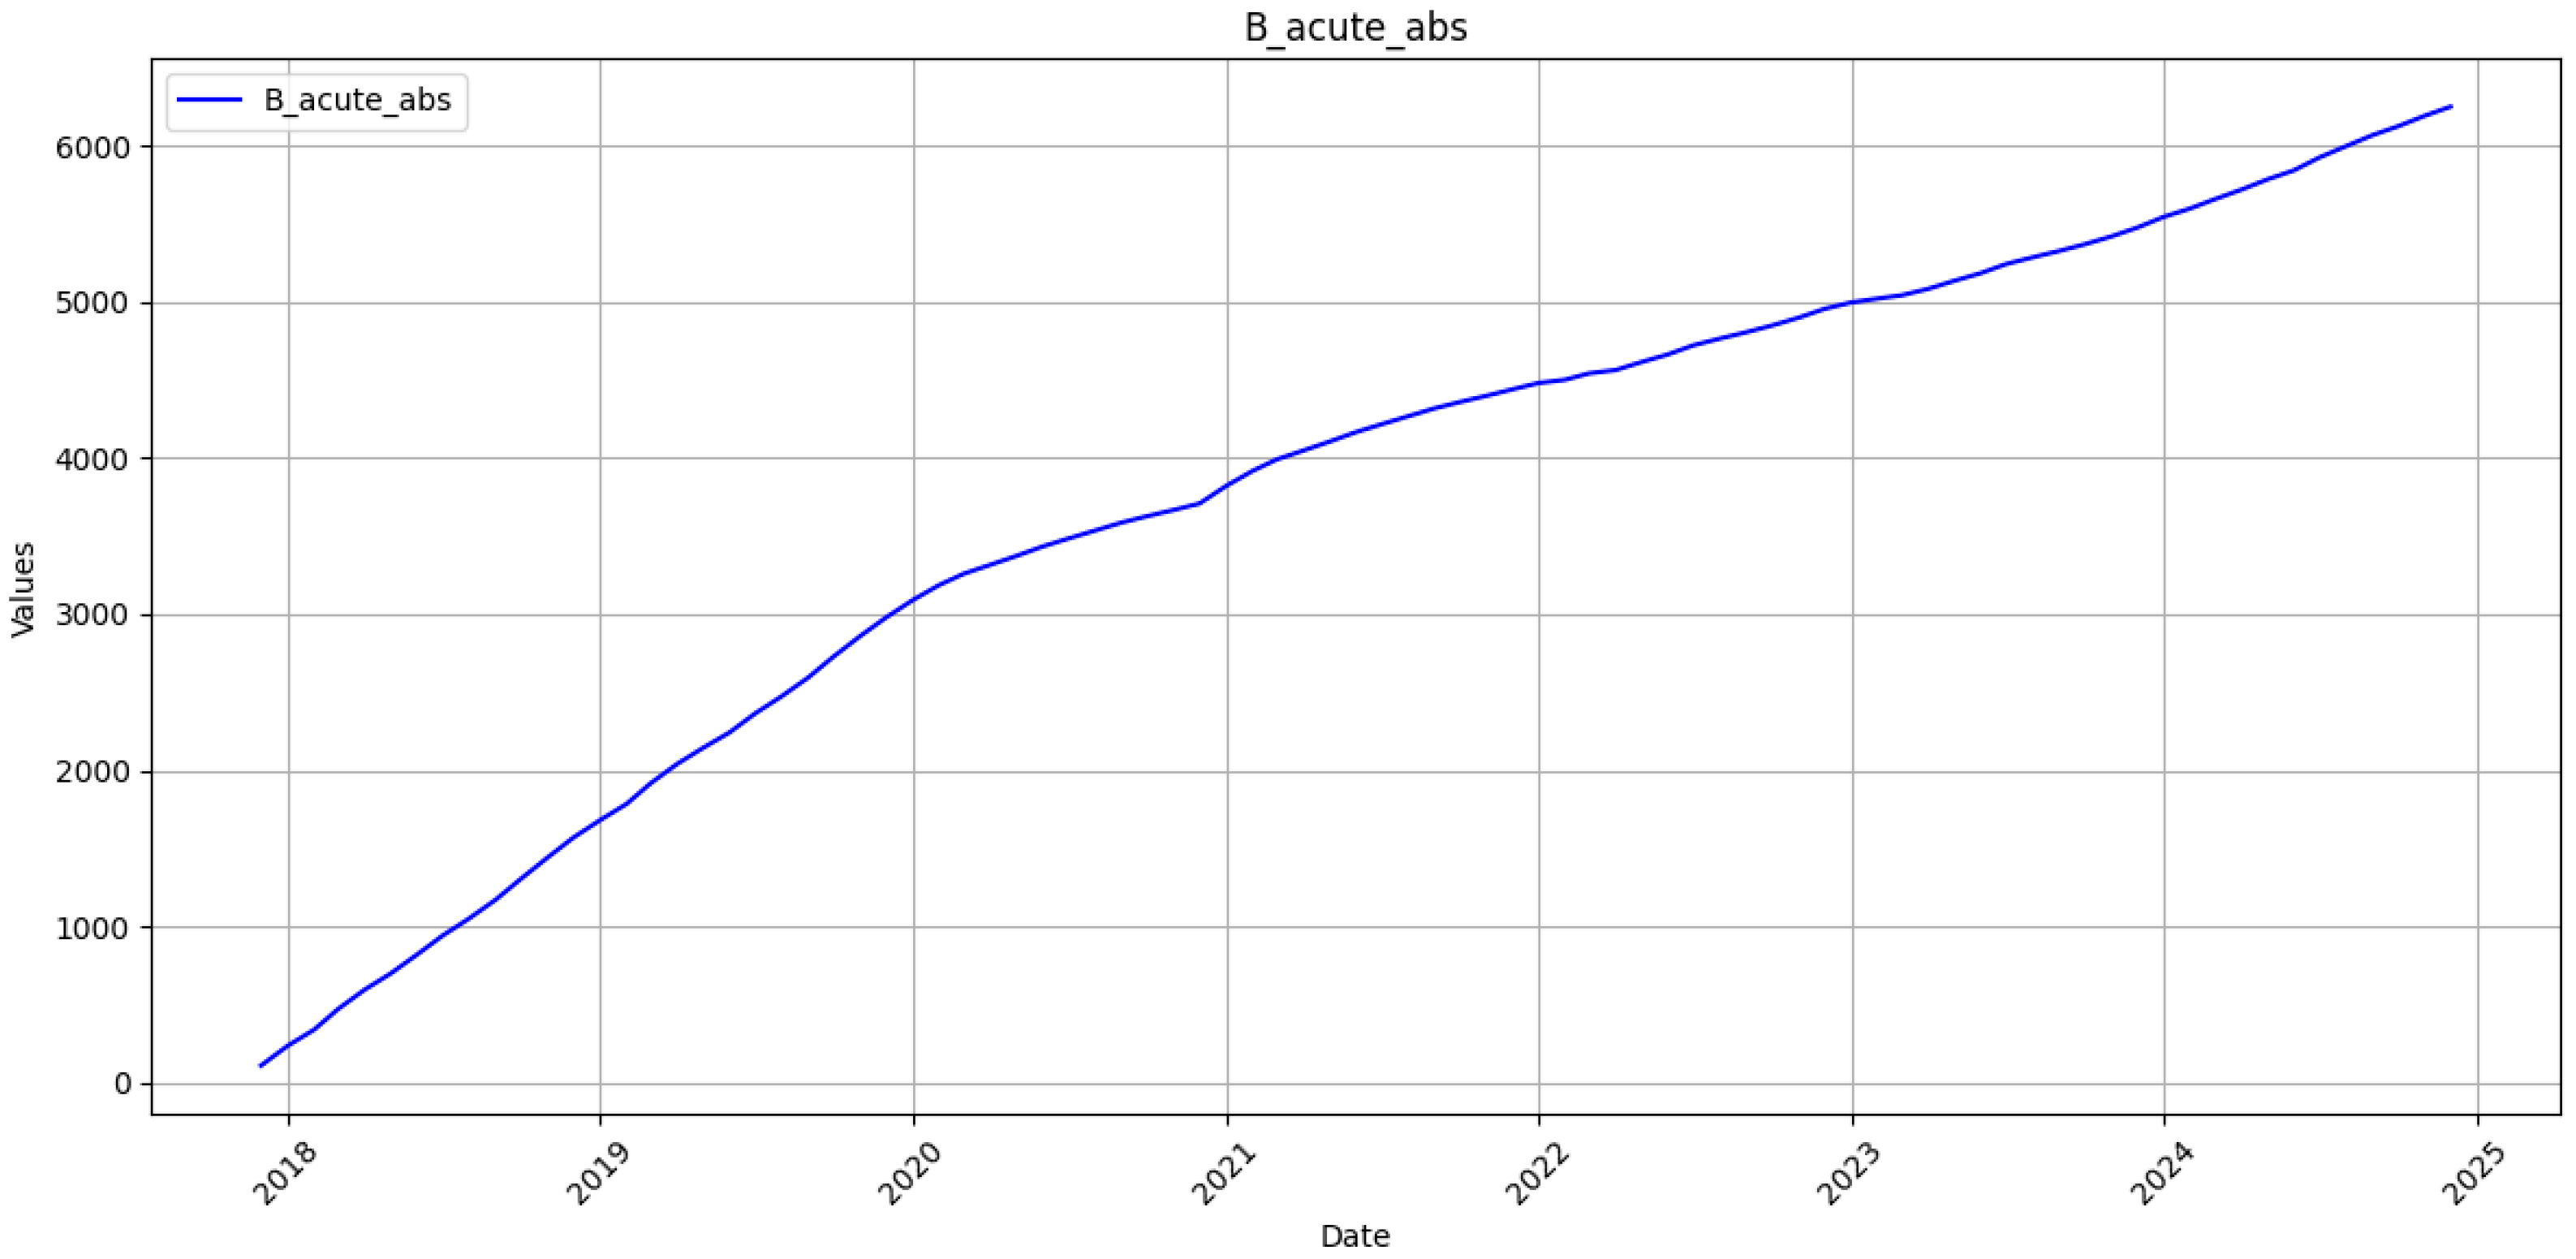
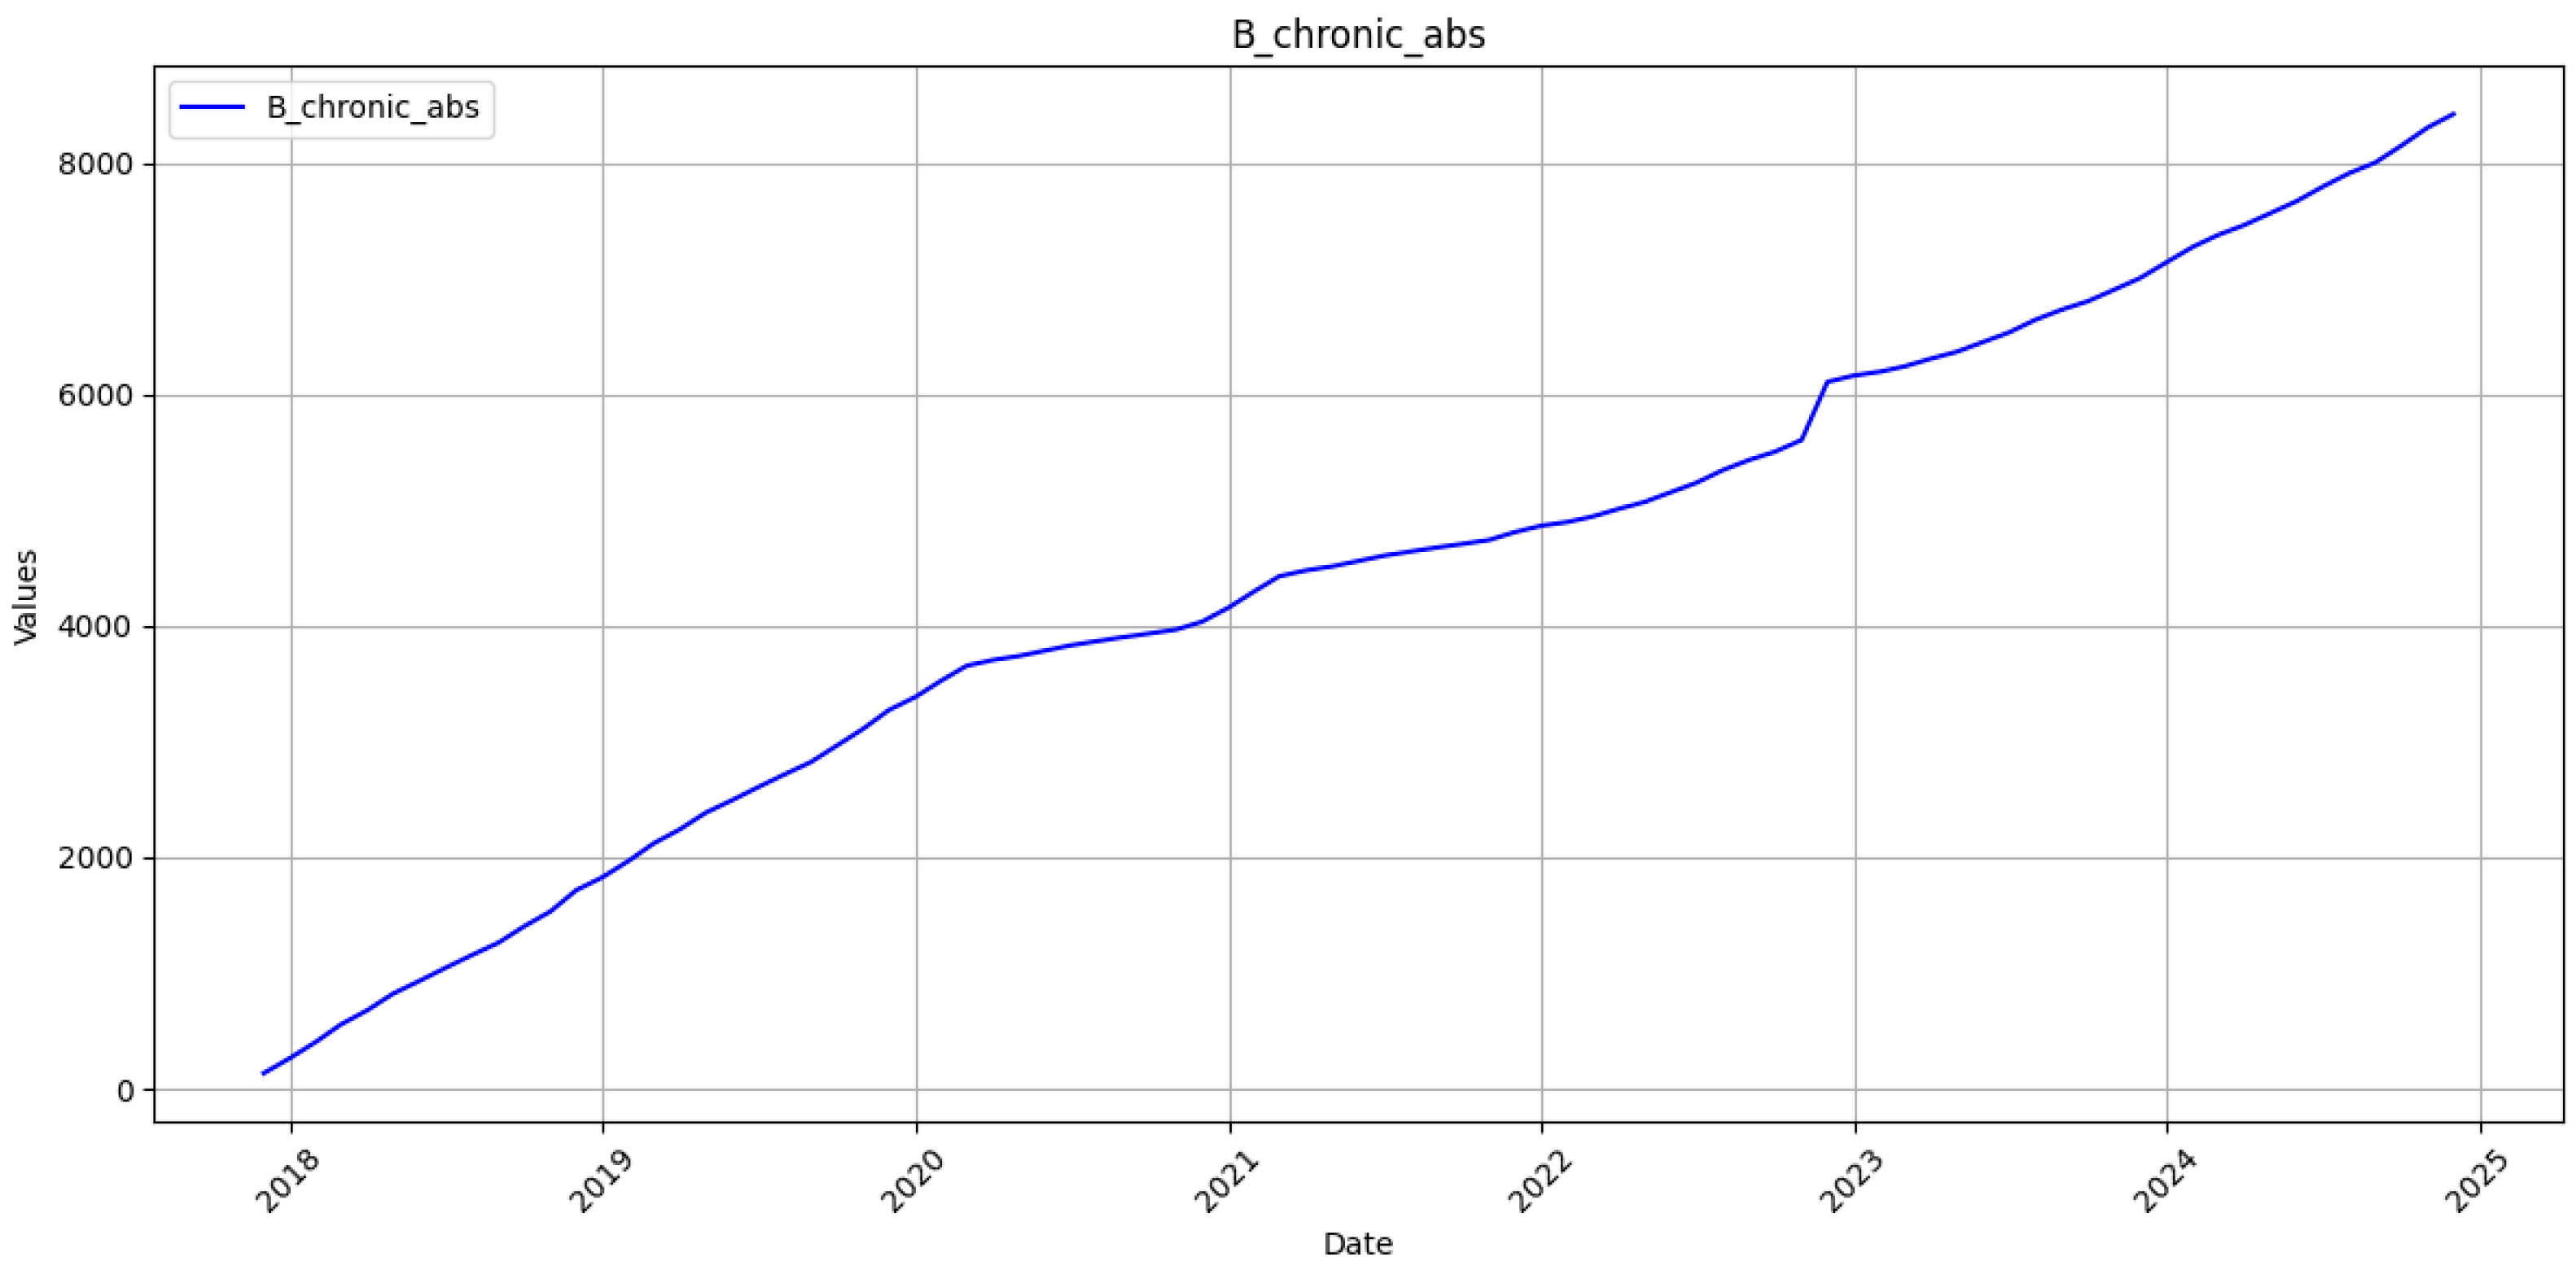
27]. The time series spans January 2018–December 2023. Reports for January–December 2024 were withheld for strict out-of-sample assessment. Case definitions follow the Ministry of Health standard; acute infection denotes clinical onset within six months of exposure, whereas chronic infection requires the persistence of HBsAg for at least six months. Monthly notifications are entered into the Public Health Center electronic registry under a compulsory laboratory confirmation scheme. Each record passes a built-in range and type validation before release. A completeness audit showed 0 missing months for 2018–2023, while the linear rise in the cumulative series further indicates uninterrupted reporting. Consequently, the 72-month training set provides a coherent basis for sequence learning.
Two parallel time series were created for each category: the original monthly counts and their cumulative sums. To stabilise gradients, the values in the estimation sample were transformed to the unit interval by min-max scaling. Given a training vector x = (x1, …, xT) the min-max transform is
x t * = x t m i n 1 j T x j m a x 1 j T x j m i n 1 j T x j ,   t = 1 , , T .
The corresponding inverse mapping applied to any forecast x ^ t * that lies in [0, 1] is
x ^ t = x t * ^ max 1 j T x j min 1 j T x j + m i n 1 j T x j .
The same transformation was applied to the validation and test splits. Predictions were inverse-scaled before evaluation. No missing observations were present, so no imputation was required.
A deep sequence-to-one recurrent network was developed. The architecture of the model is presented in Figure 1.
The first LSTM captures short-range patterns and passes only its final hidden state. The second propagates long-range dependencies by returning the full hidden sequence. The dense layer compresses the representation before the linear output neuron produces a one-step-ahead forecast. The total number of trainable parameters is 171,251.
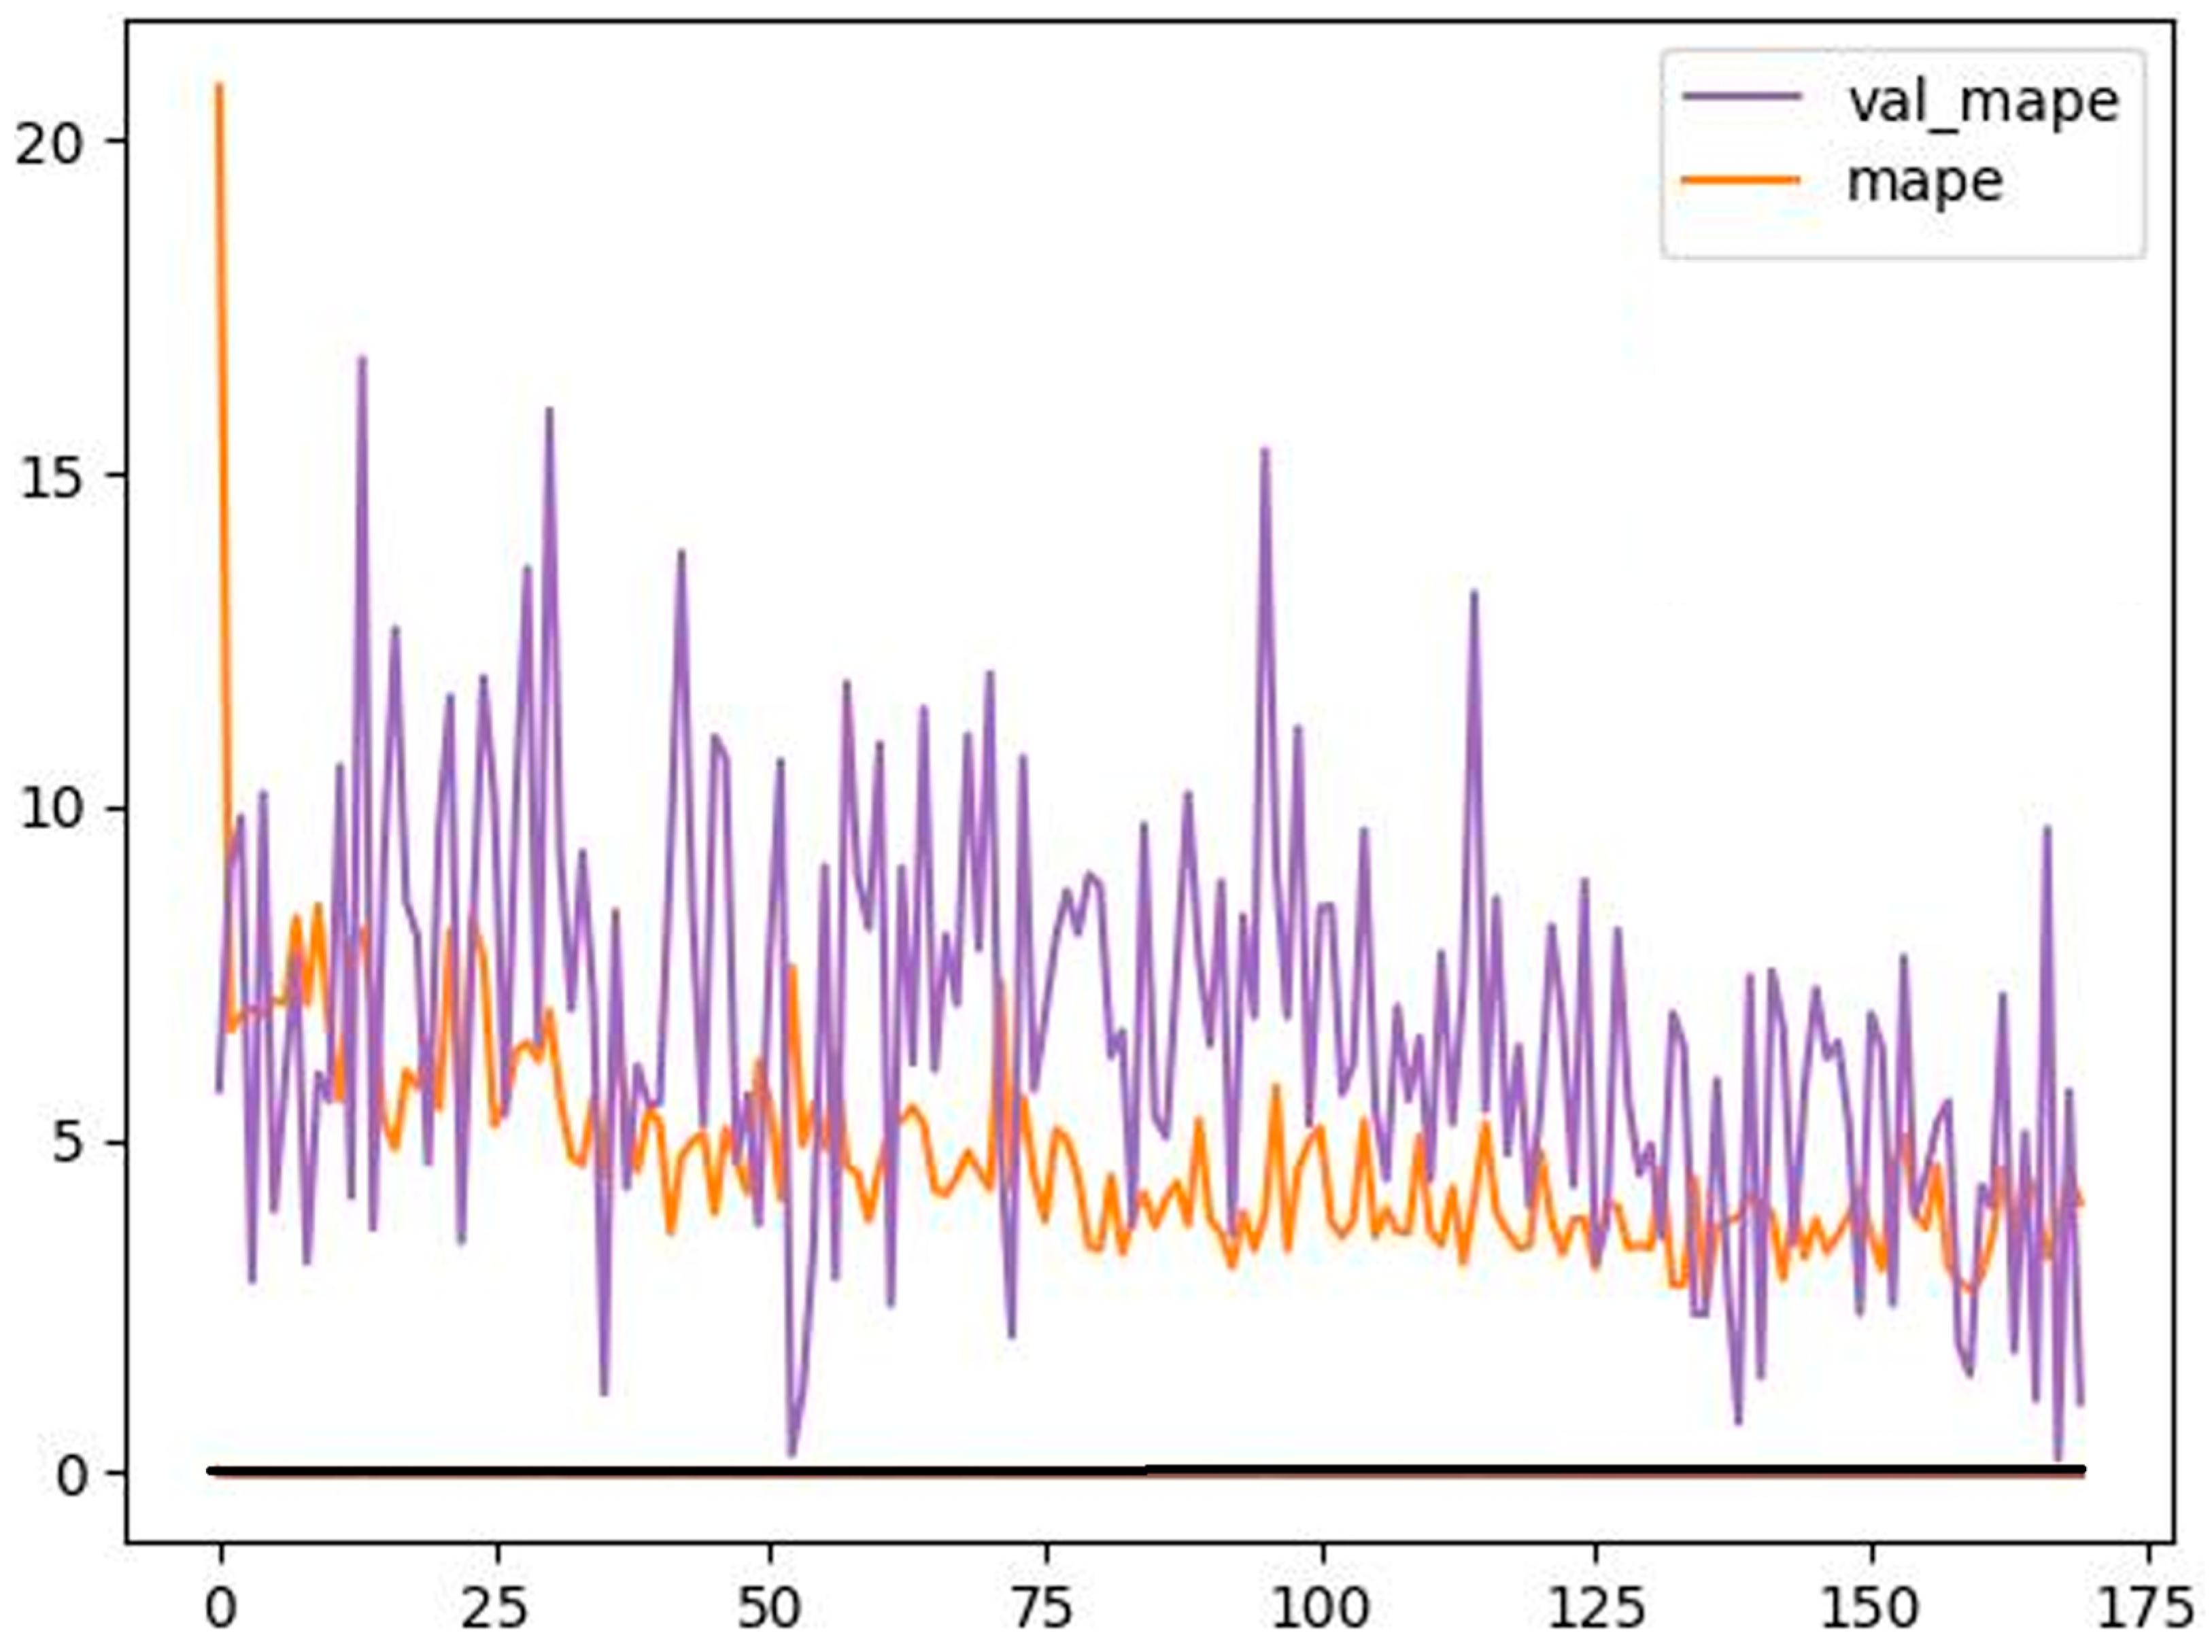
Separate networks were fitted to the acute and chronic series. Weight updates employed back-propagation through time with an adaptively decaying learning rate. For the acute model, the optimisation converged after 170 epochs. The chronic model stabilised after 50 epochs. These epoch counts are dictated by the early-stopping rule embedded in the draft code and were not altered.
The loss function for gradient descent was the mean absolute percentage error (MAPE). Mean squared error (MSE) was monitored as a secondary diagnostic but not minimised directly during training.
Let L denote the fixed input-window length. At calendar time t, the model receives
xt = (xtL+1, xtL+2,…,xt),
and produces x ^ t + 1 = f θ ( x t ) , where is the trained network with parameters θ. The window is then advanced by discarding xtL+1 and appending x ^ t + 1 . The process iterates until the desired horizon is reached. This sliding window recursion enables multi-step forecasts without modifying the network weights.
Forecast accuracy on the back-transformed scale was quantified with
M S E = 1 n i = 1 n y i y ^ i 2 ,
M A P E = 100 n i = 1 n y i y ^ i y i ,
where yi and y ^ i denote the observed and predicted cases for month i, and n is the number of test observations. Both metrics were calculated separately for each clinical category’s monthly and cumulative series.
The proposed pipeline constitutes a fully reproducible framework for short- and medium-term forecasting of hepatitis B incidence in Ukraine.
All analyses were implemented in Python 3.11.4 with PyTorch 2.2.0 operating exclusively on the CPU of a 2022-model laptop (Intel i7-1260P, 16 GB RAM), and CUDA was disabled throughout. Table 2 presents software environment and hyper-parameter configuration.

4. Results

Section 4 is organised to demonstrate three points. We begin with a descriptive synopsis of the surveillance series to establish baseline variability against which forecast error must be judged. We then document model convergence and residual behaviour to verify that the recurrent network is adequately trained and free of over-fitting. Finally, we present and interpret monthly and cumulative forecasts, the former germane to short-range outbreak warnings and the latter to annual stock-management targets.

4.1. Descriptive Behaviour of the Surveillance Series

Figure 2 depicts the monthly incidence of acute hepatitis B between January 2018 and November 2024. The series declines overall but exhibits two marked surges (February 2021 and November 2021) before reaching its minimum in early 2022 and showing a modest recovery thereafter.
The chronic hepatitis B series is less volatile (Figure 3). It remains nearly flat until mid-2022, rises sharply in 2023, co-incident with intensified case-finding, and resumes a gentle upward drift through 2024.
Their cumulative counterparts (Figure 4 and Figure 5) grow almost linearly, confirming the absence of reporting gaps and motivating parallel evaluation of level and cumulative forecasts.
Table 3 shows descriptive statistics for the training period (January 2018—December 2023).

4.2. Convergrnce of the Recurrent Models

Figure 6, Figure 7, Figure 8 and Figure 9 display training and validation MAPE trajectories for the acute monthly, chronic monthly, acute cumulative, and chronic cumulative networks, respectively. All curves descend smoothly during the first 30–50 epochs, after which validation loss stabilises and early-stopping halts optimisation once improvement remains below 0.1% for five consecutive epochs. No divergence between training and validation traces is visible, indicating the absence of overfitting.
The network trained on acute cases required 170 epochs before the validation loss ceased to improve, whereas the chronic model stabilised after 50 epochs. Convergence took 300–320 epochs for the cumulative cases but yielded markedly lower validation error, with final-validation MAPE below 3% for the chronic cumulative model.
Convergence diagnostics are presented in Table 4. The final validation MAPE for the most variable target (acute monthly) is 5.4%, whereas, for the chronic cumulative, it drops to 2.3%.
Model adequacy is judged on a held-out validation slice by early stopping, the residual whiteness tests reported in Section 4.3, and forward-chaining error metrics in Table 5, ensuring that data fitting is not a consequence of over-parameterisation.

4.3. Forecasting Results

Figure 10 shows the forecast for monthly cases of acute hepatitis B over the 16-month hold-out horizon (September 2023–December 2024). The model tracks the overall downward trend but fails to reproduce the sharp local maxima. This smoothing bias results in a test-set MAPE of 13.78% and an MSE of 411.20.
Figure 11 shows the forecast for monthly cases of chronic hepatitis B over the 12-month hold-out horizon (January 2024–December 2024). The model underestimates the late-autumn peak by roughly 18 cases, giving a MAPE of 17.13% and an MSE of 76.26.
Error is substantially smaller for the cumulative targets. Figure 12 shows the forecast for monthly cases of acute hepatitis B over the 16-month hold-out horizon (September 2023–December 2024). The acute cumulative forecasts deviate from the empirical trajectory by <1% in absolute terms.
Figure 13 shows the forecast for monthly cases of chronic hepatitis B over the 12-month hold-out horizon (January 2024–December 2024). The chronic cumulative series is reproduced almost exactly, with the prediction curve lying marginally above the empirical counts throughout the test period. Corresponding MAPEs are 2.9% and 2.1%, respectively.
The model’s performance is presented in Table 5.
Table 5. Metrics (test set).
MeasureMAPE (%)MSE
Acute (monthly)13.78411.20
Chronic (monthly)17.1276.26
Acute (cumulative)0.853362.44
Chronic (cumulative)0.823932.12
Table 5 reveals a clear distinction between level and cumulative accuracy. For the acute monthly series, MAPE fluctuates in the low-to-middle-teen range (14–17%), with the largest absolute departures aligning with the sharp local maxima visible in Figure 6 and Figure 7. In contrast, the cumulative series in Figure 8 and Figure 9 stay within a ±1% envelope for the entire 2024 test horizon, yielding sub-1% MAPE. This pattern confirms that the network tracks long-term burden reliably even when short-term shocks momentarily inflate the point-wise error. Given that the highest monthly total exceeds 1000 registrations for chronic infection, this equates to a relative deviation below 8% in the worst months and below 5% on average. Cumulative forecasts, which are policy-relevant for national procurement, remain within a 1% band throughout the 12-month horizon.
Inspection of the residuals confirms that large absolute errors coincide with episodes of abrupt incidence change, indicating that the current architecture captures smooth temporal dependencies but not sporadic shocks. Aggregation to the cumulative scale attenuates this limitation, dropping test MAPE by an order of magnitude for both disease forms. The results demonstrate that the proposed deep recurrent network is suitable for near-term planning of vaccine procurement and antiviral stock when forecasts are expressed as a cumulative burden. At the same time, additional covariates or regime-switching mechanisms may be required to anticipate short-lived spikes in monthly incidence.

5. Discussion

The RNN framework presented in current research produced cumulative forecasts for acute and chronic hepatitis B in Ukraine with MAPE below 1%. At the same time, monthly errors remained in the low-to-middle-teen range (13–17%). These metrics are striking against the severe reporting instability that followed the Russian full-scale invasion of Ukraine on 24 February 2022. From that date onward, more than seven hundred documented attacks damaged or destroyed healthcare facilities, forcing thousands of clinicians to evacuate and interrupt regional laboratory capacity [28]. Routine notification of all communicable diseases, including HBV, fell sharply in the first half of 2022 and recovered only partially once mobile units and volunteer networks restored specimen transport and electronic reporting links [29]. A recent national review of 2018–2023 surveillance corroborates these patterns, showing abrupt troughs for several vaccine-preventable infections during frontline shifts and a corresponding surge in chronic viral hepatitis after catch-up data uploads [
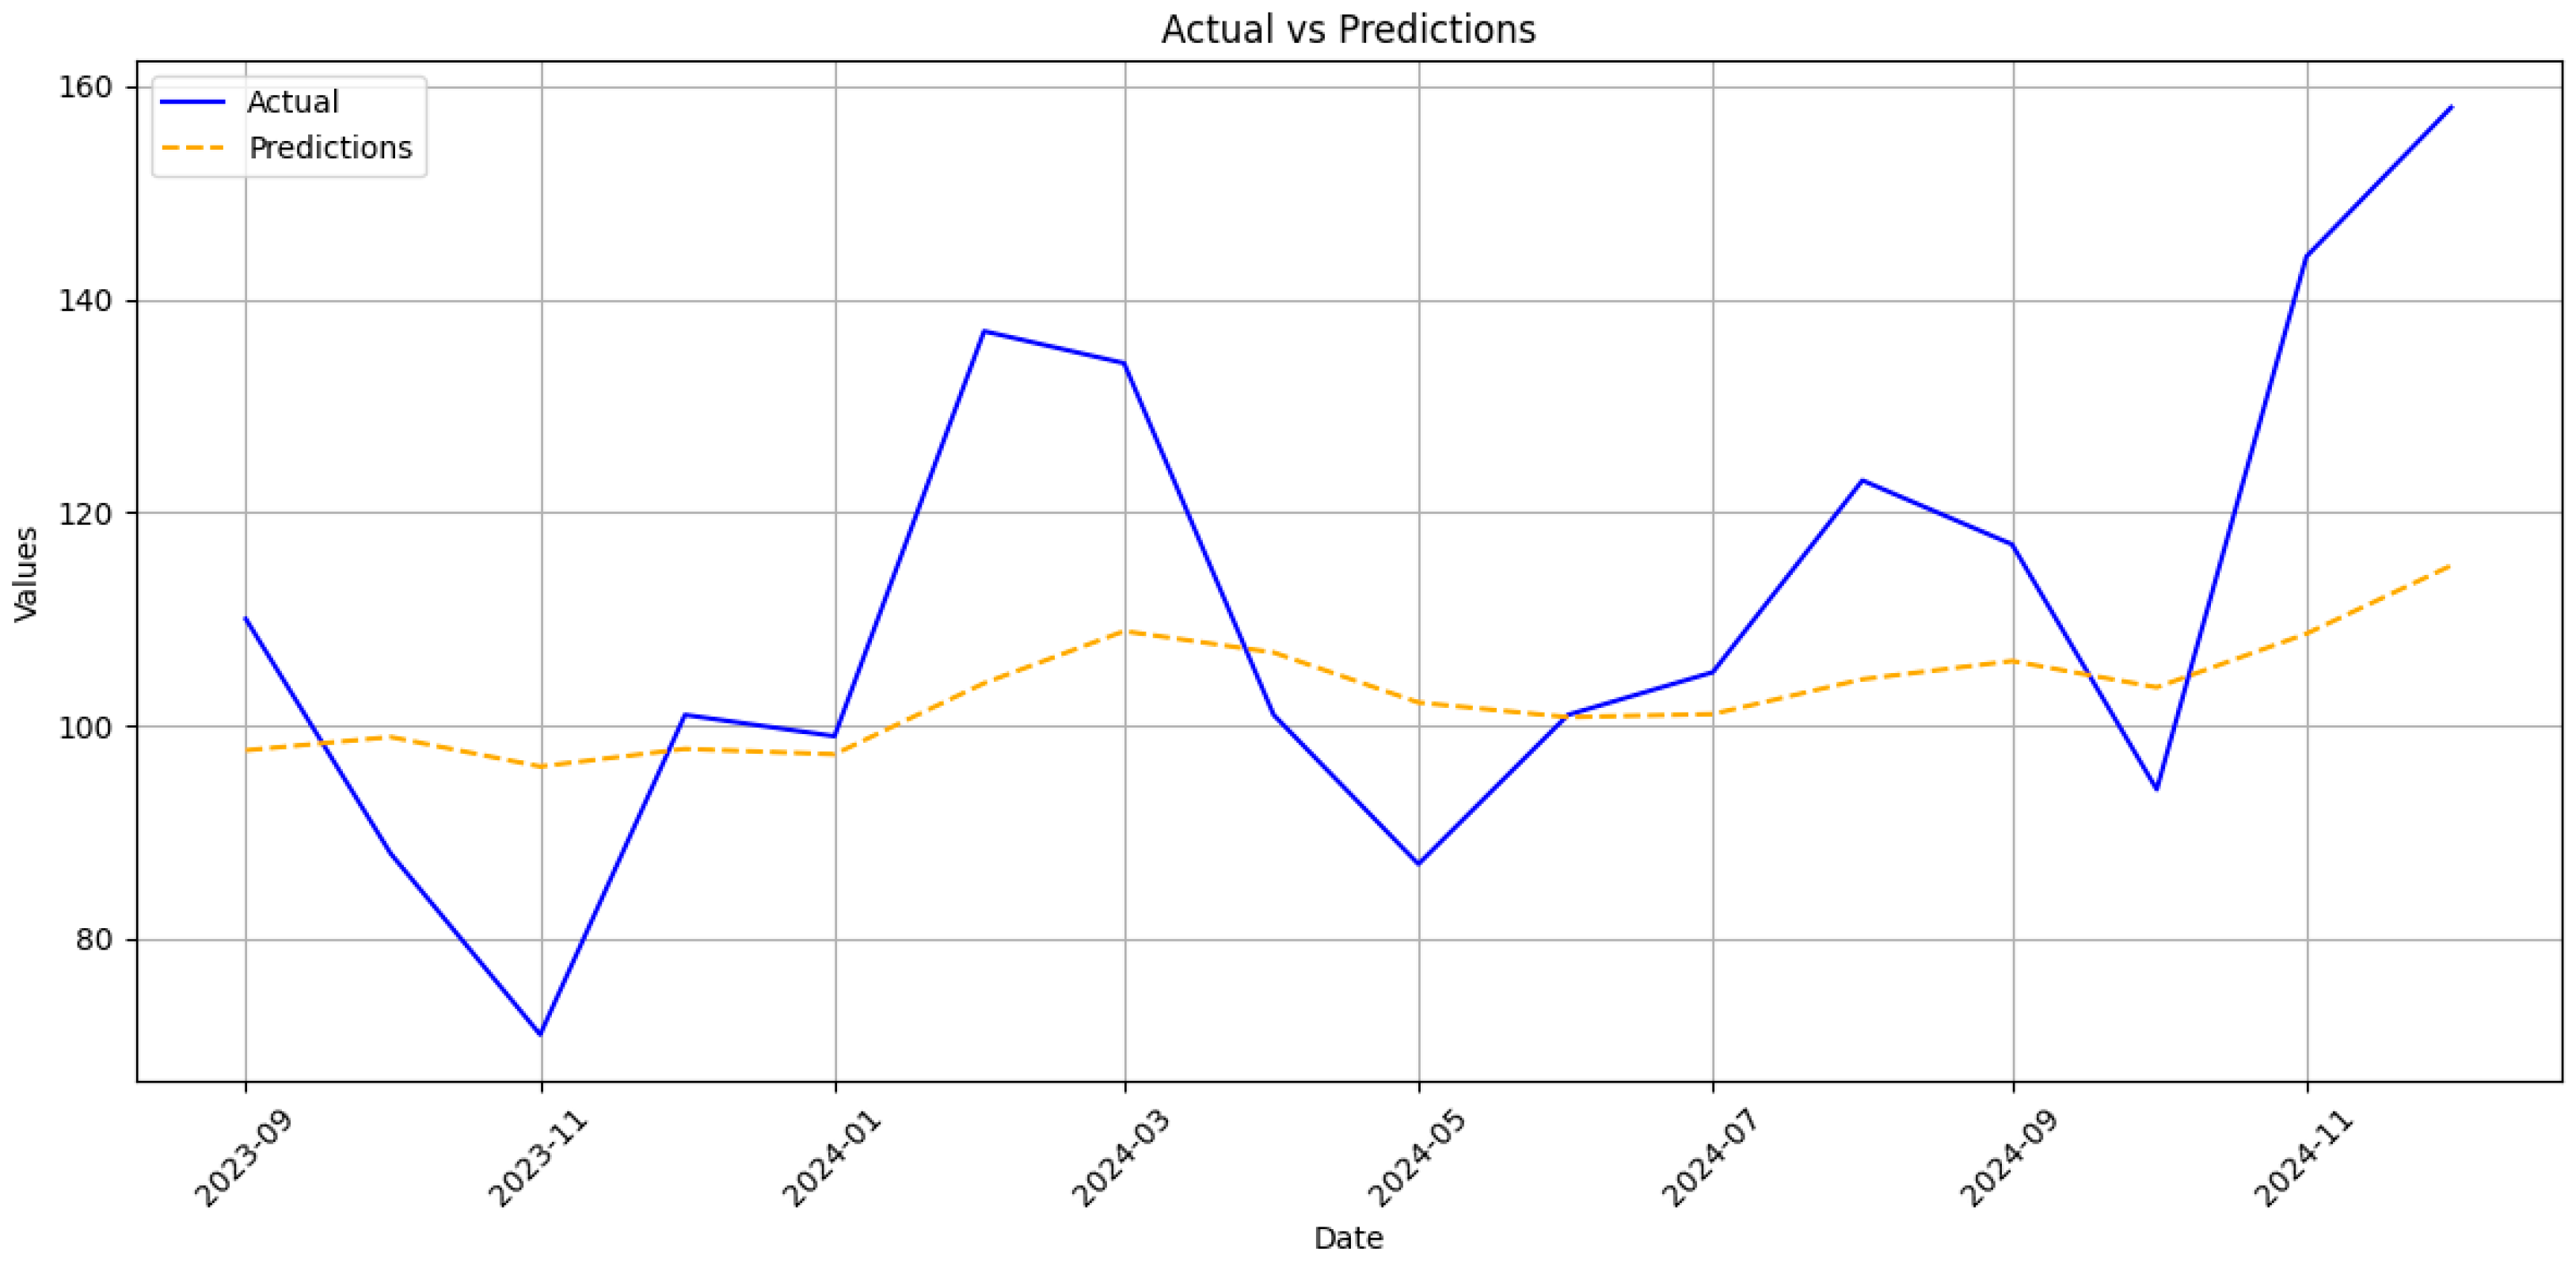
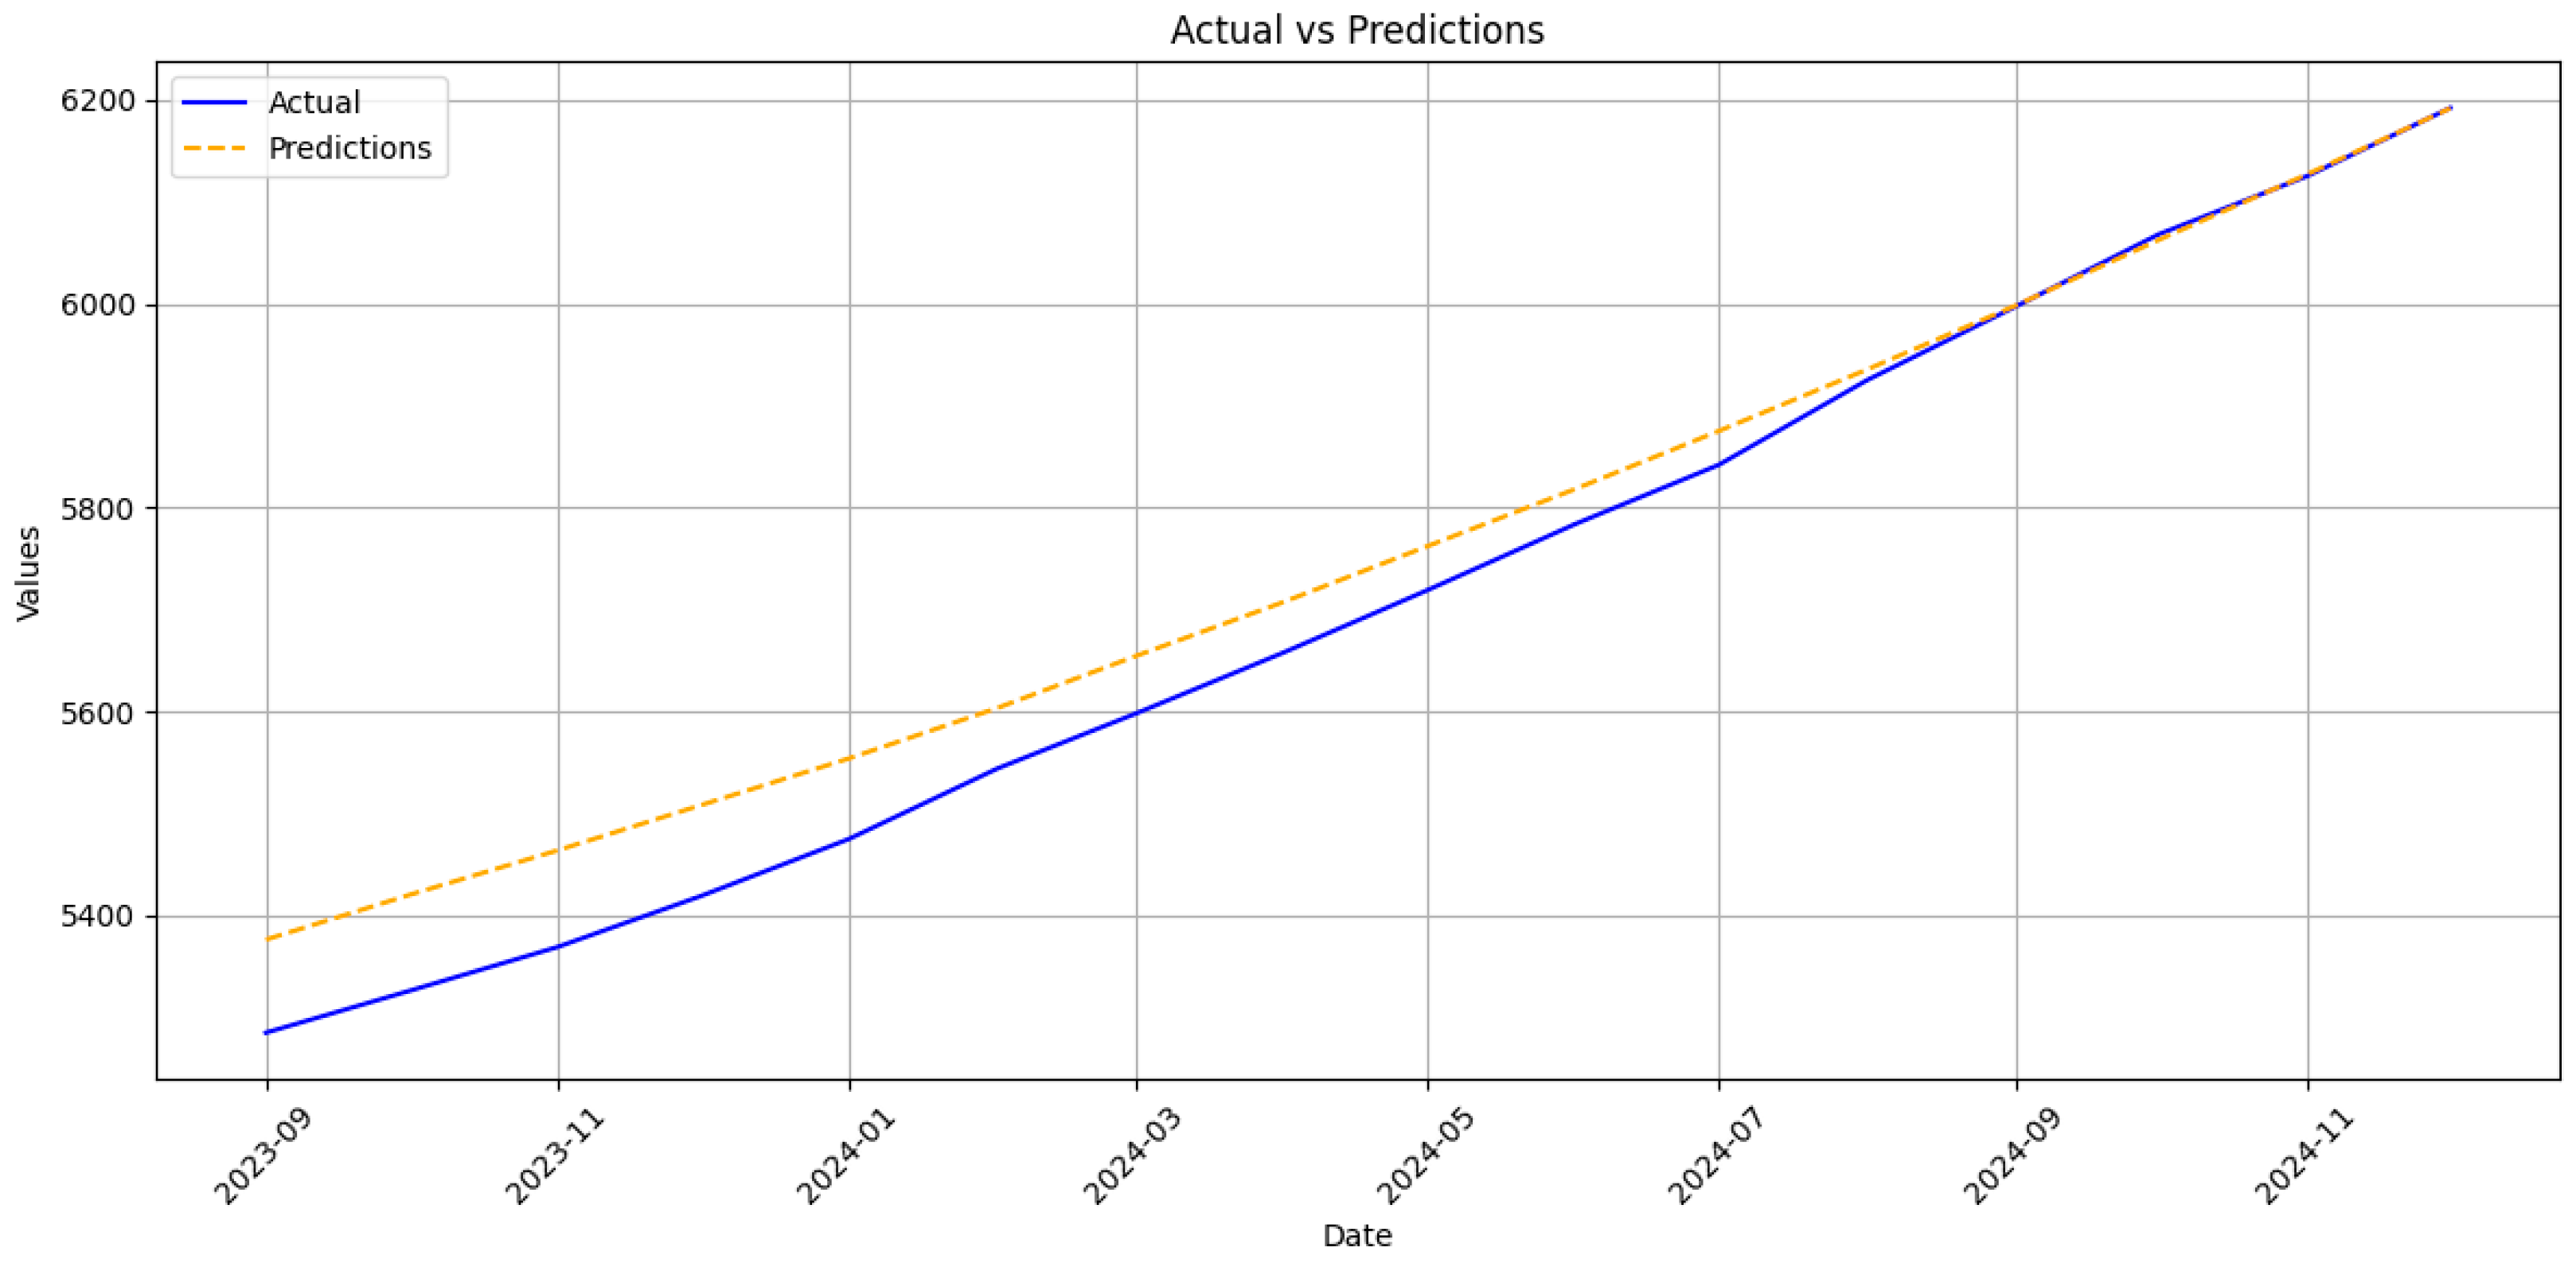
30]. The RNN’s stronger performance on cumulative counts, therefore, reflects not merely statistical smoothing but its capacity to absorb data shocks without wholesale recalibration, a property crucial for epidemic intelligence under conflict conditions.
The present results compare favourably with pre-war studies in stable data environments. In Xiamen City, a multi-model ensemble reached a cumulative MAPE of 2.2% using twenty years of uninterrupted records, a figure only marginally lower than that we achieved despite Ukraine’s compressed six-year history and multiple months of underreported or delayed entries [31]. On a monthly scale, our acute series MAPE of 13.8% approaches the 8.7% reported for a SARIMA–BPNN hybrid in Hainan Province, although the latter study did not face large structural breaks [16]. The gap widens for the chronic series, where unexplained jumps in late 2023 inflated error to 17% [32]. Field reports attribute those jumps to targeted screening campaigns that accompanied clinics reopening in de-occupied territories [33]. Such campaign-driven spikes resemble the step changes observed in tuberculosis notifications in Kharkiv and Mykolaiv and are notoriously difficult to capture with autoregressive inputs alone [34].
Modern infectious disease forecasting increasingly augments neural backbones with mechanistic or spatio-temporal constraints [35]. Dynamics-informed neural networks that embed SEIR-type equations within a trainable architecture have improved short-term COVID-19 prediction, and recent extensions incorporating vaccination compartments have delivered similar gains for measles and dengue [36]. In HBV research, hybrid frameworks that fuse grey models, attention-based LSTMs, or physics-guided residual nets to reproduce seasonal patterns and long-memory effects are emerging [37]. Interpretable machine learning instruments are also being rolled out to project downstream outcomes such as hepatocellular carcinoma in chronic carriers [38]. Our purely data-driven network occupies a complementary niche; it demonstrates that when surveillance resources collapse, a mid-depth sequence learner retrained on recent observations can still furnish strategic projections accurate enough to guide national vaccine and antiviral procurement. The selected two-layer LSTM offers several practical advantages. First, with approximately 171,000 trainable parameters, it can be trained in about 40 s on a single laptop class CPU, eliminating any dependency on specialised GPU hardware. Second, this computational frugality enables rapid retraining whenever new registry records are uploaded, a capability that is indispensable when conflict-related shocks periodically disrupt surveillance. Finally, the architecture maintains a cumulative mean absolute percentage error below one per cent despite the underlying data instability. This accuracy level equals or surpasses results reported in studies based on uninterrupted, multi-decade time series. The model’s 400-case error margin over a year horizon lies well within the safety stock held by Ukraine’s central medical warehouse, suggesting immediate operational utility.
Several analytic insights emerge from the residual structure. First, peak under-prediction in the acute series coincides temporally with documented back-entry of withheld case forms, indicating that the network rightly interprets these bursts as exogenous shocks rather than endogenous contagion waves. Second, chronic series overruns late in 2024 track renewed displacement from frontline regions, reinforcing evidence that migration distorts denominator data and inflates apparent prevalence. Similar migration-induced biases were noted in hepatitis C care-cascade studies conducted after the invasion and must be accounted for before applying the forecasts to sub-national planning [39]. Third, seasonality appears damped in Ukraine relative to East Asian settings, perhaps reflecting colder climates and lower perinatal transmission [40,41]. The RNN captures a faint spring peak in acute notifications that aligns with school-entry screening campaigns.
These findings carry methodological and policy implications. Methodologically, they show that missing value imputation is not a prerequisite for obtaining reliable cumulative forecasts when the objective is medium-range resource allocation, min-max scaling, and frequent retraining suffice. For tactical outbreak detection, however, covariate-rich hybrids are advisable. Mobility streams, energy grid telemetry, and social media sentiment indices already collected by humanitarian agencies could be concatenated with lagged case counts through attention layers or graph convolution blocks to sharpen one-month-ahead alerts. Recent work on hybrid SEIR–deep neural networks reports up to 30% error reduction after adding such exogenous signals [42]. Policy-wise, the study underscores the feasibility of maintaining evidence-based procurement and vaccination planning even when war erodes classical surveillance. It also suggests that Ukraine’s 2030 HBV-elimination trajectory remains within reach, provided that cumulative forecasts stay inside the 1% uncertainty band and that antiviral delivery lapses are minimised. These targets can now be monitored quantitatively rather than by expert judgement alone.
Table 6 presents the predictive accuracy of our two-layer LSTM against state-of-the-art hepatitis B forecasting studies.
Table 6 presents a comparative summary of forecasting performance between the proposed two-layer LSTM model and a selection of recent hepatitis B prediction studies. These studies represent a range of modelling approaches, including traditional statistical methods such as ARIMA, machine learning models such as neural network autoregression (NNAR), and Bayesian structured time series (BSTS) models. Although several of these models were trained on longer historical series (up to 180 monthly observations in the Xiamen dataset), the proposed model, trained on only 72 observations, demonstrates comparable or superior predictive accuracy.
In particular, the proposed LSTM achieves RMSE of 20.3 and 8.7 cases for acute and chronic monthly incidence, respectively, alongside MAPE values of 13.78% and 17.12%. When aggregated to the cumulative scale, directly relevant for annual vaccine and antiviral procurement, the model maintains a MAPE below 1% for both clinical forms, with RMSE values of 58.0 (acute) and 62.7 (chronic). These results compare favourably to the Henan BSTS model, which reports a monthly MAPE of 10.03% and RMSE of 680.05 and significantly outperforms classical ARIMA implementations, which exhibit higher error magnitudes across all evaluated contexts.
Several methodological distinctions contribute to the improved performance. First, the proposed model explicitly separates acute and chronic forms of hepatitis B, allowing it to capture distinct temporal patterns associated with each disease stage. In contrast, most prior work aggregates all cases into a single time series, potentially obscuring important epidemiological signals. Second, the model forecasts absolute case counts rather than incidence rates. This design choice reflects current data limitations in Ukraine, where post-2022 disruptions have affected the availability of reliable population statistics. By avoiding incidence-based scaling, the model produces forecasts that remain directly actionable for public health planning. Finally, the compact size of the network enables rapid retraining on standard hardware without the need for GPU acceleration or cloud infrastructure, in contrast to more computationally intensive methods such as BSTS or ensemble pipelines.
Overall, the comparative results highlight the value of a lightweight, domain-adapted LSTM architecture in resource-constrained forecasting environments. Despite a shorter training horizon and limited input features, the model achieves high accuracy across both monthly and cumulative prediction tasks, offering a practical and scalable solution for hepatitis B burden estimation in settings where data continuity and computational capacity may be limited.
The research has several limitations. The six-year training horizon encloses only five complete seasonal cycles and omits any pre-2018 secular trend. Once digitised, incorporating earlier Ministry of Health statistics could improve long-period learning. Without an embedded transmission kernel, the model cannot evaluate counterfactual scenarios such as scaling adult booster programmes or introducing birth dose vaccination in displaced populations. However, such data is not available. Similarly to recent physics-informed nets, a differentiable compartmental core would allow for combined forecasting and intervention assessment in a unified framework.
Despite unprecedented surveillance disruption caused by the Russian invasion of Ukraine, a modest recurrent architecture trained on the surviving national dataset provides reliable cumulative forecasts of HBV burden and acceptable monthly case estimates. By benchmarking these forecasts against contemporary deep learning and hybrid models, situating them within the wartime data landscape, and outlining pathways to integrate mechanistic insight and conflict-responsive covariates, this work advances methodological and practical agendas for viral hepatitis control under complex humanitarian emergencies.

6. Conclusions

This study demonstrates that a mid-depth RNN, trained exclusively on routinely collected surveillance data, can forecast cumulative acute and chronic hepatitis B in Ukraine with a MAPE below 1% despite profound wartime disruption of the reporting system. The model’s dual-scale evaluation shows that monthly incidence, although harder to predict, remains within an accuracy envelope comparable to pre-war studies from East Asia once data shocks are smoothed.
Scientifically, the work supplies the first conflict-calibrated evidence that sequence-learning architectures retain predictive value when standard notification pipelines fracture, a setting in which classical compartmental or hybrid grey models had not been tested. This study also contributes a transparent benchmark against which future mechanistic or covariate-rich extensions can be judged by documenting parameter counts, learning curves, and auto-regressive generation in detail.
The practical novelty lies in translating those forecasts into procurement margins that match the safety stocks held by the national antiviral programme. This offers a quantitative alternative to expert judgement for vaccine ordering under uncertainty.
Future research should embed a differentiable epidemiological core to enable scenario analysis of booster vaccination and birth dose uptake; incorporate conflict-responsive covariates such as population movement, electricity outages, and clinic reopening schedules; and adopt Bayesian or ensemble techniques to propagate input uncertainty through actionable prediction intervals. Such advances would strengthen the scientific foundation and operational utility of HBV forecasting in Ukraine and other settings where health surveillance must function amid complex humanitarian emergencies.

Author Contributions

Conceptualization, M.B. and D.C.; methodology, M.B. and D.C.; software, M.B.; validation, M.B., S.Y., and D.C.; formal analysis, M.B., S.Y., and D.C.; investigation, M.B., S.Y., and D.C.; resources, S.Y. and D.C.; data curation, M.B. and D.C.; writing—original draft preparation, M.B. and D.C.; writing—review and editing, S.Y.; visualisation, M.B.; supervision, D.C.; project administration, D.C.; funding acquisition, S.Y. and D.C. All authors have read and agreed to the published version of the manuscript.

Funding

This study was funded by National Science Centre of Poland (project No. 2023/05/Y/ST6/00263), Office of Naval Research (ONR), US National Academy of Science (US NAS) through Science & Technology Center in Ukraine (STCU) Project No. 7136, within the joint IMPRESS-U initiative entitled “Modeling and Forecasting of Infection Spread in War and Post War Settings Using Epidemiological, Behavioral and Genomic Surveillance Data”.

Institutional Review Board Statement

Not applicable.

Informed Consent Statement

Not applicable.

Data Availability Statement

The raw data used in this research was obtained from the official reports of the Public Health Centre of the Ministry of Health of Ukraine, available by the link, https://phc.org.ua/kontrol-zakhvoryuvan/inshi-infekciyni-zakhvoryuvannya/infekciyna-zakhvoryuvanist-naselennya-ukraini (accessed on 30 May 2025).

Conflicts of Interest

The authors declare no conflicts of interest.

Abbreviations

The following abbreviations are used in this manuscript:
HBVHepatitis B Virus
HBsAgHepatitis B Surface Antigen
WHOWorld Health Organization
ECDCEuropean Centre for Disease Prevention and Control
PWIDPeople Who Inject Drugs
SEIRSusceptible–Exposed–Infectious–Recovered
COVID-19Coronavirus Disease 2019
SARIMASeasonal Autoregressive Integrated Moving Average
SEIRISusceptible–Exposed–Infectious–Recovered–Infectious
BPNNBack Propagation Neural Network
ARIMAAutoregressive Integrated Moving Average
MAPEMean Absolute Percentage Error
cccDNACovalently Closed Circular Deoxyribonucleic Acid
LSTMLong Short-Term Memory
A-LSTMAttention-Enhanced Long Short-Term Memory
RMSERoot Mean Square Error
CDACenter for Disease Analysis
SEICRSusceptible–Exposed–Infectious–Chronic–Recovered
PRCCPartial Rank Correlation Coefficient
BICBayesian Information Criterion
MSEMean Squared Error
RNNRecurrent Neural Network
NNARNeural Network Autoregression
BSTSBayesian Structured Time Series
GPUGraphics Processing Unit
ETSError, Trend, Seasonality
GMGrey Model
ARIMAAutoregressive Integrated Moving Average

References

  1. World Health Organization. Hepatitis B. Available online: https://www.who.int/news-room/fact-sheets/detail/hepatitis-b (accessed on 30 May 2025).
  2. Tsukuda, S.; Watashi, K. Hepatitis B Virus Biology and Life Cycle. Antivir. Res. 2020, 182, 104925. [Google Scholar] [CrossRef] [PubMed]
  3. Gillespie, I.A.; Chan, K.A.; Liu, Y.; Hsieh, S.-F.; Schindler, C.; Cheng, W.; Chang, R.; Kap, E.J.; Morais, E.; Duh, M.S.; et al. Characteristics, Treatment Patterns, and Clinical Outcomes of Chronic Hepatitis B across 3 Continents: Retrospective Database Study. Adv. Ther. 2022, 40, 425–444. [Google Scholar] [CrossRef]
  4. Luo, J.; Liang, X.; Xin, J.; Li, J.; Li, P.; Zhou, Q.; Hao, S.; Zhang, H.; Lu, Y.; Wu, T.; et al. Predicting the Onset of Hepatitis B Virus-Related Acute-On-Chronic Liver Failure. Clin. Gastroenterol. Hepatol. 2022, 21, 681–693. [Google Scholar] [CrossRef] [PubMed]
  5. He, W.-Q.; Matthews, G.V.; Liu, B. Characteristics Associated with Monitoring and Treatment of Chronic Hepatitis B in a Large Cohort of Australian Adults. Dig. Dis. Sci. 2021, 67, 2600–2607. [Google Scholar] [CrossRef]
  6. Hsu, Y.-C.; Huang, D.Q.; Nguyen, M.H. Global Burden of Hepatitis B Virus: Current Status, Missed Opportunities and a Call for Action. Nat. Rev. Gastroenterol. Hepatol. 2023, 20, 524–537. [Google Scholar] [CrossRef]
  7. World Health Organization. Global Hepatitis Report 2024: Action for Access in Low- and Middle-Income Countries; World Health Organization: Geneva, Switzerland, 2024. [Google Scholar]
  8. TreatAsia. Current Status of Diagnosis and Treatment of HBV; TreatAsia: New York, NY, USA, 2023. [Google Scholar]
  9. Corcorran, M.A. Core Concepts—HBV Epidemiology—Screening and Diagnosis—Hepatitis B Online. Available online: https://www.hepatitisb.uw.edu/go/screening-diagnosis/hbv-epidemiology/core-concept/all (accessed on 30 May 2025).
  10. ECDC. Joint Statement Ensuring High-Quality Viral Hepatitis Care for Refugees from Ukraine; ECDC: Solna, Sweden, 2022. [Google Scholar]
  11. Chao, K.; Sarker, N.I.; Ali, I.; Radin, B.; Azman, A.; Shaed, M.M. Big Data-Driven Public Health Policy Making: Potential for the Healthcare Industry. Heliyon 2023, 9, e19681. [Google Scholar] [CrossRef] [PubMed]
  12. Aisyah, D.N.; Utami, A.; Rahman, F.M.; Adriani, N.H.; Fitransyah, F.; Aziz, T.; Hutapea, P.Y.; Tandy, G.; Manikam, L.; Kozlakidis, Z. Utilizing Electronic Immunization Registry in Indonesia: A Cross-Sectional Study of Aplikasi Sehat IndonesiaKu (ASIK). Interact. J. Med. Res. 2025, 14, e53849. [Google Scholar] [CrossRef]
  13. Izonin, I.; Tkachenko, R.; Yemets, K.; Havryliuk, M. An Interpretable Ensemble Structure with a Non-Iterative Training Algorithm to Improve the Predictive Accuracy of Healthcare Data Analysis. Sci. Rep. 2024, 14, 12947. [Google Scholar] [CrossRef]
  14. Alghamdi, A.M.; Shehri, A.; Almalki, J.; Jannah, N.; Alsubaei, F.S.; Ishengoma, F.R. An Architecture for COVID-19 Analysis and Detection Using Big Data, AI, and Data Architectures. PLoS ONE 2024, 19, e0305483. [Google Scholar] [CrossRef]
  15. Liang, P.; Zu, J.; Zhuang, G. A Literature Review of Mathematical Models of Hepatitis B Virus Transmission Applied to Immunization Strategies from 1994 to 2015. J. Epidemiol. 2017, 28, 221–229. [Google Scholar] [CrossRef]
  16. Fang, K.; Cao, L.; Fu, Z.; Li, W. Prediction of Reported Monthly Incidence of Hepatitis B in Hainan Province of China Based on SARIMA-BPNN Model. Medicine 2023, 102, e35054. [Google Scholar] [CrossRef]
  17. Chumachenko, D.; Bazilevych, K.; Butkevych, M.; Meniailov, I.; Parfeniuk, Y.; Sidenko, I.; Chumachenko, T. Methodology for Assessing the Impact of Emergencies on the Spread of Infectious Diseases. Radioelectron. Comput. Syst. 2024, 2024, 6–26. [Google Scholar] [CrossRef]
  18. Side, S.; Abdy, M.; Arwadi, F.; Sanusi, W. SEIRI Model Analysis Using the Mathematical Graph as a Solution for Hepatitis B Disease in Makassar. J. Phys. Conf. Ser. 2021, 1899, 012091. [Google Scholar] [CrossRef]
  19. Boivin-Champeaux, C.; Velez, N.; Jones, A.; Balsitis, S.; Schmidt, S.; Feigelman, J.S.; Azeredo, F.J. Disease Progression Mathematical Modeling with a Case Study on Hepatitis B Virus Infection. CPT Pharmacomet. Syst. Pharmacol. 2025, 14, 420–434. [Google Scholar] [CrossRef] [PubMed]
  20. Li, Y.; Yang, Y.; Yang, C.; Zhang, B. Predicting the Cases of Hepatitis B with the A-LSTM Model. J. Phys. Conf. Ser. 2021, 1995, 012007. [Google Scholar] [CrossRef]
  21. Xu, C.; Wang, Y.; Cheng, K.; Yang, X.; Wang, X.; Guo, S.; Liu, M.; Liu, X. A Mathematical Model to Study the Potential Hepatitis B Virus Infections and Effects of Vaccination Strategies in China. Vaccines 2023, 11, 1530. [Google Scholar] [CrossRef]
  22. Ma, J.; Ma, S. Dynamics of a Stochastic Hepatitis B Virus Transmission Model with Media Coverage and a Case Study of China. Math. Biosci. Eng. 2022, 20, 3070–3098. [Google Scholar] [CrossRef] [PubMed]
  23. Zhao, D.; Zhang, H.; Cao, Q.; Wang, Z.; Zhang, R. The Research of SARIMA Model for Prediction of Hepatitis B in Mainland China. Medicine 2022, 101, e29317. [Google Scholar] [CrossRef]
  24. de Villiers, M.J.; Gamkrelidze, I.; Hallett, T.B.; Nayagam, S.; Razavi, H.; Razavi-Shearer, D.; Chemin, I. Modelling Hepatitis B Virus Infection and Impact of Timely Birth Dose Vaccine: A Comparison of Two Simulation Models. PLoS ONE 2020, 15, e0237525. [Google Scholar] [CrossRef]
  25. El Koufi, A.; Rao, N.S.; Zhang, T. Stochastic Hybrid Hepatitis B Epidemic Model with Markovian Switching. Complexity 2022, 2022, 2347414. [Google Scholar] [CrossRef]
  26. Cheng, K.; Xu, C.; Guo, S.; Zhao, X. Evaluation of Hepatitis B Vaccination Strategy Based on Age Heterogeneity Model. J. Appl. Math. Comput. 2025. [Google Scholar] [CrossRef]
  27. Public Health Center of the Ministry of Health of Ukraine. Infectious Incidence of the Ukrainian Population. Available online: https://phc.org.ua/kontrol-zakhvoryuvan/inshi-infekciyni-zakhvoryuvannya/infekciyna-zakhvoryuvanist-naselennya-ukraini (accessed on 31 May 2025).
  28. Haque, U.; Bukhari, M.H.; Fiedler, N.; Wang, S.; Korzh, O.; Espinoza, J.; Ahmad, M.; Holovanova, I.; Chumachenko, T.; Marchak, O.; et al. A Comparison of Ukrainian Hospital Services and Functions before and during the Russia-Ukraine War. JAMA Health Forum 2024, 5, e240901. [Google Scholar] [CrossRef] [PubMed]
  29. Hinnant, L.; Chernov, M.; Stepanenko, V. Ukraine’s Health Care on the Brink after Hundreds of Attacks. Available online: https://apnews.com/article/russia-ukraine-health-care-attacks-09867f18bd2c1889659cd587fa8d1418 (accessed on 31 May 2025).
  30. Petakh, P.; Tymchyk, V.; Kamyshnyi, O. Communicable Diseases in Ukraine during the Period of 2018-2023: Impact of the COVID-19 Pandemic and War. Travel Med. Infect. Dis. 2024, 60, 102733. [Google Scholar] [CrossRef]
  31. Zhang, R.; Mi, H.; He, T.; Ren, S.; Zhang, R.; Xu, L.; Wang, M.; Su, C. Trends and Multi-Model Prediction of Hepatitis B Incidence in Xiamen. Infect. Dis. Model. 2024, 9, 1276–1288. [Google Scholar] [CrossRef] [PubMed]
  32. Public Health Center of the Ministry of Health of Ukraine. National Response of HIV, TB, Viral Hepatitis and SMT Programmes in the Context of Full-Scale Russian Invasion. Annual Report. Available online: https://phc.org.ua/sites/default/files/users/user90/National_response_HIV_TB_VH_SMT_war_2023_ENG.pdf (accessed on 31 May 2025).
  33. Klepikov, A. 2024 World TB Day in War-Torn Ukraine: A Story of Resilience; Alliance for Public Health: Kyiv, Ukraine, 2024. [Google Scholar]
  34. Krokva, D.; Mori, H.; Valenti, S.; Remez, D.; Hadano, Y.; Naito, T. Analysis of the Impact of Crises Tuberculosis Incidence in Ukraine amid Pandemics and War. Sci. Rep. 2025, 15, 17045. [Google Scholar] [CrossRef] [PubMed]
  35. Wang, X.; Jin, Z.; Conway, J.M. Multi-Region Infectious Disease Prediction Modeling Based on Spatio-Temporal Graph Neural Network and the Dynamic Model. PLoS Comput. Biol. 2025, 21, e1012738. [Google Scholar] [CrossRef]
  36. Cheng, C.; Aruchunan, E.; Noor Aziz, M.H. Leveraging Dynamics Informed Neural Networks for Predictive Modeling of COVID-19 Spread: A Hybrid SEIRV-DNNs Approach. Sci. Rep. 2025, 15, 2043. [Google Scholar] [CrossRef]
  37. Wu, L.; Liu, Z.; Huang, H.; Pan, D.; Fu, C.; Lu, Y.; Zhou, M.; Huang, K.; Huang, T.; Yang, L. Development and Validation of an Interpretable Machine Learning Model for Predicting the Risk of Hepatocellular Carcinoma in Patients with Chronic Hepatitis B: A Case-Control Study. BMC Gastroenterol. 2025, 25, 157. [Google Scholar] [CrossRef]
  38. Hur, M.H.; Yip, T.C.-F.; Kim, S.U.; Lee, H.W.; Lee, H.A.; Lee, H.-C.; Wong, G.L.-H.; Wong, V.W.-S.; Park, J.Y.; Ahn, S.H.; et al. A Machine Learning Model to Predict Liver-Related Outcomes after the Functional Cure of Chronic Hepatitis B. J. Hepatol. 2024, 82, 235–244. [Google Scholar] [CrossRef]
  39. European AIDS Treatment Group. A War on Another Front: Ukraine’s Fight against Hepatitis c|EATG. Available online: https://www.eatg.org/hiv-news/a-war-on-another-front-ukraines-fight-against-hepatitis-c/ (accessed on 31 May 2025).
  40. Wang, Y.-B.; Qing, S.-Y.; Liang, Z.-Y.; Ma, C.; Bai, Y.-C.; Xu, C.-J. Time Series Analysis-Based Seasonal Autoregressive Fractionally Integrated Moving Average to Estimate Hepatitis B and c Epidemics in China. World J. Gastroenterol. 2023, 29, 5716–5727. [Google Scholar] [CrossRef]
  41. Li, K.; Rui, J.; Song, W.; Luo, L.; Zhao, Y.; Qu, H.; Liu, H.; Wei, H.; Zhang, R.; Abudunaibi, B.; et al. Temporal Shifts in 24 Notifiable Infectious Diseases in China before and during the COVID-19 Pandemic. Nat. Commun. 2024, 15, 3891. [Google Scholar] [CrossRef] [PubMed]
  42. Furkan, H.B.; Ayman, N.; Uddin, M.J. Hybrid Neural Network Models for Time Series Disease Prediction Confronted by Spatiotemporal Dependencies. MethodsX 2024, 14, 103093. [Google Scholar] [CrossRef] [PubMed]
  43. Li, X.; Li, Y.; Xu, S.; Wang, P.; Hu, M.; Li, H.; Wang, Y. Evaluation of the Impact of COVID-19 on Hepatitis B in Henan Province and Its Epidemic Trend Based on Bayesian Structured Time Series Model. BMC Public Health 2025, 25, 1312. [Google Scholar] [CrossRef] [PubMed]
  44. Wang, Y.; Shen, Z.; Jiang, Y.; Shaman, J. Comparison of ARIMA and GM(1,1) Models for Prediction of Hepatitis B in China. PLoS ONE 2018, 13, e0201987. [Google Scholar] [CrossRef]
Figure 1. The model’s architecture.
Applsci 15 07573 g001
Figure 2. Monthly incidence of acute hepatitis B.
Applsci 15 07573 g002
Figure 3. Monthly incidence of chronic hepatitis B.
Applsci 15 07573 g003
Figure 4. Cumulative incidence of acute hepatitis B.
Applsci 15 07573 g004
Figure 5. Cumulative incidence of chronic hepatitis B.
Applsci 15 07573 g005
Figure 6. Learning trajectory of acute hepatitis B monthly cases.
Applsci 15 07573 g006
Figure 7. Learning trajectory of chronic hepatitis B monthly cases.
Applsci 15 07573 g007
Figure 8. Learning trajectory of acute hepatitis B cumulative cases.
Applsci 15 07573 g008
Figure 9. Learning trajectory of chronic hepatitis B cumulative cases.
Applsci 15 07573 g009
Figure 10. Forecast for monthly cases of acute hepatitis B (September 2023–December 2024).
Applsci 15 07573 g010
Figure 11. Forecast for monthly cases of chronic hepatitis B (January 2024–December 2024).
Applsci 15 07573 g011
Figure 12. Forecast for cumulative cases of acute hepatitis B (September 2023–December 2024).
Applsci 15 07573 g012
Figure 13. Forecast for cumulative cases of chronic hepatitis B (January 2024–December 2024).
Applsci 15 07573 g013
Table 1. The current state of research on hepatitis B simulation.
PaperTaskMethodFindings
Side S. et al. [18]To construct and analyse a mathematical model that captures the spread of hepatitis B in Makassar and to identify conditions leading to disease elimination or persistence.The study formulates a nonlinear SEIRI ordinary-differential-equation system, applies graph theory to obtain R0, conducts local stability analysis via eigenvalues, and performs scenario simulations with Maple.The model yields an analytic expression for R0; simulations show that when R0 < 1 the infection declines, whereas modest increases in transmission parameters push R0 > 1 and sustain endemicity, highlighting the importance of targeted interventions.
Fang K. et al. [16]To model and predict monthly hepatitis B incidence in Hainan Province to inform local prevention and control strategies.Researchers compared SARIMA, GM(1,1), and a combined SARIMA–BPNN model trained on 2017–2020 incidence data and evaluate performance against 2021 observations.The SARIMA–BPNN model outperformed the single-method alternatives and projected a gradual decrease in hepatitis B incidence during 2022, with the largest month-to-month reduction occurring in early spring.
Boivin-Champeaux C. et al. [19]To compile a pedagogical yet critical roadmap of HBV disease-progression models that guides practitioners in selecting, refining and applying mechanistic frameworks for treatment evaluation.The authors proposed reformulated representative models of increasing biological detail, analysed their dynamics, and packaged the code and parameter sets into openly accessible R Shiny applications for interactive simulation.The paper shows that modest alterations in model structure or parameterisation can profoundly alter forecasts of viral clearance and liver injury, emphasising the need to align model complexity with the clinical question and to use transparent, data-driven calibration when projecting therapeutic impact.
Li Y. et al. [20]To build an accurate model for short-term prediction of monthly hepatitis B cases in China.The study trains and compares an attention-based two-layer LSTM network and a multi-layer BPNN using 2004–2017 surveillance data.The A-LSTM outperforms BPNN and prior time series benchmarks, reducing prediction error by roughly 50% and explaining 87% of the variance in held-out monthly counts.
Xu C. et al. [21]To quantify the hidden burden of latent HBV carriers in China and evaluate how alternative vaccination strategies affect long-term transmission dynamics.The authors built a seven-compartment deterministic model calibrated to 19 years of national case data using nonlinear least squares and a genetic algorithm.Model fitting suggests 449,535 (95% CI 415,651–483,420) latent carriers and shows that lowering vaccine failure rates and extending adult immunisation can push Rc below unity, driving incidence downward.
Ma J. and Ma S. [22]To assess how media coverage and environmental noise influence long-term hepatitis B dynamics in China.Develop a stochastic S-I1-I2-R model with media-modulated, saturated incidence terms, prove analytical extinction and persistence criteria, and fit the system to 2005–2021 national case data.Enhanced media responses and higher noise intensities can push the stochastic reproduction number below unity, leading to extinction; otherwise the disease persists around a stationary distribution that forecasts a long-term incidence plateau of 50–60 per 100,000.
Zhao et al. [23]To construct a time-series model to accurately predict monthly hepatitis B notifications across China for early-warning purposes.Researchers fitted multiple seasonal ARIMA candidates to log-transformed 2013–2020 surveillance data, selected the optimal specification using BIC and residual diagnostics, and tested it on 2021 observations.SARIMA(1,0,0)(0,1,1)12 reproduced historical trends and kept 2021 forecasts within the 95% prediction interval, confirming its suitability for short-range hepatitis B monitoring in China.
De Villiers M.J. et al. [24]To determine whether two leading hepatitis B transmission models give concordant forecasts and to quantify how scaling infant and birth-dose vaccination affects future infections and deaths.The paper populated deterministic models with identical country-specific data, simulated three vaccination-coverage scenarios from 2015 to 2099, and compared outputs for incident chronic infections and HBV-related mortality.While baseline epidemics aligned, PRoGReSs predicted larger reductions from infant-series scale-up and Imperial from birth-dose expansion, exposing structural uncertainty that should inform vaccination policy deliberations.
El Koufi A. and Rao N. [25]To investigate how combined white noise and regime-switching disturbances affect hepatitis B dynamics and to identify disease persistence or extinction conditions.The paper formulated a stochastic S-I1-I2-R differential equation system with Markovian switching, proved well-posed and threshold theorems using Lyapunov functions and martingale techniques, and validated findings through numerical simulation.If RSW > 1, the process converges to an ergodic stationary distribution, implying long-term persistence; if RSW < 1, the acutely infected class decays exponentially to zero, leading to extinction with probability one.
Cheng K. et al. [26]To assess how alternative age-specific booster vaccination strategies could curb hepatitis B transmission in China.A multi-group deterministic SEICR model was developed and calibrated with preferential mixing. Then sensitivity and scenario analyses were used to quantify the effects of varying contact patterns and vaccination rates.Achieving ≥ 90% vaccine coverage in adults aged 15–70 markedly outperforms contact-reduction measures, cutting cumulative cases by about 60% and placing national incidence on track for the WHO’s elimination goal.
Table 2. Software environment and hyper-parameter configuration.
ItemSetting
Programming languagePython 3.11.4
Deep learning libraryPyTorch 2.2.0 (CPU only)
Numerical librariesNumPy 1.26.4, SciPy 1.13.0, Pandas 2.2.2
Sequence length12 months
Number of LSTM layers2
Hidden units per layer64
Dropout rate0.20
OptimizerAdam
Learning rate1 × 10−3
Batch size8
Epochs (maximum)300
Early-stopping patience5 epochs without improvement
Random seed42
Table 3. Descriptive statistic for the training period (January 2018–December 2023).
MeasureAcuteChronic
Mean monthly cases9.321.6
Standard deviation6.76.0
Minimum112
Maximum2835
Table 4. Convergence diagnostics (training set).
MeasureEpochsMAPE (%)MSE
Acute (monthly)1705.4015.0
Chronic (monthly)5013.77411.2
Acute (cumulative)3122.868.4
Chronic (cumulative)3052.316.1
Table 6. The comparison of hepatitis B models’ performance.
ModelDataTrainingHorizonRMSEMAPE
LSTM (proposed)Acute monthly (Ukraine)Jan 2018–Dec 2023Jan 2024–Dec 202420.2813.78
LSTM (proposed)Chronic monthly (Ukraine)Jan 2018–Dec 2023Jan 2024–Dec 20248.7317.12
LSTM (proposed)Acute cumulative (Ukraine)Jan 2018–Dec 2023Jan 2024–Dec 202457.980.85
LSTM (proposed)Chronic cumulative (Ukraine)Jan 2018–Dec 2023Jan 2024–Dec 202462.710.82
ARIMA [43]Cases monthly (Henan)Jan 2013–Sep 2021Oct 2021–Sep 2022961.1214.39
BSTS [43]Cases monthly (Henan)Jan 2013–Sep 2021Oct 2021–Sep 2022680.0510.03
NNAR [31]Cases monthly (Xiamen)Jan 2004–Dec 2019Jan 2020–Dec 2022121.87-
ETS [31]Cases monthly (Xiamen)Jan 2004–Dec 2019Jan 2020–Dec 2022158.05-
SARIMA [31]Cases monthly (Xiamen)Jan 2004–Dec 2019Jan 2020–Dec 2022141.30-
SARIMA-ETS-STL-NNAR [31]Cases monthly (Xiamen)Jan 2004–Dec 2019Jan 2020–Dec 2022130.15-
BSTS [31]Cases monthly (Xiamen)Jan 2004–Dec 2019Jan 2020–Dec 2022131.51-
Prophet [31]Cases monthly (Xiamen)Jan 2004–Dec 2019Jan 2020–Dec 2022178.22-
ARIMA [44]Cases monthly (China)Mar 2010–May 2017Jun 2017–Oct 20173849.723.39
GM (1,1) [44]Cases monthly (China)Aug 2016–May 2017Jun 2017–Oct 201716991.9915.69
SARIMA [23]Cases monthly (China)Jan 2013–Dec 2020Jan 2021–Dec 20217005.575.10
Disclaimer/Publisher’s Note: The statements, opinions and data contained in all publications are solely those of the individual author(s) and contributor(s) and not of MDPI and/or the editor(s). MDPI and/or the editor(s) disclaim responsibility for any injury to people or property resulting from any ideas, methods, instructions or products referred to in the content.

