Abstract
The present study investigates the extent and spatial distribution of metal concentration in stream sediments that flow into Keban Dam Lake, Turkey. Sediment samples were analysed for trace and potentially toxic elements (PTEs), including V, Cr, Co, Ni, Cu, Zn, Pb, Tl, Th, and U. Enrichment Factor (EF), Contamination Factor (CF), Geo-accumulation Index (Igeo), and Pollution Load Index (PLI) were employed to assess contamination levels. Results reveal that Cr exhibited very high enrichment (EF = 15.95) in downstream urban samples, while Cu and Zn showed high enrichment in samples collected from the middle to lower reaches of the stream, probably indicating anthropogenic contributions. Most other elements, such as Pb, Tl, Th, and U, were within natural background levels. Sediment Quality Guidelines (SQGs) indicate that Cr, Ni, and Cu may pose potential ecological risks, especially in samples from urban-influenced and downstream areas where concentrations exceed the Probable Effect Levels (PEL; Cr: 160 mg/kg, Ni: 42.8 mg/kg, Cu: 108 mg/kg). Multivariate statistical analyses, including Pearson correlation and hierarchical clustering, reveal three distinct geochemical groupings. Among these, the most contaminated cluster—corresponding to midstream and downstream regions—is characterized by elevated Cu and Zn concentrations. Strong correlations among Cu–Zn, Ni–Cu, and Th–U suggest there is a combination of anthropogenic and lithogenic sources for most metals. While most sites showed low to moderate pollution, urban downstream locations exhibited significant metal accumulation, necessitating the region’s continued environmental monitoring and management strategies.
1. Introduction
Worldwide, domestic sewage, untreated industrial effluents, and agricultural fertiliser leaching can contaminate river systems [1,2,3]. Numerous contaminants, including metals and nutrients, are linked to these activities and pose a serious environmental risk to freshwater resources worldwide [4,5,6,7,8,9,10,11].
In urban areas, stream sediments are particularly vulnerable to metal pollution due to the high density of anthropogenic activities such as industrial discharge, domestic wastewater, and urban runoff. In Turkey, uncontrolled discharge of industrial, agricultural, and domestic waste into water bodies has become a major source of metal contamination, particularly in urban stream systems, leading to the degradation of water quality and ecological health [12,13,14,15]. Once introduced into the aquatic environment, metals can bioaccumulate and enter the food web, ultimately threatening human health through biomagnification [12,13,16].
Metal concentrations in river sediments are influenced by a combination of both anthropogenic and natural factors. These include the cumulative effects of pollution sources, geological formations, and regional climatic conditions. The nature of these pollution sources—point-based or diffuse—and their spatial distribution and surrounding land use patterns significantly affect contamination levels [13,17,18,19]. In particular, sediment characteristics such as texture, organic carbon content, and pH can greatly influence the accumulation and mobility of metals. Land use also plays a critical role in determining the extent of water and sediment pollution [15,19,20].
Assessment of metal pollution often employs widely accepted contamination indices such as Contamination Factor (CF), Enrichment Factor (EF), Geo-accumulation Index (Igeo), and Pollution Load Index (PLI), which are reliable tools for determining sediment contamination levels and potential ecological risks. The Keban Dam Lake catchment is an important water resource affected by urbanization, agriculture, and industrial activities. Limited previous studies have identified heavy metal accumulation in some stream sediments in the region, potentially posing ecological risks. Key pollution sources include urban wastewater discharges, agricultural runoff, and nearby industrial facilities. Therefore, monitoring sediment quality and metal contamination in the Keban Dam Lake catchment is critical for effective environmental management.
To provide context for the assessment of metal contamination in stream sediments draining into Keban Dam Lake, similar studies conducted in various Turkish river basins are briefly reviewed. These studies employed commonly used contamination indices to evaluate pollution levels and identify anthropogenic and geogenic sources. In a study conducted on the Seyhan River (Turkey), heavy metal contamination was assessed through a combination of indices, including the Contamination Factor (CF), Enrichment Factor (EF), Geo-accumulation Index (Igeo), and Sediment Quality Guidelines (SQGs). The findings indicated that Cr and Ni were present at contamination levels classified as “moderate to very strong,” while Cu, Pb, and Zn were categorised within the range of “unpolluted to moderately polluted” [21]. Similarly, in another study on the Tigris River in southeastern Turkey, a combination of CF, Pollution Load Index (PLI), Igeo, and EF was applied to assess sediment contamination. The results demonstrated that Cu, Cobalt (Co), and Zn exhibited significantly high CF values, suggesting notable anthropogenic contributions. These elevated levels were primarily attributed to waste discharges from nearby copper mining activities [22]. In their study, Kalender and Çiçek Uçar [23] assessed metal contamination in sediments of the Euphrates River tributaries using pollution indices (CF, Igeo, PLI) and statistical methods, identifying Cr, Cu, and Zn as key pollutants linked to anthropogenic sources. Similarly, this study assesses contamination and source characteristics of metals in stream sediments draining into the Keban Dam Lake. Akçay and Özbay [24] evaluated the Berdan River Basin and identified significant Ni and Cd pollution levels across all sampling points, attributing these to industrial, agricultural, and domestic activities. Their health risk assessment indicated notable hazards for both children and adults due to carcinogenic metals like Pb, Cr, and Ni. Similarly, Çavuş et al. [25] analysed the Kepez Stream in Çanakkale, revealing elevated levels of metals linked to urban waste, agricultural runoff, and maritime activities. Their study emphasised these contaminants’ ecological risks and the necessity for continuous monitoring. Pulatsü and Latifi [26] investigated four streams discharging into Lake Mogan and assessed the concentrations of potentially toxic elements such as Cr, Ni, Cu, Zn, As, Cd, Hg, and Pb. Among them, Başpınar Stream poses a higher ecological risk than the others. However, the overall levels of these toxic elements in the streams were determined to be below thresholds of significant pollution. These findings underscore the importance of evaluating metal pollution in fluvial systems, particularly in regions like the Keban Dam Lake, to inform effective environmental management strategies.
This study uses various contamination indices and statistical methods to assess the metal contamination and potential sources of pollution in the stream sediments draining into Keban Dam Lake. This research is significant, as it provides essential data on sediment quality and pollution levels in a region that has not been extensively studied, contributing to understanding anthropogenic impacts on aquatic ecosystems in the context of industrial, agricultural, and domestic activities in Turkey. The aim of this study is to assess the levels and spatial distribution of metal contamination in stream sediments draining into Keban Dam Lake, and to identify the potential geogenic and anthropogenic sources. The hypothesis was that anthropogenic metal inputs have led to increased contamination levels in stream sediments that may pose ecological risks, particularly in areas influenced by urban and industrial activities.
2. Geological Setting
Turkey is situated within a tectonically intricate domain formed by the convergence of the Eurasian, African, and Arabian plates. The present-day tectonics of the region reflects a protracted history of subduction, accretion, and continental collision events spanning from the Late Palaeozoic to the Cenozoic [27,28]. The study area is located in central Anatolia, whose major tectonic units include the Kırşehir Block and the Sakarya Zone, bounded by the Pontides to the north and the Tauride Platform to the south. These domains are separated by significant suture zones, such as the İzmir–Ankara–Erzincan and Inner Tauride sutures, representing the remnants of closed Neotethyan oceanic basins associated with the Alpine orogeny (Figure 1).
The Elazığ region in Eastern Anatolia occupies a critical location within the Southeast Anatolian Orogenic Belt (SAOB) and reveals a complex lithotectonic configuration shaped by multiple tectonic phases, primarily related to the subduction and subsequent closure of the southern branch of the Neotethys Ocean and subsequent continental collisions [29,30]. The regional stratigraphy is composed, from bottom to top, of the Keban–Malatya Metamorphics, ophiolitic units, Late Cretaceous–Eocene magmatic rocks, the Hazar Group, the Maden Complex, and unconsolidated cover units.
The Keban–Malatya Metamorphics of Precambrian to Triassic ages constitutes the basement of the region and comprise high-grade metamorphic rocks, including gneisses, schists, and marbles. These units are interpreted as fragments of the northern margin of the Arabian Plate and represent the oldest exposed lithologies in the region which are described below [31,32,33,34]. Late Cretaceous ophiolitic units overlie the metamorphic basement, remnants of the Neotethyan oceanic lithosphere. These ophiolites—comprising serpentinised peridotites, layered gabbros, and sheeted dyke complexes—are thought to have been emplaced onto the continental crust during intra-oceanic subduction and subsequent obduction events in the Late Cretaceous [35,36,37,38].
The region is also marked by the Late Cretaceous Elazığ Magmatic Complex, a suite of plutonic rocks that intrude both ophiolitic and surrounding sedimentary-volcanic sequences. These intrusions include gabbros, diorites, tonalites, and granodiorites, reflecting a multi-stage magmatic evolution [29,39]. The Maden Complex, which overlies these magmatic and ophiolitic units in places, comprises Middle Eocene volcanic and pyroclastic rocks, including basalts, andesites, dacites, and associated sedimentary interlayers. These rocks exhibit calc-alkaline to shoshonitic compositions and are interpreted to have formed during a post-collisional extensional regime triggered by asthenospheric upwelling and lithospheric delamination [40]. Sr-Nd isotopic signatures indicate variable contributions from depleted mantle and enriched continental crustal sources. The Hazar Group of Palaeocene–Eocene age includes predominantly flysch-type sedimentary sequences deposited in a foreland basin setting. In some sections, the Hazar Group exhibits lateral facies transitions into contemporaneous volcanic rocks, suggesting episodic volcanic activity coeval with sedimentation [41]. Finally, the cover units consist of Quaternary alluvial deposits and unconsolidated terrestrial sediments that unconformably overlie the older basement and volcanic-sedimentary successions. These units record post-orogenic erosion and surface processes shaping the modern landscape.
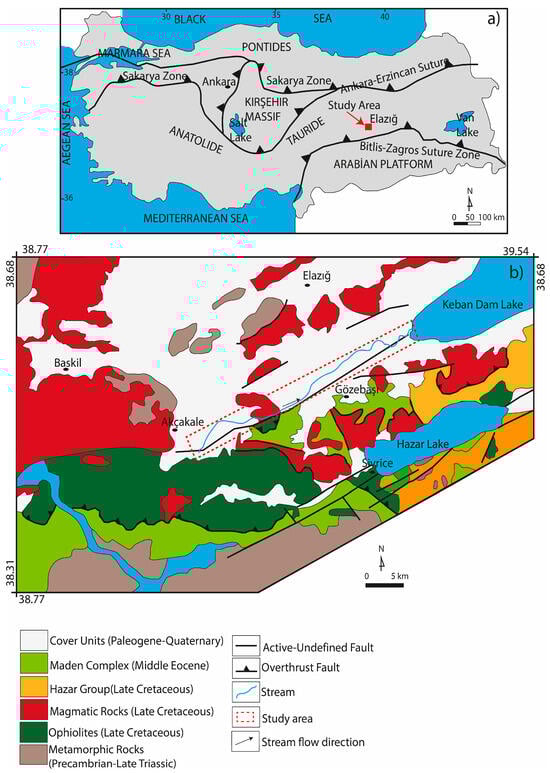
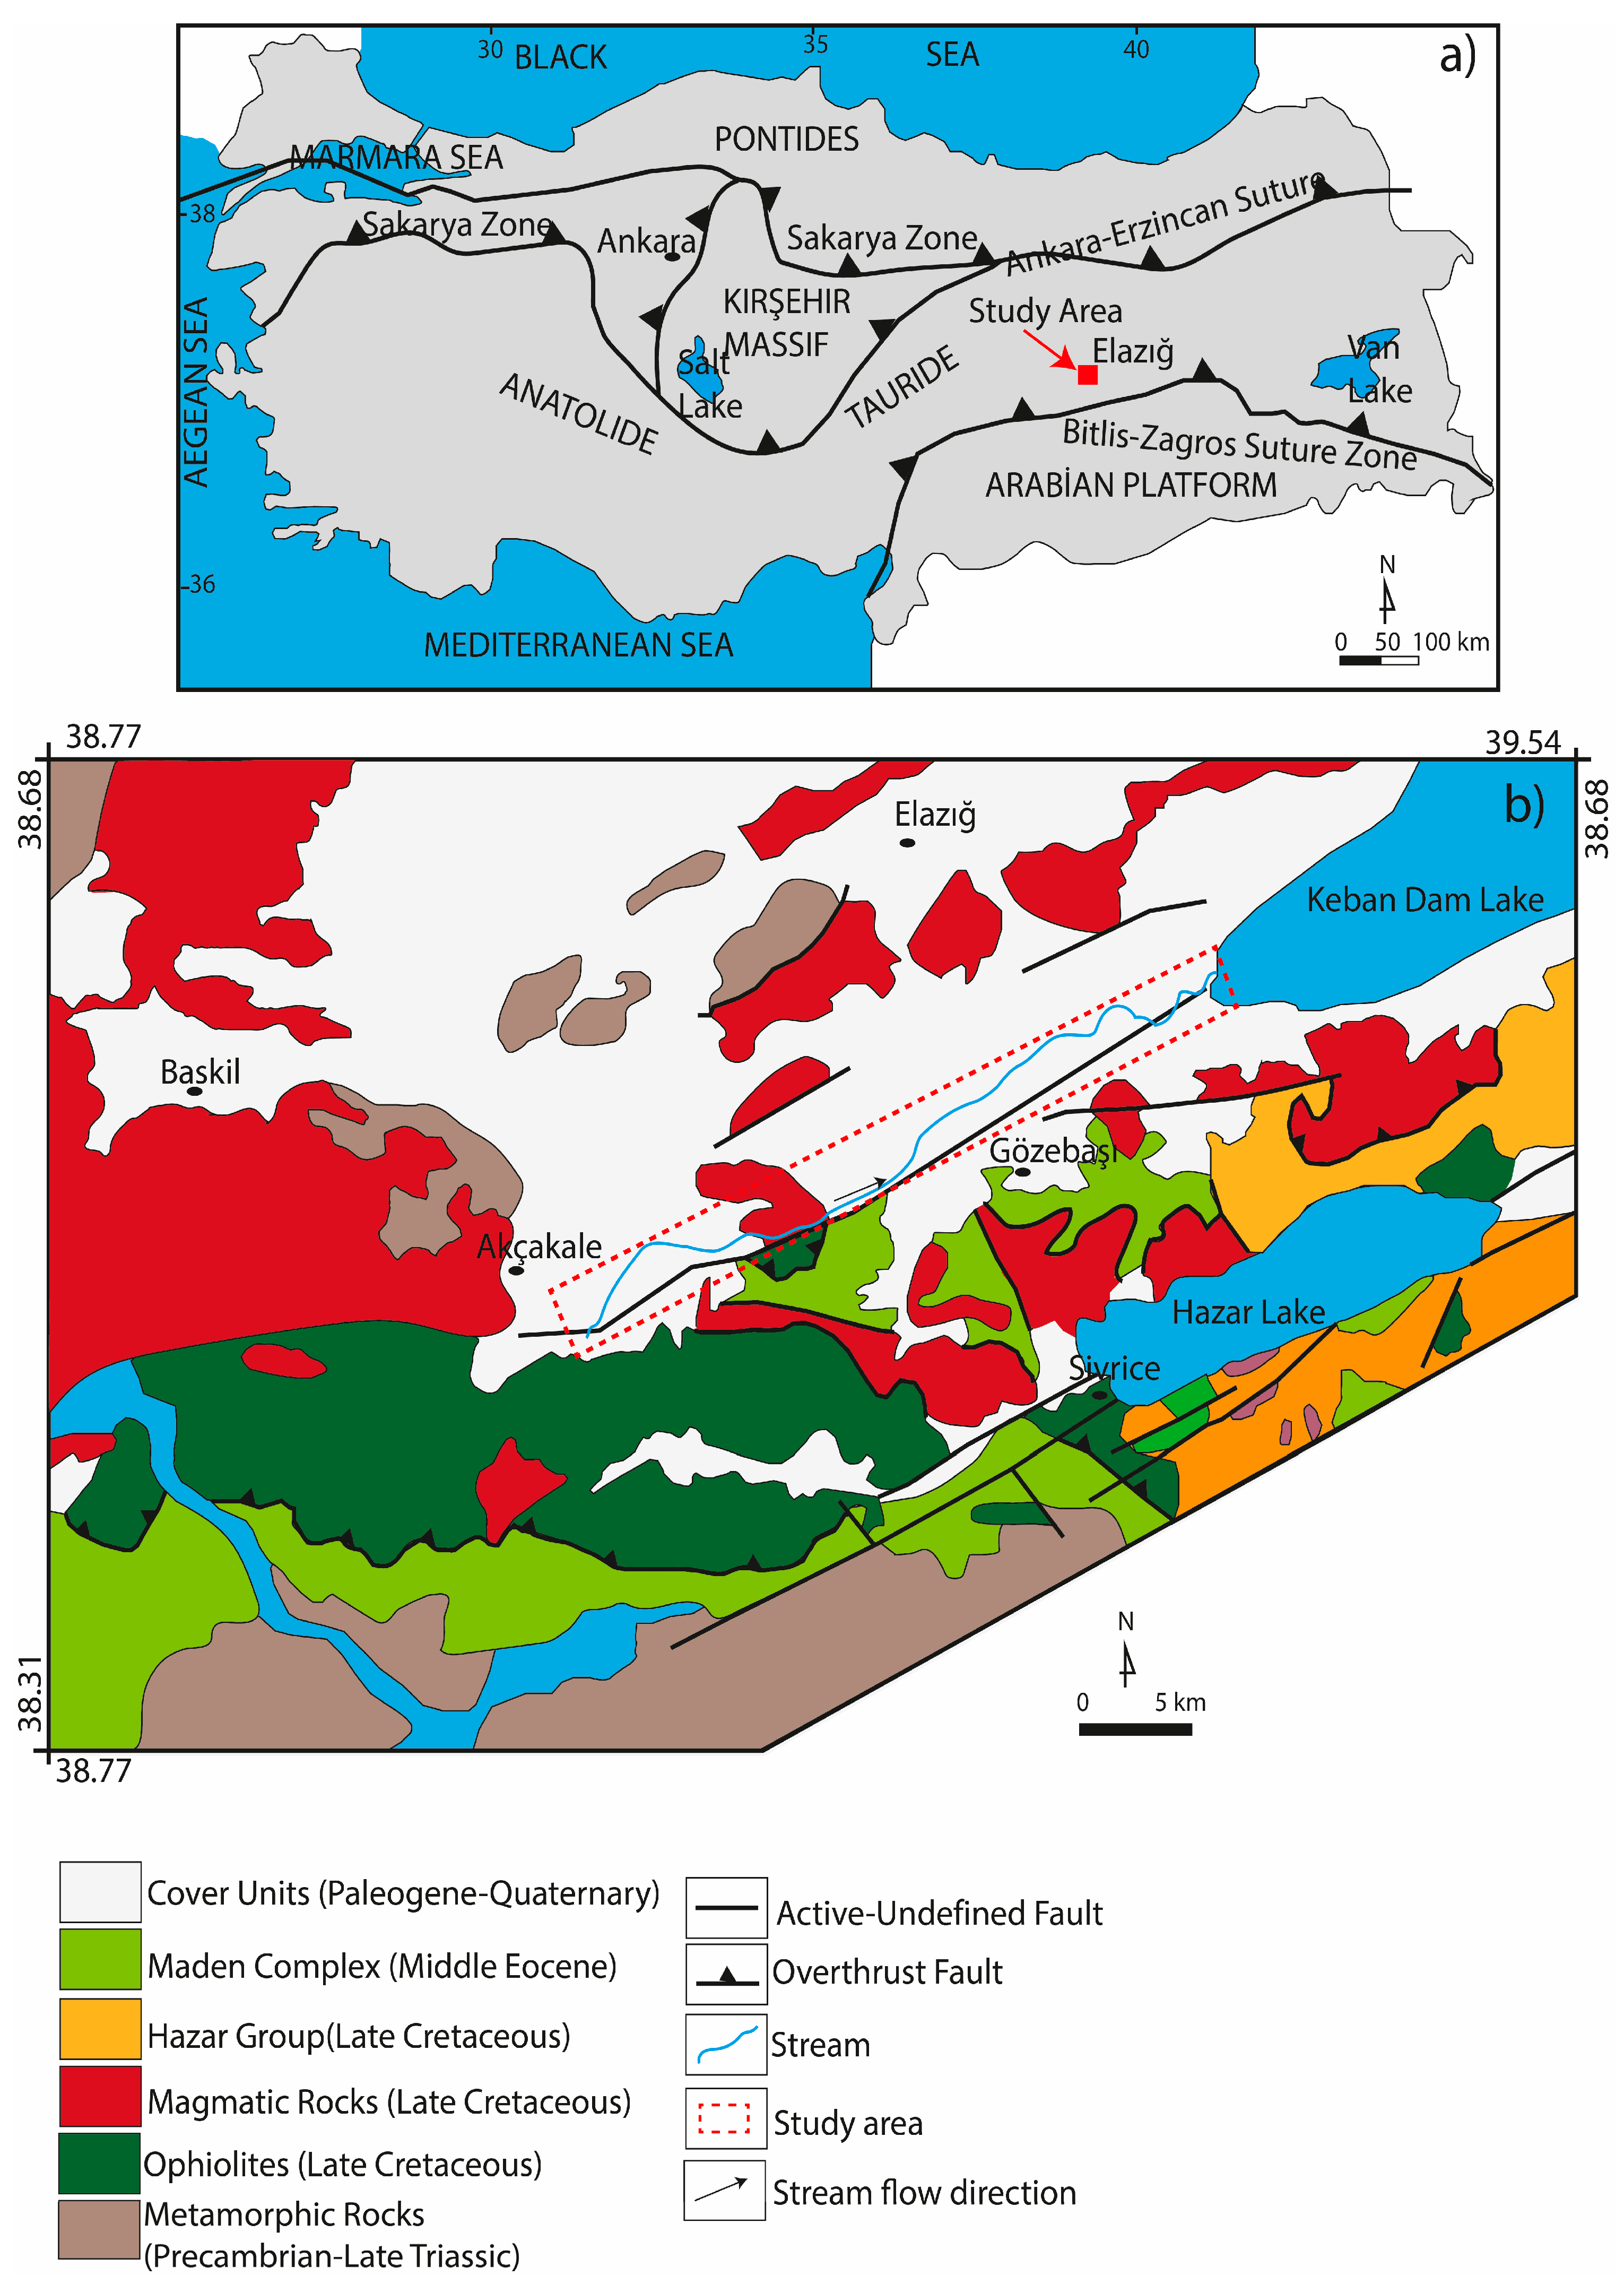
Figure 1.
(a) Simplified tectonic map showing the tectonic units of Turkey (simplified from [28]); (b) geological map of the study area with the stream and stream flow direction (modified from [42]).
Figure 1.
(a) Simplified tectonic map showing the tectonic units of Turkey (simplified from [28]); (b) geological map of the study area with the stream and stream flow direction (modified from [42]).
3. Materials and Methods
3.1. Climatic Information of the Study Area
Elazığ province is located in the Eastern Anatolia Region of Turkey and is a region with continental climate characteristics. According to the General Directorate of Meteorology (MGM) data for 1991–2020, the annual average temperature in Elazığ is 13.7 °C, and the average yearly precipitation is 420 mm.
While the annual average air temperature in Elazığ is −0.7 °C in January, this value increases to 27.2 °C in July. The highest average air temperature is observed in July and August at 34.4 °C, while the lowest drops to −22.6 °C in January.
The total annual precipitation is 420 mm, based on long-term averages. The highest average monthly precipitation occurs in April, with 63.4 mm, making it the wettest month in the region. Precipitation decreases considerably in the summer months; for instance, only 3.7 mm of rain falls on average in July, and this amount further drops to 1.8 mm in August (based on data from the Elazığ Meteorology Department).
3.2. Sediment Sampling
The studied stream originates in the highlands southwest of Elazığ province and flows in a general northeast direction, ultimately discharging into the Keban Dam Lake. The sampling transect extended over approximately 35 km, from upstream station K1 (37°S 50′72.67″ E, 42°57′51.2″ N) to downstream station K15 (37°S 53′08.42″ E, 42°72′59.8″ N) (Station K15). The sampling was conducted on a single day in July 2024, during a dry-weather period to ensure hydrological stability and minimise runoff influence. Stations K1 to K5 were located in rural and agricultural settings, K6 to K10 in peri-urban transitional zones, and K11 to K15 in urban-influenced areas near the outskirts of Elazığ city. Along its course, the stream traverses rural, agricultural, and peri-urban areas, including cultivated fields and settlements located on the outskirts of Elazığ city. Field observations during the sampling indicated an average stream width of 3–6 m and a depth ranging from 0.3 to 0.8 m, depending on local morphology and seasonal flow conditions. Although official discharge data are unavailable, the stream appears to have a moderate flow regime, fed by seasonal runoff, small tributaries, and potentially anthropogenic discharges such as untreated wastewater in certain downstream sections. This hydrological setting plays a crucial role in the transport and accumulation of pollutants, particularly metals, along the sediment continuum.
Sediment samples were collected along the urban sediment stream (Figure 2) using a hand trowel. The starting point of the stream is outside the city centre. Fifteen samples of river sediment (0–5 cm from the surface) were collected. A portable global positioning device recorded the coordinates of every sampling location. The samples were placed in polyethene bags, transported to the laboratory, and kept in dark conditions below 4 °C until analysis. To minimise contamination, the hand trowel was cleaned with a detergent, rinsed, and dried before each use.
Figure 2.
Map of study area with sampling point locations (adapted from Google Earth).
Before being analysed, the samples were allowed to air-dry in the lab. Additionally, an agate mill was used to crush the samples to about 0.075 mm (200 mesh) size after they had been homogenised and divided into subsamples.
3.3. Chemical Analysis of Sediment Samples
All geochemical analyses were conducted at Wuhan Sample Solution Analytical Technology Co., Ltd. (Wuhan, China), an ISO/IEC 17025-accredited laboratory (ISO/IEC 17025:2017 is an international standard jointly developed by the International Organization for Standardization (ISO) and the International Electrotechnical Commission (IEC), specifying the general requirements for the competence of testing and calibration laboratories). The concentrations of selected potentially toxic elements (PTEs)—including V, Cr, Co, Ni, Cu, Zn, Tl, Pb, Th, and U—were determined using Inductively Coupled Plasma Mass Spectrometry (ICP-MS) following acid digestion. Approximately 50 mg of each finely powdered sediment sample was digested with a mixture of HNO3, HClO4, HF, and HCl in a closed Teflon vessel using a CEM Mars 6 (CEM Corporation, Matthews, NC, USA), microwave digestion system, which enables high-pressure and high-temperature decomposition of silicate-rich matrices. The digestion protocol was based on USEPA Method 3052 [43], a widely accepted procedure for the preparation of geological and environmental samples. Following digestion, the solutions were diluted to the required volume and analysed using an Agilent 7700x ICP-MS instrument.
3.4. Quality Control Data (QCD)
Analytical precision and accuracy were monitored by including procedural blanks, replicate samples, and certified reference materials (CRMs) such as GBW07309 (stream sediment). The recovery rates for all elements ranged between 90% and 110%, and the relative standard deviations (RSDs) were generally below 5%, indicating satisfactory data quality for environmental assessment.
3.4.1. Contaminant Factor (CF)
The Contamination Factor (CF) is defined as the ratio of the concentration of each metal in the sediment to its corresponding background value, which in this study refers to the chemical composition of uncontaminated granodioritic rocks:
CF = Cmetal/Cbackground
CF values were interpreted according to the classification where CF < 1 indicates low contamination; 1 < CF < 3 indicates moderate contamination; 3 < CF < 6 indicates considerable contamination; and CF > 6 indicates very high contamination [44].
3.4.2. Pollution Load Index (PLI)
The Pollution Load Index (PLI) was calculated as the nth root of the product of n Contamination Factors (CF). This empirical index offers a straightforward, comparative method for evaluating the extent of metal pollution. A PLI value greater than 1 indicates the presence of pollution, whereas a value less than 1 suggests no significant metal contamination [45].
PLI = (CF1 × CF2 × CF3 ×…× CFn)1/n
3.4.3. Geo-Accumulation Index (Igeo)
The Geo-accumulation Index (Igeo) is calculated using the following equation:
where Cn is the measured concentration of a given metal in the sediment, and Bn is the corresponding geochemical background concentration. The constant factor 1.5 serves as a background matrix correction factor, accounting for possible variations in the lithogenic background due to natural fluctuations in the environment.
Igeo = Log2(Cn)/1.5(Bn)
The Igeo scale, originally introduced by Müller [46,47], categorises sediment contamination into seven distinct classes: Class 0 (practically unpolluted): Igeo ≤ 0; Class 1 (unpolluted to moderately polluted): 0 < Igeo < 1; Class 2 (moderately polluted): 1 < Igeo < 2; Class 3 (moderately to heavily polluted): 2 < Igeo < 3; Class 4 (heavily polluted): 3 < Igeo < 4; Class 5 (heavily to extremely polluted): 4 < Igeo < 5; and Class 6 (extremely polluted): 5 ˃ Igeo [22,48].
3.4.4. Enrichment Factor (EF)
The Enrichment Factor (EF) is a widely used tool for assessing the degree of metal accumulation in river sediments [49]. It is calculated using the following equation:
where Cx represents the concentration of the element of interest, and Cref is the concentration of a reference (or conservative) element, both in the sediment sample and in the background or crustal material. Reference elements are those whose concentrations are primarily influenced by natural (lithogenic) sources and are minimally affected by anthropogenic activities. They are typically characterized by low variability in natural abundance. Elements such as Ti, Ce, Sc, Mn, Zr, and Hf have been employed as reference elements [50]; however, Al and Fe are the most commonly used due to their consistent geochemical behaviour [51,52]. Because the average composition of the Earth’s crust may not accurately reflect local conditions, crustal values are often replaced with site-specific background values [48].
EF = (Cx/Cref)sediment/(Cx/Cref)Background
In this study, Sc was selected as the reference (or conservative) element for geochemical normalisation, based on the following considerations: (1) it is commonly associated with fine-grained sediment particles; (2) its geochemical behaviour is similar to that of many trace elements; and (3) its natural concentration tends to be relatively uniform [48]. EF values were interpreted according to the classification proposed by Sakan et al. [49], where: EF < 1 = no enrichment; EF = 1–3: minor enrichment; EF = 3–5: moderate enrichment; EF = 5–10: moderately severe enrichment; EF = 10–25: severe enrichment; EF = 25–50: very severe enrichment; EF > 50: extremely severe enrichment.
3.4.5. Ecological Risk Assessment
The potential ecological risk index (PERI) associated with sediment-bound metals was assessed using the method proposed by Hakanson [44]. This approach integrates both the contamination factor (CF) of each metal and its toxic response factor (Tr) to evaluate the ecological risk factor (Er) for individual elements and the overall ecological risk index (RI) for each sample.
The calculations were carried out using the following equations:
where RI = total potential risk of heavy metals, Eri = potential risk of heavy metals, Tri = toxic-response factor for heavy metal, CF contamination factor, Cm = concentration of metal in the sample, and Cbackground = background concentration of metal in UCC (Upper Continental Crust). The classification of the potential ecological risk index (RI), as proposed by Hakanson [44], is divided into four categories based on the calculated RI values. An RI value less than 150 indicates a low ecological risk. When the RI ranges from 150 to 300, it corresponds to a moderate ecological risk. Values between 300 and 600 are considered to represent considerable ecological risk. Finally, an RI value equal to or greater than 600 signifies a very high ecological risk.
CF = Cmetal/Cbackground
ER = Tri × CF
RI = ƩEri
3.4.6. Sediment Quality Guidelines (SQGs)
Sediment Quality Guidelines (SQGs) are widely used to assess the potential ecological risk of sediment-bound contaminants. In this study, the sediment concentrations of selected metals (Cr, Ni, Cu, Zn, and Pb) were evaluated using the Threshold Effect Level (TEL) and Probable Effect Level (PEL) values proposed by Smith et al. [53]. These thresholds are commonly employed in sediment quality assessments and help to interpret whether the measured contaminant levels are likely to cause adverse effects on benthic organisms. The TEL represents the concentration below which adverse biological effects are expected to occur only rarely, while the PEL indicates the concentration above which adverse effects are expected to occur more frequently.
3.5. Statistical Analyses
The arithmetic mean and standard error of the total metal concentrations were calculated. Pearson correlation analysis was employed to assess the relationships among the metals and to infer their possible sources. Hierarchical cluster analysis (HCA) was performed using Ward’s method and Euclidean distance as a measure of similarity to evaluate the grouping patterns of the metals and to further interpret their potential sources. All statistical analyses were conducted using the Statistical Package for the Social Sciences (SPSS Statistics 26) and Microsoft Excel.
4. Results
4.1. Metal Concentrations in Stream Sediments
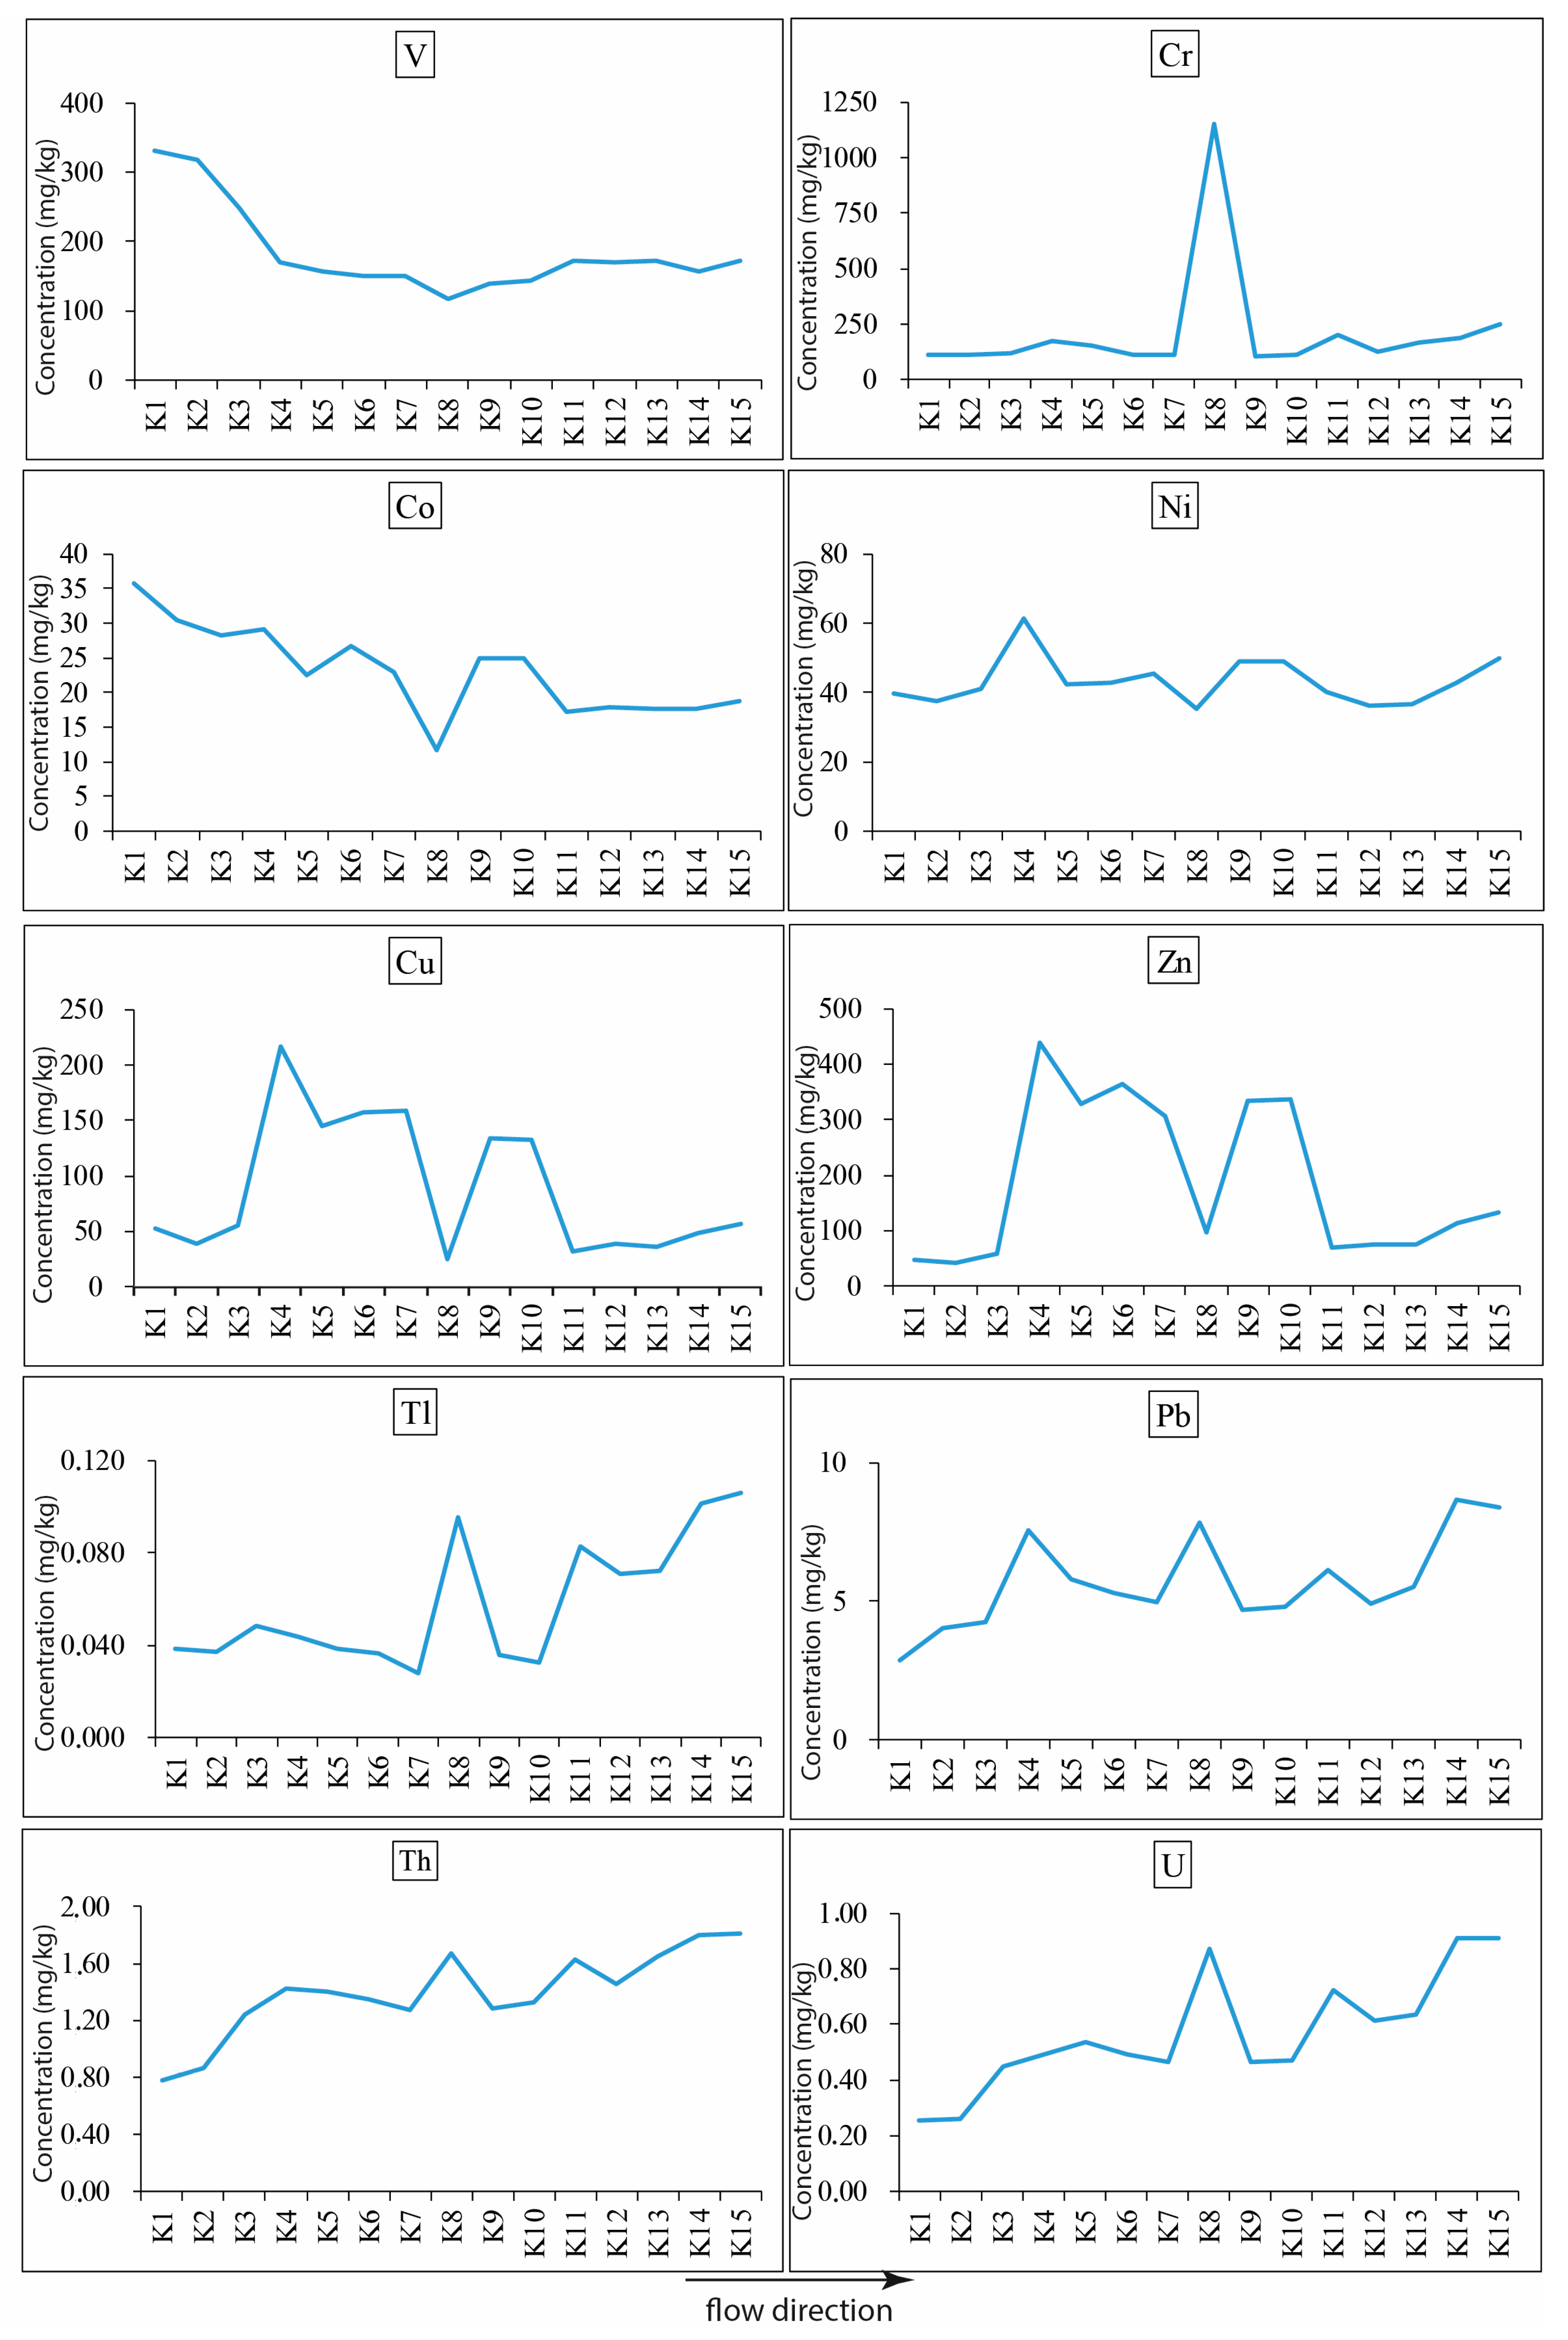
Basic statistics, background values, and sediment quality guidelines for metals and other parameters analysed in urban stream sediments are shown in Table 1. V concentrations ranged from 118.00 to 330.33 mg/kg, with an average of 184.69 mg/kg and a relatively high standard deviation (63.44), suggesting spatial variability. Similar high Cr values in sediments have previously been attributed to industrial discharges or weathering of mafic rocks [54]. Co and Ni displayed relatively narrow concentration ranges and lower standard deviations, with mean values of 23.13 mg/kg and 43.30 mg/kg, respectively, indicating more homogeneous distribution, consistent with natural geogenic sources [55]. Cu and Zn had notably high maximum values (216.22 mg/kg and 439.27 mg/kg, respectively), with elevated mean concentrations and high variability, which may point to anthropogenic influence, especially in samples such as K4. These elements are often linked to mining, industrial emissions, and urban runoff [22,56]. Trace elements such as Tl, Pb, Th, and U were found at relatively low concentrations, with Tl averaging 0.06 mg/kg and Pb averaging 5.72 mg/kg. The low mean and standard deviation values for Th (1.40 mg/kg) and U (0.57 mg/kg) suggest natural background levels with limited enrichment [57].

Table 1.
Basic statistical parameters for (n = 15) for average elemental concentrations (mg/kg) in urban stream sediments (Std = Standard Deviation (1σ); LOD = Limit of Detection).
Basic statistical parameters for the analysed elements are summarised in Table 1. On average, the elemental concentrations followed a decreasing order of Cr ˃ Zn ˃ V ˃ Cu ˃ Ni ˃ Co ˃ Pb ˃ Th ˃ U ˃ Tl. The spatial distribution of these elements across the sampling sites is illustrated in Figure 3. K8 exhibited high concentrations of most elements except for Zn, Ni, Co, V, and Cu, indicating localised enrichment of certain metals. Conversely, K1 showed elevated levels of V and Co, but comparatively low concentrations of other elements, suggesting different sources or environmental influences at this location. K15 was characterized by high concentrations of U, Th, Pb, Tl, and Ni, while other element levels remained relatively low. These variations demonstrated the heterogeneity of metal distribution in the urban stream sediments and reflected both natural background and anthropogenic influences in the study area.
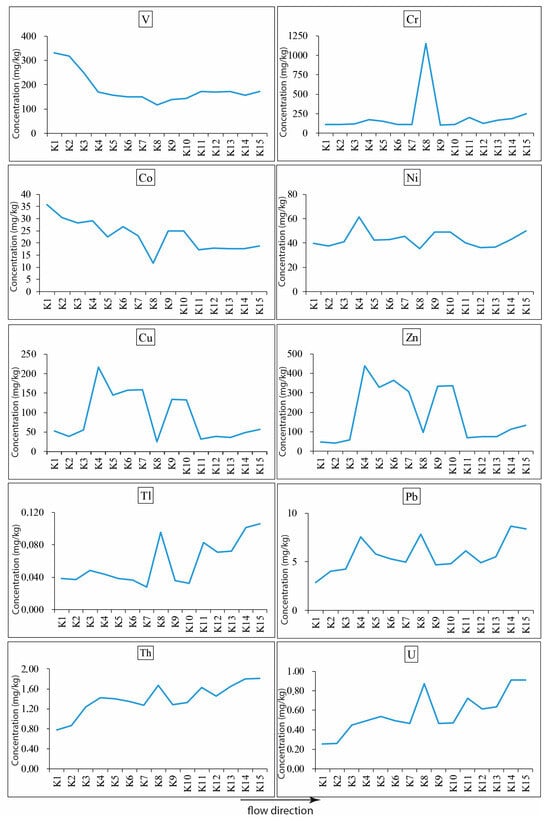
Figure 3.
Spatial distribution of elements in the urban stream sediments.
4.2. Pollution Source Identification of Elements in Stream Sediment
To determine the link between two variables, the bivariate approach of correlation analysis is commonly used. Environmental studies have frequently employed correlation analyses [58,59,60].
Several element pairs exhibit strong positive correlations, illustrating common sources or similar geochemical behaviour (Table 2). For example, Cu–Zn (r = 0.97) and Ni–Cu (r = 0.77) indicate a strong geochemical affinity, likely derived from sulfide mineralisation or anthropogenic inputs such as industrial or mining activities. Th–U (r = 0.95) and Pb–U (r = 0.87) also exhibit high correlations, implying a shared lithogenic origin, possibly from phosphate-bearing rocks or mineral assemblages. Tl–U (r = 0.91) and Tl–Th (r = 0.79) suggest that Tl may exhibit similar environmental mobility or origin to those of U and Th. Conversely, significant negative correlations are observed between specific element pairs: Co–Th (r = −0.86) and Co–U (r = −0.87) indicate that cobalt may originate from geochemically distinct sources or follow different environmental pathways compared to Th and U. V–Th (r = −0.75) and V–U (r = −0.63) also indicate an inverse relationship, suggesting differing geochemical controls or redox behaviour.
Table 2.
Pearson correlation coefficients of metals (n = 15).
Moderate correlations: Co–V (r = 0.71) suggests that similar lithological units or redox conditions may control both elements. Pb–Th (r = 0.86) and Pb–Tl (r = 0.75) imply that lead could be transported or deposited alongside Th and Tl, likely reflecting similar geochemical pathways.
Strong positive correlations suggest element pairs with common origins or co-mobilisation, whereas negative correlations reflect divergent behaviour, possibly due to different mineral hosts or environmental processes.
The results of the hierarchical cluster analysis (HCA) reveal three distinct clusters of sediment samples based on their metal concentration patterns. Cluster 1 (K8, K11–K15) contained moderate levels of Cr and Zn, lower Cu content, and relatively higher Th–U ratios. Cluster 2 (K1–K3) exhibited higher levels of V and Co, while other metals were relatively lower. Cluster 3 (K4–K7, K9–K10) showed the highest levels of Cu and Zn, along with moderate to high levels of Ni and Cr. This cluster likely represented regions with significant pollution and corresponded to most contaminated areas, especially in terms of Cu and Zn. Cluster 2 was closer to the natural background levels, despite elevated V and Co concentrations. Cluster 1 showed moderate levels of Cr and some radioactive elements (Th–U) (Table 3, Figure 4). Upper Continental Crust (UCC) [61] values were used as a reference for comparison (Table 3). The observed clustering could have been caused by a combination of anthropogenic and environmental variables. The highest concentrations of Cu, Zn, Ni, and Cr were found in Cluster 3, which was probably associated with regions more impacted by urban or industrial activities. These sites were located near residential areas, road networks, or untreated wastewater discharge points. Cluster 2 samples, on the other hand, which had higher V and Co levels, but generally lower metal levels, might have come from upstream regions that were comparatively little affected, perhaps representing natural geogenic sources with little anthropogenic interference. Cluster 1, with moderate Cr and elevated Th–U levels, might have been associated with regions influenced by lithological characteristics, such as the presence of naturally enriched source rocks or variations in grain size that enhanced the adsorption and accumulation of certain elements. Finer-grained sediments tend to retain higher concentrations of trace metals due to their larger surface area, which is often associated with a higher organic matter content.
Table 3.
Average metal concentrations (ppm) for each cluster.
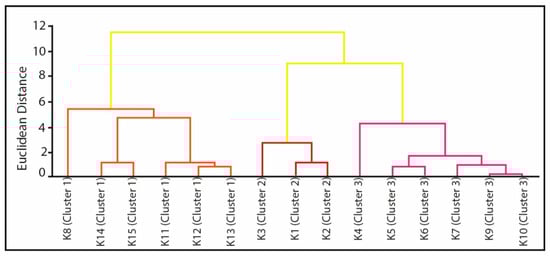
Figure 4.
The hierarchical clustering results for sediment samples are shown in the dendrogram. Annotated dendrogram of sediment samples (with cluster assignments).
4.3. Severity of Stream Sediment Contamination by Metals
The CF, PLI, Igeo, and EF were used to assess the severity of metal contamination of the sediment (Table 4 and Table 5). V shows CF values ranging from 2.57 to 3.40 in samples K1 to K3, corresponding to moderate to considerable contamination [44,62]. In contrast, most other metals (such as Pb, Tl, Th, and U) have CF values below 1, suggesting low contamination and dominance of natural background levels [55].
Table 4.
Contamination factors (CFs) (CF values are color-coded as follows: red for high pollution (CF > 3), blue for low pollution (CF ≤ 1), and black for medium pollution (1 < CF ≤ 3)) and PLI (PLI values are color-coded as follows:, black for moderate pollution (1 < PLI ≤ 3), and blue for low pollution (PLI ≤ 1)).
Table 5.
Geo-accumulation index of stream sediment samples in the study area (values greater than 2 are shown in red, values less than or equal to 0 are shown in blue, and values between 0 and 2 are presented in regular black font).
The Pollution Load Index (PLI), calculated as the geometric mean of the CF values for V, Cr, Co, Ni, Cu, Zn, Pb, Tl, Th, and U (normalised to UCC values), provides an integrated assessment of sediment quality. According to Tomlinson et al. [45], PLI > 1 indicates pollution, PLI = 1 represents baseline levels, and PLI < 1 suggests no pollution [45].
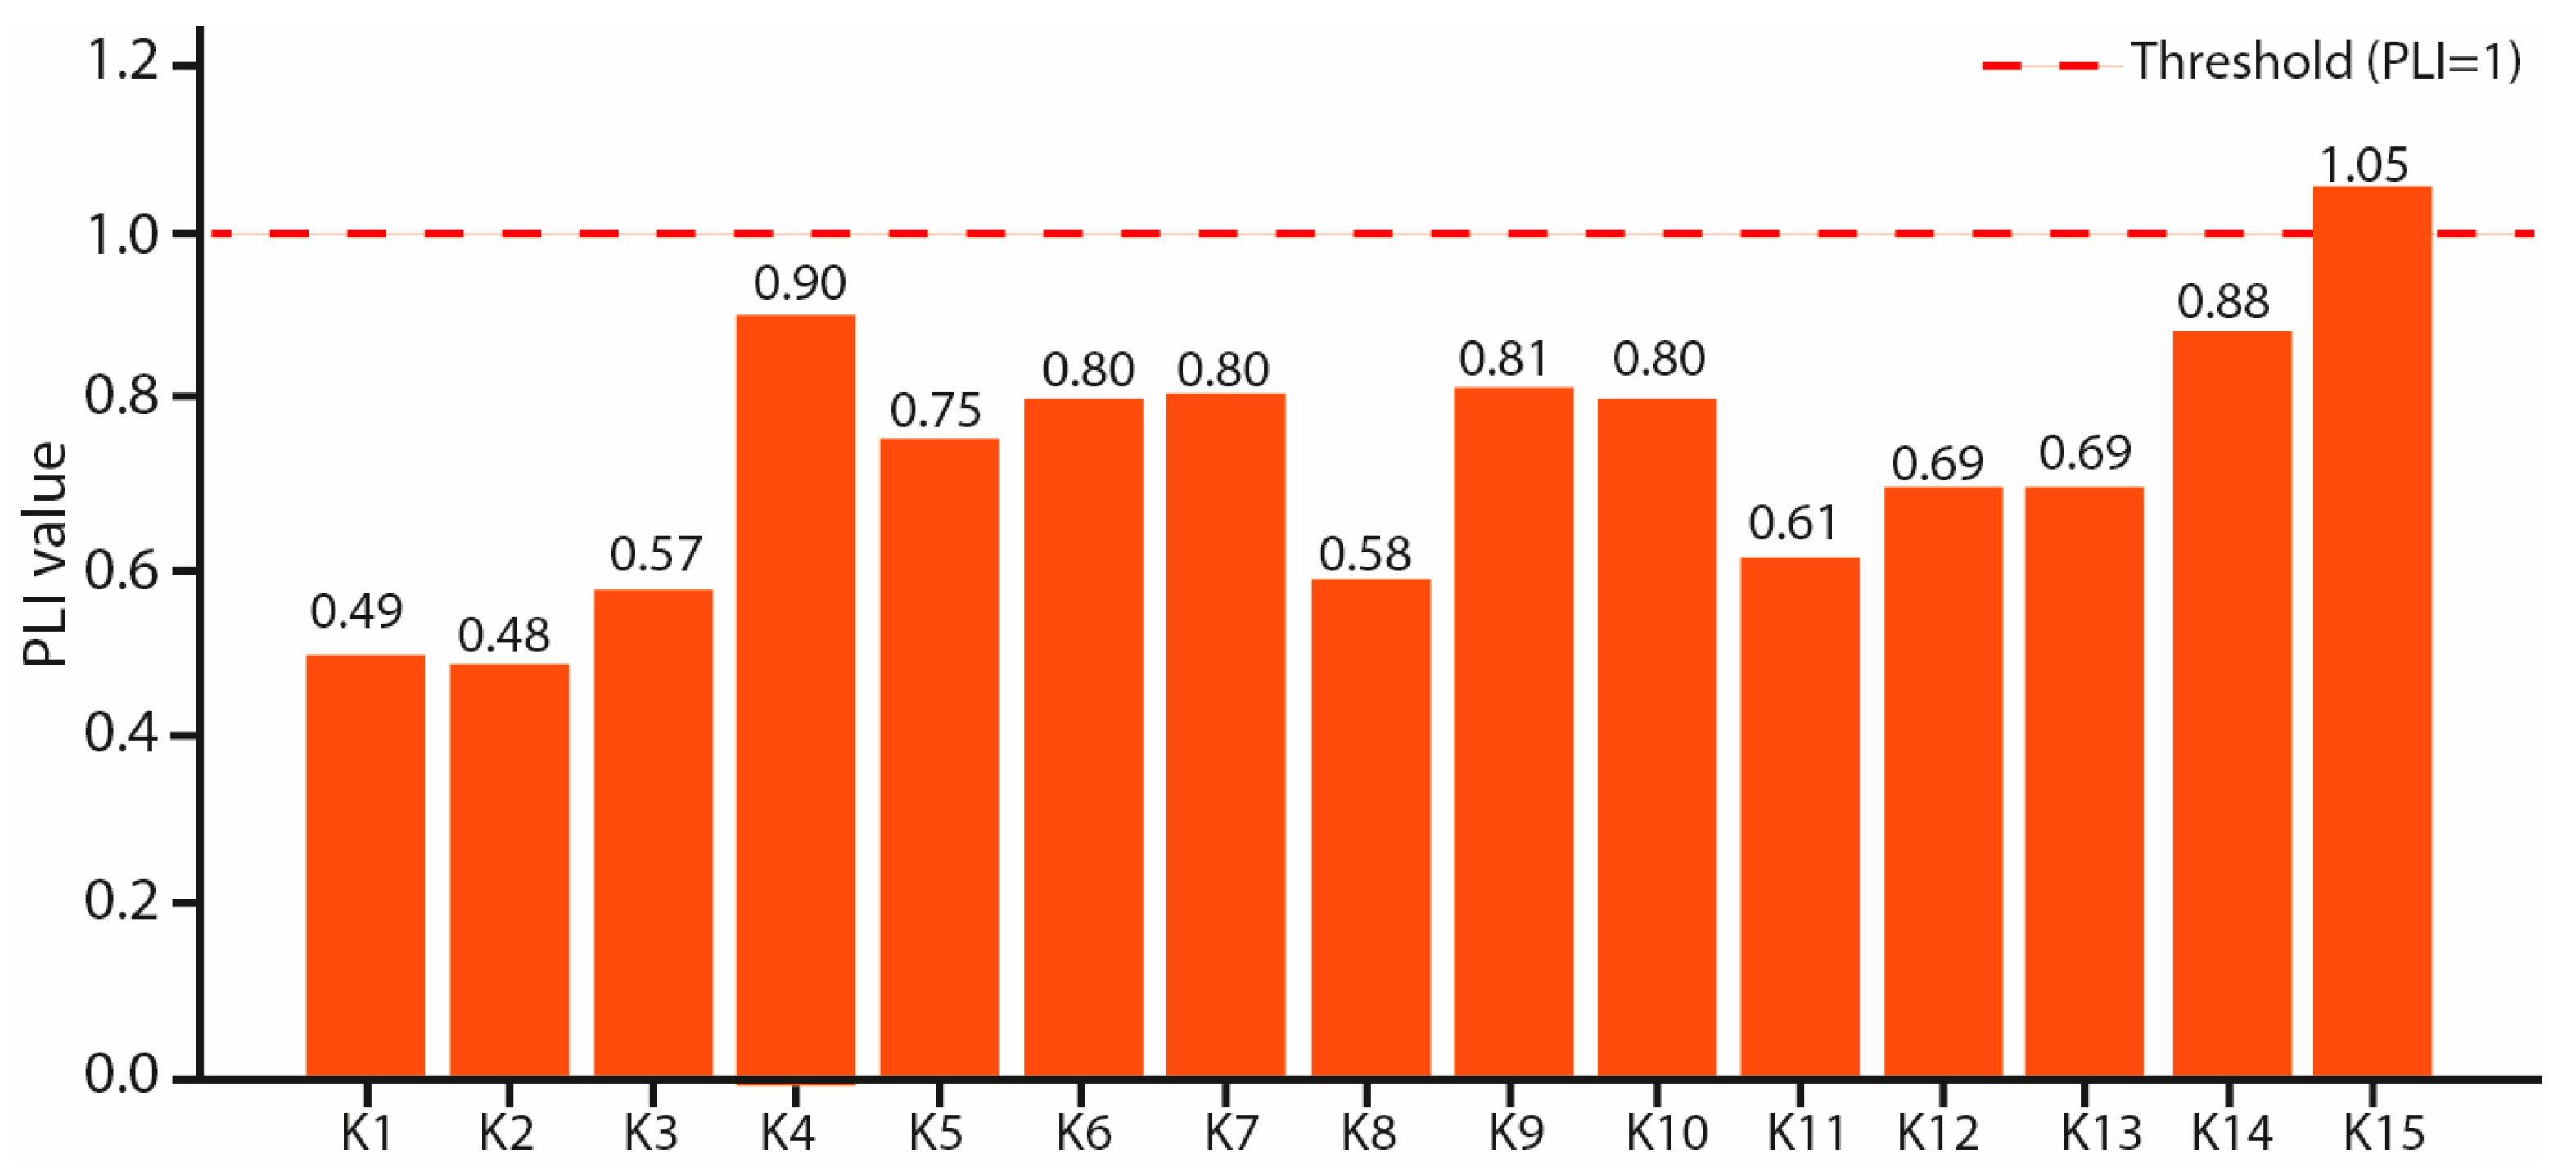
Among the analysed samples, K15 (PLI = 1.05) slightly exceeds the baseline value, indicating slight pollution. Samples K4 and K14 exhibit PLI values of 0.90 and 0.88, respectively, which are below the pollution threshold, indicating no pollution or low contamination. All remaining samples have PLI values < 1, reflecting generally low contamination levels in the study area (Figure 5).
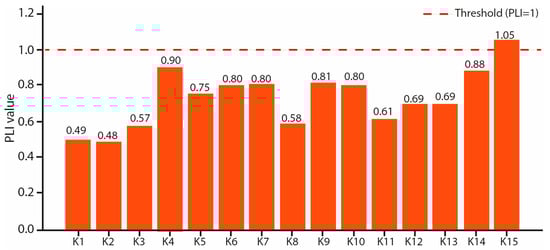
Figure 5.
The bar chart shows the PLI for each sediment sample (the horizontal dashed line at PLI = 1 indicates the threshold between unpolluted (<1) and polluted (>1) conditions. All samples except K15 fall below this threshold, indicating low contamination levels.
According to the geo-accumulation index (Igeo) values, Cr exhibited the highest pollution level with a value of 3.34 in sample K8, indicating moderate contamination. Cu and Zn also showed moderate pollution, with maximum Igeo values of 2.36 and 2.13, respectively, observed in sample K4. V showed slight to moderate pollution (Igeo = 1.18) in sample K1, while Co indicated slight pollution (Igeo = 0.46) in K1. Conversely, Ni exhibited the highest value of –0.22 in sample K4, suggesting no pollution. Pb, Tl, Th, and U had Igeo values ≤ 0 across all samples, indicating no contamination concerning these elements.
Below are the EF values calculated based on the Sc reference element and UCC background values. The EF values indicate varying degrees of metal contamination across the sediment samples. Cr exhibited very high enrichment in sample K8 (EF = 15.95), suggesting a potential for severe pollution. Cu and Zn showed high enrichment (EF > 2.5), particularly in samples K4 through K10. In contrast, Pb, Tl, Th, and U displayed low enrichment levels (EF < 0.4), indicating minimal anthropogenic influence. V, Co, and Ni were generally within the range of natural background levels to slight enrichment (EF ≈ 0.8–1.7), suggesting a predominantly geogenic origin with limited contamination.
4.4. Ecological Risk Factor (Er) and Ecological Risk Index (RI) for Stream Sediments
The Er for metals and the cumulative RI were calculated based on the methodology of Hakanson [44] using toxic response factors of Cr (2), Ni (5), Cu (5), Zn (1), and Pb (5). According to the results (Table 6), all samples fall within the low-ecological-risk category (RI < 150) as defined by Hakanson. However, some samples (K4–K7, K9–K10, and K15) exhibited relatively elevated RI values (>35), mainly due to high Cu and Zn contributions [63,64]. Additionally, sample K8 showed a notably high Er value for Cr (25.07), though the total RI remained well below 60. These findings suggest localised anthropogenic influences, particularly in downstream or urban discharge zones, contributing to heavy metal accumulation.
Table 6.
Ecological Risk Factor (Er) and Risk Index (RI) of selected metals in stream sediments (italic values indicate low risk (Er < 40 or RI < 150); regular values indicate moderate risk (Er = 40–79 or RI = 150–299)).
4.5. Metal Contamination Based on SQG (TEL–PEL)
Sediment concentrations of Cr, Ni, Cu, Zn, and Pb were evaluated against Threshold Effect Level (TEL) and Probable Effect Level (PEL) from Smith et al. [53] (Table 7). Ni levels predominantly ranged from moderate to high-risk categories, as most samples exceeded the TEL (20.9 mg/kg) and some surpassed the PEL (36 mg/kg). Cu was found at concentrations above both TEL (18.7 mg/kg) and PEL (34 mg/kg) in nearly all samples, with notably elevated values in samples K4 to K7. Zn concentrations exhibited a mixed pattern; while many samples remained below the TEL value (124 mg/kg), several samples, such as K4, K5, K6, K7, K9, and K10, exceeded this threshold, and some even approached or exceeded the PEL (271 mg/kg). Pb concentrations were generally low across all samples, remaining well below TEL (30.2 mg/kg) and PEL (112 mg/kg) values, indicating minimal Pb-related ecological concern in the studied sediments.
Table 7.
TEL and PEL values for metals in stream sediments [65] (values exceeding the Probable Effect Level (PEL) are highlighted in red, values between the Threshold Effect Level (TEL) and PEL are shown in black (regular font), and values below TEL are shown in blue).
5. Discussion
5.1. Evaluation of Contamination Severity in Stream Sediments
Copper in sample K4 shows a very high CF of 7.71, indicating significant enrichment and anthropogenic influence. Zn also displays a high CF value of 6.55 in the same sample, placing it at the threshold of very high contamination (CF > 6) [44]. The slightly elevated Pollution Load Index (PLI) value observed at sample K15 (1.05), which marginally exceeds the baseline threshold, may result from localised enrichment of potentially toxic elements due to both anthropogenic and natural factors. Anthropogenic influences such as minor industrial discharges, urban runoff, or historic land use activities (e.g., agricultural inputs containing metals) near the sampling site could have contributed to the increased metal concentrations in the sediments. Additionally, natural geological variability in the sediment source or mineral composition at K15 may lead to higher baseline metal levels independent of pollution.
5.2. Evaluation of Sediment Metal Contamination Based on SQG (TEL–PEL) Criteria
The results revealed that Cr concentrations in all sediment samples exceeded the TEL value (43.4 mg/kg), with many samples surpassing the PEL threshold (111 mg/kg), indicating a significant ecological risk. The results revealed that Cr concentrations in all sediment samples exceeded the TEL value (43.4 mg/kg), with many samples surpassing the PEL threshold (111 mg/kg), indicating a significant ecological risk. Sample K8 exhibited an exceptionally high Cr concentration (1153 mg/kg), suggesting intense anthropogenic input or localised contamination sources. Such elevated Cr levels may adversely affect benthic organisms and overall sediment quality. At such concentrations, Cr can inhibit key metabolic processes in sediment-dwelling invertebrates, leading to ecological imbalance. The spatial pattern indicates that contamination is not widespread, but highly concentrated, which may point to point-source pollution such as discharges from industrial facilities or urban runoff. This pattern points towards potential industrial or urban runoff impacts contributing to Ni enrichment in the sediments. The high Cu levels signify a probable adverse effect on aquatic biota and highlight the need for further monitoring and management. These findings suggest localised Zn pollution hotspots that may pose ecological risks. Such Zn hotspots may originate from vehicular emissions, galvanized materials, stormwater runoff, or sewage discharge—common sources of zinc in urban and semi-urban catchments. The low Pb concentrations indicate minimal Pb-related ecological concern in the studied sediments.
The SQG evaluation demonstrates that sediments in the study area are contaminated primarily with Cr, Ni, Cu, and Zn at levels likely to exert adverse ecological effects. The results highlight the influence of anthropogenic activities, especially urban and industrial discharges, on metal enrichment. Lead contamination appears minimal in comparison. These findings emphasise the importance of continuous monitoring and implementation of pollution mitigation strategies to protect the region’s sediment quality and aquatic ecosystems.
5.3. Geochemical Source Apportionment of Potentially Toxic Elements
The combination of contamination indices, correlation analyses, and geological context enables a more straightforward interpretation of the origins of potentially toxic elements (PTEs) in the study area. Metals such as Cr, Cu, and Zn show the highest contamination levels, with very high contamination factors (CF > 6) and enrichment factors (EF > 10) in specific samples (e.g., Cu and Zn in K4, Cr in K8). These patterns, together with strong positive correlations (Cu–Zn: r = 0.97; Ni–Cu: r = 0.77), suggest anthropogenic inputs, potentially originating from industrial waste, mining residues, or urban runoff.
In contrast, elements such as V, Co, Ni, Th, and U display relatively low enrichment (EF < 2) and low to moderate CF values, indicating a dominantly geogenic origin. This interpretation is further supported by the spatial alignment of elevated V and Co concentrations with regions underlain by ophiolitic rocks (e.g., peridotites and gabbros) and Eocene-aged plutonic rocks prevalent in the Elazığ geological setting. These lithologies, which include the Elazığ Magmatic Complex, Maden Complex, and ophiolitic nappes, are known to host naturally elevated levels of trace metals such as Co, Ni, and V due to their mafic-ultramafic mineral composition.
Moreover, the strong correlations observed among Th–U (r = 0.95) and their association with granodioritic intrusions suggest that these elements are likely derived from radioactive mineral-bearing lithologies, such as plutonic units rich in zircon and monazite. The low variability and consistent distribution of these elements across samples further support a lithogenic source rather than anthropogenic contamination.
Several inverse correlations (e.g., Co–Th, V–U) may indicate differing redox behaviours or environmental partitioning. For example, U and Th tend to be more mobile under oxidising conditions, whereas V and Co are often stable in reducing environments, contributing to their spatial and statistical separation.
The study area is situated within the upper part of the Elazığ Basin and encompasses a stream catchment that ultimately drains into the Keban Dam Lake. The stream flows through both rural and urban environments, including the central part of Elazığ city, which has a population of around 400,000. Urban land use dominates the middle and lower reaches of the catchment, with residential zones, road networks, and small-scale industrial facilities present along the stream. There are also municipal wastewater outlets discharging directly into the stream, which may contribute to elevated levels of certain metals such as Cu and Zn. In addition, informal car repair shops, construction activities, and urban surface runoff likely exacerbate localised contamination, especially downstream (K4–K10). Although there are no active large-scale mining operations within the immediate catchment, historical small-scale mining and quarrying activities have been reported in nearby regions, particularly related to chromite and copper deposits. Residual waste and altered landforms from these activities may still influence the sediment geochemistry through erosion and leaching, especially during periods of high precipitation. Anthropogenic pollution is evident for Cu, Zn, and Cr, particularly in localised zones such as K4–K10. Geogenic signatures dominate for V, Co, Ni, Th, and U, consistent with the regional mafic, ultramafic, and plutonic geological formations.
5.4. Spatial Trends in Metal Contamination
Spatial variations in contamination levels along the stream reveal meaningful trends. In general, Ni and Cu levels showed a tendency to increase from upstream to downstream, particularly in the central part of the stream where urban and industrial activity is more intense, suggesting a cumulative effect of anthropogenic inputs toward the lake. Samples K4 to K7, located closer to urban and semi-industrial zones, consistently displayed elevated concentrations of multiple elements (e.g., Cu, Zn, Ni), indicating these locations as potential pollution hotspots. The more polluted areas appear to coincide with regions of urban development and road networks, whereas samples from upstream rural areas (e.g., K1–K2) exhibited relatively lower metal concentrations.
Agricultural activities in rural areas may contribute to the elevated levels of certain metals such as Zn and Pb through the use of phosphate fertilisers, whereas industrial runoff and untreated urban sewage are likely sources for Cu, Ni, and Cr.
Climatic conditions, particularly seasonal precipitation, may further enhance metal mobilisation and transport, contributing to higher metal loads during periods of increased runoff. This aspect is especially important in semi-arid regions where episodic heavy rainfall can lead to pulsed contaminant delivery to stream sediments.
The cluster analysis performed in this study also supports the hypothesis of distinct contamination sources. Cluster 3 (K4–K7, K9–K10) exhibited high Cu and Zn levels, which may be linked to industrial effluents or vehicular emissions, while Cluster 2 (K1–K3) showed relatively high V and Co, potentially reflecting geogenic input or agricultural sources.
Although this study focused on point sampling, it is important to acknowledge that metal concentrations may vary across the width of the stream channel due to hydrodynamic sorting or localised inputs, particularly near discharge points.
6. Conclusions
This study comprehensively analyses metal contamination in stream sediments draining into Keban Dam Lake, utilising multiple pollution indices, including the CF, EF, PLI, and Igeo. The results revealed that metals such as Cu, Zn, and Cr are notably enriched in certain downstream areas influenced by urban and industrial activities. These levels correspond to very high contamination factors (CF > 6) and enrichment factors (EF > 10), indicating strong anthropogenic influence. In contrast, metals such as lead (Pb), thallium (Tl), thorium (Th), and uranium (U) remained below ecological risk thresholds (e.g., TEL), reflecting minimal contamination and suggesting a dominantly natural origin. The pollution load index (PLI) showed that while most sampling locations are unpolluted (PLI < 1), some urban-impacted zones exhibited moderate pollution (PLI up to 1.55), highlighting localised contamination.
Multivariate and cluster analyses identified one major pollution hotspot, located in the middle to lower reaches of the stream, where high concentrations of Cu, Zn, and Cr are observed. This region, characterized by residential, industrial, and roadside activity, likely contributes significantly to sediment pollution through surface runoff, waste discharge, and possible legacy effects of former mining activities.
Strong correlations among Cu–Zn and Ni–Cu indicated shared anthropogenic sources, while the geochemical behaviour of Th and U suggested a natural origin linked to local granitic and plutonic rock units. Negative correlations between some metals reflected differences in geochemical mobility and environmental conditions, such as redox states.
These findings are crucial for developing effective pollution control measures and provide a basis for further monitoring of sediment quality in the Keban Dam Lake region. Continued research is necessary to track changes over time and assess the long-term impacts of pollution on the local aquatic ecosystems and human health.
Funding
This work was funded by the Fırat University Scientific Research Projects Coordination Unit (FÜBAP) of Fırat University, Elazığ/Turkey, for its financial support (No MF 24.106 and MF 25.50).
Institutional Review Board Statement
Not applicable.
Informed Consent Statement
Not applicable.
Data Availability Statement
The data presented in this study are available in the article.
Conflicts of Interest
The authors declare no conflict of interest.
References
- Patel, P.; Raju, N.J.; Reddy, S.R.; Suresh, U.; Sankar, D.B.; Reddy, T.V.K. Heavy metal contamination in river water and sediments of the Swarnamukhi River Basin, India: Risk assessment and environmental implications. Environ. Geochem. Health 2018, 40, 609–623. [Google Scholar] [CrossRef] [PubMed]
- Pandey, L.K.; Park, J.; Son, D.H.; Kim, W.; Islam, S.; Choi, S.; Lee, H.; Han, T. Assessment of metal contamination in water and sediments from major rivers in South Korea from 2008 to 2015. Sci. Total Environ. 2019, 651, 323–333. [Google Scholar] [CrossRef] [PubMed]
- Wijesiri, B.; Liu, A.; Deilami, K.; He, B.; Hong, N.; Yang, B.; Zhao, X.; Ayoko, G.; Goonetilleke, A. Nutrients and metals interactions between water and sediment phases: An urban river case study. Environ. Pollut. 2019, 251, 354–362. [Google Scholar] [CrossRef] [PubMed]
- Boumaiza, L.; Walter, J.; Chesnaux, R.; Zahi, F.; Huneau, F.; Garel, E.; Stotler, R.L.; Bordeleau, G.; Johannesson, K.H.; Vystavna, Y.; et al. Combined effects of seawater intrusion and nitrate contamination on groundwater in coastal agricultural areas: A case from the Plain of the El-Nil River (North-Eastern Algeria). Sci. Total Environ. 2022, 851, 158153. [Google Scholar] [CrossRef]
- Butler, M.J.; Yellen, B.C.; Oyewumi, O.; Ouimet, W.; Richardson, J.B. Accumulation and transport of nutrient and pollutant elements in riparian soils, sediments, and river waters across the Thames River Watershed, Connecticut, USA. Sci. Total Environ. 2023, 899, 165630. [Google Scholar] [CrossRef]
- Zhao, J.; Wu, E.; Zhang, B.; Bai, X.; Lei, P.; Qiao, X.; Li, Y.-F.; Li, B.; Wu, G.; Gao, Y. Pollution characteristics and ecological risks associated with heavy metals in the Fuyang river system in North China. Environ. Pollut. 2021, 281, 116994. [Google Scholar] [CrossRef]
- Jaskuła, J.; Sojka, M.; Fiedler, M.; Wróżyński, R. Analysis of Spatial Variability of River Bottom Sediment Pollution with Heavy Metals and Assessment of Potential Ecological Hazard for the Warta River, Poland. Minerals 2021, 11, 327. [Google Scholar] [CrossRef]
- Jaskuła, J.; Sojka, M. Assessment of spatial distribution of sediment contamination with heavy metals in the two biggest rivers in Poland. Catena 2022, 211, 105959. [Google Scholar] [CrossRef]
- Kalender, L.; Aytimur, G. REE Geochemistry of Euphrates River, Turkey. J. Chem. 2016, 2016, 1012021. [Google Scholar] [CrossRef]
- Suroğlu, M.; Kalender, L.; Kara, H. Görgü Pb-Zn Yatağı Civarındaki Maden Atıklarının Yüzey ve Yeraltı Sularına Etkisi (Malatya-Türkiye). Osman. Korkut Ata Üniversitesi Fen. Bilim. Enstitüsü Derg. 2021, 4, 283–303. [Google Scholar] [CrossRef]
- Kalender, L.; Kara, H. Evulation Metal of Contamination by Natural Background and Average Earth’s Crust Values in The Inci Stream Sediments Around Chromite Deposits in Guleman (Alacakaya-Elazığ), Turkey. Afyon Kocatepe Üniversitesi Fen. Ve Mühendislik Bilim. Derg. 2023, 23, 1056–1071. [Google Scholar]
- Yi, Y.; Yang, Z.; Zhang, S. Ecological risk assessment of heavy metals in sediment and human health risk assessment of heavy metals in fishes in the middle and lower reaches of the Yangtze River basin. Environ. Pollut. 2011, 159, 2575–2585. [Google Scholar] [CrossRef] [PubMed]
- Emenike, P.C.; Tenebe, I.T.; Neris, J.B.; Omole, D.O.; Afolayan, O.; Okeke, C.U.; Emenike, I.K. An integrated assessment of land-use change impact, seasonal variation of pollution indices and human health risk of selected toxic elements in sediments of River Atuwara, Nigeria. Environ. Pollut. 2020, 265, 114795. [Google Scholar] [CrossRef] [PubMed]
- Haghnazar, H.; Pourakbar, M.; Mahdavianpour, M.; Aghayani, E. Spatial distribution and risk assessment of agricultural soil pollution by hazardous elements in a transboundary river basin. Environ. Monit. Assess. 2021, 193, 158. [Google Scholar] [CrossRef]
- Ustaoğlu, F. Ecotoxicological risk assessment and source identification of heavy metals in the surface sediments of Çömlekci stream, Giresun, Turkey. Environ. Forensics 2021, 22, 130–142. [Google Scholar] [CrossRef]
- Yi, Y.-J.; Sun, J.; Tang, C.-H.; Zhang, S.-H. Ecological risk assessment of heavy metals in sediment in the upper reach of the Yangtze River. Environ. Sci. Pollut. Res. 2016, 23, 11002–11013. [Google Scholar] [CrossRef]
- Namngam, N.; Xue, W.; Liu, X.; Kootattep, T.; Shrestha, R.P.; Wattayakorn, G.; Tabucanon, A.S.; Yu, S. Sedimentary metals in developing tropical watersheds in relation to their urbanization intensities. J. Environ. Manag. 2021, 278, 111521. [Google Scholar] [CrossRef] [PubMed]
- Wu, B.; Wang, G.; Wu, J.; Fu, Q.; Liu, C. Sources of Heavy Metals in Surface Sediments and an Ecological Risk Assessment from Two Adjacent Plateau Reservoirs. PLoS ONE 2014, 9, e102101. [Google Scholar] [CrossRef]
- Maanan, M.; Ruiz-Fernández, A.C.; Maanan, M.; Fattal, P.; Zourarah, B.; Sahabi, M. A long-term record of land use change impacts on sediments in Oualidia lagoon, Morocco. Int. J. Sediment Res. 2014, 29, 1–10. [Google Scholar] [CrossRef]
- Mohammadi, M.; Darvishan, A.K.; Bahramifar, N. Spatial distribution and source identification of heavy metals (As, Cr, Cu and Ni) at sub-watershed scale using geographically weighted regression. Int. Soil Water Conserv. Res. 2019, 7, 308–315. [Google Scholar] [CrossRef]
- Davutoğlu, O.I.; Seçkin, G.; Ersu, C.B.; Yılmaz, T.; Sarı, B. Assessment of Metal Pollution in Water and Surface Sediments of the Seyhan River, Turkey, Using Different Indexes. Clean—Soil Air Water 2011, 39, 185–194. [Google Scholar] [CrossRef]
- Varol, M. Assessment of heavy metal contamination in sediments of the Tigris River (Turkey) using pollution indices and multivariate statistical techniques. J. Hazard. Mater. 2011, 195, 355–364. [Google Scholar] [CrossRef] [PubMed]
- Kalender, L.; Çiçek Uçar, S. Assessment of metal contamination in sediments in the tributaries of the Euphrates River, using pollution indices and the determination of the pollution source, Turkey. Environ. Earth Sci. 2013, 79, 73–84. [Google Scholar] [CrossRef]
- Akçay, İ.; Özbay, Ö. Metal pollution status of surface sediments in the two coastal regions of the Mersin Bay, Northeastern Mediterranean Sea. Adv. Underw. Sci. 2022, 2, 27–32. [Google Scholar]
- Çavuş, M.; Kükrer, S.; Sağlam, M.; Erginal, A.E. Analysis of toxic metal-induced ecological risk in Kepez Stream (Çanakkale, Türkiye). Int. J. Environ. Geoinf. 2023, 10, 123–132. [Google Scholar] [CrossRef]
- Pulatsü, S.; Latifi, D. Evaluation of health risks from heavy metals in the creeks feeding Mogan Lake (Türkiye). Ege J. Fish. Aquat. Sci. 2023, 40, 231–239. [Google Scholar] [CrossRef]
- Şengör, A.M.C.; Yılmaz, Y. Tethyan evolution of Turkey: A plate tectonic approach. Tectonophysics 1981, 75, 181–241. [Google Scholar] [CrossRef]
- Robertson, A.H.F.; Ustaömer, T. Tectonic evolution of the eastern Mediterranean region: From subsidence to collision. In Sedimentary Basin Tectonics from the Black Sea and Caucasus to the Arabian Platform; Sosson, M., Kaymakçı, N., Stephenson, R.A., Bergerat, F., Eds.; Geological Society: London, UK, 2009; Volume 340, pp. 281–311. [Google Scholar]
- Sar, A.; Ertürk, M.A.; Rizeli, M.E. Genesis of Late Cretaceous intra-oceanic arc intrusions in the Pertek area of Tunceli Province, eastern Turkey, and implications for the geodynamic evolution of the southern Neo-Tethys: Results of zircon U–Pb geochronology and geochemical and Sr–Nd isotopic analyses. Lithos 2019, 350–351, 105263. [Google Scholar] [CrossRef]
- Ertürk, M.A.; Sar, A.; Rizeli, M.E. Petrology, zircon U-Pb geochronology and tectonic implications of the A1-type intrusions: Keban region, eastern Turkey. Geochemistry 2022, 82, 125882. [Google Scholar] [CrossRef]
- Perinçek, D. The Geology of Hazro-Korudağ-Çüngüş¸-Maden-Ergani-Hazar-Elazığ- Malatya Area. Guide Book (TJK), 1979, 33. Available online: https://www.researchgate.net/publication/291997458_The_Geology_of_Hazro-Korudag-Cungus-Maden-Ergani-Hazar-Elazig-_Malatya_area (accessed on 2 July 2025).
- Yılmaz, Y. Southeast Anatolian Orogenic Belt revisited (geology and evolution). Can. J. Earth Sci. 2019, 56, 1163–1180. [Google Scholar] [CrossRef]
- Kara, H.; Sağıroğlu, A. Keban ve Malatya Metamorfitleri’ne Ait Organik Madde İçeren Kayaçların İz ve Nadir Toprak Element Jeokimyası. Fırat Üniversitesi Fen. Bilim. Derg. 2013, 30, 1–10. [Google Scholar]
- Ertürk, M.A.; Kara, H.; Sar, A.; Yılmaz, İ.; Aysal, N. Geochronology and Petrogenesis of the Early Miocene Felsic Dykes: New evidence for initiation of post- collisional magmatism in the SW Malatya-Eastern Anatolia (Turkey). Geol. Carpath. 2023, 74, 245–260. [Google Scholar] [CrossRef]
- Parlak, O.; Rızaoğlu, T.; Bağcı, U.; Karaoğlan, F.; Höck, V. Tectonic significance of the geochemistry and petrology of ophiolites in Southeast Anatolia, Turkey. Tectonophysics 2009, 473, 173–187. [Google Scholar] [CrossRef]
- Rizeli, M.E.; Beyarslan, M.; Wang, K.-L.; Bingöl, A.F. Mineral chemistry and petrology of mantle peridotites from the Guleman ophiolite (SE Anatolia, Turkey): Evidence of a forearc setting. J. Afr. Earth Sci. 2016, 123, 392–402. [Google Scholar] [CrossRef]
- Bingöl, A.F.; Beyarslan, M.; Lin, Y.-C.; Lee, H.-Y. Geochronological and geochemical constraints on the origin of the Southeast Anatolian ophiolites, Turkey. Arab. J. Geosci. 2018, 11, 569. [Google Scholar] [CrossRef]
- Ertürk, M.A.; Kara, H.; Kalender, L. Oxygen isotope composition of the silicate minerals and chrome ores in the Guleman ophiolite in southeastern Türkiye. Dokl. Earth Sci. 2024, 515, 722–733. [Google Scholar] [CrossRef]
- Ertürk, M.A. Geochronology and Petrology of Late Cretaceous Subduction-Related Volcanics from Elazığ, SE Türkiye: Insights into Deciphering Petrogenesis and Magma Generation Processes. Geochemistry 2025, 85, 126234. [Google Scholar] [CrossRef]
- Ertürk, M.A.; Beyarslan, M.; Chung, S.-L.; Lin, T.-H. Eocene magmatism (Maden Complex) in the Southeast Anatolian Orogenic Belt: Magma genesis and tectonic implications. Geosci. Front. 2018, 9, 1829–1847. [Google Scholar] [CrossRef]
- Yazgan, E.; Chessex, R. Geology and tectonic evolution of the southeastern Taurides in the region of Malatya. Turk. Assoc. Pet. Geol. Bull. 1991, 3, 1–42. [Google Scholar]
- General Directorate of Mineral Research and Exploration (M.T.A). Magmatic Rocks Map of Turkey; General Directorate of Mineral Research and Exploration: Ankara, Turkey, 2013. [Google Scholar]
- United States Environmental Protection Agency (USEPA). SW-846 EPA Method 3052: Microwave Assisted Acid Digestion of Siliceous and Organically Based Matrices. In Test Methods for Evaluating Solid Waste, 3rd ed.; US Environmental Protection Agency: Washington, DC, USA, 1996. [Google Scholar]
- Hakanson, L. Ecological risk index for aquatic pollution control, a sedimentological approach. Water Res. 1980, 14, 975–1001. [Google Scholar] [CrossRef]
- Tomlinson, D.C.; Wilson, J.G.; Harris, C.R.; Jeffery, D.W. Problems in the assessment of heavy metals levels in estuaries and the formation of a pollution index. Helgol. Wiss. Meeresunters 1980, 33, 566–575. [Google Scholar] [CrossRef]
- Müller, G. Index of geoaccumulation in sediments of the Rhine River. GeoJournal 1969, 2, 108–118. [Google Scholar]
- Müller, G. Die Schwermetallbelstung der Sedimente des Neckars und seiner Nebenflüsse: Eine Bestandsaufnahme. Chem. Ztg. 1981, 105, 157–164. [Google Scholar]
- Buhiyan, M.A.H.; Parvez, L.; Islam, M.A.; Dampare, S.B.; Suzuki, S. Heavy metal pollution of coal mine affected agricultural soils in the northern part of Bangladesh. J. Hazard. Mater. 2010, 173, 384–392. [Google Scholar] [CrossRef]
- Sakan, S.M.; Djordjevic, D.S.; Manojlovic, D.D.; Polic, P.S. Assessment of heavy metal pollutants accumulation in the Tisza River sediments. J. Environ. Manag. 2009, 90, 3382–3390. [Google Scholar] [CrossRef] [PubMed]
- Romero, A.; Gonzalez, I.; Galan, E. Trace elements absorption by citrus in a heavily polluted mining site. J. Geochem. Explor. 2013, 113, 76–85. [Google Scholar] [CrossRef]
- Sutherland, R.A. Bed sediment associated trace metals in an urban stream, Oahu, Hawaii. Environ. Geol. 2000, 39, 611–627. [Google Scholar] [CrossRef]
- Sterckeman, T.; Douay, F.; Baize, D.; Fourrier, H.; Proix, N.; Schvartz, C. Trace elements in soil developed in sedimentary materials from Northern France. Geoderma 2006, 136, 912–929. [Google Scholar] [CrossRef]
- Smith, S.L.; MacDonald, D.D.; Keenleyside, K.A.; Carr, G.J.; Ingersoll, C.G.; Field, L.J. A preliminary evaluation of sediment quality assessment values for freshwater ecosystems. J. Great Lakes Res. 1996, 22, 624–638. [Google Scholar] [CrossRef]
- Reimann, C.; Birke, M.; Demetriades, A.; Filzmoser, P.; O’Connor, P. Chemistry of Europe’s Agricultural Soils—Part A: Methodology and Interpretation of the GEMAS Data Set; Schweizerbart Science Publishers: Stuttgart, Germany, 2014. [Google Scholar]
- Kabata-Pendias, A. Trace Elements in Soils and Plants, 4th ed.; CRC Press: Boca Raton, FL, USA, 2011. [Google Scholar]
- Förstner, U.; Wittmann, G.T.W. Metal Pollution in the Aquatic Environment, 2nd ed.; Springer: Berlin/Heidelberg, Germany, 1983. [Google Scholar]
- Zhang, Z.; Lu, Y.; Tu, Y.; Liu, B.; Yang, Z. Assessment of heavy metal contamination, distribution and source identification in the sediments from the Zijiang River, China. Sci. Total Environ. 2018, 645, 235–243. [Google Scholar] [CrossRef]
- Varol, M.; Şen, B. Assessment of surface water quality using multivariate statistical techniques: A case study of Behrimaz Stream, Turkey. Environ. Monit. Assess. 2009, 159, 543–553. [Google Scholar] [CrossRef] [PubMed]
- Coşkun, A.; Horosan, B.Y.; Öztürk, A. Heavy metal distribution in stream sediments and potential ecological risk assessment in Konya Northeast region. Environ. Earth Sci. 2021, 80, 181. [Google Scholar] [CrossRef]
- Ferati, F.; Kerolli-Mustafa, M.; Kraja-Ylli, A. Assessment of heavy metal contamination in water and sediments of Trepça and Sitnica rivers, Kosovo, using pollution indicators and multivariate cluster analysis. Environ. Monit. Assess. 2015, 187, 338. [Google Scholar] [CrossRef]
- Rudnick, R.L.; Gao, S. Composition of the Continental Crust. In The Crust; Rudnick, R.L., Holland, H.D., Turekian, K.K., Eds.; Treatise on Geochemistry; Elsevier-Pergamon: Oxford, UK, 2003; Volume 3, pp. 1–64. [Google Scholar]
- Liu, E.; Shen, J.; Yang, L.; Zhang, E.; Wang, J.; Wang, S. Assessment of heavy metal contamination in the sediments of Nansihu Lake Catchment, China. Environ. Monit. Assess. 2009, 161, 217–227. [Google Scholar] [CrossRef]
- Liu, W.H.; Zhao, J.Z.; Ouyang, Z.Y.; Soderlund, L.; Liu, G.H. Impacts of sewage irrigation on heavy metal distribution and contamination in Beijing, China. Environ. Int. 2005, 31, 805–812. [Google Scholar] [CrossRef] [PubMed]
- Cai, Q.Y.; Mo, C.H.; Li, Y.H.; Zeng, Q.Y.; Katsoyiannis, A. Assessment of heavy metals contamination in agricultural soils and potential health risk in a mining area of Hunan Province, China. Environ. Geochem. Health 2012, 34, 189–197. [Google Scholar]
- MacDonald, D.D.; Ingersoll, C.G.; Berger, T.A. Development and evaluation of consensus-based sediment quality guidelines for freshwater ecosystems. Arch. Environ. Contam. Toxicol. 2000, 39, 20–31. [Google Scholar] [CrossRef]

Disclaimer/Publisher’s Note: The statements, opinions and data contained in all publications are solely those of the individual author(s) and contributor(s) and not of MDPI and/or the editor(s). MDPI and/or the editor(s) disclaim responsibility for any injury to people or property resulting from any ideas, methods, instructions or products referred to in the content. |
© 2025 by the author. Licensee MDPI, Basel, Switzerland. This article is an open access article distributed under the terms and conditions of the Creative Commons Attribution (CC BY) license (https://creativecommons.org/licenses/by/4.0/).