Article

Prediction of Surface Deformation Induced by Ultra-Shallow-Buried Pilot Tunnel Construction

1
China Railway First Group Second Engineering Co., Ltd., Tangshan 063000, China
2
School of Civil Engineering, Beijing Jiaotong University, Beijing 100044, China
*
Author to whom correspondence should be addressed.
Appl. Sci. 2025, 15(13), 7546; https://doi.org/10.3390/app15137546 (registering DOI)
Submission received: 22 May 2025 / Revised: 27 June 2025 / Accepted: 1 July 2025 / Published: 4 July 2025

Abstract

The prediction of ground deformation during ultra-shallow-buried pilot tunnel construction is critical for urban rail transit projects in complex geological settings, yet existing cross-section models often lack accuracy. This study proposes an enhanced non-uniform convergence model based on stochastic medium theory, which decomposes surface settlement into uniform soil shrinkage and non-uniform initial support deformation. A computational formula for horseshoe-shaped sections is derived and validated through field data from Kunming Rail Transit Phase I, demonstrating a 59% improvement in maximum settlement prediction accuracy (reducing error from 7.5 mm to 3.1 mm) compared to traditional methods. Its application to Beijing Metro Line 13 reveals two distinct deformation patterns: significant ground heave occurs at 2.5 times the tunnel width from the centerline, while maximum settlement concentrates above the excavation center and diminishes radially. To mitigate heave, early strengthening of the secondary lining is recommended to control initial horizontal deformation. These findings enhance prediction reliability and provide actionable insights for deformation control in similar urban tunneling projects, particularly under ultra-shallow burial conditions.

1. Introduction

With the development of urban underground space toward ultra-shallow burial, surface deformation control during mining method tunnel construction faces severe challenges. Although the shallow mining method offers the advantage of non-disruptive traffic, when the burial depth is less than 1.5 times the tunnel diameter—especially during full-face excavation—the stratum stress arching effect is significantly weakened [1], posing safety hazards to adjacent structures. The tunnel-induced ground surface disturbance becomes particularly pronounced under ultra-shallow conditions [2], causing a sharp decline in the prediction accuracy of conventional empirical formulas. For example, Peck’s formula fails to consider the lining force [3], often predicting settlement where the actual surface experiences heave, thus urgently necessitating the establishment of a targeted theoretical prediction model.
The system of surface deformation prediction methods primarily comprises four categories: empirical formula methods (e.g., Peck’s formula), elastic–plastic analytical methods (Mindlin’s solution, cavity expansion theory, etc.), numerical simulation methods and stochastic medium theory. Although Peck’s formula demonstrates high accuracy in deep-buried, small-radius tunnels [4], its Gaussian curve assumption struggles to capture abrupt settlement changes in shallow-buried conditions. Direct analysis of the settlement–time relationship can also be classified as an empirical method. To accurately predict surface settlements induced by shallow-buried metro tunnel construction, Zhao et al. [5] proposed a bagging algorithm with an improved combined strategy for base learners. Shi et al. [6] established a surrounding rock prediction model using the SVM information granulation method for vault settlement in shallow tunnels.
Elastic–plastic analytical methods have limited adaptability in complex strata. For instance, cavity expansion theory typically ignores soil stress history, initial stress anisotropy and stress-induced fabric anisotropy [7], overestimating deformations in soft soils. The classic Mindlin solution, considering only additional normal stresses, is commonly used for settlement prediction in shield tunneling [8]. When applying complex variable functions, most analyses assume full bonding between the lining and surrounding rock [9], regarding the tunnel as embedded in a linear elastic medium [10], which excels in solving seismic stress responses [11] and time-dependent material effects [12]. Stress functions are more suitable for elastic mechanics problems [13]. Although numerical simulation methods can reproduce the construction process in 3D, they exhibit high parameter sensitivity and require substantial computational time, often used when measured data are scarce. Wang et al. [14] verified the applicability of stochastic medium theory in predicting deep soil settlements caused by shield tunneling in sandy pebble strata through numerical simulation and model tests.
Stochastic medium theory has become a research hotspot in recent years due to its clear physical mechanism. First proposed by Litwiniszyn J [15] in the 1950s, this theory treats geotechnical materials as discontinuous media with stochastic movements to construct a surface settlement prediction system. After Liu Baochen [16] established a circular shrinkage model, a complete system formed, which has been widely applied to calculate surface settlements from subway excavation. Subsequent scholars have made a series of improvements to address its limitations. Aiming at the difficulty of determining key parameters, Yang, J.S. [17] proposed using Powell’s optimization program method in back-analysis to determine the main influence angle and uniform radial shrinkage value in Liu Baochen’s formula. Verruijt introduced an elliptical deformation mechanism, suggesting that tunnels undergo elliptical deformation superimposed on uniform radial shrinkage, but did not specify elliptical parameters [18]. Loganathan [19] introduced a fixed-base assumption, combining the gap parameter concept from small-hole expansion theory to argue that the circular section should not shrink symmetrically from the center but maintain fixed contact with the soil at the bottom, deriving a modified vertical displacement formula.
C. Gonzalez first regarded the final shrinkage shape as a combination of multiple deformations, proposing a step-by-step uniform convergence model for tunnel excavation and suggesting that shield tunnels undergo overall subsidence after shrinkage [20]. Following this, Han Xuan et al. [21] derived boundary conditions for complex sections (e.g., horseshoe-shaped tunnels) based on non-uniform convergence modes. Additionally, collated measured data show that Peck’s formula becomes less applicable with decreasing burial depth, and can be viewed as a special case of the stochastic medium formula. Wei Gang [22] established a non-uniform convergence model for mined tunneling, comparing the differences between mined and shield methods from the soil deformation mechanism, and proposed two suitable non-uniform convergence modes, which have been widely applied. Shao Zhushan [23] proposed a double-clearance non-uniform convergence correction model for circular and horseshoe sections, using an annealing genetic algorithm to find the optimal parameter combination.
Shang et al. [24] considered the influence of variable tunnel cross-sections and existing structures based on traditional stochastic medium theory, treating ground loss at tunnel connections as a linear transition and introducing the concept of a variable cross-section linear transition section. Wang et al. [25] established an analytical solution for surface settlement prediction based on stochastic medium theory, studying 103 groups of monitoring data on surface settlements caused by shield construction in sandy pebble strata using back-analysis, and proposed an empirical prediction formula by analyzing the statistical characteristics of maximum settlement, settlement trough width and ground loss. Zhang et al. [26] used stochastic medium theory to study the surface heave mechanism of ultra-shallow pipe-roof freezing method tunnels, proposing that the surface turns to heave when the frozen wall development depth exceeds the overburden thickness.
However, current studies on stochastic medium theory rarely distinguish between burial depths. Convergence modes are mostly superimposed based on two categories—shield construction and shallow-buried excavation—with deep-buried theories being more widely applied. The horseshoe cross-section is often simplified as a circle, and no theoretical study has addressed ultra-shallow-buried conditions. Therefore, this study develops a ground deformation prediction model for ultra-shallow-buried pilot tunnels based on the non-uniform superimposed convergence mode of stochastic medium theory, verifying its scientific validity and practicality through engineering cases to improve the theory’s applicability in ultra-shallow environments.

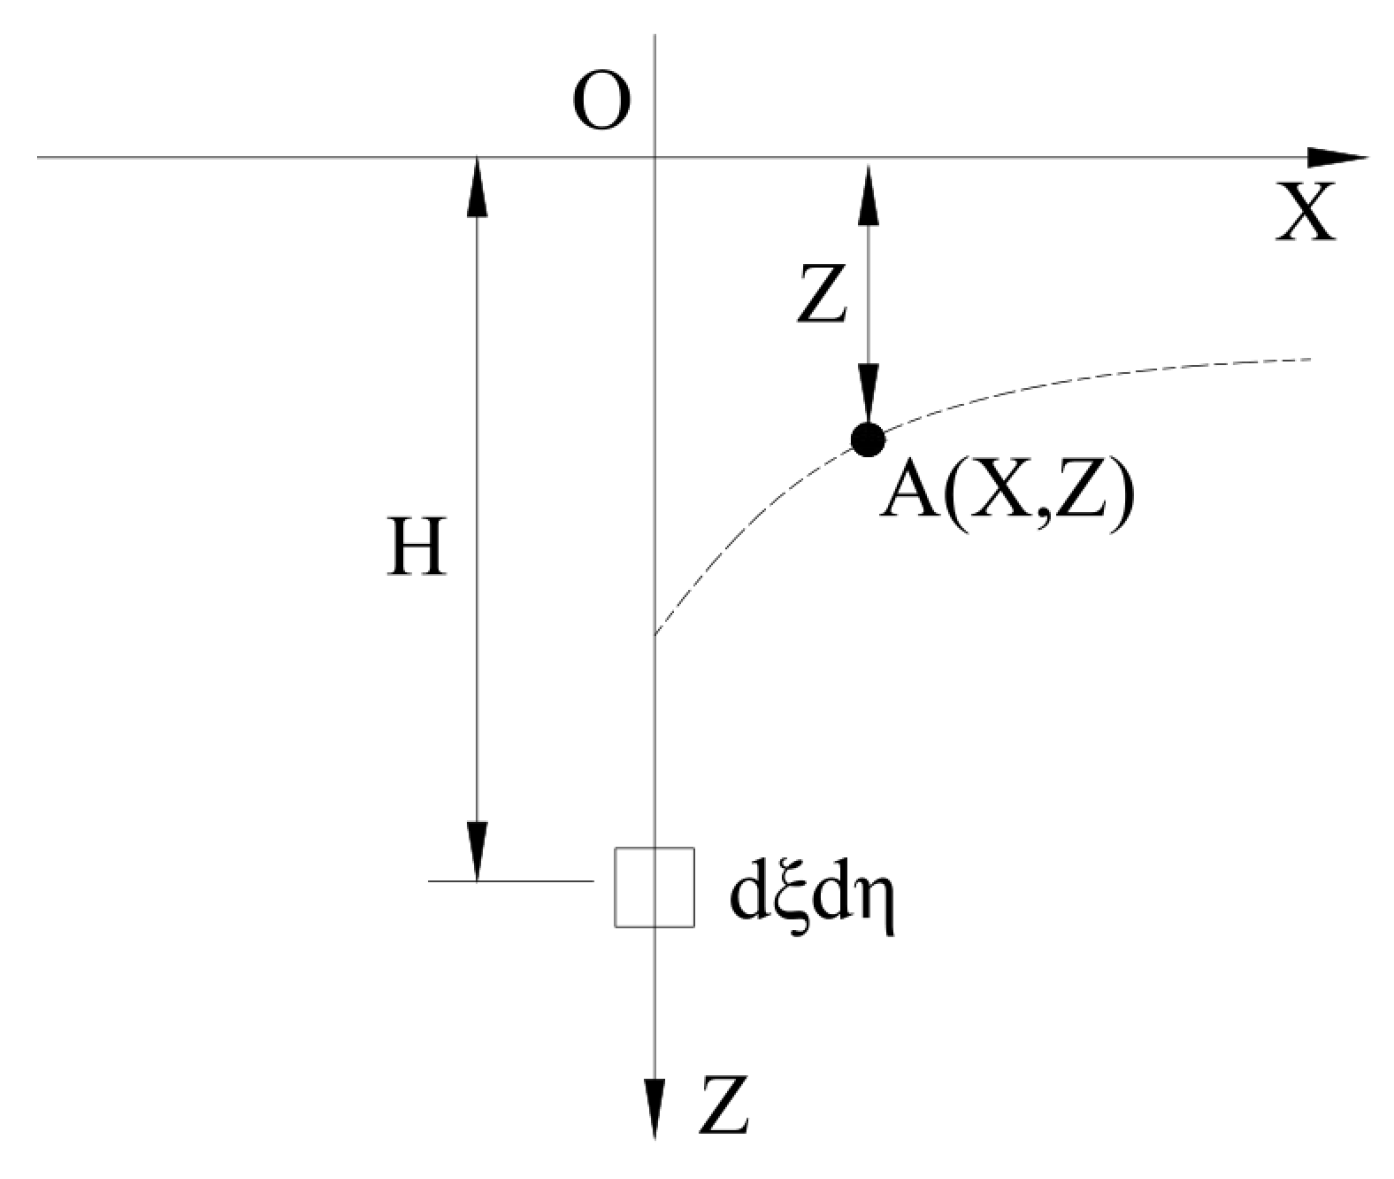
2. Calculation Theory of Lateral Ground Settlement Caused by Ultra-Shallow-Buried Pilot Tunnel Construction

2.1. Calculation of Surface Deformation Induced by Unit Excavation

First, a vertical section of the geotechnical soil mass is studied. Take the ground surface as the X-axis and the Z-axis with downward as the positive direction, establishing a Cartesian coordinate system as shown in Figure 1. Consider a micro soil element dξdη at a depth of H. The excavation of this micro-element will induce ground settlement, and tunnel-excavation-induced ground settlement can be regarded as the superposition of settlements induced by each micro-element. Statistically, the settlement induced by excavating a micro-element at any point A(X,Z) above it is a random event with a certain probability [27]. The probability of this event is f(X2)dX, where f denotes the probability density function.
Based on the above coordinate system, assuming the positive Y-axis direction is perpendicular to the page inward, the probability P(dS) that the excavation of a micro soil element dξdζdη induces settlement at point A(X,Y,Z) is expressed as
P d S = f X 2 f Y 2 d X d Y
The magnitude of this probability is independent of the coordinate system selected, thus establishing an equivalence relation. Considering the boundary conditions, where the probability approaches 0 at both positive and negative infinity, solving the equation yields
f X 2 = q ( Z ) exp π r 2 ( Z ) X 2
f Y 2 = q ( Z ) exp π r 2 ( Z ) Y 2
where q(Z) and r(Z) are functions of the coordinate Z. Substituting Equations (2) and (3) into Equation (1), we obtain
P ( d S ) = q 2 ( Z ) exp π r 2 ( Z ) ( X 2 + Y 2 ) d X d Y
Therefore, in three-dimensional space, the probability density function of the settlement at point A induced by the excavation of a micro soil element is
f X , Y , Z = q 2 ( Z ) exp π r 2 ( Z ) ( X 2 + Y 2 )
It is generally accepted that the volume of stratum ground loss due to tunnel excavation equals the volume of the final surface settlement basin. Similarly, the volume of excavated micro soil elements equals the volume of the subsidence basin at point A. The subsidence basin at point A is composed of smaller “unit subsidence” (hereafter referred to as “unit subsidence”), defined as the product of the micro soil element volume and the probability density function after the basin stabilizes. After excavating a micro soil element at time t, the unit subsidence We at point A is
f X , Y , Z = q 2 ( Z ) exp π r 2 ( Z ) ( X 2 + Y 2 )
Under the soil incompressibility assumption, we first derive q2(Z) and substitute it into Equation (6) for simplification. The resulting expression is integrated over the infinite Y-axis. By imposing convergence as t→∞ (i.e., subsidence stabilization) and treating r2(Z) as a depth-dependent constant, the final unit settlement expression is obtained:
W e ( X ) = 1 r ( Z ) exp π r 2 ( Z ) X 2 d ξ d η
Equation (7) is the basic formula for investigating subsidence at any point within the formation under the influence of arbitrary excavation under plane strain conditions.
Now consider a plane strain problem: an arbitrary cross-sectional shape tunnel is located underground, with the center of its cross-section at a burial depth H from the surface, as shown in Figure 2. The surface uses an XOY coordinate system, and the excavated micro soil elements use a ξOη coordinate system. If the tunnel completely collapses after excavation (i.e., the cross-section with area Ω collapses into the surrounding soil), the volume of stratum loss and the volume of the final surface settlement basin reach their maximum values simultaneously. Applying the superposition principle, the volume of the final surface settlement basin can be obtained by integrating the unit subsidence over the excavation range. Thus, the final surface settlement value W(X) at a point (X,0) on the ground surface is
W ( X ) = Ω tan β η exp π tan 2 β η 2 ( X ξ ) 2 d ξ d η
where tanβ reflects the stratigraphic conditions near the tunnel excavation and is determined based on field conditions.

2.2. Calculation of Surface Deformation Considering Non-Uniform Convergence

In reality, the cross-section with area Ω does not collapse completely after excavation but shrinks to area ω. According to the superposition principle, the surface settlement value after adjusting the integration range is
W ( X ) = Ω ω tan β η exp π tan 2 β η 2 ( X ξ ) 2 d ξ d η
The process of tunnel cross-section shrinkage from Ω to ω is the focus of current research on stochastic medium theory. Initially, Liu Baochen [28] simplified the cross-section shrinkage process to uniform shrinkage when proposing stochastic medium theory, as shown in Figure 3a. After analyzing the tunnel deformation mechanism with measured data, Verruijt [29] proposed that elliptical deformation is superimposed on uniform radial shrinkage, as shown in Figure 3b. C. Gonzalez [30] first suggested that shield tunnels undergo additional overall subsidence during shrinkage, as shown in Figure 3c.
The cross-sections of ultra-shallow-buried pilot tunnels in excavation sections are mostly horseshoe-shaped. Lateral ground settlement induced by construction is calculated based on the plane strain problem, and the solution is subsequently obtained by integrating stochastic medium theory. The method for determining the integration boundary follows the concept of shallow-buried tunnels [22], involving two deformations: The first deformation is the uniform shrinkage of the soil body. The arch part of the initial horseshoe section, which is originally circular, remains circular during shrinkage. The second deformation is the non-uniform deformation of the initial section. The arch part transforms from a circle to an ellipse, while the rectangular portion below remains a rectangle for both deformations. The shrinkage ratios of the short and long sides differ, with specific assumptions as follows:
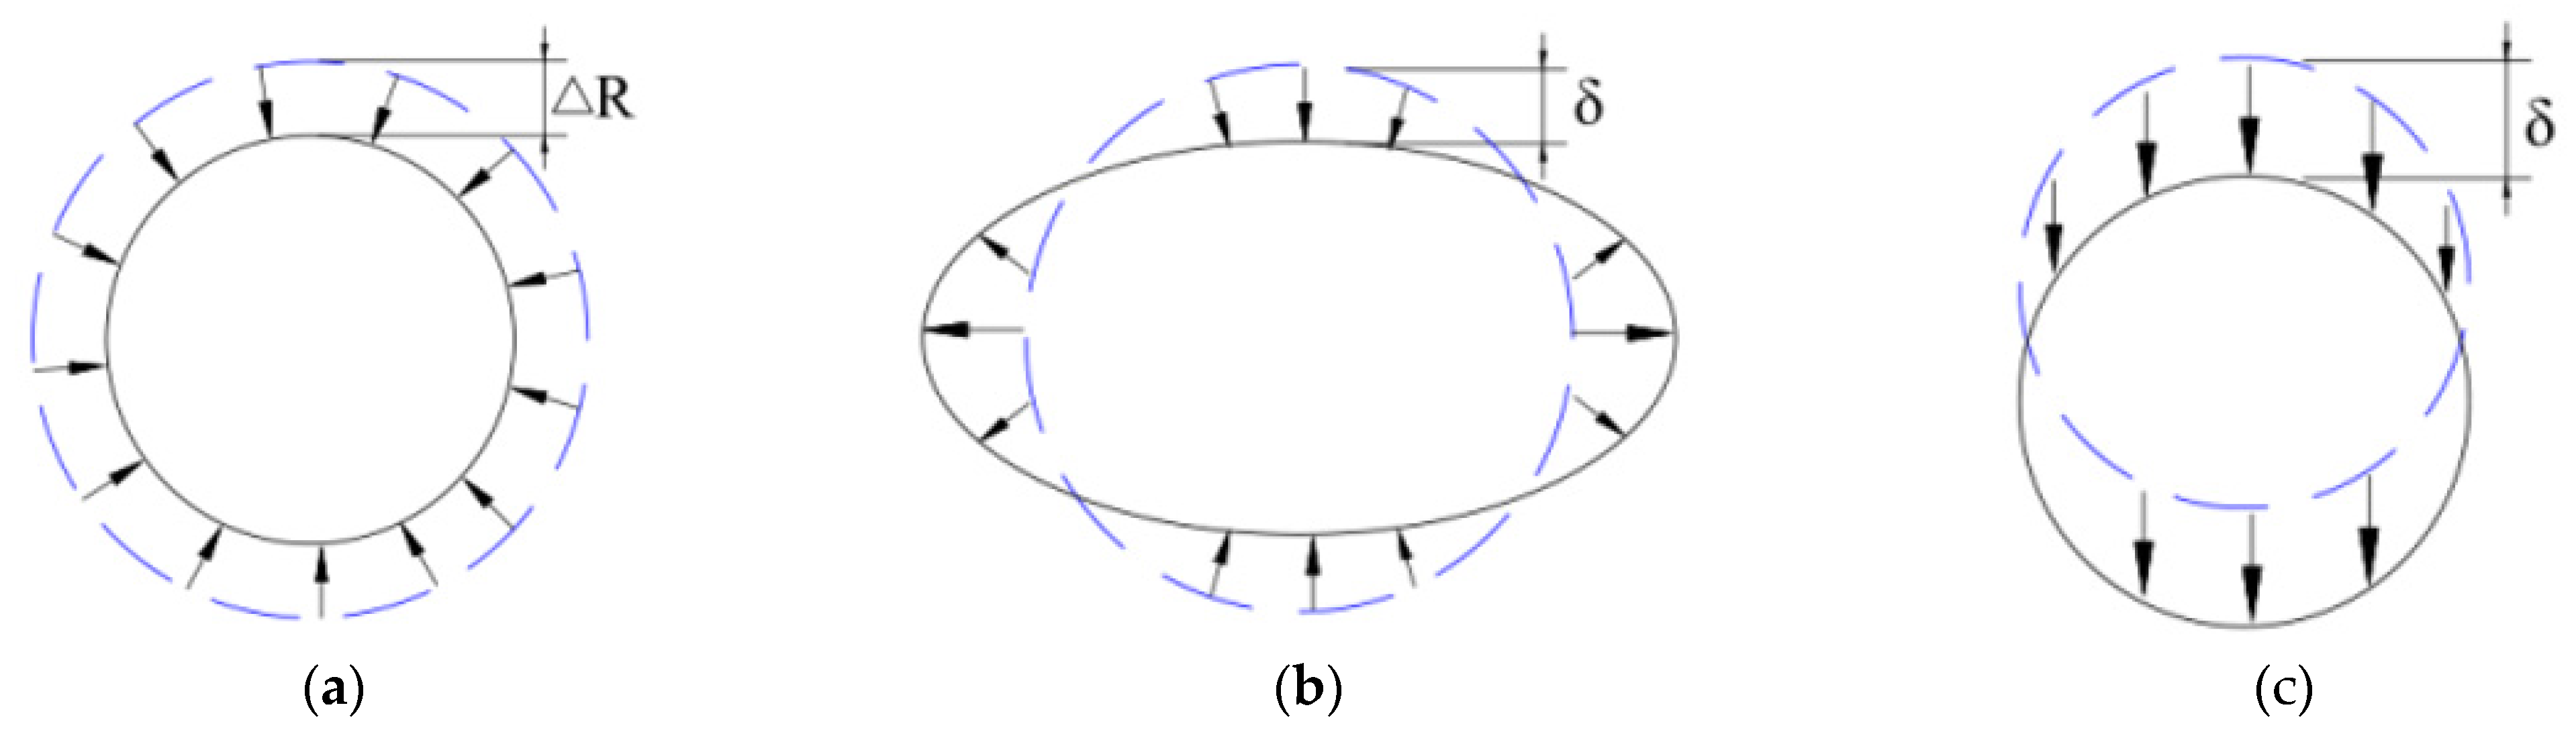
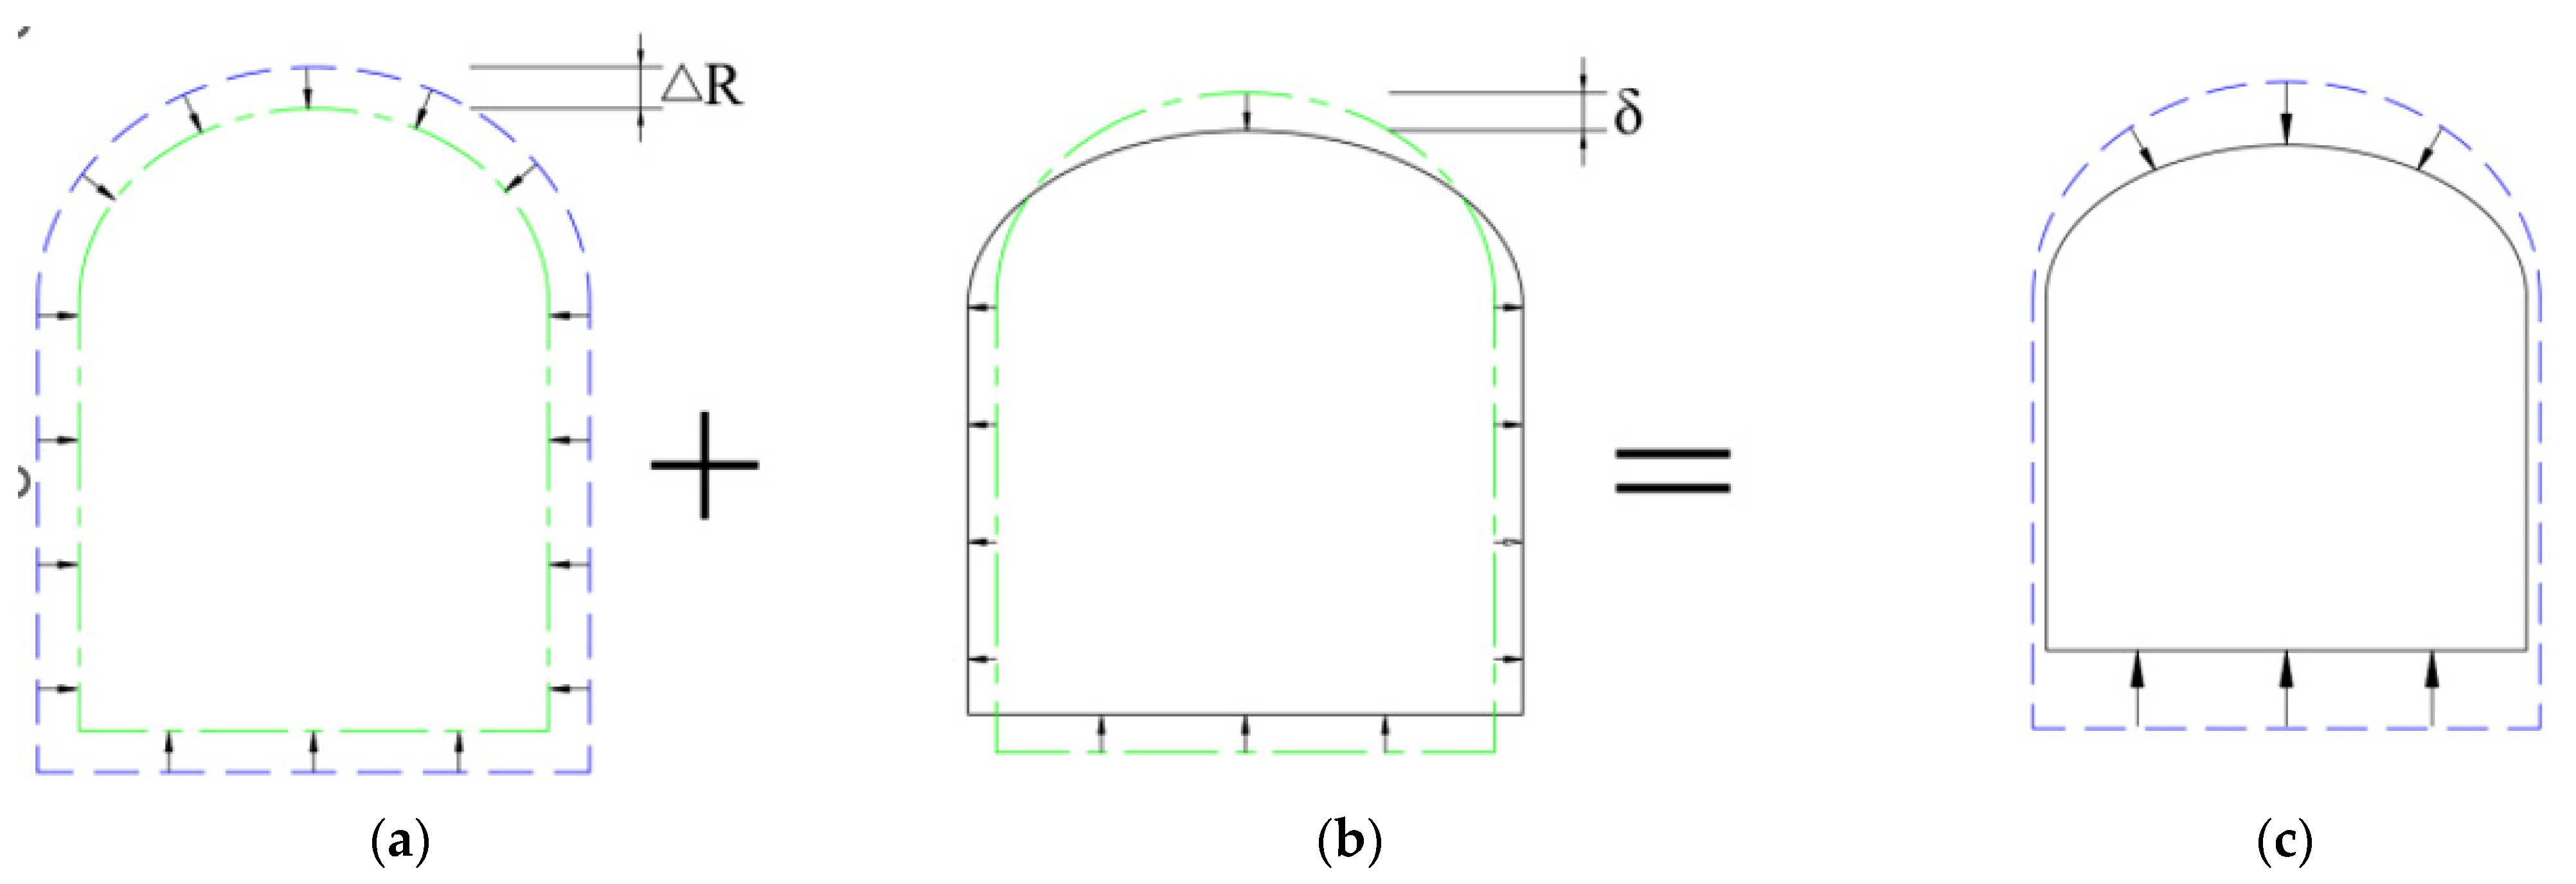
  • After excavating the pilot tunnel and until the initial support gains strength, the excavation face is in a critical state and the surrounding stratum stress redistributes. At this time, the excavation face shrinks uniformly, as shown in Figure 4a.
2.
Before the strength of the second lining is formed, the initial support deforms under the action of surrounding soil–water pressure. The second deformation occurs after uniform shrinkage, exhibiting a deformation trend of lateral expansion and vertical shrinkage, as shown in Figure 4b. Both deformation parameters (ΔR and δ) incorporate the influence of construction grouting on lining deformation.
3.
The sectional area remains constant before and after the second deformation.
4.
The construction-induced vertical ground displacement results from the superposition of the above two deformation components, as shown in Figure 4c.
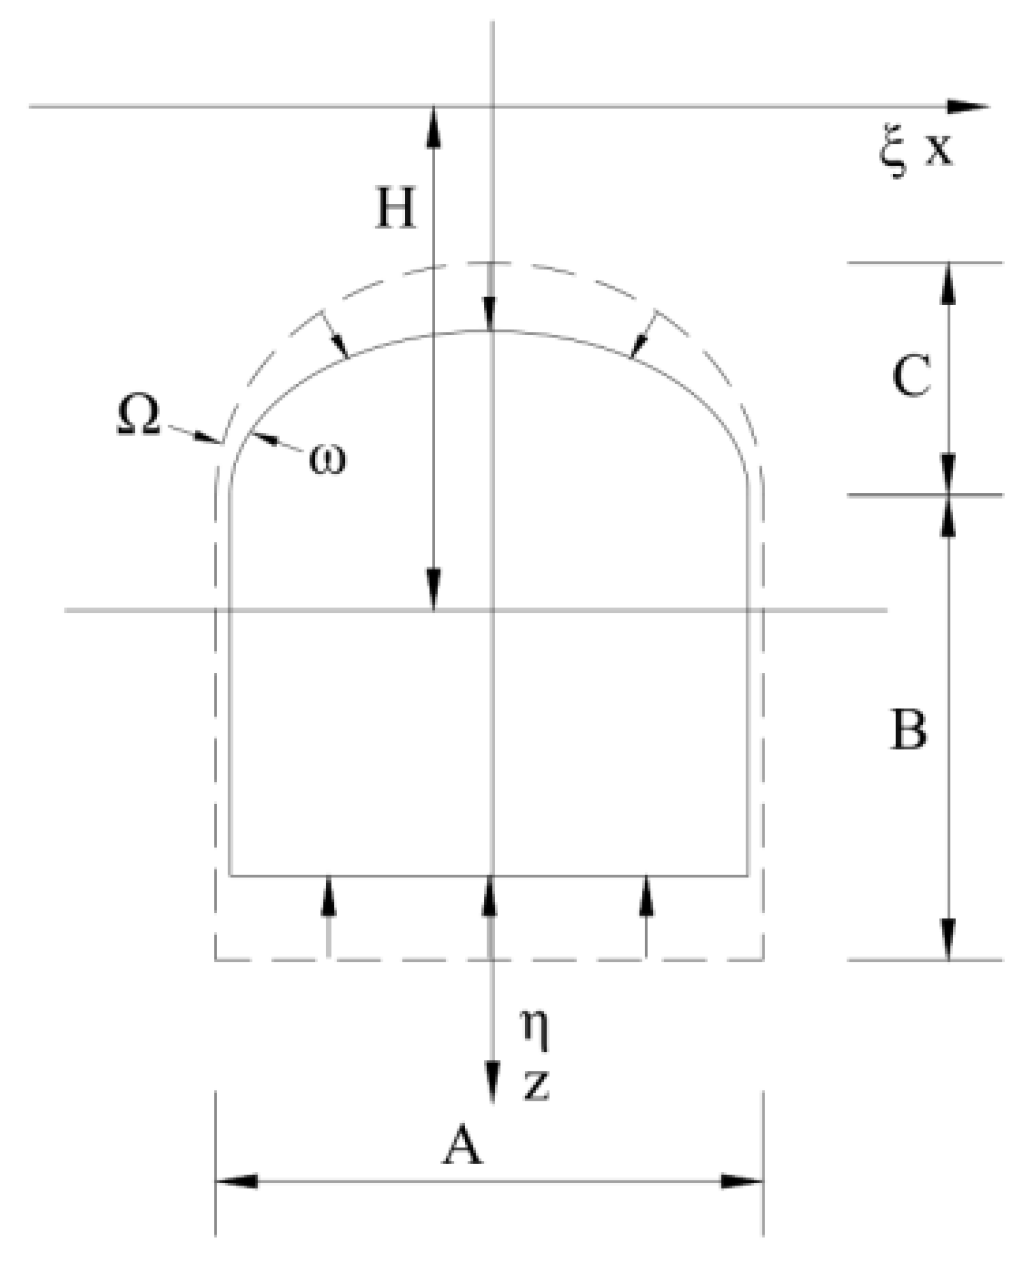
The surface settlement due to the uniform shrinkage of the section is given by Equation (9):
W 1 ( x ) = Ω ω tan β η exp π tan 2 β η 2 ( x ξ ) 2 d ξ d η
where Ω is the integration region before shrinkage, ω is the integration region after shrinkage, x is the horizontal distance from the axis of the pilot tunnel and β is the main influence angle of the surrounding rock above the pilot tunnel. Setting
w ( x , ξ , η ) = tan β η exp π tan 2 β η 2 ( x ξ ) 2
Equation (10) can be rewritten as
W 1 ( x ) = a b c d w ( x , ξ , η ) d ξ d η e f g h w ( x , ξ , η ) d ξ d η
The derived dual integration bounds a-h are listed in Table 1, where H is the burial depth of the pilot tunnel, the tunnel center is calculated by (B + C)/2, B is the height of the rectangular portion, A is the width of the rectangular portion and C is the height of the arch portion (see Figure 2). ΔR denotes the uniform shrinkage displacement of the section (see Figure 4).
The surface displacement caused by the second deformation of the cross-section is calculated by Equation (13):
W 2 ( x ) = e f g h w ( x , ξ , η ) d ξ d η e f g h w ( x , ξ , η ) d ξ d η
The derived upper and lower bounds of the double integration e-h′ are listed in Table 2, where B’ is the height of the rectangular portion after uniform shrinkage, A’ is the width of the rectangular portion after uniform shrinkage and C’ is the height of the arch portion after uniform shrinkage.
The height C′ of the arched portion after uniform shrinkage is calculated by Equation (14):
C = C Δ R δ
where C is the height of the initial arched portion, ΔR is the uniform shrinkage displacement of the section and δ is the second shrinkage displacement of the section. A′ and B′ are determined by ensuring the cross-sectional area remains equal before and after the second deformation.
The final surface settlement induced by the excavation of the pilot tunnel is given by the formula
W ( x ) = W 1 ( x ) + W 2 ( x )

2.3. Key Parameters

The back-analysis method is used to infer the following key parameters of the prediction model from existing settlement data: the tangent value of the main influence angle of the surrounding rock tanβ, the uniform shrinkage displacement of the section ΔR and the second shrinkage displacement δ. The obtained key parameters can be used for settlement prediction under the same geological conditions. Before back-analysis, a target function between the known settlement data and the key parameters to be determined is first established, transforming the parameter determination problem into a problem of solving the minimum value of the target function. The target function for the parameters to be determined can be defined as
F ( p ) = i = 1 m W i 0 W i ( p ) 2
W0i is the measured value of the ith surface settlement; Wi(p) is the theoretically calculated value of the ith surface settlement; m is the total number of measured data; and p is a parameter to be determined, where p = {tanβ,ΔR,δ}.
The model in this paper is practical and empirical. The error generated by using the minimum approximation instead of the exact minimum value is acceptable in practical engineering. To obtain the optimal parameter combination, Powell’s optimization algorithm in the principle of optimization is used to find the minimum value of the objective function F(p). Assuming the initial values of the undetermined parameters are zero, the value of the objective function under the initial conditions is calculated, followed by iterative operations based on the specified output accuracy. First, the extrapolation method is used to determine the search interval for a single golden section, then the step size of the current search is determined. A new coordinate is obtained by moving in the initial direction, and the function variation value corresponding to the current moving direction is recorded. Before the end of the current search, the direction with the maximum variation is identified. At the end of the search, a reflection point is constructed to determine whether it meets the Powell optimization condition. If so, an accelerated search is performed and the direction with the maximum variation is replaced; otherwise, this step is skipped, and only the starting point for the next search is updated. Finally, it is determined whether the target accuracy is met. If so, the data are output to obtain the three key parameters. A corresponding calculation program was developed using Matlab to facilitate the calculation of ground settlement caused by ultra-shallow-buried subsurface pilot tunnel construction.
The posterior variance test in gray prediction is used to evaluate the back-analysis results. The residual between the theoretical calculation and the measured value at each measuring point is defined as
ε i = W i W i 0
The average residual of each measuring point is calculated as
ε ¯ = 1 m i = 1 m ε i
The average value of the calculated results at each measuring point is calculated as
W ¯ = 1 m i = 1 m W i
The mean square deviation of the theoretical calculation at each measuring point is calculated as
S 1 = 1 m i = 1 m ( W i W ¯ ) 2
The mean square deviation of the residual of the theoretical calculation at each measuring point is calculated as
S 2 = 1 m i = 1 m ( ε i ε ¯ ) 2
The posterior variance ratio is calculated as
C p = S 2 S 1
The evaluation is conducted according to Table 3. Only when the back-analysis results meet the standard of “qualified” or above is the parameter combination obtained by back-analysis considered effective.

3. Case Validation of Deformation Predictions in Shallow-Buried Tunnels

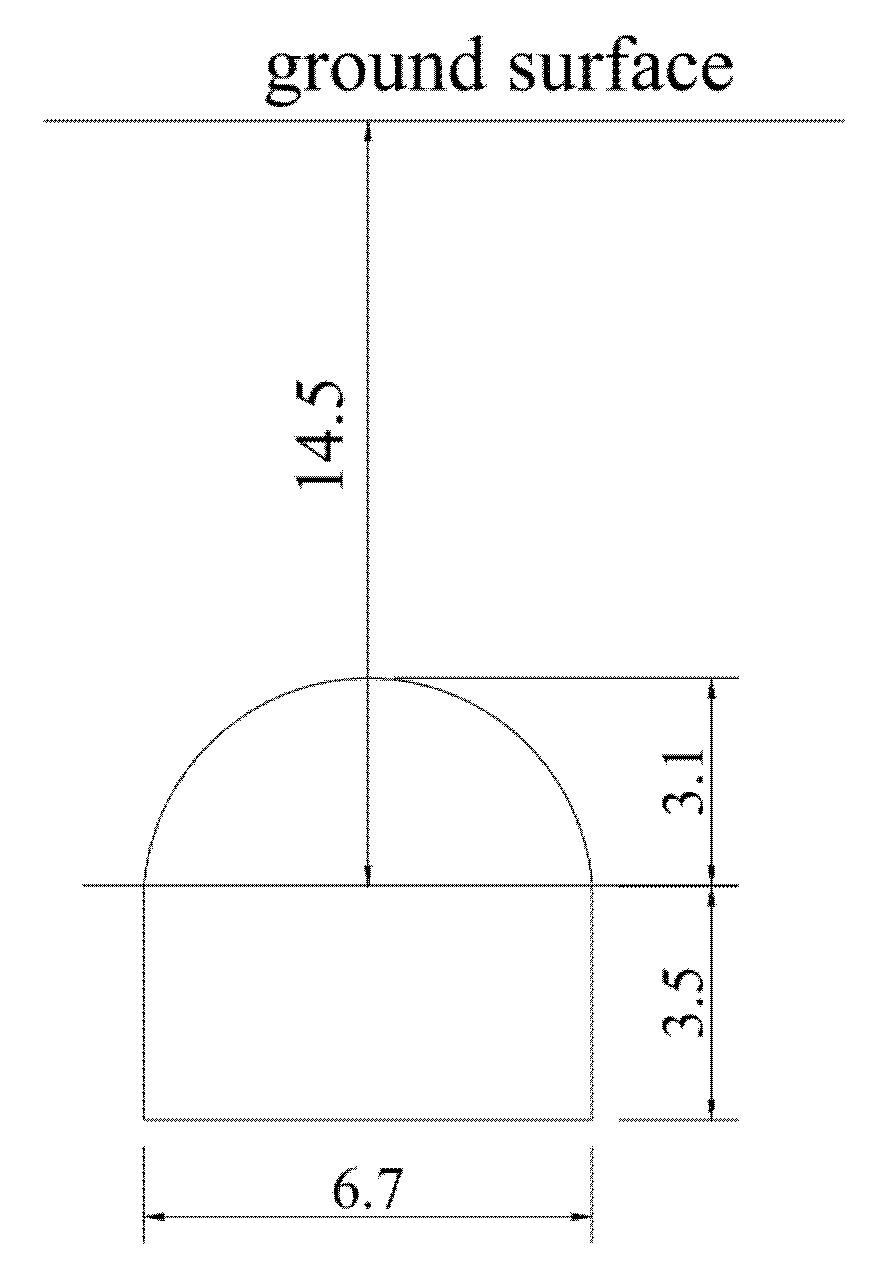
3.1. Kunming Rail Transit Phase I Interval Tunnel

The interval tunnel from East Passenger Station to Dabanqiao Station of the Kunming Rail Transit Line adopted the shallow-buried subsurface excavation method [31]. The overall total mechanical parameters of the main traversed strata are shown in Table 4, with tunnel design parameters visualized in Figure 5.
The calculation parameter values are as follows: H = 14.5 m, A = 6.7 m, B = 3.5 m, C = 3.1 m, ΔR = 30.26 mm, tanβ = 0.7 and δ = 228.96 mm. Under these parameters, the posterior variance ratio of the proposed model is 0.02, indicating an “excellent” accuracy rating for the back-analysis. The reference literature converts the horseshoe-shaped section into an equivalent circle for calculations and assumes the circular section shrinkage occurs in two stages: a uniform inward shrinkage centered at the circle’s origin followed by elliptical deformation. The overall deformation pattern is similar to the present model. A comparison of the calculation results between the two models is shown in Figure 6 (with the tunnel centerline at horizontal distance x = 0 m).
As shown in Figure 6, at the tunnel axis (horizontal distance = 0 m), the measured settlement is −38.3 mm and the calculated settlement by this model is −36.9 mm, with a relative error of 3.6% compared to the measurement. The calculated value from the reference literature is −30.8 mm, with a relative error of 19.6%—approximately 5 times larger than that of this model. At a horizontal distance of 7.5 m, the settlement curve exhibits an inflection point similar to that proposed by Peck, with a measured settlement of −16.9 mm, this model’s calculation of −20.9 mm and a reference calculation of −19.2 mm. The overall settlement curve shows a bell shape, with larger settlement in the middle and smaller settlement on both sides—a trend observed in both measurements and the two calculation models.
The error value is defined as the theoretical calculated value minus the measured value. As shown in Figure 7, the maximum deviation between the theoretical and measured values for this model is −3.06 mm, while the maximum error of the equivalent section method is 7.5 mm—twice as large as this model’s error. The reference model exhibits smaller errors at the edges and the largest error at the tunnel center, whereas this model has smaller errors at both the edges and the tunnel center, with relatively larger errors at a horizontal distance of one tunnel diameter.

3.2. Xi’an Metro Line 8 Mining Method Tunnel

Xi’an’s first circular metro line, Metro Line 8, features a horseshoe-shaped cross-section constructed by the mining method [23]. The overall mechanical parameters of the main traversed strata are shown in Table 5, with tunnel design parameters visualized in Figure 8.
The parameter values used in the calculation of this model are as follows: H = 13.8, A = 6.4 m, B = 3.6 m, C = 2.0 m, ΔR = 44.5 mm, tanβ = 0.35 and δ = 200 mm. Under these parameters, the posterior variance ratio of the proposed model is 0.05, indicating an “excellent” accuracy rating for the back-analysis. The reference literature uses a modified double-gap non-uniform convergence model for horseshoe-shaped tunnels. In contrast, this model employs a single-gap, two-stage non-uniform convergence method while maintaining the horseshoe-shaped cross-section. A comparison of the calculation results between the two models is shown in Figure 9 (with the tunnel centerline at horizontal distance x = 0 m).
As shown in Figure 9, the measured settlement at the tunnel axis is −26.4 mm, with the calculated value by this model being −24.5 mm—slightly smaller than the measurement, yielding a relative error of 6.8%. The reference model’s calculated settlement is −28.4 mm—slightly larger than the measurement—with a relative error of 7.7%. At a horizontal distance of 10 m, the measured settlement is −18.7 mm, this model’s calculation is −19.2 mm (relative error 0.8%) and the reference calculation is −20.3 mm (relative error 8.3%). The overall settlement curve shows larger values at the center and smaller values on both sides, with the settlement change rate decreasing as the horizontal distance from the axis increases—a trend observed in both measurements and the two calculation models.
Figure 10 shows that the maximum deviation between the theoretical and measured values for this model is 1.9 mm, while the reference model has a maximum error of 3.7 mm—twice as large as this model’s error. The reference model exhibits the largest error at a distance of twice the tunnel diameter from the axis, with smaller errors at the edges and axis, contrary to the error characteristics of this model, which has the smallest error at twice the tunnel diameter and larger errors at the edges and axis.

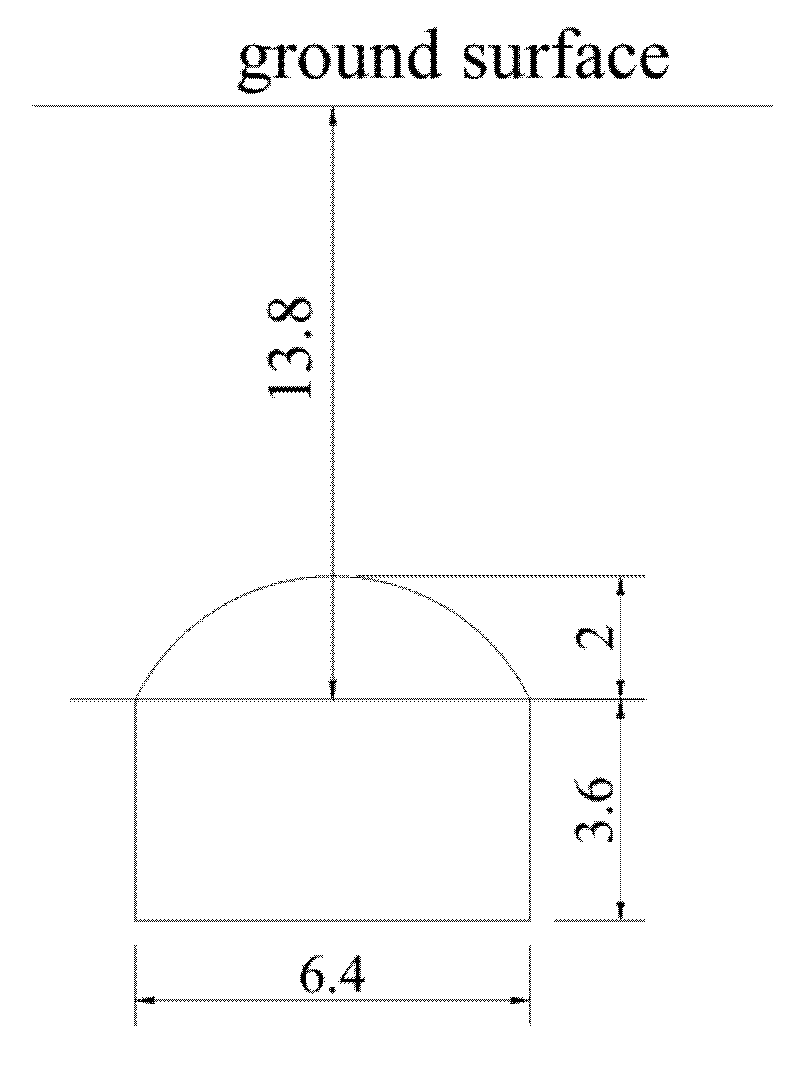
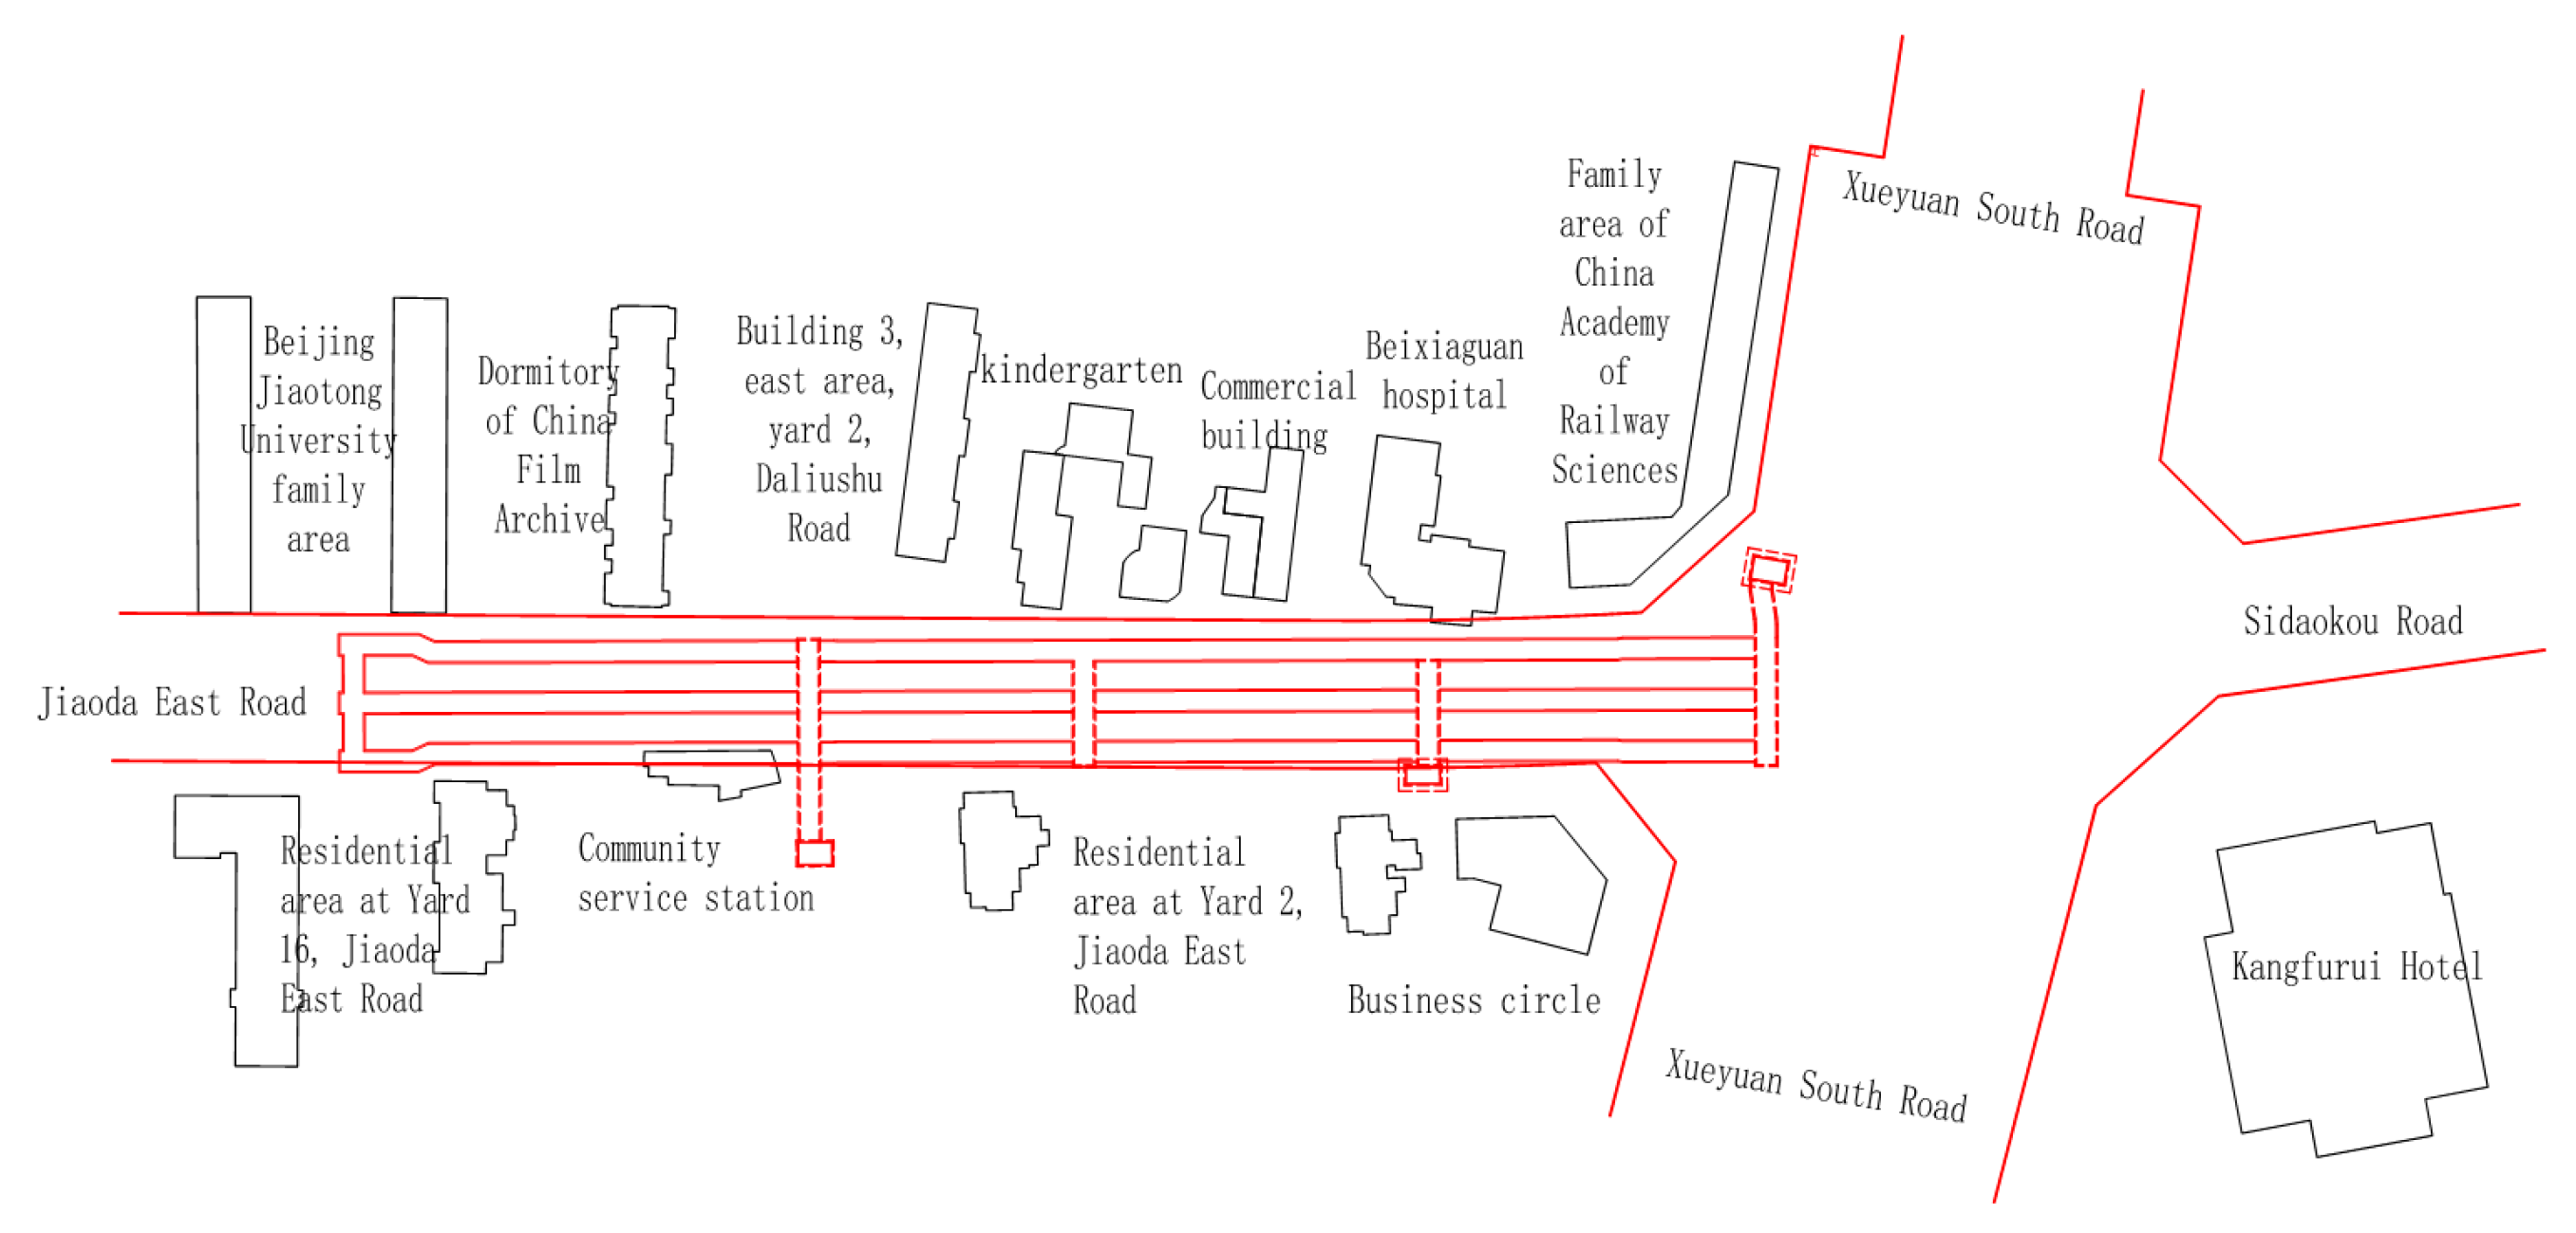
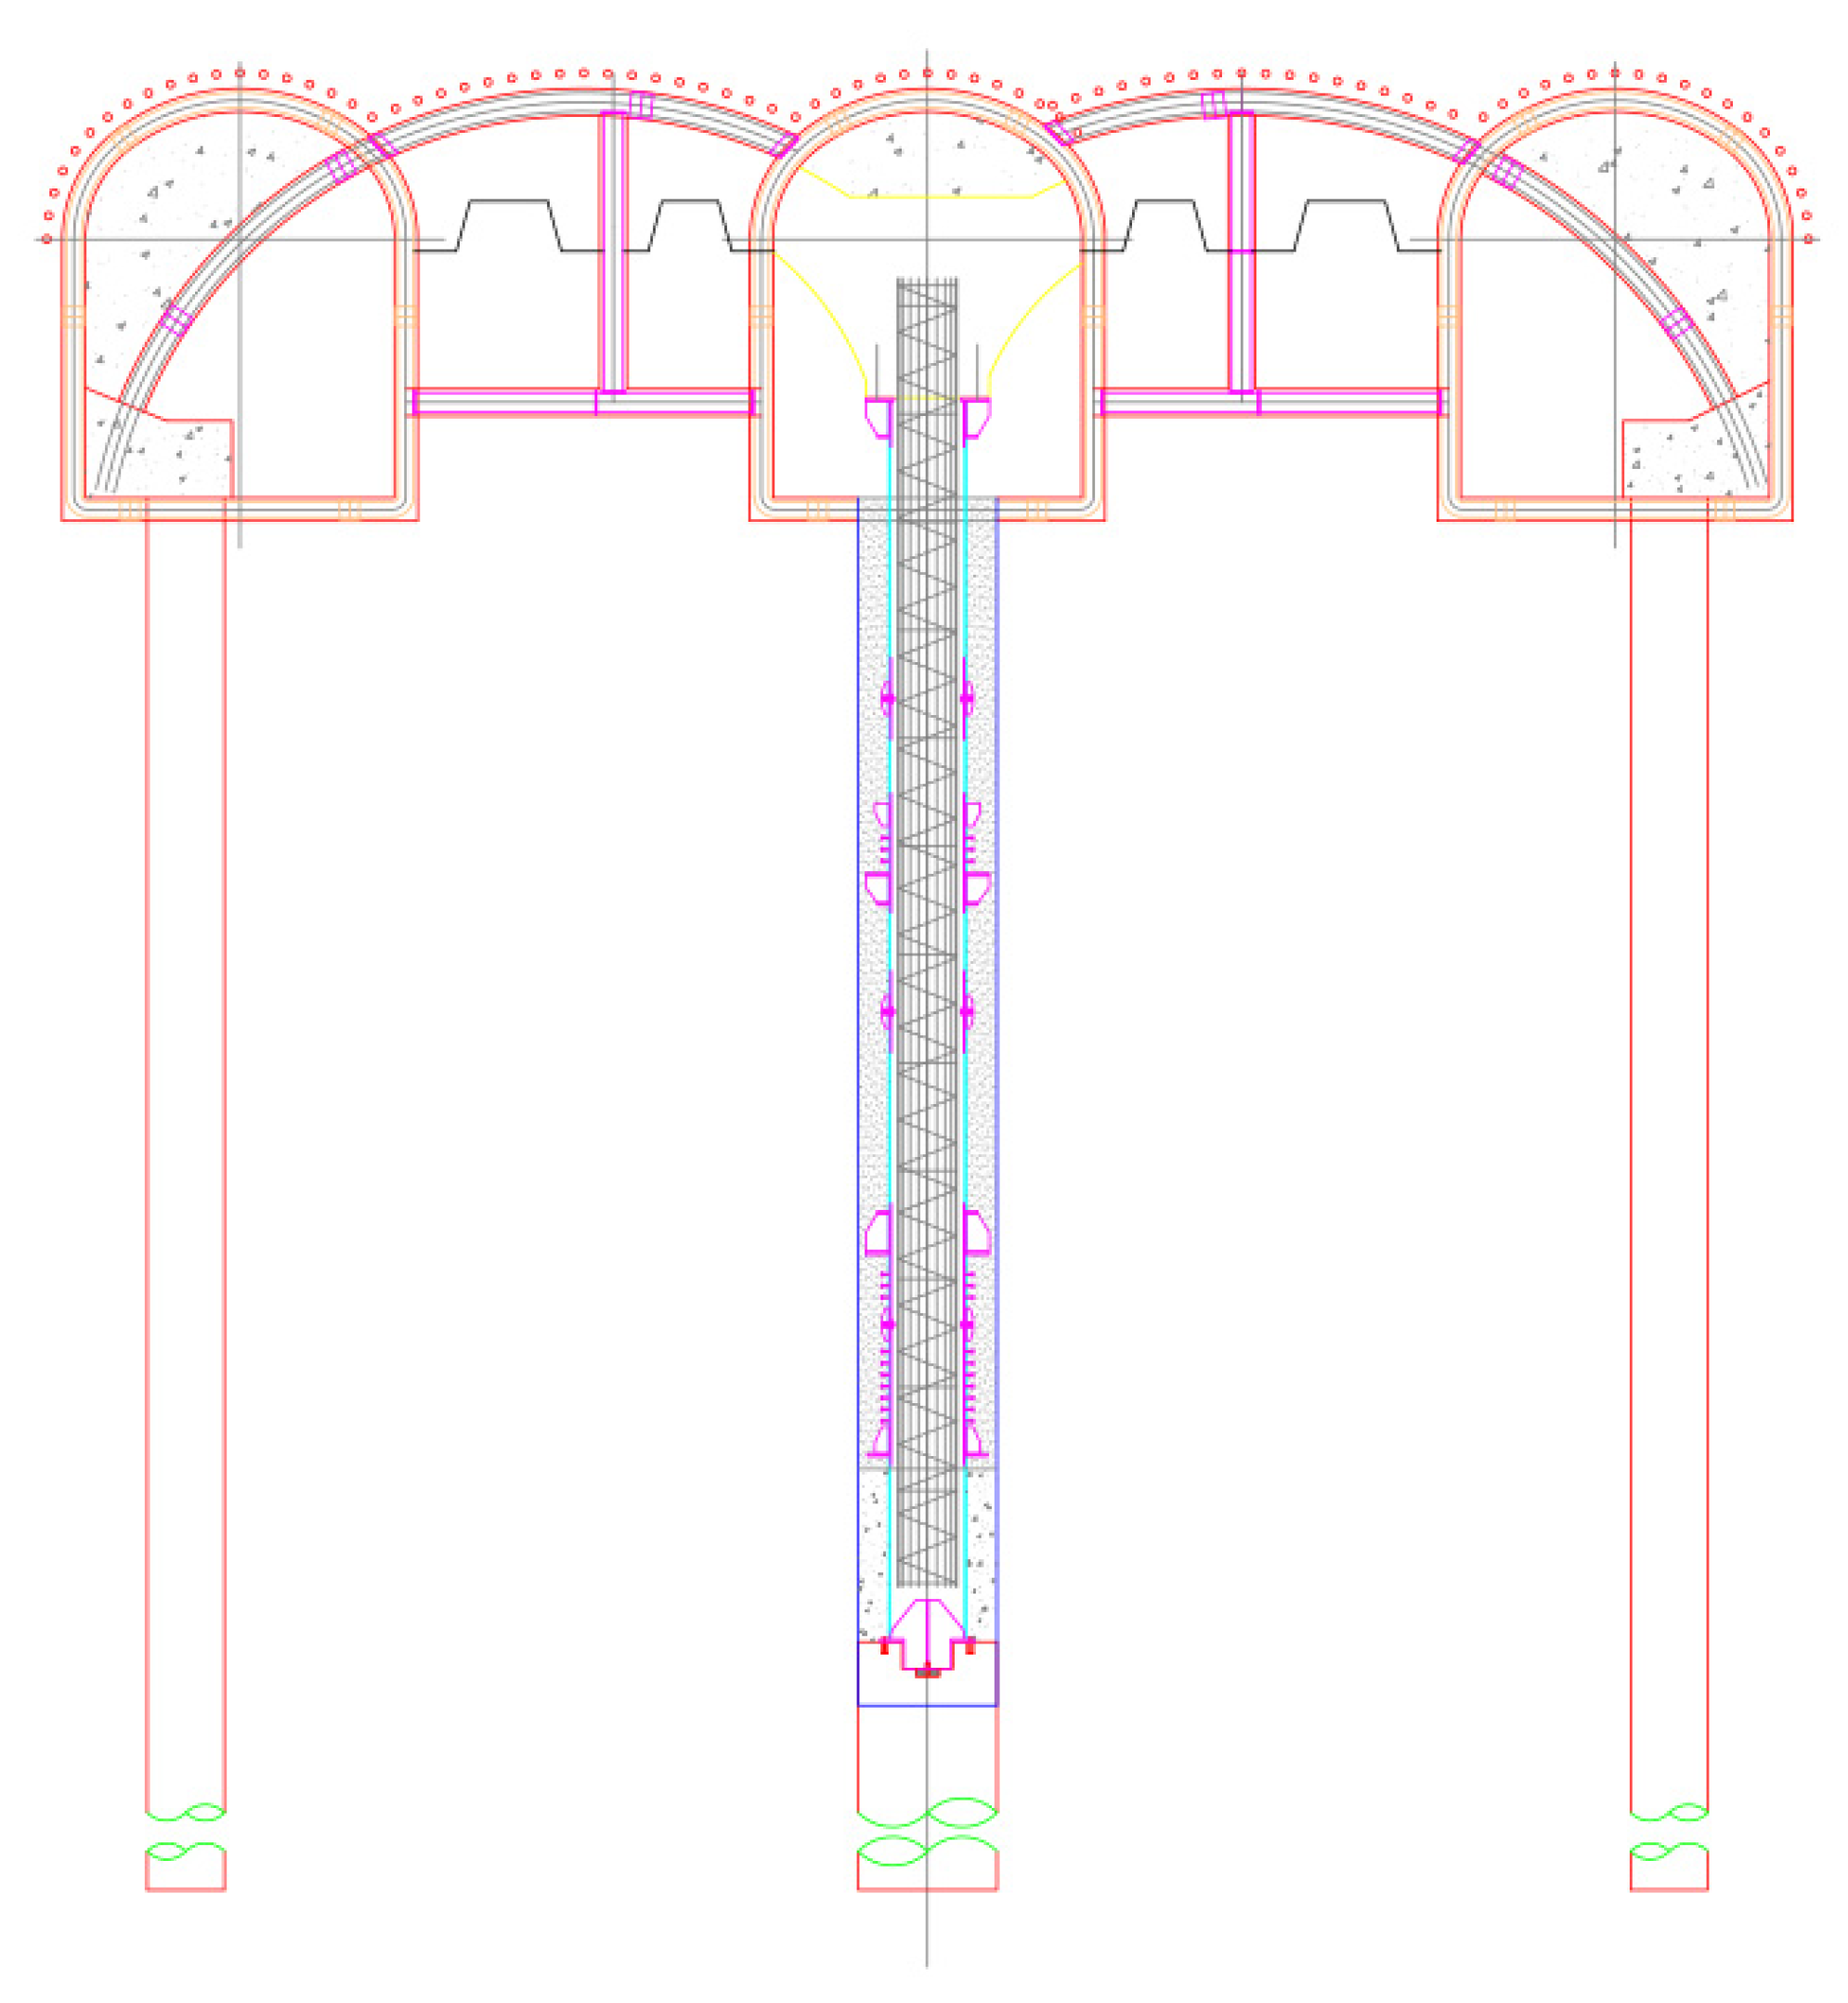
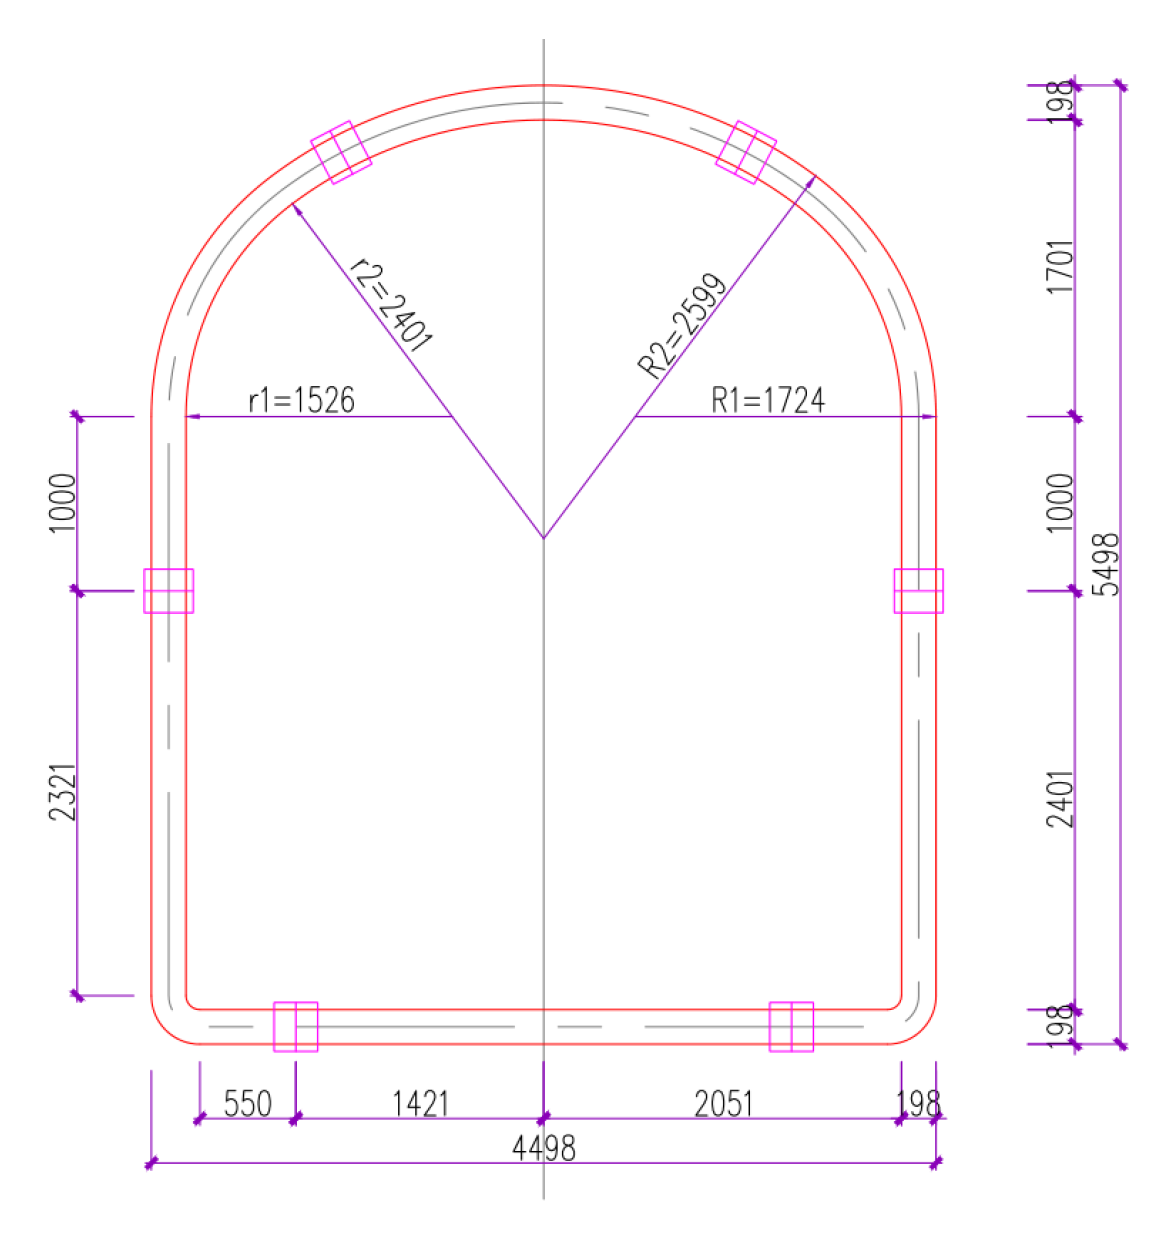
4. Analysis of Surface Deformation Induced by Ultra-Shallow-Buried Pilot Tunnel of Beijing Metro Line 13 Based on Non-Uniform Convergence Model

4.1. Project Overview

Beijing Rail Transit Line 13 College South Road Station is situated at the south side of the College South Road and Jiaoda East Road intersection, serving as an interchange for Line 13A and the planned Changnan Line (positional relationship shown in Figure 11). The ultra-shallow-buried pilot tunnel section within the study scope has a maximum burial depth of 8.2 m, with relevant soil layers and mechanical parameters detailed in Table 6.
The station employs the six-pilot-tunnel pile–beam construction method, with this case focusing on the first step: deformation induced by initial pilot tunnel excavation (Figure 12). Pilot tunnels are excavated using the bench method with reserved core soil, adhering to key principles like “advanced support and strict grouting”. The construction sequence emphasizes critical steps: advanced small duct support (DN32 steel pipes, 2.5 m length, grouting pressure 0.5 MPa), staged shotcreting (C25) and grid steel frame installation (spacing 0.5 m, main bars Φ22 mm) (Figure 13 and Figure 14).
Settlement monitoring utilized the Trimble DINI03 digital level (Trimble, Navi Mumbai, Maharashtra) (accuracy 0.3 mm/km), calibrated by the National Institute of Metrology, with daily checks under stable conditions to ensure data reliability. Key calibration metrics (i-angle correction, repeatability ≤0.3 mm/km) were retained to validate measurement credibility.
The three pilot tunnels were all excavated under ultra-shallow-buried conditions, with a crown overburden thickness of 4.5 m. No surface water was present within the station site. Within a depth of 40 m, there were three groundwater layers: upper perched water, phreatic water and confined water. The complexity of fault structures in the proposed site was moderate, and the current assessment of active fault hazard is low. The pilot tunnel has a horseshoe-shaped cross-section, being 4 m wide with a rectangular part height of 3.4 m and a circular part height of 1.7 m, with a center burial depth of 5.5 m. It should be noted that the single pilot tunnel in this case was the first excavated tunnel, and the stratum had not been disturbed by the excavation of adjacent pilot tunnels before. As the burial depth of the pilot tunnel was shallow and above the groundwater table, it was not affected by groundwater during construction, so the consolidation drainage effect was not considered in the model. The calculation parameters are as follows: H = 5.5 m, A = 4 m, B = 3.4 m, C = 1.7 m, ΔR = −7.75 mm, tanβ = 0.17, δ = 350.89 mm. Under these parameters, the posterior variance ratio of the model is 0.31, indicating an “excellent” back-analysis accuracy rating. The calculation results are shown in Figure 15 at the tunnel centerline (horizontal distance = 0 m).

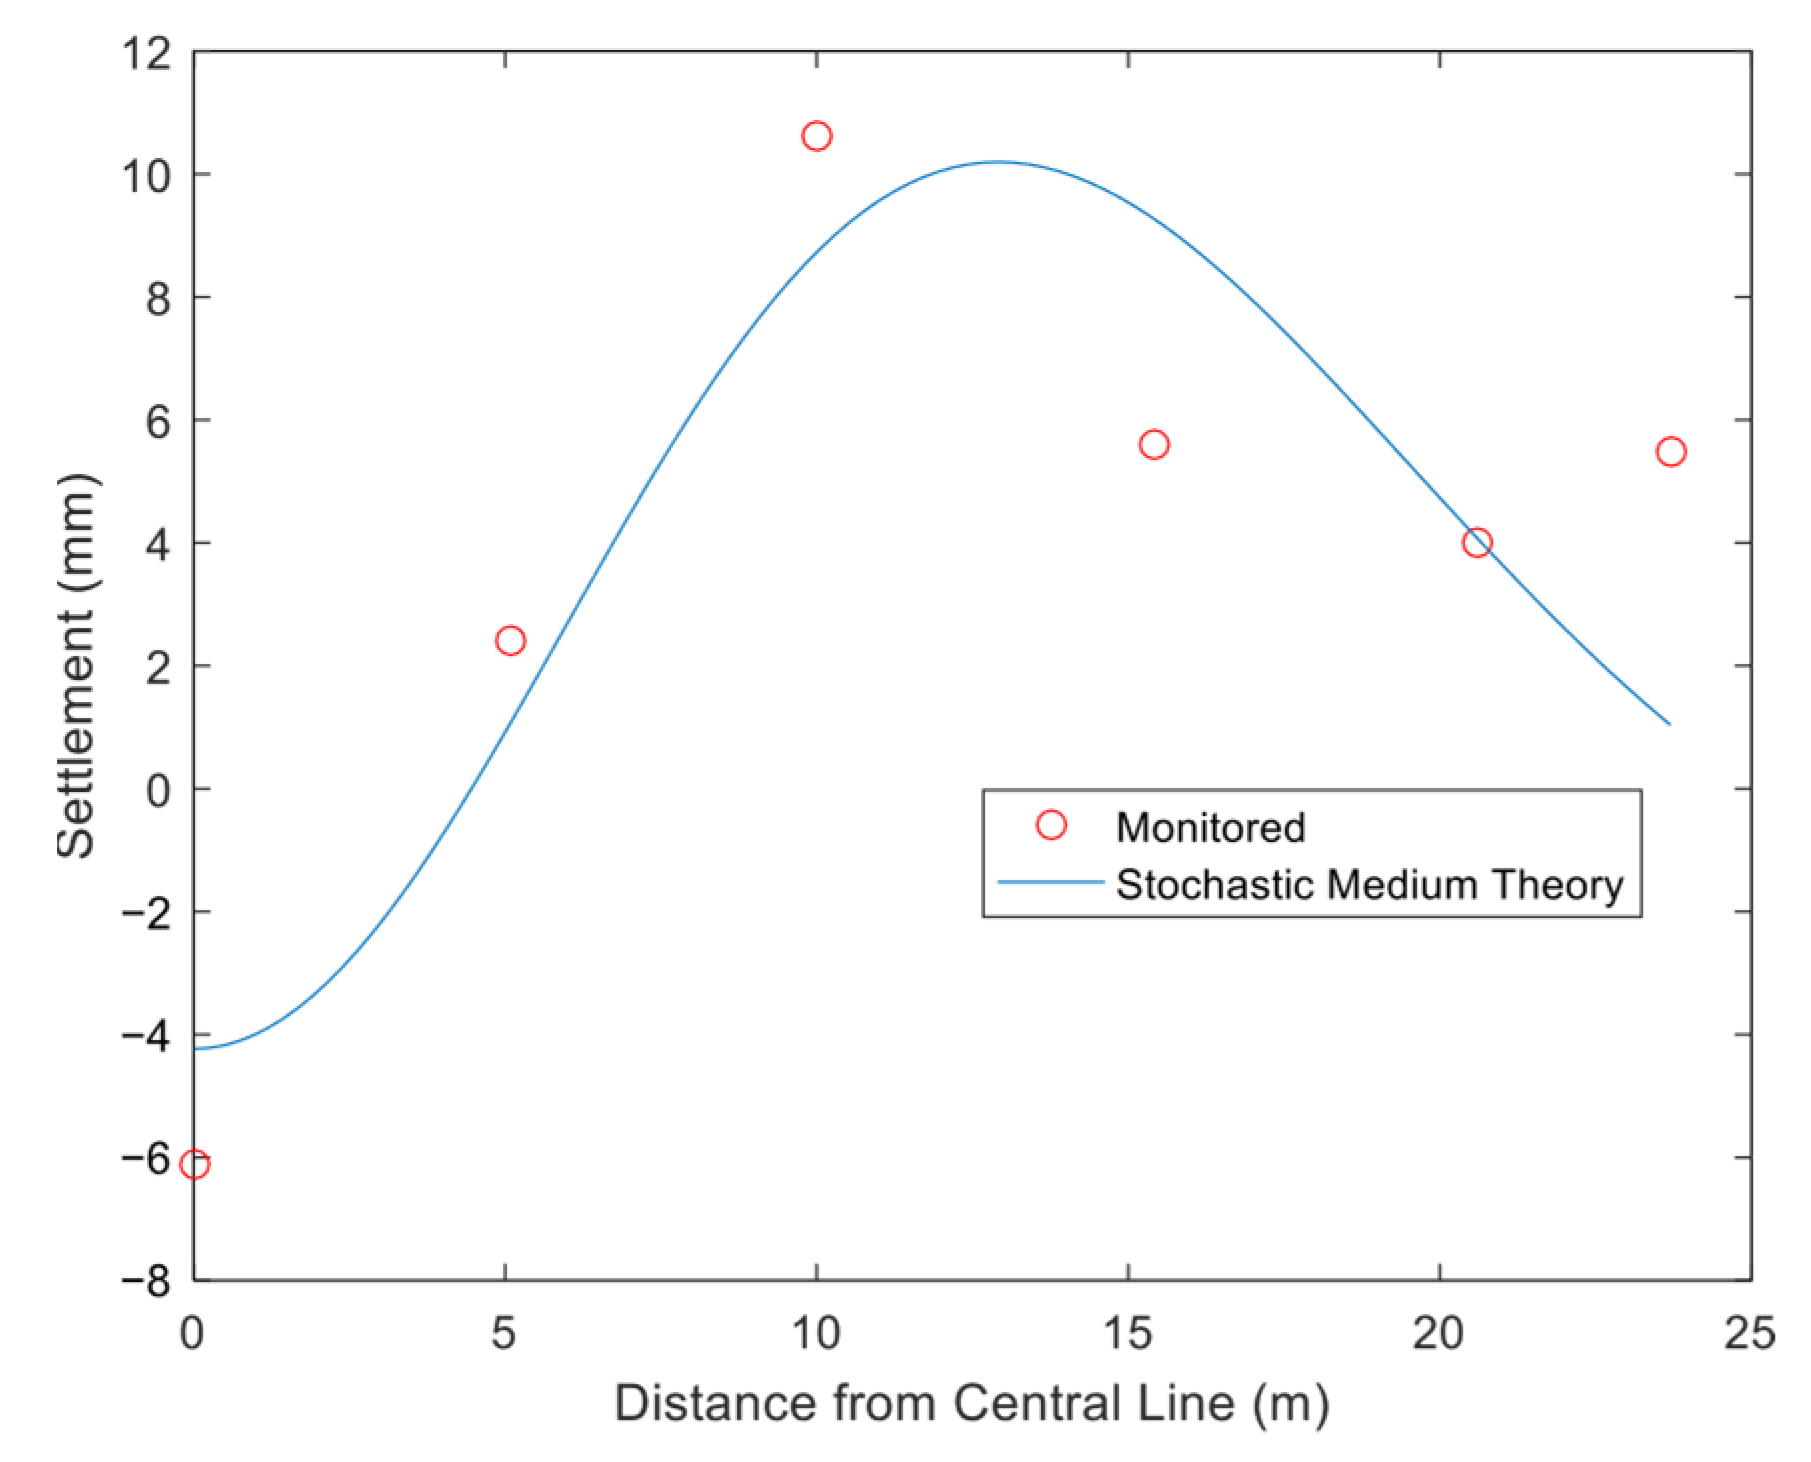
4.2. Analysis of Results

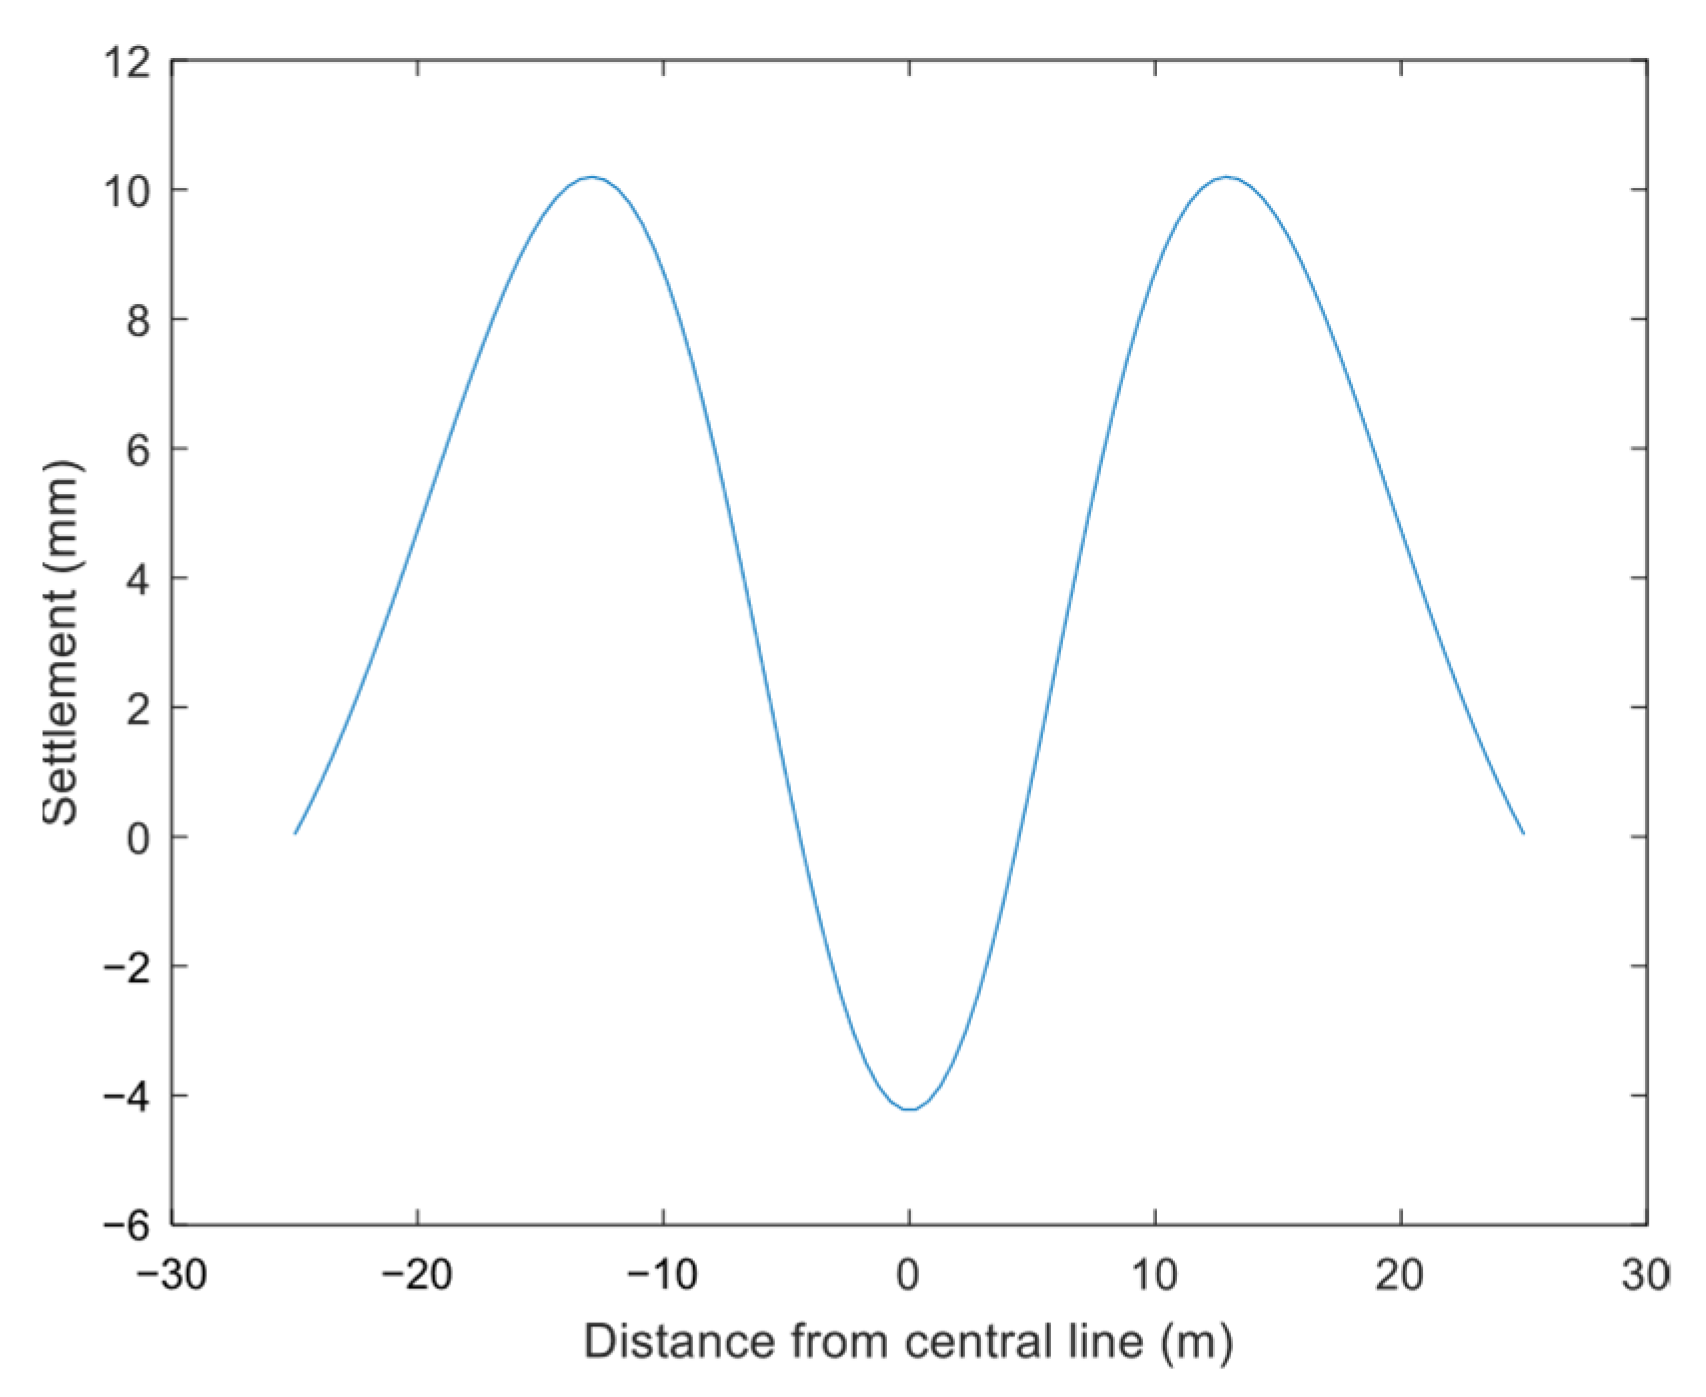
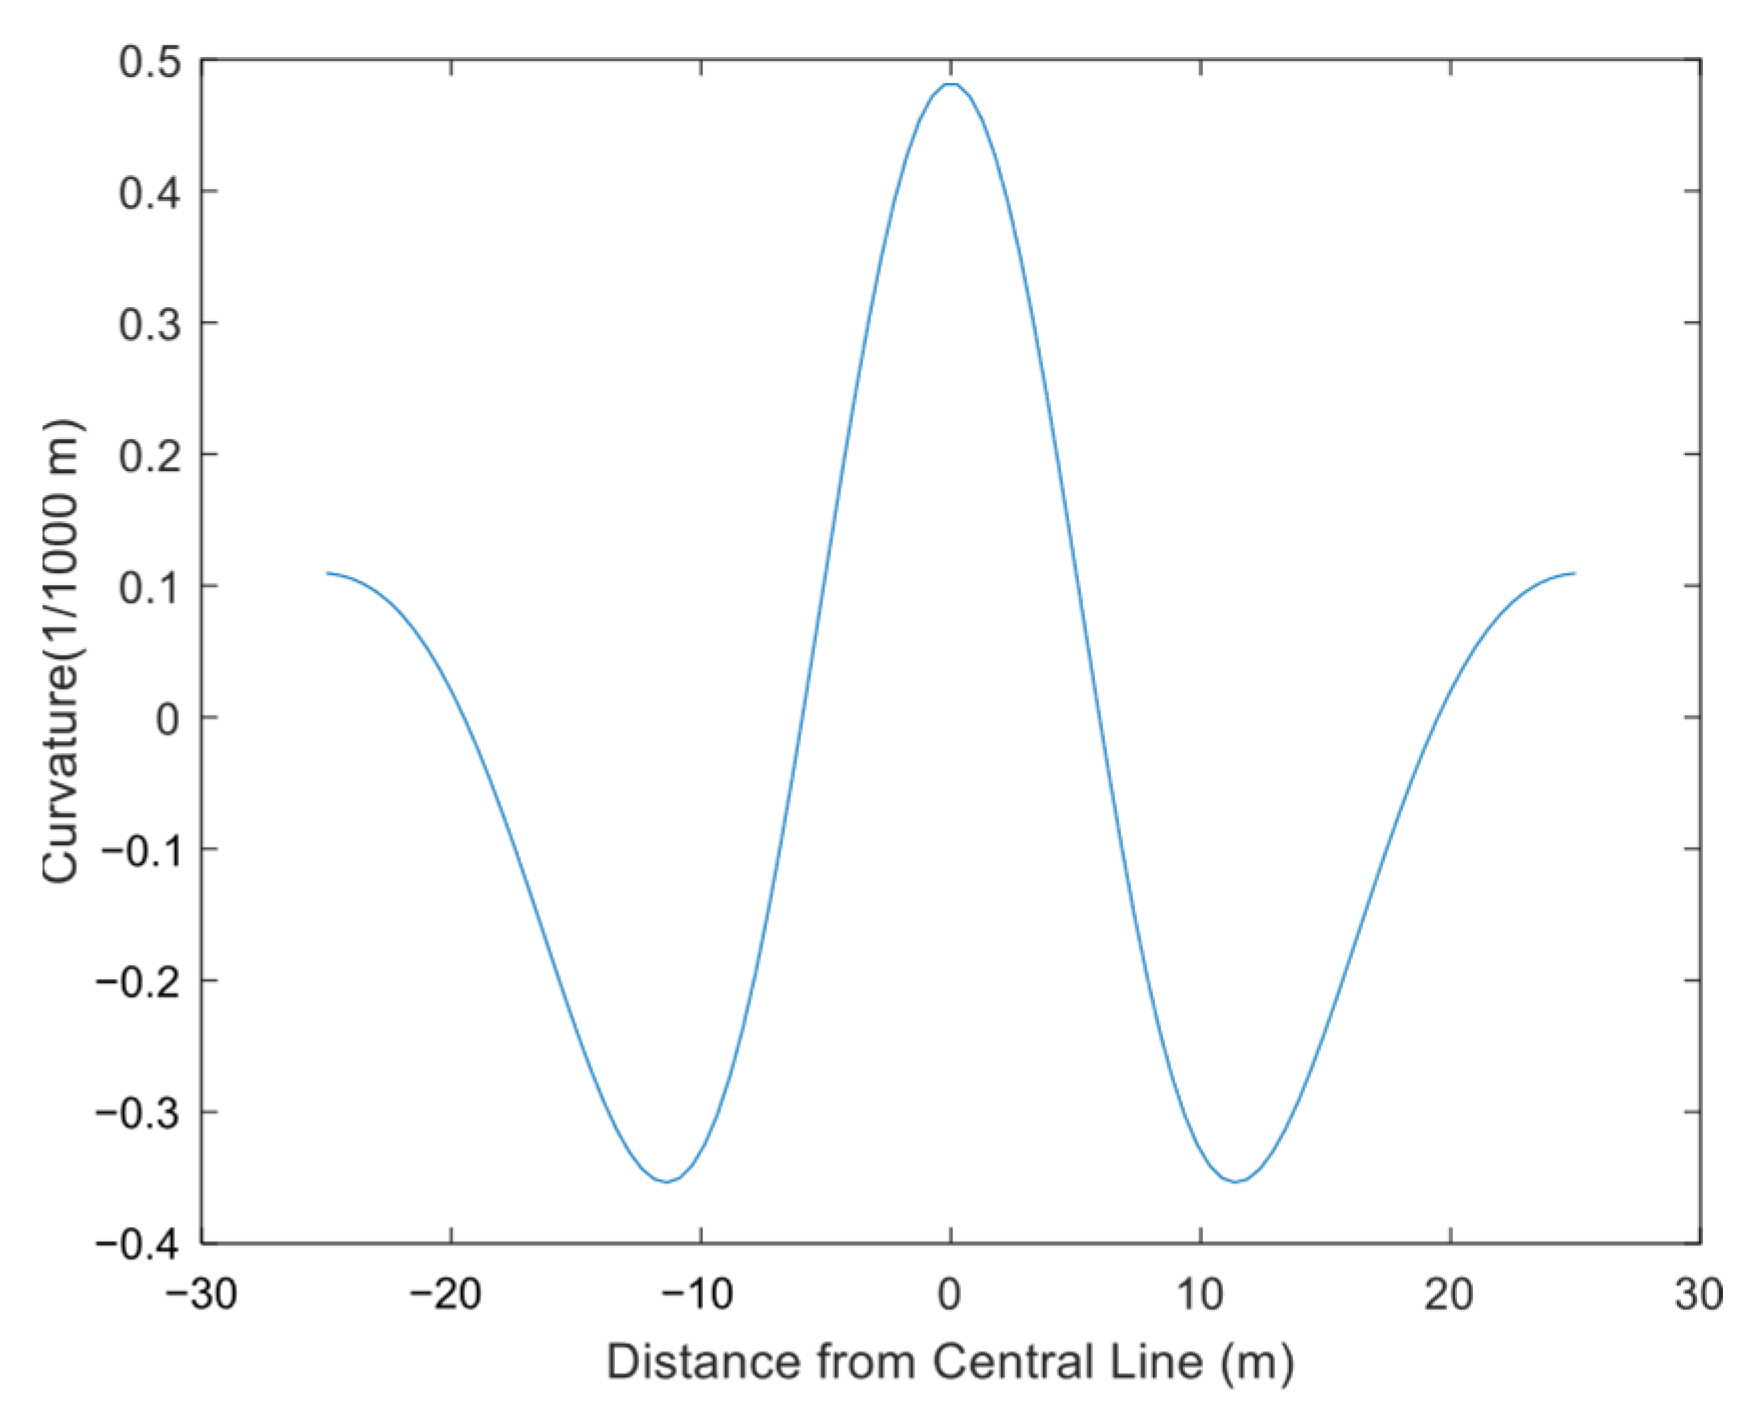
4.2.1. Vertical Surface Deformation

The measured data changes can be seen in Figure 15. Six settlement measurement points are arranged on the same side of the pilot tunnel axis, with the horizontal distance at the tunnel’s longitudinal axis being 0 m. The first measurement point directly above the pilot tunnel shows a measured settlement of −6.13 mm, the maximum value of this measurement line. At a horizontal distance of 5.1 m to the right along the cross-section, the second settlement point reveals a rapid transition from settlement to heave, with a measured surface heave of 2.42 mm—an 8.55 mm difference from the first point, resulting in a surface tilt toward the axis of 1.68 mm/m. From the second to the third settlement point, the surface heave value increases rapidly, reaching a maximum of 10.62 mm at 10 m horizontal distance (8.2 mm larger than the second point), with the same tilt direction and a tilt value of 1.64 mm/m. Thereafter, the heave value decreases rapidly to 5.58 mm at 15.4 m and 4.02 mm at 20.6 m, inducing a surface tilt away from the axis—an uncommon feature in shallow-buried tunnel settlement troughs. Analyzing the third to fifth points away from the pilot tunnel axis, the rate of heave decrease gradually slows, with the surface tilt rate reducing from −0.93 mm/m to −0.3 mm/m. Subsequently, the heave value slightly rebounds to 5.47 mm at 23.7 m, causing the surface tilt rate to turn positive, with a tilt toward the axis of 0.47 mm/m. Overall, the observations show that settlement is largest above the pilot tunnel axis, decreasing rapidly and transitioning to heave when far from the axis. The change rate peaks at 1.68 mm/m, with heave deformation peaking at 2.5 times the tunnel width from the axis, decreasing rapidly and then rebounding again at 5 times the tunnel width.
Figure 15 demonstrates that the theoretical calculations in this study align with the measured data in terms of overall trend. However, stochastic medium theory predicts a maximum settlement of −4.23 mm directly above the axis, exceeding the measured values. Beyond this point, the settlement transitions to heave, decreasing radially at a rate of 1.41 mm/m. The ground surface tilts toward the axis, with the heave magnitude peaking at 10.19 mm (10.2 m from the axis). Subsequently, the heave diminishes rapidly at a reduction rate of 0.67 mm/m, reaching 1.04 mm at 23.7 m from the axis. Beyond this distance, the surface tilt direction reverses, pointing away from the axis. The theoretical calculation yields an error of 1.9 mm at the axis, slightly larger than the measured value. Along the direction away from the axis, the error decreases, reaching 0 mm at a horizontal distance of 4.2 m. At 5.1 m, the calculated value is slightly smaller than the measured value by 1.0 mm, with an error of −1.8 mm at 10 m. The absolute error first decreases then increases away from the axis, reaching 3.7 mm at 15.4 m. The maximum error occurs at the edge, with a value of −4.4 mm at 23.7 m. Overall, stochastic medium theory shows strong correlation with the measured data. Within a 10 m horizontal distance, the maximum relative error is 17.2%; the correlation is moderate at 10–23.7 m, with absolute errors fluctuating between 0 and 4.4 mm. The highest correlation occurs within 5 m of the axis, corresponding to the stage of surface settlement decrease. The theoretical calculation exhibits a similar pattern to the field measurements: the rate of surface heave increase is approximately twice that of the decrease stage, and the surface tilt during heave decrease shows a higher correlation with the actual measurements.
The theoretical calculation curve in Figure 15 is symmetrically redrawn to obtain Figure 16. The lateral ground subsidence induced by ultra-shallow-buried excavation differs from the traditional bell-shaped settlement trough. The most significant difference is the pronounced surface heave at 2.5 times the pilot tunnel width from the centerline, a feature absent in classic bell-shaped profiles. This phenomenon arises because the secondary lining has low stiffness before gaining sufficient strength. Under surrounding rock pressure, soil on both sides of the pilot tunnel is horizontally extruded. As this soil moves laterally, it squeezes the undisturbed dense soil below, generating an upward stress component. In deeply buried tunnels, a natural soil arch forms in the overburden and the self-weight stress fully offsets the upward stress, preventing surface heave. By contrast, ultra-shallow burial depths are insufficient to form a natural arch, so the self-weight stress is less than the upward stress, causing partial surface heave. The horizontal expansion of the initial support has limited disturbance, only inducing heave over a localized surface area that diminishes with distance from the axis. Overall, the surface deformation curve is M-shaped, characterized by maximum settlement above the excavation center, a rapid transition from settlement to heave from the axis to the edge, and a subsequent rapid decrease in heave magnitude.
Ultra-shallow-buried pilot tunnel excavation induces surface tilting and warping due to uneven heave and settlement, collectively termed vertical surface deformation. As shown in Figure 17, the ground surface near the pilot tunnel centerline on both sides exhibits tilted deformation toward the axis. The positive/negative values in the figure denote the tilt direction: the normal to the tilted plane aligns with the positive x-axis (positive), and vice versa (negative). The surface tilt curve is centrally symmetric, featuring three zero points and four extreme values within the plotted range. The zero points occur at horizontal distances of −12.9 m, 0 m and +12.9 m, corresponding to the three extreme points of the settlement curve: maximum settlement at 0 m and peak heave at ±12.9 m. As the horizontal distance approaches infinity, the surface tilt tends to zero. The tilt curve has four extreme points, corresponding to the four inflection points (reverse bends) on the surface settlement curve. The distances from these inflection points to the pilot tunnel axis are denoted as i1 and i2. Starting from the origin, as the distance x from the tunnel axis increases, the surface tilt value gradually rises, reaching a maximum at x = ±i1 and then decreasing. For a typical shallow-buried tunnel, the tilt curve would converge to zero at this stage, whereas the ultra-shallow-buried tunnel’s tilt curve crosses the zero point after a reverse increase, reaching a secondary maximum at x = ±i2 and then decreasing to zero. Analyzing the positive x-axis alone, inflection point i1 is at 5.8 m, where the surface tilt reaches a maximum of −1.79 mm/m, corresponding to the steepest increase in surface heave on the settlement curve. Inflection point i2 is at 19.4 m, where the tilt reaches the next highest value of 1.11 mm/m, aligning with the fastest reduction rate of surface heave.
As shown in Figure 18, the surface curvature deformation curve exhibits axisymmetric distribution, with an extreme value of 0.48 × 10⁻³ m−1 directly above the pilot tunnel axis. The curvature curve follows the same variation pattern along both the positive and negative x-axes. For the positive x-axis, as the distance x from the pilot tunnel center increases, surface curvature gradually decreases. When x reaches x = i1, the curvature deformation first drops to zero, coinciding with the maximum surface tilt. As x continues to increase, the curvature deformation increases negatively, reaching a negative maximum of −0.35 × 10⁻³ m−1 at x = 11.4 m. For a typical shallow-buried tunnel, the surface curvature curve would converge to zero at this stage, whereas the curvature curve for an ultra-shallow-buried pilot tunnel does not converge to zero. Instead, it increases positively after reaching zero at x = i2. In regions (−i1, i1), (−∞, −i2) and (i2, ∞), surface curvature deformation is positive, corresponding to the surface settlement curve being relatively convex upward. In regions (−i2, −i1) and (i1, i2), curvature deformation is negative, with the settlement curve being relatively concave. Thus, the four inflection points ±i1 and ±i2 of the surface settlement curve are also the four curvature reversal points.
Generally, the settlement value at the rebound point of a shallow-buried tunnel is approximately 0.63 times the maximum ground surface settlement. In this case, the ultra-shallow-buried pilot tunnel excavation exhibits a similar pattern: the heave value at rebound points ±i1 is 2.35 mm (about 50% of the maximum settlement of −4.23 mm), and the heave at ±i2 is 5.35 mm (50% of the maximum heave of 10.19 mm). As x approaches infinity, surface tilt and curvature tend to zero. Notably, significant surface heave occurs at 2.5 times the pilot tunnel’s width from the centerline, while surface deformation nearly vanishes at 5 times the tunnel’s width. Using the shallow tunnel influence radius concept, the calculated influence radius for this pilot tunnel is 34 m, but field data show that surface deformation is negligible at a 25 m horizontal distance, indicating that the shallow tunnel influence radius concept is inapplicable here.

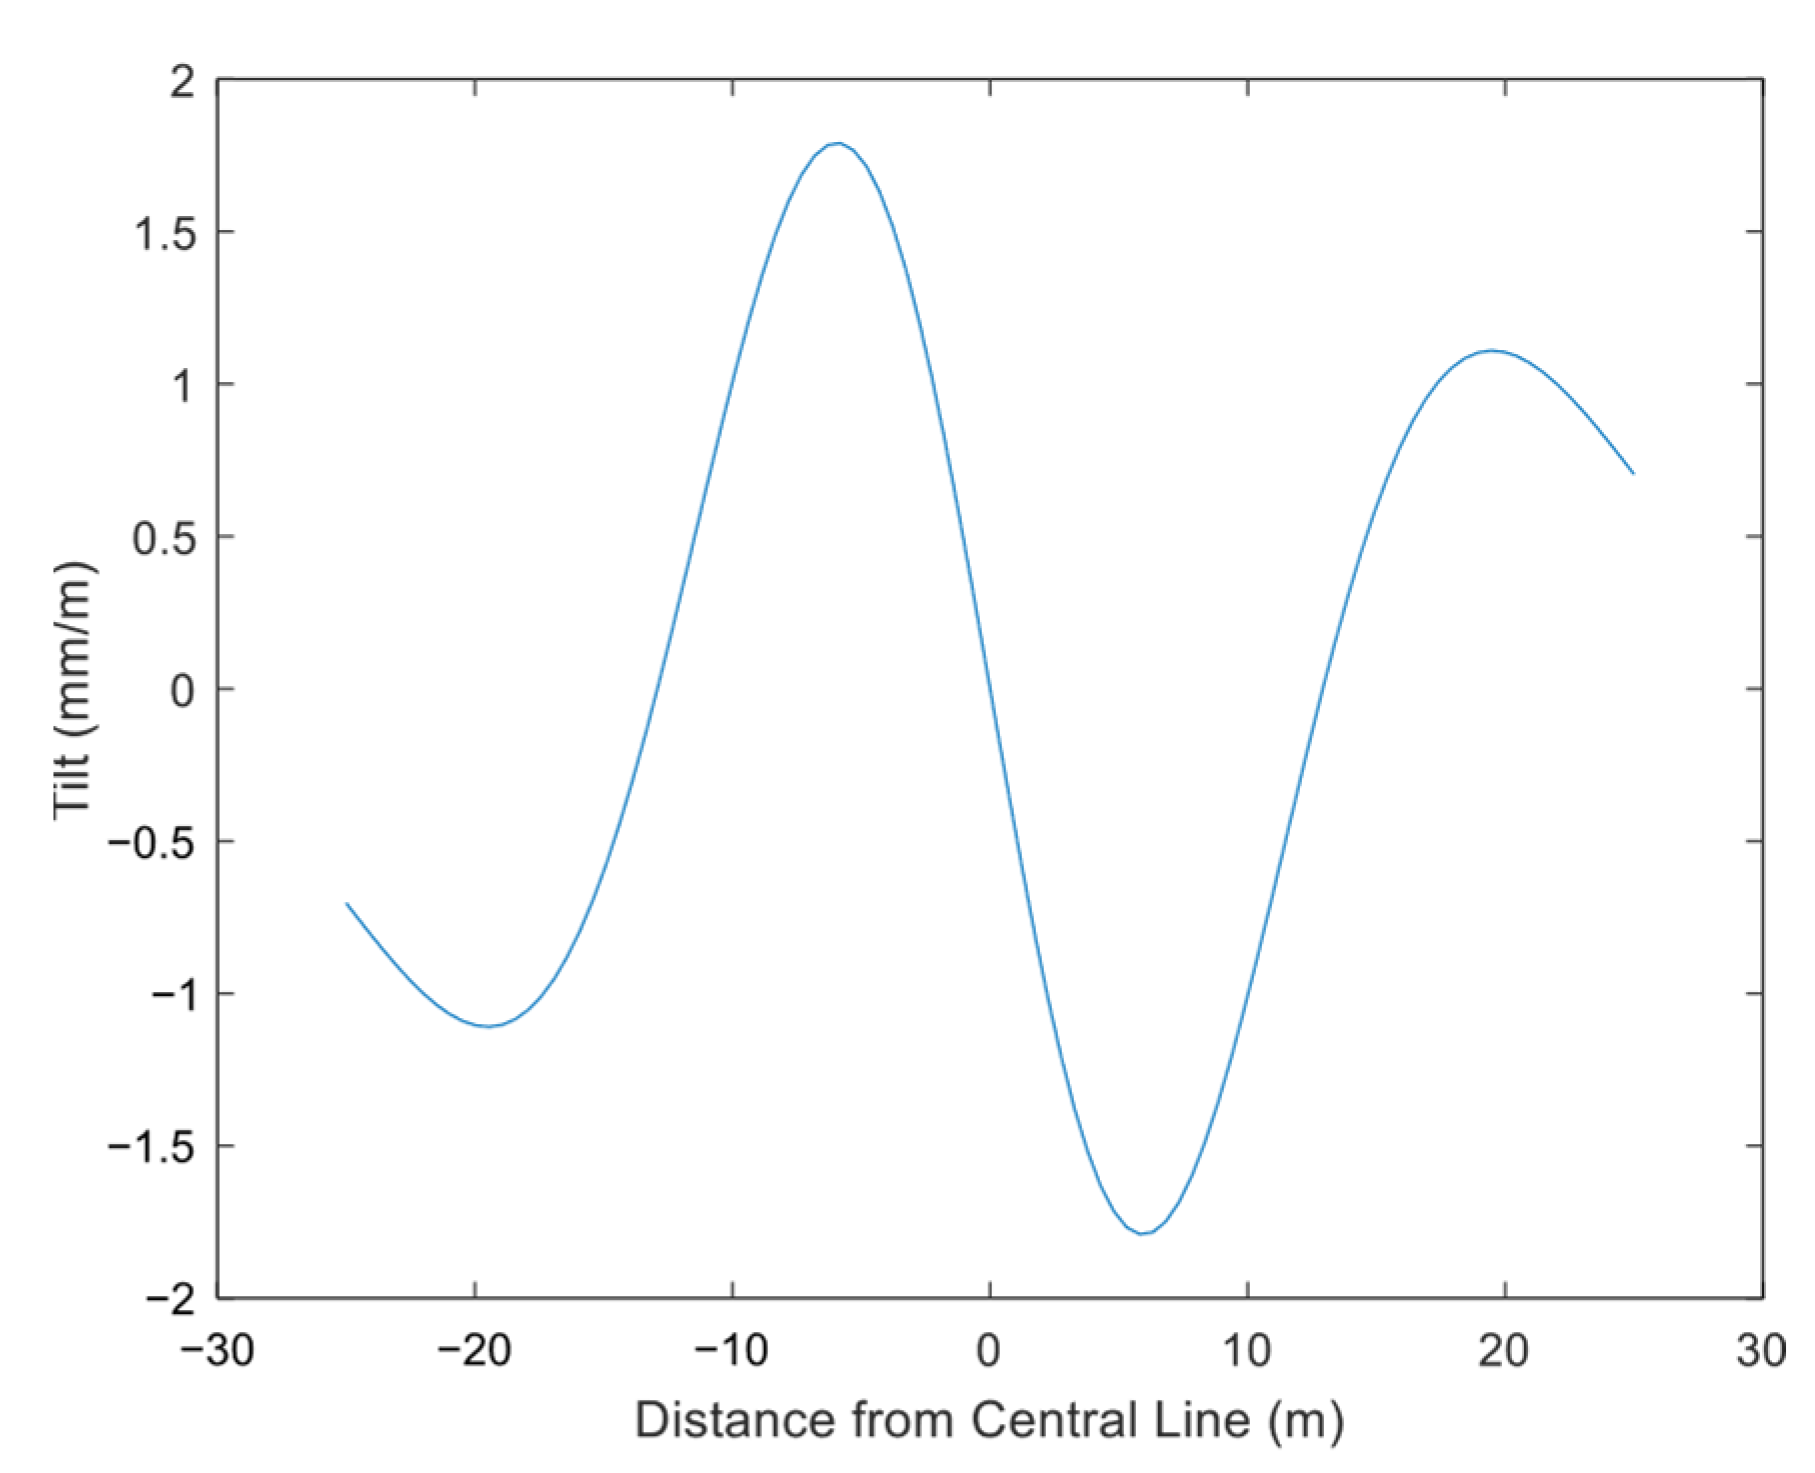
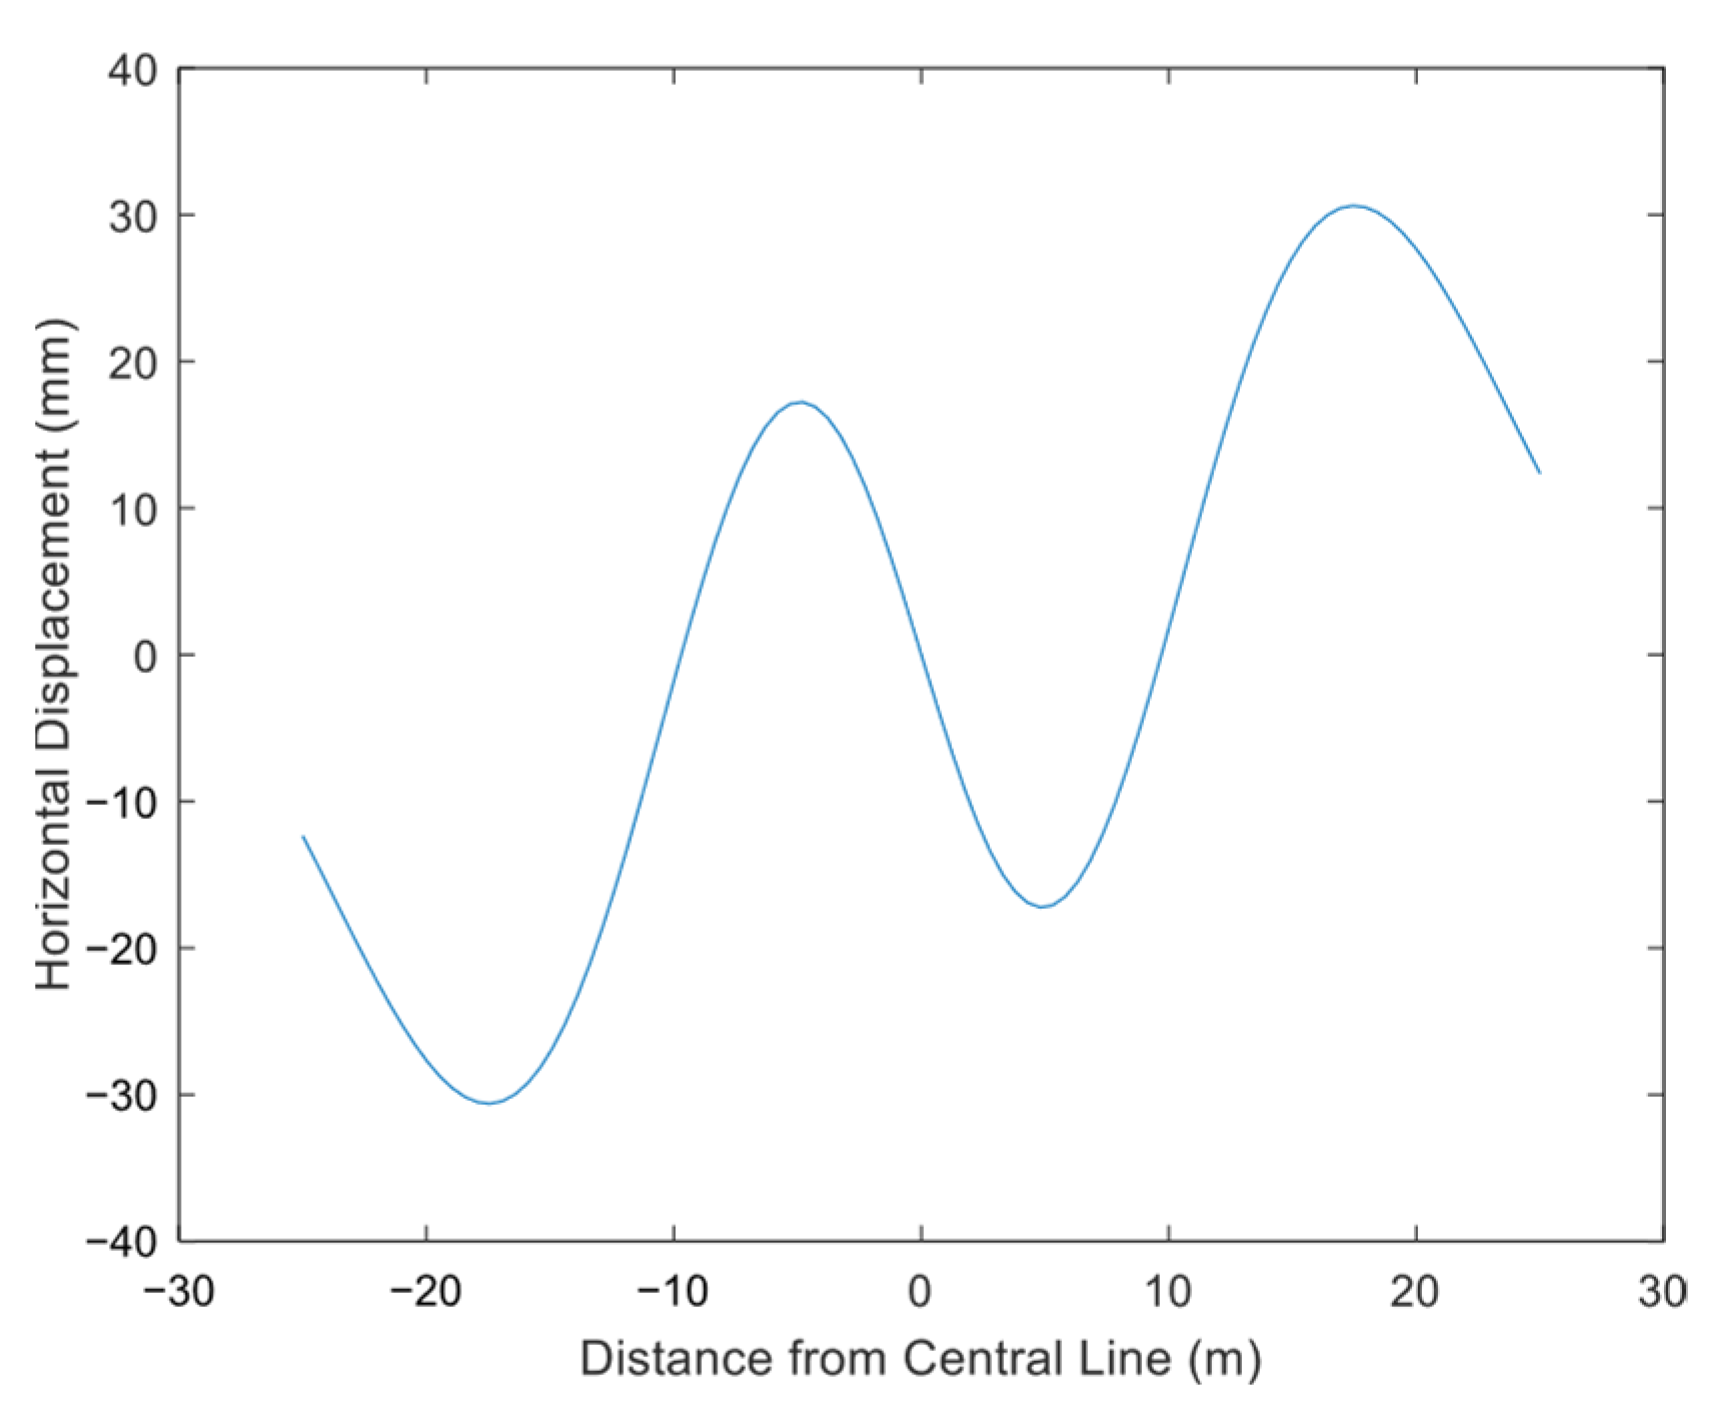
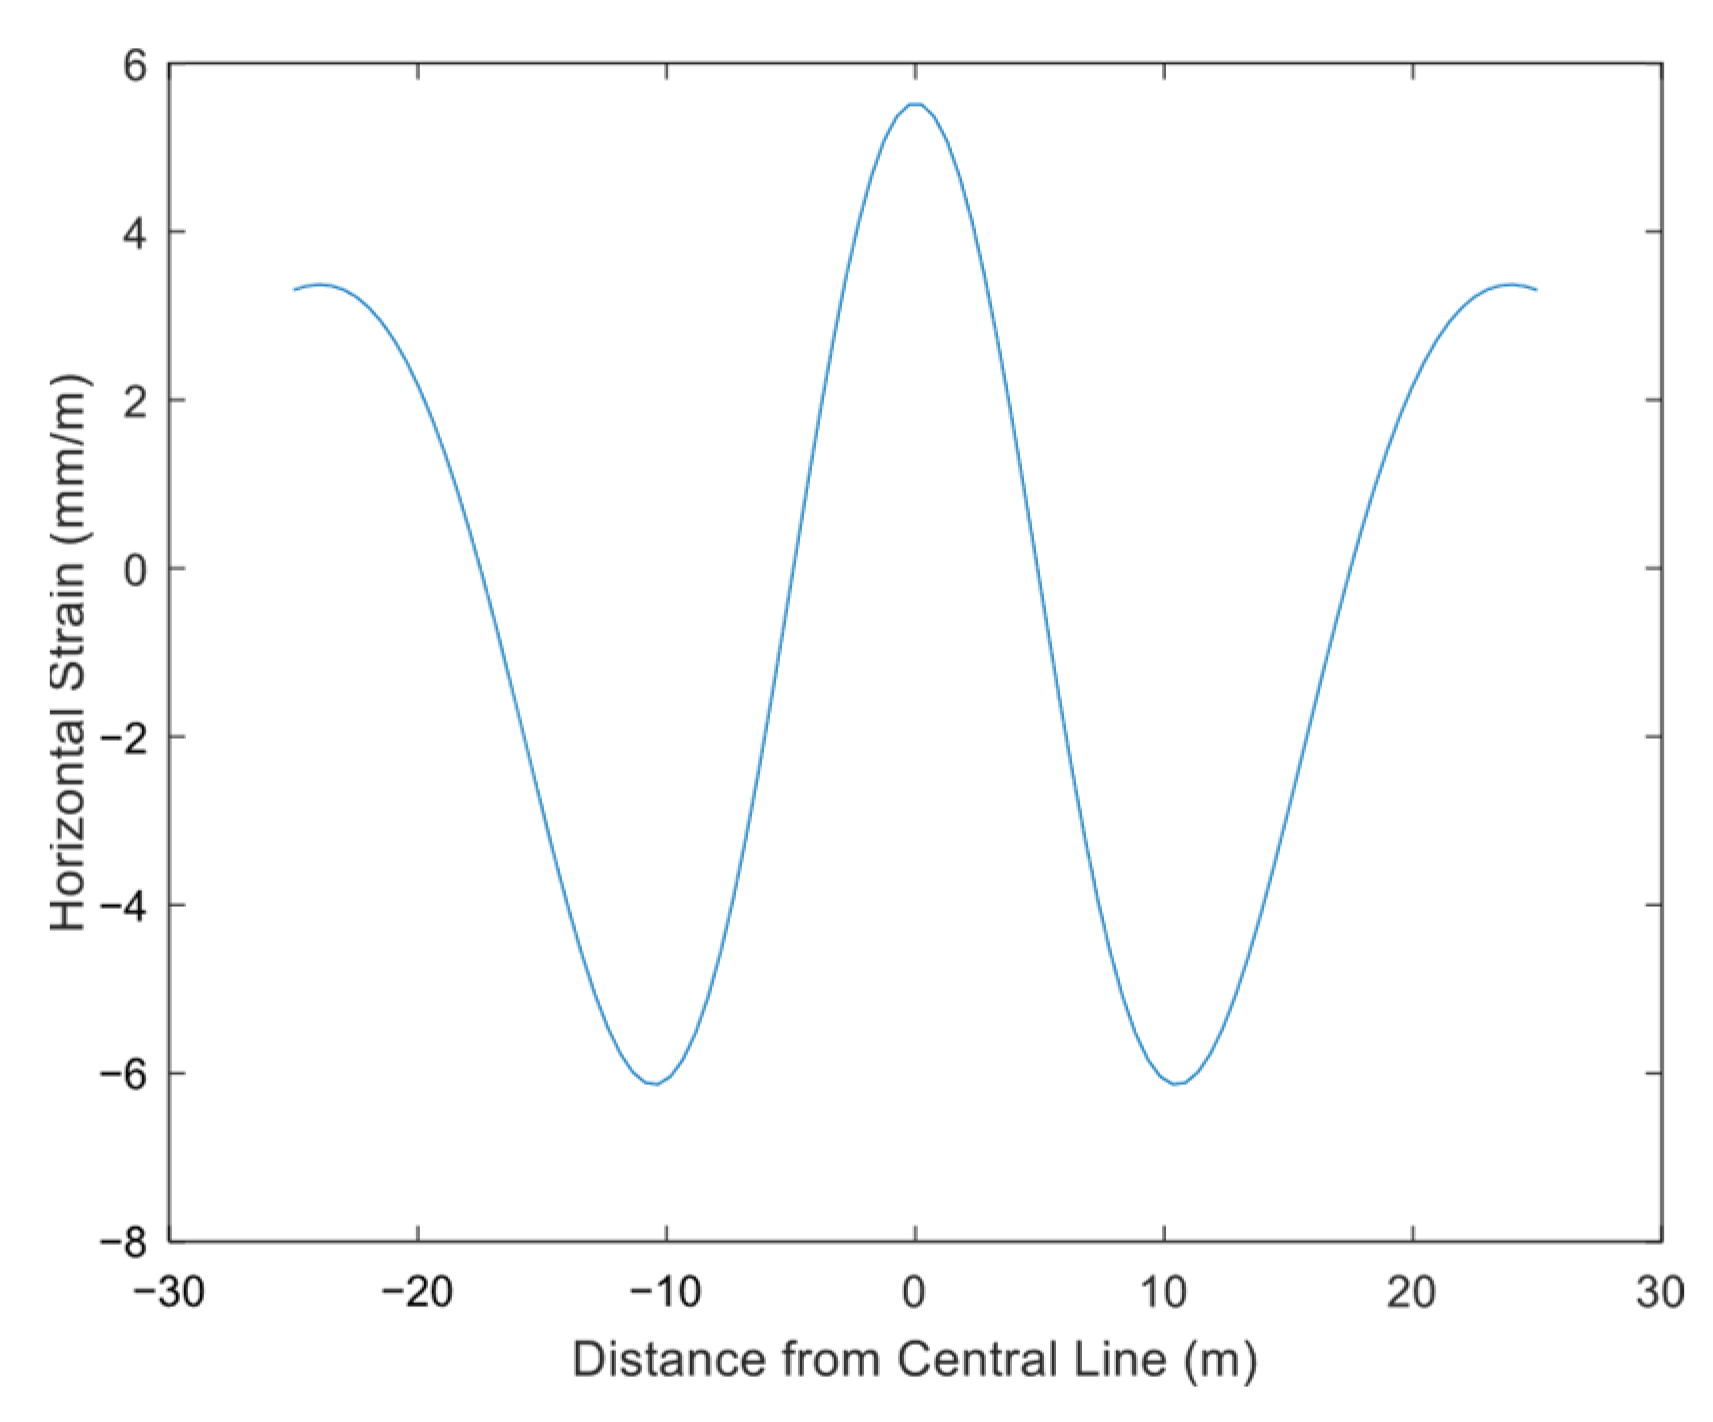
4.2.2. Horizontal Displacement of Ground Surface

As shown in Figure 19, the ground surface near the pilot tunnel centerline on both sides exhibits horizontal displacement toward the axis. In Figure 15, the positive/negative values denote the horizontal displacement direction: positive aligns with the x-axis positive direction, and negative indicates the opposite. The surface horizontal displacement curve is centrally symmetric, featuring three zero points and four extreme values within the plotted range. The first point where horizontal displacement is zero lies at the pilot tunnel axis. The horizontal displacement curve is symmetric along the positive and negative x-axes. For the positive x-axis, as the distance x from the pilot tunnel axis increases, surface horizontal displacement toward the axis occurs and gradually increases, reaching the first extreme value of −17.23 mm at 4.8 m. The displacement then decreases, reaching the second zero point at 9.7 m. Beyond this, surface horizontal displacement occurs away from the axis, increasing to an extreme value of 30.61 mm at 17.4 m, then decreasing and tending to zero at infinity. Within the range (−9.7 m, 9.7 m), all surface horizontal displacements point to the tunnel axis (toward the excavation center). In regions (−∞, −9.7 m) and (9.7 m, ∞), displacements depart from the tunnel axis, moving away from the excavation center.
As shown in Figure 20, the ground surface near the pilot tunnel centerline on both sides exhibits compressive deformation. In Figure 19, positive values denote horizontal compressive deformation, while negative values indicate tensile deformation. The overall horizontal deformation curve is axisymmetric, featuring four zero points and three extreme values within the plotted range. Directly above the pilot tunnel axis, the extreme value of horizontal compression deformation is 5.51 mm/m. The horizontal deformation curve is symmetric along the positive/negative x-axes. For the positive x-axis, as the distance x from the pilot tunnel axis increases, the compression deformation value decreases, reaching the first zero point at 4.8 m—corresponding to the first extreme value point of the surface horizontal displacement curve. As the horizontal distance increases further, tensile deformation values rise, reaching a second extreme point of −6.13 mm/m at 10.4 m. The horizontal tensile deformation then decreases gradually, reaching the second zero point at 17.4 m (corresponding to the extreme value of the horizontal displacement curve). Beyond this, horizontal deformation reverts to compression and tends to zero at infinite distance.

5. Conclusions

  • It is proposed that the ground surface settlement induced by ultra-shallow-buried excavation consists of two components: uniform soil shrinkage and the non-uniform deformation of the initial support. Based on this, the calculation formula for ground surface settlement caused by the excavation of a horseshoe-section pilot tunnel is derived.
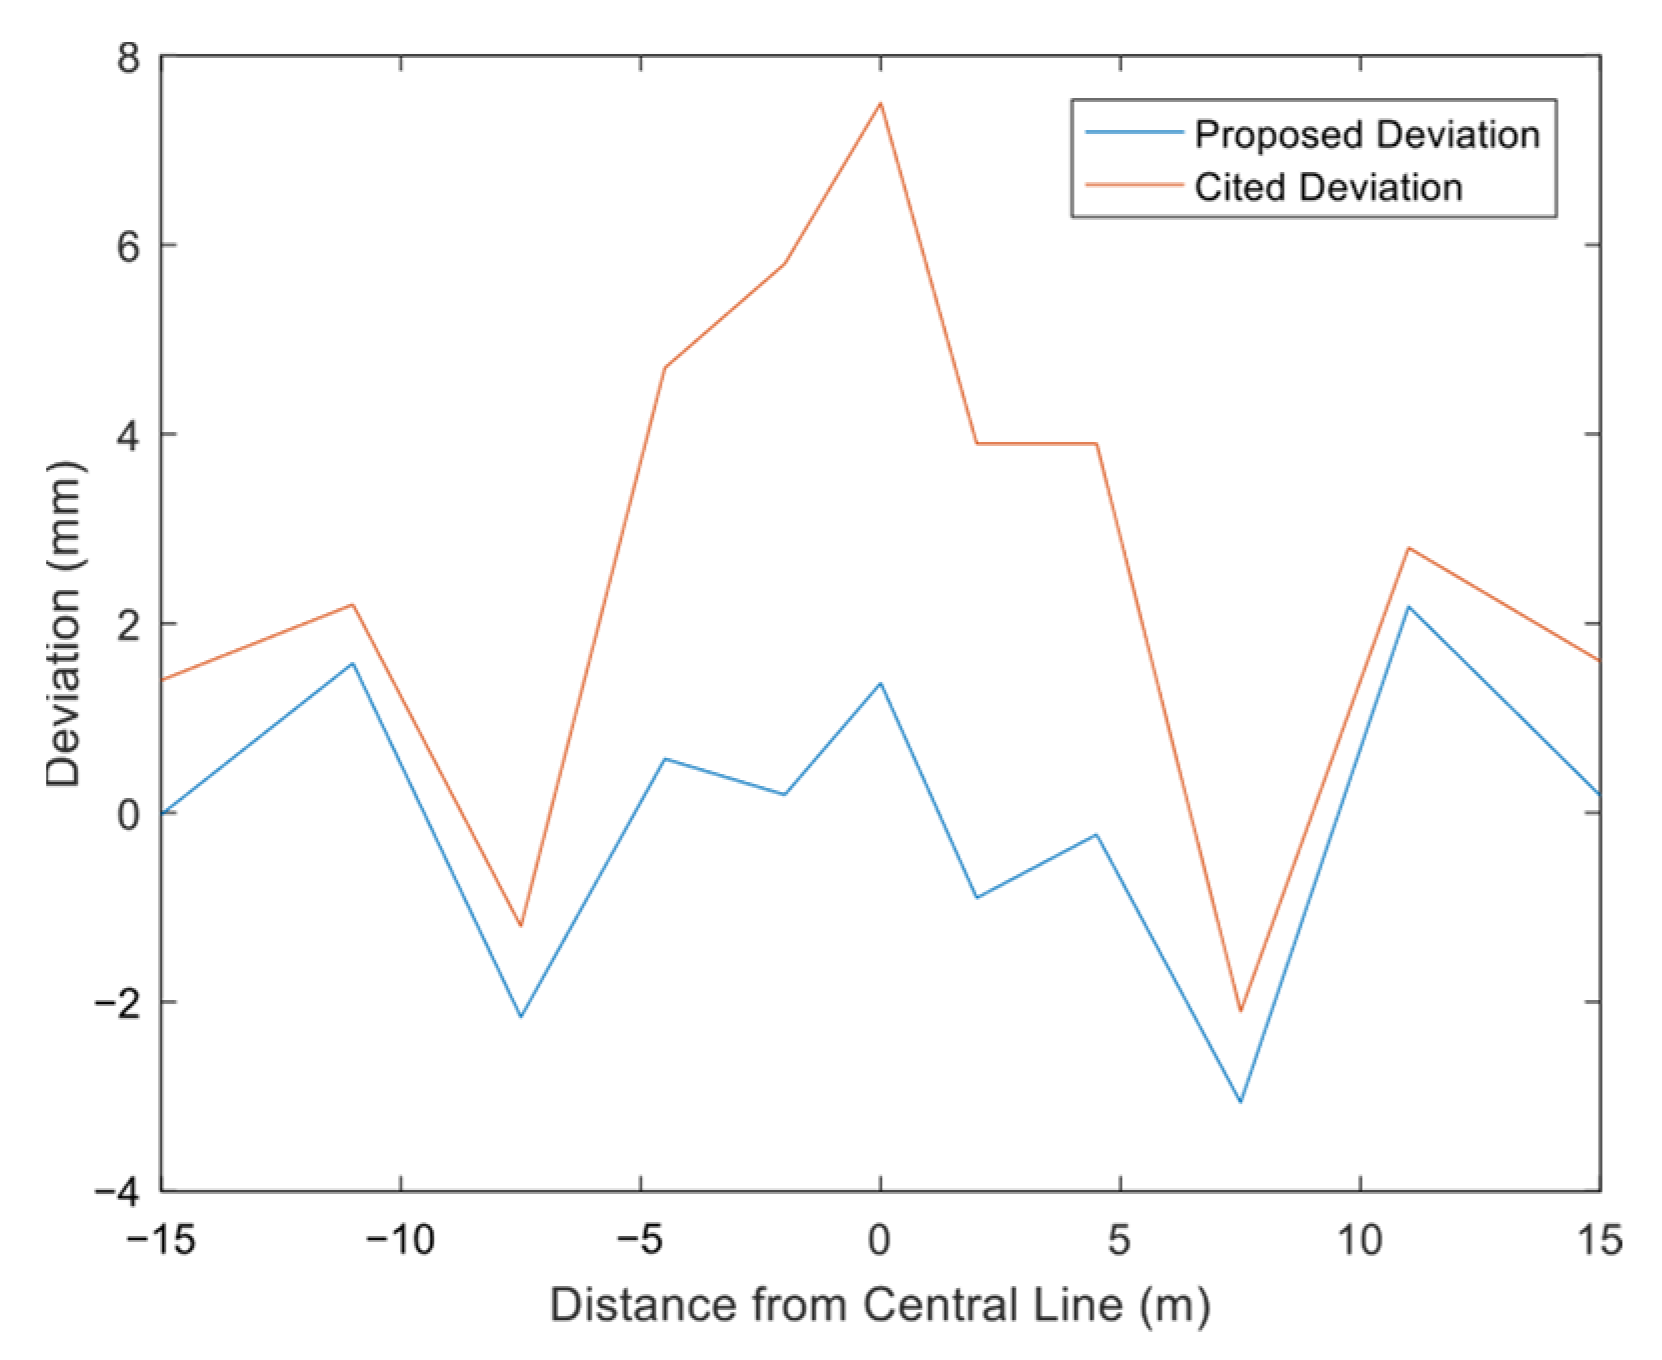
  • The calculation model proposed in this study applies to diverse geological conditions and construction methods, enabling the accurate prediction of surface settlement from shallow tunnel excavation. Taking the Kunming Railway Transit Phase I and Xi’an Metro Line 8 shallow tunnels as cases, compared with the equivalent cross-section calculation model, the direct use of the horseshoe-shaped cross-section model reduces errors by 50%, significantly enhancing prediction accuracy.
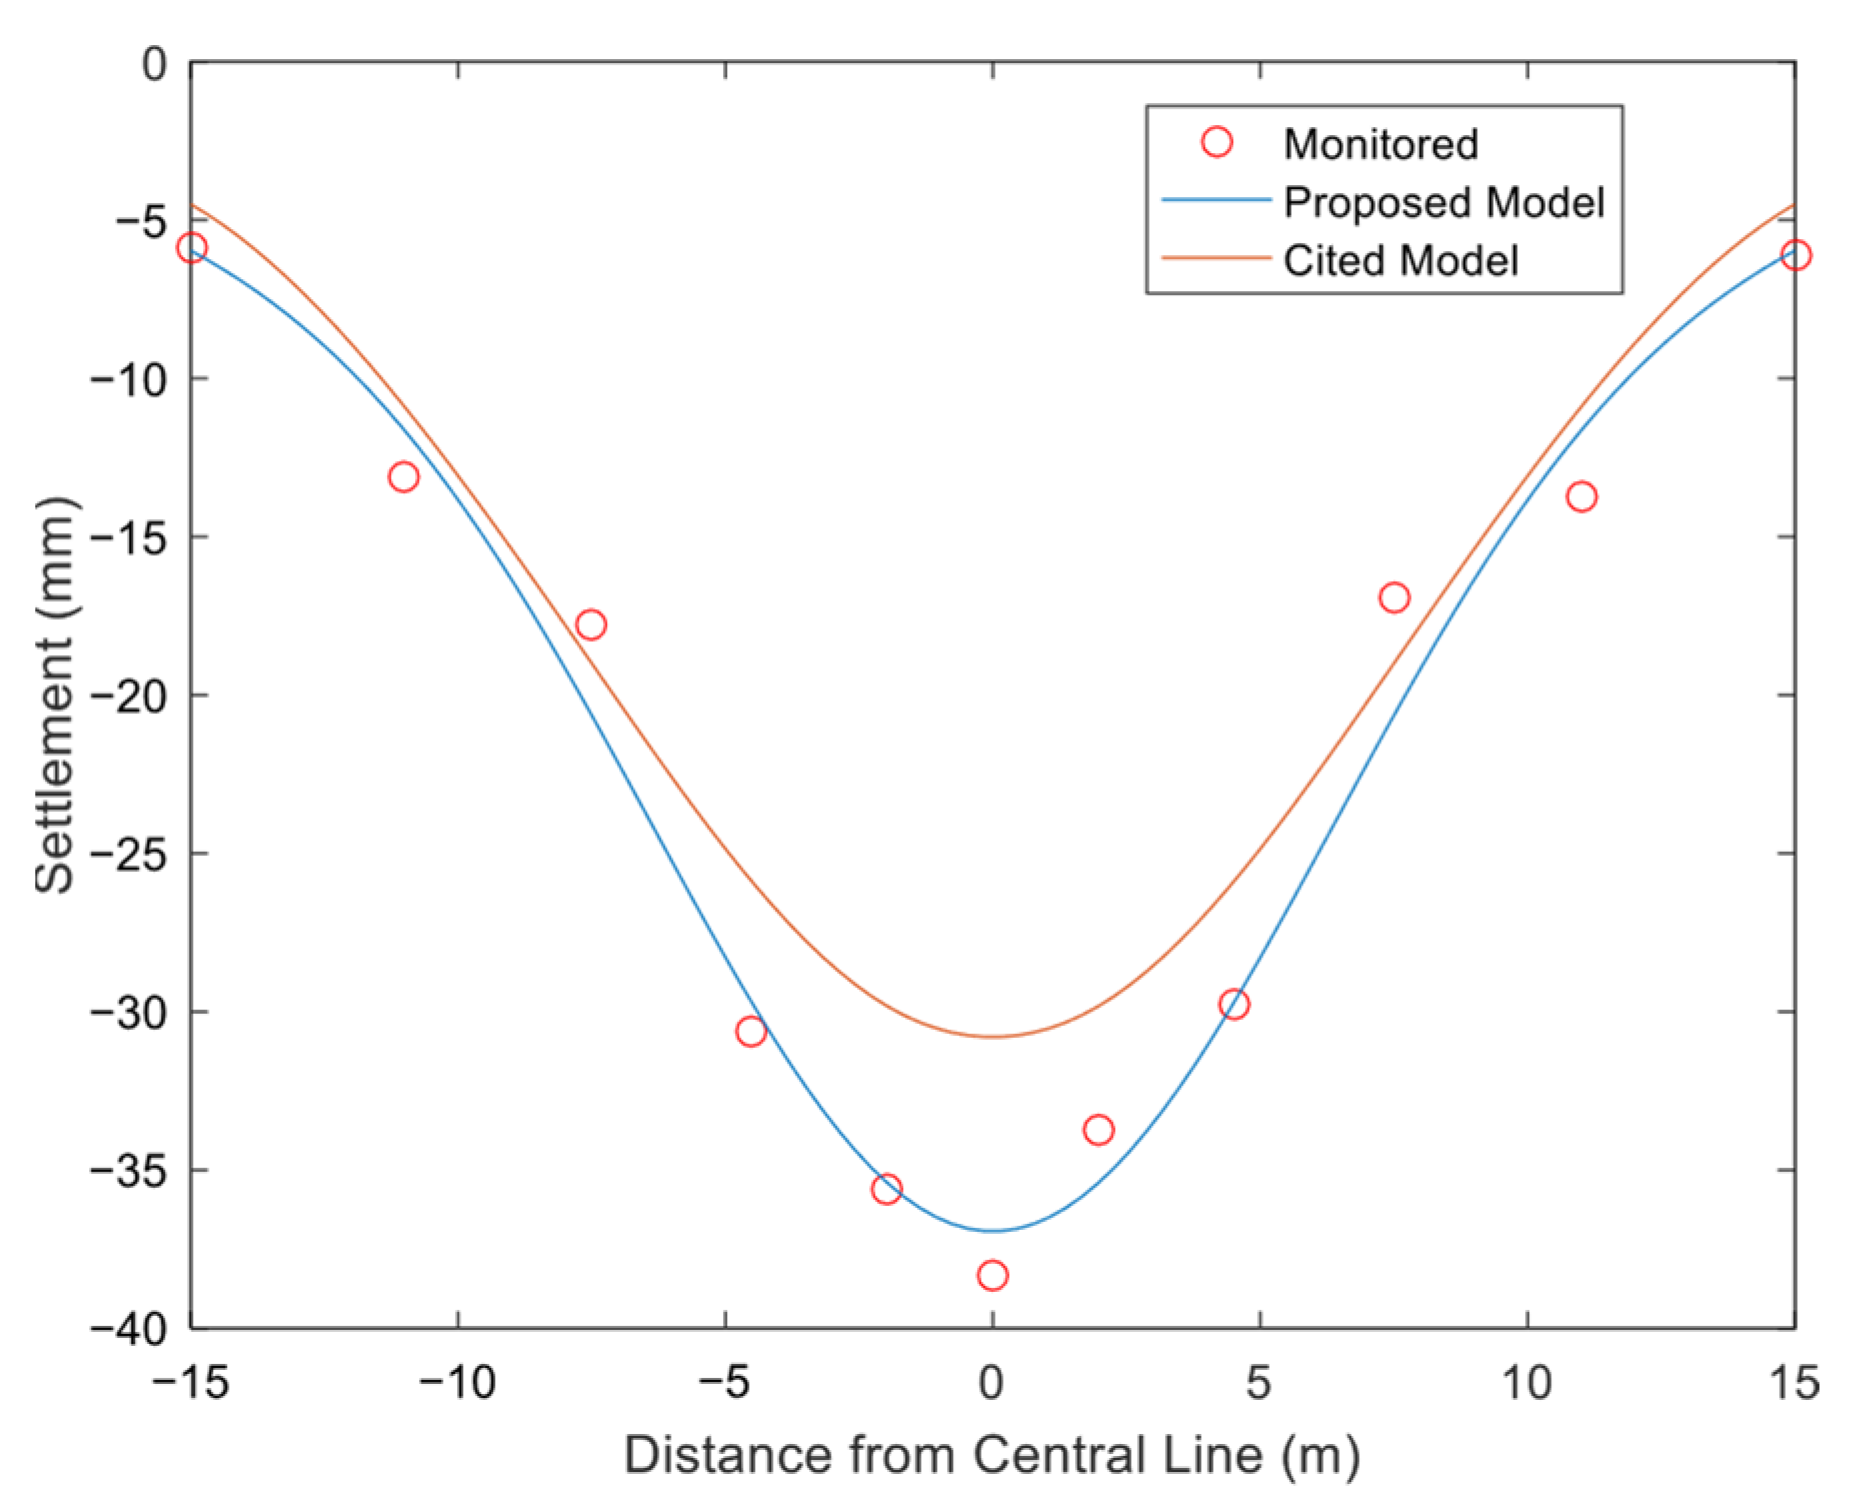
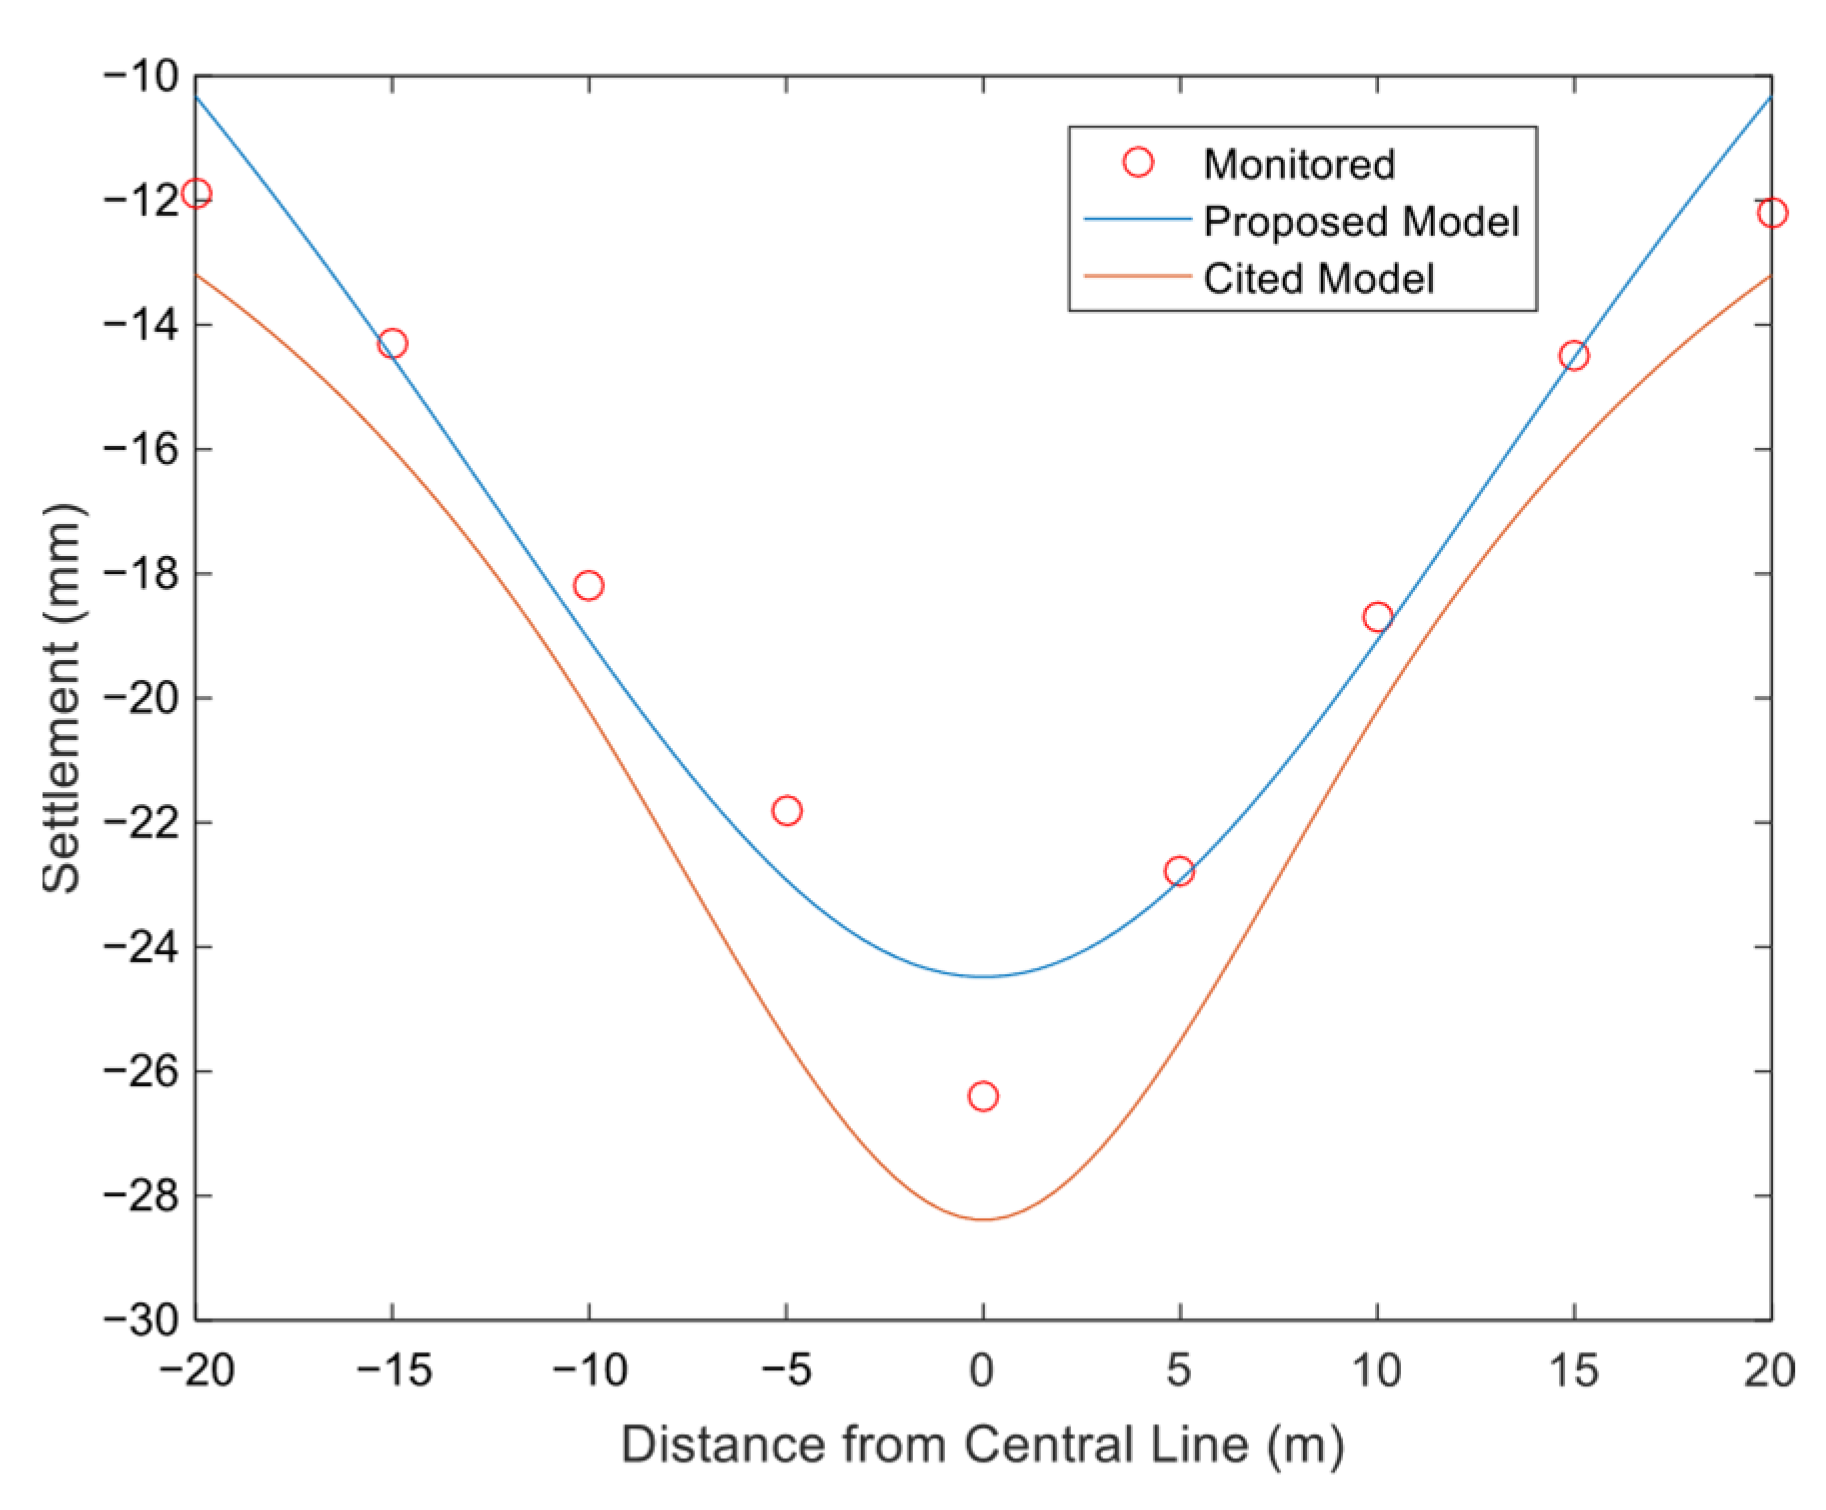
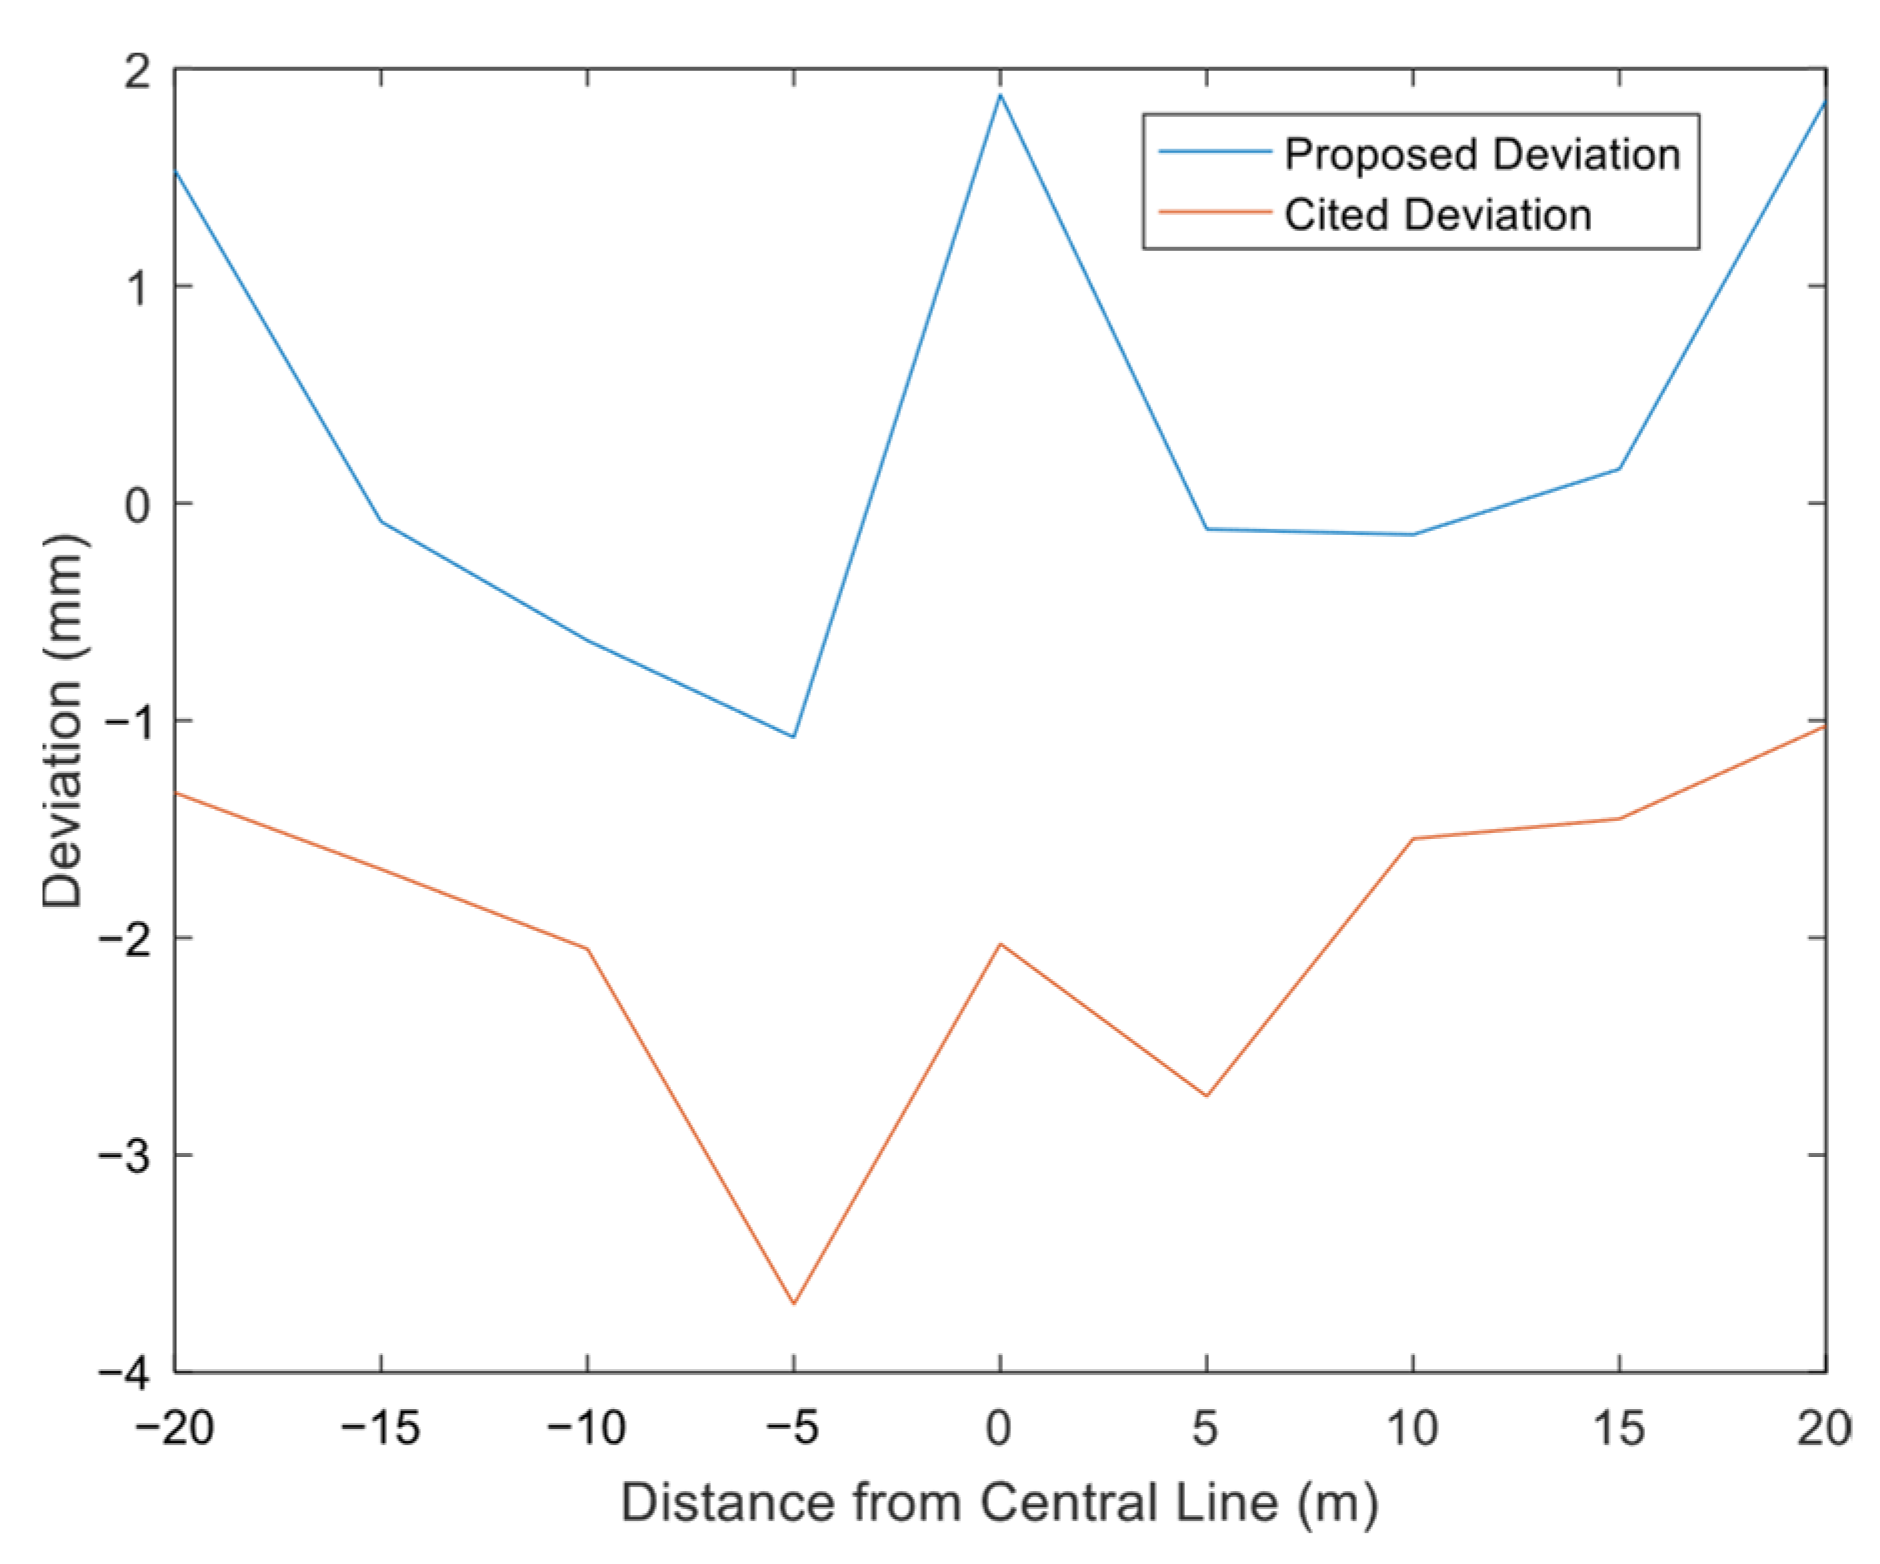
  • The computational model proposed in this study for surface deformation induced by the excavation of an ultra-shallow-buried pilot tunnel on Beijing Rail Transit Line 13 demonstrates good correlation with the measured data. It is found that under ultra-shallow burial conditions, significant ground surface heave occurs at 2.5 times the width from the pilot tunnel center. The cross-section settlement curve overall trends show maximum settlement above the excavation center, followed by a rapid decrease in settlement toward the edge, which transitions to heave, after which the heave rapidly diminishes.

Author Contributions

Conceptualization, C.L. and Y.S.; methodology, X.G. and P.J.; software, X.G.; validation, C.L. and Y.S.; formal analysis, P.J.; investigation, Y.Y.; resources, X.L. and Y.S.; data curation, Y.Y. and P.J.; writing—original draft preparation, X.L. and X.G.; writing—review and editing, P.J. and Y.Y.; visualization, X.G. and Y.Y.; supervision, C.L. and P.J.; project administration, X.L. and P.J.; funding acquisition, C.L. and Y.S. All authors have read and agreed to the published version of the manuscript.

Funding

This research was funded by China Railway First Group Second Engineering Co., Ltd. and Beijing Jiaotong University, under the collaborative project entitled “Study on Settlement Control of Ultra-Shallow-Buried Tunnel-Excavated Stations on Beijing Metro Line 13” (Project Code: C24L01730). The APC (Article Processing Charge) was also funded by this project.

Data Availability Statement

The original contributions presented in this study are included in the article. Further inquiries can be directed to the corresponding author.

Conflicts of Interest

The authors declare that they have no known competing financial interests or personal relationships that could have appeared to influence the work reported in this paper. Caijun Liu, Xiangdong Li and Yang Yang are employees of China Railway First Group Second Engineering Co., Ltd. The authors declare that this study received funding from China Railway First Group Second Engineering Co., Ltd.

Abbreviations

The following abbreviations are used in this manuscript:
PBAPile–Beam–Arch method
List of Symbols
SymbolDefinitionUnit
X,Y,Zcoordinates of Cartesian coordinate systemm
ξ, ζ, ηcoordinates of local Cartesian coordinate systemm
Hburial depth of micro soil element or tunnel sectionm
dξdηvertical section of micro soil element-
dξdζdηmicro soil element-
fprobability density function-
Pprobability-
P(dS)probability that excavation of micro soil element induces settlement at point A-
q(Z),r(Z)functions of coordinate Z-
ttime elapsed after excavations
Ωcross-sectional areas of tunnel before shrinkagem2
ωcross-sectional areas of tunnel after shrinkagem2
W(X)final surface settlement value at a point (X,0) on ground surfacem
βmain influence angle of surrounding rock°
xhorizontal distance from axis of pilot tunnelm
a,b,c,d,e,f,g,h,e′,f′,g′,hdual integration bounds-
Awidth of rectangular portion in initial state of pilot tunnel section m
Bheight of rectangular portion in initial state of pilot tunnel sectionm
Cheight of arch portion in initial state of pilot tunnel sectionm
Rradius of arch portion in initial state of pilot tunnel sectionm
Awidth of rectangular portion in pilot tunnel section after uniform shrinkagem
Bheight of rectangular portion in pilot tunnel section after uniform shrinkagem
Cheight of arch portion in pilot tunnel section after uniform shrinkagem
Aovalsemi-major axis of arch portion in pilot tunnel section after second shrinkagem
Bovalsemi-minor axis of arch portion in pilot tunnel section after second shrinkagem
ΔRuniform shrinkage displacement of sectionm
δsecond shrinkage displacement of sectionm
F(p)target function for parameters to be determined-
pparameter to be determined, where p = {tanβ,ΔR,δ}-
ε i residual between calculation and measured valuem
ε ¯ average residual of each measuring pointm
W ¯ average value of calculated resultsm
S1mean square deviation of theoretical calculationm2
S2mean square deviation of residual of calculationm2
Cpposterior variance ratio-

References

  1. Wang, J.; Gao, X.; Liu, H.; Dai, L.; Li, X.; Ren, Z.; Bai, B.; Fan, H. Characteristic analysis of tunnel collapse arch in weak rock mass. Phys. Fluids 2024, 36, 096606. [Google Scholar] [CrossRef]
  2. Wang, Q.; Wei, H.; Jiang, B.; Wang, X.; Sun, L.; He, M. High pre-tension reinforcing technology and design for ultra-shallow buried large-span urban tunnels. Int. J. Rock Mech. Min. 2024, 182, 105891. [Google Scholar] [CrossRef]
  3. Tao, Y.; Rao, J. Construction analysis of Guiyang Metro passing across Guiyang Railway Station in karst zone. Tunn. Undergr. Space Technol. 2022, 126, 104541. [Google Scholar] [CrossRef]
  4. Hui, W.; Shengjun, M.; Zimu, W.; Yuanfang, S. Study on ground settlement caused by excavation of metro parallel tunnels based on stochastic medium theory. Yangtze River 2019, 50, 182–187. [Google Scholar]
  5. Zhao, D.; Bai, J.; Chen, X.; Li, H.; He, Y.; Zhang, Q.; Liu, R. Shallow-buried subway station construction period: Comparison of intelligent early warning and optimization strategies for surface deformation risk. Tunn. Undergr. Space Technol. 2024, 153, 105978. [Google Scholar] [CrossRef]
  6. Shi, S.; Zhao, R.; Li, S.; Xie, X.; Li, L.; Zhou, Z.; Liu, H. Intelligent prediction of surrounding rock deformation of shallow buried highway tunnel and its engineering application. Tunn. Undergr. Space Technol. 2019, 90, 1–11. [Google Scholar] [CrossRef]
  7. Gang, W.; Xin-Jiang, W.; Ci, G.; Zhi, D. Study on calculation for shield tunneling-induced ground movements in clays. Rock Soil Mech. 2006, 27, 995–999. [Google Scholar]
  8. Cheng, X.; Guo, Y.; Zhu, X.; Li, W.; Hu, W.; Xu, L.; Xie, L. Analytical study on additional stress field of double shield TBM tunneling based on Mindlin theory. Appl. Math. Model. 2025, 142, 115980. [Google Scholar] [CrossRef]
  9. Lv, Z.; Yan, M.; Yuan, S.; Xia, C.; Zeng, X. Complex function stress solution of cold region tunnels under frictional contact condition of lining and surrounding rock with support delay. Appl. Math. Model. 2025, 138, 115817. [Google Scholar] [CrossRef]
  10. Jain, H.; Kumar, J. Ground displacements and stresses around a non-uniformly deforming circular tunnel in elastic media using complex variable method. Acta Geotech. 2023, 18, 2169–2193. [Google Scholar] [CrossRef]
  11. Jain, H.; Kumar, J. Displacements and stresses around a circular tunnel in an elastic medium with pseudo-static horizontal earthquake body forces. Comput. Geotech. 2023, 162, 105663. [Google Scholar] [CrossRef]
  12. Kong, F.; Lu, D.; Ma, C.; Shen, C.; Yang, X.; Du, X. Fractional viscoelastic solution of stratum displacement of a shallow tunnel under the surface slope condition. Undergr. Space 2023, 10, 233–247. [Google Scholar] [CrossRef]
  13. Fanwen, S.; Dingli, Z.; Huangcheng, F.; Acikgoz, S. Analytical solution of ground displacement responses induced by shallowly tunneling in stratum with a cavity. J. Cent. South Univ. (Sci. Technol.) 2023, 54, 1109–1120. [Google Scholar]
  14. Wang, F.; Du, X.; Li, P. Prediction of subsurface settlement induced by shield tunnelling in sandy cobble stratum. J. Rock Mech. Geotech. Eng. 2024, 16, 192–212. [Google Scholar] [CrossRef]
  15. Litwiniszyn, J. The theories and model research of movements of ground masses. In Proceedings of the European Congress Ground Movement; University of Leeds: Leeds, UK, 1957; pp. 203–209. [Google Scholar]
  16. Junsheng, Y.; Baochen, L. Ground Surface Movement and Deformation Due to Tunnel Construction by Squeezing Shield. Rock Soil Mech. 1998, 19, 10–13. [Google Scholar]
  17. Yang, J.S.; Liu, B.C.; Wang, M.C. Modeling of tunneling-induced ground surface movements using stochastic medium theory. Tunn. Undergr. Space Technol. 2004, 19, 113–123. [Google Scholar] [CrossRef]
  18. Yu, L.; Zhang, D.; Fang, Q.; Xu, T.; Luo, J.; Chen, W. Semi-analytical solutions of three-dimensional ground movements due to shallow tunnelling. Tunn. Undergr. Space Technol. 2023, 136, 105074. [Google Scholar] [CrossRef]
  19. Loganathan, N.; Poulos, H.G. Analytical prediction for tunneling induced ground movementsin clays. J. Geotech. Geoenviron. 1998, 124, 846–856. [Google Scholar] [CrossRef]
  20. Ma, M.; Yang, X.; Zhou, J.; Li, L.; Tian, J. Model tests and numerical simulations of deformation repair effect for operating shield tunnels under horizontal lateral grouting. Transp. Geotech. 2024, 47, 101277. [Google Scholar] [CrossRef]
  21. Xuan, H.; Ning, L.I. A predicting model for ground movement induced by non-uniform convergence of tunnel. Chin. J. Geotech. Eng. 2007, 29, 347–352. [Google Scholar]
  22. Gang, W.; Xinjiang, W.; Weijun, C.; Ning, Y. Prediction of Surface Settlement Induced by Shallow Excavation Tunneling. J. Munic. Technol. 2009, 27, 487–490. [Google Scholar]
  23. Zhu-Shan, S.; Xin, Z. Based on extension of stochastic medium theory prediction model for surface subsidence induced by tunnel construction. J. Chang. Univ. (Nat. Sci. Ed.) 2021, 41, 73–81. [Google Scholar]
  24. Shang, X.; Miao, S.; Wang, H.; Yang, P.; Xia, D. A prediction model for surface settlement during the construction of variable cross-section tunnels under existing structures based on stochastic medium theory. Tunn. Undergr. Space Technol. 2025, 155, 106177. [Google Scholar] [CrossRef]
  25. Wang, F.; Du, X.; Li, P. Predictions of ground surface settlement for shield tunnels in sandy cobble stratum based on stochastic medium theory and empirical formulas. Undergr. Space 2023, 11, 189–203. [Google Scholar] [CrossRef]
  26. Zhang, D.; Chen, C.; Zhang, D. Ground surface movement of Shallow-Buried Large-Sectional tunnel under Full-Ring Pipe-Jacking roof and ground freezing. Tunn. Undergr. Space Technol. 2022, 127, 104600. [Google Scholar] [CrossRef]
  27. Junsheng, Y.; Baochen, L. The prediction of ground surface settlements due to tunnelling in urban areas. Prog. Saf. Sci. Technol. 2000, II, 354–361. [Google Scholar]
  28. Baochen, L.; Jiasheng, Z. Stochastic method for ground subsidence due to near surface excavation. Chin. J. Rock Mech. Eng. 1995, 14, 289–296. [Google Scholar]
  29. Verruijt, A.; Booker, J.R. Surface settlements due to deformation of a tunnel in an elastic half plane. Geotechnique 1996, 46, 753–756. [Google Scholar] [CrossRef]
  30. Gonzalez, C.; Sagaseta, C. Patterns of soil deformations around tunnels: Application to the extension of madrid metro. Comput. Geotech. 2001, 28, 445–468. [Google Scholar] [CrossRef]
  31. Ziwen, H. Analysis of Surface Subsidence and Tunnel Stability During the Shallow Tunnelling Construction. Master’s Thesis, East China University of Technology, Fuzhou, China, 2017. [Google Scholar]
Figure 1. Schematic diagram of unit excavation impacts.
Applsci 15 07546 g001
Figure 2. Schematic diagram of pilot tunnel excavation.
Applsci 15 07546 g002
Figure 3. A schematic diagram of the shrinkage form of the tunnel section. (a) Uniform shrinkage; (b) elliptic deformation occurs on the basis of uniform radial shrinkage; (c) integral subsidence occurs during shrinkage.
Applsci 15 07546 g003
Figure 4. Shrinkage modes of horseshoe-shaped sections in ultra-shallow-buried subsurface excavation. (a) First-stage shrinkage mode; (b) second-stage shrinkage mode; (c) final-stage shrinkage mode.
Applsci 15 07546 g004
Figure 5. Schematic diagram of calculation parameter values for Kunming Rail Transit Phase I Interval Tunnel.
Applsci 15 07546 g005
Figure 6. Comparison chart of measured and calculated surface settlement for Kunming Rail Transit Phase I Interval Tunnel.
Applsci 15 07546 g006
Figure 7. Comparison chart of settlement calculation errors for Kunming Rail Transit Phase I Interval Tunnel.
Applsci 15 07546 g007
Figure 8. Schematic diagram of calculation parameter values for Xi’an Metro Line 8 Mining Method Tunnel.
Applsci 15 07546 g008
Figure 9. Comparison chart of measured and calculated surface settlement for Xi’an Metro Line 8 Mining Method Tunnel.
Applsci 15 07546 g009
Figure 10. Comparison chart of settlement calculation errors for Xi’an Metro Line 8 Mining Method Tunnel.
Applsci 15 07546 g010
Figure 11. Schematic plan.
Applsci 15 07546 g011
Figure 12. Schematic diagram of main arch soil excavation by pilot tunnel and column method.
Applsci 15 07546 g012
Figure 13. Schematic diagram of small pilot tunnel lining structure.
Applsci 15 07546 g013
Figure 14. Dimensions of small pilot tunnel grid steel frame (unit: mm).
Applsci 15 07546 g014
Figure 15. Comparison of measured and calculated ground settlements for Beijing Pilot Tunnel.
Applsci 15 07546 g015
Figure 16. Surface settlement of Beijing Pilot Tunnel.
Applsci 15 07546 g016
Figure 17. Beijing Pilot Tunnel surface tilt.
Applsci 15 07546 g017
Figure 18. Surface curvature deformation of Beijing Pilot Tunnel.
Applsci 15 07546 g018
Figure 19. Horizontal surface displacement of Beijing Pilot Tunnel.
Applsci 15 07546 g019
Figure 20. Horizontal surface deformation of Beijing Pilot Tunnel.
Applsci 15 07546 g020
Table 1. Table of uniform shrinkage integral limits for horseshoe-shaped sections.
Integration BoundArch PartRectangular Part
a H B + C / 2 H B C / 2
b H B C / 2 H + B + C / 2
c R 2 H η B + C 2 R 2 A 2
d-c-c
e H B + C / 2 + Δ R H B C / 2
f H B C / 2 H + B + C / 2 Δ R
g R Δ R 2 H η B + C 2 R 2 A 2 Δ R
h-g-g
R A 2 8 C + C 2
Table 2. Second shrinkage integral limit table of horseshoe section.
Integration BoundArch PartRectangular Part
e H B + C / 2 H B C / 2
f H B C / 2 H + B + C / 2
g A oval 1 H B + C 2 C η B oval 2 A 2
hgg
A oval A / 2
B oval C
Table 3. Back-analysis accuracy rating table.
GradeExcellentQualifiedMarginalUnqualified
Cp<0.35<0.5<0.65≥0.65
Table 4. Total mechanical parameters of traversed strata for Kunming Tunnel.
StratumElastic Modulus (MPa)Cohesion (kPa)Internal Friction Angle (°)Poisson’s Ratio
Silty Clay7.2412.815.60.28
Argillaceous Siltstone8.5514.618.70.3
Table 5. Total mechanical parameters of traversed strata for Xi’an Tunnel.
StratumElastic Modulus (MPa)Cohesion (kPa)Internal Friction Angle (°)Poisson’s Ratio
Medium Sand Layer332330.29
Table 6. Total mechanical parameters of traversed strata for Beijing Tunnel.
StratumCohesion
(kPa)
Internal Friction Angle
(°)
Coefficient of Earth Pressure at RestVertical Subgrade Coefficient Kv (MPa/m)Horizontal Subgrade Coefficient Kh (MPa/m)Characteristic Value of Foundation Bearing Capacity (kPa)
Silty Clay③31.611.80.63034.3130
Clayey Silt③114.125.40.434552.4140
Silty Fine Sand③20300.402522200
Medium Coarse Sand③30320.353530300
Pebble Gravel③40350.306560400
Disclaimer/Publisher’s Note: The statements, opinions and data contained in all publications are solely those of the individual author(s) and contributor(s) and not of MDPI and/or the editor(s). MDPI and/or the editor(s) disclaim responsibility for any injury to people or property resulting from any ideas, methods, instructions or products referred to in the content.

