Abstract
This study addresses the lack of detailed geodetic assessments of crustal strain accumulation along the central Yangsan Fault in southeastern Korea, an area of recognized but insufficiently characterized seismic potential. To tackle this, we applied elastic strain tensor analysis to GNSS data from 33 stations, forming 49 triangular elements across the fault zone. From this, we quantified areal strain (Δ), maximum shear strain (γmax), and principal stress orientations (θp, θ_γmax) to map spatial deformation heterogeneity. The results identify several high-strain zones, notably Triangle 10 (2.984 µstrain/yr), Triangle 16 (2.325), and Triangle 31 (2.452), with Triangle 16—located at the Yangsan–Ulsan Fault intersection—exhibiting pronounced shear strain and a sharp angular deviation in stress orientation. These findings reveal localized stress reorganization likely caused by fault–fault interaction. Our analysis highlights the capability of GNSS-based strain tensor modeling to detect subtle intraplate deformation. The proposed methodology offers a practical framework for pinpointing structurally sensitive fault segments with elevated seismic risk in otherwise stable continental interiors, supporting more targeted seismic hazard assessment in Korea and other intraplate regions worldwide.
1. Introduction
1.1. Scientific Background and Motivation
The accumulation and release of tectonic stress within the Earth’s crust are fundamental processes that govern earthquake occurrence. While seismic activity provides direct evidence of stress release, it is the interseismic phase—characterized by subtle yet measurable crustal deformation—that offers critical insight into stress accumulation. With the advent of high-precision Global Navigation Satellite System (GNSS) networks, researchers have been able to monitor these strain dynamics with unprecedented temporal and spatial resolution. Such geodetic techniques are increasingly recognized as essential tools for seismic hazard assessment and earthquake forecasting in both interplate and intraplate settings [1,2].
In particular, GNSS-derived strain rates have proven effective in informing probabilistic earthquake forecasts. For example, ref. [1] converted strain-rate fields into estimates of seismic moment accumulation in southwestern Japan, successfully correlating zones of elevated strain with historical seismicity. Ref. [2] further emphasized the importance of separating long-term tectonic trends from transient postseismic signals, warning that uncorrected geodetic anomalies can mislead hazard models—especially in slowly deforming regions.
While the utility of strain monitoring is well established in active plate boundary zones, its application in stable continental interiors remains limited. The Korean Peninsula, situated in an intraplate setting but with a history of moderate to large earthquakes, presents a compelling case. Of particular significance is the Yangsan Fault, a structurally complex, right-lateral strike-slip fault extending approximately 170–200 km in southeastern Korea. The fault transects both sedimentary and crystalline rocks, exhibiting wide, distributed fault zones in weaker lithologies and narrow, localized slip zones in more competent units [3].
Tectonic analysis has identified at least four major movement phases since the Late Cretaceous: an initial sinistral phase, intense Paleogene dextral activity, weak Miocene sinistral reactivation, and Quaternary dextral slip with a reverse component [4]. These phases reflect broader changes in the tectonic regime of East Asia and have resulted in a structurally segmented fault zone with differential mechanical properties and slip behaviors along strike.
Recent advances in paleoseismology have clarified the Yangsan Fault’s seismogenic potential. Ref. [5] documented at least five to six surface-rupturing earthquakes during the Holocene using three-dimensional trenching data, estimating recurrence intervals between 10,000 and 13,000 years. Ref. [6] demonstrated significant along-strike variability in rupture history, with multiple Holocene ruptures in the northern and central segments and a notable lack of such events in the south. Offshore investigations have further revealed active faulting, with [7] estimating slip rates between 0.13 and 0.73 mm/yr in the Riedel shear zones, suggesting a recurrence interval as short as 550–1500 years.
The fault’s internal architecture also supports its long-term activity and complexity. Ref. [8] reconstructed its deformation history using 3-D shape preferred orientation and illite age dating, revealing multiple reactivation episodes consistent with episodic fluid infiltration and clay mineral growth [9]. Ref. [3] found that long-term weakening processes—such as mineral alteration, fault gouge development, and clay-rich core formation—create conditions for both seismic and aseismic slip. These features promote strain localization along narrow principal slip zones, allowing stress to accumulate between major rupture events. Such localized deformation patterns are characteristic of broader active tectonic zones, where long-term stress accumulation drives complex rupture behavior.
Active tectonic zones exhibit intense crustal deformation associated with faults, folds, and fault-bounded basins. Earthquakes arise from progressive stress accumulation and rupture once fault strength is exceeded. Recurrence and rupture behavior are governed by slip rates, stress regimes, and fluid overpressure. Advances in geodetic and remote sensing techniques have enhanced the detection of surface ruptures, slip estimation, and real-time deformation monitoring, thereby improving seismic hazard assessment and risk mitigation [10,11,12,13,14,15].
Quantifying crustal deformation requires a robust mathematical framework to describe how external forces manifest as internal displacements within the lithosphere. In continuum mechanics, this relationship is captured through stress and strain tensors, which represent the internal force and geometric deformation states, respectively. These second-order tensors are fundamental in describing the spatial distribution and orientation of tectonic forces acting on the Earth’s crust.
The strain tensor encapsulates the relative displacement between infinitesimal elements of a deforming body, accounting for both extensional and shear components. Likewise, the stress tensor describes the internal traction forces per unit area acting on arbitrary planes within a material. Together, these tensors provide the theoretical basis for deriving principal directions of deformation and interpreting geodetic measurements such as GNSS displacement vectors.
For example, the episodic and decadal strain anomalies observed before the 2011 Tohoku-Oki earthquake suggest that such geodetic indicators can serve as valuable precursors to large seismic events [16,17,18].
1.2. Regional Seismotectonic Context of the Korean Peninsula
These microstructural and geochemical characteristics underscore the potential for episodic fault reactivation under varying stress conditions. Notably, recent studies on intraplate deformation in stable continental interiors—such as northwestern Iberia [19], southeastern France [20], and central Australia [21]—demonstrate that inherited fault structures, lithological contrasts, and far-field stress transmission can drive localized deformation even in tectonically quiescent settings. These findings challenge the conventional view of continental interiors as mechanically dormant and highlight the importance of characterizing stress accumulation and strain localization mechanisms in such regions.
Although such intraplate settings are often underestimated in terms of seismic hazard, the Korean Peninsula exhibits similar geological traits, such as inherited fault systems and heterogeneous crustal composition.
In this context, the Korean Peninsula, often classified as a stable intraplate region, may still harbor structurally inherited faults capable of storing and releasing tectonic stress over geologic timescales. Therefore, comprehensive investigations that integrate geodetic strain measurements, microstructural analysis, and regional geomechanical modeling are essential to accurately assess long-term seismic potential and develop effective earthquake preparedness strategies.
This geomechanical evidence is further substantiated by historical records, which provide direct observations of past seismic activity along the fault.
Historical earthquake records further corroborate the seismogenic potential of the Yangsan Fault. The Annals of the Joseon Dynasty report a significant seismic event in 1643 CE (reign of King Injo), during which surface rupturing and groundwater upwelling were observed in the Ulsan region, accompanied by a tsunami. Another major earthquake was documented in 1681 CE (reign of King Sukjong), and both events are estimated to have exceeded a moment magnitude (Mw) of 6.5. Based on such historical accounts, some researchers have proposed a recurrence interval of approximately 400 years for large-magnitude earthquakes along the fault. However, this hypothesis remains tentative and has not yet been established as a consensus within the geoscientific community.
Geophysical data provide further insight into the fault’s segmentation and crustal environment. Ref. [22] used gravity field interpretation to detect significant variations in density and structural depth along the fault, particularly in the central segment, indicative of complex interactions with surrounding tectonic features such as the Yeonil Tectonic Line. These structural discontinuities may act as barriers or triggers for rupture propagation, influencing earthquake magnitudes and rupture extents.
Although the Korean Peninsula lies within a tectonically stable intraplate setting, recent moderate earthquakes—such as the 2016 Mw 5.8 Gyeongju and 2017 Mw 5.4–5.5 Pohang events—demonstrate active faulting in southeastern Korea. This region, which hosts most of the nation’s nuclear power infrastructure, requires high-resolution deformation monitoring and seismic hazard assessment to ensure disaster preparedness and structural resilience.
To this end, high-resolution geomorphic and structural mapping techniques have been increasingly employed to delineate active fault systems with greater precision. In particular, LiDAR-based analyses have proven effective for identifying fault scarps and subtle geomorphic offsets in Korea. For instance, ref. [23] utilized high-resolution digital elevation models (DEMs) to map surface features along the central Yangsan Fault, which were subsequently integrated with trenching and geochronological data by [24] to construct segment-based rupture scenarios for regional seismic hazard modeling.
1.3. Research Gap and Objectives
While such studies offer valuable qualitative insights into fault segmentation and paleo-rupture behavior, they do not capture the contemporary deformation processes that are critical for assessing ongoing strain accumulation. To address this gap, the present study utilizes dense GNSS velocity fields to quantify contemporary strain rates across the Yangsan Fault system. By analyzing spatial patterns of crustal strain, we aim to assess the degree of stress buildup in different fault segments and evaluate their seismogenic potential. This geodetic approach complements previous geomorphic and paleoseismic investigations and contributes to a more comprehensive understanding of the fault’s current tectonic state.
Together, these studies reveal that the Yangsan Fault is not only structurally segmented and long-lived but also capable of producing large-magnitude earthquakes despite its intraplate setting. Its complex deformation history, diverse lithological controls, and evidence for both seismic and aseismic behavior make it an ideal natural laboratory for strain-based seismic risk analysis.
In light of these insights, the present study aims to quantify crustal strain evolution in southeastern Korea over a two-year period using a high-density GNSS network anchored to national geodetic control points. By computing strain tensors from GNSS baseline vectors through elastic theory and least-squares estimation, we extract spatial and temporal variations in principal strain, maximum shear, and areal dilation. Special attention is directed toward the Yangsan Fault and its surroundings, allowing us to evaluate the consistency between geodetically inferred stress accumulation and known patterns of historical and paleoseismic activity.
This integrative approach—linking geodetic strain modeling with fault structural analysis and seismic records—contributes to the development of early warning indicators and long-term seismic forecasting models in stable continental regions. It also enhances our understanding of fault zone processes that govern earthquake recurrence and deformation localization, offering crucial insights for national-scale seismic hazard assessment in the Korean Peninsula.
1.4. Study Areas
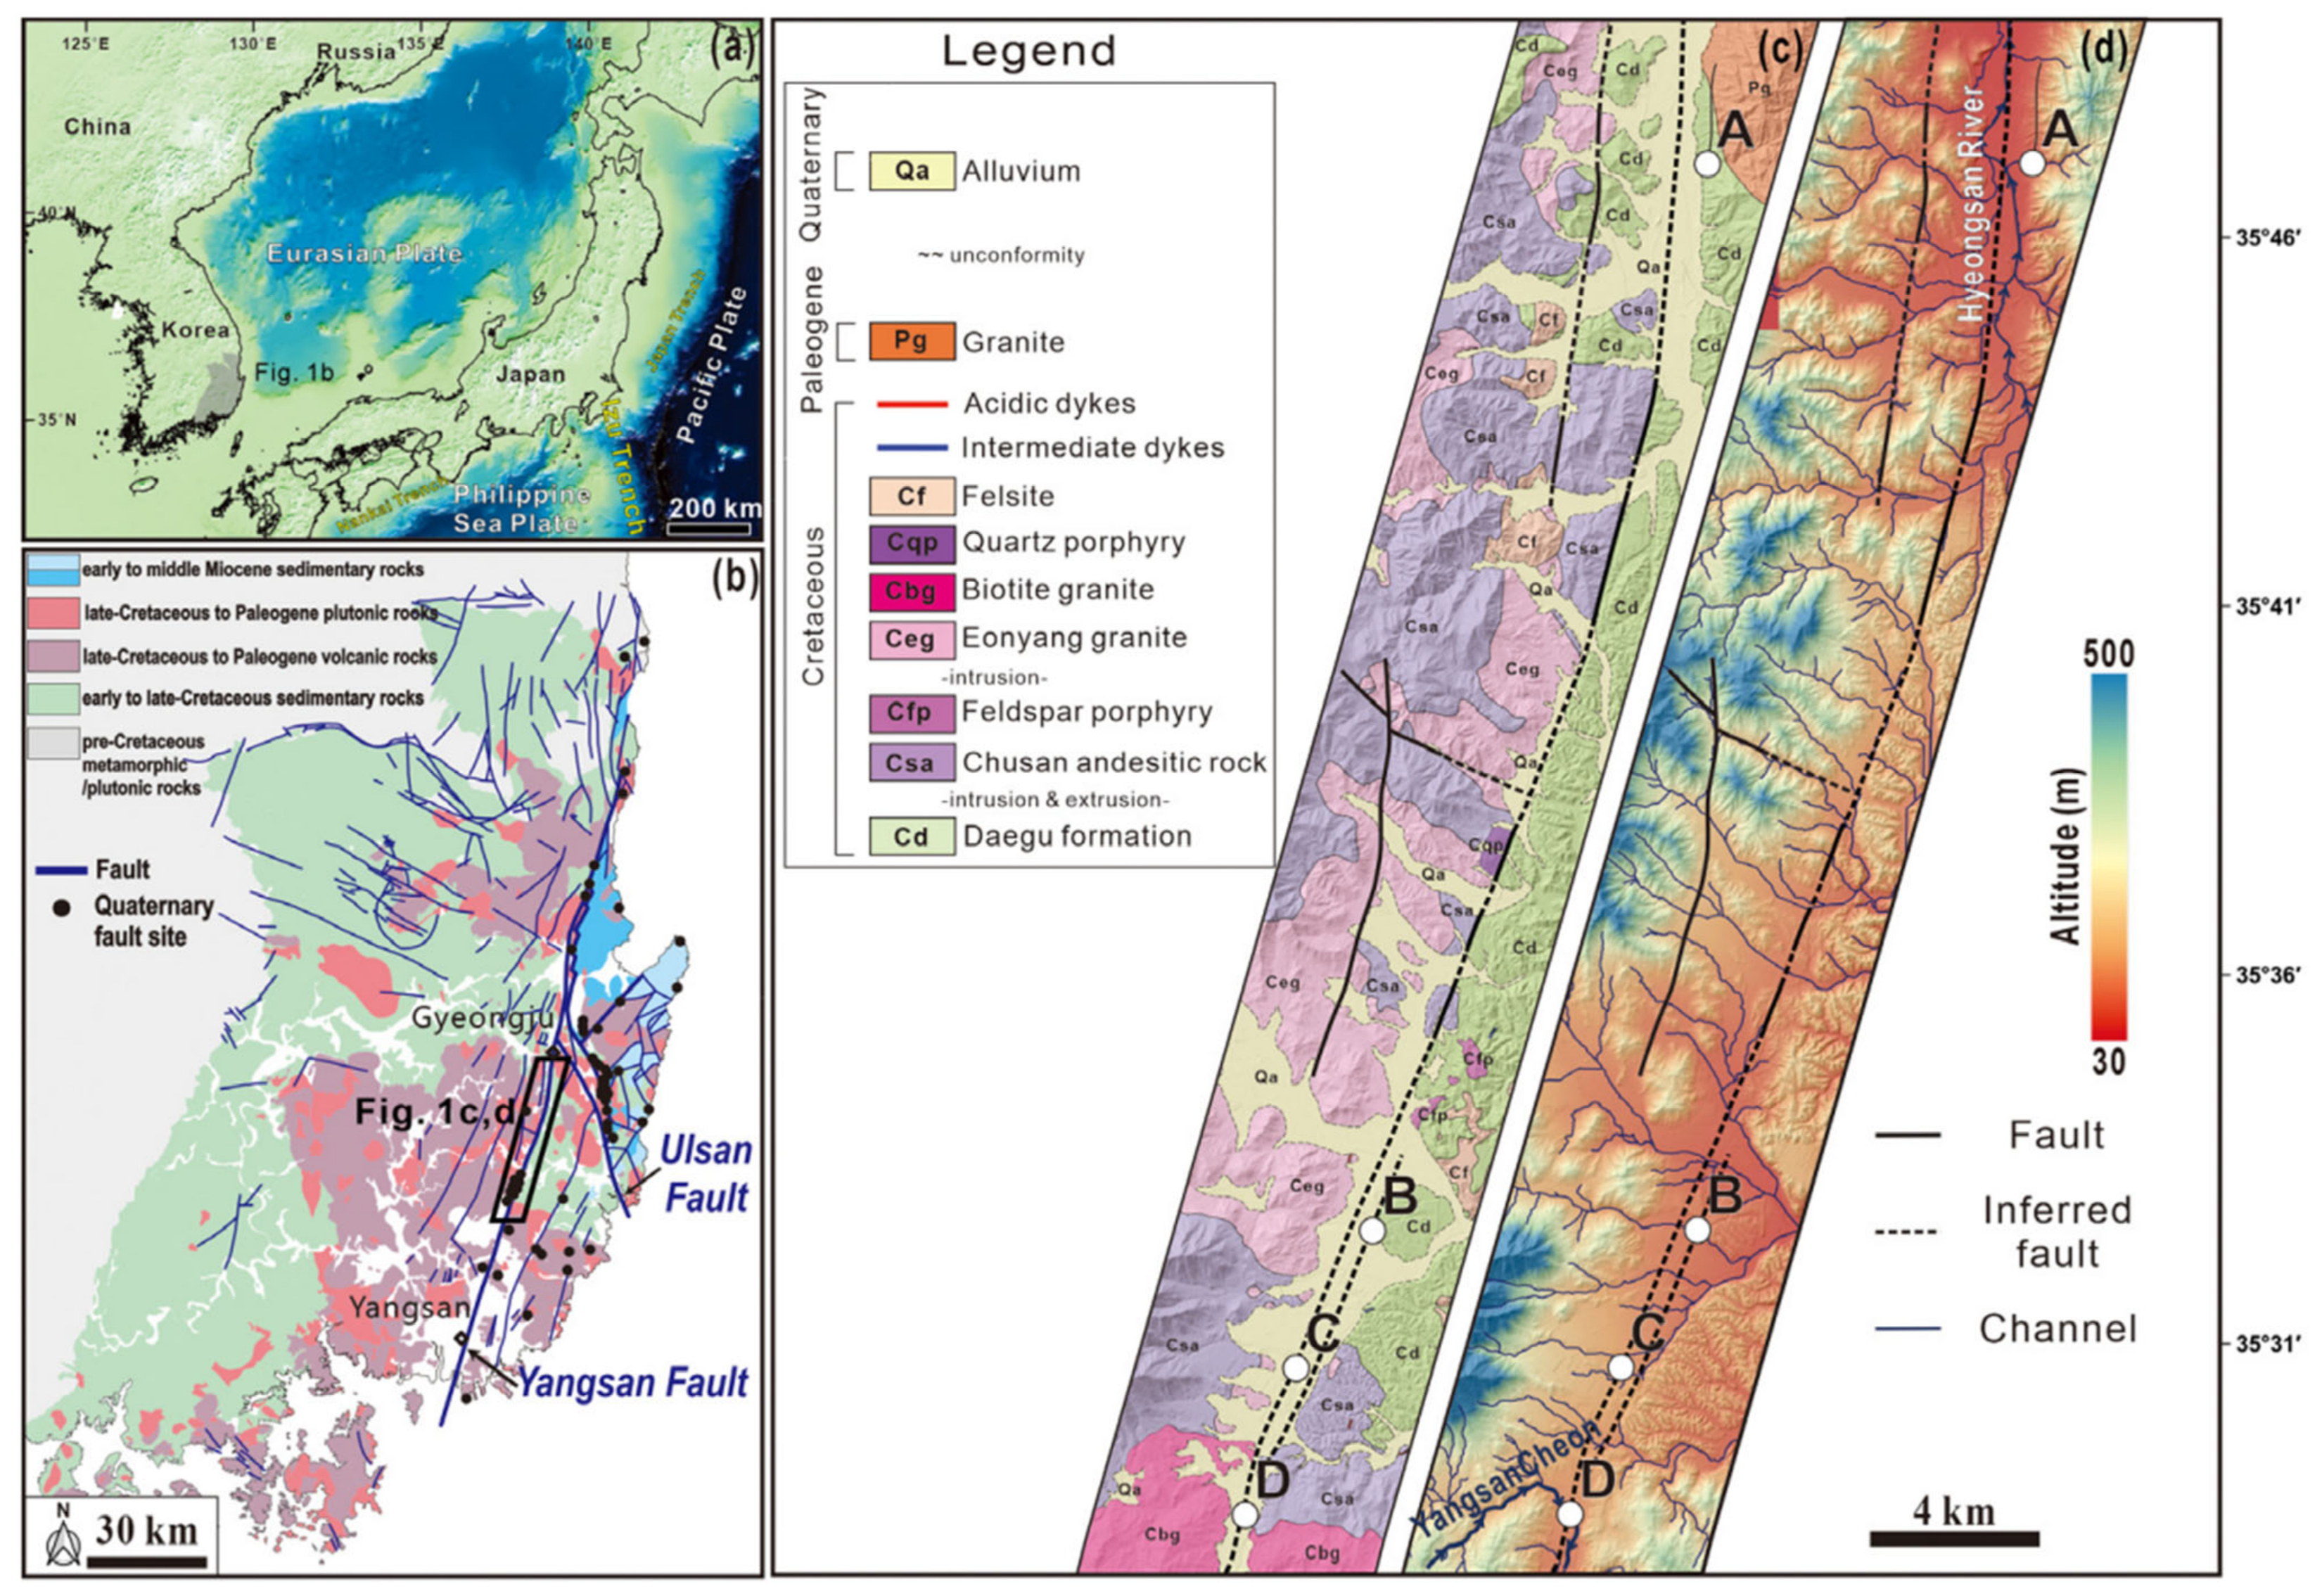
This study focuses on the central to southern segment of the Yangsan Fault Zone in the Gyeongsang Basin, southeastern Korea. This region is particularly well-suited for investigating crustal strain and fault-zone behavior due to the combination of active faulting, complex lithological variation, and clear structural expression. As shown in Figure 1a [25], the study area lies on the eastern margin of the Eurasian Plate, adjacent to complex tectonic boundaries involving the Philippine Sea Plate and Pacific Plate.
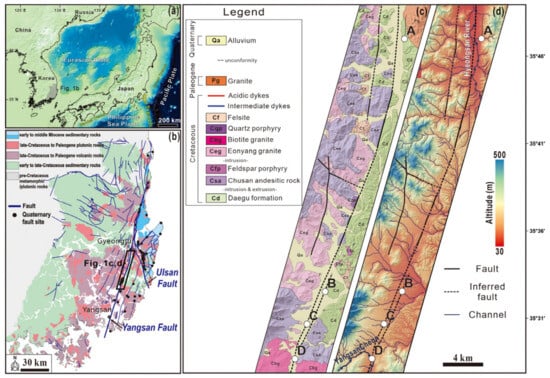
Figure 1.
(a) Simplified tectonic map around the Korean Peninsula. (b) Regional geological map around the Gyeongsang Basin, SE Korea (modified from [25,26]). (c) Detailed geological map of the central-southern Yangsan Fault (modified from [27,28,29]), showing lithology and major fault traces. (d) Digital elevation model (DEM) displaying the drainage system and fault distribution in the study area. Investigation sites A, B, C, and D marked in both (c,d), are locations where surface displacements associated with the Yangsan Fault were previously investigated by [30].
The regional geological framework (Figure 1b) is based on the geological maps from [25,26], showing a distribution of Mesozoic to Cenozoic volcanic, plutonic, and sedimentary rocks dissected by the Yangsan and Ulsan Fault systems. The Yangsan Fault, in particular, cuts across Late Cretaceous to Paleogene rock units, indicating a long-lived and complex deformation history.
A detailed geological map of the study area (Figure 1c), revised from the foundational works of [27,28,29], reveals that the fault traverses various lithologies, including the Eonyang granite (Ceg), Chusan andesitic rocks (Csa), and Daegu formation (Cd). These lithological variations are closely linked to differences in fault architecture and deformation style observed along the fault zone.
A high-resolution digital elevation model (DEM; Figure 1d) further illustrates the geomorphic expression of the fault and its influence on the drainage network. Major streams, such as the Hangsancheon River, align with mapped and inferred fault traces, suggesting a strong tectonic control on surface morphology. The DEM serves as a critical dataset for geomorphic and structural analyses in this study.
Figure 1b illustrates the Yangsan and Ulsan faults, both of which are major left-lateral strike-slip faults that transect a variety of geological units across the region. The map reveals the spatial distribution of distinct lithological domains, including middle Miocene sedimentary rocks (light blue), Late Cretaceous plutonic rocks (pink), volcanic rocks (purple), Early to Late Cretaceous sedimentary rocks (light green), and pre-Cretaceous metamorphic and plutonic rocks (gray). The crosscutting relationships between these geological units and the fault traces highlight the complex structural framework and the spatiotemporal evolution of fault activity in the region.
Figure 1c depicts the heterogeneous distribution of Cretaceous and Paleogene igneous and sedimentary rocks, offering key insights into intrusive and extrusive magmatic processes. Notably, lithological boundaries are sharply defined along fault zones, underscoring the role of these faults as structural boundaries. This spatial contrast in rock assemblages across the faults reflects the tectono-thermal history of the area and provides critical evidence for interpreting the regional crustal deformation and structural segmentation associated with intraplate fault systems.
2. Materials and Methods
2.1. Fundamentals of Elastic Theory in Lithospheric Mechanics
This study adopts a geodetic approach grounded in elastic theory to quantify crustal deformation along the Yangsan Fault. Elastic mechanics, based on Hooke’s law, assumes linear stress–strain behavior in an isotropic, homogeneous medium, expressed as follows:
where σ and ε are the stress and strain tensors, respectively, and λ, μ are the Lamé constants [31,32]. While real crustal conditions are often heterogeneous and anisotropic [33,34,35,36,37,38], this first-order approximation remains effective for interpreting interseismic strain accumulation.
We employed the elastic rebound theory [32,39,40,41] to understand the stress release process during fault rupture and to infer seismic potential from GNSS-derived deformation. GNSS campaign data from 33 stations were processed using GAMIT/GLOBK v.(10.70) and Bernese v.(5.2) software packages to obtain surface velocities. A Delaunay triangulation was constructed to form 49 non-overlapping triangles, enabling regional strain field resolution.
Strain tensors were calculated using least-squares inversion, yielding maximum shear strain (γmax), areal strain (Δ), and principal stress directions (θp, θ_γmax). Invariants derived from 2D elasticity formulations are used to highlight tectonically sensitive zones. Interpolation and uncertainty quantification techniques were applied to enhance spatial continuity [42,43,44]. The resulting framework enables identification of localized strain anomalies relevant to seismic hazard mapping, particularly in stable intraplate regions like Korea [32].
2.2. Mathematical Representation of Strain and Stress Tensors
Quantifying crustal deformation requires a robust mathematical framework to describe how external forces manifest as internal displacements within the lithosphere. In continuum mechanics, this relationship is captured through stress and strain tensors, which represent the internal force and geometric deformation states, respectively. These second-order tensors are fundamental in describing the spatial distribution and orientation of tectonic forces acting on the Earth’s crust.
The strain tensor encapsulates the relative displacement between infinitesimal elements of a deforming body, accounting for both extensional and shear components. Likewise, the stress tensor describes the internal traction forces per unit area acting on arbitrary planes within a material. Together, these tensors provide the theoretical basis for deriving principal directions of deformation and interpreting geodetic measurements such as GNSS displacement vectors.
In geodetic applications, these tensor quantities are typically derived from differential GNSS observations using linear elasticity assumptions. The decomposition of these tensors into principal values and directions enables the identification of regional strain patterns, fault kinematics, and potential zones of seismic hazard. As such, understanding their mathematical structure is essential for the application of geophysical models to real-world tectonic systems [45,46,47,48,49,50].
In two-dimensional Cartesian coordinates, the strain tensor ε is represented as follows:
where εxx and εyy are the normal strain components along the x and y directions, respectively, and εxy is the shear strain component. These quantities are derived from spatial derivatives of displacement fields:
where u(x, y) and v(x, y) represent horizontal displacements in the x and y directions, typically obtained from GNSS baseline vectors. This formulation assumes infinitesimal strain, appropriate for tectonic deformation measured over yearly timescales.
The corresponding stress tensor σ under linear elasticity is given by Hooke’s law for plane stress conditions:
where E is Young’s modulus and ν is Poisson’s ratio. These material parameters are typically estimated from seismic velocity models or laboratory experiments on crustal rock samples. Using these values, the individual components of the stress tensor under plane stress conditions are calculated as follows:
where
σxx, σyy—normal stress components
σxy—shear stress component
εxx, εyy—normal strain components
εxy—shear strain component
E—Young’s modulus
ν—Poisson’s ratio
For tectonic interpretation, the principal strain components ε1 and ε2 are obtained as eigenvalues of the strain tensor, with corresponding eigenvectors indicating the directions of maximum and minimum strain. The maximum shear strain is computed as follows:
and the dilatation (or volumetric strain) as follows:
These scalar quantities offer valuable geophysical insights—maximum shear strain is associated with faulting potential, while dilatation reflects crustal shortening or extension. The orientation of the principal axes can also be used to infer tectonic stress regimes and kinematic characteristics of active faults. The visual representations corresponding to Equations (2)–(7) are provided in Appendix A to support the conceptual understanding of the strain components and their geometric interpretations.
2.3. Derivation of Strain from GNSS Baseline Vectors
The expansion of dense and continuous GNSS observation networks has facilitated precise monitoring of surface displacements across both tectonically active and stable regions. In geodetic strain analysis, these displacements are represented as baseline vectors between GNSS stations, where temporal variations reflect the accumulation of crustal deformation.
Strain tensors are derived by converting spatial velocity gradients calculated from GNSS baseline time series, based on the assumptions of linear elasticity. This process enables the construction of regional strain fields and contributes to the understanding of tectonic loading patterns and potential zones of strain concentration.
Reliable strain field estimation typically requires multiannual velocity data, generally spanning six to seven years, processed using established software packages such as GAMIT/GLOBK or Bernese. These outputs are expressed within globally or regionally consistent reference frames, including ITRF2020 and GSRM v2.1, to ensure compatibility and accuracy [51,52,53]. However, methodological differences and reference frame selection may introduce discrepancies, particularly in spatially dense station arrays, thereby necessitating thorough cross-validation and quantitative uncertainty assessment [32,51,53,54,55].
Based on this processing framework, the present study computed the satellite-based displacement of five continuously operating reference stations over a ten-year period. As described in Section 3.1, the derived results were compared against the tectonic velocity models of ITRF2020, GSRM v2.1, and APKIM2005-IGN.
2.4. Optimal Triangulation Network Design
Accurate estimation of crustal strain rates from GNSS velocity fields critically depends on the spatial configuration of observation stations. A widely adopted method involves dividing the study region into non-overlapping triangular elements, within which strain tensors are calculated. However, the geometric quality of these triangles—particularly internal angles and aspect ratios—directly affects the numerical stability and spatial reliability of the strain estimates. Elongated or narrow triangles with acute angles are prone to instability and error amplification.
To mitigate these limitations, this study employs Delaunay triangulation, which maximizes the minimum internal angle of each triangle and avoids poorly shaped elements, thereby improving geometric regularity. This method enhances the robustness and accuracy of strain field computations, particularly in areas with uneven GNSS station distribution. In contrast to interpolation techniques such as kriging, inverse distance weighting (IDW), or spline functions, which often overlook triangulation geometry or introduce smoothing effects, the Delaunay approach preserves the spatial configuration of the observation network and retains local deformation signals.
Delaunay triangulation is also compatible with probabilistic and Bayesian modeling frameworks increasingly used in modern geodetic analyses to quantify uncertainty in strain fields. Its ability to adaptively preserve resolution in dense areas while minimizing interpolation artifacts in sparse regions makes it particularly effective for tectonic applications [54,56,57,58].
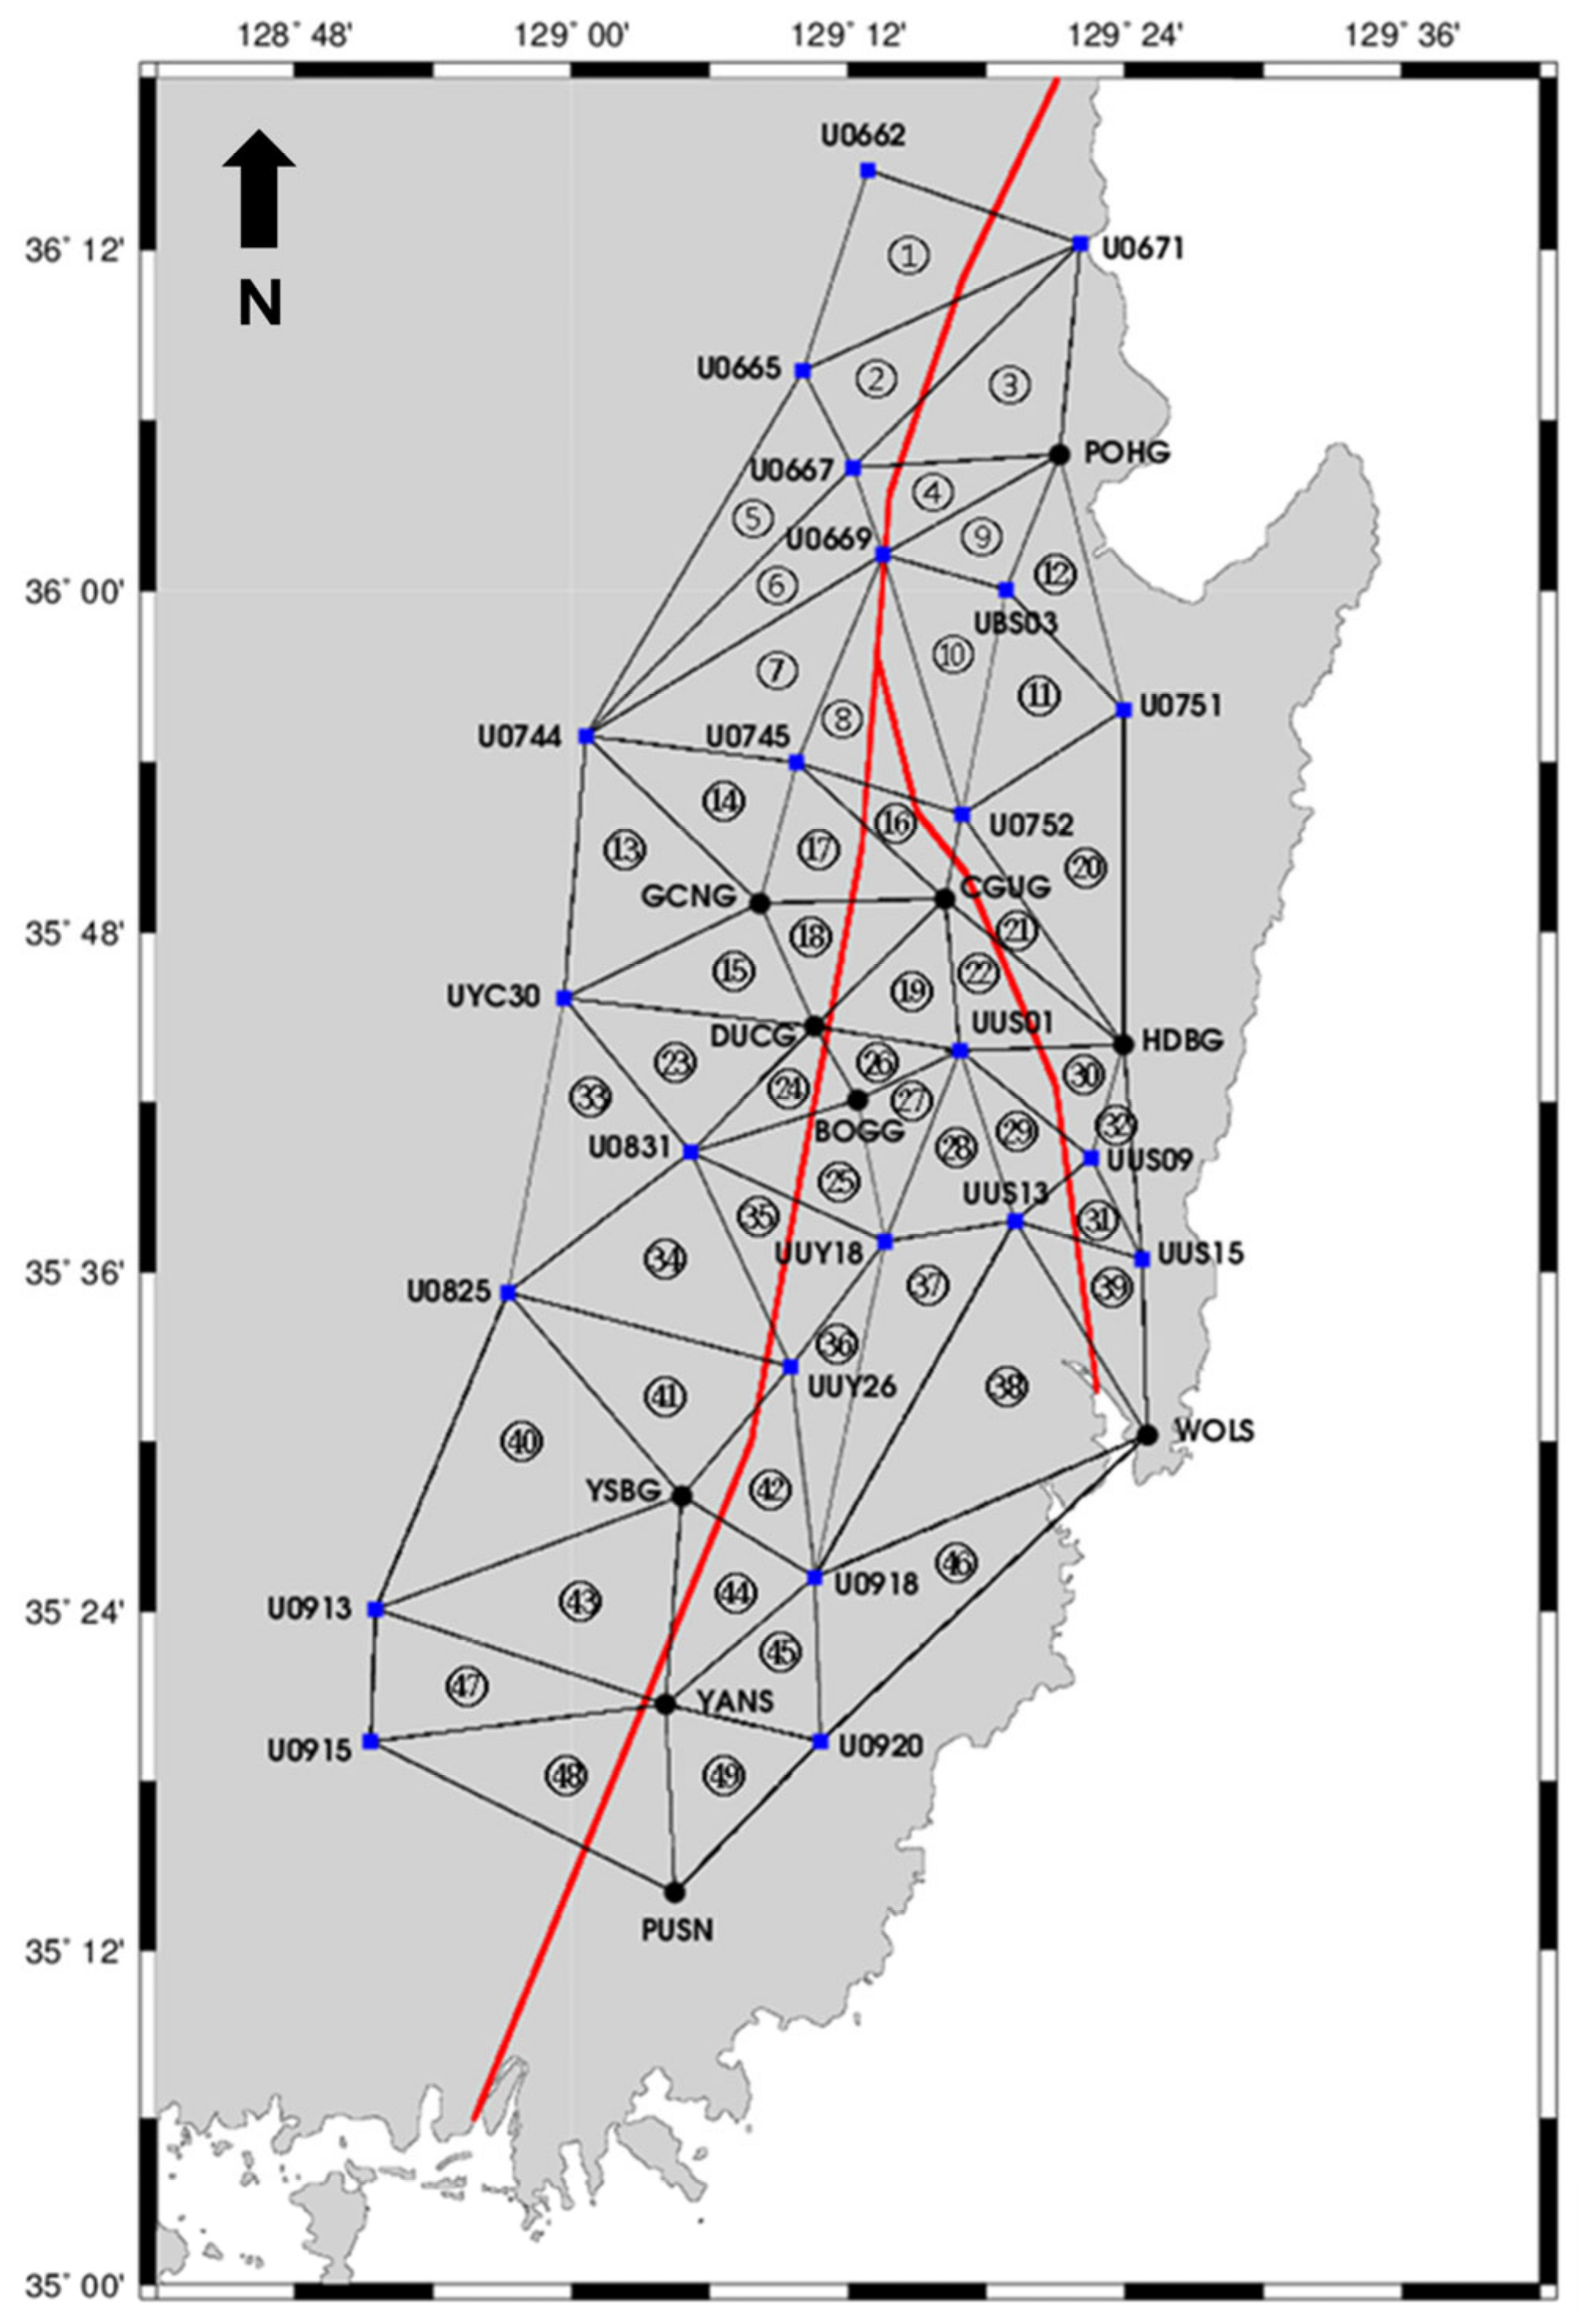
In this study, a total of 49 non-overlapping triangles were constructed using 33 GNSS stations—23 from the national Continuously Operating Reference Station (CORS) network and 10 additional campaign-mode sites. This configuration ensures dense spatial coverage across the southeastern Korean Peninsula, particularly near major fault systems.
Figure 2 shows the constructed triangulation network. Blue squares denote permanent CORSs, while black circles represent temporary campaign stations deployed to improve spatial resolution. Red lines mark the Yangsan (west) and Ulsan (east) Faults—both seismically active and structurally significant. Triangles are indexed (1–49) to enable spatially resolved analysis. Notably, attention was given to the fault-intersection zone, where crustal strain is expected to localize due to fault interaction dynamics.
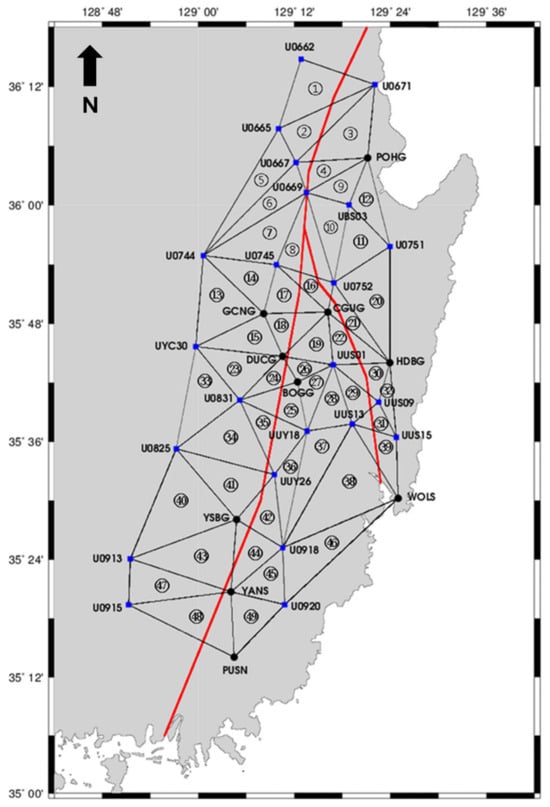
Figure 2.
Triangular network constructed from 33 GNSS stations, including 23 geodetic control points (blue squares) and 10 CORS (black circles). A total of 49 non-overlapping triangles were formed and numbered for localized strain rate analysis. The red lines represent major active faults: the western line corresponds to the Yangsan Fault, and the eastern line to the Ulsan Fault, in the southeastern Korean Peninsula.
This triangulation forms the geometric foundation for two-dimensional strain tensor computation and provides a high-resolution basis for analyzing crustal deformation and assessing seismic hazard in southeastern Korea.
2.5. Data Collection
To investigate recent crustal deformation in the southeastern Korean Peninsula, GNSS surveys were conducted at 23 geodetic control points that form part of the national crustal deformation monitoring network. The most recent campaign was carried out in June 2020, and the collected GNSS data were processed using the precise geodetic analysis software GAMIT/GLOBK (version 10.70) to compute horizontal coordinates.
These 2020 results were compared with those from two previous GNSS surveys conducted at the same sites: the second campaign on 17 September 2018 and the first campaign on 26 February 2019. All three datasets were processed using consistent software and analysis strategies to ensure compatibility in the temporal comparisons. From these results, horizontal coordinate differences (Δx, Δy, Δt) were calculated to quantify short-term crustal displacement at each site.
To further assess crustal strain across active fault systems, two triangulated GNSS networks were established for comparative analysis. In the first case, 32 triangular elements were constructed by connecting 6 satellite control stations and 17 integrated geodetic control points from the 2020 and 2018 datasets. In the second, a denser network of 49 triangles was created using 10 satellite stations and 23 control points. For both configurations, all baselines were converted to geodesic lines prior to strain computation, and baseline strains were calculated for east–west-oriented segments that intersect major fault zones. These two network resolutions enabled a multi-scale assessment of deformation patterns and spatially variable strain accumulation across the southeastern Korean Peninsula.
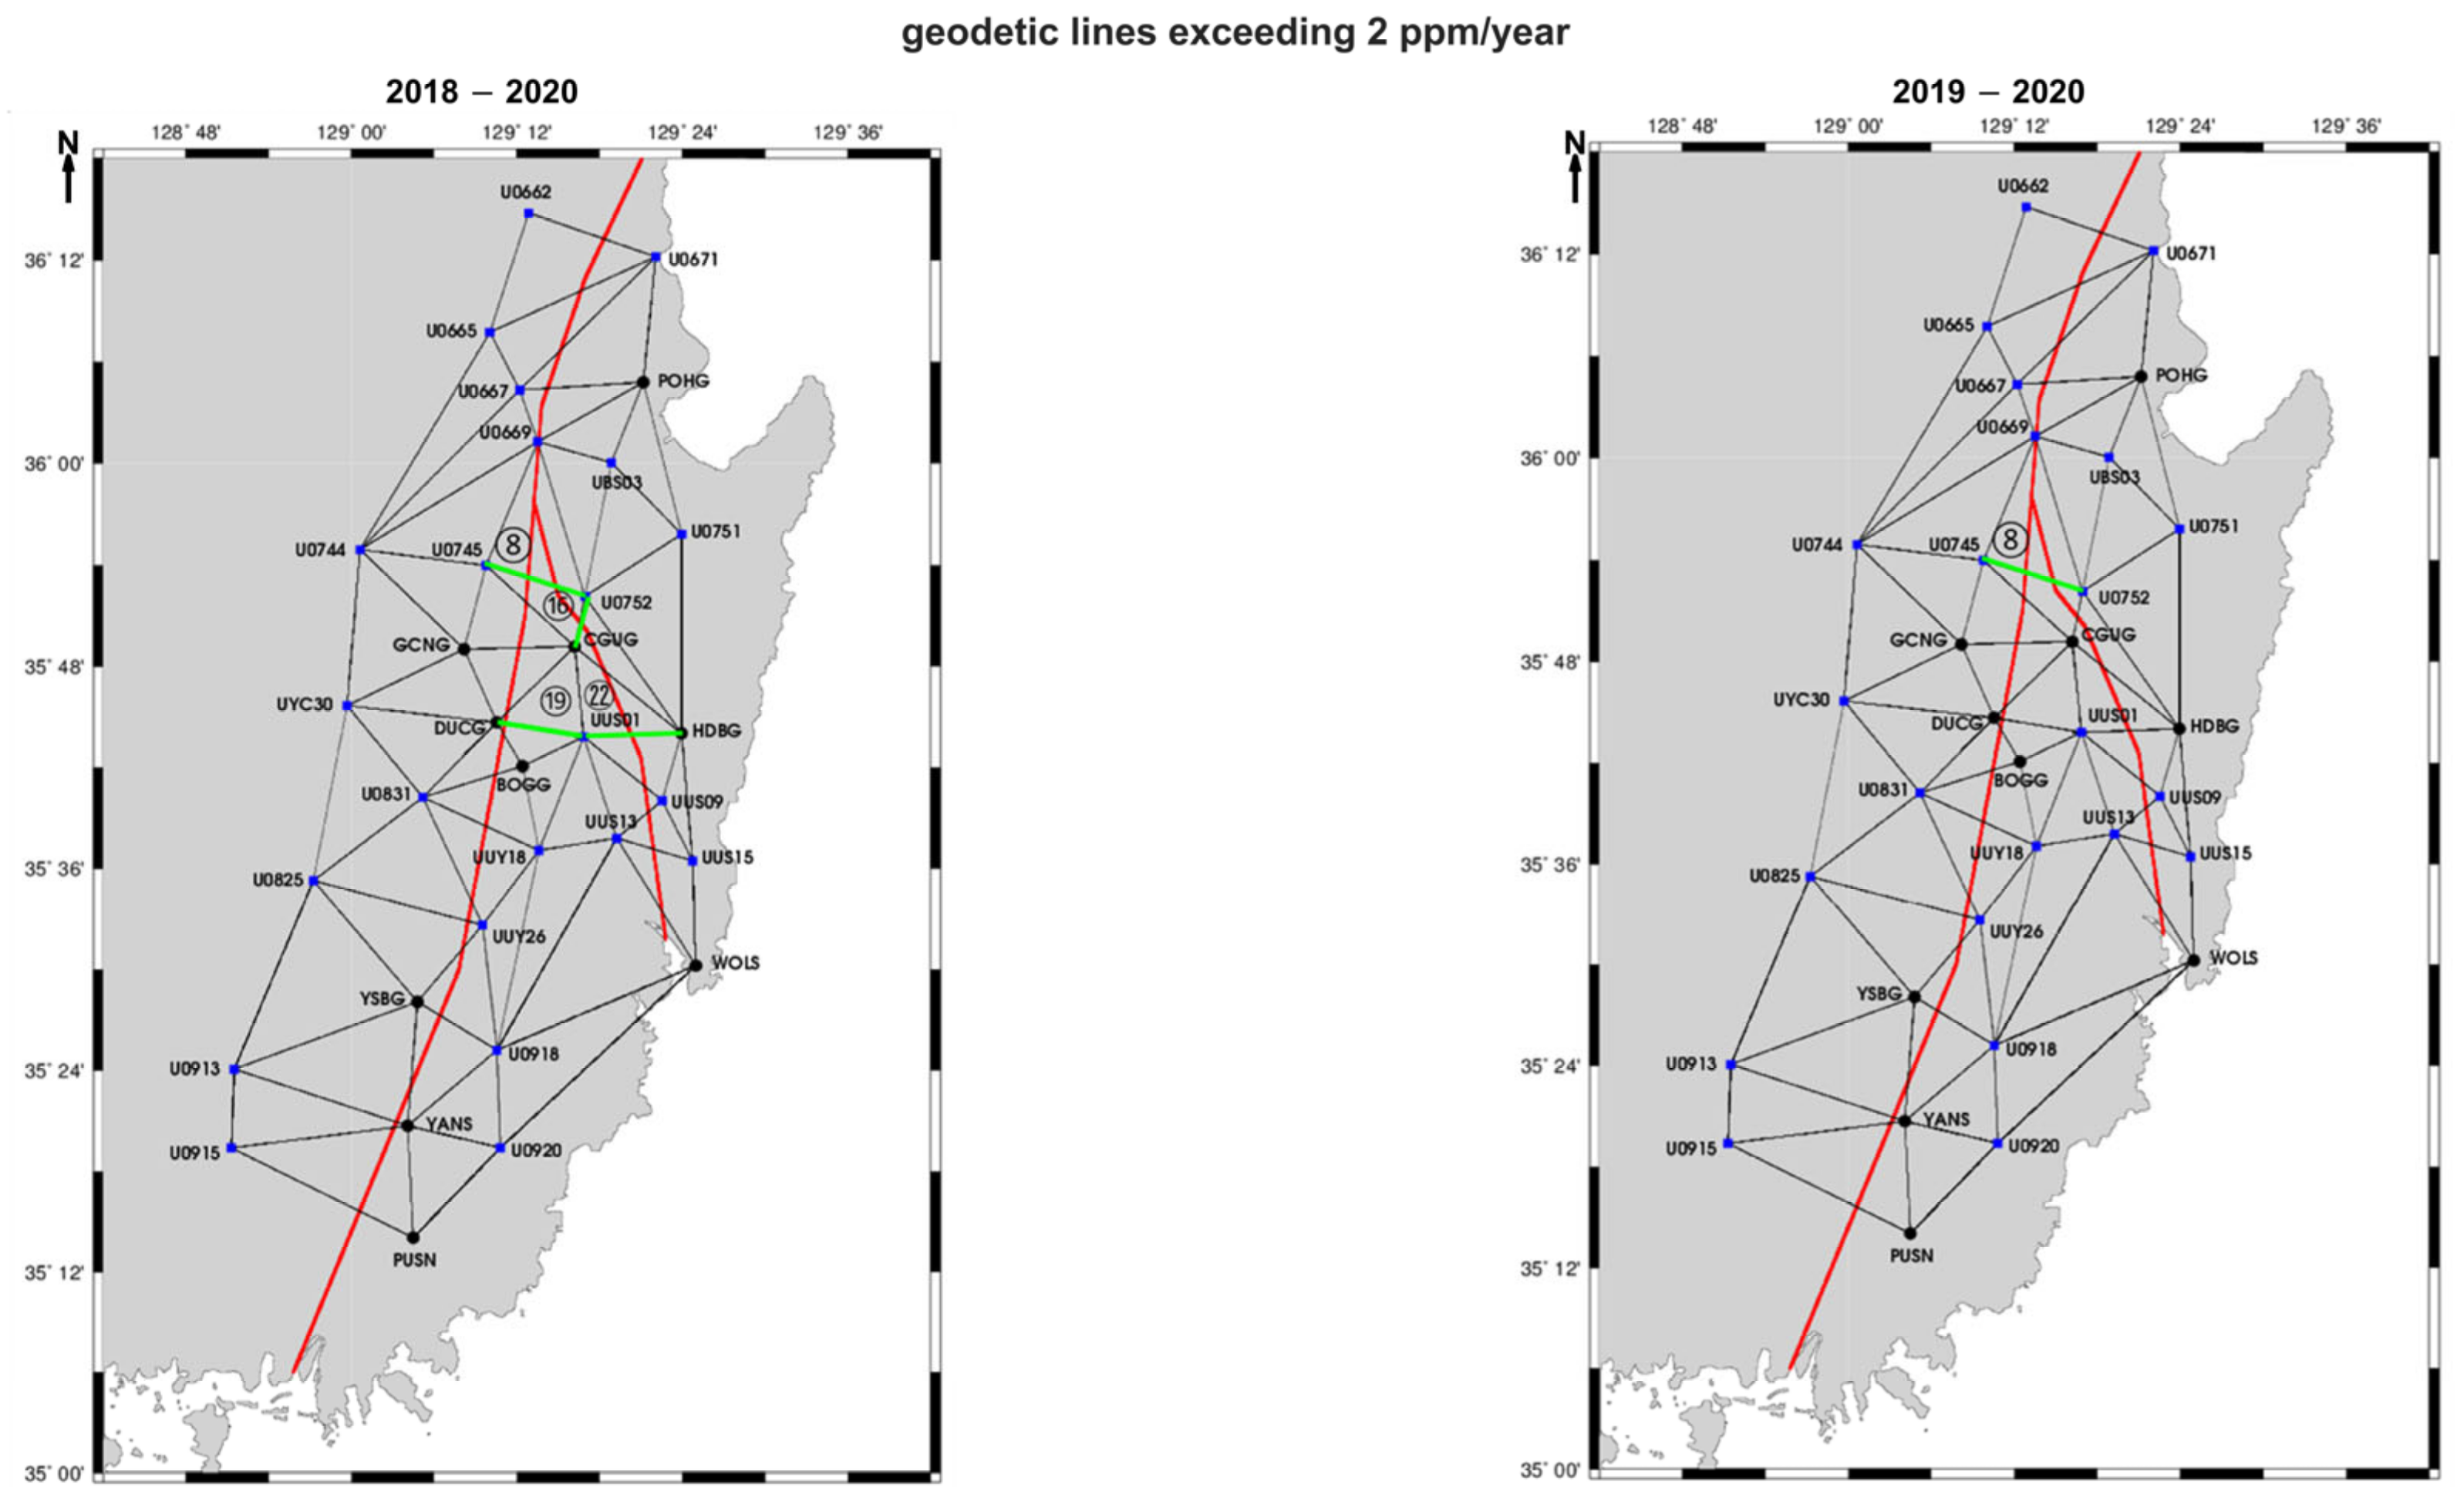
To highlight zones of significant deformation, geodetic lines exhibiting strain rates exceeding 2 ppm/year were extracted and visualized (Figure 3). The maps compare two consecutive observation periods (2018–2020 and 2019–2020), allowing for the identification of spatial and temporal variations in strain concentration. These high-strain-rate baselines were identified and flagged for subsequent spatial analysis, focusing on the central segment of the Yangsan Fault where concentrated strain values were observed.
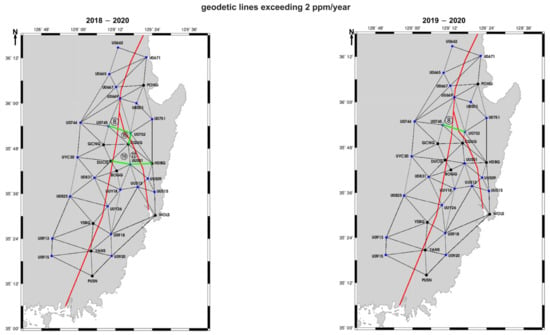
Figure 3.
Geodetic baselines exhibiting strain rates exceeding 2 ppm/year during two observation periods: 2018–2020 (left) and 2019–2020 (right). Red lines correspond to high-strain-rate baselines that predominantly trace the Yangsan and Ulsan Fault systems. Green triangles highlight specific geodetic subnetworks (Triangles 8, 16, 19, and 22) where elevated strain was detected during the 2018–2020 interval. Among these, only the U0745–U0752 baseline within Triangle 8 continued to exhibit strain rates exceeding 2 ppm/year during the 2019–2020 interval. The network includes 23 geodetic control points (blue squares) and 10 CORS (black circles).
During the 2018–early 2020 period, baseline strain rates exceeding 2 ppm/year were observed along the following lines: U0745–U0752 in Triangle 6, CGUG–U0752 in Triangle 16, DUCG–UUS01 in Triangle 19, and UUS01–HDBG in Triangle 22. In contrast, during the 2019–early 2020 period, only the U0745–U0752 baseline in Triangle 6 exhibited strain rates exceeding 2 ppm/year.
2.6. Workflow for GNSS-Based Strain Field Generation and Seismic Hazard Zonation
To systematically assess crustal deformation and its implications for seismic hazard, this study developed a multi-step analytical framework that integrates geodetic data processing, strain tensor computation, and hazard mapping. The approach leverages high-resolution GNSS observations to quantify spatial patterns of tectonic stress and identify structurally sensitive regions.
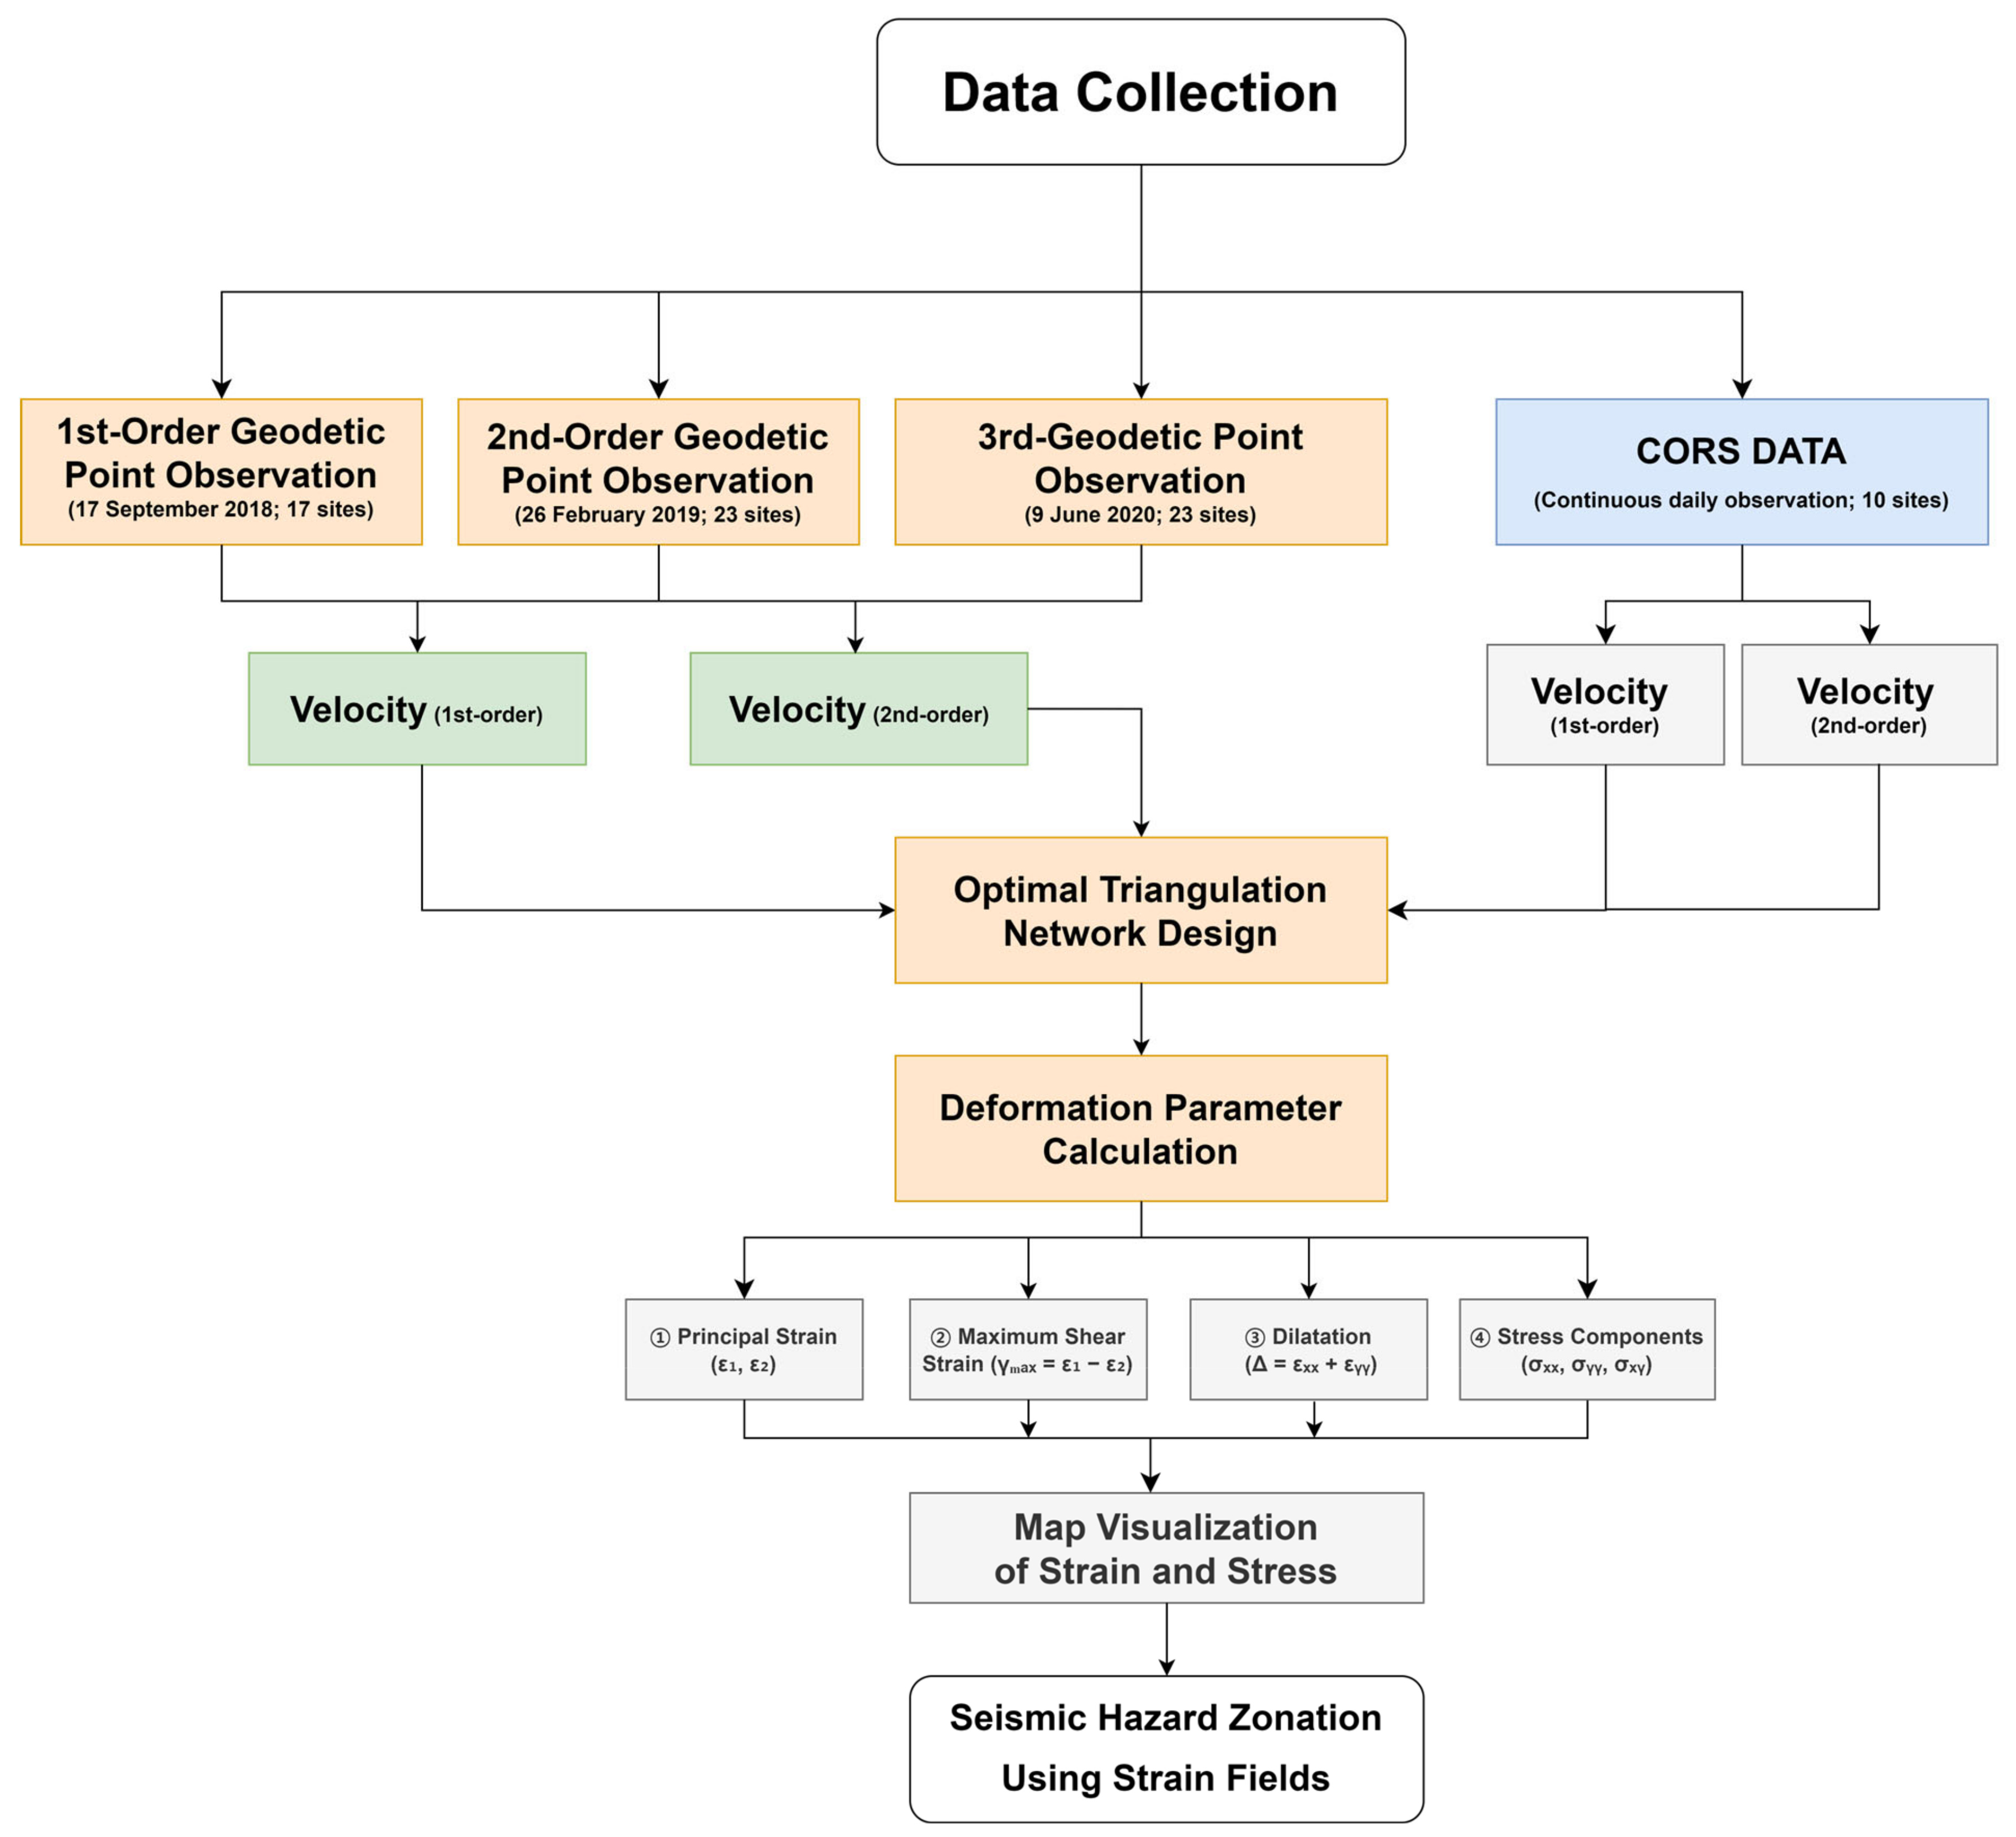
Figure 4 illustrates the comprehensive workflow adopted in this study to assess seismic hazards through GNSS-derived strain field analysis. The process begins with three discrete geodetic campaign surveys (1st-, 2nd-, and 3rd-order observations) and continuous CORS (Continuously Operating Reference Stations) data collection. These datasets are used to compute horizontal velocity vectors, which serve as the basis for constructing an optimized triangulated geodetic network.
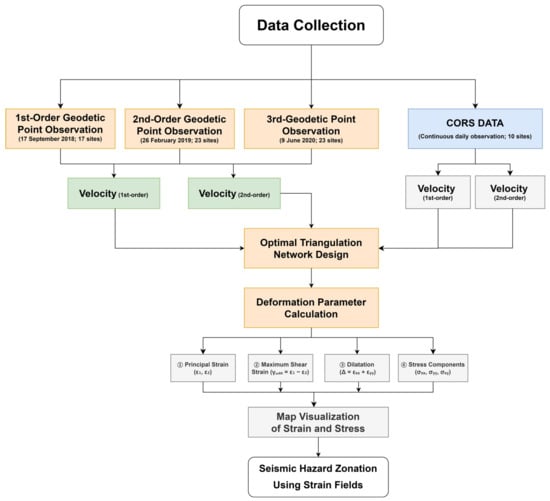
Figure 4.
Workflow diagram of the crustal deformation analysis. The process includes data collection from geodetic point observations and CORSs, velocity estimation, optimal triangular network design, and deformation parameter calculation. Derived parameters include principal strain, maximum shear strain, dilatation, and stress components. The final outputs include spatial visualization of strain and stress fields and seismic hazard zonation based on strain field interpretation.
Subsequently, strain tensor parameters are calculated for each triangular element, yielding key deformation metrics, including principal strain components (ε1, ε2), maximum shear strain (γmax), areal dilation (Δ), and individual stress components (σxx, σyy, σxy). These outputs are then spatially mapped to visualize regional variations in strain and stress accumulation.
The final step involves integrating these strain-derived parameters into a seismic hazard zonation framework, enabling the identification of structurally sensitive zones with elevated tectonic stress. This systematic approach establishes a reproducible framework for applying high-density GNSS monitoring and elastic strain modeling to generate input parameters for regional seismic hazard assessment in intraplate tectonic environments such as the Korean Peninsula.
3. Results
3.1. Assessment of Tectonic Coherence Using GNSS Velocities and Plate Motion Benchmarks
To assess the kinematic integrity of the Korean Peninsula and validate the robustness of GNSS-derived velocity estimates, this section presents a comparative evaluation of horizontal displacement vectors computed using two independent geodetic processing suites—GAMIT/GLOBK and Bernese. By systematically comparing these results with globally recognized plate motion models (ITRF2020, GSRM v2.1, and APKIM2005-IGN), the analysis aims to identify consistent regional motion trends and isolate potential discrepancies attributable to localized tectonic deformation or software-dependent processing differences. These evaluations are critical for establishing a reliable geodetic basis for subsequent strain field derivation and seismic hazard assessment.
As a prerequisite for this analysis, although the observation period was relatively short (three years), strain analysis reliability was improved through denser GNSS point distribution. By supplementing existing CORSs with additional geodetic control points, spatial resolution was enhanced, especially around the Yangsan and Ulsan Faults. This approach aligns with prior findings that dense, evenly distributed GNSS networks improve strain estimation accuracy [42,54,59].
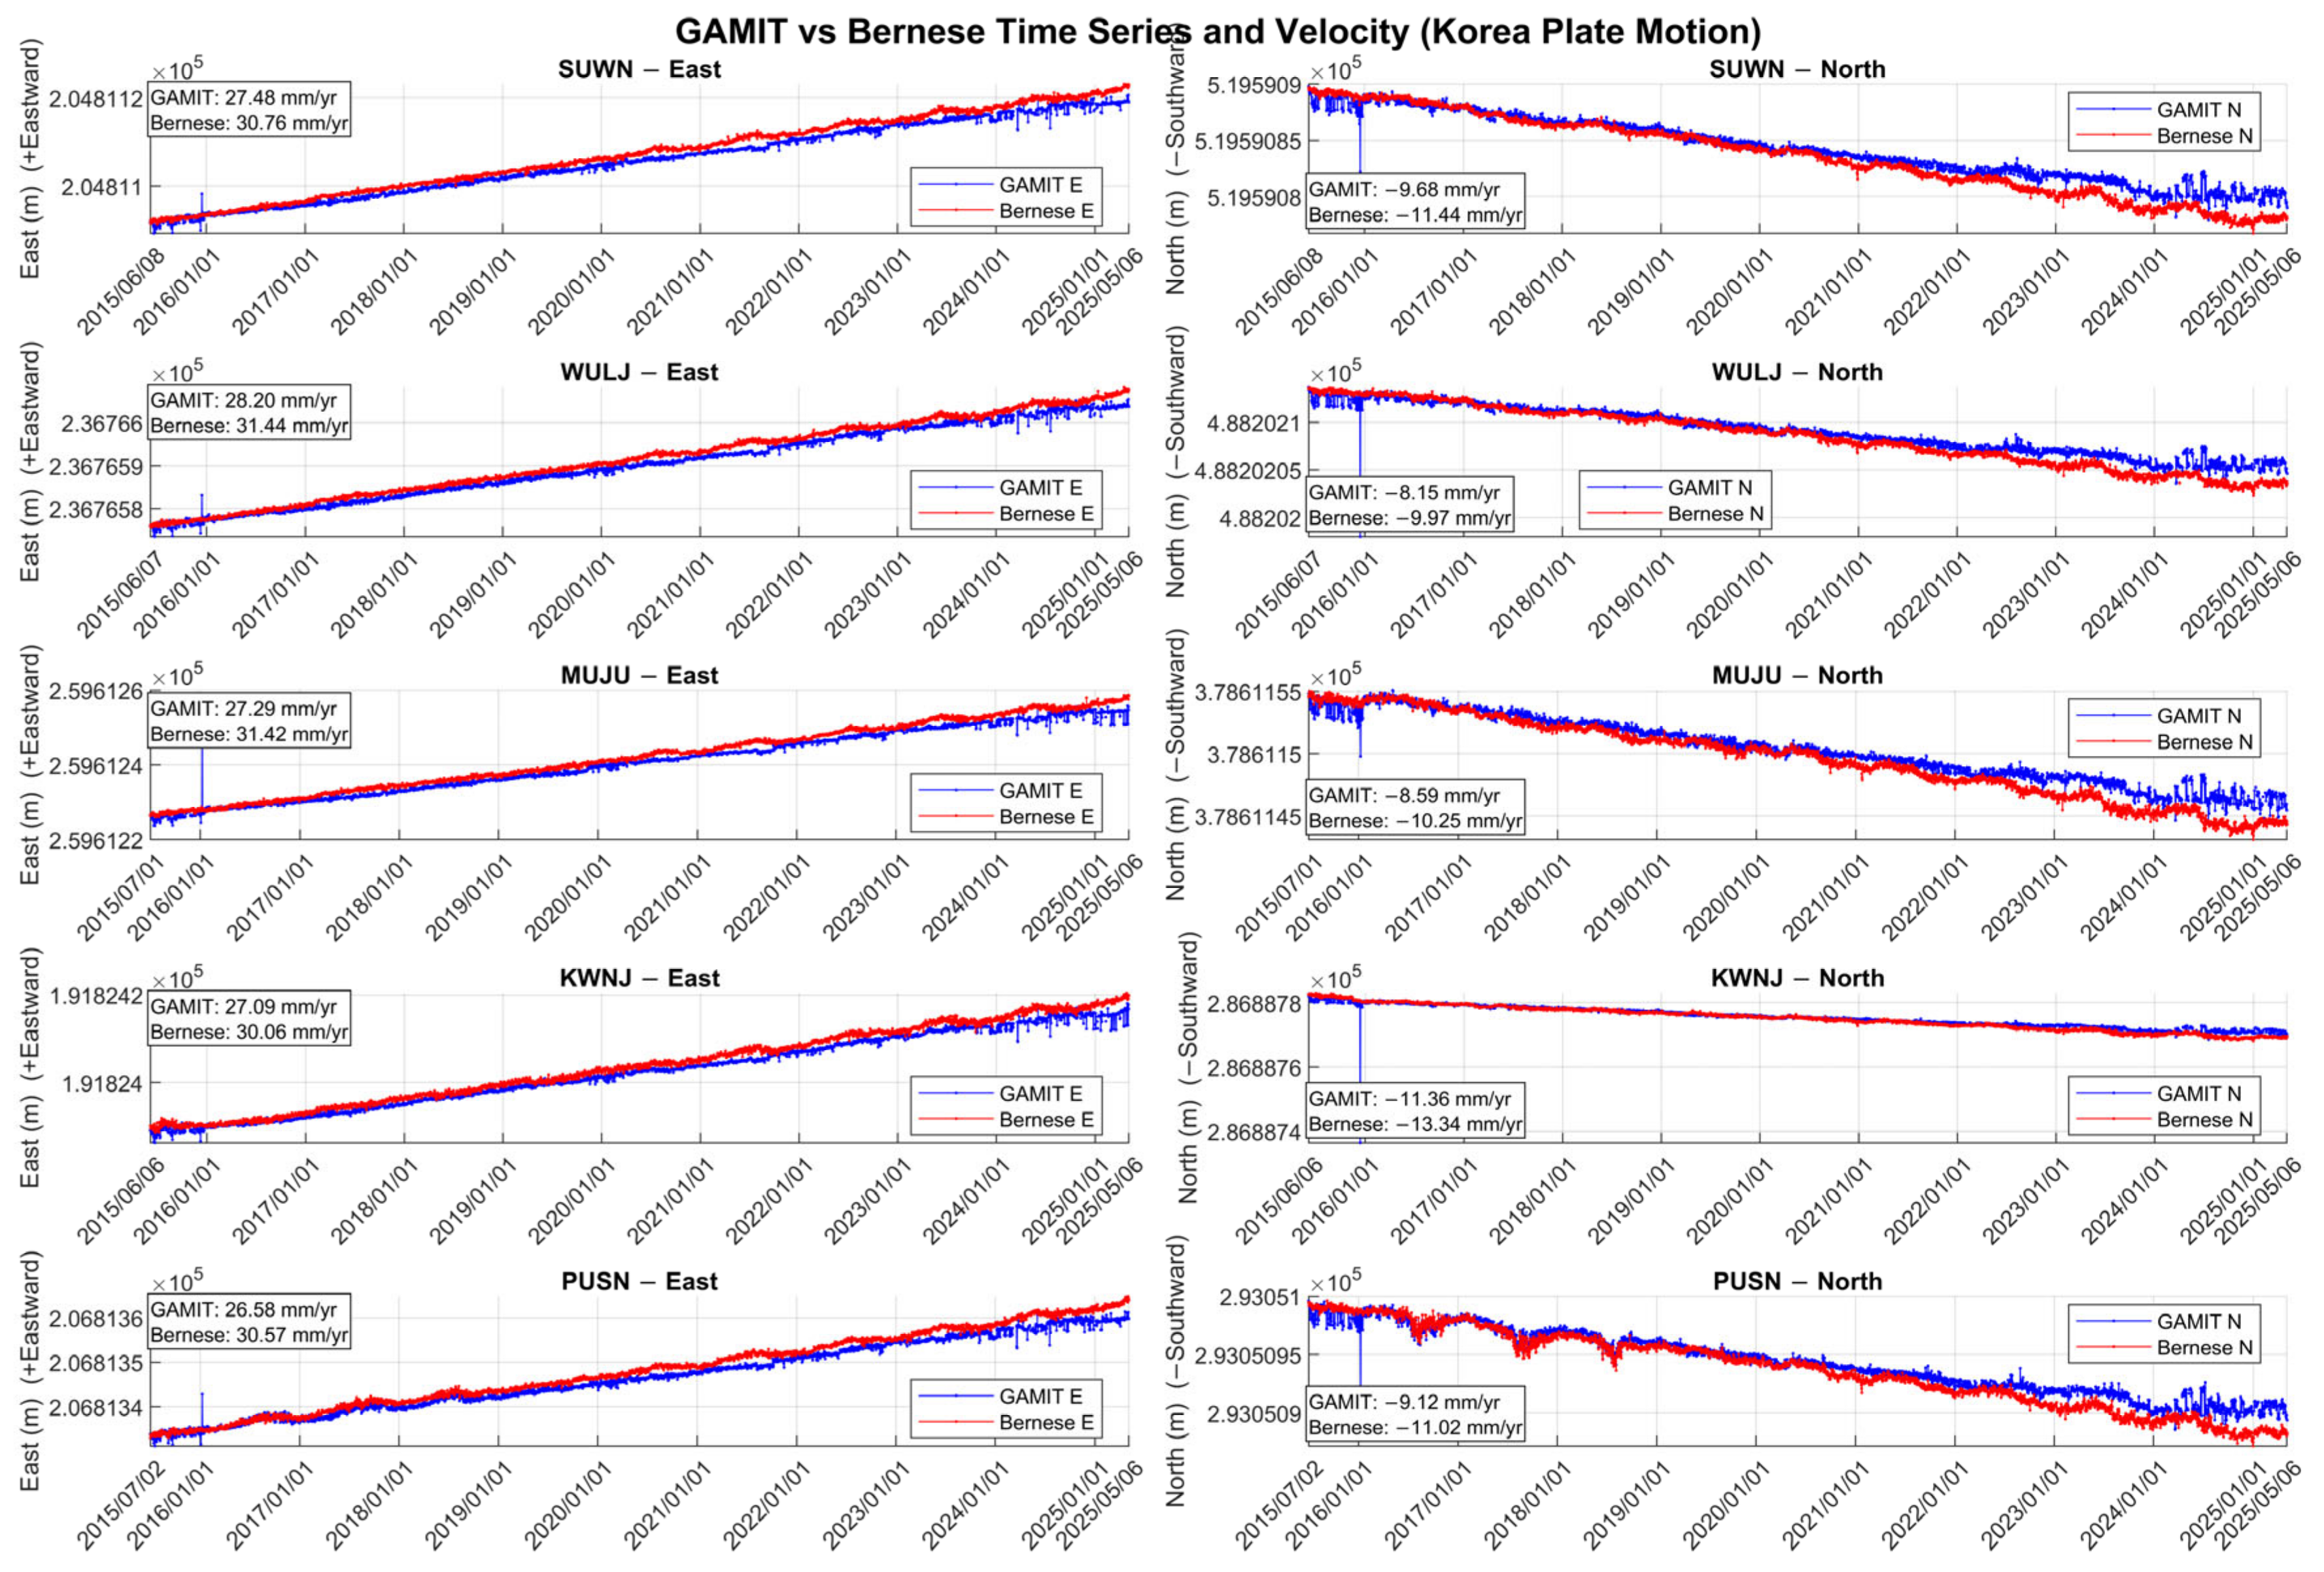
Figure 5 compares east and north displacement components from GAMIT and Bernese processing at six stations. Despite slight differences (e.g., SUWN: 27.48 vs. 30.76 mm/yr in the east), the east-northeastward trend is consistent across solutions, supporting the interpretation of the Korean Peninsula as a coherent tectonic block. These discrepancies underscore the importance of understanding software-specific effects when deriving strain rates.
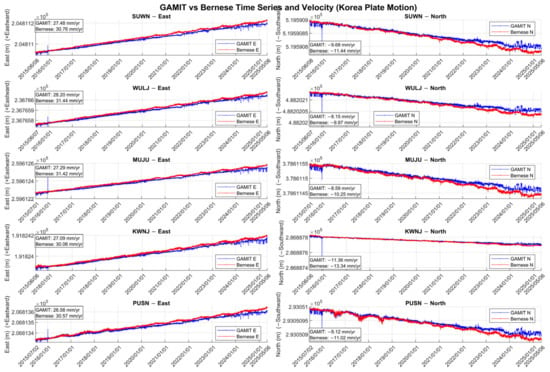
Figure 5.
Time series of east (left) and north (right) coordinate components from five GNSS stations (SUWN, WULJ, MUJU, KWNJ, and PUSN) in the Korean Peninsula. Each subplot compares daily position estimates processed by GAMIT (blue) and Bernese (red) software packages. Linear trends represent horizontal crustal motion, with velocity estimates (in mm/year) annotated in each plot.
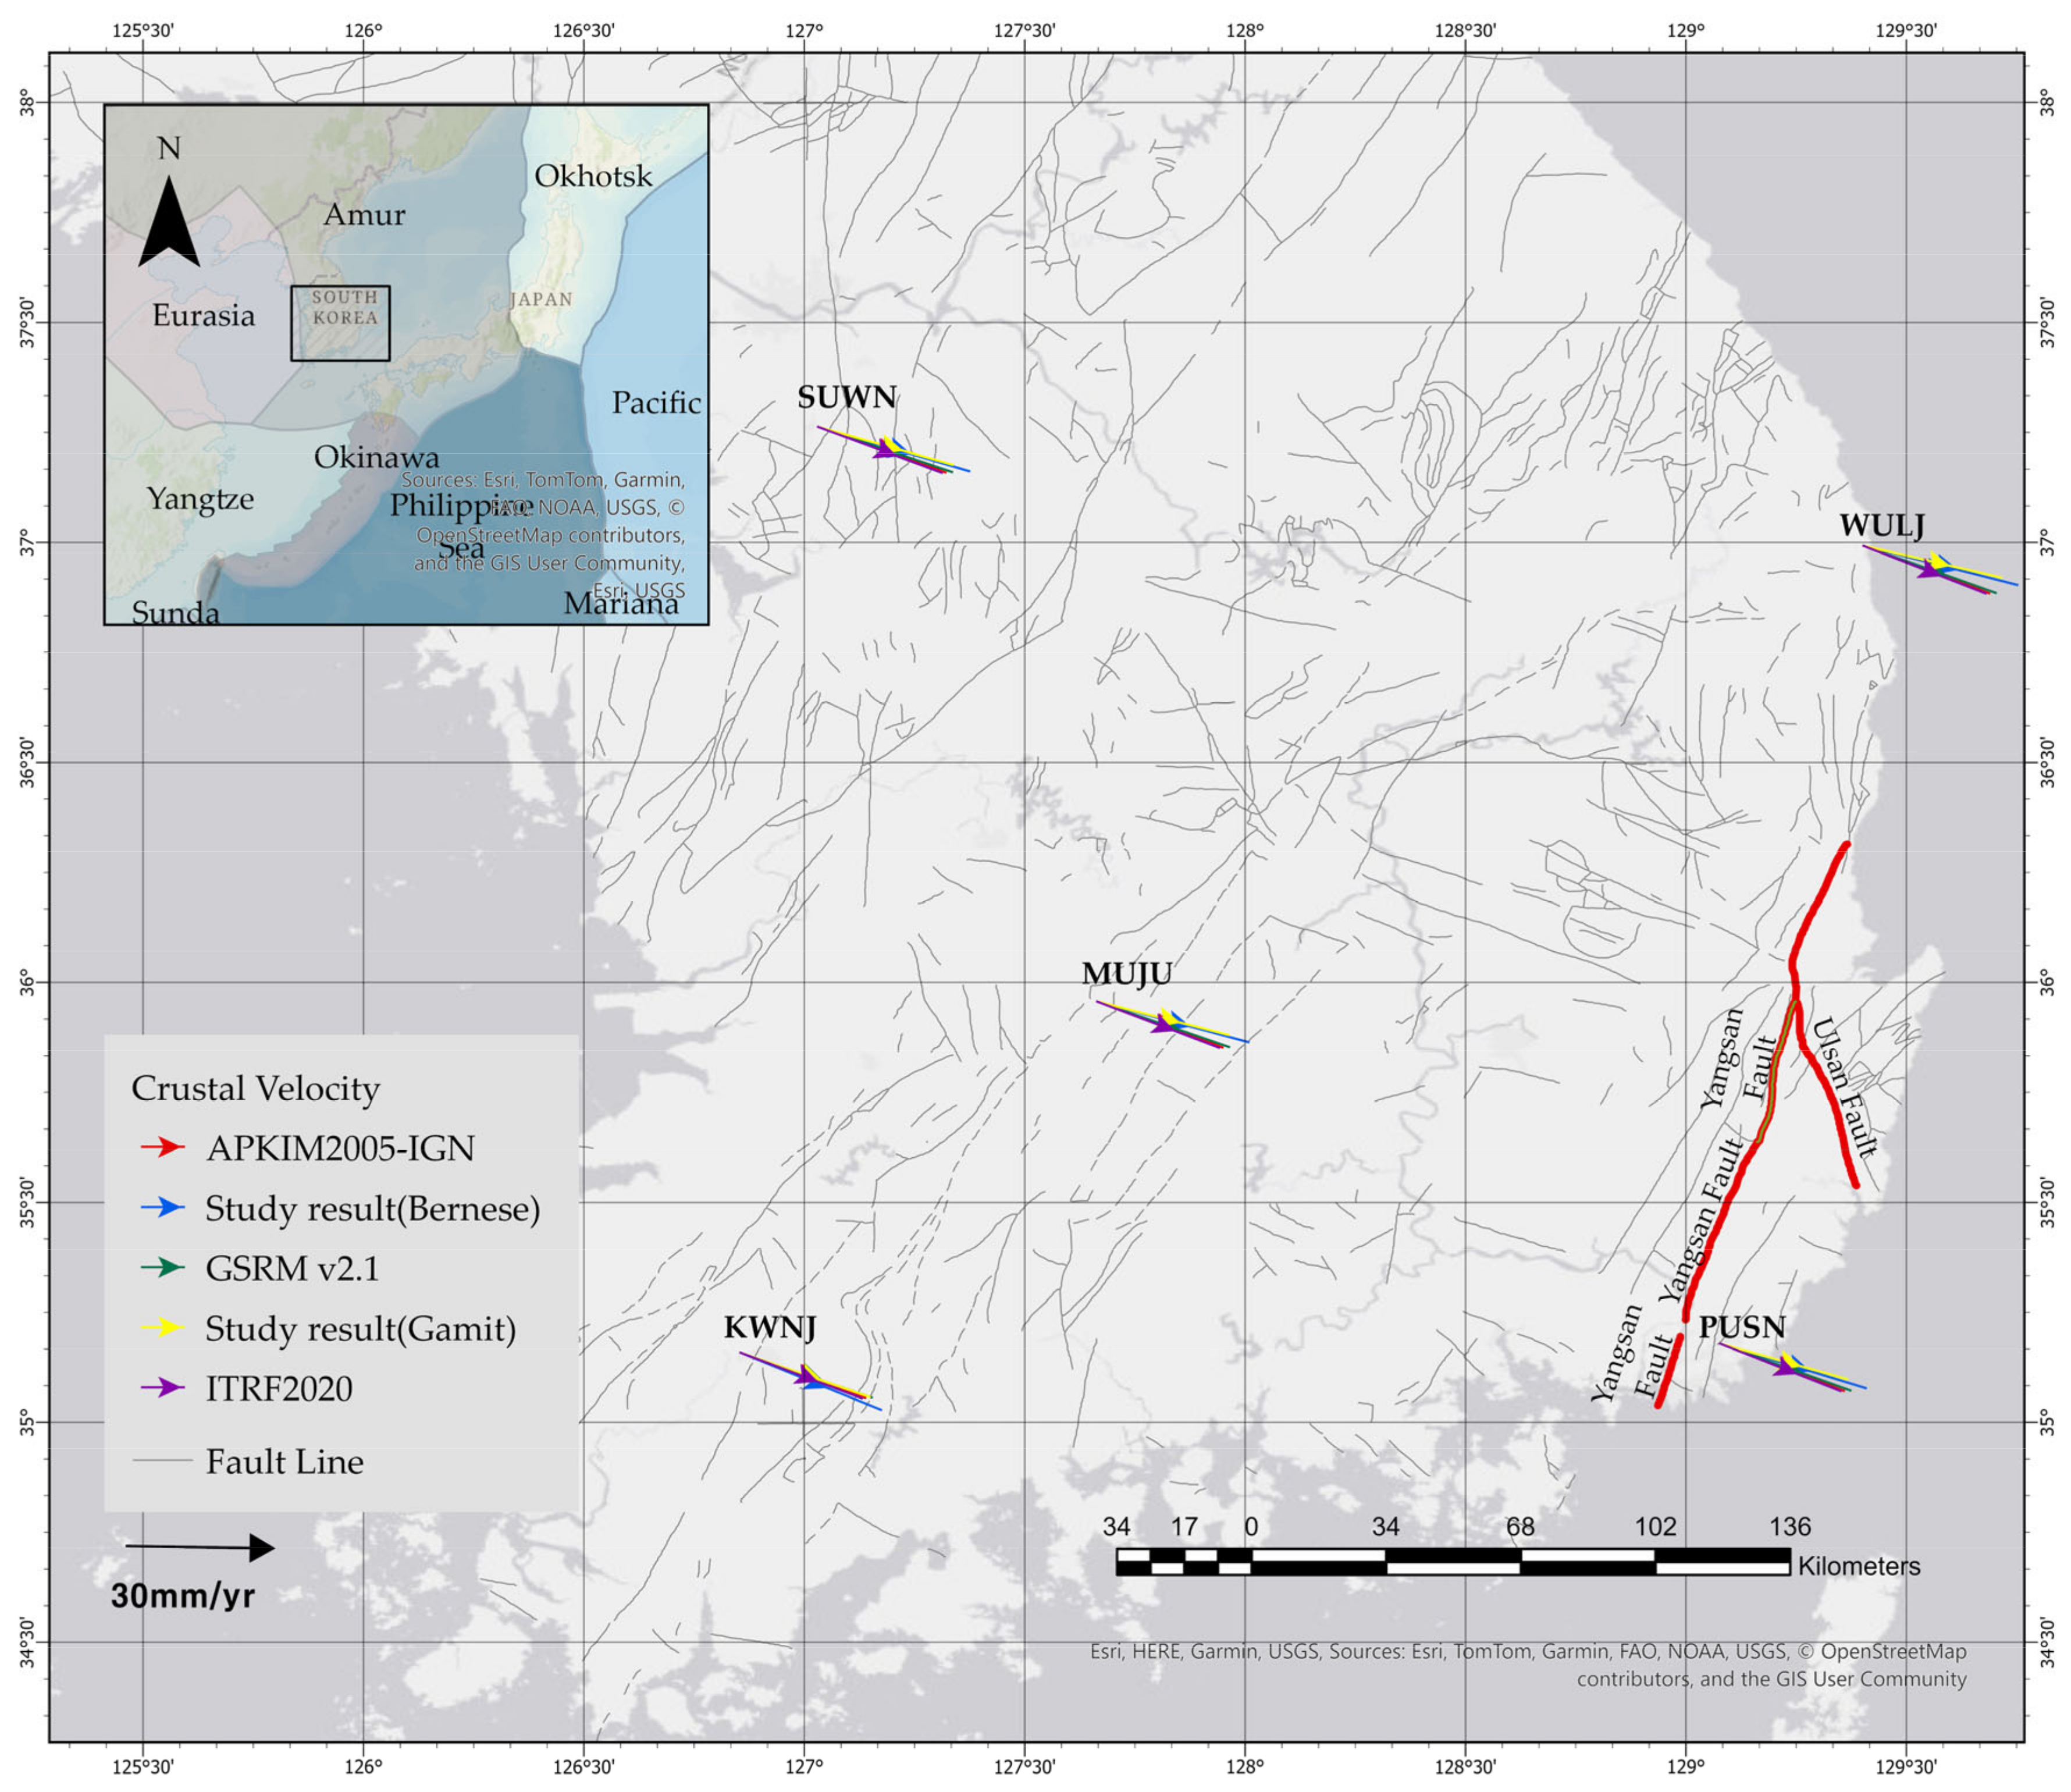
To contextualize the observed crustal motion, Figure 6 overlays GNSS-derived velocity vectors onto three global plate motion models—APKIM2005, ITRF2020, and GSRM v2.1—across the Korean Peninsula. The velocity vectors computed from both GAMIT and Bernese processing exhibit high consistency with the model predictions, with magnitudes ranging from 28 to 31 mm/yr and azimuths of approximately 113° to 116°, indicating a coherent east-northeastward motion.
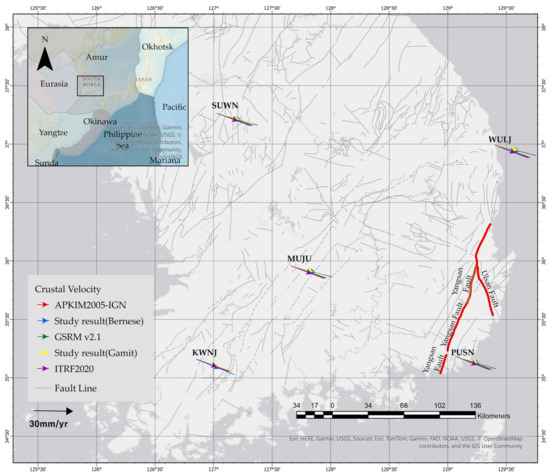
Figure 6.
Crustal velocity vectors at GNSS stations in southeastern Korea derived from this study and previous models. Blue and yellow arrows represent velocity results processed using the Bernese and GAMIT software, respectively. For comparison, red arrows indicate velocities based on the APKIM2005-IGN plate model, green arrows show the GSRM v2.1 model, and purple arrows represent ITRF2020-based velocities. All vectors are shown relative to a stable Eurasian reference frame. The map highlights variations in crustal motion near major active faults, including the Yangsan and Ulsan faults (marked in red), where deviations between modeled and observed velocities may indicate localized deformation or tectonic strain accumulation. The inset map provides regional tectonic context, including surrounding plates and microplates. A velocity scale of 30 mm/yr is provided for reference.
This strong agreement across independent models and processing strategies validates the reliability of GNSS-derived velocities for strain analysis. It also confirms that the Korean Peninsula behaves as a kinematically coherent tectonic block within the overriding plate system. Minor discrepancies between observed and modeled vectors—particularly near plate boundaries or coastal zones—may indicate localized deformation or inelastic strain accumulation. When analyzed at high spatial resolution, these deviations can reveal motion gradients critical for computing precise regional strain tensors.
Furthermore, comparisons with global models not only serve as a benchmark for velocity field accuracy but also facilitate the extraction of residual motion fields. These residuals are essential for isolating internal deformation processes and may capture anomalous strain accumulation that precedes seismic events or reflects long-term tectonic adjustment.
3.2. Analysis of Coordinate Differences
To characterize crustal motion around the southeastern fault systems of the Korean Peninsula, GNSS velocity fields were analyzed based on observations from 23 unified control points and 10 satellite reference stations of the 2020 National GNSS Control Network. Horizontal velocities were estimated with respect to three different geodetic reference frames: the Global Strain Rate Model (GSRM v2.1), the International Terrestrial Reference Frame (ITRF2014), and the Asia-Pacific plate-fixed reference frame (APKIM2000). These models provide complementary perspectives on long-term plate motion, intraplate deformation, and regional kinematics across the study area.
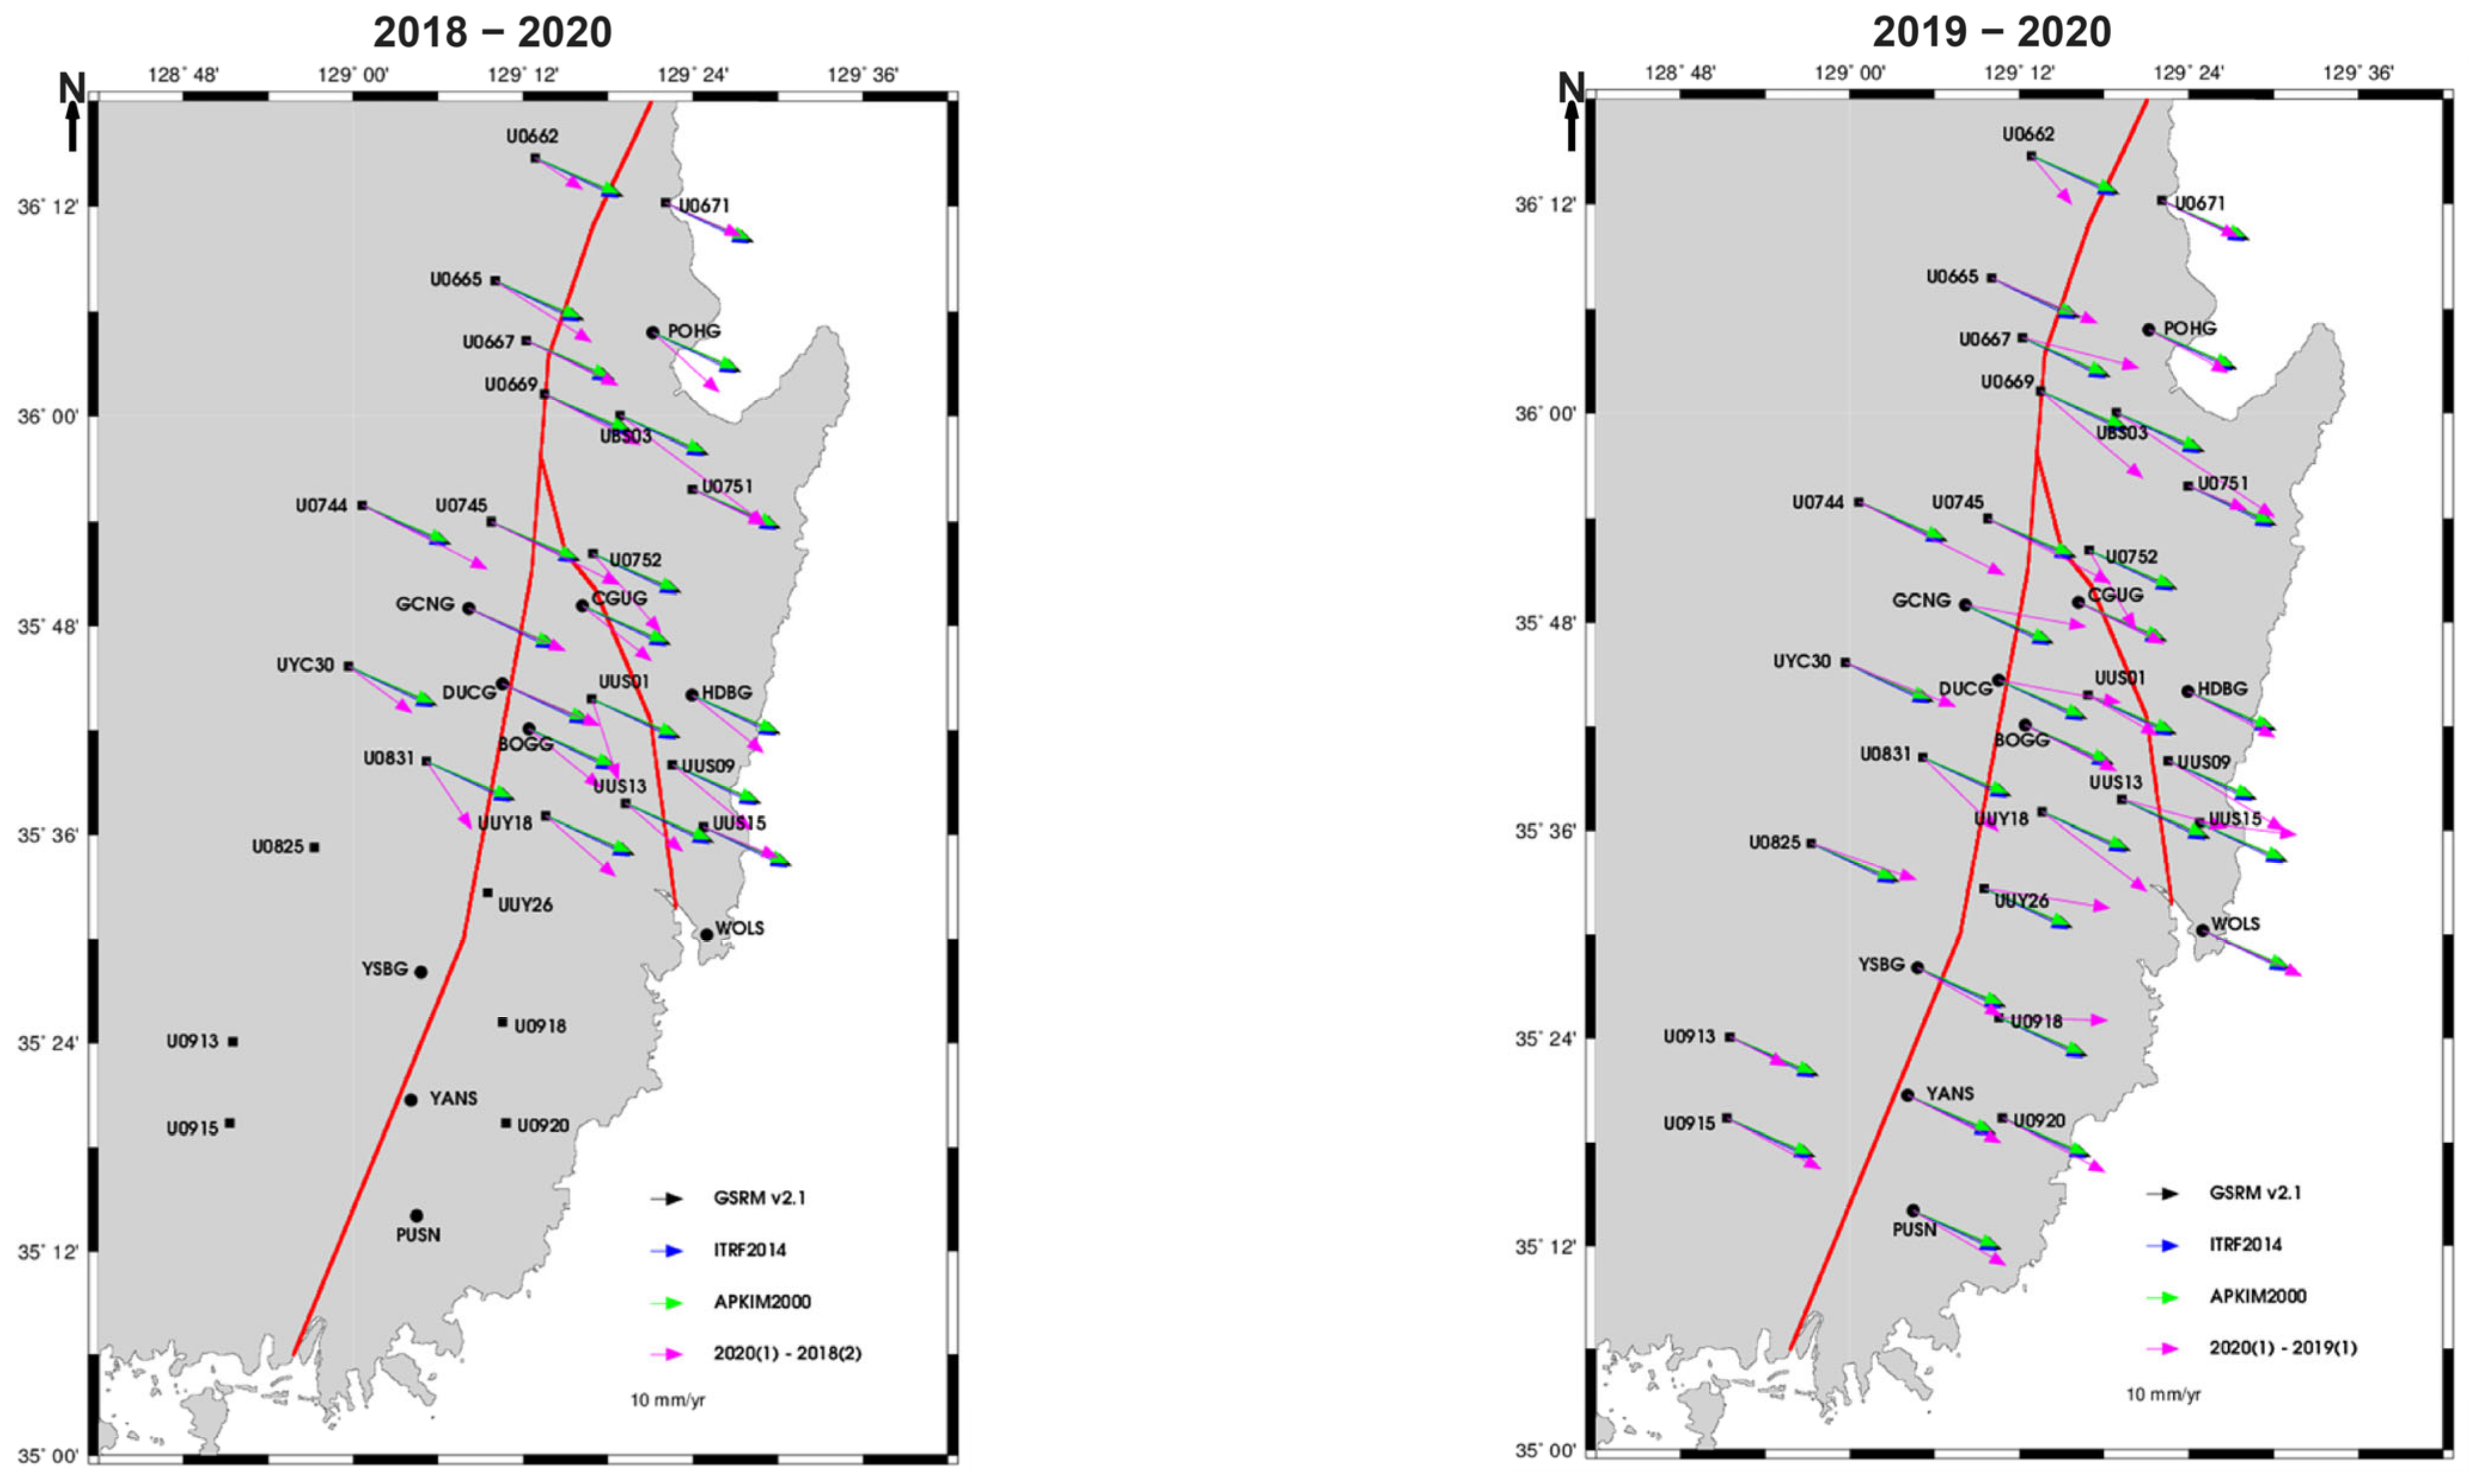
Figure 7 illustrates the horizontal velocity fields derived from continuous GNSS stations for the periods 2018–2020 (left) and 2019–2020 (right). The velocity vectors are shown relative to three reference frames—GSRM v2.1 (black), ITRF2014 (blue), and APKIM2000 (green)—to provide insight into absolute plate motion and regional kinematics. In addition, magenta arrows represent the inter-epoch displacements between campaign measurements, highlighting localized deviations from long-term trends. Notably, differential motion near the Yangsan Fault indicates transient strain accumulation and/or release within short time intervals.
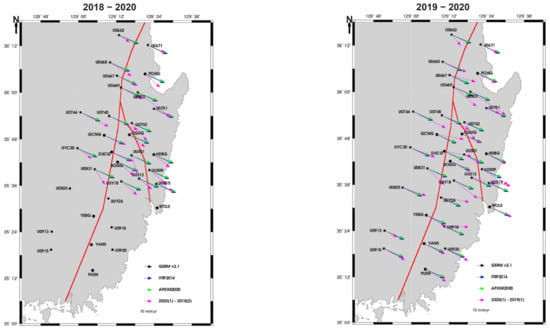
Figure 7.
Horizontal velocity vectors derived from GNSS observations for the periods 2018–2020 (left) and 2019–2020 (right). Vectors are shown with respect to three geodetic reference frames: GSRM v2.1 (black), ITRF2014 (blue), and APKIM2000 (green). The reference scale for velocity vectors is 10 mm/yr.
For the 2018–2020 interval, the mean difference in velocity magnitude between the observed GNSS measurements and the model-predicted velocities was calculated as 0.08 cm/yr for the GSRM v2.1 frame, 0.20 cm/yr for ITRF2014, and 0.24 cm/yr for APKIM2000. These differences indicate that while the overall agreement between the long-term tectonic motion models and the multi-year GNSS results is relatively good, subtle deviations are present depending on the reference frame used. Among the three models, GSRM v2.1 showed the closest match in velocity magnitude, possibly due to its incorporation of global strain rate data, which may better reflect regional deformation patterns. In contrast, APKIM2000 yielded the largest deviation, likely due to its assumption of a rigid plate-fixed frame, which may not fully account for intraplate strain accumulation in the study area.
The corresponding mean azimuthal deviations for the same interval were calculated as 11.92° for GSRM v2.1, 10.05° for ITRF2014, and 12.67° for APKIM2000. These angular differences suggest that not only the magnitude but also the direction of crustal motion varies depending on the adopted model. The relatively small deviation in azimuth for ITRF2014 may indicate that it provides a more stable directional reference for this region over longer time spans, despite exhibiting a slightly higher magnitude discrepancy compared to GSRM.
In contrast, the GNSS-derived velocities for the 2019–2020 interval revealed significantly larger discrepancies from the model predictions. The mean velocity differences during this one-year period were 0.42 cm/yr for GSRM v2.1, 0.53 cm/yr for ITRF2014, and 0.57 cm/yr for APKIM2000, representing a notable increase compared to the 2018–2020 results. This pattern suggests greater instability or transient deformation that is not captured by long-term reference models. Since these models are based on multi-decadal averages, they may not reflect short-term strain events such as localized aseismic slip, slow earthquakes, or postseismic deformation that can occur on shorter timescales.
Similarly, mean azimuthal deviations for the 2019–2020 data were found to be 2.37° for GSRM v2.1, 0.05° for ITRF2014, and 3.12° for APKIM2000. Although these angular differences are generally smaller than those observed for the 2018–2020 interval, they still reflect noticeable directional variability, especially under the APKIM2000 frame. The near-zero deviation in azimuth for ITRF2014 may imply that short-term directional changes are minimal in this frame, though the larger velocity magnitude difference suggests more complex motion dynamics. Overall, these results emphasize the importance of selecting appropriate reference frames for interpreting both long-term and short-term GNSS velocity data, especially in tectonically stable yet deforming intraplate regions such as southeastern Korea.
3.3. Strain Tensor Analysis and Spatial Characterization of Deformation
Each method serves a specific interpretive purpose. Density maps highlight where most of the coordinate differences are concentrated, offering insight into central tendencies and outlier structures. Scatter plots help reveal the dispersion and clustering behavior, while polar histograms provide information on azimuthal directionality that may be related to network geometry, processing strategy, or localized effects.
A total of six primary deformation parameters were derived from the strain tensor for each triangular element. These include the principal strain rates (ε1, ε2), principal axis orientation (θp), maximum shear strain rate (γmax), its orientation (θ_γmax), and areal strain rate (Δ). These values serve as key indicators for quantifying local contraction, extension, rotation, and shear deformation within each triangular cell.
Table 1 summarizes the primary deformation parameters estimated for 32 triangular elements based on strain tensor analysis. For each triangle, six key indicators were computed: the first and second principal strain rates (ε1 and ε2), the orientation of the principal axis (θp), the maximum shear strain rate (γmax), the orientation of maximum shear (θ_γmax), and the areal strain rate (Δ). These parameters provide a quantitative assessment of regional contraction and extension trends, concentrations of shear deformation, and overall areal changes within each element. The average values for each parameter are also presented at the bottom of the table.

Table 1.
Primary deformation parameters calculated for 32 triangular elements based on strain tensor analysis using GNSS velocity data from the 2018–2020 period. The parameters include the first and second principal strain rates (ε1, ε2), principal axis orientation (θp), maximum shear strain rate (γmax), orientation of maximum shear (θ_γmax), and areal strain rate (Δ). Average values for each parameter are listed at the bottom of the table.
Upon reviewing the strain values, several triangles exhibit significantly higher strain magnitudes than others. These include the following:
- Triangle 6:
- Maximum Shear Strain: 1.513 µstrain/yr
- Shear Stress Direction: 37.00°
- Principal Strain: 2.498 µstrain/yr and 0.985 µstrain/yr
- Principal Axis Orientation: 99.81°
- Dilatation: 3.482 µstrain/yr
This triangle shows a very high principal strain value and dilatation, suggesting a region of concentrated tectonic deformation. The shear strain is also significantly elevated, which could be indicative of active faulting along or near the Yangsan Fault.
- Triangle 10:
- Maximum Shear Strain: 2.984 µstrain/yr
- Shear Stress Direction: 18.84°
- Principal Strain: 2.367 µstrain/yr and −0.617 µstrain/yr
- Principal Axis Orientation: 68.30°
- Dilatation: 1.750 µstrain/yr
Triangle 10 also demonstrates high shear strain, highlighting a region with intense deformation, likely linked to active fault movement along the fault system.
- Triangle 11:
- Maximum Shear Strain: 1.105 µstrain/yr
- Shear Stress Direction: 21.24°
- Principal Strain: −2.241 µstrain/yr and −3.346 µstrain/yr
- Principal Axis Orientation: 72.30°
- Dilatation: −5.588 µstrain/yr
This triangle has negative strain values, which suggest contraction or compression in the region. The high dilatation rate of −5.588 µstrain/yr could reflect a potential region of significant fault activity or localized compressive stress buildup.
- Triangle 45:
- Maximum Shear Strain: 1.442 µstrain/yr
- Shear Stress Direction: 89.25°
- Principal Strain: 1.906 µstrain/yr and 0.464 µstrain/yr
- Principal Axis Orientation: 125.89°
- Dilatation: 2.370 µstrain/yr
This triangle shows a balanced strain pattern, with noticeable contraction and extension. The high dilatation suggests that this region might be experiencing localized extension, which could indicate evolving fault dynamics in this section.
These high-strain values in specific triangles point to areas with notable deformation, likely indicative of ongoing tectonic processes or active faulting. Notably, triangles with larger shear strain values, such as Triangle 6 and Triangle 10, highlight areas with heightened seismic potential. These zones are critical for further monitoring, as they may represent concentrated stress accumulation or potential rupture sites along the Yangsan Fault or its adjacent segments.
The regions identified through this analysis are critical to understanding the active tectonic processes in southeastern Korea. High-resolution monitoring in these areas is recommended for more detailed seismic hazard assessment.
Table 2 summarizes the deformation parameter results derived from GNSS velocity data spanning from the first campaign in 2019 to the first campaign in 2020. For each of the 49 triangular elements, six key indicators were computed: the first and second principal strain rates (ε1, ε2), principal axis orientation (θp), maximum shear strain rate (γmax), orientation of maximum shear (θ_γmax), and areal strain rate (Δ). These parameters allow for quantitative interpretation of localized contraction/extension trends, shear concentration, and surface area changes. The average values for each parameter are listed at the bottom of the table.

Table 2.
Primary deformation parameters calculated for 49 triangular elements based on strain tensor analysis using GNSS velocity data from the 2019–2020 period. The parameters include the first and second principal strain rates (ε1, ε2), principal axis orientation (θp), maximum shear strain rate (γmax), orientation of maximum shear (θ_γmax), and areal strain rate (Δ). Average values for each parameter are listed at the bottom of the table.
Upon reviewing the strain values, several triangles exhibit significantly higher strain magnitudes than others. These regions are particularly critical for understanding the active tectonic processes along the Yangsan Fault and its surrounding areas. The triangles with large strain values are as follows:
- Triangle 6:
- Maximum Shear Strain: 1.513 µstrain/yr
- Shear Stress Direction: 54.81°
- Principal Strain: 2.498 µstrain/yr and 0.985 µstrain/yr
- Principal Axis Orientation: 99.81°
- Dilatation: 3.482 µstrain/yr
This triangle exhibits very high principal strain and dilatation, suggesting a region of concentrated tectonic deformation. The elevated shear strain points to possible active faulting along or near the Yangsan Fault. The dilatation value indicates a region of significant extension, possibly reflecting a fault zone where strain is accumulating prior to potential fault rupture.
- Triangle 10:
- Maximum Shear Strain: 2.984 µstrain/yr
- Shear Stress Direction: 23.30°
- Principal Strain: 2.367 µstrain/yr and −0.617 µstrain/yr
- Principal Axis Orientation: 68.30°
- Dilatation: 1.750 µstrain/yr
Triangle 10 also demonstrates high shear strain, marking a region with intense deformation, likely linked to active fault movement along the Yangsan Fault system. The high dilatation value suggests localized extension in this zone, which could be an indicator of evolving tectonic dynamics and potentially significant deformation in the near future.
- Triangle 11:
- Maximum Shear Strain: 1.105 µstrain/yr
- Shear Stress Direction: 27.30°
- Principal Strain: −2.241 µstrain/yr and −3.346 µstrain/yr
- Principal Axis Orientation: 72.30°
- Dilatation: −5.588 µstrain/yr
This triangle shows negative strain values, indicating contraction or compression in the region. The large negative dilatation of −5.588 µstrain/yr suggests significant compressive stress in this area, which may reflect fault reactivation or stress accumulation. This could be an area where a potential earthquake may nucleate, particularly due to the contraction observed.
- Triangle 45:
- Maximum Shear Strain: 1.442 µstrain/yr
- Shear Stress Direction: 80.89°
- Principal Strain: 1.906 µstrain/yr and 0.464 µstrain/yr
- Principal Axis Orientation: 125.89°
- Dilatation: 2.370 µstrain/yr
Triangle 45 exhibits a balanced strain pattern, with both contraction and extension. The high dilatation value suggests that localized extension is occurring, which could be indicative of evolving fault dynamics. This area may be undergoing complex deformation, including both shear and tensional stress, and could represent a key area for monitoring as it might serve as a deformation zone between different fault segments.
These high-strain values in specific triangles point to regions with notable deformation, likely indicative of ongoing tectonic processes or active faulting. Notably, Triangles 6 and 10, with their larger shear strain values, highlight areas with heightened seismic potential. These zones, with significant strain accumulation, are critical for future seismic hazard assessments and warrant detailed monitoring.
The regions identified through this analysis are key to understanding the active tectonic processes in southeastern Korea. High-resolution monitoring in these areas is essential for detecting early signals of deformation, improving regional seismic hazard forecasting, and refining the understanding of fault dynamics along the Yangsan Fault and its adjacent segments.
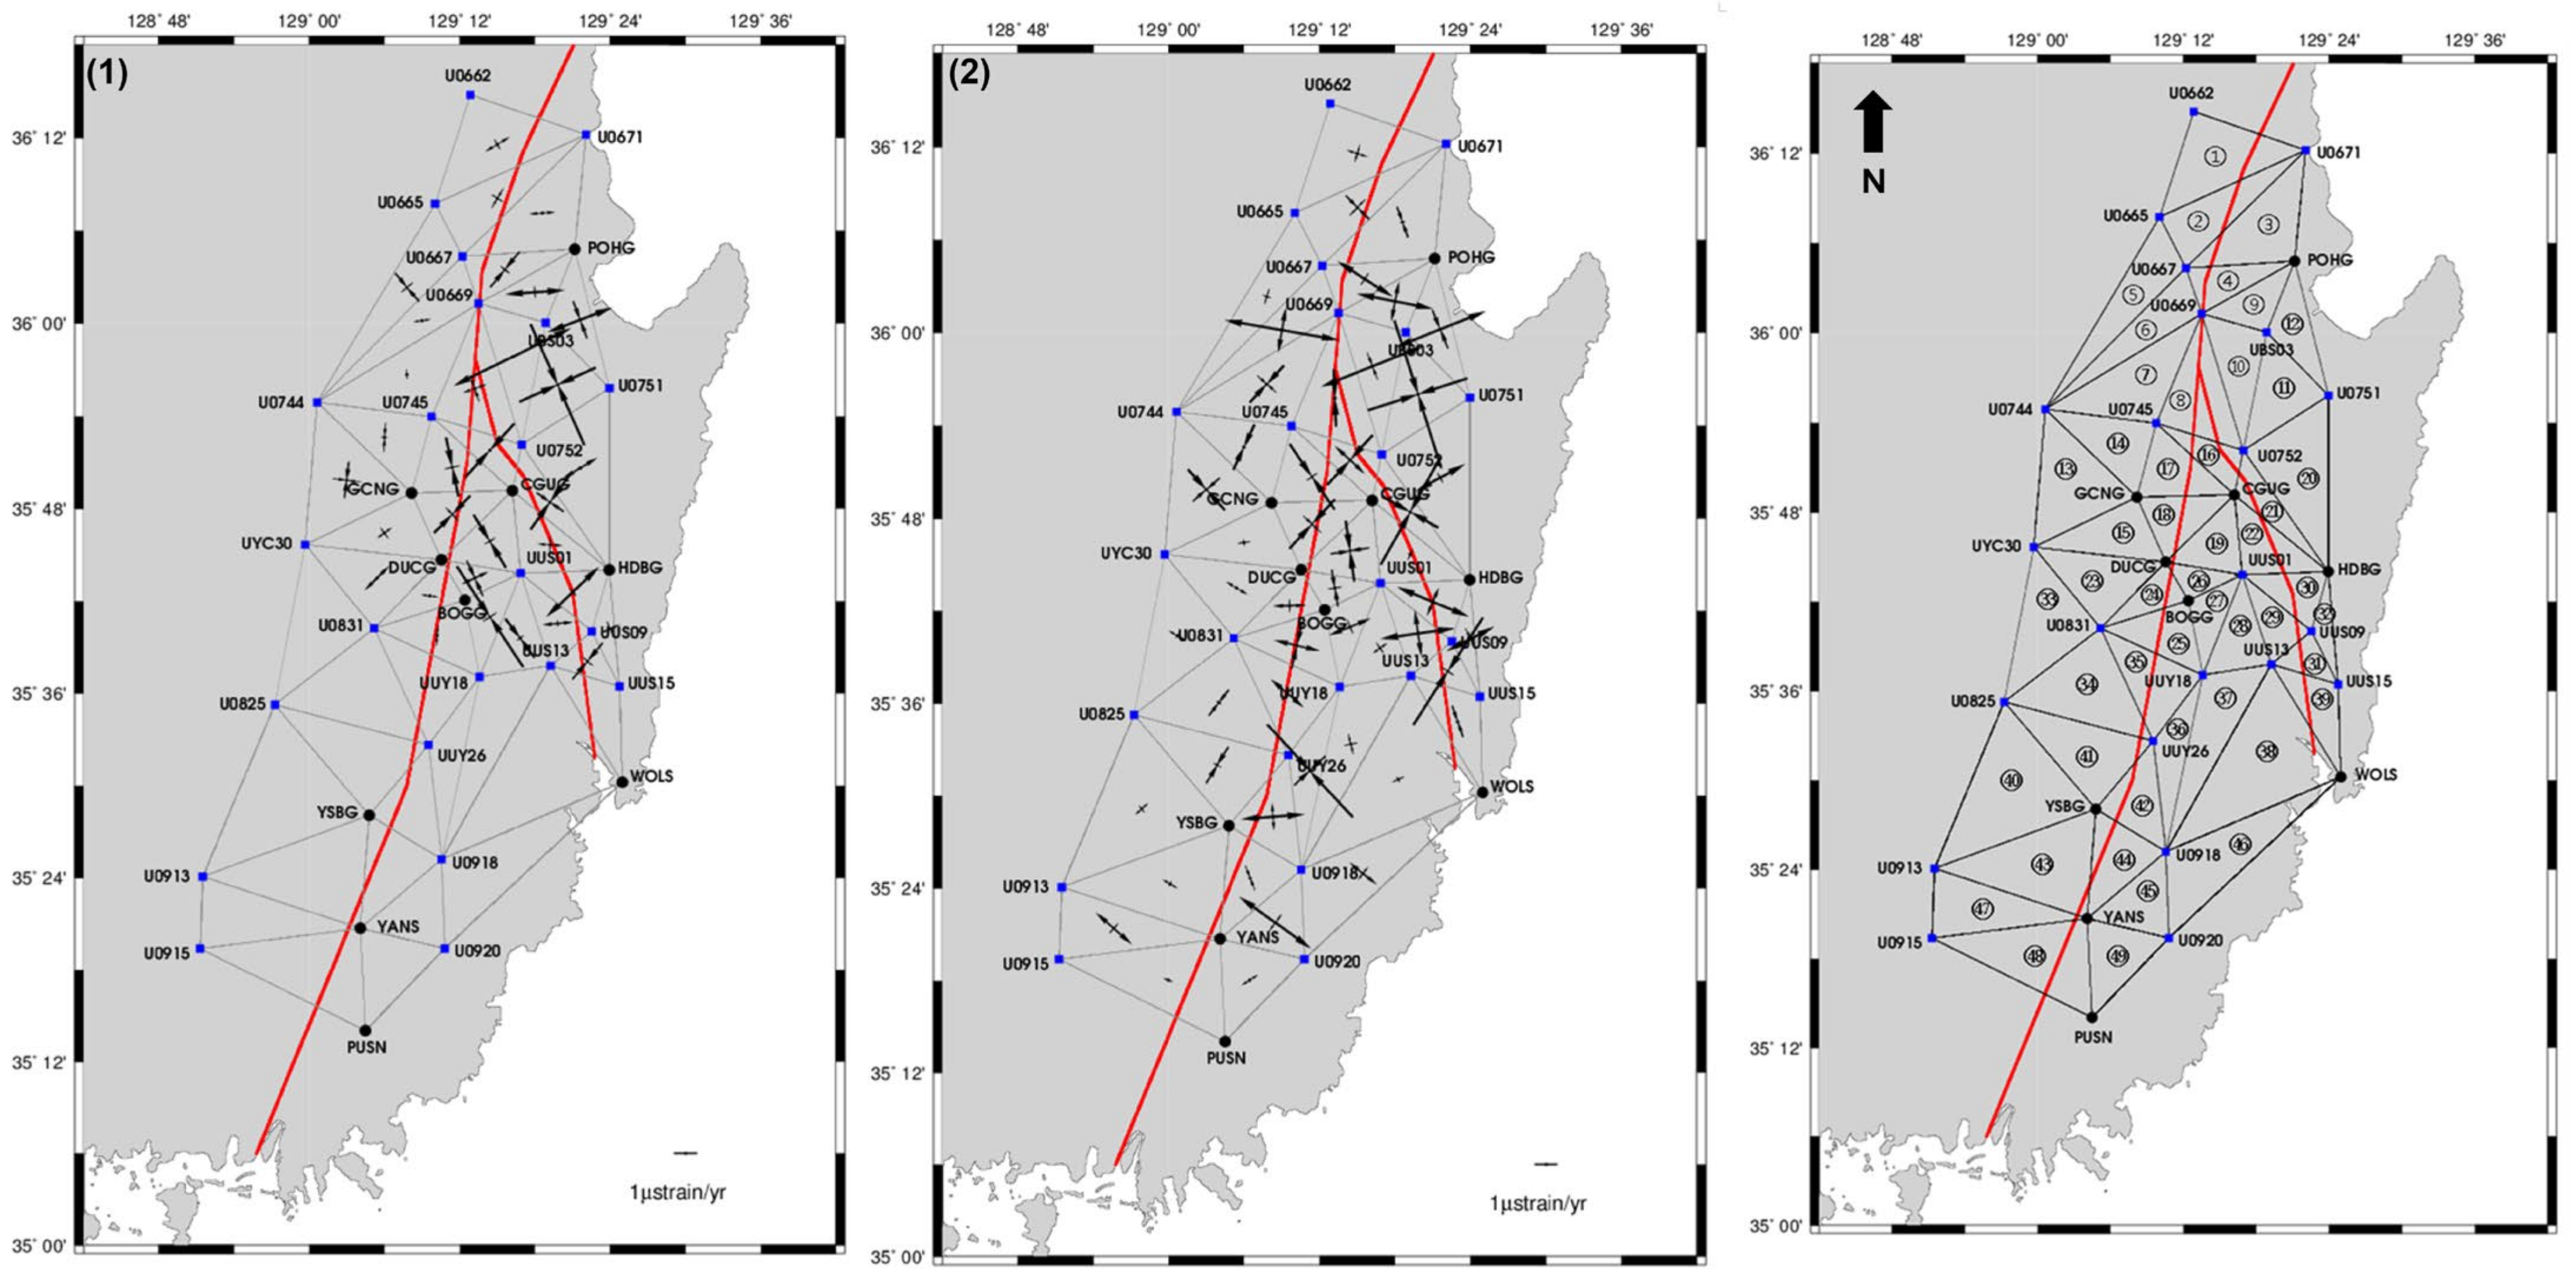
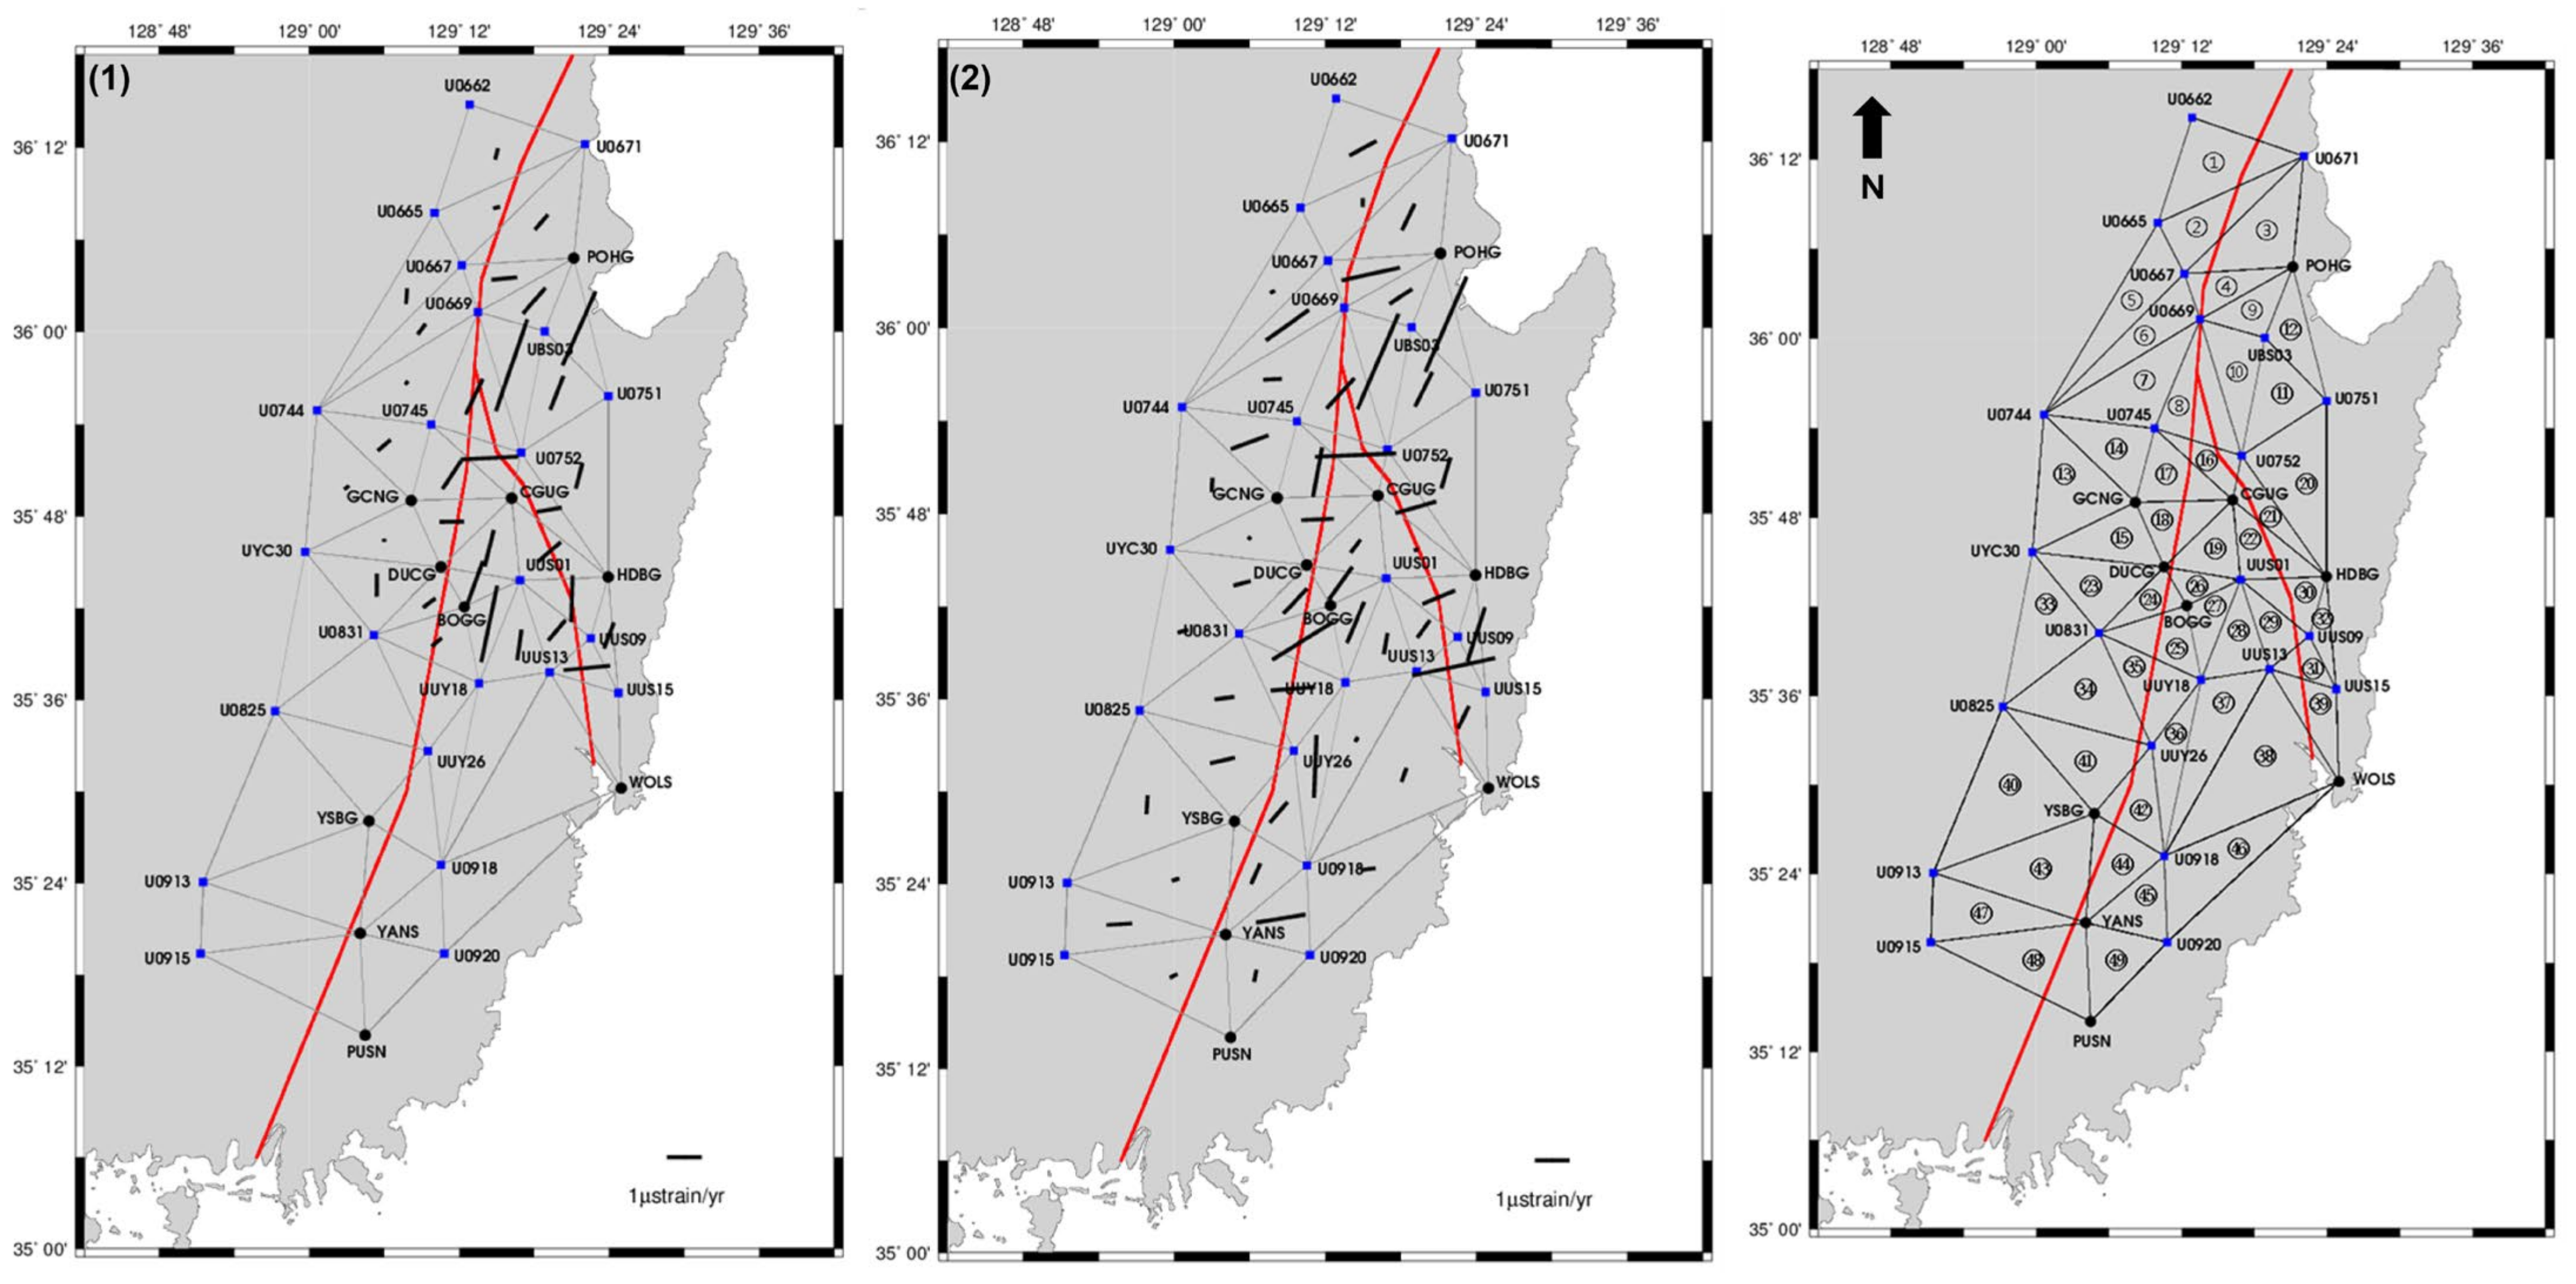
The magnitude and direction of principal strain were visualized in Figure 8 and Figure 9, based on the data derived from Table 1 and Table 2. Figure 8 illustrates the principal strain ellipses for the two observation periods, 2018–2020 and 2019–2020, helping to clearly understand the regions of strain concentration and regional deformation patterns. Each ellipse represents the magnitude and orientation of the maximum and minimum principal strain axes, allowing for a comparison of strain pattern differences between the two periods. The red lines in the figure represent the locations of the Yangsan Fault (left) and Ulsan Fault (right), providing context for the spatial distribution of strain relative to these key tectonic features. This visualization helps to identify localized strain accumulation areas and provides insights into how deformation evolves over time.
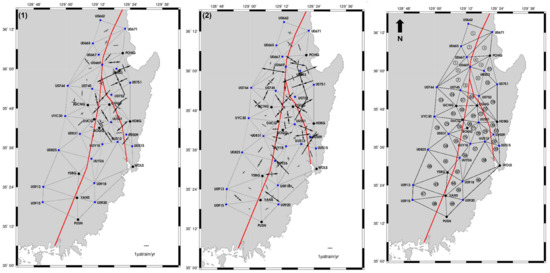
Figure 8.
Maps of principal strain magnitude and direction derived from GNSS-based strain tensor analysis for two observation periods: (1) 2018–2020 (left) and (2) 2019–2020 (center). The rightmost panel illustrates the triangulated geodetic network used for strain computation. Black bars indicate the orientations and magnitudes of maximum and minimum principal strain axes, with bar lengths scaled to strain intensity (μstrain/yr). The red lines denote the Yangsan Fault (western trace) and the Ulsan Fault (eastern trace). Strain accumulation is notably concentrated between the two fault zones, particularly in the central segment of the Yangsan Fault. The network includes 23 geodetic control points (blue squares) and 10 CORS (black circles).
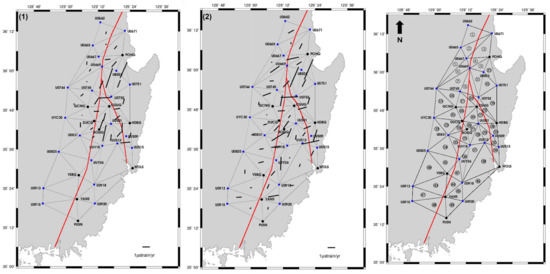
Figure 9.
Maps of maximum shear strain magnitude based on GNSS-derived strain tensor analysis for two observation periods: (1) 2018–2020 (left) and (2) 2019–2020 (center). The rightmost panel shows the triangulated geodetic network employed for strain estimation, with triangle IDs indicated. Black bars represent the absolute magnitudes of maximum shear strain within each triangular element, with lengths scaled to the strain rate (μstrain/yr). Red lines mark the Yangsan Fault (western trace) and the Ulsan Fault (eastern trace). The maps reveal spatial and temporal variations in localized shear deformation, with consistently elevated strain accumulation observed near the central segment of the Yangsan Fault. The network includes 23 geodetic control points (blue squares) and 10 CORS (black circles).
Figure 9 visualizes the maximum shear strain vectors, highlighting the distribution of shear deformation in regions centered around the Yangsan Fault. The red lines again indicate the Yangsan Fault (left) and Ulsan Fault (right), emphasizing how shear deformation is concentrated in these areas. The direction and magnitude of the strain vectors are used to identify areas where deformation is focused and to show the changes in deformation patterns during the two observation periods. The visualization particularly highlights the deformation zones around the Yangsan Fault, offering a clearer understanding of regions with higher seismic potential.
Figure 8 and Figure 9 illustrate the spatial distribution of principal strain and maximum shear strain for the periods 2018–2020 and 2019–2020. These maps highlight regions of strain concentration along the Yangsan Fault and its surrounding areas, showing distinct differences in strain magnitude and orientation between the two observation periods.
Figure 8 presents the magnitude and direction of principal strain, visualizing areas of concentrated deformation. High strain values, such as those observed in Triangle 6 (2.498 µstrain/yr and 3.482 µstrain/yr) and Triangle 10 (2.367 µstrain/yr), indicate significant deformation likely related to active faulting along the Yangsan Fault. These regions suggest the potential for strain accumulation, which could elevate seismic hazard risk. Negative strain values, such as those found in Triangle 11 (−5.588 µstrain/yr), indicate compressive stress, which may reflect the reactivation of faults or areas with increased potential for seismic events.
In this context, attention must be given to the shear stress direction at Triangle 16, located at the structural boundary where the Yangsan and Ulsan faults diverge. Notably, significant differences in shear stress direction can be observed when comparing Triangle 16 with nearby sites.
Comparison of Triangle 16 and Triangle 17:
- Triangle 16:
- Shear Stress Direction: 87.31°
- Maximum Shear Strain: 1.675 µstrain/yr
- Principal Strain: 0.107 µstrain/yr and −1.568 µstrain/yr
- Triangle 17:
- Shear Stress Direction: 33.32°
- Maximum Shear Strain: 0.976 µstrain/yr
- Principal Strain: −0.327 µstrain/yr and −1.304 µstrain/yr
The shear stress direction difference between Triangle 16 and Triangle 17 is 53.99°. This substantial difference indicates a concentration of shear stress at Triangle 16, which lies near the Yangsan Fault, suggesting the potential for active faulting. In contrast, Triangle 17 exhibits a significantly lower shear stress direction, implying different deformation characteristics and potentially lower seismic hazard. The large difference in shear stress direction at Triangle 16 indicates a region closer to the fault’s primary deformation axis, where fault reactivation is more likely.
Comparison of Triangle 16 and Triangle 8:
- Triangle 16:
- Shear Stress Direction: 87.31°
- Maximum Shear Strain: 1.675 µstrain/yr
- Principal Strain: 0.107 µstrain/yr and −1.568 µstrain/yr
- Triangle 8:
- Shear Stress Direction: 25.81°
- Maximum Shear Strain: 1.133 µstrain/yr
- Principal Strain: 0.535 µstrain/yr and −0.598 µstrain/yr
The shear stress direction difference between Triangle 16 and Triangle 8 is 61.50°, reflecting a sharp rotation in shear stress direction at Triangle 16. Triangle 8, on the other hand, shows a much lower shear stress direction, suggesting that it is situated in a region with relatively lower shear stress accumulation. This indicates a notable difference in the underlying crustal deformation mechanisms. Triangle 16, located closer to the Yangsan Fault’s center, shows concentrated shear stress, while Triangle 8 represents a region with relatively less deformation and weaker shear stress orientation.
Figure 9 visualizes the maximum shear strain, with the highest shear strain (2.984 µstrain/yr) observed in Triangle 10. This emphasizes concentrated deformation along fault zones, particularly around the Yangsan Fault. Regions such as Triangle 45, exhibiting high strain, suggest localized extension, indicative of evolving fault dynamics. These findings highlight changes in fault behavior and the potential for significant deformation in the near future.
In this context, significant differences in shear stress direction can be observed between Triangle 16 and nearby regions, as follows:
Comparison of Triangle 16 and Triangle 17:
- Triangle 16:
- Shear Stress Direction (θ7max): 87.59°
- Maximum Shear Strain: 2.325 µstrain/yr
- Principal Strain: 0.107 µstrain/yr and −1.568 µstrain/yr
- Triangle 17:
- Shear Stress Direction (θ7max): 33.32°
- Maximum Shear Strain: 0.976 µstrain/yr
- Principal Strain: −0.327 µstrain/yr and −1.304 µstrain/yr
The 54.27° difference in shear stress direction between Triangle 16 and Triangle 17 indicates a region of concentrated shear stress at Triangle 16, which lies at the boundary where the Yangsan and Ulsan faults diverge. This suggests a higher potential for fault reactivation and seismic hazard at Triangle 16, as compared to Triangle 17, which exhibits a significantly lower shear stress direction.
Additionally, the comparison between Triangle 16 and Triangle 8 further illustrates a sharp contrast:
Comparison of Triangle 16 and Triangle 8:
- Triangle 16:
- Shear Stress Direction (θ7max): 87.59°
- Maximum Shear Strain: 2.325 µstrain/yr
- Principal Strain: 0.107 µstrain/yr and −1.568 µstrain/yr
- Triangle 8:
- Shear Stress Direction (θ7max): 42.56°
- Maximum Shear Strain: 1.182 µstrain/yr
- Principal Strain: 0.535 µstrain/yr and −0.598 µstrain/yr
The 45.03° difference in shear stress direction between Triangle 16 and Triangle 8 suggests a significant change in the shear stress field at Triangle 16, located closer to the central deformation zone of the Yangsan Fault. In contrast, Triangle 8 shows relatively lower shear stress values, indicating less concentrated deformation and potentially weaker fault activity in that region.
These observations emphasize the role of Triangle 16 as a key site for understanding fault dynamics and highlight the substantial spatial variability in shear stress directions that may influence seismic risk in the region.
These maps provide a means of identifying regions with high strain, enhancing the understanding of active tectonic processes occurring along the Yangsan Fault and its adjacent areas. Continuous monitoring of these regions is essential for improving seismic hazard assessments and furthering the understanding of strain accumulation and fault activity.
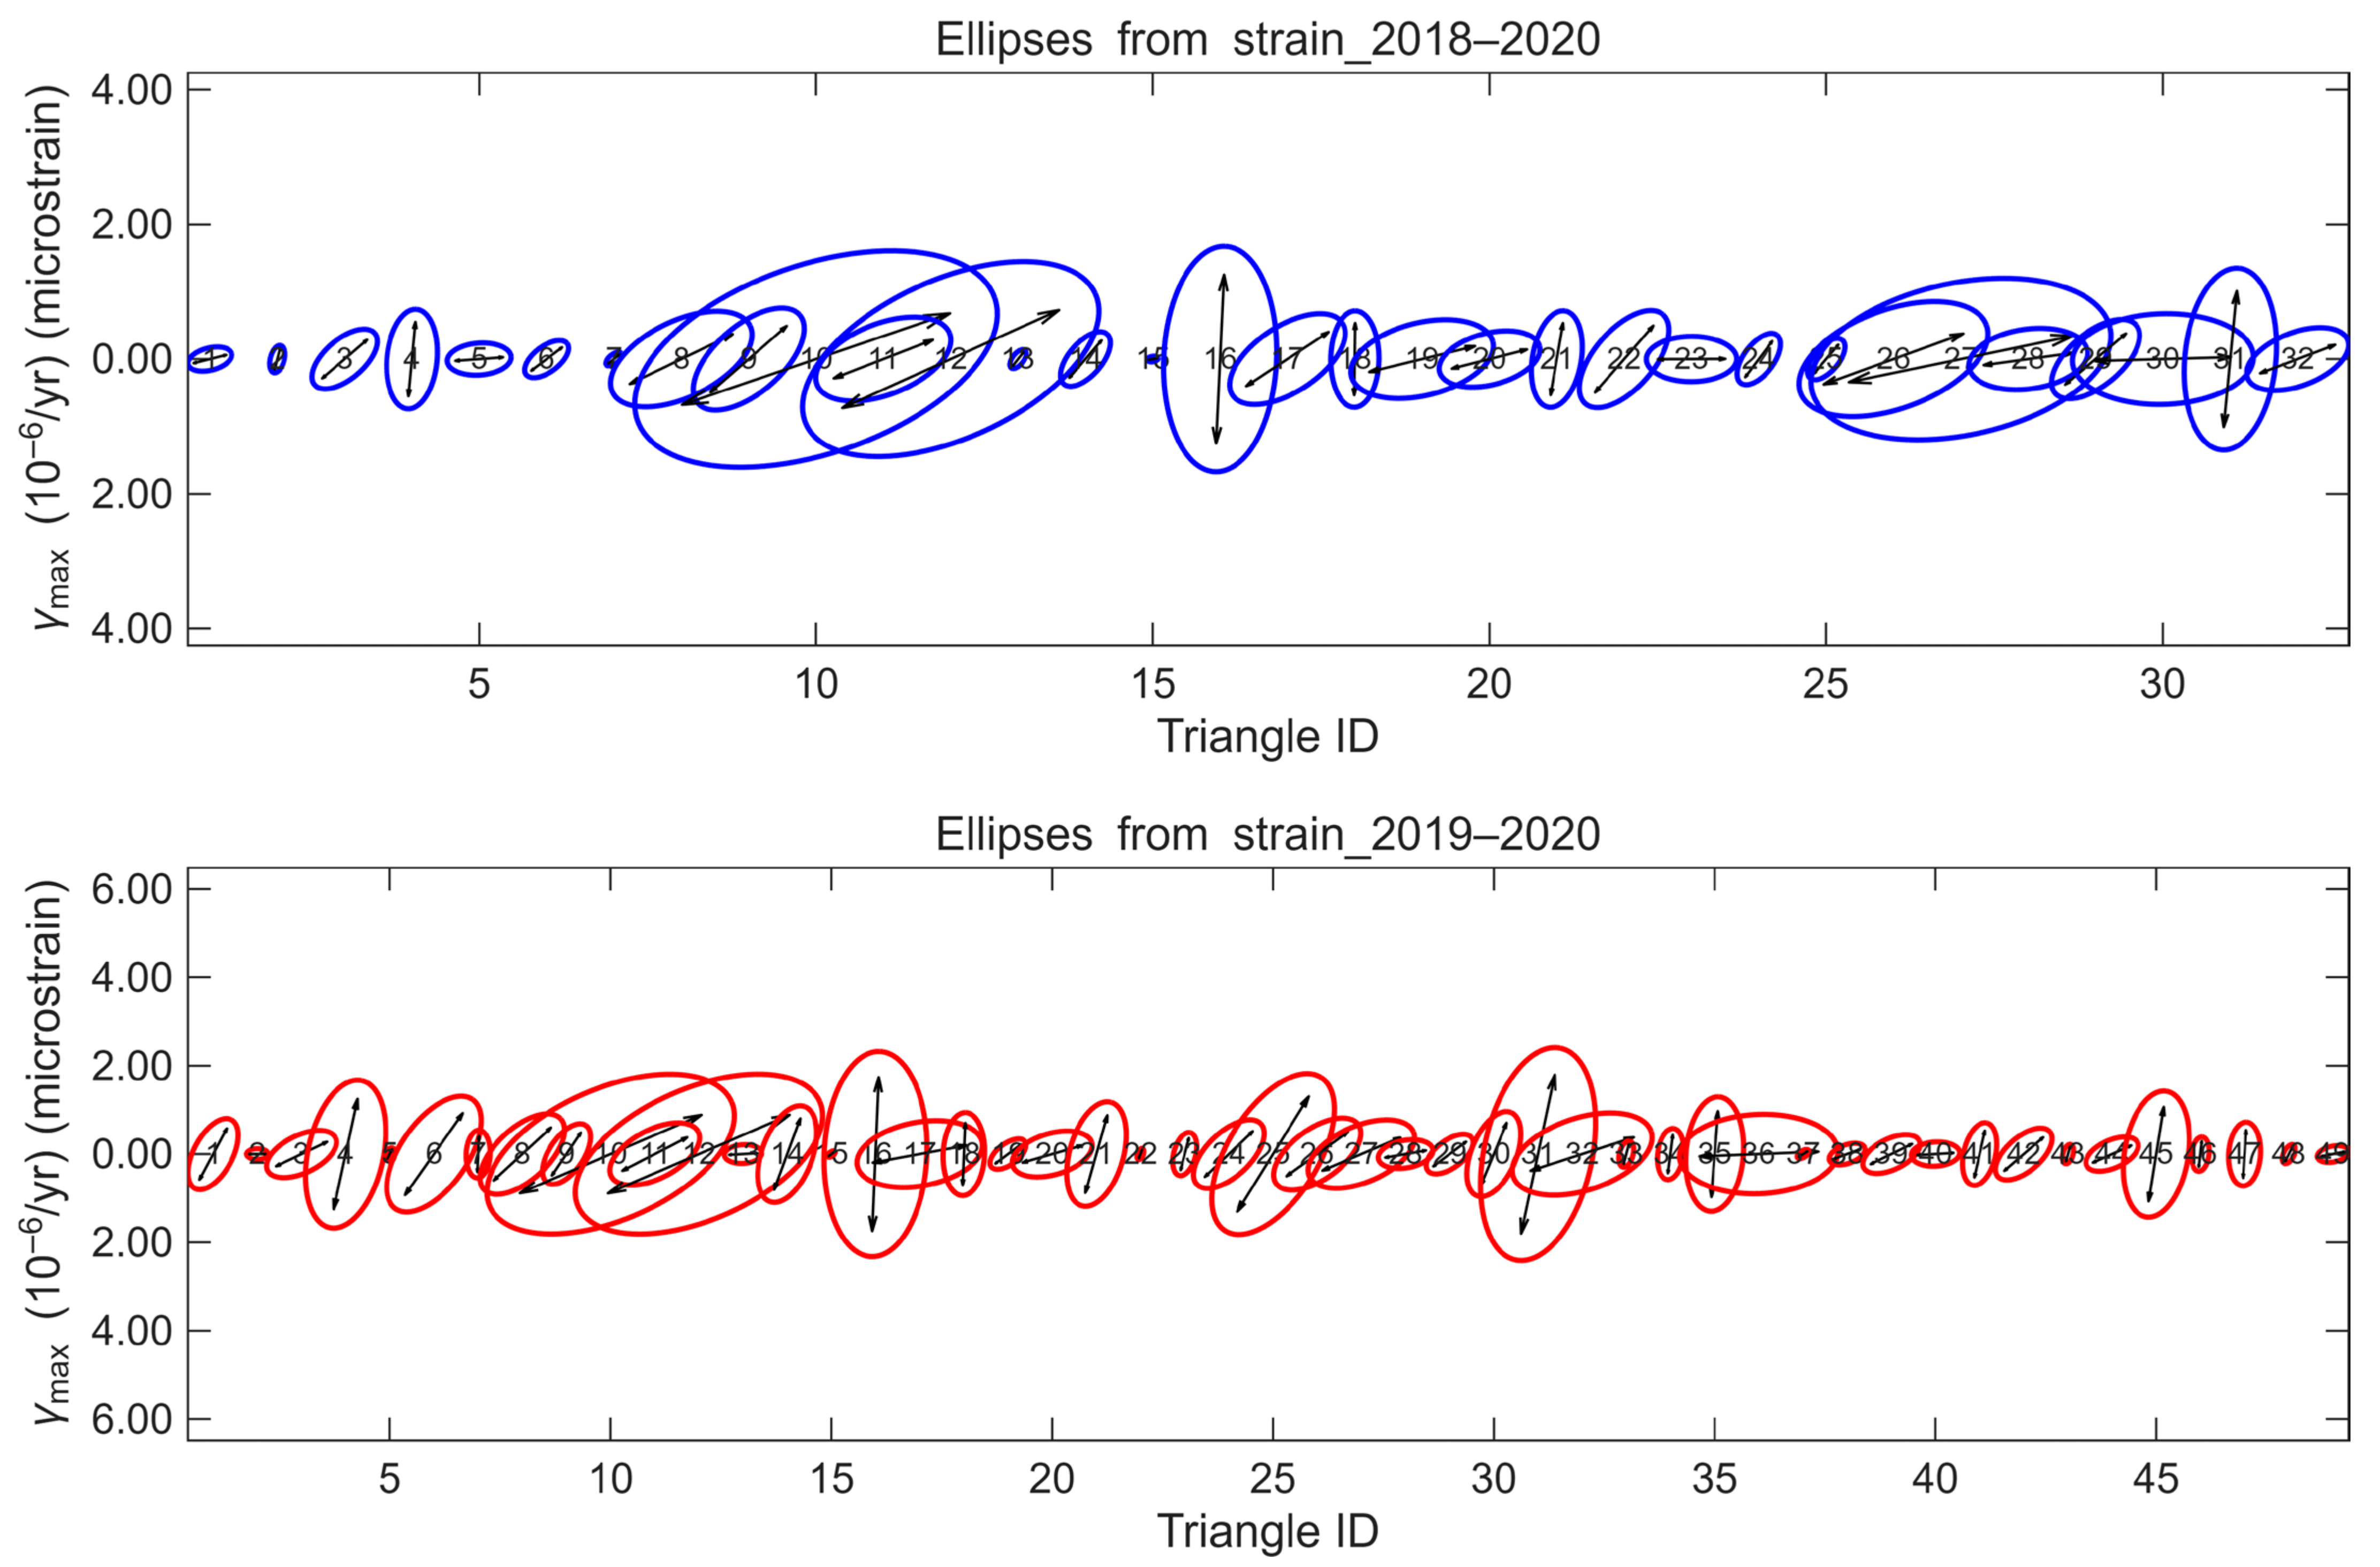
Figure 10 illustrates the formal error ellipses for maximum shear strain (γ_max) derived from GNSS-based strain analysis over the periods 2018–2020 (top) and 2019–2020 (bottom). These ellipses represent the propagated uncertainties in the strain tensor estimates and provide a visual measure of both the magnitude and directional confidence of the shear strain for each triangle. Notably, triangles such as 10, 12, and 16 exhibit relatively large error ellipses, reflecting substantial levels of strain accumulation and directional consistency. This indicates that these regions may correspond to zones of heightened tectonic stress and, consequently, an elevated potential for seismic activity.
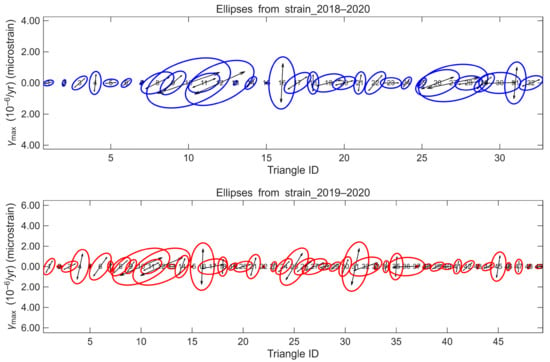
Figure 10.
Formal error ellipses representing the uncertainties in maximum shear strain (γ_max) estimates for each triangular element, derived from GNSS observations. The upper panel shows results for the 2018–2020 period (blue ellipses), while the lower panel corresponds to the 2019–2020 period (red ellipses). Each ellipse indicates the magnitude and orientation of maximum shear strain, as well as the directional confidence based on the propagated uncertainties from GNSS positioning. Larger ellipses, particularly those associated with triangles 11, 14, and 16, suggest significant strain accumulation and directional consistency, which may imply localized zones of increased seismic hazard. These visualizations facilitate the assessment of spatial variation in deformation and contribute to a more robust understanding of strain distribution along the Yangsan Fault.
A more detailed treatment of measurement uncertainties and their propagation through the strain tensor calculations strengthens the scientific robustness of this study. By incorporating formal error ellipses, the analysis enables a clearer interpretation of the reliability of shear strain estimates and allows for meaningful comparisons with future datasets or alternative methodologies. Given that GNSS positioning errors and triangle geometry directly influence the estimation of strain parameters, these uncertainty visualizations are essential for assessing the spatial distribution of seismic hazard across the Yangsan Fault and adjacent areas.
4. Discussion
4.1. Seismotectonic Implications of GNSS-Based Strain Tensor Analysis
Elastic strain fields derived from geodetic observations, such as GNSS data, provide a robust and quantitative basis for assessing tectonic stress accumulation along active fault systems. When interpreted through the framework of elastic dislocation theory, these strain fields serve as proxies for subsurface stress distributions and help identify regions with elevated seismic potential. High-resolution geodetic measurements allow for the detection of subtle crustal deformations and spatial variations in strain rates, which are key to characterizing stress buildup along known faults. Numerous studies have demonstrated that geodetic strain fields correlate well with stress orientations inferred from borehole and seismological data, validating their use in tectonic stress mapping even in complex or intraplate settings [60,61,62]. Moreover, inversion of geodetic velocities through elastic dislocation models enables the estimation of deep strain and stress patterns, enhancing our understanding of fault loading and earthquake hazard [63,64,65,66].
The relative displacement vectors observed across multiple baselines are used to construct a planar strain tensor field. Eigenvalue decomposition of this tensor yields the principal strains and their orientations, which directly relate to the directions and magnitudes of the dominant compressive and extensional stresses [67]. The maximum shear strain, derived from the differential of principal strains, serves as a critical indicator of fault slip potential. Regions where the principal stress orientation aligns with known fault geometries are often interpreted as seismically unstable and prone to rupture.
GNSS-based baselines can detect displacements on the order of millimeters per year, making them particularly effective for monitoring strain accumulation even in tectonically quiet regions [68]. By continuously tracking such subtle changes over time, geodetic baselines can reveal evolving stress conditions and highlight zones experiencing persistent strain accumulation—an essential prerequisite for earthquake nucleation [2].
Moreover, geodetically derived stress field models complement traditional seismic hazard assessments based on historical earthquake catalogs by offering greater spatial resolution and the ability to identify aseismic zones of latent stress. Case studies from Japan, Italy, and North China have demonstrated strong correlations between zones of concentrated geodetic strain and subsequent major seismic events [69,70].
Elastic strain fields derived from GNSS data provide a physically grounded and quantitative framework for assessing tectonic stress accumulation. When interpreted within the context of elastic dislocation theory, these fields approximate subsurface stress distributions and help delineate regions of elevated seismic potential. Previous studies have confirmed that geodetic strain directions are consistent with stress orientations inferred from borehole breakouts and seismic moment tensors, reinforcing their applicability in regional hazard mapping [60,61,62].
In this study, relative displacement vectors across GNSS baselines were used to construct planar strain tensors. Eigenvalue decomposition of these tensors yielded principal strain components and orientations, allowing for the identification of maximum compressive and extensional stress directions. Notably, zones exhibiting elevated maximum shear strain or dilatation corresponded spatially with known active fault segments. This alignment suggests ongoing tectonic loading in structurally vulnerable regions and highlights the value of integrating elastic strain indicators into seismic hazard zonation efforts.
Furthermore, the sensitivity of GNSS baselines—capable of detecting sub-centimeter annual movements—enables the monitoring of crustal strain accumulation even in relatively quiescent tectonic settings. When combined with conventional seismic catalogs, these measurements enhance our ability to detect aseismic strain buildup and forecast zones of future seismic activity [63,64,65,66,67,68,69,70].
Figure 11 conceptually illustrates the core workflow adopted in this study: from the acquisition of GNSS displacement data, through the evaluation of stress and strain tensors, to the identification of potential seismic hazard zones. This process highlights how high-resolution geodetic observations can be systematically transformed into meaningful seismotectonic insights. By linking surface displacements with elastic strain modeling, the figure underscores the value of GNSS-based methods in detecting ongoing crustal deformation and informing earthquake hazard assessment frameworks.

Figure 11.
Conceptual workflow illustrating the process of converting GNSS displacement data into elastic strain and stress evaluations, which subsequently inform seismic hazard identification. This framework emphasizes the role of geodetic observations in detecting crustal deformation and supporting tectonic risk assessments.
4.2. Localized Strain Anomalies and Fault Interaction Effects on Seismic Hazard
The application of elastic strain fields derived from GNSS observations represents a significant advancement in the quantitative assessment of seismic hazards. By interpreting relative displacements among geodetic baselines through the framework of elastic dislocation theory, it becomes possible to infer subsurface stress accumulation and delineate zones with elevated rupture potential. The eigen-decomposition of strain tensors enables the extraction of principal strain axes and maximum shear magnitudes, which provide insight into tectonic stress orientations and fault kinematics. In regions where the inferred stress directions align with mapped fault geometries, such as the Yangsan Fault, this correspondence strengthens the case for ongoing tectonic loading and heightened seismic risk.
Beyond shear stress orientations, an examination of the first principal strain (ε1) magnitudes reveals that several triangular elements—specifically Triangles 6, 10, 11, and 16—exhibit notably elevated extensional strain. This anomalous behavior indicates localized zones of heightened stress accumulation, which may not be uniformly distributed along the fault system. Among these, Triangle 16 is particularly significant, as it lies at the intersection between the Yangsan and Ulsan Faults, a region of complex fault-fault interactions. The coexistence of oblique fault geometries in this area likely facilitates distributed deformation and transient stress reorganization.
Moreover, this triangle coincides with a well-defined lithological boundary, as is evident from regional geological maps. The western side is composed predominantly of Mesozoic crystalline basement rocks, including granodiorite and granite (e.g., yγTK2, aγK), whereas the eastern side contains Cretaceous sedimentary formations (e.g., K2, λK2), with localized deposits of Neogene strata (e.g., O2, Q) along the eastern fault margins. Such lithological contrasts introduce mechanical heterogeneity into the crust, which can act as strain concentrators by amplifying differential deformation across material interfaces [69].
The combination of structural discontinuities and lithological contrasts thus provides a plausible explanation for the elevated strain accumulation and angular deviations in strain orientation observed in these regions. These findings underscore the importance of integrating geological and structural context into the interpretation of geodetically derived strain fields, especially when identifying critical segments for seismic hazard evaluation.
In this context, Triangle 16—located at the structural boundary between the Yangsan and Ulsan Faults—demonstrates a notably high maximum shear strain of 2.325 µstrain/yr and a shear stress direction (θ_γmax) of 87.59°, indicating a dominant NE-SW oriented shear regime. When compared to neighboring triangles, such as Triangle 17 (θ_γmax = 33.32°) and Triangle 8 (θ_γmax = 42.56°), the substantial angular deviation in shear orientation (over 45°) observed at Triangle 16 suggests localized reorganization of the stress field, likely induced by complex fault-fault interactions. This directional discrepancy underscores the spatial heterogeneity of deformation patterns and supports the interpretation of Triangle 16 as a critical site for assessing fault reactivation potential.
Such pronounced discrepancies in shear orientation are of particular interest for seismic hazard analysis, as they may indicate abrupt mechanical transitions that influence fault rupture behavior. In particular, Triangle 16 may act either as a structural barrier that impedes rupture propagation due to stress misalignment or as an asperity that concentrates strain energy and facilitates seismic release under critical conditions. The presence of multiple intersecting fault strands and contrasting rock units within this triangle enhances the likelihood of stress partitioning and slip heterogeneity, both of which are important factors in controlling rupture nucleation and arrest. These findings emphasize the need to account for localized strain anomalies and angular discontinuities when modeling fault segmentation and earthquake rupture scenarios in intraplate fault systems.
4.3. Temporal Variability and Observational Challenges in GNSS-Derived Strain Field Interpretation
In particular, the marked temporal variation in strain fields between the 2018–2020 and 2019–2020 periods is a noteworthy observation, suggesting that stress accumulation in this region is not governed solely by static tectonic processes but is also influenced by dynamic mechanisms that evolve over time. One plausible explanation for this variability is the occurrence of aseismic slip along segments of the fault, which can relieve strain without generating detectable seismic events. Additionally, episodic fluid migration along structural weaknesses—such as fault zones or lithological boundaries—may induce localized crustal weakening and facilitate differential deformation. These transient mechanisms, when interacting with pre-existing structural heterogeneities, can lead to short-term fluctuations in both the magnitude and orientation of strain. Therefore, a comprehensive understanding of the temporal evolution of strain in such complex fault systems requires long-term GNSS monitoring in conjunction with integrated analyses of seismic activity and hydrogeological conditions.
High-precision GNSS networks are capable of detecting displacements on the order of millimeters per year, making them particularly effective for monitoring inter-seismic strain accumulation, even in tectonically stable intraplate settings. Notably, geodetic strain field models offer enhanced spatial granularity compared to traditional hazard maps based on historical seismicity. This allows for the identification of aseismic but critically stressed zones that may be overlooked by earthquake catalog-based assessments. In particular, using GAMIT/GLOBK (10.7), millimeter-level precision in displacement measurement is achieved, enhancing the detection of subtle strain accumulation. Case studies from intraplate domains such as North China, Italy, and southwestern Japan have demonstrated that concentrated geodetic strain is often spatially correlated with future large-magnitude events, underscoring the utility of this approach in predictive modeling [1,2,70,71].
Nevertheless, the use of elastic strain fields for seismic hazard assessment is subject to several limitations. First, the elastic assumption inherently simplifies the rheological behavior of the crust, neglecting time-dependent viscoelastic or inelastic deformation that may significantly influence long-term strain evolution [31,32]. In regions undergoing slow slip, fluid migration, or postseismic relaxation, this simplification may lead to misinterpretation of the actual stress state. Second, the resolution and accuracy of strain field estimates are highly dependent on the spatial distribution of GNSS stations. In areas where the network is sparse or uneven—such as mountainous terrains or offshore regions—strain interpolation can introduce artifacts and obscure localized deformation signals [2].
Accordingly, this study improved the spatial resolution of the GNSS network by utilizing existing GNSS CORS data [72] and conducting three additional campaigns of geodetic point observations. However, these supplementary surveys are resource intensive, requiring considerable time and manpower, which poses limitations for long-term monitoring. While the study compares deformation fields between the 2018 to 2020 and 2019 to 2020 periods, incorporating more frequent temporal intervals, such as quarterly or semiannual snapshots, could enhance the ability to detect transient deformation signals and distinguish them from long-term trends. To enable high-precision monitoring of the elastic strain field in the Gyeongju and Pohang regions, where multiple nuclear power plants are concentrated, it is essential to establish a dense GNSS observation network by installing additional permanent CORSs along the Yangsan Fault zone.
4.4. Toward an Integrated Framework for GNSS-Based Seismic Hazard Modeling
To overcome the limitations inherent in elastic strain models, it is essential to adopt an integrative approach that combines GNSS-derived strain field data with detailed fault maps, geological cross-sections, and region-specific elastic models. Such multidisciplinary integration enhances the physical realism of deformation modeling and contributes to a more accurate understanding of long-term fault system behavior. However, the temporal variability observed in GNSS strain fields presents additional challenges for interpretation. Short-term anomalies may result from seasonal surface loading, transient aseismic deformation, or noise within the observational dataset, all of which complicate the distinction between sustained tectonic loading and episodic perturbations [1]. Furthermore, although maximum shear strain is a useful proxy for assessing fault slip potential, it does not directly indicate rupture probability or timing. Therefore, the interpretation of elastic strain fields should be conducted in conjunction with complementary datasets, including paleoseismic records, seismicity catalogs, geomechanical models, and geological parameters such as lithological heterogeneity, fault zone material properties, and structural boundary conditions. This integrated framework enables a more comprehensive and reliable assessment of regional seismic hazards and plays a crucial role in improving the predictability of future seismic events by advancing our understanding of complex crustal deformation processes.
To advance this integration, observed geodetic strain rates can serve as critical input parameters for probabilistic seismic hazard models (PSHM), especially in regions with sparse or incomplete historical seismicity. By linking the rate of strain accumulation to long-term seismic moment release, it becomes possible to estimate the frequency and spatial distribution of future earthquakes over defined time intervals. For instance, ref. [73] demonstrated a strong correlation between strain rate and seismicity in the India–Asia collision zone, suggesting that geodetic strain can act as a proxy for estimating seismic hazard in tectonically active but data-limited regions. Similarly, refs. [74,75] employed geodetic strain rates to calibrate moment rate budgets and spatially refine seismic source zones in New Zealand and Mainland China, respectively.
These studies show that the inclusion of geodetic data improves the spatial resolution and physical basis of PSHM, particularly by informing slip rate models and constraining the Gutenberg–Richter parameters. Moreover, as [42] emphasizes, careful treatment of strain rate uncertainties further enhances the robustness of probabilistic forecasts. Therefore, integrating GNSS-derived strain data into PSHM frameworks represents a promising approach for refining regional seismic hazard assessments on the Korean Peninsula.
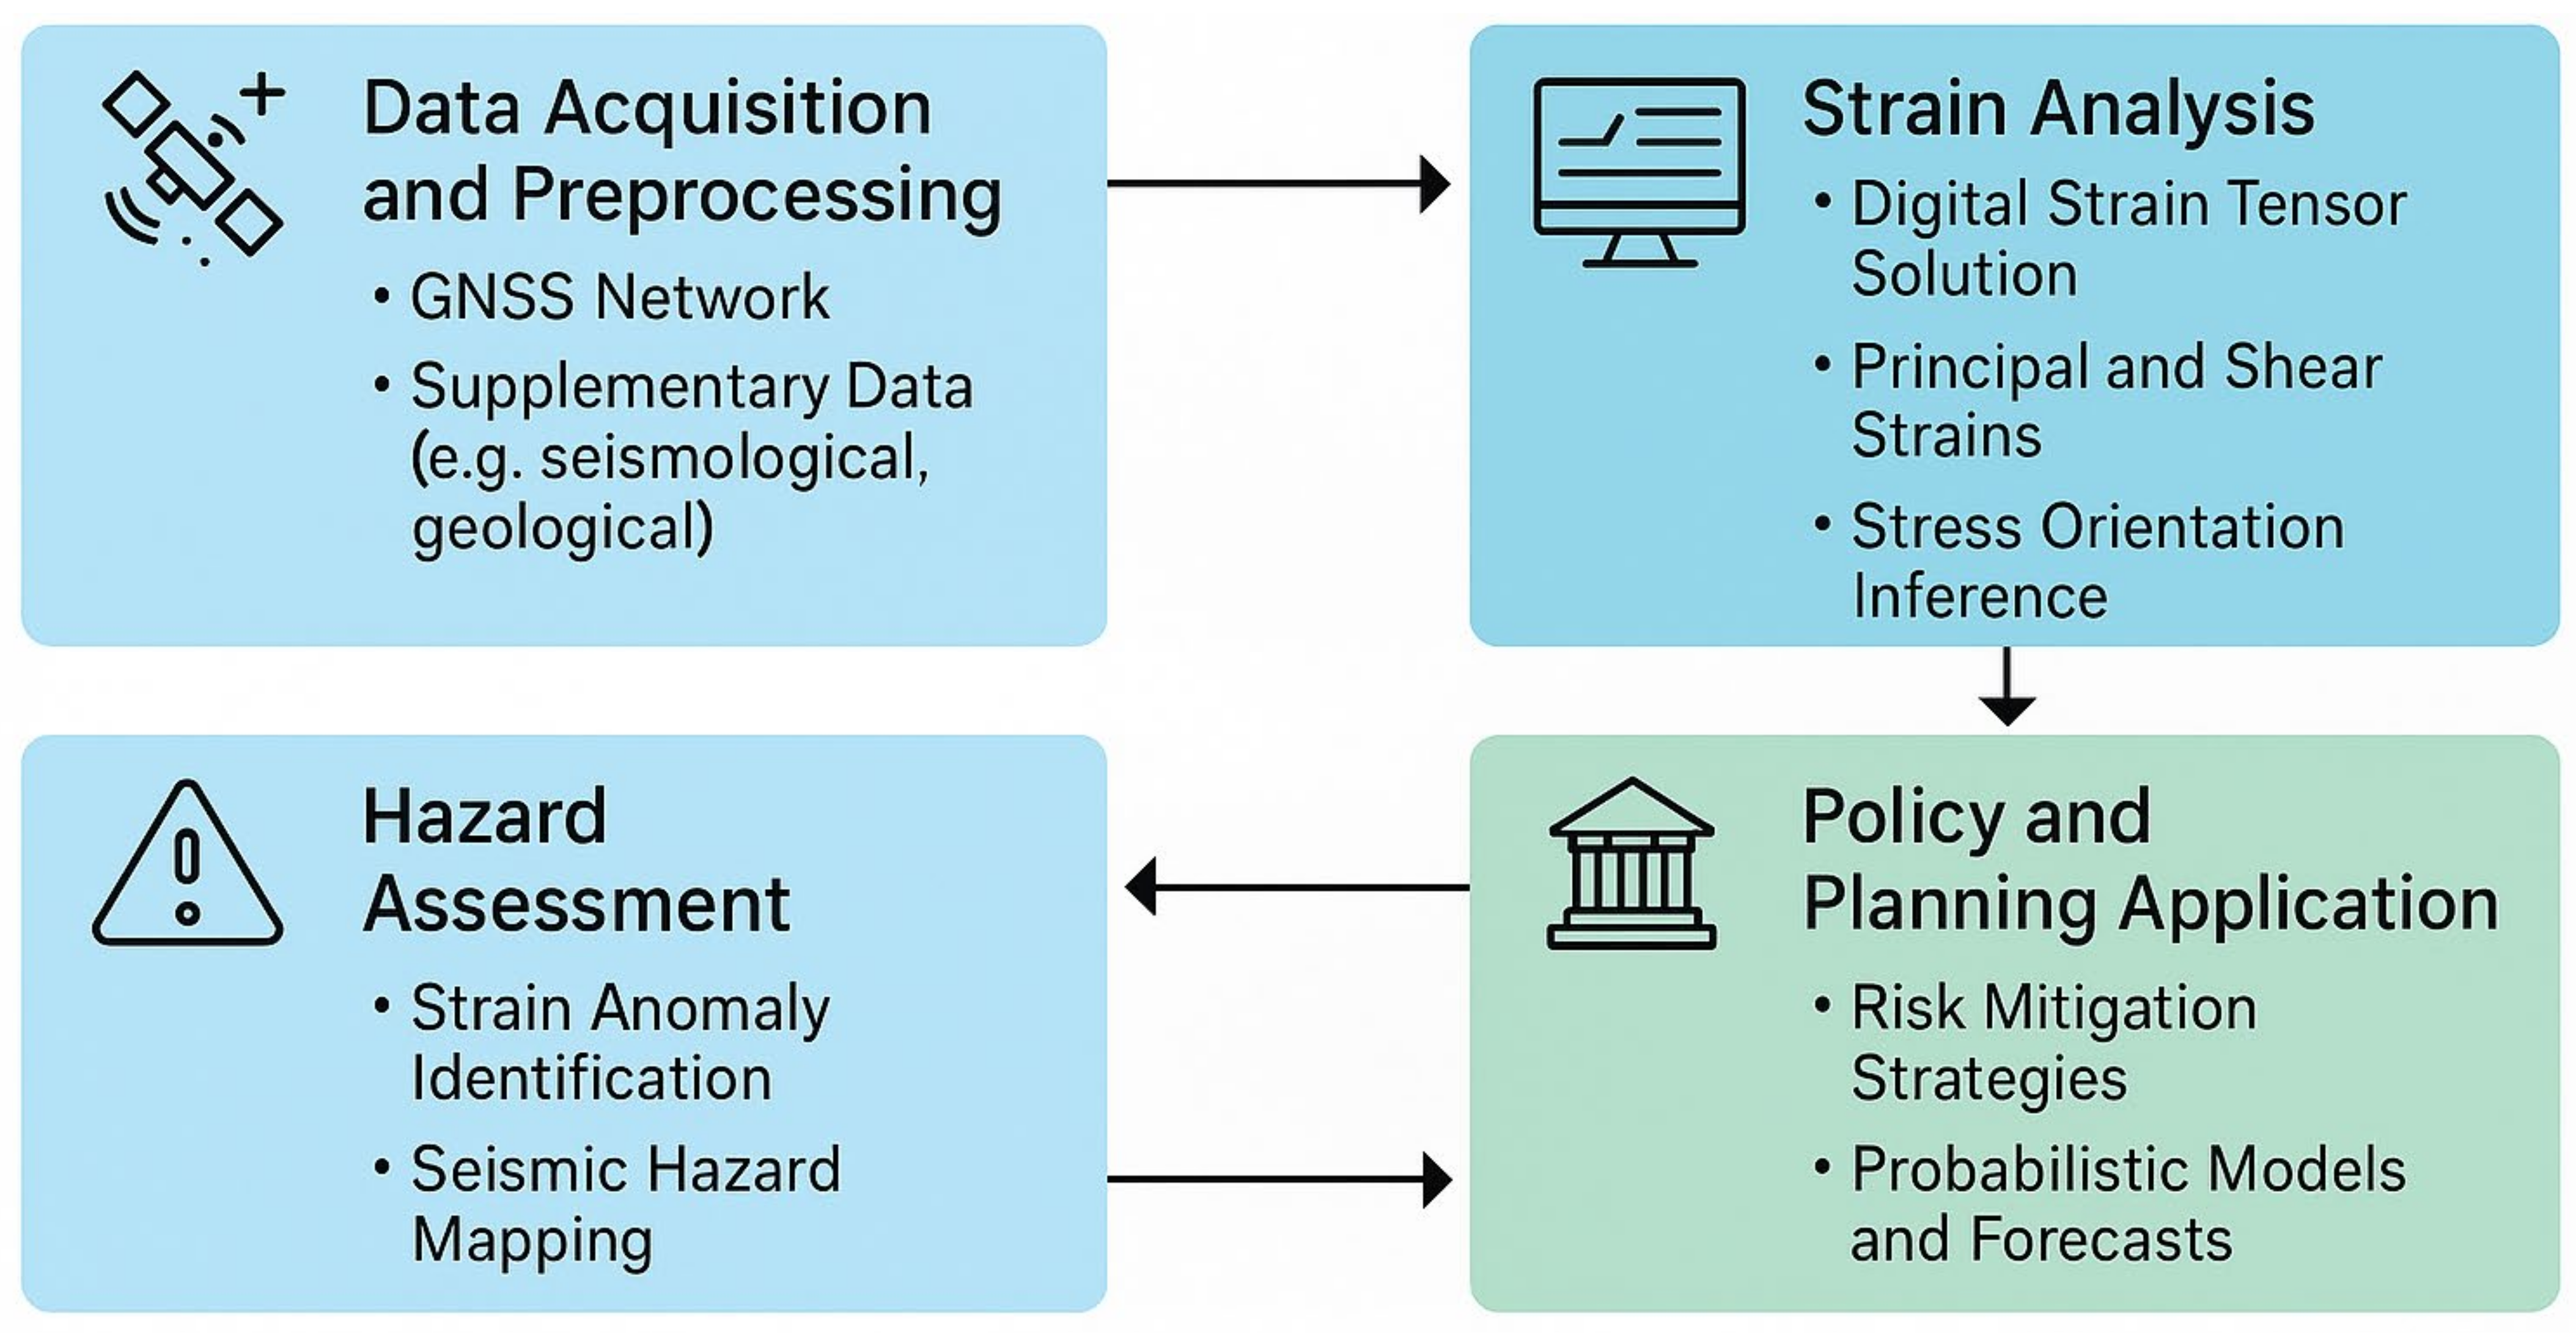
Figure 12 presents a conceptual roadmap outlining the integrative workflow for GNSS-based strain analysis and its application to seismic hazard assessment and policy planning. The framework emphasizes the sequential linkage from data acquisition to decision support, incorporating strain anomaly detection and probabilistic hazard modeling. This diagram underscores the importance of combining geodetic observations with geological and seismological data to inform risk mitigation strategies and enhance regional seismic resilience.
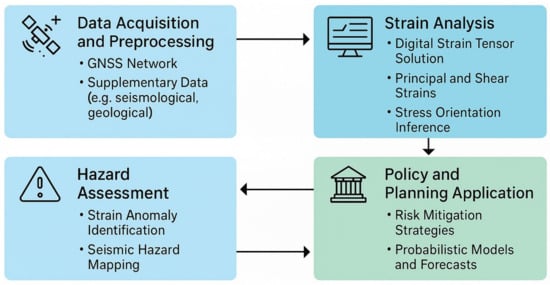
Figure 12.
Conceptual framework for integrating GNSS-based strain analysis into seismic hazard assessment and policy planning. The process begins with data acquisition and preprocessing, utilizing GNSS network observations alongside supplementary geological and seismological datasets. This is followed by strain analysis, where digital strain tensor solutions are derived to extract principal and maximum shear strains and infer regional stress orientations. In the hazard assessment phase, anomalies in strain patterns are identified and mapped to delineate zones of elevated seismic risk. Finally, outputs feed into policy and planning applications, enabling the formulation of risk mitigation strategies and the development of probabilistic seismic hazard models and forecasts (PSHM). This framework highlights a multidisciplinary approach that enhances the reliability and applicability of strain-based assessments in tectonically active yet low-seismicity intraplate regions.
5. Conclusions
This study presents a quantitative analysis of crustal deformation in southeastern Korea by integrating dense GNSS baseline measurements with elastic tensor modeling. Temporal and spatial comparisons of strain and stress fields revealed notable shear strain accumulation along the central segment of the Yangsan Fault, consistent with ongoing tectonic loading. The results demonstrate the effectiveness of GNSS-derived strain tensors in distinguishing between steady-state and transient deformation regimes in intraplate environments.
The findings highlight the importance of deploying a spatially optimized and structurally stable GNSS network, particularly in regions near active faults. Enhanced spatial resolution, combined with continuous high-frequency monitoring, would improve the ability to resolve localized deformation and assess seismic hazard with greater confidence. In light of the proximity of critical infrastructure and active fault systems, a strategic upgrade of Korea’s geodetic infrastructure should be considered.
By applying a physically grounded elastic strain framework, this study provides a methodological foundation for linking surface deformation patterns to underlying fault behavior. Future work should incorporate fault mechanics, real-time stress monitoring, and integrated modeling to further refine assessments of fault stability and seismic risk in structurally complex intraplate settings.
Author Contributions
Conceptualization, S.-J.L., S.-H.L. and H.-S.Y.; methodology, S.-J.L., S.-H.L. and D.-H.S.; software, S.-J.L. and S.-H.L.; validation, S.-J.L., S.-H.L. and H.-S.Y.; formal analysis, S.-J.L., S.-H.L. and D.-H.S.; investigation, S.-J.L. and S.-H.L.; resources, S.-J.L., S.-H.L. and D.-H.S.; data curation, S.-J.L., S.-H.L. and D.-H.S.; writing—original draft preparation, S.-J.L. and S.-H.L.; writing—review and editing, H.-S.Y. and D.-H.S.; visualization, S.-J.L., S.-H.L. and D.-H.S.; supervision, H.-S.Y.; project administration, H.-S.Y.; funding acquisition, H.-S.Y. All authors have read and agreed to the published version of the manuscript.
Funding
This work was supported by a National Research Foundation of Korea (NRF) grant funded by the Korea government (MSIT) (RS-2021-NR059478).
Institutional Review Board Statement
Not applicable.
Informed Consent Statement
Not applicable.
Data Availability Statement
The original contributions presented in the study are included in the article, further inquiries can be directed to the corresponding author.
Conflicts of Interest
The authors declare no conflicts of interest.
Appendix A
Appendix A provides schematic illustrations that support the conceptual understanding of strain and stress in geodetic deformation analysis. These figures are intended to complement the advanced geodetic computations presented in the main text by visualizing how strain is manifested and interpreted in simplified geometries.

Figure A1.
Schematic of strain-induced deformations: gray areas show original shapes, dashed lines indicate deformed boundaries, and red arrows represent principal stress (σ1) directions under (a) horizontal deformation (εx), (b) vertical deformation (εy), and (c) shear deformation (γxy).
Figure A1.
Schematic of strain-induced deformations: gray areas show original shapes, dashed lines indicate deformed boundaries, and red arrows represent principal stress (σ1) directions under (a) horizontal deformation (εx), (b) vertical deformation (εy), and (c) shear deformation (γxy).


Figure A2.
Schematic representation of peripheral strain in geodetic triangulation networks. (Left) The initial and later state of a circular element undergoing deformation due to external stress, visualized as an ellipse with two principal strain axes: S1 (horizontal extension) and S2 (vertical compression). (Center) Vector diagram illustrating strain-induced line segment elongation: segment PQ with original length S is displaced to P′Q′, exhibiting a length increase in ΔS, aligned with the direction of local strain gradients. (Right) A geodetic triangle △ABC, with sides a, b, and c, shows an internal strain ellipse derived from GNSS point displacements. Rotational angles αa, αb, and αc and orientation angles θa, θb, and θc are marked at each vertex. The strain ellipse at the centroid indicates the orientation and magnitude of principal strains ε1 and ε2, with arrows showing tensile and compressive directions.

References
- Nishimura, T. Time-Independent Forecast Model for Large Crustal Earthquakes in Southwest Japan Using GNSS Data. Earth Planets Space 2022, 74, 69. [Google Scholar] [CrossRef]
- Carafa, M.M.C.; Vannucci, G.; Burrato, P.; Doglioni, C. Empirical Evidence for Multi-Decadal Transients Affecting Geodetic Velocity Fields and Derived Seismicity Forecasts in Italy. Sci. Rep. 2024, 14, 70816. [Google Scholar] [CrossRef]
- Kim, C.; Cheon, Y.; Lee, T.; Choi, J.; Ha, S.; Jeong, J. Long-Term Weakening Processes and Short-Term Seismic Slip Behavior of an Intraplate Mature Fault Zone: A Case Study of the Yangsan Fault, SE Korea. J. Geophys. Res. Solid Earth 2022, 127, e2021JB023154. [Google Scholar] [CrossRef]
- Cheon, Y.; Cho, H.; Ha, S.; Kang, H.; Kim, J.; Son, M. Tectonically Controlled Multiple Stages of Deformation along the Yangsan Fault Zone, SE Korea, Since Late Cretaceous. J. Asian Earth Sci. 2019, 177, 248–263. [Google Scholar] [CrossRef]
- Naik, S.; Rockwell, T.; Jeong, S.; Kim, Y.; Shin, H.; Choi, J.; Ha, S.; Son, M. Evidence for Large Holocene Earthquakes along the Yangsan Fault in the SE Korean Peninsula Revealed in Three-Dimensional Paleoseismic Trenches. Geol. Soc. Am. Bull. 2024, 136, 512–529. [Google Scholar] [CrossRef]
- Kim, T.; Choi, J.; Cheon, Y.; Lee, T.; Kim, N.; Lee, H.; Kim, C.; Choi, Y.; Bae, H.; Kim, Y.; et al. Correlation of Paleoearthquake Records at Multiple Sites along the Southern Yangsan Fault, Korea: Insights into Rupture Scenarios of Intraplate Strike-Slip Earthquakes. Tectonophysics 2023, 847, 229817. [Google Scholar] [CrossRef]
- Moon, S.; Kim, H.; Kim, C.; Jun, H.; Lee, S.; Joo, H.; Kim, K. The Quaternary Slip Rate of the Yangsan Fault Offshore the SE Korean Peninsula and Implications for Seismic Hazard Assessment. Geomat. Nat. Hazards Risk 2021, 12, 548–565. [Google Scholar] [CrossRef]
- Sim, H.; Song, Y.; Hong, S. Insights of Fault Activities Through 3-D Shape Preferred Orientation and Illite Age Analysis. Geol. Soc. Am. Bull. 2024, 136, 650–668. [Google Scholar] [CrossRef]
- Bilal, A.; Yang, R.; Li, Y.; Zhang, J.; Janjuhah, H.T. Microfacies shift in the Late Paleocene–Early Eocene Patala Formation in the Upper Indus Basin (Pakistan): Implications for development of the Ceno-Tethys Ocean. Mar. Pet. Geol. 2024, 161, 106693. [Google Scholar] [CrossRef]
- Yu, Z.; Yin, N.; Wang, C.; Deng, M.; Lan, W. Active tectonics, paleoseismology and seismic hazards of the piedmont Xizhoushan fault zone in the Shanxi graben system, North China Block. J. Asian Earth Sci. 2021, 205, 104590. [Google Scholar] [CrossRef]
- Sibson, R.H. Preparation zones for large crustal earthquakes consequent on fault-valve action. Earth Planets Space 2020, 72, 31. [Google Scholar] [CrossRef]
- Elliott, J.R.; Walters, R.J.; Wright, T.J. The role of space-based observation in understanding and responding to active tectonics and earthquakes. Nat. Commun. 2016, 7, 13844. [Google Scholar] [CrossRef]
- Duong, T.N.; Huang, B.S.; Dinh, V.T.; Lai, H.P.; Bui, V.T.; Sulinthone, O.; Pham, H.T.; Pham, N.D.; Nguyen, V.H.; Duangpaseuth, S. Identification of the active faults and seismotectonic zonation of Laos territory. Vietnam J. Earth Sci. 2024, 46, 489–514. [Google Scholar] [CrossRef]
- Ren, Z.; Zielke, O.; Yu, J. Active tectonics in 4D high-resolution. J. Struct. Geol. 2018, 117, 264–271. [Google Scholar] [CrossRef]
- Liang, S.; Zheng, W.; Zhang, D.; Peng, H.; Sun, X.; Wei, S. Holocene earthquake cycles of an active tectonic block boundary fault zone: A case study in the Qilian–Haiyuan fault zone, Northeastern Tibet Plateau. Lithosphere 2023, 2023, 7919174. [Google Scholar] [CrossRef]
- Mavrommatis, A.; Segall, P.; Johnson, K. A decadal-scale deformation transient prior to the 2011 Mw 9.0 Tohoku-oki earthquake. Geophys. Res. Lett. 2014, 41, 3787–3795. [Google Scholar] [CrossRef]
- Socquet, A.; Marill, L.; Marsan, D.; Rousset, B.; Radiguet, M.; Burgmann, R.; Cotte, N.; Bouchon, M. Revisiting the deformation transients before the 2011 Tohoku-Oki Megathrust Earthquake with GPS. In Proceedings of the EGU General Assembly Conference Abstracts, Online, 4–8 May 2020. EGU2020-21477. [Google Scholar] [CrossRef]
- Kato, A.; Obara, K.; Igarashi, T.; Tsuruoka, H.; Nakagawa, S.; Hirata, N. Propagation of Slow Slip Leading Up to the 2011 Mw 9.0 Tohoku-Oki Earthquake. Science 2012, 335, 705–708. [Google Scholar] [CrossRef]
- Martín-González, F.; Crespo-Martín, C.; Cesca, S.; González-Muñoz, S. Understanding Seismicity and Seismotectonics in a Stable Continental Region (NW Iberian Peninsula): Implications for the Nature of Intraplate Seismicity. Glob. Planet. Change 2023, 226, 104177. [Google Scholar] [CrossRef]
- Parizot, O.; Missenard, Y.; Barbarand, J.; Blaise, T.; Sarda, P.; Benedicto, A.; Haurine, F. How Sensitive Are Intraplate Inherited Structures? Insight from the Cévennes Fault System (Languedoc, SE France). Geol. Mag. 2022, 159, 2033–2049. [Google Scholar] [CrossRef]
- Dyksterhuis, S.; Müller, R.D. Cause and Evolution of Intraplate Orogeny in Australia. Geology 2008, 36, 495–498. [Google Scholar] [CrossRef]
- Choi, S.; Kim, S.; Yoon, J.; Choi, E. Tectonic Evolution of the Yangsan Fault, SE Korea, by Gravity Field Interpretation. Geophys. J. Int. 2023, 236, 1863–1878. [Google Scholar] [CrossRef]
- Ha, S.; Son, M.; Seong, Y. Active Fault Trace Identification Using a LiDAR High-Resolution DEM: A Case Study of the Central Yangsan Fault, Korea. Remote Sens. 2022, 14, 4838. [Google Scholar] [CrossRef]
- Ha, S.; Kang, H.; Lee, S.; Seong, Y.; Choi, J.; Kim, S.; Son, M. Quaternary Surface Ruptures of the Inherited Mature Yangsan Fault: Implications for Intraplate Earthquakes in Southeastern Korea. Solid Earth 2025, 16, 197–217. [Google Scholar] [CrossRef]
- Chough, S.K.; Sohn, Y.K. Tectonic and sedimentary evolution of a Cretaceous continental arc–backarc system in the Korean peninsula: New view. Earth-Sci. Rev. 2010, 101, 225–249. [Google Scholar] [CrossRef]
- Son, M.; Song, C.W.; Kim, M.C.; Cheon, Y.B.; Jung, S.H.; Cho, H.S.; Son, Y.G. Miocene crustal deformation, basin development, and tectonic implication in the southeastern Korean Peninsula. J. Geol. Soc. Korea 2013, 49, 93–118. [Google Scholar] [CrossRef]
- Lee, M.S.; Kang, P.C. Geological Map of Korea, Yangsan Sheet, 1:50,000; Geological Survey of Korea: Seoul, Republic of Korea, 1964. [Google Scholar]
- Kim, N.J.; Kwon, Y.I.; Jin, M.S. Geological Map of Korea, Moryang Sheet, 1:50,000; Geological Survey of Korea: Seoul, Republic of Korea, 1971. [Google Scholar]
- Lee, Y.J.; Lee, I.K. Geological Map of Korea, Eonyang Sheet, 1:50,000; Geological Survey of Korea: Seoul, Republic of Korea, 1972. [Google Scholar]
- Kim, N.; Choi, J.; Park, S.; Lee, T.; Choi, I. Cumulative Offset Analysis of the Central-Southern Yangsan Fault Based on Topography of Quaternary Fluvial Terrace. J. Geol. Soc. Korea 2020, 56, 135–154. [Google Scholar] [CrossRef]
- Turcotte, D.L.; Schubert, G. Geodynamics, 3rd ed.; Cambridge University Press: Cambridge, UK, 2014. [Google Scholar] [CrossRef][Green Version]
- Segall, P. Earthquake and Volcano Deformation; Princeton University Press: Princeton, NJ, USA, 2010. [Google Scholar] [CrossRef]
- Okaya, D.; Vel, S.; Song, W.; Johnson, S. Modification of crustal seismic anisotropy by geological structures (“structural geometric anisotropy”). Geosphere 2019, 15, 1450–1462. [Google Scholar] [CrossRef]
- Ip, S.; Borja, R. Multiscale interactions of elastic anisotropy in unsaturated clayey rocks using a homogenization model. Acta Geotech. 2023, 18, 2547–2564. [Google Scholar] [CrossRef]
- Nogueira, L.; Borges, L.; Castello, D. Integrating MIL and Mori–Tanaka methods for microstructural analysis and mechanical behaviour prediction in heterogeneous materials. Mech. Mater. 2024, 190, 105167. [Google Scholar] [CrossRef]
- Backus, G. Long-Wave Elastic Anisotropy Produced by Horizontal Layering. J. Geophys. Res. 1962, 67, 4427–4440. [Google Scholar] [CrossRef]
- Zhuang, X.; Wang, Q.; Zhu, H. A 3D computational homogenization model for porous material and parameters identification. Comput. Mater. Sci. 2015, 96, 579–591. [Google Scholar] [CrossRef]
- Wang, S.; He, Y.; Deng, Z. Stretching-dominated truss lattice materials: Elastic anisotropy evaluation, control, and design. Compos. Struct. 2022, 299, 116004. [Google Scholar] [CrossRef]
- Ohnaka, M. A physical basis for earthquakes based on the elastic rebound model. Bull. Seismol. Soc. Am. 1976, 66, 533–552. [Google Scholar] [CrossRef]
- Bányai, L. The role of the elastic rebound theory in design and evaluation of deformation surveys. Tectonophysics 1992, 202, 369–375. [Google Scholar] [CrossRef]
- Griffin, J.; Stirling, M.; Wang, T. Periodicity and Clustering in the Long-Term Earthquake Record. Geophys. Res. Lett. 2020, 47, e2020GL089272. [Google Scholar] [CrossRef]
- Maurer, J.; Materna, K. Quantification of geodetic strain rate uncertainties and implications for seismic hazard estimates. Geophys. J. Int. 2023, 235, 1879–1896. [Google Scholar] [CrossRef]
- Kreemer, C.; Blewitt, G.; Klein, E. A geodetic plate motion and Global Strain Rate Model. Geochem. Geophys. Geosyst. 2014, 15, 3849–3889. [Google Scholar] [CrossRef]
- Bird, P.; Kreemer, C.; Holt, W. A Long-Term Forecast of Shallow Seismicity Based on the Global Strain Rate Map. Seismol. Res. Lett. 2010, 81, 184–194. [Google Scholar] [CrossRef]
- Wu, H. Continuum Mechanics and Plasticity; CRC Press: Boca Raton, FL, USA, 2004. [Google Scholar] [CrossRef]
- Liu, X.; Ji, Y.; Liang, Q. Expression of strain tensor in orthogonal curvilinear coordinates. Geod. Geodyn. 2010, 1, 48–52. [Google Scholar] [CrossRef][Green Version]
- Ayissi, R. A Rereading and a Mathematical Formulation of Deformations and Strains in Elasticity. Int. J. Math. Anal. Optim. Theory Appl. 2013, 1, 1–14. [Google Scholar]
- Faraji-Oskouie, M.; Ansari, R.; Darvizeh, M. A variational differential quadrature solution to finite deformation problems of hyperelastic shell-type structures: A two-point formulation in Cartesian coordinates. Appl. Math. Mech. 2022, 43, 911–926. [Google Scholar] [CrossRef]
- Doğruoğlu, A.; Komurcu, S. Nonlinear mixed finite element formulations for the analysis of planar curved beams. Comput. Struct. 2019, 224, 106121. [Google Scholar] [CrossRef]
- Fialko, Y. Interseismic strain accumulation and the earthquake potential on the southern San Andreas fault system. Nature 2007, 441, 968–971. [Google Scholar] [CrossRef]
- Serpelloni, E.; Cavaliere, A.; Martelli, L.; Pintori, F.; Anderlini, L.; Borghi, A.; Randazzo, D.; Bruni, S.; Devoti, R.; Perfetti, P.; et al. Surface Velocities and Strain-Rates in the Euro-Mediterranean Region From Massive GPS Data Processing. Front. Earth Sci. 2022, 10, 907897. [Google Scholar] [CrossRef]
- Bawa, S.; Ojigi, L.; Dodo, J.; Lawal, K. Strain rate field on the Nigeria lithosphere derived from GNSS velocity. Appl. Geomat. 2020, 13, 179–193. [Google Scholar] [CrossRef]
- Zhang, Z.; Zhang, H.; Shi, Y. Reconciling high-resolution strain rate of continental China from GNSS data with the spherical spline interpolation. Tectonophysics 2025, 898, 230614. [Google Scholar] [CrossRef]
- Pagani, C.; Bodin, T.; Métois, M.; Lasserre, C. Bayesian Estimation of Surface Strain Rates From Global Navigation Satellite System Measurements: Application to the Southwestern United States. J. Geophys. Res. Solid Earth 2021, 126, e2021JB021905. [Google Scholar] [CrossRef]
- Pérez-Peña, A.; Fernández-Ros, A.; Rosado, B.; De Gil, A.; Prates, G.; Gárate, J.; Berrocoso, M. Integration of GNSS-GPS networks (cGPS) for obtaining stress and strain models for the SPINA region (south of the Iberian Peninsula and North Africa). In Proceedings of the EGU General Assembly Conference Abstracts 2020, Online, 4–8 May 2020. [Google Scholar] [CrossRef]
- Farolfi, G.; Del Ventisette, C. Strain rates in the Alpine Mediterranean region: Insights from advanced techniques of data processing. GPS Solut. 2017, 21, 1013–1023. [Google Scholar] [CrossRef]
- Marotta, G.; França, G.S.; Monico, J.F.G.; Bezerra, F.H.; Fuck, R.A. Strain rates estimated by geodetic observations in the Borborema Province, Brazil. J. S. Am. Earth Sci. 2015, 58, 220–229. [Google Scholar] [CrossRef]
- Xiong, Z.; Zhuang, J. Crustal strain-rate fields estimated from GNSS data with a Bayesian approach and its correlation to seismic activity. Tectonophysics 2021, 815, 229003. [Google Scholar] [CrossRef]
- Shen, K.; Li, Y.; Liu, T.; Zuo, J.; Yang, Z. Adaptive-Robust Fusion Strategy for Autonomous Navigation in GNSS-Challenged Environments. IEEE Internet Things J. 2024, 11, 6817–6832. [Google Scholar] [CrossRef]
- Jarosiński, M.; Araszkiewicz, A.; Bobek, K.; Gogołek, T. Contemporary state of stress in a stable plate interior (northern Poland): The integration of satellite geodesy, borehole and seismological data. Tectonophysics 2022, 838, 229336. [Google Scholar] [CrossRef]
- Rashidi, A.; Derakhshani, R. Strain and Moment Rates from GPS and Seismological Data in Northern Iran: Implications for an Evaluation of Stress Trajectories and Probabilistic Fault Rupture Hazard. Remote Sens. 2022, 14, 2219. [Google Scholar] [CrossRef]
- Palano, M.; Cannavò, F.; Ferranti, L.; Mattia, M.; Mazzella, M. Strain and stress fields in the Southern Apennines (Italy) constrained by geodetic, seismological and borehole data. Geophys. J. Int. 2011, 187, 1451–1460. [Google Scholar] [CrossRef]
- Haines, A.; Wallace, L. New Zealand-Wide Geodetic Strain Rates Using a Physics-Based Approach. Geophys. Res. Lett. 2020, 47, e2019GL084606. [Google Scholar] [CrossRef]
- Castaldo, R.; Nardis, R.; de Novellis, V.; Ferrarini, F.; Lanari, R.; Lavecchia, G.; Pepe, S.; Solaro, G.; Tizzani, P. Coseismic Stress and Strain Field Changes Investigation Through 3-D Finite Element Modeling of DInSAR and GPS Measurements and Geological/Seismological Data: The L’Aquila (Italy) 2009 Earthquake Case Study. J. Geophys. Res. Solid Earth 2018, 123, 2017JB014453. [Google Scholar] [CrossRef]
- Chai, C.; Delorey, A.; Maceira, M.; Levandowski, W.; Guyer, R.; Zhang, H.; Coblentz, D.; Johnson, P.A. A 3D Full Stress Tensor Model for Oklahoma. J. Geophys. Res. Solid Earth 2020, 126, e2020JB021113. [Google Scholar] [CrossRef]
- Johnson, K. Disagreements in Geodetically Inferred Strain Rates in the Western US With Stress Orientations and Geologic Moment Rates. J. Geophys. Res. Solid Earth 2024, 129, e2023JB027472. [Google Scholar] [CrossRef]
- Okazaki, T.; Nishimura, T.; Yarai, H. Consistent estimation of strain-rate fields from GNSS velocity data using basis function expansion with ABIC. Earth Planets Space 2021, 73, 174. [Google Scholar] [CrossRef]
- Riguzzi, F.; Devoti, R.; Doglioni, C.; Pietrantonio, G.; Pisani, A.R.; Serpelloni, E. Geodetic strain rate and earthquake size: New clues for seismic hazard studies. Tectonophysics 2012, 530–531, 63–71. [Google Scholar] [CrossRef]
- Bilal, A.; Yang, R.; Lenhardt, N.; Han, Z.; Luan, X. The Paleocene Hangu Formation: A Key to Unlocking the Mysteries of Paleo-Tethys Tectonism. Mar. Pet. Geol. 2023, 157, 106508. [Google Scholar] [CrossRef]
- Nucci, R.; Serpelloni, E.; Faenza, L.; Garcia, A.; Belardinelli, M.E. Comparative Analysis of Methods to Estimate Geodetic Strain Rates from GNSS Data in Italy. Ann. Geophys. 2023, 66, DM531. [Google Scholar] [CrossRef]
- Gao, Y.; Qu, W.; Zhang, Q.; Li, J.; Li, D.; Wang, Y.; Hao, M. Assessment of the Seismic Hazard in North China by Combining Micro-Seismicity Records and Geodetic Observations. Tectonophysics 2023, 869, 230130. [Google Scholar] [CrossRef]
- Lee, S.; Yoon, H. Analysis of Crustal Deformation Parameters in the Southeastern Region of the Korean Peninsula Using GNSS. J. Korean Soc. Surv. Geod. Photogramm. Cartogr. 2020, 38, 697–705. [Google Scholar] [CrossRef]
- Stevens, V.L.; Avouac, J.-P. On the Relationship between Strain Rate and Seismicity in the India–Asia Collision Zone: Implications for Probabilistic Seismic Hazard. Geophys. J. Int. 2021, 226, 220–245. [Google Scholar] [CrossRef]
- Maurer, J.; Johnson, K.; Wallace, L.M.; Hamling, I.; Williams, C.A.; Rollins, C.; Gerstenberger, M.; Van Dissen, R. Geodetic Strain Rates for the 2022 Update of the New Zealand National Seismic Hazard Model. Bull. Seismol. Soc. Am. 2024, 114, 57–77. [Google Scholar] [CrossRef]
- Rong, Y.; Xu, X.; Cheng, J.; Chen, G.; Magistrale, H.; Shen, Z.-K. A Probabilistic Seismic Hazard Model for Mainland China. Earthq. Spectra 2020, 36 (Suppl. 1), 1–29. [Google Scholar] [CrossRef]
Disclaimer/Publisher’s Note: The statements, opinions and data contained in all publications are solely those of the individual author(s) and contributor(s) and not of MDPI and/or the editor(s). MDPI and/or the editor(s) disclaim responsibility for any injury to people or property resulting from any ideas, methods, instructions or products referred to in the content. |
© 2025 by the authors. Licensee MDPI, Basel, Switzerland. This article is an open access article distributed under the terms and conditions of the Creative Commons Attribution (CC BY) license (https://creativecommons.org/licenses/by/4.0/).

