Abstract
This study aimed to evaluate how wearable hip exoskeleton assistance affects phase-dependent gait stability in healthy adults using a novel visualization technique known as gait tube analysis. Hip exoskeletons offer significant potential to enhance human locomotion through joint torque augmentation, yet their effects on gait stability across the gait cycle remain underexplored. This study introduces gait tube analysis, a novel method for visualizing center of mass velocity trajectories in three-dimensional state space, to quantify phase-dependent gait stability under hip exoskeleton assistance. We analyzed data from ten healthy adults walking under twelve conditions (ten powered with varying torque magnitude and timing, one passive, and one unassisted), assessing variability via covariance-based ellipsoid volumes. Powered conditions, notably HighLater and HighLatest, significantly increased vertical variability (VT) during early-to-mid stance (10–50% of the gait cycle), with HighLater showing the highest mean ellipsoid volume (99,937 mm3/s3; z = 2.3). Conversely, the passive PowerOff condition exhibited the lowest variability (47,285 mm3/s3; z = –1.7) but higher metabolic cost, highlighting a stability-efficiency trade-off. VT was elevated in 11 of 12 conditions (p ≤ 0.0059), and strong correlations (r ≥ 0.65) between ellipsoid volume and total variability validated the method’s robustness. These findings reveal phase-specific stability challenges and metabolic cost variations induced by exoskeleton assistance, providing a foundation for designing adaptive controllers to balance stability and efficiency in rehabilitation and performance enhancement contexts.
1. Introduction
Falls due to gait instability are a leading cause of injury, costing billions annually and limiting mobility for millions, particularly among aging and clinical populations [1,2,3]. With advancements in wearable robotics, hip exoskeletons have emerged as promising tools to augment locomotion by providing targeted joint torque assistance, benefiting healthy individuals and those with mobility impairments [4,5]. These devices aim to enhance gait performance, reduce metabolic cost, and support rehabilitation by assisting hip extension, a critical component of walking that accounts for up to 45% of mechanical power [2,4,5,6,7]. However, a comprehensive understanding of how exoskeleton assistance influences gait stability throughout the gait cycle remains limited, posing challenges for optimizing device design and control strategies.
Lower-limb robotic exoskeletons have been utilized to support walking across various populations, including individuals with mobility impairments, military personnel, and industrial workers [8]. By providing external mechanical assistance, these devices can reduce muscular demands [8] and decrease the metabolic cost of walking [5,9,10,11,12], enhance self-selected walking speed [13,14,15,16], and reduce fatigue during locomotion. While initial research has focused on improving energy efficiency and gait strength, expanding the functionality of exoskeletons to address stability control has become an increasingly important area of investigation. Notably, hip exoskeletons have attracted growing interest due to their ability to assist the hip joint, an essential contributor to propulsion and postural control during gait, thus potentially improving both gait performance and dynamic balance [3]. Several quantitative metrics have been developed to assess human gait and evaluate such stability improvements.
Traditional approaches to assessing gait stability, such as the margin of stability (MOS), focus on discrete gait events, typically heel contact, using the extrapolated center of mass (XCoM) relative to the base of support [1,3]. MOS integrates COM position and velocity through the linear inverted pendulum model, providing a biomechanically grounded estimate of instantaneous stability [1,3]. However, its event-based nature limits its ability to capture the continuous, multidimensional nature of gait variability, particularly during transitions between gait phases. Furthermore, the interpretability of MOS in the anteroposterior (AP) direction is debated due to walking’s inherently unstable forward-driven mechanics, where the COM often exceeds the base of support to propel the body forward [1,3]. This raises questions about MOS’s suitability as a global stability metric, especially under assistive conditions where compensatory adjustments may occur outside discrete events. Nonetheless, MOS remains a widely used and biomechanically grounded metric that provides valuable insights into stability at discrete gait events, particularly heel strike [1,3]. It has been applied successfully in perturbation studies, clinical assessments, and investigations of fall risk where event-specific deviations are informative. Rather than replacing MOS, our approach offers a complementary tool that expands stability analysis to a continuous, multidimensional framework across the entire gait cycle [1,3].
The interpretation of MoS varies by direction: in the AP plane, the MoS is typically negative, reflecting the “fall forward” mechanics inherent in normal gait, where the extrapolated center of mass (XCoM) moves beyond the anterior boundary of the base of support to enable forward progression. A more negative AP MoS may indicate a greater reliance on momentum-driven stepping, which is not necessarily indicative of instability unless compensatory mechanisms fail. In contrast, the mediolateral (ML) MoS is usually positive and offers a more precise representation of lateral balance control, with smaller values indicating reduced margins and increased demands on neuromuscular control to prevent falls [3]. This directional asymmetry in MoS interpretation is essential when evaluating the effects of assistive devices like hip exoskeletons, which can alter COM dynamics in complex ways. Additionally, step width and ML MoS are closely linked; wider steps typically correspond to increased ML MoS and may reflect compensatory strategies to enhance lateral stability [3]. Recent work has also highlighted the potential of combining biomechanical signals with data-driven models for gait pattern recognition and classification. For example, Zhang et al. [17] introduced a novel method to identify gait patterns based on joint motion signals, offering insights applicable to both sports and clinical rehabilitation settings [17]. While their approach focuses on identifying movement patterns, our work extends this direction by offering a continuous, phase-dependent metric of stability rather than discrete classification, complementing such approaches and supporting applications in exoskeleton control, real-time feedback, and individualized therapy planning.
In addition to MOS, other model-based and dynamical systems approaches, such as Lyapunov exponents [1,3,18,19], Floquet analysis [18], and Poincaré maps [19], have been used to quantify gait stability [1,3,18,19]. Specifically, Local Dynamic Stability, measured as the short-term Lyapunov exponent, captures the immediate divergence of gait trajectories, reflecting sensitivity to small perturbations during walking [1,3,18,19,20,21]. Additionally, the Hurst exponent has been employed to assess the long-range correlations and persistence in gait dynamics, providing insights into the fractal structure of walking patterns and their stability over time [22]. Sample entropy, another dynamical systems metric, quantifies the complexity and predictability of gait time series, offering a measure of irregularity that can indicate underlying stability challenges in locomotor control [23,24,25].
These methods provide insight into walking dynamics’ average local divergence or return map properties over time. While mathematically robust, they often lack intuitive visualization and are not easily interpretable in real-time applications or clinical environments. While traditional metrics such as MoS, Lyapunov exponents, or entropy provide valuable insights, they are typically constrained to single dimensions or isolated events within the gait cycle. These approaches may overlook how stability evolves continuously in three dimensions, particularly in response to dynamic inputs like assistive torque. Moreover, unidimensional metrics may not fully capture the coupled variability between directions (e.g., vertical and mediolateral sway), which can be critical for maintaining balance. A method capable of continuously characterizing gait variability in all three directions throughout the stride would allow for richer interpretation of stability mechanisms and a better understanding of how assistive devices influence balance across different gait phases. To address these limitations, this study presents the first application of gait tube analysis for evaluating gait stability under robotic exoskeleton assistance. Gait tube analysis is a continuous, phase-resolved approach that visualizes COM velocity trajectories in three-dimensional state space and quantifies variability through covariance-based ellipsoids computed across the gait cycle. By computing ellipsoid volumes at each gait phase, gait tubes offer a temporally resolved representation of locomotor stability, capturing the magnitude and orientation of COM variability. This approach is particularly suited for detecting subtle changes in stability induced by external perturbations or assistive interventions, providing a more detailed understanding than traditional metrics.
In this study, we applied gait tube analysis to investigate how a semi-rigid bilateral hip exoskeleton affects gait stability across different cycle phases. We utilized data from a previously published experimental protocol involving ten healthy adults walking under twelve conditions, which systematically varied actuation magnitude and timing [4]. By analyzing COM velocity trajectories and computing ellipsoid volumes for each condition, we aimed to identify which gait phases were most sensitive to exoskeleton assistance and how stability patterns varied with assistance profiles. We hypothesized that hip exoskeleton assistance would significantly alter gait stability, with the greatest effects occurring during the late stance phase (50–60% of the gait cycle) when assistive torque was maximized. Additionally, we expected that ellipsoid volume, as a proxy for multidimensional gait variability, would be significantly increased in powered conditions compared to unassisted walking, exhibiting phase-specific patterns across the gait cycle. This analysis seeks to enhance our understanding of phase-dependent gait stability under assistive conditions and inform the development of intelligent exoskeleton controllers that adapt assistance timing and magnitude to meet individual dynamic stability needs, with applications in clinical rehabilitation and performance enhancement. We specifically expected that ellipsoid volumes would increase during the late stance phase (approximately 50–60% of the gait cycle), coinciding with the peak in exoskeleton torque delivery. Based on prior studies of push-off mechanics, we anticipated that this added torque would introduce greater vertical and mediolateral variability due to alterations in limb propulsion and trunk control demands. While we did not perform an a priori power analysis due to the secondary nature of the data, our study was designed to detect medium-to-large effects in variability metrics, particularly during stance phases under powered assistance.
Therefore, the aim of this study was to investigate the phase-dependent effects of hip exoskeleton assistance on the center of mass variability during walking, using gait tube analysis to quantify multidimensional stability throughout the gait cycle. This approach represents a novel application of gait tube methodology to human-exoskeleton interaction. Unlike traditional gait stability metrics that rely on discrete gait events or stride-averaged statistics, gait tube analysis provides a continuous, multidimensional visualization of center of mass variability. To our knowledge, this is the first study to apply this method to evaluate the destabilizing or stabilizing effects of wearable hip assistance throughout the gait cycle.
2. Materials and Methods
2.1. Data Sources and Preprocessing
This study leveraged data from a previously published experimental protocol evaluating a semi-rigid bilateral hip exoskeleton designed to assist hip extension during treadmill walking [4]. Ten healthy adults participated (4 males, 6 females; mean age: 27.6 ± 5.9 years; body mass: 65.3 ± 13.1 kg; height: 1.66 ± 0.08 m). Participants walked at a fixed speed of 1.25 m/s on a split-belt instrumented treadmill (Bertec, Columbus, OH, USA). Kinematic data were recorded at 120 Hz using a Vicon motion capture system (Vicon Motion Systems Inc., Oxford, UK), and kinetic data were collected at 1000 Hz via integrated force plates.
The hip exoskeleton was actuated by an off-board motor connected through a series-elastic interface and controlled in real-time using a Simulink-based system (SpeedGoat, MathWorks, Natick, MA, USA). A temporal force-tracking controller applied extension torque profiles to the hip joint, with torque onset fixed at 90% of the stride cycle (just before heel strike) and peak torque occurring at 17% (early stance). The duration of torque application varied systematically across conditions by adjusting the end-timing of assistance, ranging from 21% to 49% of the stride cycle. Twelve experimental conditions were tested, comprising ten powered assistance trials, a passive condition (PowerOff, where participants wore the exoskeleton without actuation), and an unassisted condition (NoExo, where the exoskeleton was not worn). The powered conditions combined two torque magnitudes—low (~0.06 Nm/kg) and high (~0.12 Nm/kg)—with five end-timings, labeled as LowEarly, LowEarlier, LowMid, LowLater, LowLatest, HighEarly, HighEarlier, HighMid, HighLater, and HighLatest. For example, LowEarly delivered low-magnitude torque with an end-timing at approximately 21% of the stride cycle, while HighLatest provided high-magnitude torque ending near 49%. The NoExo and PowerOff conditions served as controls, isolating the effects of natural walking and the exoskeleton’s passive mass (5.77 kg).
Gait data were segmented into strides based on heel strike events detected from ground reaction forces and time-normalized to 100 points representing the whole gait cycle (0–100%). Center of mass (COM) velocity trajectories were computed in the anteroposterior (Vx), vertical (Vy), and mediolateral (Vz) directions using kinematic data. Velocities were converted from meters per second to millimeters per second to enhance numerical resolution for variability analyses, consistent with gait tube visualization requirements [4]. For each condition, average COM velocity trajectories were calculated across valid strides per participant. Trials with fewer than five clean strides were excluded to ensure reliable variability estimates. Clean strides were defined as those free of marker loss, tracking artifacts, or irregular timing patterns that deviated more than ±2 standard deviations from the subject’s average stride time [4]. Strides with inconsistent COM trajectories or discontinuities in velocity profiles were excluded based on visual inspection. This ensured that each included stride reflected typical, uninterrupted walking behavior under the given condition. This preprocessing enabled a systematic investigation of how assistance magnitude and timing variations influenced gait mechanics across all twelve conditions.
Participants were included if they were between 18 and 40 years of age, had no known neuromuscular or musculoskeletal impairments, and were capable of walking unaided for prolonged periods. Exclusion criteria included any recent lower limb injury, neurological disorder, cardiovascular condition, or prior use of wearable robotic devices that could interfere with gait mechanics. These criteria ensured the safety of participants and the consistency of gait measurements under exoskeleton conditions, as detailed in the original data collection protocol [1].
All procedures involving human participants were conducted in accordance with the ethical standards of the institutional and/or national research committee and with the 1964 Declaration of Helsinki and its later amendments adopted by the 75th World Medical Association General Assembly (19 October 2024, Helsinki, Finland).
2.2. Gait Tube Analysis
We employed gait tube analysis to quantify phase-dependent gait stability, a multidimensional framework that visualizes COM velocity trajectories in a 3D state space and computes variability via covariance-based ellipsoids [4]. COM velocity trajectories (Vx, Vy, Vz) were extracted and time-normalized to 100 points for each condition. Stride-to-stride variability was assessed by constructing a 3 × 3 covariance matrix of Vx, Vy, and Vz at each gait phase, pooling data across participants. Clean strides were defined as those free from marker dropout, tracking artifacts, or timing anomalies. Strides were excluded if their duration or step length deviated more than ±2 standard deviations from the participant’s mean, or if visual inspection revealed discontinuities in the COM trajectory. Eigenvalues of these matrices were used to derive bivariate ellipsoids, whose volumes quantified local variability, forming a continuous “gait tube” that reflects the evolving structure of COM variability throughout the stride. Specifically, for each normalized gait phase (0–100%), we computed a 3 × 3 covariance matrix of COM velocity (Vx, Vy, Vz) across all valid strides. The eigenvalues and eigenvectors of this matrix were used to define ellipsoids representing local variability. These ellipsoids were then projected onto the plane perpendicular to the mean trajectory using the Frenet–Serret frame to preserve the directional context of variability [26]. A five-point moving window was applied to smooth temporal fluctuations in ellipsoid volume, improving signal clarity while maintaining phase resolution. This process yielded a temporally continuous map of variability that forms the gait tube structure. This method, implemented via the MATLAB R2024b function (MathWorks, Natick, MA, USA) GaitTubePlot_Supplementary_MATLAB_Code.m (Supplementary Material: MATLAB Code), draws on principles from prior studies of multidimensional gait variability. A detailed mathematical formulation of the gait tube analysis method is provided in the Supplementary Material titled “Gait Tube Analysis Mathematical Model”, which accompanies this manuscript.
Gait tubes were visualized from multiple perspectives: 3D (Vx, Vy, Vz), sagittal (Vx vs. Vy), transverse (Vx vs. Vz), and frontal (Vy vs. Vz), as shown in Figure 1. The mean ellipsoid volume was computed over the entire gait cycle for each condition to enable global comparisons. Direction-specific variability was quantified by calculating the stride-to-stride standard deviation of COM velocity in the ML, AP, and VT directions. A total variability index was defined as the sum of these directional variances. At each normalized time point in the gait cycle (0–100%), all valid strides across participants within a given condition were aligned in time. The COM velocity vectors (Vx, Vy, Vz) at each time point were assembled into a data matrix, and a 3 × 3 covariance matrix was computed using standard covariance estimation:
where represents the COM velocity vector for stride , and is the mean vector. This matrix captures the stride-to-stride variability in all three directions.
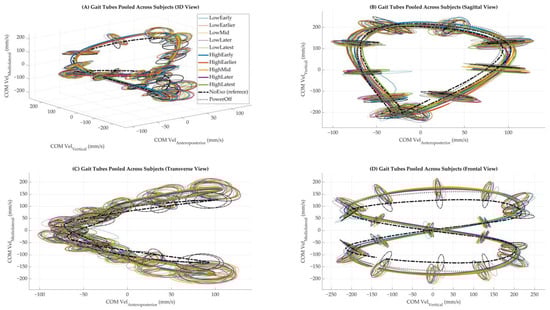
Figure 1.
Gait tubes were pooled across subjects under each walking condition. (A) Three-dimensional view of the center of mass (COM) velocity trajectories in velocity state space. (B) Sagittal view showing COM vertical versus anteroposterior components. (C) Transverse view showing COM mediolateral versus anteroposterior components. (D) The frontal view shows COM mediolateral versus vertical components. Each color represents a distinct walking condition. The NoExo condition is shown as a bold dashed line, and PowerOff is a dotted line, which is included for reference. Ellipsoids were computed at each gait phase and plotted to represent local variability in COM velocity across strides.
We chose to pool data across participants to generate a generalized group-level representation of the gait stability envelope for each condition. This approach enhances the visibility of consistent, condition-dependent variability patterns while controlling for individual idiosyncrasies. For participant-level comparisons (e.g., ellipsoid volume statistics and correlations), separate analyses were conducted to retain individual-specific features.
Z-scores for ellipsoid volume and total variability were computed using the mean and standard deviation of the NoExo condition as a reference, providing a normalized measure of deviation from unassisted walking. Pearson correlation coefficients were calculated between ellipsoid volume and total variability for each condition to explore the relationship between multidimensional and univariate variability. All analyses were conducted using custom MATLAB scripts (MathWorks, Natick, MA, USA) and applied uniformly across the twelve conditions. Results were summarized in tables and visualized through phase-dependent line plots and summary bar graphs, as described in the Results section. Figure 2 shows the gait tube structure for a single representative condition (NoExo), which helps readers understand the shape and flow of COM trajectories in isolation.
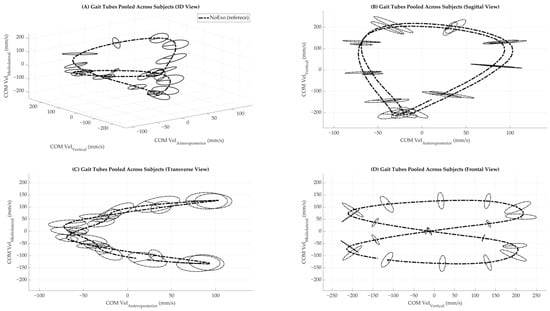
Figure 2.
Gait tubes were pooled across subjects under NoExo walking condition. (A) Three-dimensional view of the center of mass (COM) velocity trajectories in velocity state space. (B) Sagittal view showing COM vertical versus anteroposterior components. (C) Transverse view showing COM mediolateral versus anteroposterior components. (D) The frontal view shows COM mediolateral versus vertical components. The NoExo condition is shown as a bold dashed line. Ellipsoids were computed at each gait phase and plotted to represent local variability in COM velocity across strides.
2.3. Statistical Analyses
To evaluate the effects of exoskeleton assistance on gait stability, non-parametric Wilcoxon signed-rank tests were used to compare each of the ten powered conditions and the PowerOff condition to the NoExo condition across multiple gait stability metrics [14,27]. Phase-dependent comparisons were performed at each of the 100 normalized points across the gait cycle. For each participant and condition, ellipsoid volumes were smoothed using a five-point moving window, and differences from the NoExo condition were assessed at each time point using paired Wilcoxon tests. The minimum p-value across the cycle was recorded for each condition to summarize statistically significant deviations. To reduce the risk of false positives, we interpreted significant effects only if they persisted across multiple contiguous gait phases. For ellipsoid volume, phase-dependent comparisons were performed at each of the 100 normalized gait cycle points. Per-subject ellipsoid volumes were calculated using a five-point sliding window to smooth temporal variations, and pairwise comparisons were conducted at each phase. This window size (5% of the gait cycle) was chosen based on sliding-window practices in cyclic human movement analyses, which recommend small windows (≈5% of the cycle) to balance noise reduction and temporal resolution [28]. It preserves meaningful phase-specific trends while attenuating high-frequency fluctuations that could obscure short-duration effects [28]. Larger windows were avoided to prevent over-smoothing of critical transient changes in gait stability [28]. The minimum p-value across the cycle was recorded to summarize condition-wise deviations from the reference (NoExo). To account for multiple comparisons across 100 gait phases, we applied a temporal clustering approach. Specifically, a condition was only considered statistically different from the NoExo reference if significant p-values (p < 0.05) occurred across at least five consecutive gait points. This method balances sensitivity to phase-dependent effects with control of family-wise error rate and has been applied in prior studies analyzing time-normalized biomechanical data. Direction-specific variability in the ML, AP, and VT directions was assessed by computing the standard deviation of stride-to-stride COM velocity for each axis, averaged across the gait cycle. These variability values were compared to the NoExo condition using the Wilcoxon signed-rank test. A total variability metric, defined as the sum of ML, AP, and VT variances, was also compared using the same statistical approach. To quantify the relationship between multidimensional ellipsoid volume and total linear variability, Pearson correlation coefficients (r) and associated p-values were calculated for each condition, providing insight into the consistency of variability patterns across metrics. All statistical analyses were implemented in MATLAB (MathWorks, Natick, MA, USA) using custom scripts, with a significance threshold of 0.05. Raw p-values for each metric were tabulated, and results were visualized using bar plots and phase-dependent line plots annotated with statistical significance. This approach ensured robust comparisons across conditions, accounting for the non-normal distribution of variability metrics and the paired nature of the experimental design.
3. Results
Multidimensional gait tubes, constructed by pooling strides across all participants for each condition, provided a comprehensive visualization of COM dynamics (Figure 1). Compared to the NoExo and PowerOff conditions, powered conditions exhibited more dispersed trajectories, particularly in the vertical (Vy) and mediolateral (Vz) directions. This dispersion was most pronounced during late stance phases (50–60% of the gait cycle), aligning with the timing of peak torque application in powered conditions (Figure 1).
Phase-specific ellipsoid volumes confirmed that variability evolved dynamically over the gait cycle and was modulated by the exoskeleton’s torque assistance profile (Figure 3A). Most powered conditions exhibited elevated variability during early and mid-stance phases (10–50% of the gait cycle) compared to NoExo. For instance, HighLater and HighLatest showed prominent peaks in ellipsoid volume between 10 and 50%, corresponding to their respective torque profiles (Figure 3B). Statistical significance (Wilcoxon signed-rank test) was indicated by p-values in the legend, with significant differences from NoExo observed for most powered conditions (p < 0.05). Ground reaction force (GRF) trajectories, normalized to body weight, remained consistent across conditions in the anteroposterior, mediolateral, and vertical directions (Figure 3C), suggesting that changes in variability were not driven by altered external loading but rather by the exoskeleton’s assistive torque.
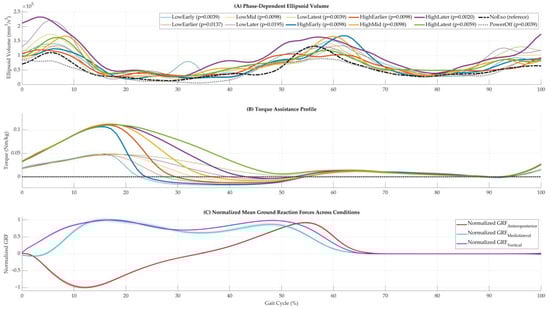
Figure 3.
Phase-dependent metrics and supporting signals across walking conditions. (A) Phase-dependent ellipsoid volumes across the gait cycle for all walking conditions. Based on Wilcoxon signed-rank tests, statistically significant differences from the NoExo condition are indicated by corresponding p-values in the legend. (B) Torque assistance profiles for powered conditions, showing the magnitude and timing of applied hip torque. (C) Mean normalized ground reaction force (GRF) trajectories averaged across subjects and strides in the anteroposterior, mediolateral, and vertical directions.
Group-level comparisons revealed that all powered and PowerOff conditions led to significantly different mean ellipsoid volumes than NoExo (p < 0.05). The HighLater condition exhibited the most excellent mean ellipsoid volume (99,937 mm3/s3; z = 2.3), indicating heightened variability, whereas PowerOff yielded the lowest (47,285 mm3/s3; z = −1.7), reflecting constrained trajectories in the absence of active assistance (Figure 4A). Across directional components, vertical variability (VT) was consistently elevated under powered conditions, with 11 of 12 comparisons reaching significance (p ≤ 0.0059). In contrast, ML and AP variability showed condition-specific responses. HighLater was the only powered condition with significantly increased AP variability (p = 0.0371), while PowerOff was the only condition with significantly reduced ML variability (p = 0.0488) (Figure 4B–D). These findings suggest that VT is particularly sensitive to the presence and timing of exoskeleton assistance.
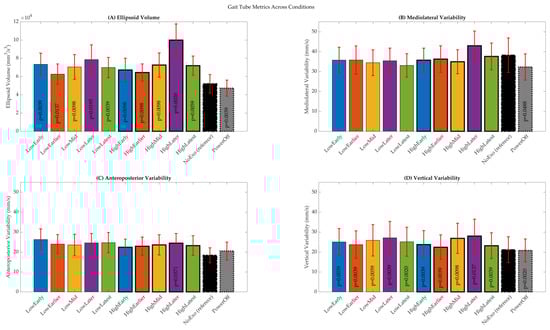
Figure 4.
Summary of gait tube metrics averaged across the gait cycle. (A) Mean ellipsoid volume. (B) Mediolateral variability. (C) Anteroposterior variability. (D) Vertical variability. Bars represent condition-wise means across subjects, and error bars indicate standard deviations. Statistical significance is determined using Wilcoxon signed-rank tests relative to the NoExo condition.
Z-scores and Pearson correlation coefficients were calculated between ellipsoid volume and total variability (sum of ML, AP, and VT variances) to evaluate the alignment between multidimensional and univariate variability measures. Z-scores were positive in most powered trials, indicating increased variability relative to NoExo (Figure 5B). Correlation analysis revealed strong associations (r ≥ 0.65, p < 0.05) between ellipsoid volume and total variability in all but one powered condition, with the strongest relationship observed in HighLatest (r = 0.91, p = 0.0002) (Figure 5C). These results confirm that ellipsoid volume is a robust surrogate for summarizing total variability under varying assistance conditions. Figure 5A presents raw values of ellipsoid volume and total variability, while Figure 5B and Figure 4C show z-scores and correlation coefficients, respectively, with dashed bars indicating reference conditions (NoExo and PowerOff).
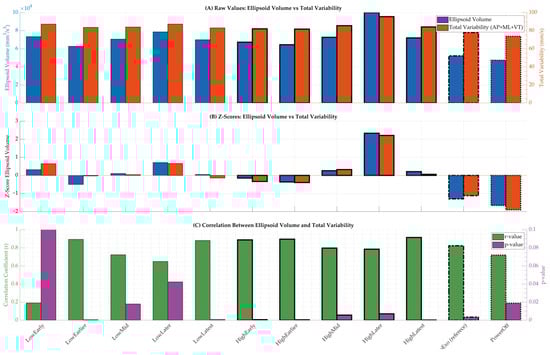
Figure 5.
Summary of variability metrics and correlations across walking conditions. (A) Raw values of ellipsoid volume and total variability for each condition. (B) Z-scores computed relative to the NoExo condition for both metrics. (C) Pearson correlation coefficients (r-values) and corresponding p-values comparing ellipsoid volume and total variability across conditions. Dashed bars indicate reference conditions (NoExo and PowerOff).
A comprehensive summary of extracted metrics is provided in Table 1, including ellipsoid volumes, direction-specific variability (AP, ML, VT), z-scores, statistical significance, correlation results, and metabolic cost [4]. Consistent with visual data, HighLater and HighLatest emerged as the most variable conditions, while PowerOff exhibited the most constrained trajectories. The table quantitatively reinforces the trends observed in Figure 1, Figure 2, Figure 3, Figure 4 and Figure 5, offering a detailed overview of how exoskeleton assistance modulates gait variability across the gait cycle. This increased dispersion was quantified by greater ellipsoid volumes, with powered conditions exhibiting an average volume of 75,232 mm3/s3, compared to 52,097 mm3/s3 in the NoExo condition and 47,285 mm3/s3 in the PowerOff condition. Additionally, vertical variability (standard deviation of vertical COM velocity) was consistently higher in powered conditions, particularly during early-to-mid stance phases (see Table 1). These quantitative differences reflect greater stride-to-stride deviations in COM control during exoskeleton-assisted walking.

Table 1.
Summary of gait tube metrics, direction-specific variability, and metabolic cost across walking conditions. Reported measures include ellipsoid volume (mm3/s3), z-scores, anteroposterior, mediolateral, and vertical variability, total variability (sum of directional variances), Pearson correlation coefficients between ellipsoid volume and total variability, and net metabolic cost (W/kg). p-values reflect Wilcoxon signed-rank test comparisons relative to the NoExo condition.
In addition to the reported p-values in Table 1, we provide 95% confidence intervals for the main stability metrics in Table 2 to further clarify the range and reliability of condition-wise differences.
Table 2.
95% confidence intervals (CIs) for gait stability metrics across powered, unpowered, and baseline walking conditions. Confidence intervals are provided for ellipsoid volume, mediolateral variability, anteroposterior variability, and vertical variability. These intervals help interpret the precision of the observed differences and complement the p-values reported in Table 1.
To further elucidate the impact of hip exoskeleton assistance on multidimensional gait stability, z-scores and correlations of additional stability metrics were analyzed across all conditions (Figure 6). Figure 6A presents the z-scores of seven gait stability metrics—ellipsoid volume, Lyapunov exponent, local dynamic stability, Hurst exponent, sample entropy, maximum Floquet multiplier, and Poincaré variance—relative to the NoExo condition, revealing that powered conditions like HighLater and HighLatest exhibited distinct variability patterns, with z-scores peaking for ellipsoid volume in HighLater (z = 2.33) and for local dynamic stability in HighLatest (z = 1.30). Figure 6B,C display the correlation coefficients (r) and corresponding p-values between ellipsoid volume and the other six metrics, demonstrating varied relationships across conditions; for instance, the correlation for Lyapunov exponent in HighLatest was moderate (r = 0.29, p = 0.41), and for sample entropy in HighLater, it was weakly negative (r = −0.21, p = 0.55), indicating that these relationships were not statistically significant and highlighting the complexity of stability interactions under exoskeleton assistance.
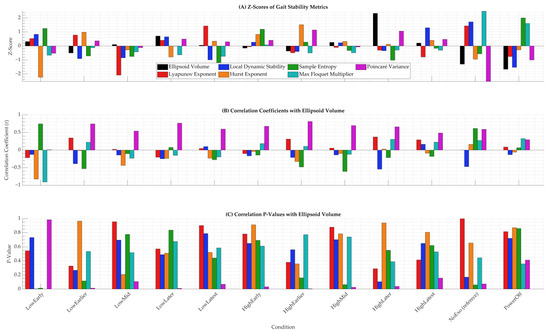
Figure 6.
Z-scores and correlations of gait stability metrics across twelve walking conditions. (A) Z-scores of ellipsoid volume, Lyapunov exponent, local dynamic stability, Hurst exponent, sample entropy, maximum Floquet multiplier, and Poincaré variance, all computed relative to the NoExo condition. The legend identifies each metric. (B) Pearson correlation coefficients (r) between ellipsoid volume and each of the six alternative stability metrics. (C) Corresponding p-values for these correlations across conditions.
Raw values of these stability metrics were compared directly with ellipsoid volume to highlight phase-independent trends across conditions (Figure 7). This figure plots ellipsoid volume on the left y-axis against each of the other six metrics on the right y-axis for subplots A through F, respectively: Lyapunov exponent, local dynamic stability, Hurst exponent, sample entropy, maximum Floquet multiplier, and Poincaré variance. Across all subplots, conditions such as HighLater and HighLatest exhibited elevated values for both ellipsoid volume and the paired metric, particularly during early-to-mid stance, consistent with the phase-specific variability peaks observed in Figure 3A. For instance, HighLater showed the highest raw ellipsoid volume (99,937 mm3/s3) alongside a local dynamic stability value of 0.092, reinforcing the destabilizing effect of high-magnitude, late-timed torque. At the same time, PowerOff consistently displayed the lowest values across metrics, with an ellipsoid volume of 47,285 mm3/s3 and a local dynamic stability value of 0.039, reflecting its stabilizing but metabolically costly nature.
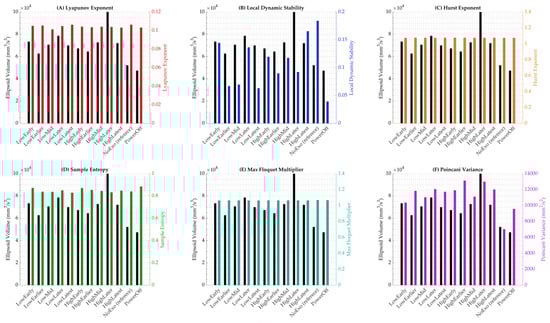
Figure 7.
Raw values of gait stability metrics compared to ellipsoid volume across twelve walking conditions. Each subplot displays ellipsoid volume (left y-axis) alongside a secondary stability metric (right y-axis), allowing for visual comparison of condition-specific trends. (A) Lyapunov exponent. (B) Local dynamic stability. (C) Hurst exponent. (D) Sample entropy. (E) Maximum Floquet multiplier. (F) Poincaré variance.
4. Discussion
This study aimed to investigate how hip exoskeleton assistance affects phase-dependent gait stability using gait tube analysis. We hypothesized that exoskeleton torque, particularly when applied with high magnitude and during late stance, would increase gait variability, with peak effects expected near 50–60% of the gait cycle. Additionally, we anticipated that ellipsoid volume would serve as a valid multidimensional metric for detecting subtle and temporally localized changes in gait stability.
Our results revealed that the greatest variability occurred earlier than expected, primarily during early-to-mid stance (10–50%), with distinct peaks in ellipsoid volume observed during initial contact and toe-off (Figure 3A). These phases correspond to transitions between double and single limb support, where the COM trajectory and base of support rapidly shift [3,29]. These findings are supported by vertical ground reaction force patterns in Figure 3C, suggesting that foot-ground contact events are key phases where gait stability is challenged [3,29]. This earlier-than-expected variability peak may reflect biomechanical instability during weight acceptance and early single-limb support, where the body transitions from double to single support while managing vertical loading. These phases are characterized by rapid changes in limb stiffness, postural control demands, and motor coordination. Additionally, participants may have made anticipatory or compensatory adjustments in response to the onset of hip assistance, which could increase variability earlier in the cycle than the torque peak itself. These findings suggest that exoskeleton-induced perturbations can influence gait stability not only at the moment of maximal assistance but also during preceding preparatory phases when balance demands are already elevated. These early-to-mid stance increases in variability may reflect biomechanical challenges during weight acceptance and transition from double to single limb support. During these phases, the body’s center of mass rapidly shifts over the stance limb while absorbing impact forces and maintaining forward progression. The presence of assistive torque from the hip exoskeleton may disrupt the natural timing and coordination of joint moments, thereby amplifying vertical excursions and postural adjustments. The observed increase in VT, particularly in conditions with late or high-magnitude torque, suggests a potential destabilizing effect on vertical balance control mechanisms, which are critical for trunk and head stabilization. These findings indicate that early stance is a sensitive period for stability disruptions under powered assistance and should be considered when designing exoskeleton controllers that adapt torque delivery in a phase-specific manner. This temporal pattern reinforces the rationale for traditional stability metrics like MOS being calculated at heel strikes [3,30].
This timing corresponds to key biomechanical transitions within the gait cycle. Between 10% and 30%, the body transitions from double to single limb support, requiring coordinated control of vertical and lateral ground reaction forces—critical for maintaining trunk and head stability during weight acceptance and limb stiffness modulation [31,32,33]. During this phase, lower limb joints adjust stiffness to manage vertical loading and ensure smooth progression. The addition of hip torque assistance may alter typical joint moment patterns, introducing instability prior to the peak torque application later in the cycle [31,32,33]. From 30% to 50%, the limb continues weight support while preparing for push-off, a phase that is biomechanically sensitive to force and coordination perturbations [31,32,33]. These findings indicate that phase-specific adjustments in ground reaction force modulation and neuromuscular control underlie the observed early-to-mid stance variability, and they highlight that assistive torque strategies should consider stability demands beginning earlier in the gait cycle than traditionally expected.
The gait tube approach extends these traditional methods by offering a continuous, temporally resolved representation of COM variability across the gait cycle. Unlike event-based or stride-averaged methods such as MOS, Lyapunov exponents [16,24,34], or Floquet analysis [18,30], gait tubes allow for detailed visualization and interpretation of when and where variability increases. The multidimensional gait tubes in Figure 1 demonstrate these patterns visually: powered conditions resulted in wider, more dispersed tubes during stance transitions, while the NoExo condition exhibited narrow, stable trajectories throughout. Group-level comparisons showed that HighLater, which involved high-magnitude torque with a late end timing, produced the largest mean ellipsoid volume (99,937 mm3/s3; z = 2.3), confirming this condition had the greatest destabilizing effect (Figure 4A; Table 1). This finding supports our hypothesis regarding the destabilizing role of prolonged assistance but also shows that the most sensitive period was earlier in the gait cycle than initially predicted.
In direction-specific analyses, AP variability remained stable in most conditions, with only HighLater showing a significant increase (p = 0.0371; Figure 4C; Table 1). This supports the understanding that forward motion in walking is inherently momentum-driven and robust against moderate perturbations [3]. In contrast, ML variability responded more noticeably to changes in condition. Surprisingly, the PowerOff condition (i.e., passive exoskeleton [35,36,37]) led to a significant reduction in ML variability (p = 0.0488; Figure 4B), suggesting that passive structure alone may restrict lateral sway and contribute to stability. These findings offer design insights, indicating that passive and active features influence dynamic balance [35,36,37,38,39].
To explore how ellipsoid volume reflects overall variability, we compared it with total variability (sum of ML, AP, and VT directions). We found consistently strong correlations across powered conditions (r ≥ 0.65), with the strongest relationship seen in HighLatest (r = 0.91, p = 0.0002; Figure 5C). This suggests that ellipsoid volume is a robust surrogate for multidimensional variability and supports its use in future studies or clinical applications. The z-score comparison between ellipsoid volume and total variability further supports their alignment as complementary metrics (Figure 5B and Table 1). In most conditions, both scores shifted in the same direction relative to NoExo, confirming that multidimensional variability captured by the gait tube method reflects the magnitude of direction-specific fluctuations in COM velocity.
The comparison of z-scores for ellipsoid volume and total variability (Table 1; Figure 5B) revealed consistent directional trends across most powered conditions, supporting their alignment as complementary metrics. While ellipsoid volume captures the multidimensional structure of COM fluctuations, total variability provides a unidimensional aggregation. The similarity in z-score patterns across both metrics strengthens the validity of gait tube analysis as a summary method for quantifying stability under varying assistance profiles.
The inclusion of metabolic cost in Table 1 reveals intriguing relationships with gait variability metrics, shedding light on the interplay between energy expenditure and stability under hip exoskeleton assistance. Notably, conditions with high-magnitude torque, such as HighLater and HighLatest, which exhibited the most enormous mean ellipsoid volumes (99,937 mm3/s3 and 92,314 mm3/s3, respectively) and significant VT (p ≤ 0.0059), were associated with reduced metabolic cost compared to the NoExo condition, consistent with prior findings on exoskeleton efficiency [4,12]. This suggests that while powered assistance amplifies COM variability, particularly during early-to-mid stance, it may simultaneously alleviate muscular effort, potentially at the expense of stability. Conversely, the PowerOff condition, with the lowest ellipsoid volume (47,285 mm3/s3) and reduced ML variability (p = 0.0488), showed a higher metabolic cost, likely due to the added inertia of the passive exoskeleton constraining natural gait dynamics [4]. The strong correlations between ellipsoid volume and total variability (r ≥ 0.65) across conditions further indicate that metabolic cost reductions may be linked to increased multidimensional variability, highlighting a trade-off between energy efficiency and dynamic stability. These findings underscore the need for exoskeleton controllers to balance metabolic benefits with stability requirements, particularly by optimizing torque timing to minimize variability during critical stance phases, enhancing safety and efficacy in rehabilitation and performance applications. Based on these findings, we recommend that exoskeleton controllers incorporate phase-specific modulation strategies to reduce torque during early stance (10–30%), where vertical variability was elevated, and apply assistance more conservatively during mid-stance transitions. Adaptive controllers that monitor real-time stability indicators—such as vertical COM fluctuations or variability thresholds—could dynamically adjust torque delivery to prioritize safety without fully sacrificing energetic gains. This phase-aware approach may be particularly beneficial for clinical populations who are more sensitive to balance perturbations.
From a biomechanical perspective, vertical COM control is closely linked to managing ground reaction forces, trunk posture, and head stabilization during stance. The increased VT variability observed under powered conditions may reflect perturbations in the force generation and absorption mechanisms responsible for smooth vertical motion. Hip torque assistance—especially during push-off—can alter leg stiffness and disrupt the neuromuscular coordination of proximal and distal joints, amplifying fluctuations in vertical displacement. This result suggests that exoskeleton designs should consider how vertical force control is affected during late stance to avoid destabilizing the upper body. Notably, vertical ground reaction force analysis during powered exoskeleton walking has shown distinctive loading patterns in such devices, linking vertical loading control to stability maintenance [40,41,42]. Moreover, studies modeling the vertical stiffness of the hip and knee during gait demonstrate that vertical stiffness varies significantly across the gait cycle and is critical for attenuating vertical oscillations [40].
Figure 6 and Figure 7 extend the gait tube analysis by incorporating a broader suite of dynamical stability metrics, revealing nuanced patterns that complement and contrast with the phase-specific variability observed in ellipsoid volumes (Figure 1, Figure 2 and Figure 3). The z-scores in Figure 6A show that powered conditions like HighLater (z = 2.33 for ellipsoid volume, z = −0.34 for local dynamic stability) and HighLatest (z = 0.21 for ellipsoid volume, z = 1.30 for local dynamic stability) amplified variability in ellipsoid volume and local dynamic stability, aligning with the gait tube findings of heightened VT variability during early-to-mid stance (p ≤ 0.0059, Figure 4D). In contrast, metrics like Hurst exponent (z = 0.12 in HighLater, z = 0.40 in HighLatest), sample entropy (z = −1.01 in HighLater, z = −0.16 in HighLatest), and maximum Floquet multiplier (z = −0.29 in HighLater, z = −0.30 in HighLatest) exhibited minimal deviation across conditions, indicating lower sensitivity to exoskeleton assistance. Correlation analysis in Figure 6B further underscores this trend, with ellipsoid volume showing weak and non-significant correlations with Lyapunov exponent (r = 0.29, p = 0.41 in HighLatest; r = 0.37, p = 0.29 in HighLater) and sample entropy (r = −0.21, p = 0.55 in HighLater; r = −0.18, p = 0.62 in HighLatest), contrasting with the strong correlations (r ≥ 0.65) observed for total variability (Figure 5C). This discrepancy highlights the gait tube method’s strength in capturing multidimensional variability. At the same time, individual metrics like Lyapunov exponents may be more sensitive to specific perturbation responses, as noted in studies of exoskeleton-assisted gait where short-term Lyapunov exponents showed variable responses to torque assistance depending on stride length and timing adaptations [43,44]. The reduced sensitivity of Hurst exponent, Lyapunov exponent, sample entropy, and maximum Floquet multiplier in this dataset may stem from their dependence on longer time series for reliable estimation, which could be limited by the short adaptation period (~4 min) per condition, potentially masking condition-specific effects as observed in other studies with extended walking trials [45,46]. From a computational standpoint, gait tube analysis requires high-quality, time-normalized kinematic data and the construction of covariance matrices and ellipsoids at each phase, making it more resource-intensive than scalar metrics like MOS or Lyapunov exponents. However, this additional complexity allows for richer phase-specific insights and the visualization of multidimensional COM variability that event-based methods cannot provide. Practically, the gait tube method may not yet be well suited for real-time applications or clinical environments without automation and streamlined preprocessing tools. Nevertheless, its intuitive 3D visual outputs and potential to capture subtle stability changes make it a powerful complement to traditional metrics in research and potentially in high-resolution rehabilitation contexts.
The raw value comparisons in Figure 7 further illustrate condition-specific trends, with HighLater’s peak ellipsoid volume (99,937 mm3/s3) coinciding with elevated local dynamic stability (0.092), consistent with the gait tube method’s indication of destabilization during early-to-mid stance (Figure 3A), while PowerOff’s low values (e.g., ellipsoid volume at 47,285 mm3/s3, local dynamic stability at 0.039) mirror its reduced ML variability (p = 0.0488, Figure 4B), reflecting a stabilizing effect of passive structure. In contrast, metrics like sample entropy and maximum Floquet multiplier showed limited variation across conditions (e.g., sample entropy: 0.83 in HighLatest vs. 0.84 in NoExo; maximum Floquet multiplier: 1.0616 in HighLatest vs. 1.0665 in NoExo), reinforcing their relative insensitivity to the exoskeleton conditions in this study. These findings align with prior research showing that passive exoskeletons can constrain lateral dynamics at a metabolic cost [4,47,48]. Still, they also underscore the gait tube method’s advantage in resolving phase-specific effects that raw value averages may obscure, as supported by studies highlighting the importance of temporal resolution in stability analysis [49]. Moreover, studies using short-term Lyapunov exponents and Floquet multipliers have reported similar increases in local dynamic stability under high-torque assistance during stance transitions, corroborating our observations [50]. Yet, the lack of sensitivity in Hurst exponent and sample entropy may be attributed to their sensitivity to noise and short data lengths, which can dilute condition-specific effects in controlled treadmill settings [51,52]. Collectively, the integration of gait tube analysis with these additional metrics provides a more comprehensive understanding of stability dynamics, suggesting that future exoskeleton designs should target phase-specific torque modulation to mitigate variability spikes while balancing metabolic efficiency, particularly in populations with heightened fall risk where such variability may be more pronounced [53,54].
The visualization capabilities of gait tube analysis further enhance its clinical relevance. As shown in Figure 1, ellipsoids during unstable phases expand visibly in powered conditions, highlighting periods of instability. This visual language is more intuitive than abstract stability metrics and could support real-time feedback, gait retraining, or rehabilitation planning in neurologic populations.
In summary, the gait tube framework complements and improves upon traditional stability metrics. It provides clinicians and researchers with a clear, time-resolved, multidimensional tool for evaluating the effects of assistive devices like exoskeletons on gait. These insights could guide the development of phase-specific controllers, tailor training to individual stability needs, and enable more precise interventions across clinical and performance settings.
The phase-specific variability patterns identified in this study have important clinical implications. Individuals with impaired balance, such as stroke survivors or people with Parkinson’s disease, may be more vulnerable to destabilizing effects during early stance when vertical variability is elevated. By integrating gait tube metrics into real-time control strategies, exoskeletons could be designed to modulate torque in a stability-aware manner, enhancing support during phases prone to instability while minimizing unnecessary assistance elsewhere. This approach could improve safety and confidence during walking in clinical populations, potentially reducing fall risk and supporting more personalized rehabilitation protocols.
Several limitations should be considered when interpreting these findings. First, the sample size (n = 10) limits the generalizability of the results, particularly to clinical populations with varying gait patterns and stability impairments. Second, data were collected during treadmill walking, which may constrain natural variability compared to overground gait due to fixed belt speed and the absence of optic flow [30]. Third, the mass of the exoskeleton (5.77 kg) may have contributed to the observed variability through added inertia or mechanical constraint, particularly in the PowerOff condition [4]. Fourth, the adaptation period per condition was relatively short (~4 min), potentially limiting participants’ ability to adjust their gait strategy fully [4]. Finally, the study focused on healthy adults; future research should extend this approach to clinical populations to determine how assistive torque influences pathological gait stability [11]. Future work should extend gait tube analysis to populations with known balance deficits, such as individuals with stroke, Parkinson’s disease, or aging-related instability, where its high-resolution, phase-specific insights could uncover compensatory patterns or early markers of fall risk. Studies have shown that in these populations, increased gait variability often correlates with higher metabolic cost, reflecting inefficient compensatory strategies that compromise stability [53,54,55]. For instance, stroke survivors exhibit elevated energy expenditure alongside irregular gait patterns, which may predict fall risk [53]. Similarly, individuals with Parkinson’s disease show heightened step timing variability, associated with increased metabolic demand and reduced dynamic stability [56]. In older people, greater stride variability is linked to higher walking energy costs, underscoring the need for precise stability metrics like gait tubes to optimize assistive interventions [57]. Applying gait tube analysis to these groups could elucidate how exoskeleton assistance modulates the stability-efficiency trade-off, informing personalized rehabilitation strategies. Furthermore, all participants were young, healthy adults, and their responses may not reflect the behavior of clinical populations with impaired neuromotor control or balance. Future studies should validate these findings in populations with gait impairments to better understand how assistive torque affects pathological movement patterns and fall risk. Furthermore, while the gait tube method demonstrated strong utility in a healthy, treadmill-based walking context, its generalizability to overground walking, uneven terrains, or clinical populations with movement disorders (e.g., stroke, Parkinson’s disease) remains to be tested. These populations often exhibit atypical stride timing, asymmetries, or reduced walking consistency, which may affect the stability of the constructed gait tube and the interpretability of ellipsoid volume trends. Future studies should evaluate whether this framework can be adapted to account for non-periodic or highly variable gait and whether it retains sensitivity to phase-specific instability in diverse populations.
While we included metabolic cost values to contextualize exoskeleton effects, we did not observe strong linear correlations between energy expenditure and stability metrics such as ellipsoid volume or directional variability. The relationship appeared nonlinear and variable across participants. As our focus in this study was on developing and validating the gait tube analysis for stability assessment, we did not pursue deeper modeling of metabolic-stability interactions. Future work could incorporate nonlinear modeling techniques to investigate these relationships more rigorously.
Additionally, the study utilized existing data from a previously published protocol, and therefore, no a priori power analysis was conducted. While our sample size (n = 10) is consistent with similar biomechanical studies, it may limit the generalizability and statistical power to detect small effect sizes. Future research should include prospective power analyses to optimize sample size and improve the robustness of statistical comparisons.
5. Conclusions
This study demonstrates that gait tube analysis is a powerful method for assessing phase-dependent gait stability under hip exoskeleton assistance. The results show that powered conditions significantly increase multidimensional variability, particularly during early-to-mid stance phases where torque overlaps with transitions in support. VT was the most sensitive direction to assistance, while AP variability remained unchanged. The PowerOff condition uniquely reduced ML variability, highlighting the influence of passive structural elements. Ellipsoid volume was strongly correlated with total variability across conditions, validating its use as a summary metric. To support safer and more effective exoskeleton use, future device designs should consider implementing phase-specific control strategies that reduce assistance during early-to-mid stance—when users appear most sensitive to stability disruptions—and increase assistance during late stance with caution. Adaptive control systems that monitor individual stability responses in real time could further personalize support to optimize both energy efficiency and balance. Clinically, the ability to detect phase-dependent instability offers significant potential for fall-risk assessment and rehabilitation planning in older adults or individuals with neurological impairments. Incorporating gait tube analysis into clinical gait evaluations could help identify specific instability-prone phases and guide targeted interventions. Together, these findings suggest that gait tube analysis offers a comprehensive, interpretable framework for evaluating the effects of wearable assistive devices. This approach can inform the development of phase-specific controllers and support personalized rehabilitation strategies. Future studies should focus on translating these insights to clinical populations, optimizing torque delivery, and enhancing the real-world applicability of exoskeleton technologies. These findings confirm our hypothesis that the timing of assistance plays a critical role in modulating gait stability and suggest that exoskeleton controllers should implement phase-specific torque strategies to reduce variability during early stance. Clinically, this method could be used to identify instability-prone gait phases and guide individualized rehabilitation protocols that address balance control in users with neurological or age-related gait impairments.
Supplementary Materials
The following supporting information can be downloaded at: https://www.mdpi.com/article/10.3390/app15137530/s1, S1: Supplementary Material: Gait Tube Stability method via the MATLAB function (GaitTubePlot_Supplementary_MATLAB_Code.m); S2: Gait Tube Analysis Mathematical Model explanations (Gait Tube Analysis Mathematical Model.docx).
Author Contributions
Conceptualization A.M.G.; Methodology A.M.G. and F.F.; Software A.M.G.; Validation A.M.G.; Formal analysis A.M.G.; Investigation A.M.G. and F.F.; Resources A.M.G. and F.F.; Data curation A.M.G. and F.F.; Writing—original draft preparation A.M.G. and F.F.; Writing—review and editing A.M.G. and F.F.; Visualization A.M.G. and F.F.; Supervision A.M.G.; Project administration A.M.G.; Funding acquisition A.M.G. All authors have read and agreed to the published version of the manuscript.
Funding
This work was supported by the National Institutes of Health (P20GM109090 and R01HD090333), the National Science Foundation (2203143), and the U.S. Department of Veterans Affairs Rehabilitation Research and Development Service (101RX000604 and 101RX003266). The content is solely the authors’ responsibility and does not represent the official views of the funding agencies.
Institutional Review Board Statement
Not applicable.
Informed Consent Statement
Not applicable.
Data Availability Statement
The original contributions presented in this study are included in the article/Supplementary Materials. Further inquiries can be directed to the corresponding author.
Acknowledgments
We thank Philippe Malcolm and Nathaniel Hunt for their insightful advice.
Conflicts of Interest
The authors declare no conflict of interest.
References
- Bruijn, S.M.; Meijer, O.G.; Beek, P.J.; van Dieën, J.H. Assessing the Stability of Human Locomotion: A Review of Current Measures. J. R. Soc. Interface 2013, 10, 20120999. [Google Scholar] [CrossRef] [PubMed]
- Gonabadi, A.M.; Antonellis, P.; Malcolm, P. Differentiating Fallers from Nonfallers Using Nonlinear Variability Analyses of Data from a Low-Cost Portable Footswitch Device: A Feasibility Study. Acta Bioeng. Biomech. 2021, 23, 139–145. [Google Scholar] [CrossRef] [PubMed]
- Fallahtafti, F.; Mohammadzadeh Gonabadi, A.; Samson, K.; Yentes, J.M. Margin of Stability May Be Larger and Less Variable during Treadmill Walking Versus Overground. Biomechanics 2021, 1, 118–130. [Google Scholar] [CrossRef]
- Mohammadzadeh Gonabadi, A.; Antonellis, P.; Dzewaltowski, A.C.; Myers, S.A.; Pipinos, I.I.; Malcolm, P. Design and Evaluation of a Bilateral Semi-Rigid Exoskeleton to Assist Hip Motion. Biomimetics 2024, 9, 211. [Google Scholar] [CrossRef] [PubMed]
- Young, A.J.; Ferris, D.P. State of the Art and Future Directions for Lower Limb Robotic Exoskeletons. IEEE Trans. Neural Syst. Rehabil. Eng. 2017, 25, 171–182. [Google Scholar] [CrossRef]
- Arones, M.M.; Shourijeh, M.S.; Patten, C.; Fregly, B.J. Musculoskeletal Model Personalization Affects Metabolic Cost Estimates for Walking. Front. Bioeng. Biotechnol. 2020, 8, 588925. [Google Scholar] [CrossRef]
- Umberger, B.R.; Gerritsen, K.G.M.M.; Martin, P.E. A Model of Human Muscle Energy Expenditure. Comput. Methods Biomech. Biomed. Engin. 2003, 6, 99–111. [Google Scholar] [CrossRef]
- Xu, L.; Liu, X.; Chen, Y.; Yu, L.; Yan, Z.; Yang, C.; Zhou, C.; Yang, W. Reducing the Muscle Activity of Walking Using a Portable Hip Exoskeleton Based on Human-in-the-Loop Optimization. Front. Bioeng. Biotechnol. 2023, 11, 1006326. [Google Scholar] [CrossRef]
- Kim, M.-K. Foot Pressure Analysis of Adults with Flat and Normal Feet at Different Gait Speeds on an Ascending Slope. J. Phys. Ther. Sci. 2015, 27, 3767–3769. [Google Scholar] [CrossRef]
- Poggensee, K.L.; Collins, S.H. How Adaptation, Training, and Customization Contribute to Benefits from Exoskeleton Assistance. Sci. Robot. 2021, 6, eabf1078. [Google Scholar] [CrossRef]
- Martini, E.; Crea, S.; Parri, A.; Bastiani, L.; Faraguna, U.; McKinney, Z.; Molino-Lova, R.; Pratali, L.; Vitiello, N. Gait Training Using a Robotic Hip Exoskeleton Improves Metabolic Gait Efficiency in the Elderly. Sci. Rep. 2019, 9, 7157. [Google Scholar] [CrossRef] [PubMed]
- Zhang, J.; Fiers, P.; Witte, K.A.; Jackson, R.W.; Poggensee, K.L.; Atkeson, C.G.; Collins, S.H. Human-in-the-Loop Optimization of Exoskeleton Assistance during Walking. Science 2017, 356, 1280–1284. [Google Scholar] [CrossRef] [PubMed]
- Xie, W.; Shu, T.; Liu, J.; Peng, H.; Karpeta, N.; Marques, P.; Liu, Y.; Duan, M. The Relationship between Clinical Characteristics and Magnetic Resonance Imaging Results of Ménière Disease: A Prospective Study. Sci. Rep. 2021, 11, 7212. [Google Scholar] [CrossRef] [PubMed]
- Lim, B.; Choi, B.; Roh, C.; Lee, J.; Kim, Y.-J.; Lee, Y. Ultra-Lightweight Robotic Hip Exoskeleton with Anti-Phase Torque Symmetry for Enhanced Walking Efficiency. Sci. Rep. 2025, 15, 10850. [Google Scholar] [CrossRef]
- Fang, S.; Vijayan, V.; Reissman, M.E.; Kinney, A.L.; Reissman, T. Effects of Walking Speed and Added Mass on Hip Joint Quasi-Stiffness in Healthy Young and Middle-Aged Adults. Sensors 2023, 23, 4517. [Google Scholar] [CrossRef]
- Mohammadzadeh Gonabadi, A.; Buster, T.W.; Cesar, G.M.; Burnfield, J.M. Effect of Data and Gap Characteristics on the Nonlinear Calculation of Motion During Locomotor Activities. J. Appl. Biomech. 2024, 40, 278–286. [Google Scholar] [CrossRef]
- Xu, D.; Zhou, H.; Quan, W.; Jiang, X.; Liang, M.; Li, S.; Ugbolue, U.C.; Baker, J.S.; Gusztav, F.; Ma, X.; et al. A New Method Proposed for Realizing Human Gait Pattern Recognition: Inspirations for the Application of Sports and Clinical Gait Analysis. Gait Posture 2024, 107, 293–305. [Google Scholar] [CrossRef]
- Dingwell, J.B.; Kang, H.G. Differences Between Local and Orbital Dynamic Stability During Human Walking. J. Biomech. Eng. 2007, 129, 586–593. [Google Scholar] [CrossRef]
- Hur, P.; Shorter, K.A.; Mehta, P.G.; Hsiao-Wecksler, E.T. Invariant Density Analysis: Modeling and Analysis of the Postural Control System Using Markov Chains. IEEE Trans. Biomed. Eng. 2012, 59, 1094–1100. [Google Scholar] [CrossRef]
- van Schooten, K.S.; Rispens, S.M.; Pijnappels, M.; Daffertshofer, A.; Dieen, J.H. Van Assessing Gait Stability: The Influence of State Space Reconstruction on Inter- and Intra-Day Reliability of Local Dynamic Stability during over-Ground Walking. J. Biomech. 2013, 46, 137–141. [Google Scholar] [CrossRef]
- Sloot, L.H.; Van Schooten, K.S.; Bruijn, S.M.; Kingma, H.; Pijnappels, M.; van Dieën, J.H. Sensitivity of Local Dynamic Stability of Over-Ground Walking to Balance Impairment Due to Galvanic Vestibular Stimulation. Ann. Biomed. Eng. 2011, 39, 1563–1569. [Google Scholar] [CrossRef] [PubMed][Green Version]
- Rhea, C.K.; Kiefer, A.W.; D’Andrea, S.E.; Warren, W.H.; Aaron, R.K. Entrainment to a Real Time Fractal Visual Stimulus Modulates Fractal Gait Dynamics. Hum. Mov. Sci. 2014, 36, 20–34. [Google Scholar] [CrossRef]
- Delgado-Bonal, A.; Marshak, A. Approximate Entropy and Sample Entropy: A Comprehensive Tutorial. Entropy 2019, 21, 541. [Google Scholar] [CrossRef] [PubMed]
- Mohammadzadeh Gonabadi, A.; Cesar, G.M.; Buster, T.W.; Burnfield, J.M. Effect of Gap-Filling Technique and Gap Location on Linear and Nonlinear Calculations of Motion during Locomotor Activities. Gait Posture 2022, 94, 85–92. [Google Scholar] [CrossRef] [PubMed]
- Chien, J.H.; Mukherjee, M.; Siu, K.C.; Stergiou, N. Locomotor Sensory Organization Test: How Sensory Conflict Affects the Temporal Structure of Sway Variability During Gait. Ann. Biomed. Eng. 2016, 44, 1625–1635. [Google Scholar] [CrossRef]
- Erkan, E.; Yüce, S. Serret-Frenet Frame and Curvatures of Bézier Curves. Mathematics 2018, 6, 321. [Google Scholar] [CrossRef]
- Ebers, M.R.; Rosenberg, M.C.; Kutz, J.N.; Steele, K.M. A Machine Learning Approach to Quantify Individual Gait Responses to Ankle Exoskeletons. bioRxiv 2023. [Google Scholar] [CrossRef]
- Banos, O.; Galvez, J.-M.; Damas, M.; Pomares, H.; Rojas, I. Window Size Impact in Human Activity Recognition. Sensors 2014, 14, 6474–6499. [Google Scholar] [CrossRef]
- Fallahtafti, F.; Bruijn, S.; Mohammadzadeh Gonabadi, A.M.; Sangtarashan, M.; Boron, J.B.; Curtze, C.; Siu, K.-C.; Myers, S.A.; Yentes, J. Trunk Velocity Changes in Response to Physical Perturbations Are Potential Indicators of Gait Stability. Sensors 2023, 23, 2833. [Google Scholar] [CrossRef]
- Hof, A.L.; Gazendam, M.G.J.; Sinke, W.E. The Condition for Dynamic Stability. J. Biomech. 2005, 38, 1–8. [Google Scholar] [CrossRef]
- Little-Letsinger, S.E.; Cook, R.W.; Wilson, D.; Truitt, K.; Schmitt, D. Gait Compliance Alters Ground Reaction Forces in Human Walking: Implications for the Evolution of Bipedalism. J. Exp. Biol. 2025, 228, jeb250219. [Google Scholar] [CrossRef] [PubMed]
- Leal-Junior, A.; Frizera-Neto, A. Gait Analysis: Overview, Trends, and Challenges. In Optical Fiber Sensors for the Next Generation of Rehabilitation Robotics; Elsevier: Amsterdam, The Netherlands, 2022; pp. 53–64. [Google Scholar]
- Schrade, S.O.; Devittori, G.; Easthope, C.A.; Shirota, C.; Lambercy, O.; Gassert, R. Exoskeleton Knee Compliance Improves Gait Velocity and Stability in a Spinal Cord Injured User: A Case Report. arXiv 2019. [Google Scholar] [CrossRef]
- Mohammadzadeh Gonabadi, A.; Fallahtafti, F.; Burnfield, J.M. How Gait Nonlinearities in Individuals Without Known Pathology Describe Metabolic Cost During Walking Using Artificial Neural Network and Multiple Linear Regression. Appl. Sci. 2024, 14, 11026. [Google Scholar] [CrossRef]
- van den Bogert, A.J. Exotendons for Assistance of Human Locomotion. Biomed. Eng. Online 2003, 2, 17. [Google Scholar] [CrossRef]
- Paper, C.; Saadatzi, M.H.; Celik, O. A Passive Hip Exoskeleton for Reducing Metabolic Cost of Walking: A Simulation Study. In Proceedings of the 41st Annual Meeting of the American Society of Biomechanics, Boulder, CO, USA, 8–11 August 2017; pp. 4–6. [Google Scholar]
- Walsh, C.J.; Paluska, D.; Pasch, K.; Grand, W.; Valiente, A.; Herr, H. Development of a Lightweight, Underactuated Exoskeleton for Load-Carrying Augmentation. In Proceedings of the 2006 IEEE International Conference on Robotics and Automation, 2006, ICRA 2006, Orlando, FL, USA, 15–19 May 2006; pp. 3485–3491. [Google Scholar] [CrossRef]
- Talaty, M.; Esquenazi, A.; Briceno, J.E. Differentiating Ability in Users of the ReWalk(TM) Powered Exoskeleton: An Analysis of Walking Kinematics. In Proceedings of the 2013 IEEE 13th International Conference on Rehabilitation Robotics (ICORR), Seattle, WA, USA, 24–26 June 2013; p. 6650469. [Google Scholar] [CrossRef]
- Wurdeman, S.R.; Huben, N.B.; Stergiou, N. Variability of Gait Is Dependent on Direction of Progression: Implications for Active Control; Elsevier: Amsterdam, The Netherlands, 2012; Volume 45, pp. 653–659. [Google Scholar]
- Zhao, H.; Cao, J.; Liao, W.-H. Simultaneous Estimation of the Vertical Stiffness in the Knee and Hip for Healthy Human Subjects during Walking. Bioengineering 2023, 10, 187. [Google Scholar] [CrossRef] [PubMed]
- Fineberg, D.B.; Asselin, P.; Harel, N.Y.; Agranova-Breyter, I.; Kornfeld, S.D.; Bauman, W.A.; Spungen, A.M. Vertical Ground Reaction Force-Based Analysis of Powered Exoskeleton-Assisted Walking in Persons with Motor-Complete Paraplegia. J. Spinal Cord Med. 2013, 36, 313–321. [Google Scholar] [CrossRef]
- Normand, M.A.; Lee, J.; Su, H.; Sulzer, J.S. The Effect of Hip Exoskeleton Weight on Kinematics, Kinetics, and Electromyography during Human Walking. J. Biomech. 2023, 152, 111552. [Google Scholar] [CrossRef]
- Raz, D.; Joshi, V.; Umberger, B.R.; Ozay, N. Ankle Exoskeletons May Hinder Standing Balance in Simple Models of Older and Younger Adults. IEEE Trans. Neural Syst. Rehabil. Eng. 2025, 33, 1145–1155. [Google Scholar] [CrossRef] [PubMed]
- Terrier, P.; Dériaz, O. Non-Linear Dynamics of Human Locomotion: Effects of Rhythmic Auditory Cueing on Local Dynamic Stability. Front. Physiol. 2013, 4, 230. [Google Scholar] [CrossRef]
- Costa, M.; Peng, C.-K.; Goldberger, A.L.; Hausdorff, J.M. Multiscale Entropy Analysis of Human Gait Dynamics. Phys. A Stat. Mech. Its Appl. 2003, 330, 53–60. [Google Scholar] [CrossRef]
- Terrier, P.; Dériaz, O. Kinematic Variability, Fractal Dynamics and Local Dynamic Stability of Treadmill Walking. J. Neuroeng. Rehabil. 2011, 8, 12. [Google Scholar] [CrossRef]
- McCain, E.M.; Dick, T.J.M.M.; Giest, T.N.; Nuckols, R.W.; Lewek, M.D.; Saul, K.R.; Sawicki, G.S. Mechanics and Energetics of Post-Stroke Walking Aided by a Powered Ankle Exoskeleton with Speed-Adaptive Myoelectric Control. J. Neuroeng. Rehabil. 2019, 16, 57. [Google Scholar] [CrossRef] [PubMed]
- Sawicki, G.S.; Ferris, D.P. Mechanics and Energetics of Level Walking with Powered Ankle Exoskeletons. J. Exp. Biol. 2008, 211, 1402–1413. [Google Scholar] [CrossRef] [PubMed]
- McAndrew, P.M.; Wilken, J.M.; Dingwell, J.B. Dynamic Stability of Human Walking in Visually and Mechanically Destabilizing Environments. J. Biomech. 2011, 44, 644–649. [Google Scholar] [CrossRef]
- Titz, M.; Kaiser, F.; Kruse, J.; Witthaut, D. Predicting Dynamic Stability from Static Features in Power Grid Models Using Machine Learning. Chaos 2024, 34, 013139. [Google Scholar] [CrossRef] [PubMed]
- Rhea, C.K.; Silver, T.A.; Hong, S.L.; Ryu, J.H.; Studenka, B.E.; Hughes, C.M.L.; Haddad, J.M. Noise and Complexity in Human Postural Control: Interpreting the Different Estimations of Entropy. PLoS ONE 2011, 6, e17696. [Google Scholar] [CrossRef]
- Bruijn, S.M.; van Dieën, J.H.; Meijer, O.G.; Beek, P.J. Statistical Precision and Sensitivity of Measures of Dynamic Gait Stability. J. Neurosci. Methods 2009, 178, 327–333. [Google Scholar] [CrossRef]
- Farris, D.J.; Hampton, A.; Lewek, M.D.; Sawicki, G.S. Revisiting the Mechanics and Energetics of Walking in Individuals with Chronic Hemiparesis Following Stroke: From Individual Limbs to Lower Limb Joints. J. Neuroeng. Rehabil. 2015, 12, 24. [Google Scholar] [CrossRef]
- Roemmich, R.T.; Nocera, J.R.; Stegemöller, E.L.; Hassan, A.; Okun, M.S.; Hass, C.J. Locomotor Adaptation and Locomotor Adaptive Learning in Parkinson’s Disease and Normal Aging. Clin. Neurophysiol. 2014, 125, 313–319. [Google Scholar] [CrossRef]
- Barbieri, F.A.; Simieli, L.; Orcioli-Silva, D.; Baptista, A.M.; Borkowske Pestana, M.; Spiandor Beretta, V.; dos Santos, P.C.R.; Bucken Gobbi, L.T. Obstacle Avoidance Increases Asymmetry of Crossing Step in Individuals with Parkinson’s Disease and Neurologically Healthy Individuals. J. Mot. Behav. 2018, 50, 17–25. [Google Scholar] [CrossRef]
- Perron, M.; Malouin, F.; Moffet, H.; McFadyen, B.J. Three-Dimensional Gait Analysis in Women with a Total Hip Arthroplasty. Clin. Biomech. 2000, 15, 504–515. [Google Scholar] [CrossRef] [PubMed]
- Wert, D.M.; Brach, J.; Perera, S.; VanSwearingen, J.M. Gait Biomechanics, Spatial and Temporal Characteristics, and the Energy Cost of Walking in Older Adults with Impaired Mobility. Phys. Ther. 2010, 90, 977–985. [Google Scholar] [CrossRef] [PubMed]
Disclaimer/Publisher’s Note: The statements, opinions and data contained in all publications are solely those of the individual author(s) and contributor(s) and not of MDPI and/or the editor(s). MDPI and/or the editor(s) disclaim responsibility for any injury to people or property resulting from any ideas, methods, instructions or products referred to in the content. |
© 2025 by the authors. Licensee MDPI, Basel, Switzerland. This article is an open access article distributed under the terms and conditions of the Creative Commons Attribution (CC BY) license (https://creativecommons.org/licenses/by/4.0/).