Article

Detecting Out-of-Distribution Samples in Complex IoT Traffic Based on Distance Loss

1
School of Cyberspace Security, Beijing University of Posts and Telecommunications, Beijing 100876, China
2
National Engineering Research Center of Disaster Backup and Recovery, Beijing University of Posts and Telecommunications, Beijing 100876, China
3
China Industrial Control Systems Cyber Emergency Response Team, Beijing 100040, China
*
Author to whom correspondence should be addressed.
Appl. Sci. 2025, 15(13), 7522; https://doi.org/10.3390/app15137522
Submission received: 30 May 2025 / Revised: 28 June 2025 / Accepted: 2 July 2025 / Published: 4 July 2025
(This article belongs to the Special Issue IoT Technology and Information Security)

Abstract

Out-of-distribution (OOD) detection is critical for securing Internet of Things (IoT) systems, particularly in applications such as intrusion detection and device identification. However, conventional classification-based approaches struggle in IoT environments due to challenges like large class numbers and data imbalance. To address these limitations, we propose a novel framework that combines class mean clustering and a group-level feature distance loss to optimize both intra-group compactness and inter-group separability. Our framework utilizes Mahalanobis distance for robust OOD scoring and Kernel density estimation (KDE) for adaptive threshold selection, enabling precise boundary estimation under varying data distributions. Experimental results on real-world IoT datasets show that our framework outperforms baseline techniques, achieving at least a 10% improvement in AUROC and a 33% reduction in FPR95, demonstrating its scalability and effectiveness in complex, imbalanced IoT scenarios.

1. Introduction

The proliferation of technologies such as cloud computing and virtualization in IoT environments has significantly increased the complexity of network traffic in IoT scenarios. This complexity poses challenges for supervised machine learning and deep learning-based IoT security applications, such as intrusion detection and device identification [1]. In practical deployments, these systems often encounter novel samples not belonging to any known types in the training set, which are academically referred to as OOD samples [2]. These OOD samples may originate from emerging cyberattacks or newly deployed devices [3]. Current IoT security applications, which rely on classification paradigms based on known patterns, are constrained by the limitations and lag in training data. As a result, they fail to identify OOD samples and instead misclassify them as known types. This misclassification of OOD samples can lead to critical security issues, such as undetected novel threats and incorrect device categorization, thereby compromising the security of IoT systems. Therefore, developing OOD detection techniques tailored to complex IoT traffic is of significant importance for safeguarding the security and reliability of IoT ecosystems.
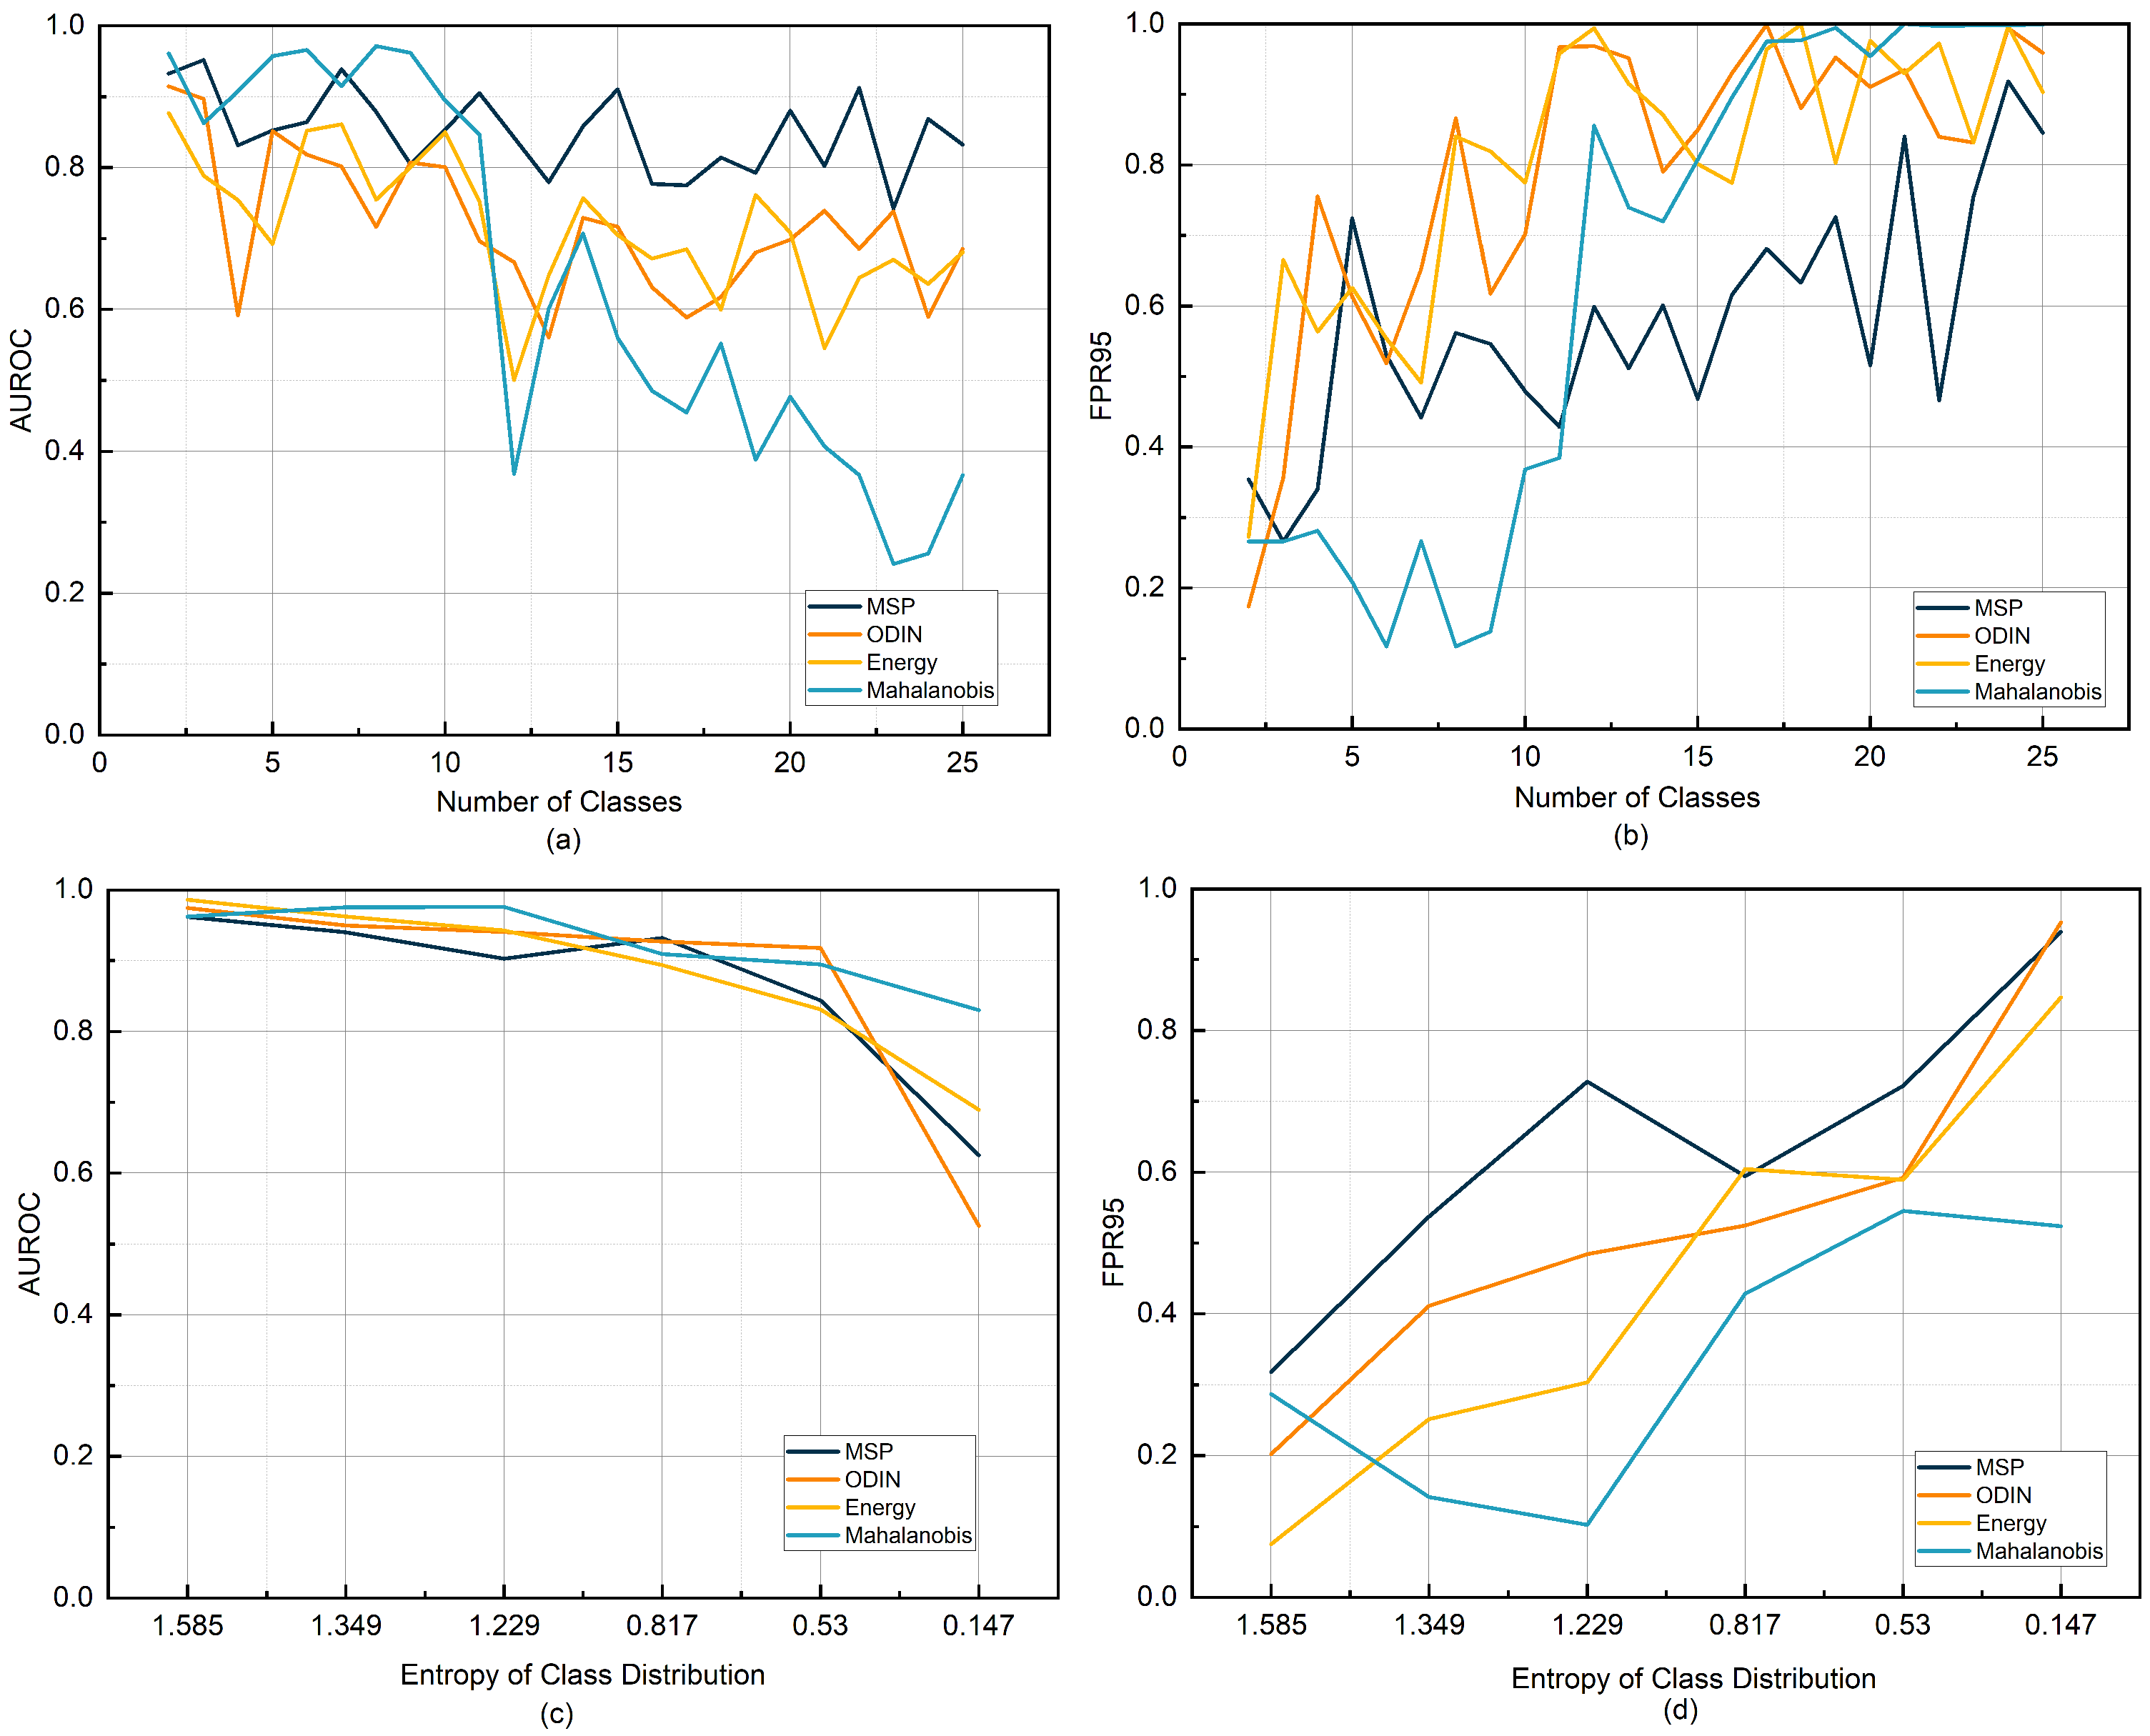
Recent research has primarily focused on post hoc modifications of scoring functions to enhance the distinction between in-distribution (ID) and OOD samples in OOD detection. For example, the ODIN method increases the difference in OOD scores between ID and OOD samples by applying temperature scaling and adding small perturbations [4]. React further mitigates overconfidence in classification-based OOD detection by modifying activation patterns [5]. UM and logit normalization alleviate model overconfidence by adjusting the loss function, thereby improving classification-based OOD detection performance [6,7]. However, the complexity of IoT traffic is increasing, and the types of traffic training samples that can be collected are becoming more diverse and imbalanced in distribution [8,9]. The aforementioned supervised learning-based OOD detection techniques struggle to handle such complex real-world conditions. To verify this limitation, we replicated classification-based OOD detection methods using both open-source and real IoT traffic datasets [4,10,11,12,13]. As shown in Figure 1, as the number of labeled samples increases and distribution imbalance grows, the performance of these methods deteriorates. These methods often overfit to ID samples, leading to misclassification of ambiguous samples as ID, reducing OOD detection reliability [6,7]. Additionally, the imbalanced nature of IoT data causes issues, as minority class samples are poorly learned and their features overlap with OOD samples. This results in the misclassification of OOD samples as minority class samples. As the number of ID classes grows, decision boundaries become more complex, further hindering confidence-based OOD methods [14]. These challenges emphasize the need for improved OOD detection techniques that can handle the multi-class and imbalanced nature of IoT traffic [15]. Moreover, most existing research evaluates OOD detection performance using metrics like AUROC, AUPR, and FPR95, but often overlooks the importance of selecting the right threshold for real-world applications. While methods like Otsu’s [16] exist, they struggle with skewed data distributions.
To address the above limitations of existing techniques, we propose a model combining feature clustering, distance loss optimization, and an adaptive threshold selection strategy. First, feature clustering is performed based on class means, grouping similar classes together to simplify decision boundaries while preserving class information. Next, we optimize a feature distance loss function to ensure that samples within each group converge toward the group center, increasing the minimum feature distance between groups and enhancing the separability of in-distribution samples. Clustering is performed in the penultimate feature layer, allowing the model to focus on local information within each group, improving the discriminability of feature representations while maintaining classification accuracy. For test samples, the Mahalanobis distance is used to calculate the distance to each group, serving as the OOD score. During real-world deployment, we introduce a KDE-based adaptive threshold selection strategy, which smooths the probability density distribution of sample scores to identify potential inflection points in the distribution, which are used as a reasonable threshold for OOD detection. Experimental results show that our method significantly outperforms existing methods on multiple public datasets and real-world IoT traffic, especially in scenarios with class imbalance, where it demonstrates greater robustness.
Our contributions are as follows:
  • A Novel Group-Based OOD Detection Framework: We propose an OOD detection framework tailored for complex IoT environments, which integrates class mean feature clustering and group-level partitioning at the penultimate layer to enhance the semantic organization of the feature space.
  • Innovative Distance Loss and Adaptive Thresholding: We introduce a group-level distance loss to enhance intra-group compactness and inter-group separability, and employ KDE to adaptively select detection thresholds, significantly improving OOD discrimination under varying traffic distributions and device types.
  • Improved Performance in Imbalanced IoT Traffic: Experiments on public and real-world IoT datasets show that our method outperforms state-of-the-art baselines, achieving at least a 10% increase in AUROC and a 33% reduction in FPR95, particularly excelling in class-imbalanced conditions.

2. Related Work

2.1. OOD Detection

OOD detection emerged as a critical research topic in deep learning following the introduction of the maximum softmax probability (MSP) baseline by Hendrycks and Gimpel [10]. MSP identifies OOD samples based on the maximum softmax confidence, but tends to produce overconfident predictions even for anomalous samples, leading to suboptimal separability between ID and OOD samples. To address this limitation, ODIN [4] augments MSP with temperature scaling and small input perturbations to amplify the distinction between ID and OOD confidence scores. Although ODIN improves detection performance in certain cases, its effectiveness relies heavily on the choice of temperature and perturbation parameters, and may degrade in high-dimensional feature spaces.
Beyond softmax-based approaches, energy-based models (EBMs) [12] compute the log-sum-exp of model logits to generate an energy score that replaces confidence-based indicators. EBMs offer a more theoretically grounded detection signal, but can still suffer from class overlap in the learned representation space. Autoencoder (AE)-based methods [11] have also been widely applied for OOD detection, where reconstruction error serves as the anomaly score. While effective in low-dimensional or structured domains, AE methods often struggle with complex or large-scale datasets due to limited capacity in modeling semantic feature relationships.
Lee et al. [13] propose using Mahalanobis distance in the feature space to estimate the likelihood of a sample belonging to known classes. This method considers feature correlations and provides robust scoring under certain conditions. However, it assumes Gaussian-distributed features, which may not hold in real-world IoT traffic, especially in scenarios with non-Gaussian or multi-modal feature distributions. These limitations highlight the need for more adaptable OOD detection strategies that can handle complex and imbalanced data, such as those commonly found in IoT environments.

2.2. Threshold Selection Strategies

Threshold selection is a critical factor influencing the performance of OOD detection.
Traditional OOD detection methods often rely on fixed thresholds, which are ineffective in dynamically changing data environments. In real-world IoT scenarios, where data distributions are complex and time-varying, fixed thresholds can lead to poor detection performance, necessitating adaptive threshold selection strategies.
Several adaptive threshold selection methods have been proposed. The Otsu method [17] determines the optimal threshold by maximizing inter-class variance, making it effective for bimodal distributions. However, in skewed distributions, which are common in IoT traffic, the Otsu method often struggles to find an appropriate threshold, leading to degraded detection performance. The standard deviation inflection point method identifies a threshold based on changes in the standard deviation trend [16]. While useful when the data distribution has clear change points, it is ineffective for smoothly distributed data, limiting its applicability in IoT environments with gradually evolving traffic patterns. An alternative method based on Extreme Value Theory (EVT) employs the Peak Over Threshold (POT) framework to model tail distributions using the Generalized Pareto Distribution (GPD) to determine an optimal threshold [18]. Despite its solid theoretical foundation for tail anomaly detection, the POT method encounters challenges related to parameter initialization, GPD fitting stability, and computational efficiency. The Empirical Cumulative Distribution Function (ECDF) method selects thresholds based on a preset significance level ( α ), allowing partial adaptability [19]. Although existing adaptive thresholding methods have made some progress, they still face problems such as uneven data distribution and dynamic changes. Especially in IoT scenarios, the distribution of data is often time-varying and uncertain, so more flexible and robust threshold selection strategies are needed.

3. Proposed Approach

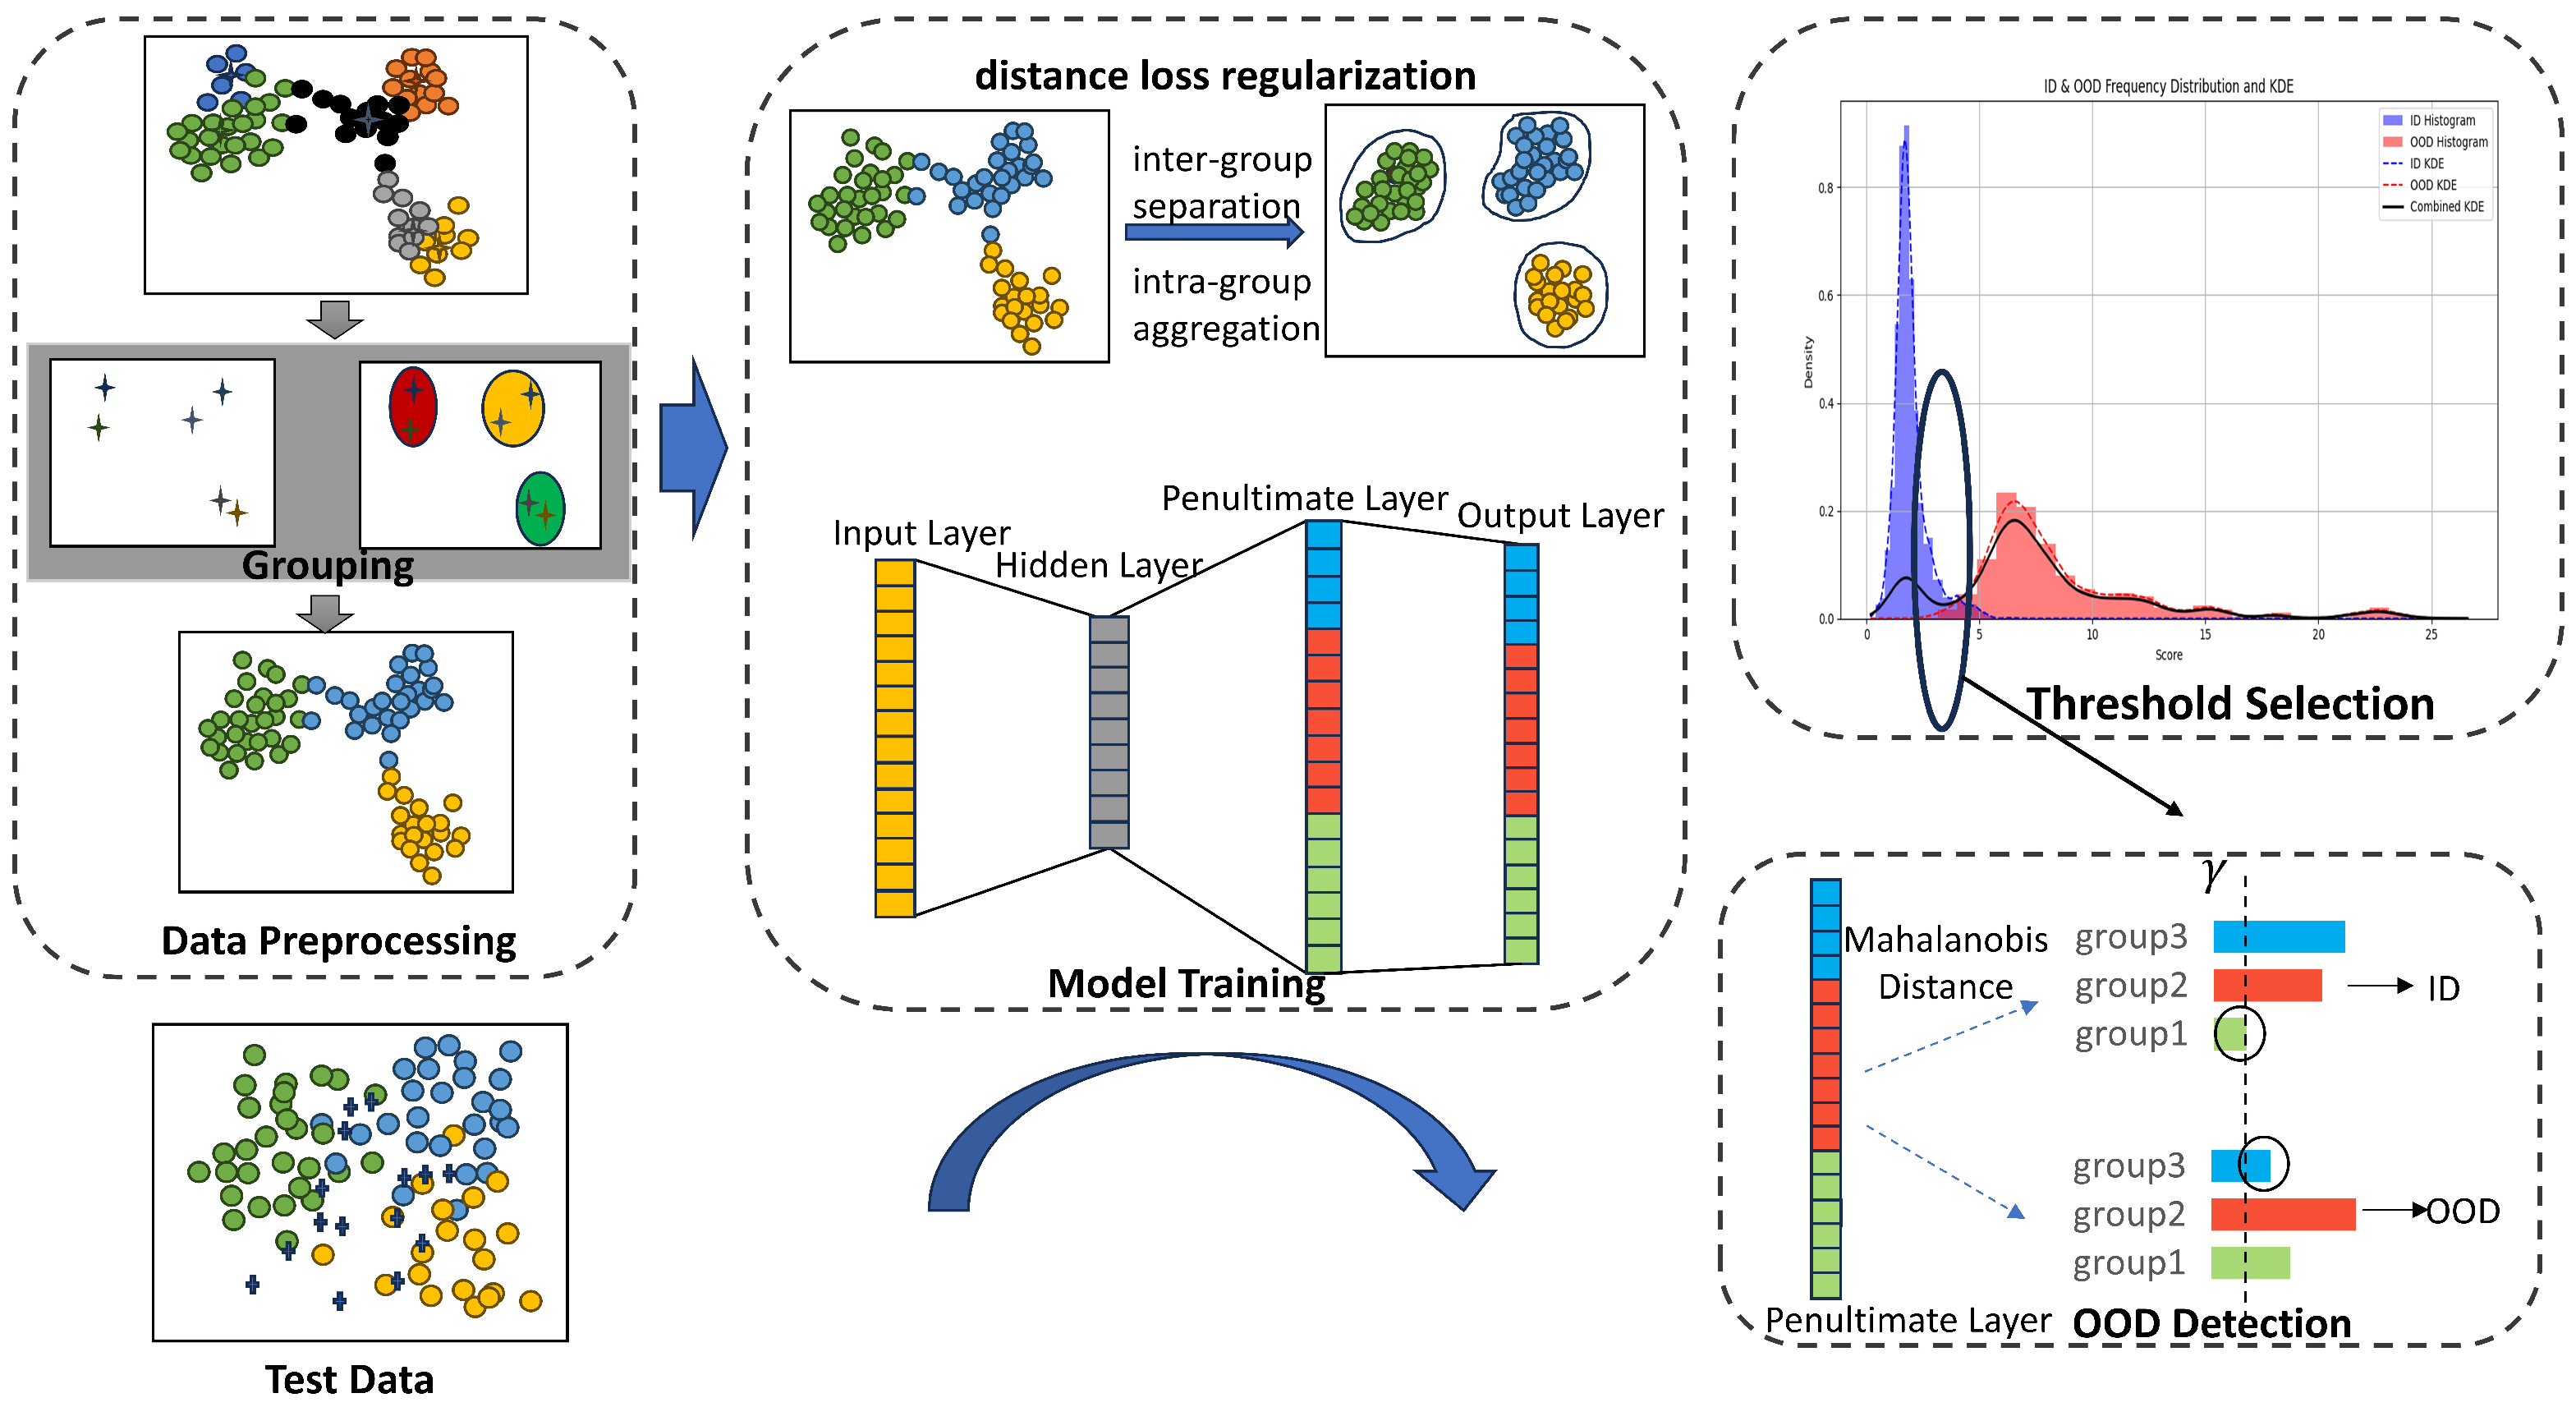
To enhance the performance of OOD detection in complex IoT traffic, we propose an OOD detection framework. The framework integrates three core components: class mean clustering, group-level distance loss optimization, and Mahalanobis distance-based OOD scoring, along with a dynamic threshold selection strategy using KDE. The overall workflow of our proposed method is illustrated in Figure 2.

3.1. Class Mean Clustering

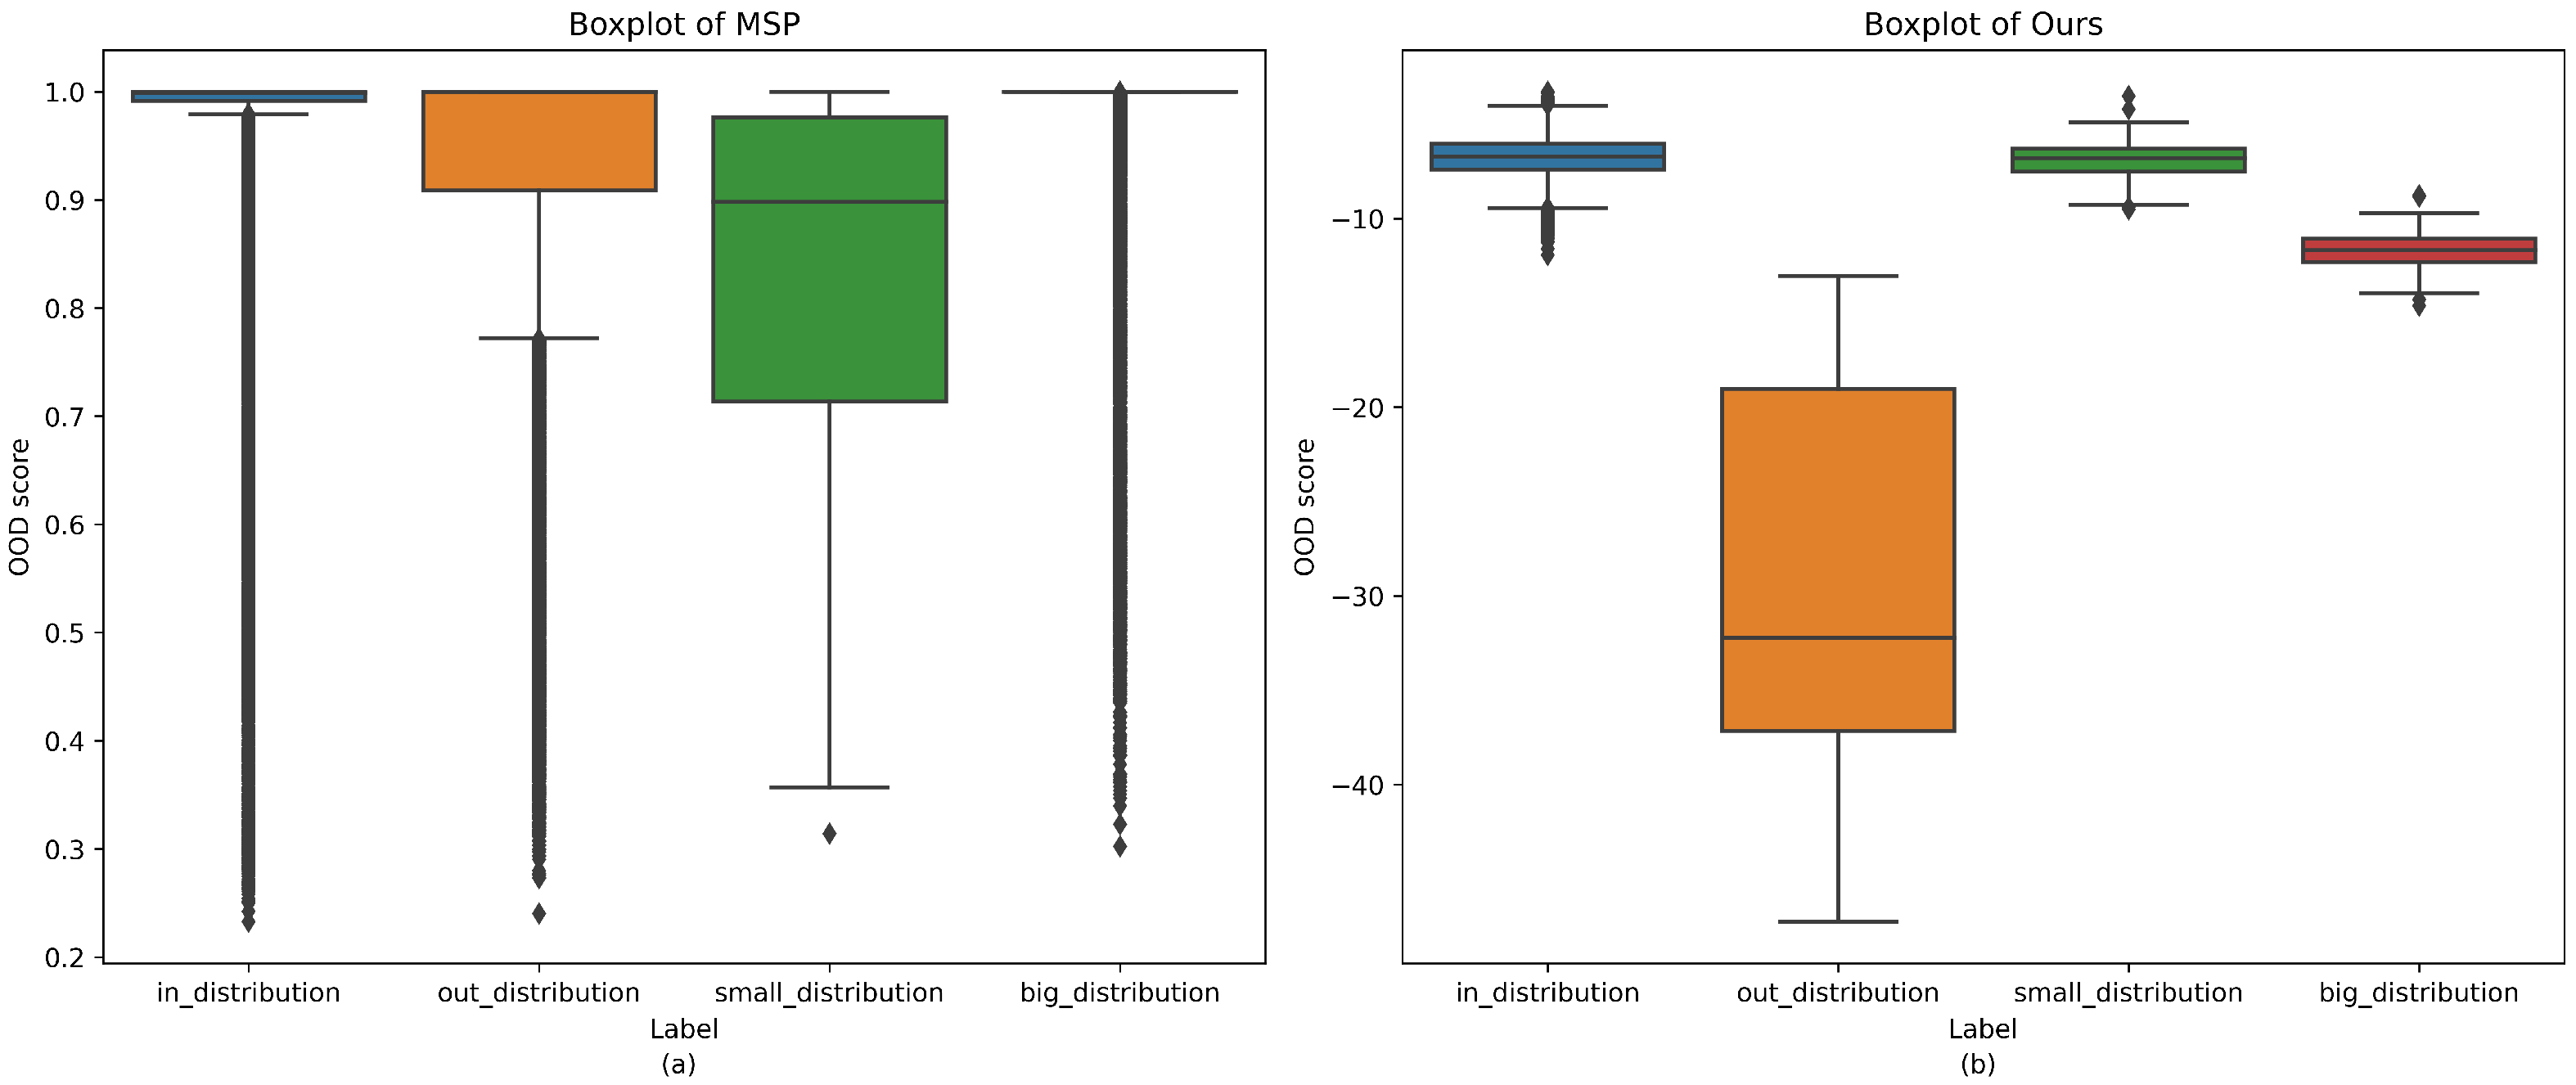
Decision boundaries are less effective in complex IoT traffic scenarios due to diverse device types, similar class characteristics, and severe class imbalance. In particular, minority class samples are prone to misclassification as OOD due to insufficient training, as shown in Figure 3. To mitigate this issue, we introduce class mean clustering [20], which reduces class-wise decision complexity by grouping similar classes, thereby minimizing mutual interference and improving OOD detection robustness.
Our method computes the mean feature vector for each class and performs supervised clustering in the feature space, as shown in Algorithm 1. By merging similar classes into groups, we reduce decision boundary complexity and minimize feature overlap between groups. This helps integrate minority class samples into more representative groups, improving feature generalization. Unlike conventional unsupervised clustering, we adopt class mean clustering with supervision, leveraging class labels to guide the grouping process [21]. Through this approach, we introduce group labels and intra-group category labels, where group labels represent a higher-level aggregation of similar classes, and intra-group class labels reflect the internal structure of each group.
Furthermore, our approach partitions the feature space of a specific model layer into distinct groups based on the clustering results. This partitioning allows us to focus on optimizing different subspaces of features, each with its own specific characteristics. By splitting the features of a layer into groups, we can allocate different feature dimensions to each group, ensuring that each group captures the most relevant features for its particular class or feature set. This helps in addressing feature imbalance and heterogeneity, as different groups may focus on different aspects of the feature space, leading to a more balanced and discriminative feature representation.
Algorithm 1 Hierarchical class mean clustering algorithm
Require: Training set X train , training label set Y train
Ensure: Clustered groups for OOD detection
  1:
for  i = 1 to C do
  2:
    Compute class mean for each class i:
  3:
            class_meani 1 | X train , i | x X train , i x
  4:
end for
  5:
Perform hierarchical clustering on class means:
  6:
        g r o u p c ← HierarchicalClustering(class_mean)
  7:
Initialize group counters:
  8:
        class_group 0 G
  9:
for  i = 1 to C do
10:
    Initialize group label array as a zero vector:
11:
            label_group 0 G
12:
    Assign class i to corresponding group:
13:
            label_group[groupi] ← class_group[groupi]
14:
    Update group counter:
15:
            class_group[groupi] ← class_group[groupi] + 1
16:
end for

3.2. Distance Loss Optimization Design

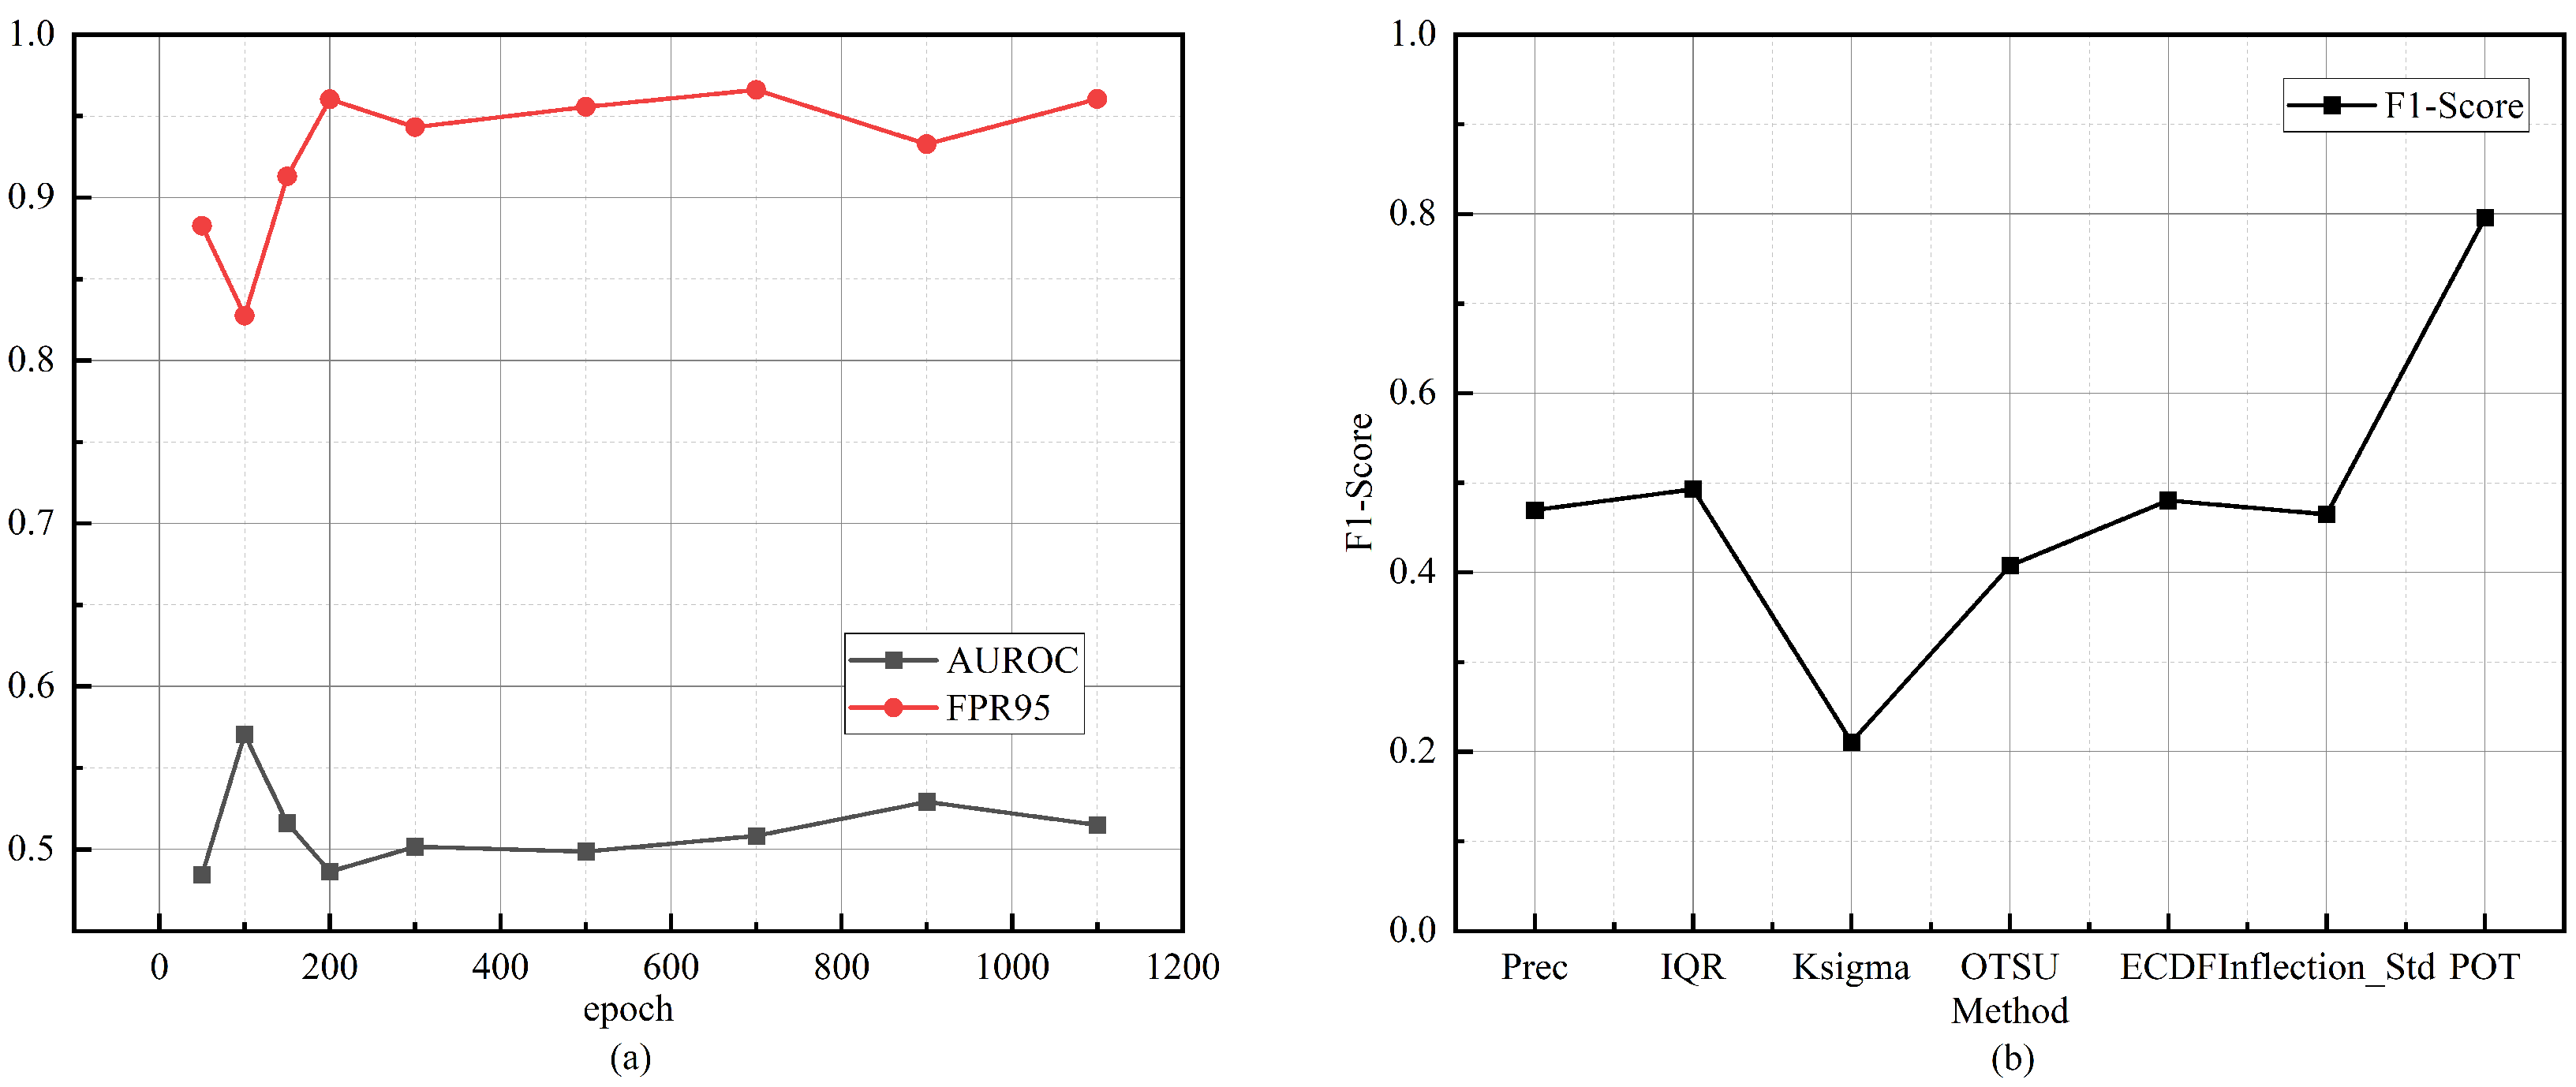
Existing classification-based OOD detection methods primarily focus on classification objectives, typically using cross-entropy loss. However, such objectives tend to encourage overconfidence in ID data, leading to suboptimal OOD detection. For instance, as shown in Figure 4a, methods like MSP initially perform well but degrade with continued training due to overfitting [6,7]. These issues are exacerbated in complex IoT scenarios with overlapping class features.
To address this, we propose a group-level distance loss optimization strategy, which explicitly introduces a distance-based objective during training. Unlike conventional approaches that rely on feature spaces not specifically designed for OOD detection [13], our method enhances the structure of the learned feature space by guiding the model to increase inter-group separation and reduce intra-group variance. This promotes better feature discrimination and robustness to OOD samples [22].
Specifically, we partition the feature space at the penultimate layer based on the grouping results derived from class mean similarity. This partitioning allows each group to capture class-specific characteristics, minimizing feature overlap. Our loss function incorporates the following components:
  • Intra-group feature aggregation: Encourages features within a group to cluster around their group center, improving the intra-class compactness and ensuring that similar samples are grouped together. This reduces the variance within the group, leading to better classification performance for ID samples.
  • Inter-group feature separation: Maximizes the minimum distance between different group centers to reduce confusion between groups, ensuring that the feature representations of distinct classes are well-separated. This enhances the discriminability of in-distribution samples and increases the margin between ID and OOD instances, making it easier to identify OOD samples.
We retain the standard cross-entropy loss to preserve ID classification performance while integrating the distance-based loss to strengthen OOD detection.
The optimization objective is formulated as:
L = L CE + L i n _ g r o u p L i n t e r _ g r o u p
where
L d i s t a n c e = L i n _ g r o u p L g r o u p
where L CE represents the cross-entropy loss for classification and L i n _ g r o u p minimizes the distance between features f j and their group center μ ^ i :
L i n _ g r o u p = 1 | G | i = 1 | G | 1 | G i | j G i f j μ ^ i 2
where
  • | G | is the total number of groups;
  • G i is the set of samples in group i;
  • f j is the feature vector of sample j in group i;
  • μ ^ i is the mean feature vector of group i.
L g r o u p ensures that the minimum distance between different groups is maximized:
L g r o u p = min i μ ^ m i μ ^ i 2
where
  • μ ^ m i is the mean feature vector of the out-of-group samples;
  • μ ^ i is the mean feature vector of group i.
Note that although features across groups may be embedded in different semantic subspaces, we calculate the inter-group separation based on their representations within the shared feature space of the current layer. In this setting, the group-wise mean vectors μ ^ i and μ ^ m i are derived from the same-dimensional representations, ensuring that Euclidean distance computations remain geometrically meaningful.
Moreover, by treating features from other groups as out-of-group samples within the same projection dimension, we effectively enforce worst-case margin separation, encouraging the model to avoid overlapping feature regions across groups. This group-based contrast enforces a more discriminative feature organization even under complex, overlapping traffic distributions.
The complete training procedure is described in Algorithm 2. In contrast to traditional Mahalanobis-based approaches, which require computation of high-dimensional covariance matrices, our group-level strategy significantly reduces computational complexity while maintaining strong discriminative capability.
As shown in Figure 3, the proposed method yields superior OOD detection performance compared to classification-based baselines such as MSP, particularly in complex and overlapping IoT traffic scenarios.
Algorithm 2 Loss Function Optimization
Require: Training set X train , class-group labels Y train , penultimate layer feature representations f , grouping results g r o u p slice
Ensure: Optimized feature representations for OOD detection
  1:
for each mini-batch do
  2:
    for  i = 1 to G do
  3:
        Extract feature vectors belonging to group i:
  4:
                f i f [ g r o u p slice [ i ] [ 0 ] : g r o u p slice [ i ] [ 1 ] ]
  5:
        Compute mean feature vector for group i samples:
  6:
                μ ^ i = 1 | G i | j G i f j
  7:
        Compute intra-group loss:
  8:
                L in - group i = 1 | G i | j G i f j μ ^ i 2
  9:
        Identify samples outside group i:
10:
                m i = { samples in mini - batch not in G i }
11:
         Compute mean feature vector for out-of-group samples:
12:
                μ ^ m i = 1 | m i | j m i f j
13:
        Compute inter-group loss:
14:
                L group i = μ ^ m i μ ^ i 2
15:
    end for
16:
    Compute the average intra-group loss:
17:
            L in - group = 1 | G | k = 1 | G | L in - group k
18:
    Compute the minimum inter-group loss:
19:
            L group = min k L group k
20:
    Compute overall loss:
21:
            L = L in - group L group + L CE
22:
end for

3.3. OOD Detection with Feature Distance

Our method improves feature space representation by applying class mean clustering and optimizing feature distance loss, which increases the separation between ID and OOD samples. Since our approach relies on feature distances [23], we use the Mahalanobis distance as the OOD detection metric.
The Mahalanobis distance measures the distance of a sample from the center of the distribution, considering feature covariance. Given a test sample x, its Mahalanobis distance to a group center μ G i is defined as:
D M ( x , G i ) = ( f μ G i ) T Σ G i 1 ( f μ G i )
where f represents the feature vector of the test sample x extracted by the model, μ G i is the mean feature vector of group G i , and Σ G i 1 is the inverse covariance matrix of the group. The OOD detection score is defined as the negative minimum Mahalanobis distance across all groups:
OOD Score ( x ) = min i D M ( x , G i )
A sample is classified as OOD if its score falls below a threshold γ , which is selected to ensure at least 95% in-distribution classification accuracy. To ensure the stability of Mahalanobis distance computation in high-dimensional settings, we adopt a dual strategy: (1) grouping similar classes to reduce the effective dimensionality of the feature space, and (2) applying Tikhonov regularization to the covariance matrices by adding a small multiple of the identity matrix. Specifically, the regularization parameter λ is empirically set to a small positive value (e.g., 10 3 ) after tuning on a validation set, balancing numerical stability and fidelity to the original covariance structure. This approach not only improves numerical robustness but also aligns with standard practices in high-dimensional statistical modeling, ensuring reliable inversion of covariance matrices without significantly distorting data distribution.
Threshold selection plays a crucial role in OOD detection. However, traditional OOD methods often lack adaptability. Figure 4b shows that different threshold selection strategies yield significantly different performance, even when applied to the same model. This inconsistency highlights the need for a model-specific threshold selection approach.
To address this, we propose an adaptive threshold selection strategy using KDE to determine an optimal threshold dynamically. KDE estimates the probability density function of OOD scores:
p ^ ( x ) = 1 n h i = 1 n K x x i h
where K ( · ) is a Gaussian kernel function, h is the bandwidth parameter controlling the smoothness, and x i are the OOD scores obtained from the test set. Specifically, x represents a specific OOD score for which the density function is being estimated, and x i denotes the set of all OOD scores used to estimate the probability density function p ^ ( x ) . This non-parametric method estimates the density by averaging contributions from each score, providing a smooth approximation of the score distribution.
The bandwidth h plays a crucial role in balancing bias and variance in the density estimate: a smaller bandwidth captures more local detail but may overfit noise, while a larger bandwidth results in a smoother but potentially oversimplified density. To adaptively select an appropriate bandwidth for each dataset, we employ Scott’s rule, which calculates h based on the number of samples n, the data dimensionality d, and the standard deviation σ of the scores, according to
h = σ · n 1 d + 4 .
This automatic bandwidth selection ensures that the KDE thresholding remains stable and reliable across different test sets with varying score distributions, eliminating the need for manual tuning.
The threshold is selected at the first significant inflection point in the density curve, where it exhibits a sharp decline, marking the transition between ID and OOD samples. This inflection point represents the greatest change in the kernel density estimate, effectively distinguishing between ID and OOD samples. It is particularly effective because the OOD scores of ID samples are often tightly clustered and exhibit a near-normal distribution. This clustering creates a distinct transition at the first inflection point, where the density sharply drops, establishing a natural decision boundary. By selecting this point as the threshold, we minimize the risk of misclassifying ID samples as OOD or vice versa.
By dynamically adjusting the threshold based on the distribution of OOD scores, our KDE-based approach effectively mitigates the instability observed in Figure 4, leading to more robust OOD detection performance across various datasets.

4. Experiments

In this section, we discuss our experimental setup and demonstrate the effectiveness of our method (ODDL) for OOD detection on both open-source and real-world datasets, highlighting its improved performance in OOD detection, particularly in complex IoT traffic scenarios. Additionally, we conduct parameter analysis and ablation experiments to assess the contribution of each component of the method.

4.1. Setup

Datasets: We utilize two open-source IoT traffic datasets, IoT Sentinel [24] and CIC IoT Dataset2022 [25], along with a real-world IoT traffic dataset from the Shenzhen power grid. We extract features from the IoT Sentinel PCAP files and use this open-source dataset for setting up experiments. We validate our approach using the CIC IoT Dataset2022, which includes 28 device classes across three distinct categories. The data distributions of the CIC IoT Dataset2022 are shown in Table 1. In each experiment, we treat one class as the OOD sample, with the remaining classes serving as the ID samples. To evaluate its effectiveness in real-world scenarios, we use the Shenzhen power grid IoT traffic dataset as the OOD data and the IoT Sentinel dataset as the ID data. The Shenzhen power grid IoT traffic consists of TCP sessions between various energy metering terminals and master stations, collected over a 7-day period from 1 January to 7 January 2021, totaling approximately 2.5 GB. The dataset includes three types of terminals—TTU, LMT, and LVMR—each corresponding to distinct functionalities and operational roles within the power grid. These terminal types are exclusively used as OOD test samples in our evaluation. Their corresponding sample quantities and descriptions are provided in Table 2.
Evaluation Metrics: We use the following standard metrics commonly used for OOD detection to evaluate our method and compare it with baseline methods: (1) Area Under the Receiver Operating Characteristic Curve (AUROC); (2) False Positive Rate at 95% True Positive Rate (FPR95) for OOD samples; (3) Area Under the Precision-Recall Curve (AUPR).
Training Details: We follow part of the experimental setup from Huang et al. [14], where the batch size is 512, and the learning rate decays by a factor of 10 at 30%, 60%, and 90% of the training steps. We use an SGD optimizer with an initial learning rate of 0.03 and momentum of 0.9. The training and testing sets have the same feature dimensionality. To comprehensively assess the practical applicability of our proposed method, we measured the inference runtime of all compared approaches on the same evaluation datasets. All runtime experiments were performed on an NVIDIA RTX 4090 GPU with 24 GB under identical software and hardware configurations to ensure a fair and unbiased comparison.
Baseline Methods: To ensure a fair evaluation, we compare our method with several strong baseline methods from the literature: MSP [10], AE [11], ODIN [4], Energy [12], Mahalanobis [13]. These methods infer OOD scores using models trained solely on in-distribution data, without relying on any auxiliary anomaly data [26,27]. For [13], we use the final-layer features for OOD scoring, without utilizing feature sets from multiple layers for confidence score computation. We also evaluate our method against several baseline threshold selection techniques: Prec [28], IQR [29], Ksigma [30], OTSU [17], ECDF [19], Inflection Std [16], and POT [18]. These baseline methods utilize various techniques for selecting thresholds based on the OOD scores output by the models.

4.2. Results

We evaluate our method on the open-source CIC IoT Dataset 2022, which is characterized by a large number of classes and highly imbalanced class distributions. The results, as shown in Table 3, demonstrate that our model significantly outperforms baseline methods in terms of OOD detection performance. Through repartitioning the feature space, designing an OOD-specific learning objective, and introducing a dedicated scoring function, our method substantially improves detection accuracy. It achieves AUROC and AUPR values above 0.95 and up to 0.99, while reducing FPR95 to as low as 0.03.
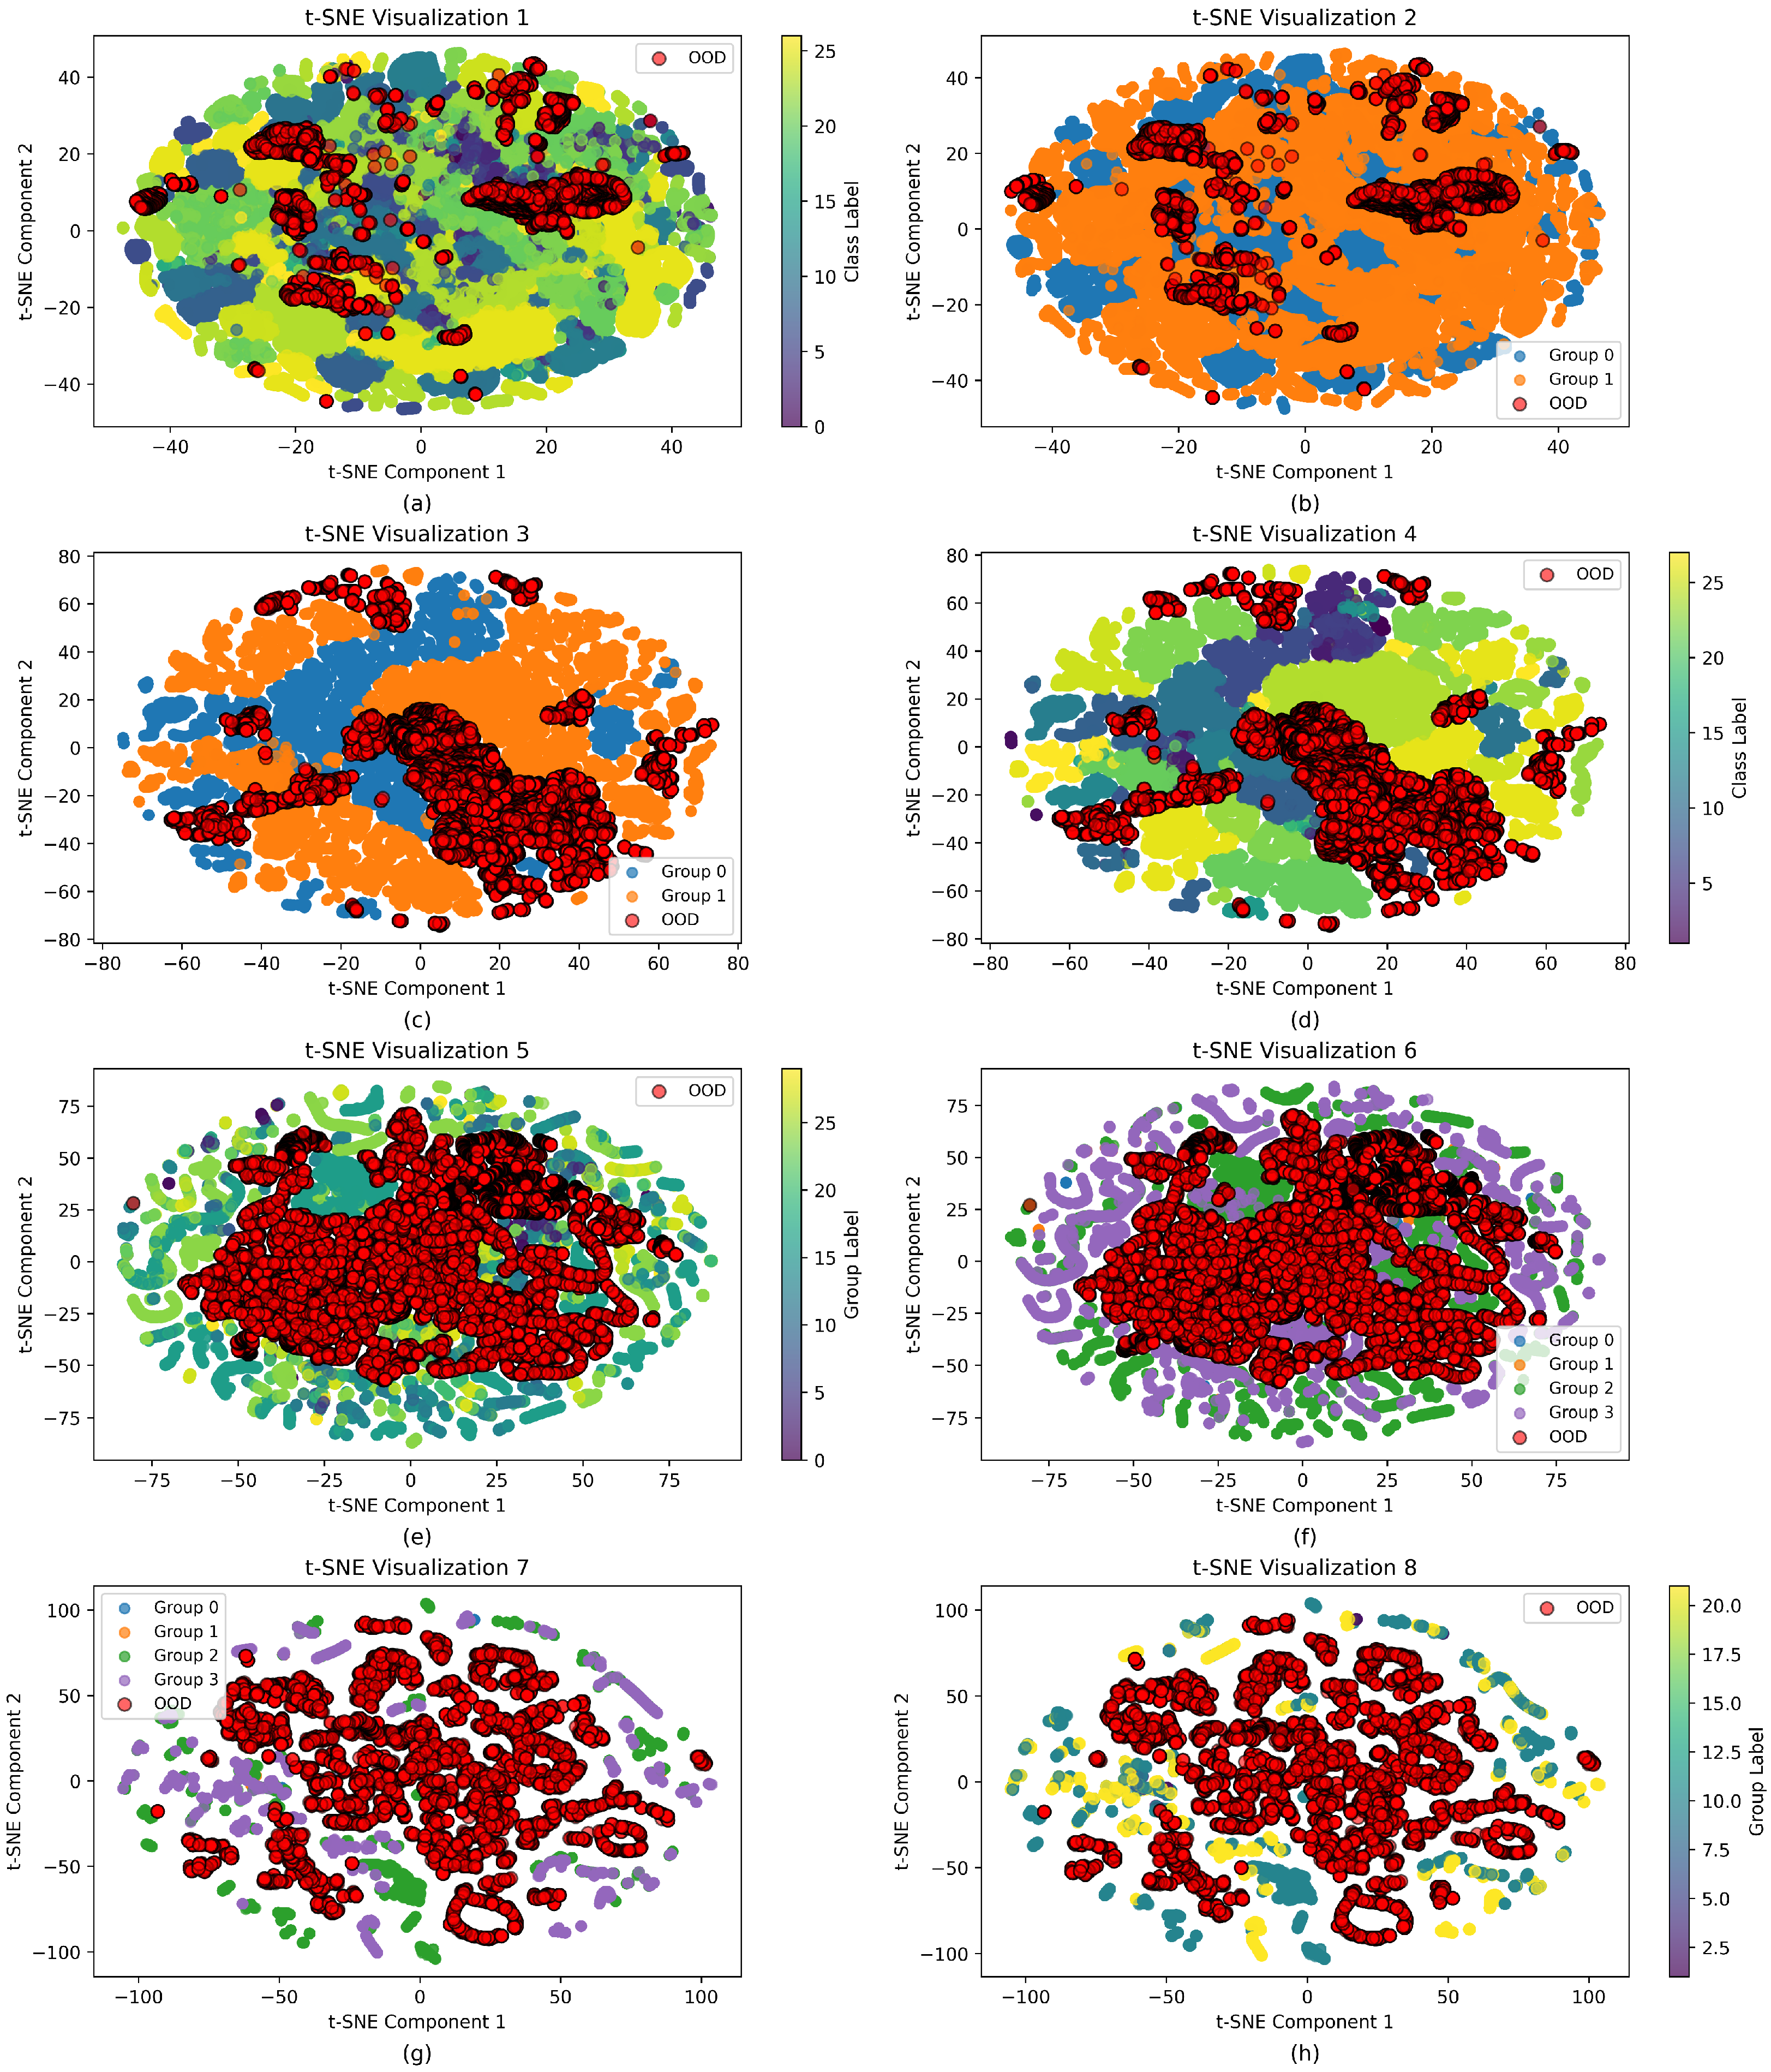
We further evaluate our method using IoT Sentinel as the in-distribution dataset and the Shenzhen Grid traffic as the OOD dataset. The results, averaged over 10 runs, are presented in Table 4. Our method consistently outperforms the baseline methods, achieving an average AUROC of 0.9315—outperforming the second-best method by 0.24—and an FPR95 of 0.1770, representing a reduction of 0.5806 compared to the second-best method. These results demonstrate the effectiveness of our approach in real-world scenarios. However, we observe that the performance on the IoT Sentinel dataset is slightly lower compared to the CIC IoT Dataset 2022. This is mainly due to the high similarity of feature distributions among classes in the IoT Sentinel dataset, which leads to lower overall classification accuracy, as illustrated in Figure 5.
As presented in Table 3, our method achieves significantly better performance compared to existing baselines across all OOD detection metrics. This improvement is closely related to both the characteristics of the dataset and the structure of the proposed framework. The CIC IoT 2022 dataset contains classes with relatively clear boundaries and distinguishable traffic patterns. This property allows the model to learn feature representations that are naturally more separable, which benefits OOD detection methods that rely on distributional differences rather than classifier outputs.
The grouping mechanism contributes to this effect by aggregating classes with similar feature distributions into the same group. This reduces inter-class interference and transforms the original fine-grained classification task into a more robust group-level modeling process. The group-wise distance loss further refines this structure by encouraging tighter intra-group clustering and enlarging the margins between groups in the feature space. Consequently, OOD samples are more likely to fall into low-density regions, making them easier to distinguish from in-distribution instances.
Recent studies support that feature-based methods often outperform classifier-based ones in complex or imbalanced settings, which aligns with our findings [31].
In the two experimental setups described above, we calculate the OOD detection F1 scores for various threshold selection strategies. The results, presented in Table 5 and Table 6, demonstrate that our method exhibits greater robustness across different datasets and achieves the best overall performance. Although the fixed-percentile threshold approach performs comparably to our method on the IoT Sentinel dataset, it proves less effective on the CIC IoT Dataset 2022, suggesting that fixed thresholds lack adaptability to varying data distributions. Other traditional threshold selection strategies suffer from similar performance degradation.
The Otsu method performs best when using IoT Sentinel as the in-distribution dataset and Shenzhen Grid Flow TTU as the OOD data. However, its performance drops substantially in experiments using Shenzhen Grid Flow LMT as OOD, due to the positively skewed score distribution (skewness of 1.19). In contrast, our method exhibits minimal performance variation across different experimental conditions, demonstrating stronger robustness by better adapting to varying data distributions and leading to more appropriate threshold choices.
To evaluate computational efficiency for edge deployment, we report the inference runtimes (in seconds) of all compared methods on both the CIC-IoT2022 and IoT Sentinel datasets, as shown in Table 7. Our proposed method (ODDL) achieved the lowest inference time on both datasets—0.0165 s on CIC-IoT2022 and 0.0200 s on IoT Sentinel—outperforming all baseline methods, including MSP, AE, ODIN, Energy, and Mahalanobis. These results demonstrate that our approach offers not only superior detection performance but also significantly reduced computational cost, making it highly suitable for real-time OOD detection in resource-constrained IoT environments.

4.3. Robustness and Fairness Evaluation

To ensure the reliability of the reported improvements, we adopted a rigorous and fair experimental design. All baseline and proposed methods were trained and tested using the same data partitions, backbone architectures, and optimization settings to eliminate experimental bias.
To assess the robustness of our method, we introduced additive Gaussian noise N ( 0 , 0.01 2 ) to 20% of the test samples during evaluation. This simulates real-world perturbations such as sensor or network noise in IoT applications. As shown in Table 8, our method maintains consistently high performance, with a marginal decrease in AUROC (from 0.9905 to 0.9312) and FPR95 (from 0.0305 to 0.1513) on the CIC IoT 2022 dataset. This indicates that the learned representations and thresholding mechanism are robust to moderate perturbations in the input.
Interestingly, we observed that the performance of several baseline methods (e.g., MSP and ODIN) improved under noisy test conditions. A possible explanation is that Gaussian noise reduces the overconfidence of ID predictions, effectively increasing the separation between ID and OOD score distributions. In contrast, our method already optimizes for inter-group separability and OOD sensitivity during training, and is less affected by such changes. These results suggest that our method offers more stable and reliable OOD detection in the presence of input uncertainty.
In addition, to ensure the statistical reliability of our results, we conducted each experiment five times with different random seeds. The reported values in Table 3 and Table 4, including AUROC and FPR95, represent the mean and the corresponding 95% confidence intervals across these independent runs. For instance, in Table 4, our method achieves an AUROC of 0.8703 ± 0.0156 , demonstrating consistent and robust performance across multiple trials.
These evaluations provide strong evidence that the observed performance gains are both robust and reproducible.

4.4. Hyperparameter Sensitivity Analysis

In this section, we study the impact of key hyperparameters on model performance and threshold selection robustness. Specifically, we analyze the number of feature groups (G) and the KDE bandwidth (h), both of which play essential roles in the proposed OOD detection framework.

4.4.1. Effect of Group Number on Detection Performance

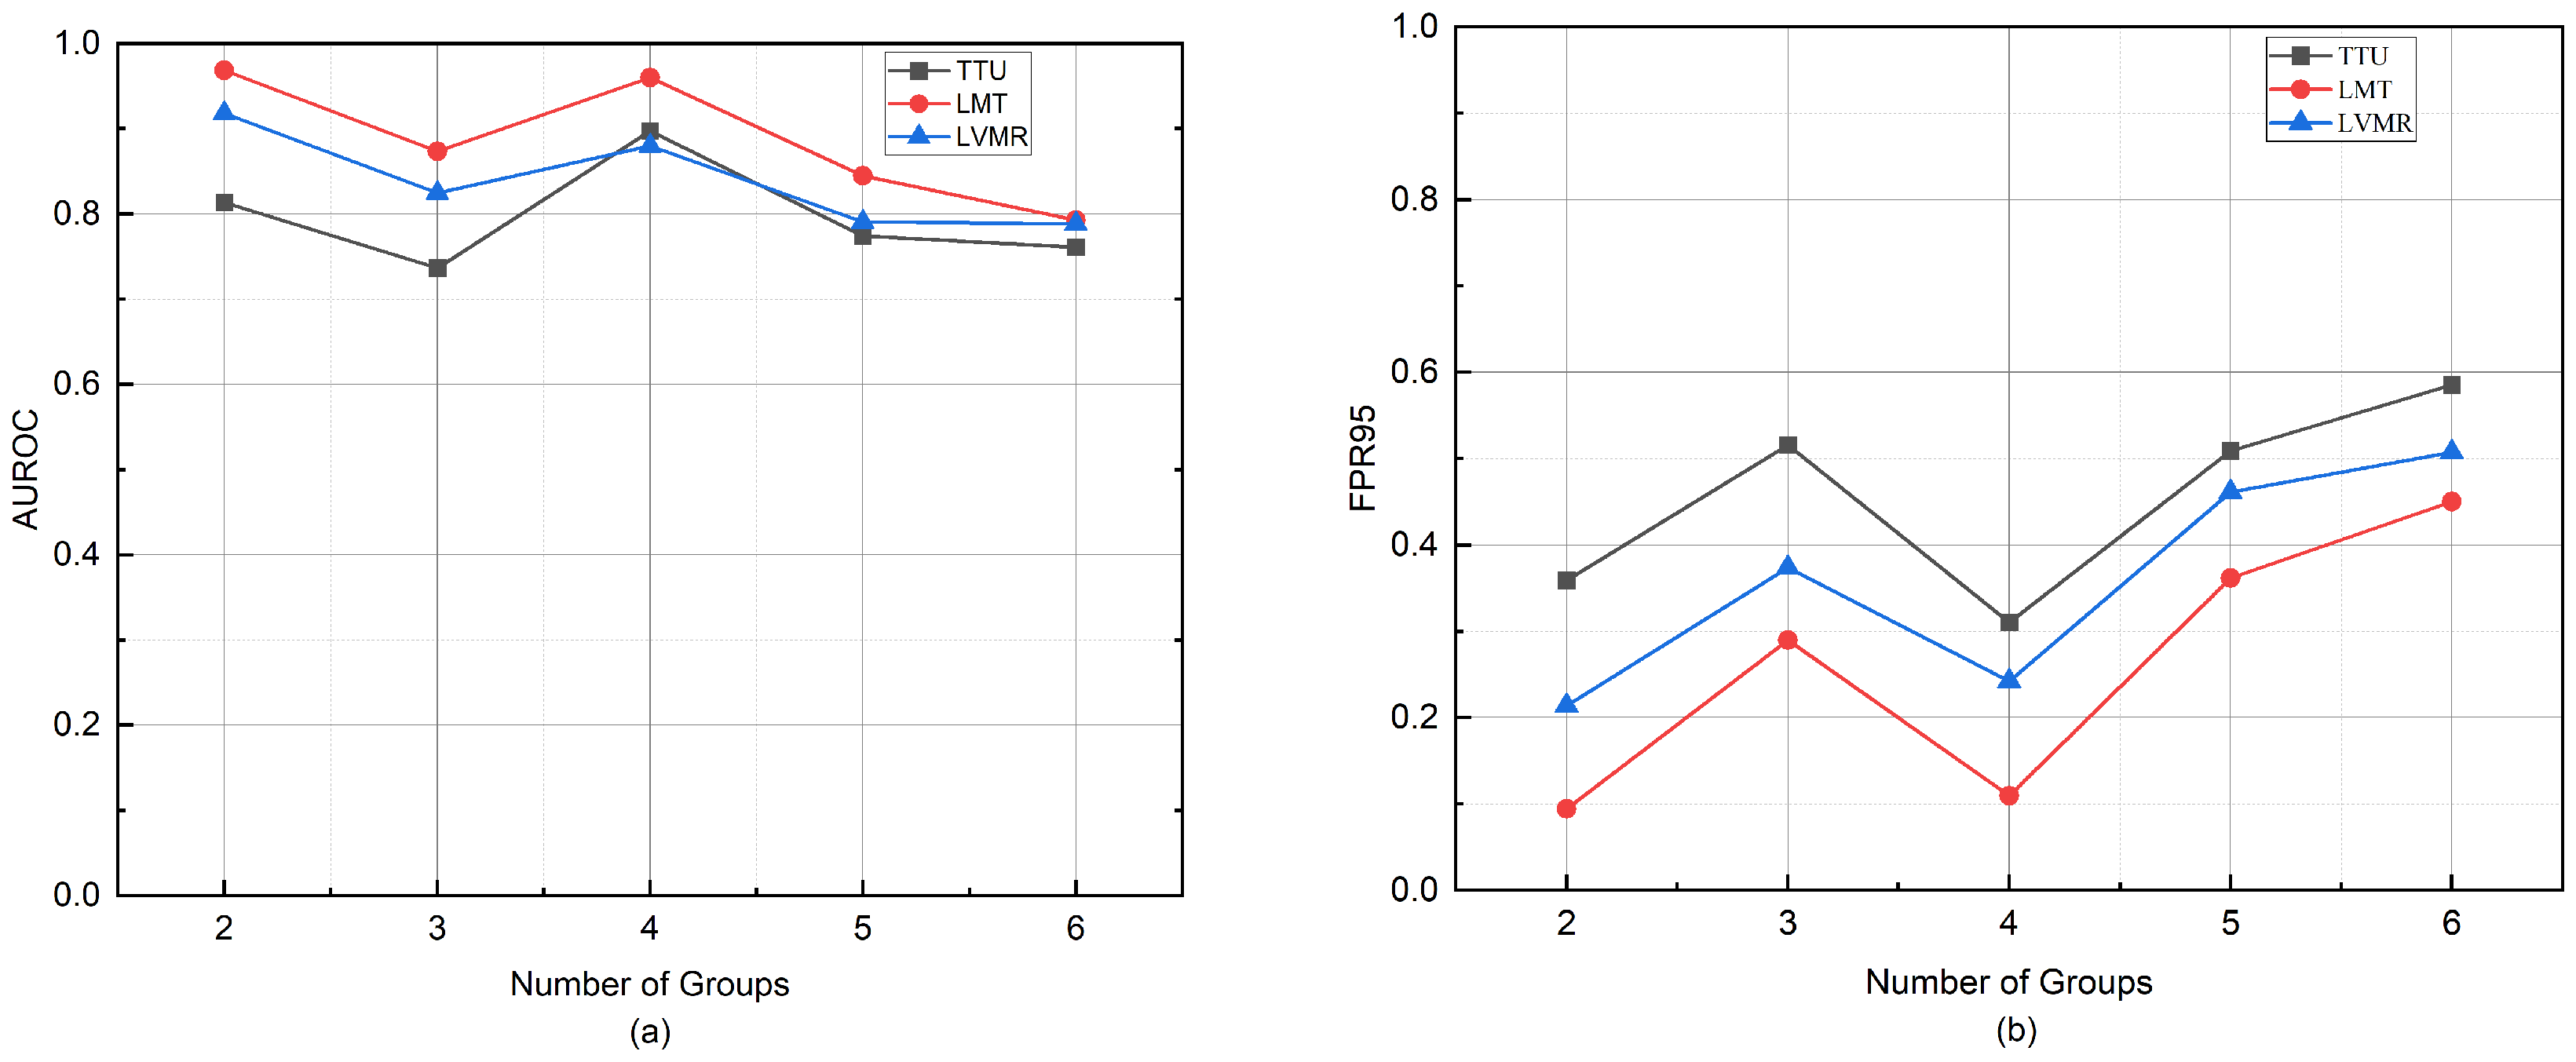
In complex IoT traffic scenarios with large-scale labeled datasets, our method aggregates classes into groups to facilitate more effective feature learning and simplify decision boundaries. To analyze the effect of group number G, we vary this hyperparameter and examine its influence on AUROC and FPR95.
As shown in Figure 6, increasing G leads to a degradation in OOD detection performance, reflected by a decrease in AUROC and an increase in FPR95. This supports our hypothesis that an overly large number of groups may assign semantically similar classes into different clusters, leading to blurred decision boundaries and reduced separability. Conversely, too small a group number results in highly heterogeneous groups, dispersing the feature distribution and limiting the effectiveness of the distance-aware loss.
To support the choice of group number, we computed the silhouette coefficient as an unsupervised clustering quality metric (see Algorithm 3). For instance, on the IoT Sentinel dataset, the silhouette score peaked at k = 3 ( S = 0.3199 ), while the best OOD performance was achieved at k = 4 , with a 19.5% reduction in FPR95. This discrepancy suggests that the silhouette alone may not be sufficient to guide OOD-aware clustering. Future work will consider performance-aware automatic group selection strategies.
Algorithm 3 Automatic group number selection via silhouette score
Require:
  Class mean vectors M R n × d where n = number of classes
  Minimum group number k min = 2
  Maximum group number k max = 10
Ensure: Optimal group number k *
  1:
Initialize k * k min , s * 1
  2:
for  k = k min   to  k max   do
  3:
    Cluster M into k groups:
  4:
            C k KMeans ( n _ c l u s t e r s = k ) . f i t ( M )
  5:
            l a b e l s C k . l a b e l s _
  6:
    Calculate Silhouette Score:
  7:
            a i mean intra - cluster distance for group i
  8:
            b i nearest - cluster distance for group i
  9:
            s k 1 k i = 1 k b i a i max ( a i , b i )
10:
    Update optimal group number:
11:
    if  s k > s *  then
12:
         k * k
13:
         s * s k
14:
    end if
15:
end for

4.4.2. Threshold Sensitivity to Group Number and Bandwidth

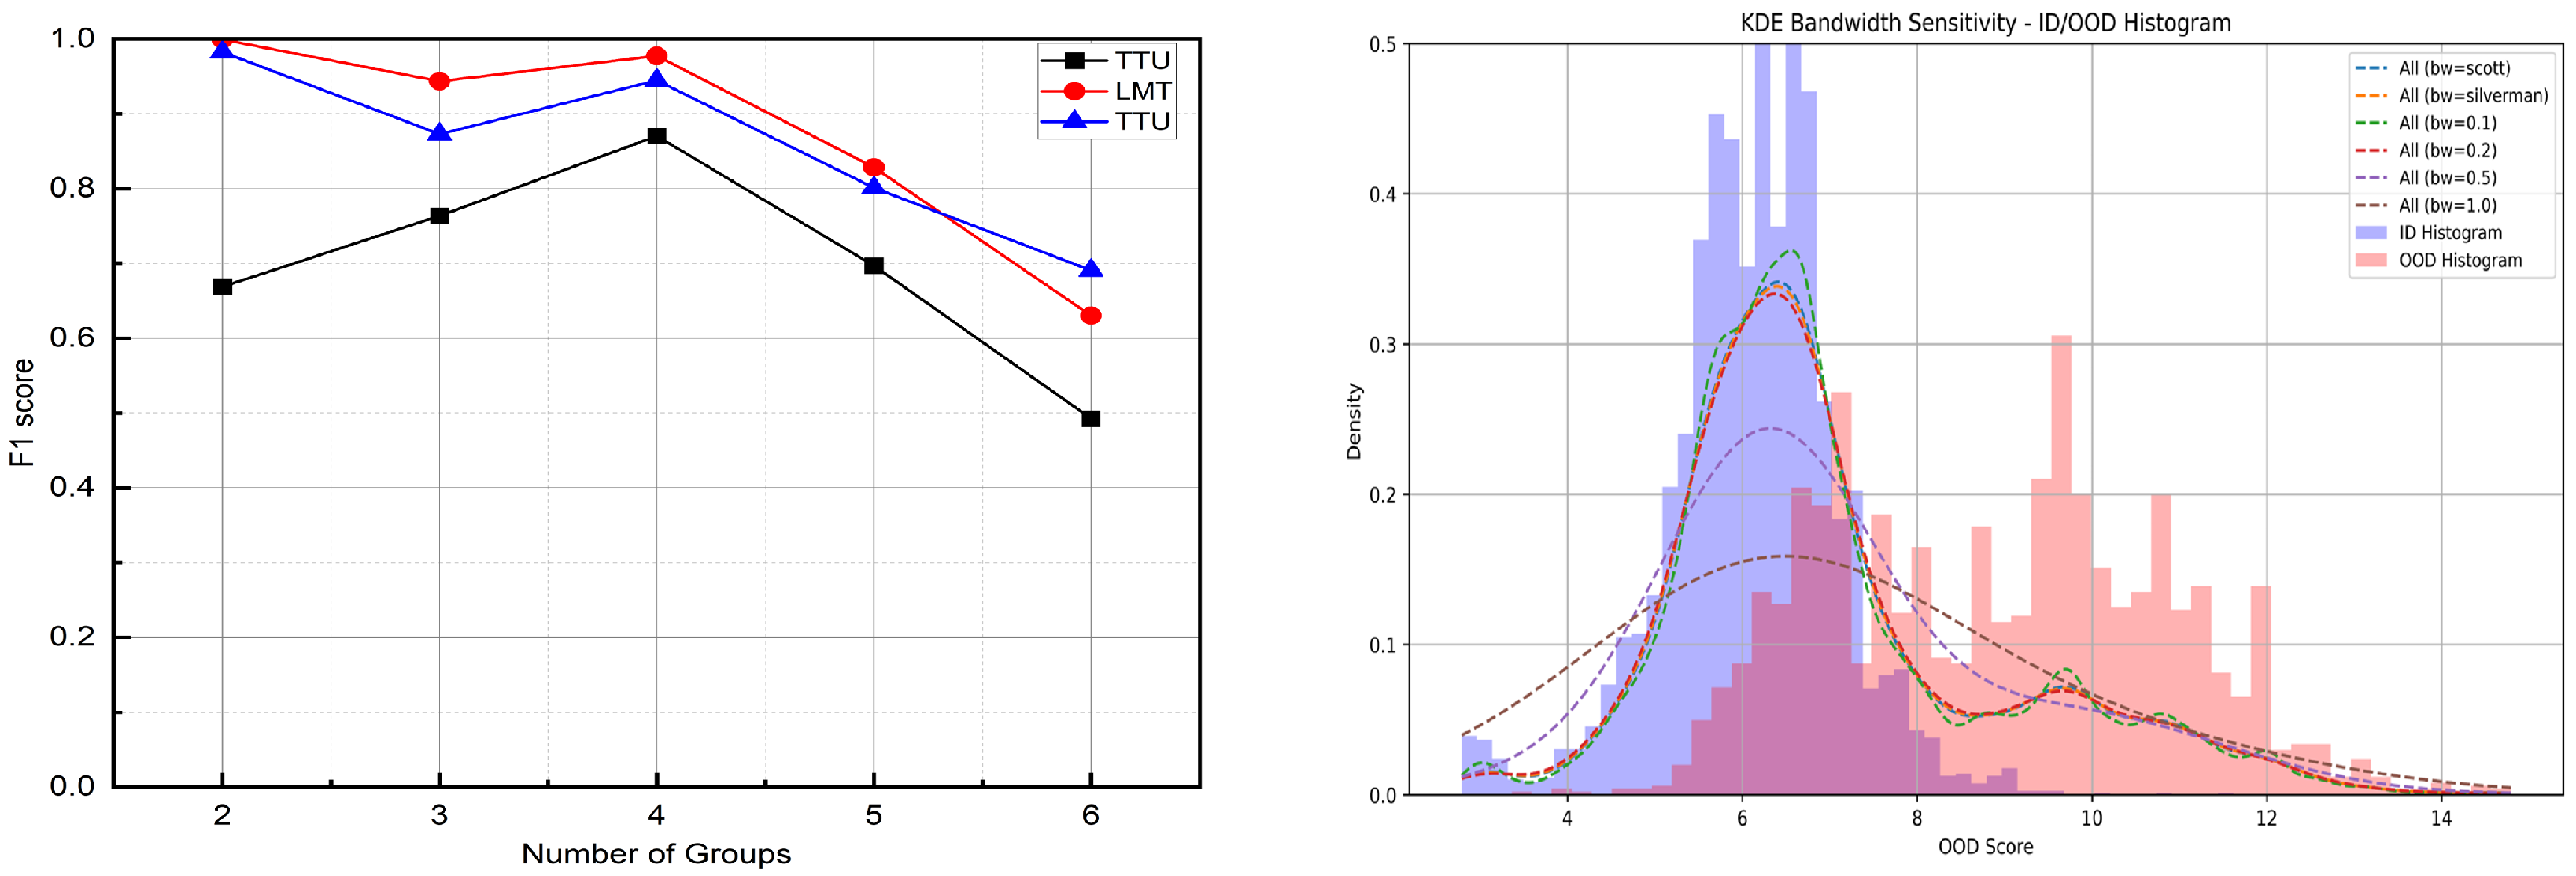
We further study how threshold selection via KDE responds to variations in group number G and bandwidth h. As shown in Figure 7, we evaluate the F1 score of the OOD decision results under varying group numbers ( G [ 2 , 6 ] ) and different KDE bandwidths ( h { scott , silverman , 0.1 , 0.2 , 0.3 , 0.5 , 1.0 } ). We find that changes in F1 score exhibit similar trends to AUROC with respect to G, indicating that the thresholding closely tracks the underlying feature space quality. For the bandwidth h, performance remains stable when h [ 0.2 , 0.3 ] , while larger values such as h = 0.5 or 1.0 cause over-smoothed densities and imprecise thresholds.
These results demonstrate that our method is relatively robust to hyperparameter settings. In particular, the KDE-based thresholding mechanism performs reliably under a broad range of bandwidths and group configurations, making it well-suited for practical deployment where exhaustive tuning may not be feasible.

4.5. Ablation Study

To assess the contribution of each component in our proposed OOD detection framework, we conduct a stepwise ablation study with the following configurations:
  • Baseline: A standard classifier trained only with cross-entropy loss, without any grouping or distance-based regularization.
  • Baseline + Grouping: A class grouping mechanism based on class mean similarity is introduced, encouraging similar classes to form compact groups and enabling more localized decision boundaries.
  • Complete ODDL (Baseline + Grouping + Distance Loss): A group-wise distance loss is added to enforce intra-group compactness and inter-group separation in the feature space.
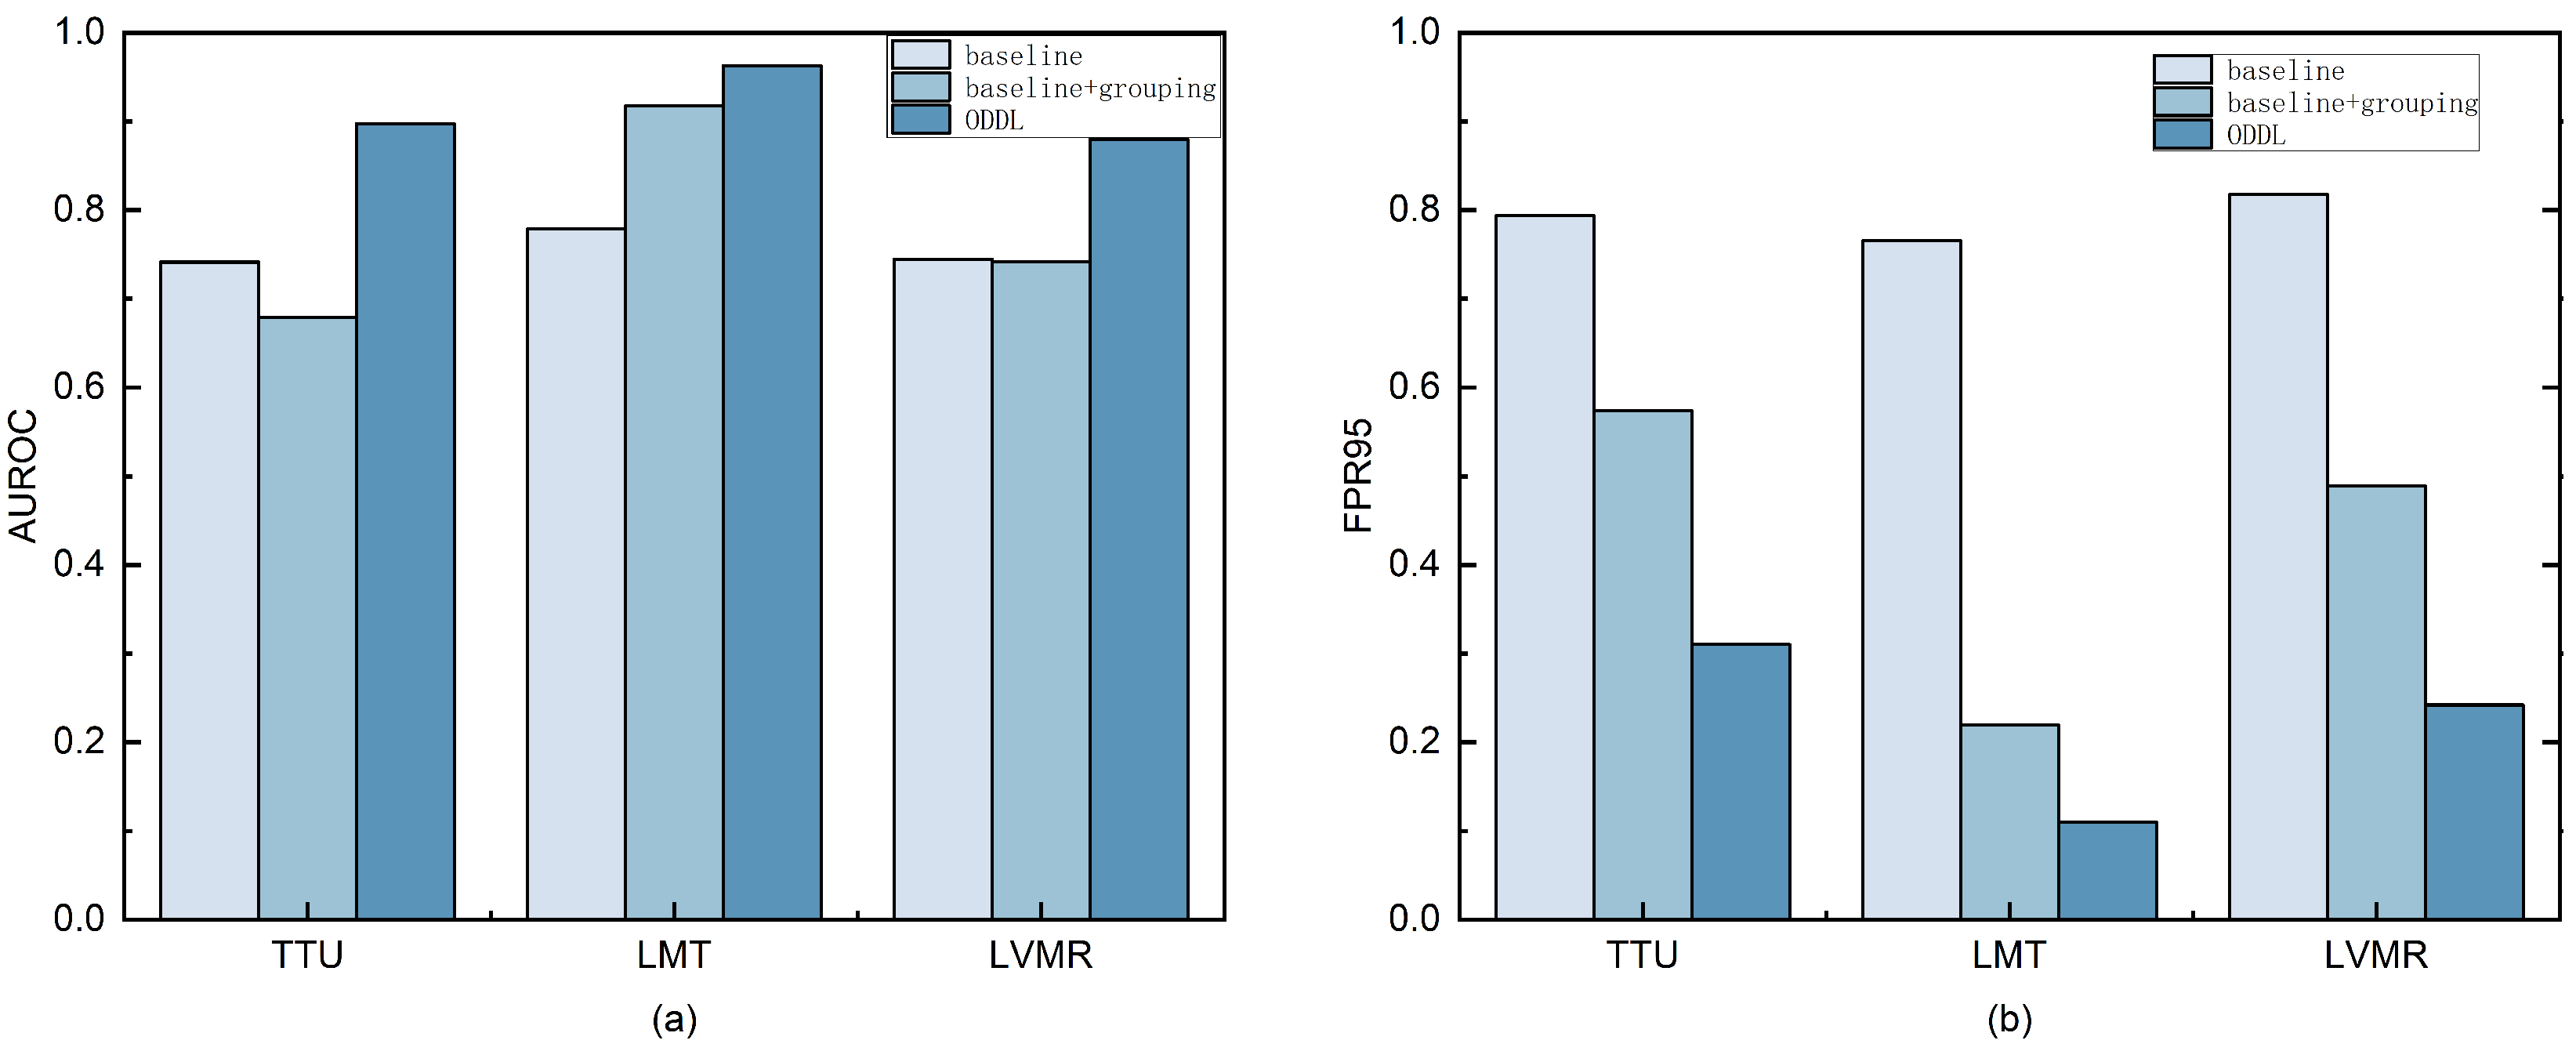
As shown in Figure 8, the grouping module alone reduces FPR95, indicating improved suppression of high-confidence misclassification on OOD samples. Although AUROC improvement is modest at this stage, adding the distance loss yields substantial gains in both AUROC and FPR95.
This improvement is attributed to the way each component shapes the feature space. Grouping organizes classes with similar distributions into semantically meaningful regions, while the distance loss tightens intra-group clusters and pushes apart different groups. As a result, in-distribution (ID) samples tend to cluster near group centers, whereas OOD samples are more likely to fall into low-density regions, improving their separability under the Mahalanobis distance metric.
All experiments were conducted under identical training protocols and data splits to ensure fair comparison. No other variables were changed across configurations, ensuring the observed improvements result solely from the added components. These results validate the design of our framework and explain the significant performance differences reported in Table 3.

4.6. Analysis of KDE-Based Adaptive Threshold Selection

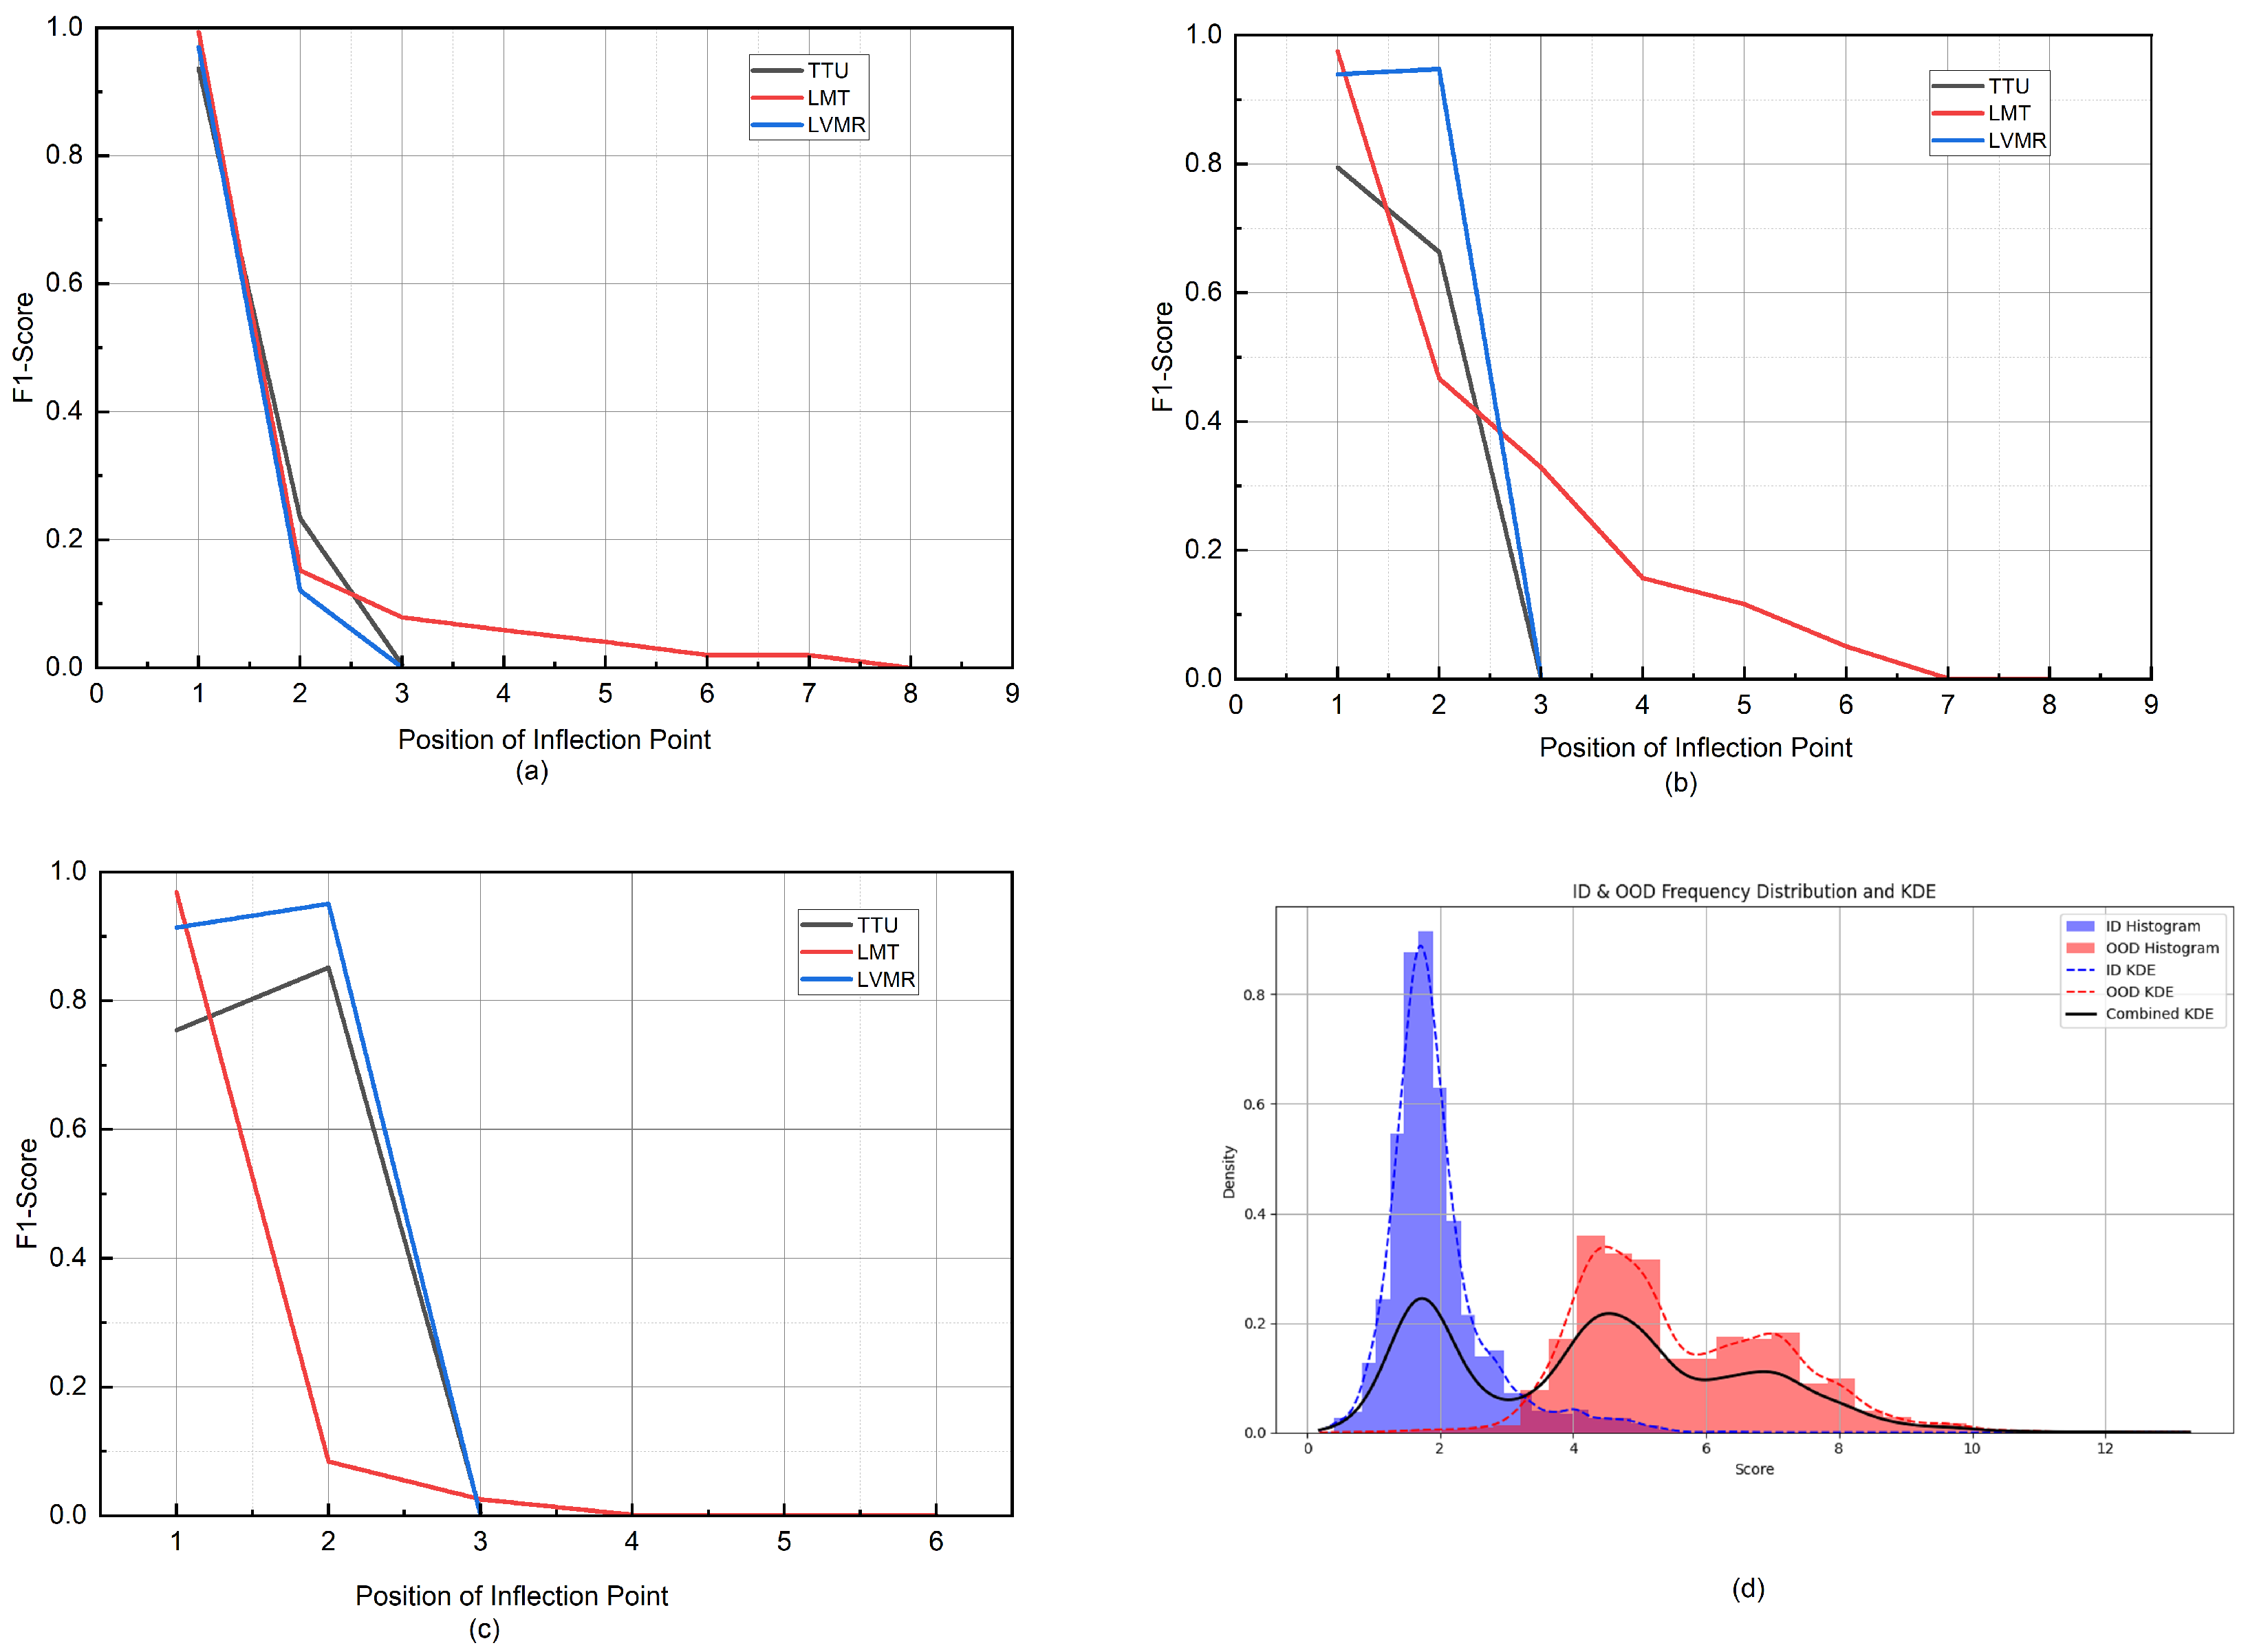
To assess the effectiveness of the proposed KDE-based adaptive threshold selection strategy, we analyze the F1 scores corresponding to different inflection points on the KDE curve, as shown in Figure 9, using IoT Sentinel as ID and Shenzhen power grid traffic as OOD. The results demonstrate that choosing the first inflection point of the KDE curve as the decision threshold consistently yields higher and more stable F1 scores across experiments.
Although the second local minimum occasionally results in slightly higher F1 scores, its performance is less stable, with values dropping sharply to as low as 0.1 in certain cases. Furthermore, as shown in the fourth subfigure of Figure 8, the density of ID samples is relatively concentrated, which supports the use of local minima in the KDE curve as reliable indicators of ID-OOD decision boundaries.

4.7. Scalability Evaluation on IoT-23 Dataset

To further evaluate the generalization ability and scalability of our proposed method, we conducted additional experiments on the IoT-23 dataset. This dataset is significantly more diverse and imbalanced compared to those used in previous sections, comprising 33 in-distribution (ID) classes with traffic from various IoT devices and attack types. Notably, the class distribution is highly skewed: the largest class contains 7,200,501 samples, while the smallest class has only 1252 samples, introducing substantial challenges for both in-distribution learning and OOD detection.
In our evaluation, we follow a leave-one-out setting where one class is treated as the out-of-distribution (OOD) class, and the remaining 32 classes are used for training. Due to the large volume of data, we observe some fluctuations during training. Nevertheless, our proposed method consistently outperforms baseline methods such as ODIN, Mahalanobis, and MSP. The AUROC achieved by our method ranges from 0.7353 to 0.8976, showing robust detection performance under severe class imbalance and increased category complexity. Table 9 summarizes the performance comparison on IoT-23.
These results confirm the scalability of our proposed method and its applicability to real-world IoT environments, where device diversity and traffic imbalance pose significant challenges.

5. Discussion

The rapid proliferation of IoT devices has intensified security concerns, particularly in the areas of intrusion detection and device identification. While traditional classification-based methods such as MSP and ODIN excel in closed-set classification, they struggle with OOD detection due to the complex, highly imbalanced nature of IoT traffic. The presence of a large number of class labels and dynamic traffic patterns further complicates the decision boundaries, thereby undermining the effectiveness of OOD detection.
One fundamental limitation of classification-based methods lies in their reliance on the softmax cross-entropy loss, which tends to produce overconfident predictions for ID samples. This results in inflated softmax probabilities that obscure the ID-OOD distinction, limiting the efficacy of post hoc OOD scoring functions. As shown in our experiments, methods such as MSP and ODIN exhibit declining performance as the number of labeled classes increases and data imbalance worsens.
To overcome these challenges, we introduce a novel OOD detection framework that partitions classes into groups based on feature similarity, thereby simplifying the decision space. By incorporating a distance-based representation learning approach, our method enhances feature separation by minimizing intra-group variance and maximizing inter-group distances. OOD detection is then performed using Mahalanobis distance relative to these learned feature groups. Additionally, we introduce a KDE-based adaptive thresholding mechanism to improve robustness across different IoT traffic distributions. Our experiments demonstrate that this method consistently outperforms existing approaches on both open-source datasets and real-world IoT scenarios.
Nevertheless, this study has certain limitations that warrant further investigation. First, the effectiveness of the grouping strategy directly impacts detection performance, and different ID sample distributions require different group partitioning strategies. If the grouping is not well-optimized, OOD detection performance may degrade. In future work, we plan to explore more adaptive grouping strategies tailored to various ID sample distributions to enhance the robustness of our method. Additionally, our current approach primarily focuses on tabular traffic features. Future research should explore its applicability to alternative traffic representations, such as grayscale images and other feature modalities. Our current framework relies on supervised learning with labeled data, which limits its applicability where labeled samples are scarce. We intend to investigate semi-supervised and self-supervised approaches to leverage unlabeled data and improve OOD detection.
Finally, real-time and online OOD detection is essential for dynamic IoT environments with evolving traffic patterns. Future research will develop streaming-based detection pipelines with sliding window mechanisms and incremental density estimation to enable adaptive thresholding and timely detection.
As IoT networks continue to scale in size and complexity, robust OOD detection will become increasingly critical for ensuring the security and reliability of cloud–edge collaborative environments. Our work provides a practical and effective contribution toward enhancing the robustness of classification-based IoT security systems, including intrusion detection and device authentication.

Author Contributions

Conceptualization, all authors; methodology, C.Z. and J.Z.; software, C.Z. and M.F.; validation, J.Z. and Y.C.; formal analysis, M.F. and Y.C.; investigation, C.Z. and M.F.; resources, Y.L.; data curation, M.F.; writing—original draft preparation, C.Z.; writing—review and editing, C.Z. and Y.L.; visualization, J.Z. and Y.C.; supervision, Y.L. and C.W.; project administration, Y.L. and C.W.; funding acquisition, Y.L. and C.W. All authors have read and agreed to the published version of the manuscript.

Funding

This research was funded by the National Key Research and Development Program of China grant number No. 2023YFB3107604.

Institutional Review Board Statement

Not applicable.

Informed Consent Statement

Not applicable.

Data Availability Statement

The real IoT trafffc data used in Section 4 is from the wireless-accessing area of the Shenzhen Power Supply Bureau and can be obtained by contacting us via e-mail.

Acknowledgments

This work was supported by the National Engineering Research Center of Disaster Backup and Recovery (BUPT), and the Shenzhen Power Supply Bureau was acknowledged toprovide network traffc data from real 5G IoT terminals.

Conflicts of Interest

The authors declare no conflicts of interest.

References

  1. Ullah, I.; Mahmoud, Q.H. Network traffic flow based machine learning technique for IoT device identification. In Proceedings of the 2021 IEEE International Systems Conference (SysCon), Vancouver, BC, Canada, 15 April–15 May 2021; pp. 1–8. [Google Scholar] [CrossRef]
  2. Yang, J.; Zhou, K.; Li, Y.; Liu, Z. Generalized out-of-distribution detection: A survey. Int. J. Comput. Vis. 2024, 132, 5635–5662. [Google Scholar] [CrossRef]
  3. Yang, L.; Guo, W.; Hao, Q.; Ciptadi, A.; Ahmadzadeh, A.; Xing, X.; Wang, G. {CADE}: Detecting and explaining concept drift samples for security applications. In Proceedings of the 30th USENIX Security Symposium (USENIX Security 21), Virtual, 11–13 August 2021; pp. 2327–2344. [Google Scholar]
  4. Liang, S.; Li, Y.; Srikant, R. Enhancing the reliability of out-of-distribution image detection in neural networks. arXiv 2017, arXiv:1706.02690. [Google Scholar]
  5. Sun, Y.; Guo, C.; Li, Y. React: Out-of-distribution detection with rectified activations. Adv. Neural Inf. Process. Syst. 2021, 34, 144–157. [Google Scholar] [CrossRef]
  6. Zhu, J.; Li, H.; Yao, J.; Liu, T.; Xu, J.; Han, B. Unleashing mask: Explore the intrinsic out-of-distribution detection capability. arXiv 2023, arXiv:2306.03715. [Google Scholar]
  7. Wei, H.; Xie, R.; Cheng, H.; Feng, L.; An, B.; Li, Y. Mitigating neural network overconfidence with logit normalization. In Proceedings of the International Conference on Machine Learning. PMLR, Baltimore, MD, USA, 17–23 July 2022; pp. 23631–23644. [Google Scholar] [CrossRef]
  8. Mach, P.; Becvar, Z. Mobile edge computing: A survey on architecture and computation offloading. IEEE Commun. Surv. Tutorials 2017, 19, 1628–1656. [Google Scholar] [CrossRef]
  9. Mao, Y.; You, C.; Zhang, J.; Huang, K.; Letaief, K.B. A survey on mobile edge computing: The communication perspective. IEEE Commun. Surv. Tutorials 2017, 19, 2322–2358. [Google Scholar] [CrossRef]
  10. Hendrycks, D.; Gimpel, K. A baseline for detecting misclassified and out-of-distribution examples in neural networks. arXiv 2016, arXiv:1610.02136. [Google Scholar]
  11. Michelucci, U. An introduction to autoencoders. arXiv 2022, arXiv:2201.03898. [Google Scholar]
  12. Liu, W.; Wang, X.; Owens, J.; Li, Y. Energy-based out-of-distribution detection. Adv. Neural Inf. Process. Syst. 2020, 33, 21464–21475. [Google Scholar] [CrossRef]
  13. Lee, K.; Lee, K.; Lee, H.; Shin, J. A simple unified framework for detecting out-of-distribution samples and adversarial attacks. Adv. Neural Inf. Process. Syst. 2018, 31, 7167–7177. [Google Scholar] [CrossRef]
  14. Huang, R.; Li, Y. Mos: Towards scaling out-of-distribution detection for large semantic space. In Proceedings of the IEEE/CVF Conference on Computer Vision and Pattern Recognition, Nashville, TN, USA, 20–25 June 2021; pp. 8710–8719. [Google Scholar] [CrossRef]
  15. Hendrycks, D.; Basart, S.; Mazeika, M.; Zou, A.; Kwon, J.; Mostajabi, M.; Steinhardt, J.; Song, D. Scaling out-of-distribution detection for real-world settings. arXiv 2019, arXiv:1911.11132. [Google Scholar]
  16. Komadina, A.; Martinić, M.; Groš, S.; Mihajlović, Ž. Comparing Threshold Selection Methods for Network Anomaly Detection. IEEE Access 2024, 12, 124943–124973. [Google Scholar] [CrossRef]
  17. Otsu, N. A threshold selection method from gray-level histograms. Automatica 1975, 11, 23–27. [Google Scholar] [CrossRef]
  18. Yang, C.; Du, Z.; Meng, X.; Zhang, X.; Hao, X.; Bader, D.A. Anomaly detection in catalog streams. IEEE Trans. Big Data 2022, 9, 294–311. [Google Scholar] [CrossRef]
  19. Hoang, D.H.; Nguyen, H.D. A PCA-based method for IoT network traffic anomaly detection. In Proceedings of the 2018 20th International Conference on Advanced Communication Technology (ICACT), Chuncheon, Republic of Korea, 11–14 February 2018; pp. 381–386. [Google Scholar] [CrossRef]
  20. Rafsanjani, M.K.; Varzaneh, Z.A.; Chukanlo, N.E. A survey of hierarchical clustering algorithms. J. Math. Comput. Sci. 2012, 5, 229–240. [Google Scholar] [CrossRef]
  21. Verma, M.; Srivastava, M.; Chack, N.; Diswar, A.K.; Gupta, N. A comparative study of various clustering algorithms in data mining. Int. J. Eng. Res. Appl. (IJERA) 2012, 2, 1379–1384. [Google Scholar]
  22. Zaeemzadeh, A.; Bisagno, N.; Sambugaro, Z.; Conci, N.; Rahnavard, N.; Shah, M. Out-of-distribution detection using union of 1-dimensional subspaces. In Proceedings of the IEEE/CVF conference on Computer Vision and Pattern Recognition, Nashville, TN, USA, 20–25 June 2021; pp. 9452–9461. [Google Scholar] [CrossRef]
  23. Techapanurak, E.; Suganuma, M.; Okatani, T. Hyperparameter-free out-of-distribution detection using cosine similarity. In Proceedings of the Asian Conference on Computer Vision, Kyoto, Japan, 30 November–4 December 2020. [Google Scholar] [CrossRef]
  24. Miettinen, M.; Marchal, S.; Hafeez, I.; Asokan, N.; Sadeghi, A.R.; Tarkoma, S. IoT sentinel: Automated device-type identification for security enforcement in IoT. In Proceedings of the 2017 IEEE 37th International Conference on Distributed Computing Systems (ICDCS), Atlanta, GA, USA, 5–8 June 2017; pp. 2177–2184. [Google Scholar] [CrossRef]
  25. Dadkhah, S.; Mahdikhani, H.; Danso, P.K.; Zohourian, A.; Truong, K.A.; Ghorbani, A.A. Towards the development of a realistic multidimensional IoT profiling dataset. In Proceedings of the 2022 19th Annual International Conference on Privacy, Security & Trust (PST), Fredericton, NB, Canada, 22–24 August 2022; pp. 1–11. [Google Scholar] [CrossRef]
  26. Chen, J.; Li, Y.; Wu, X.; Liang, Y.; Jha, S. Atom: Robustifying out-of-distribution detection using outlier mining. In Proceedings of the Machine Learning and Knowledge Discovery in Databases. Research Track: European Conference, ECML PKDD 2021, Bilbao, Spain, 13–17 September 2021; Proceedings, Part III 21; Springer: Berlin/Heidelberg, Germany, 2021; pp. 430–445. [Google Scholar] [CrossRef]
  27. Lee, K.; Lee, H.; Lee, K.; Shin, J. Training confidence-calibrated classifiers for detecting out-of-distribution samples. arXiv 2017, arXiv:1711.09325. [Google Scholar]
  28. Zong, B.; Song, Q.; Min, M.R.; Cheng, W.; Lumezanu, C.; Cho, D.; Chen, H. Deep autoencoding gaussian mixture model for unsupervised anomaly detection. In Proceedings of the International Conference on Learning Representations, Vancouver, BC, Canada, 30 April–3 May 2018. [Google Scholar]
  29. Data, M.C.; Komorowski, M.; Marshall, D.C.; Salciccioli, J.D.; Crutain, Y. Exploratory data analysis. In Secondary Analysis of Electronic Health Records; Springer: Berlin/Heidelberg, Germany, 2016; pp. 185–203. [Google Scholar] [CrossRef]
  30. Bovenzi, G.; Aceto, G.; Ciuonzo, D.; Montieri, A.; Persico, V.; Pescapé, A. Network anomaly detection methods in IoT environments via deep learning: A fair comparison of performance and robustness. Comput. Secur. 2023, 128, 103167. [Google Scholar] [CrossRef]
  31. Wang, H.; Li, Z.; Feng, L.; Zhang, W. Vim: Out-of-distribution with virtual-logit matching. In Proceedings of the IEEE/CVF Conference on Computer Vision and Pattern Recognition, New Orleans, LA, USA, 18–24 June 2022; pp. 4921–4930. [Google Scholar] [CrossRef]
Figure 1. Variation in OOD detection performance (AUROC/FPR95) under different class numbers and imbalance levels on the CIC IoT 2022 dataset. (a,b) show the changes in AUROC and FPR95 as the number of in-distribution classes increases. (c,d) present the changes in AUROC and FPR95 as the in-distribution class imbalance increases.
Applsci 15 07522 g001
Figure 2. Workflow of ODDL. The model clusters training data based on class means and applies a feature distance loss to optimize penultimate-layer representations, enhancing intra-group compactness and inter-group separability. At inference, Mahalanobis distances to each group are computed, and the maximum distance is used as the OOD score. An adaptive threshold is selected using KDE by locating local minima in the score distribution. Samples exceeding this threshold are classified as OOD.
Applsci 15 07522 g002
Figure 3. Comparison of OOD score distributions. Boxplots of OOD scores produced by MSP and our proposed method for in-distribution (ID) samples, out-of-distribution (OOD) samples, a minority class, and a majority class. (a) shows the distribution under MSP, which tends to misclassify minority classes as OOD and fails to detect some true OOD samples. (b) shows the distribution under our method, which more effectively separates ID and OOD samples despite class imbalance.
Applsci 15 07522 g003
Figure 4. OOD detection performance. (a) Variation in AUROC and FPR95 as training epochs increase. Performance first improves and then degrades, indicating overfitting in later training stages. (b) Comparison of different threshold selection strategies within our framework. The performance disparity highlights the need for an adaptive thresholding mechanism to ensure consistent OOD detection.
Applsci 15 07522 g004
Figure 5. t-SNE visualization of feature distributions for two OOD detection scenarios. (ad) CIC IoT 2022 dataset with the Amcrest device as OOD. (a) Raw class features. (b) Group features after class mean-based clustering. (c) Group features after distance loss optimization. (d) Class features after distance loss optimization. (eh) IoT Sentinel dataset with the grid TTU device as OOD, corresponding to feature representations in (ad).
Applsci 15 07522 g005
Figure 6. Impact of different group numbers on OOD detection performance measured by AUROC and FPR95, using IoT Sentinel as the in-distribution dataset and Shenzhen power grid traffic as the OOD dataset. (a) shows the AUROC variation with increasing group numbers. (b) shows the corresponding FPR95 changes.
Applsci 15 07522 g006
Figure 7. Sensitivity analysis of key hyperparameters in the proposed OOD detection framework. Left: The effect of varying the number of groups on the F1 score under the KDE-based thresholding strategy. Results are obtained from the IoT dataset. Right histogram of OOD detection scores for in-distribution (ID, in blue) and out-of-distribution (OOD, in red) test samples. Overlaid Kernel density estimation (KDE) curves illustrate the effect of different bandwidth values (h) on score distribution smoothness. Larger bandwidths (e.g., h = 0.5 or h = 1.0 ) lead to over-smoothing and reduced separability between ID and OOD samples.
Applsci 15 07522 g007
Figure 8. Ablation study results on different OOD test sets. Each bar group represents the performance of three configurations: (1) Baseline (only cross-entropy loss), (2) Baseline + Grouping, and (3) Baseline + Grouping + Distance Loss (ODDL). (a) shows the AUROC results, and (b) shows the FPR95 results across the different OOD test sets. The figure illustrates the incremental effect of the grouping and distance loss modules in improving OOD detection performance.
Applsci 15 07522 g008
Figure 9. Comparison of F1 scores at different inflection points for the KDE-based adaptive threshold selection method. (ac) show the F1 scores on different OOD test sets at various inflection points. (d) presents the KDE smoothing estimate of the OOD scores on the test set, with histograms of the ID (blue) and OOD (red) sample scores.
Applsci 15 07522 g009
Table 1. Sample distribution of the CIC IoT Dataset 2022, collected from 28 different IoT devices. The table shows the number of samples per device, highlighting the dataset’s diversity in terms of traffic patterns and device types.
Device TypeDevice NameNumber of Samples
Audioechodot2786
echospot3218
echostudio2932
nestmini3269
sonos6569
Cameraamcrest18,362
arlobasecam20,520
arloqcam21,948
boruncam2432
dlinkcam14,099
heimvisioncam13,787
homeyecam27,619
luohecam20,076
nestcam7490
netatmcam10,625
simcam34,217
Home Automationamazonplug584
atomiccoffeemaker413
eufyhomebase11,007
globelamp908
heimvisionlamp3813
philips hue919
roomba1106
smartboard116
teckin1220
teckin2249
yutron1239
yutron2234
Table 2. Distribution of samples in power grid traffic.
Terminal CategoryFunction DescriptionNumber of Samples
TTUMonitor and record the operating conditions of distribution transformers226
LMTTerminal used for on-site service and management with functions such as remote metering reading and energy monitoring3056
LVMRReceive and forward commands from the master station to collect and control data from electric energy meters833
Table 3. Comparison of OOD detection performance between our method and baseline methods on the CIC IoT Dataset 2022. All values represent the average performance when each class is individually considered as an OOD sample, as detailed in Section 4.1. For our method, we additionally report the standard deviation across multiple runs to assess performance stability. ↑ indicates that higher values are better, while ↓ indicates that lower values are preferred. The best-performing method is highlighted in bold.
MethodCIC IoT Dataset 2022
AUROCAUPRFPR95Inference Time (s)
MSP0.49180.84600.97983.3157
AE0.36260.85360.98990.9031
ODIN0.28890.84420.96032.0252
Energy0.33170.81870.94770.7935
Mahalanobis0.60270.88950.80052.9780
Ours0.9905 ± 0.01510.9997 ± 0.00020.03047 ± 0.04820.04324
Table 4. Comparison of OOD detection performance between our method and baseline methods using the open-source IoT Sentinel dataset as ID samples and the real power grid traffic dataset as OOD samples. All results represent the average over 10 independent runs under identical conditions. For our method, we additionally report the standard deviation to assess performance stability. ↑ indicates that higher values are better, and ↓ indicates that lower values are better. The best-performing method is highlighted in bold.
MethodTTULMTLVMR
AUROC↑FPR95↓AUROC↑FPR95↓AUROC↑FPR95↓
MSP0.74150.79420.77900.76540.74470.8177
AE0.51730.89910.56570.97050.42500.9577
ODIN0.79220.64180.81870.61110.78760.6460
Energy0.76500.67840.73480.67550.72800.7222
mahalanobis0.17330.97260.12900.98960.17750.9628
Ours0.8976 ± 0.07300.3104 ± 0.08280.9629 ± 0.01260.1097 ± 0.07020.8800 ± 0.01200.2421 ± 0.0599
Table 5. F1 scores of OOD detection using different threshold selection strategies with IoT Sentinel as in-distribution samples and Shenzhen power grid traffic as OOD samples. For our method, we report the average and standard deviation of F1 scores over 10 independent runs to evaluate robustness.
MethodTTULMTLVMR
Prec0.8731780.96890.932345
IQR0.8508990.9415430.864865
Ksigma0.6368950.8712050.649914
OTSU0.8819390.446960.9344
ECDF0.7058760.3815330.47022
Inflection_Std0.7144470.9611060.867697
POT0.8286820.5764370.705651
Ours0.870305 ± 0.01560.977578 ± 0.02200.944754 ± 0.0331
Table 6. F1 scores for OOD detection using different threshold selection strategies, with Amcrest as the OOD sample and the remaining devices as ID samples on the CIC IoT Dataset 2022. For our method, the result is reported as the average ± standard deviation over five independent runs to assess robustness.
MethodAmcrest
Prec0.895544
IQR0.9808
Ksigma0.987398
OTSU0.91543
ECDF0.79554
Inflection_Std0.594377
POT0.753772
Ours0.989546 ± 0.0043
Table 7. Comparison of inference times (in seconds) for various OOD detection methods on the CIC IoT 2022 and IoT Sentinel datasets. Lower values represent better runtime performance.
MethodCIC IoT 2022IoT Sentinel
MSP3.31570.7098
AE2.02520.6448
ODIN0.79350.2821
Energy0.90310.1961
Mahalanobis2.97801.3786
Ours0.043240.0111
Table 8. Robustness evaluation under Gaussian noise ( σ = 0.01 ) on the CIC-IoT2022 dataset. Metric: AUROC.
MethodNo Noise (Clean)Gaussian Noise
MSP0.49180.5650
AE0.36260.5243
ODIN0.28890.3196
energy0.33170.3142
Mahalanobis0.60270.4570
Ours (ODDL)0.9905 ± 0.01510.9312 ± 0.0466
Table 9. AUROC and FPR95 performance on the IoT-23 dataset. In each trial, one class is selected as the OOD class. Despite the large scale and class imbalance, our method consistently outperforms the baselines.
MethodAUROCFPR95
MSP0.53520.9874
ODIN0.45140.9986
Energy0.50010.9987
Ours0.81760.3365
Disclaimer/Publisher’s Note: The statements, opinions and data contained in all publications are solely those of the individual author(s) and contributor(s) and not of MDPI and/or the editor(s). MDPI and/or the editor(s) disclaim responsibility for any injury to people or property resulting from any ideas, methods, instructions or products referred to in the content.