
The Margin of Stability During a Single-Turn Pirouette in Female Amateur Dancers: A Pilot Study


Abstract
1. Introduction
2. Materials and Methods
2.1. Participants
2.2. Instrumentation and Experimental Procedures
2.3. Protocol
2.3.1. Static Standing Calibration and Test Walking Trial
2.3.2. Pirouette Data Collection
2.4. Data Analysis
2.4.1. Data Reduction
2.4.2. Statistical Analysis
3. Results
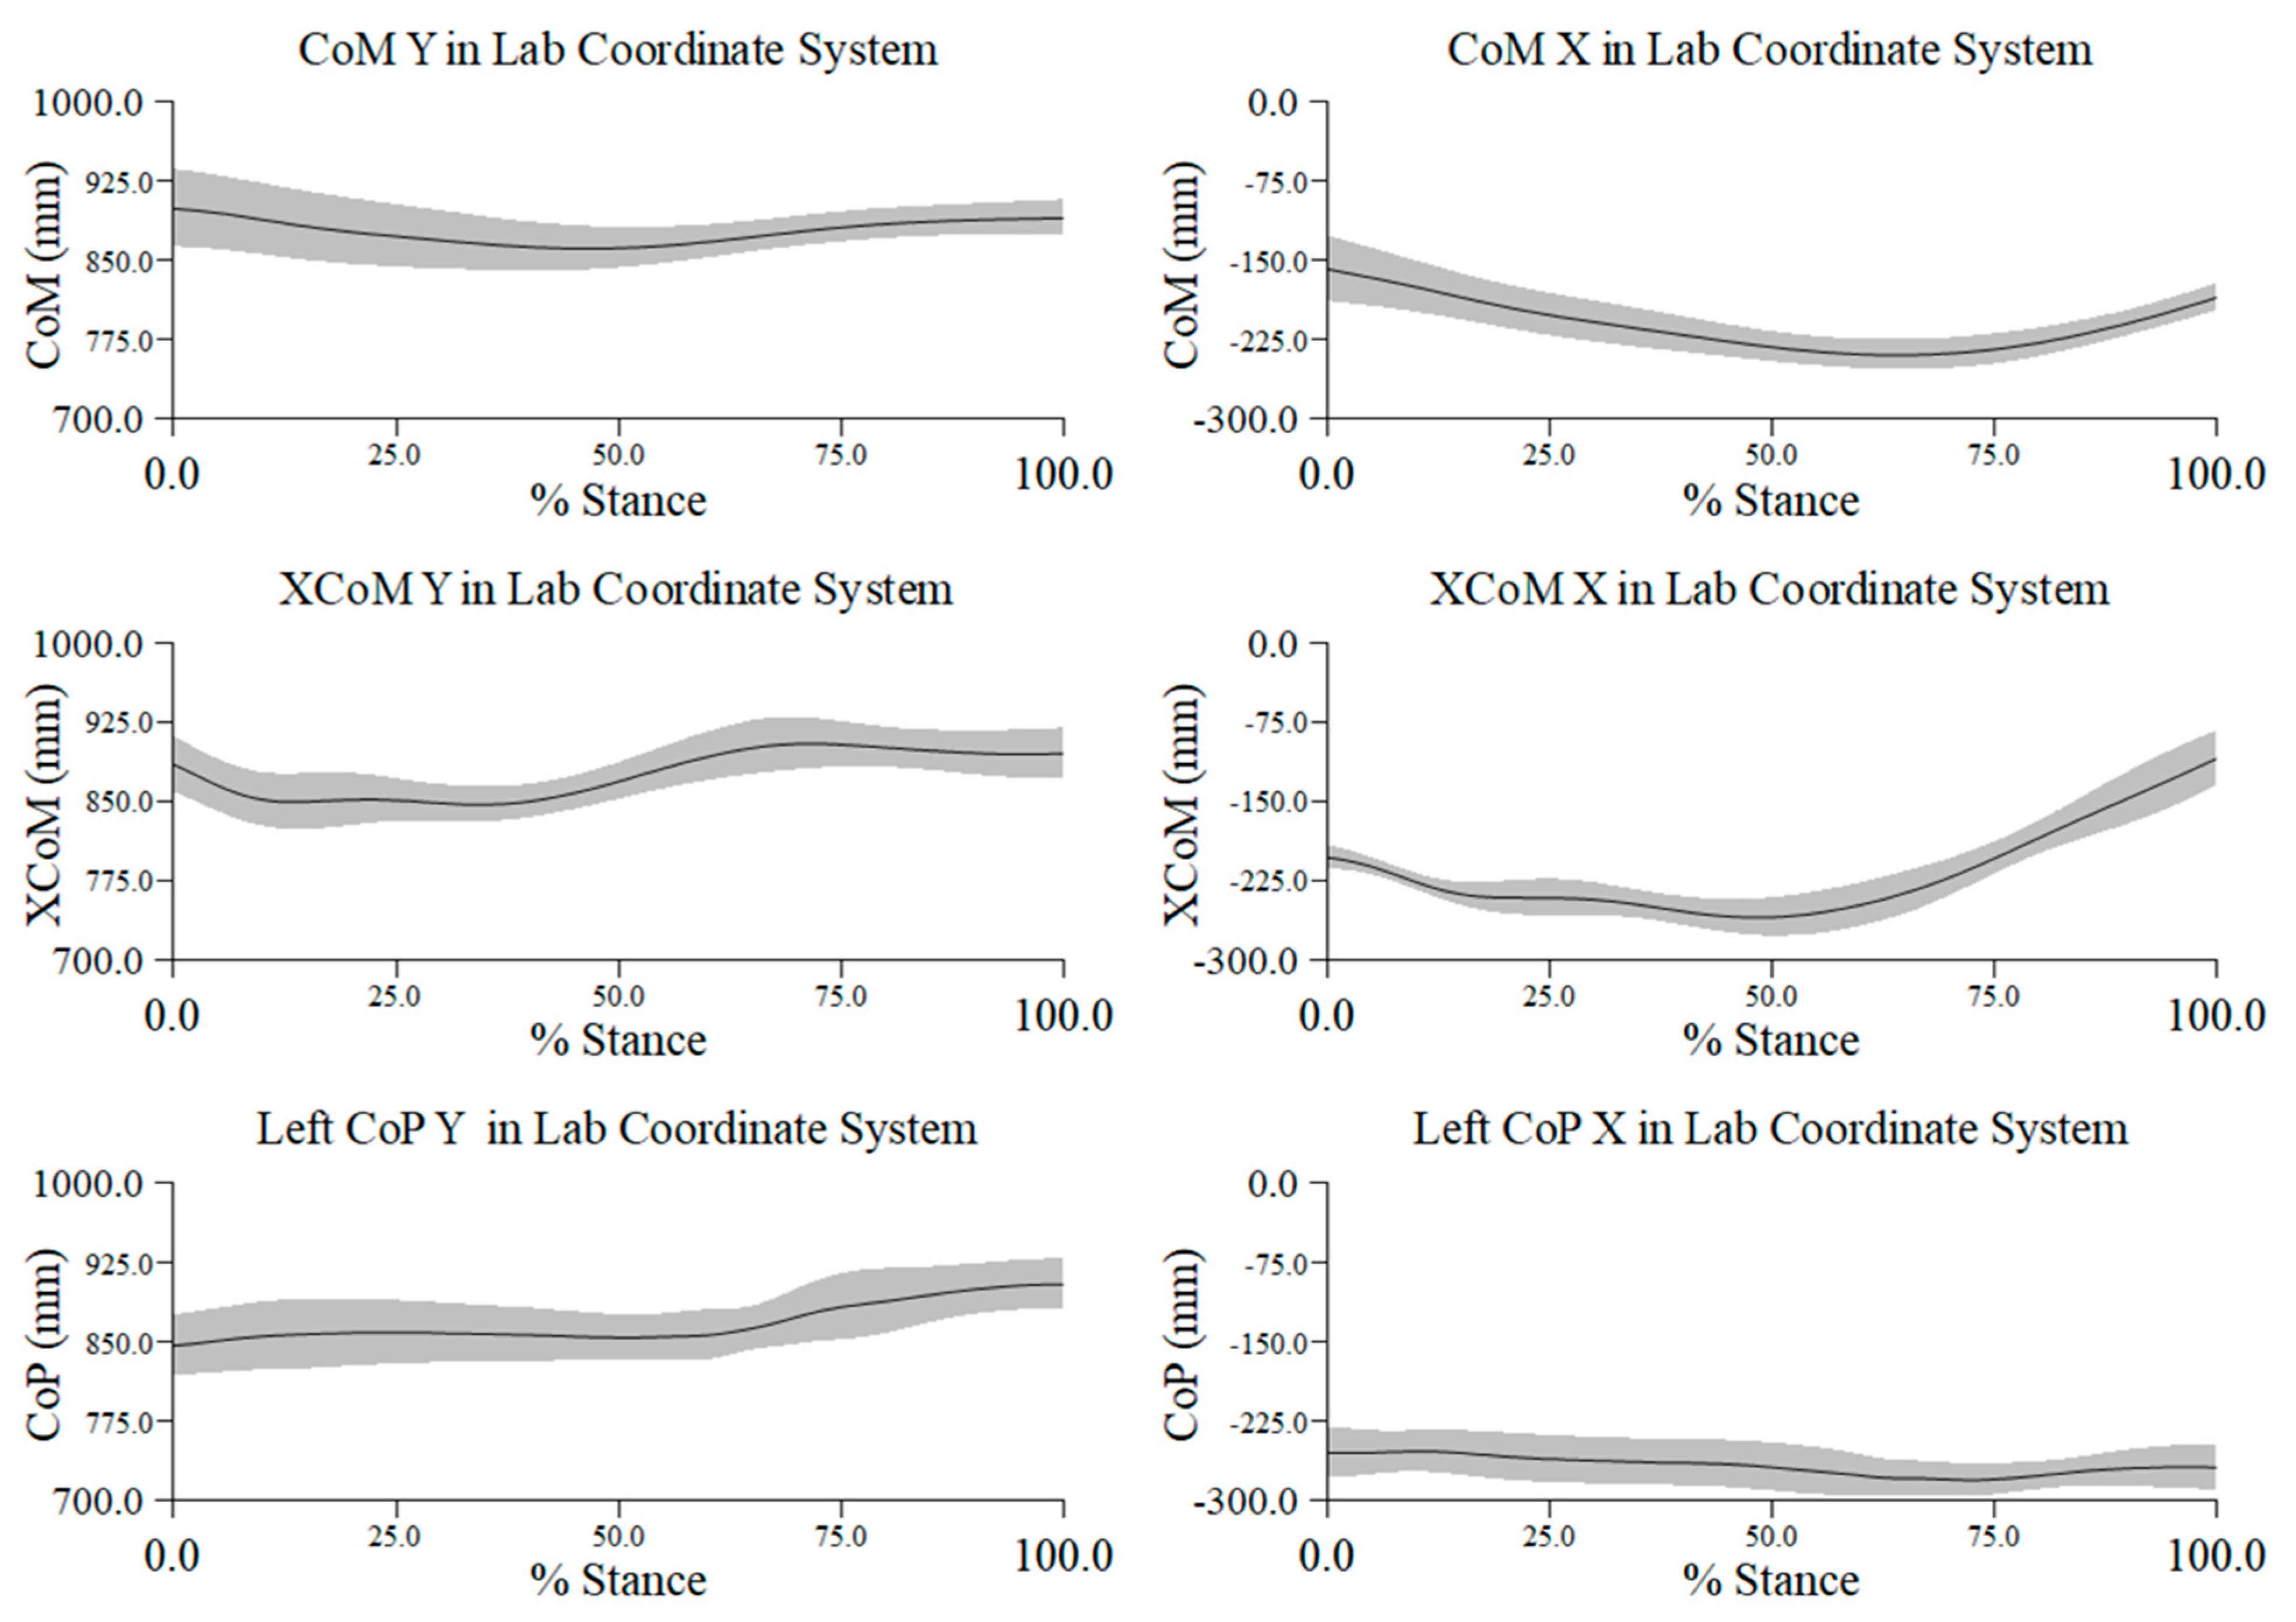
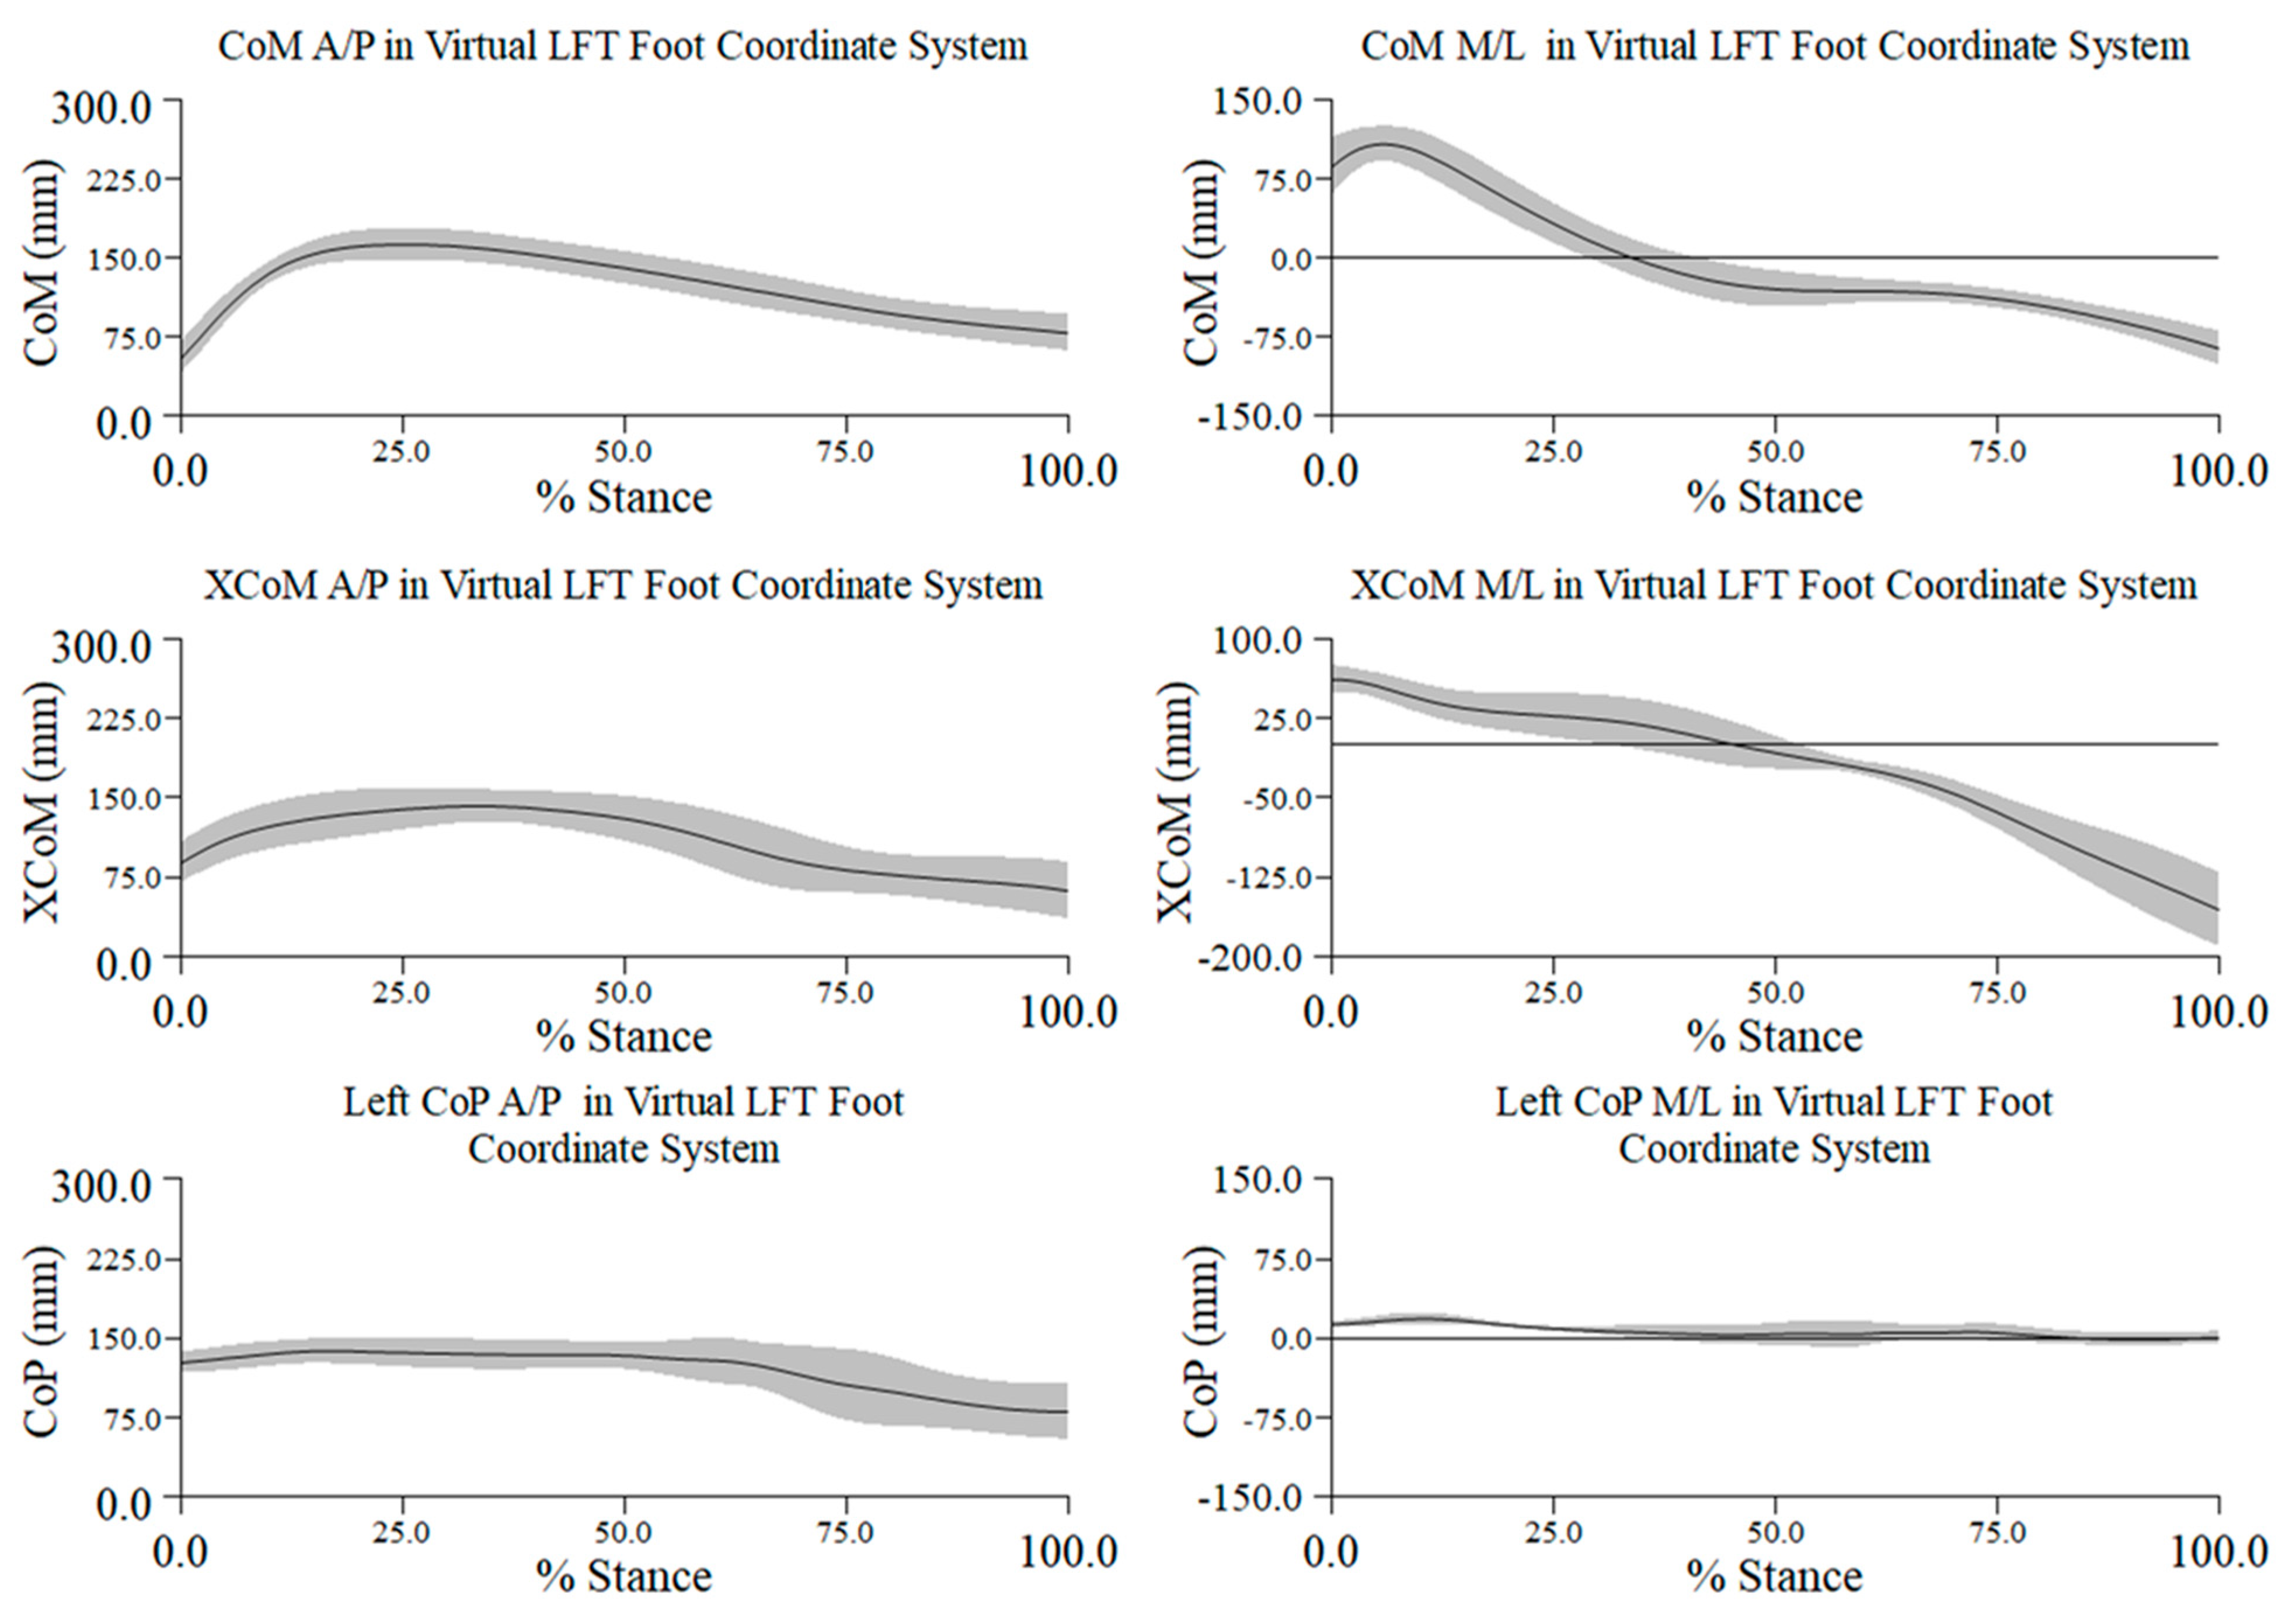
3.1. Excursions of the CoM and XCoM Relative to Laboratory and Left Foot Coordinate Systems
3.1.1. CoM and XCoM Relative to the CoP in the LCS
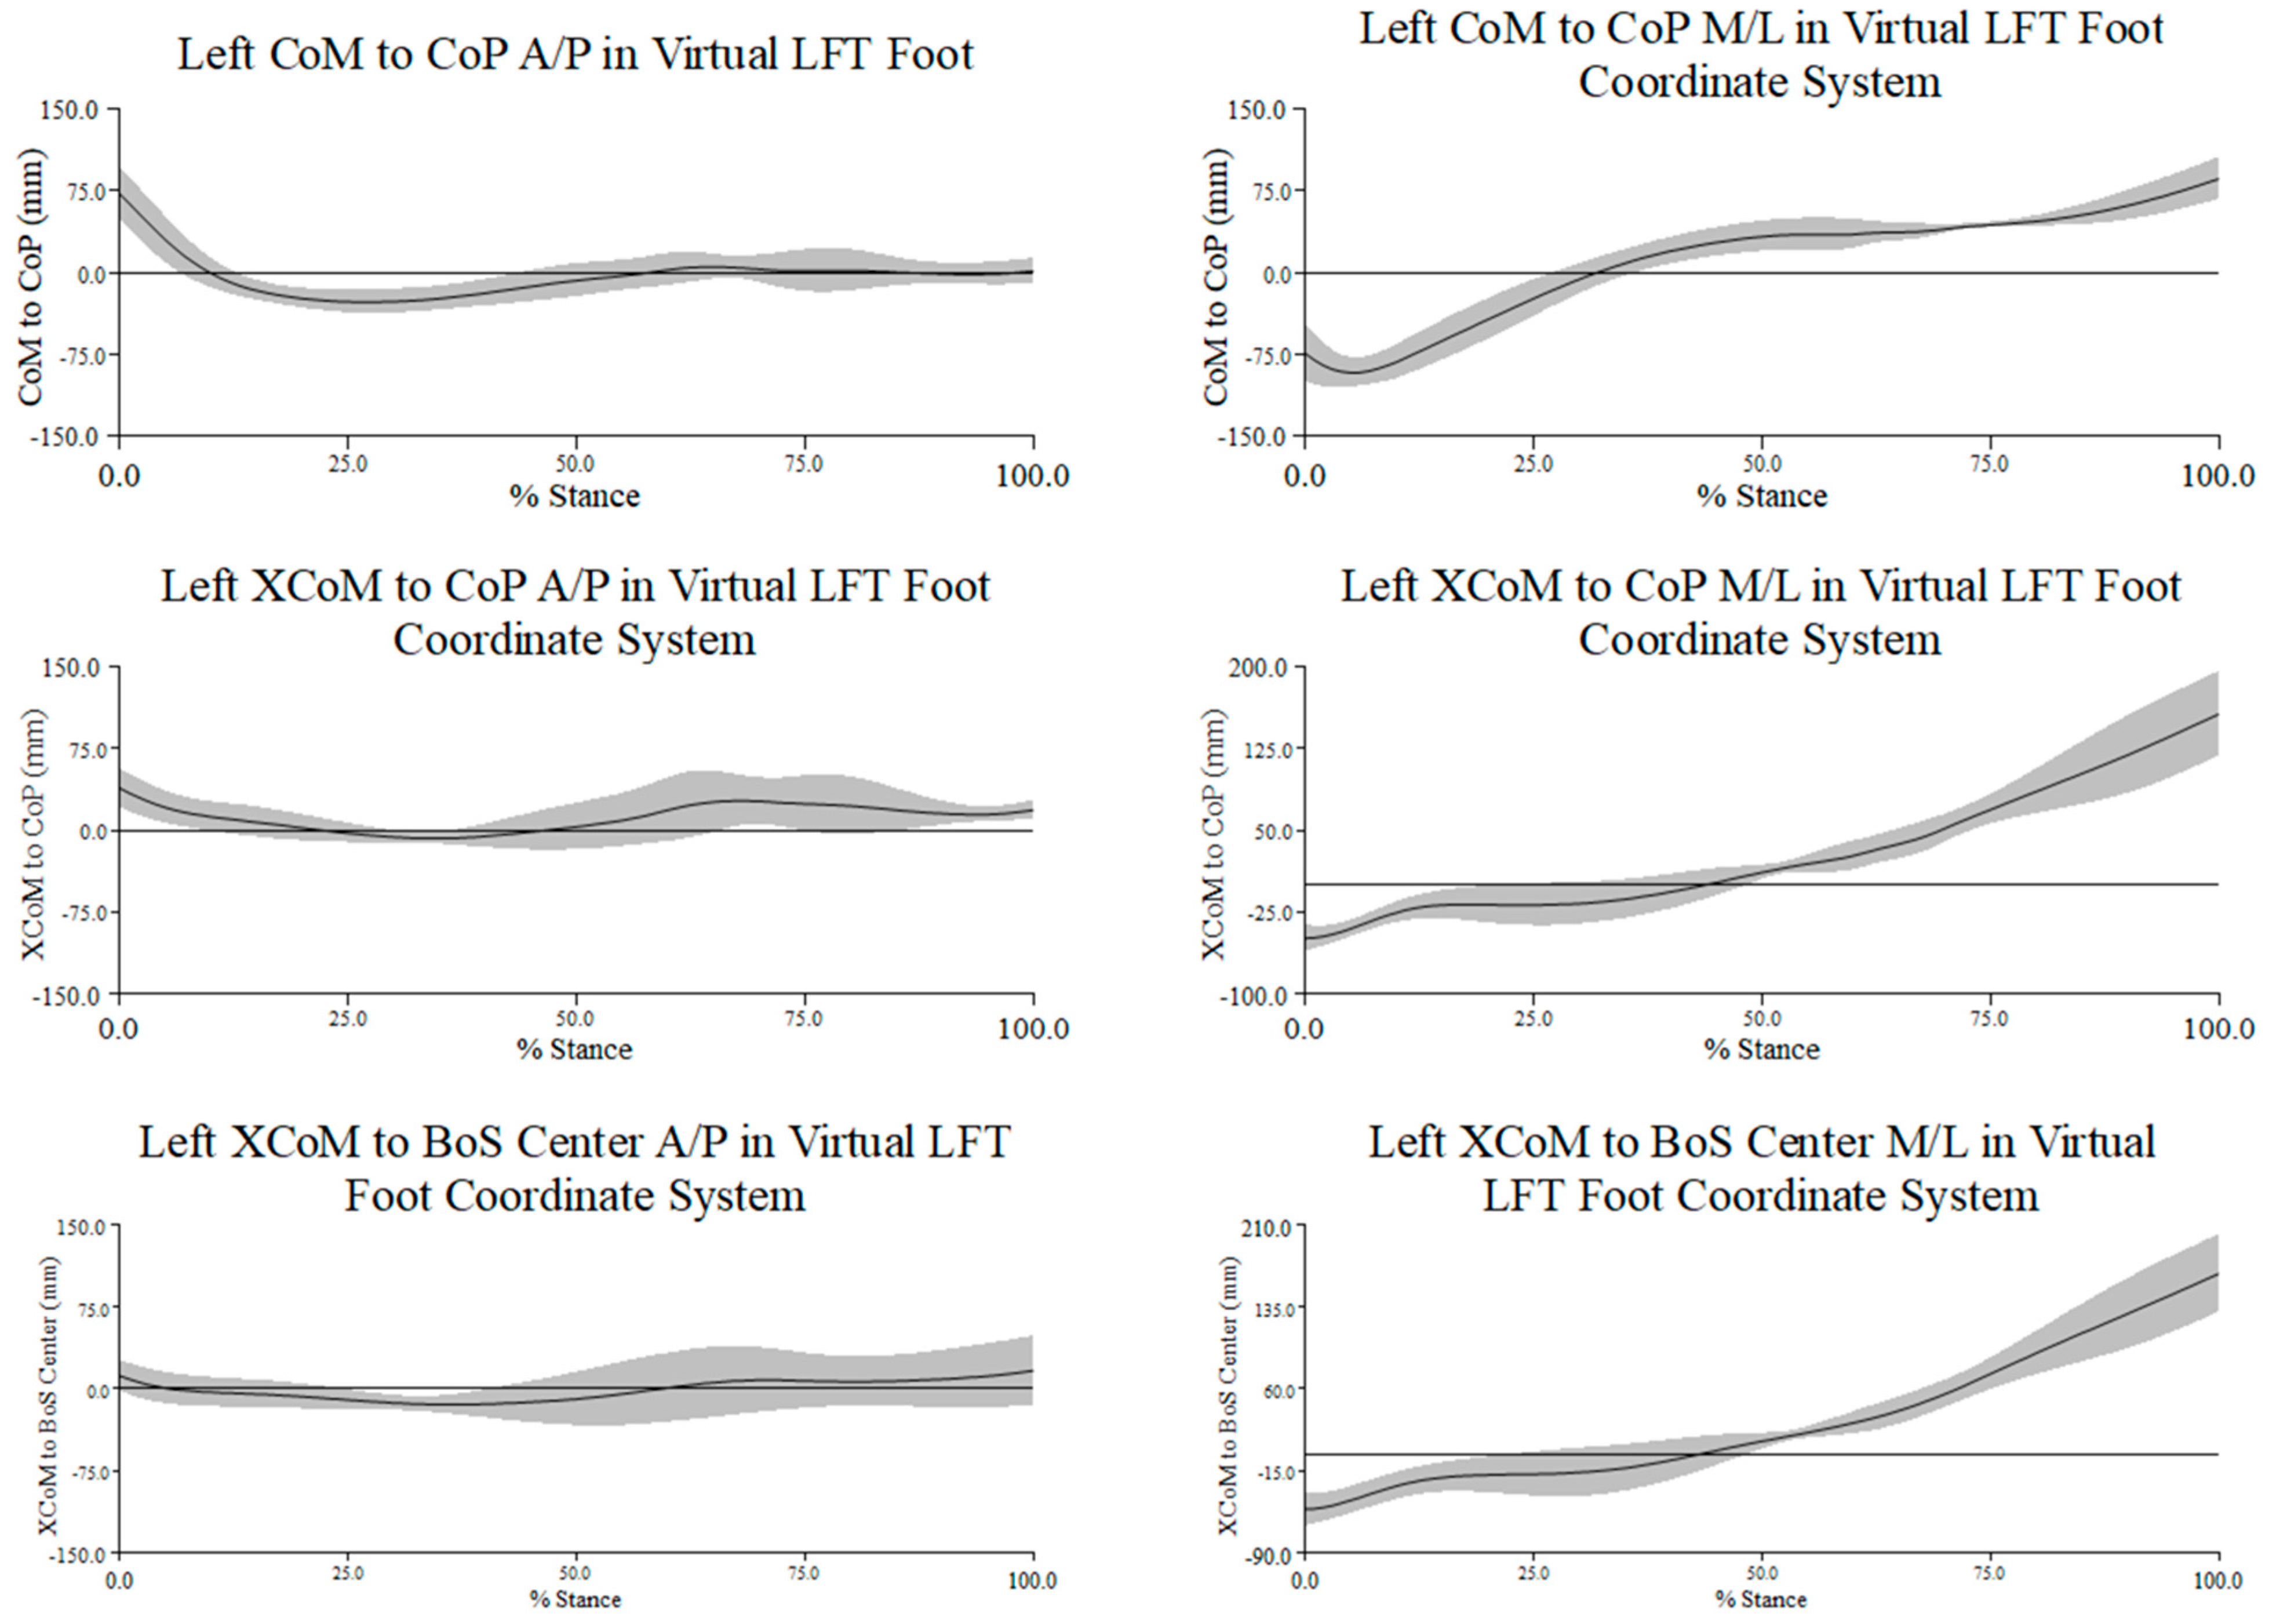
3.1.2. CoM and XCoM Relative to the CoP in the LFT CS
3.2. Comparison of the Two Methods for Determining the MoS: XCoM to CoP and XCoM to BoS Center
3.2.1. MoS Excursion Patterns
3.2.2. Magnitude and Variability of MoS Excursion
- -
- There was a larger mean MoS in the M/L direction for XCoM to both the CoP and the BoS center.
- -
- Each participant demonstrated the largest coefficients of variation with XCoM to the BoS center in the A/P direction.
- -
- Participants #1 and #5 demonstrated the largest mean MoS in the M/L direction for XCoM to the CoP and the BoS center.
- -
- Participant #2 demonstrated the smallest mean MoS in the A/P direction for XCoM to the CoP and the BoS center.

| Variable | Axis | Participant 1 Mean (SD) mm | CV (%) | Participant 2 Mean (SD) mm | CV (%) | Participant 3 Mean (SD) mm | CV (%) | Participant 5 Mean (SD) mm | CV (%) |
|---|---|---|---|---|---|---|---|---|---|
| XCoM to BoS Center | x | 57.57 (9.82) | 17.06 | 43.87 (10.58) | 24.12 | 41.82 (12.26) | 29.31 | 67.93 (11.03) | 16.24 |
| XCoM to BoS Center | y | 23.13 (11.80) | 51.01 | 12.78 (3.49) | 27.35 | 17.36 (7.65) | 44.04 | 25.24 (8.22) | 32.56 |
| XCoM to CoP | x | 50.34 (9.86) | 19.60 | 40.44 (10.19) | 25.18 | 38.49 (9.21) | 23.94 | 68.22 (10.87) | 15.93 |
| XCoM to CoP | y | 20.29 (0.26) | 1.29 | 18.67 (2.73) | 14.64 | 23.24 (4.95) | 21.29 | 22.21 (5.39) | 24.29 |
- -
- The MoS in the M/L direction demonstrated greater values.
- -
- There was greater mean variation in the MoS in the M/L direction.
- -
- The largest coefficient of variation was the excursion of the XCoM to the BoS center in the A/P direction.
| Variable | Axis | Mean (SD) mm | CV (%) |
|---|---|---|---|
| XCoM to BoS Center | x | 52.80 (12.28) | 14.31 |
| XCoM to BoS Center | y | 19.63 (5.65) | 23.25 |
| XCoM to CoP | x | 49.37 (13.60) | 27.54 |
| XCoM to CoP | y | 21.10 (2.03) | 9.62 |
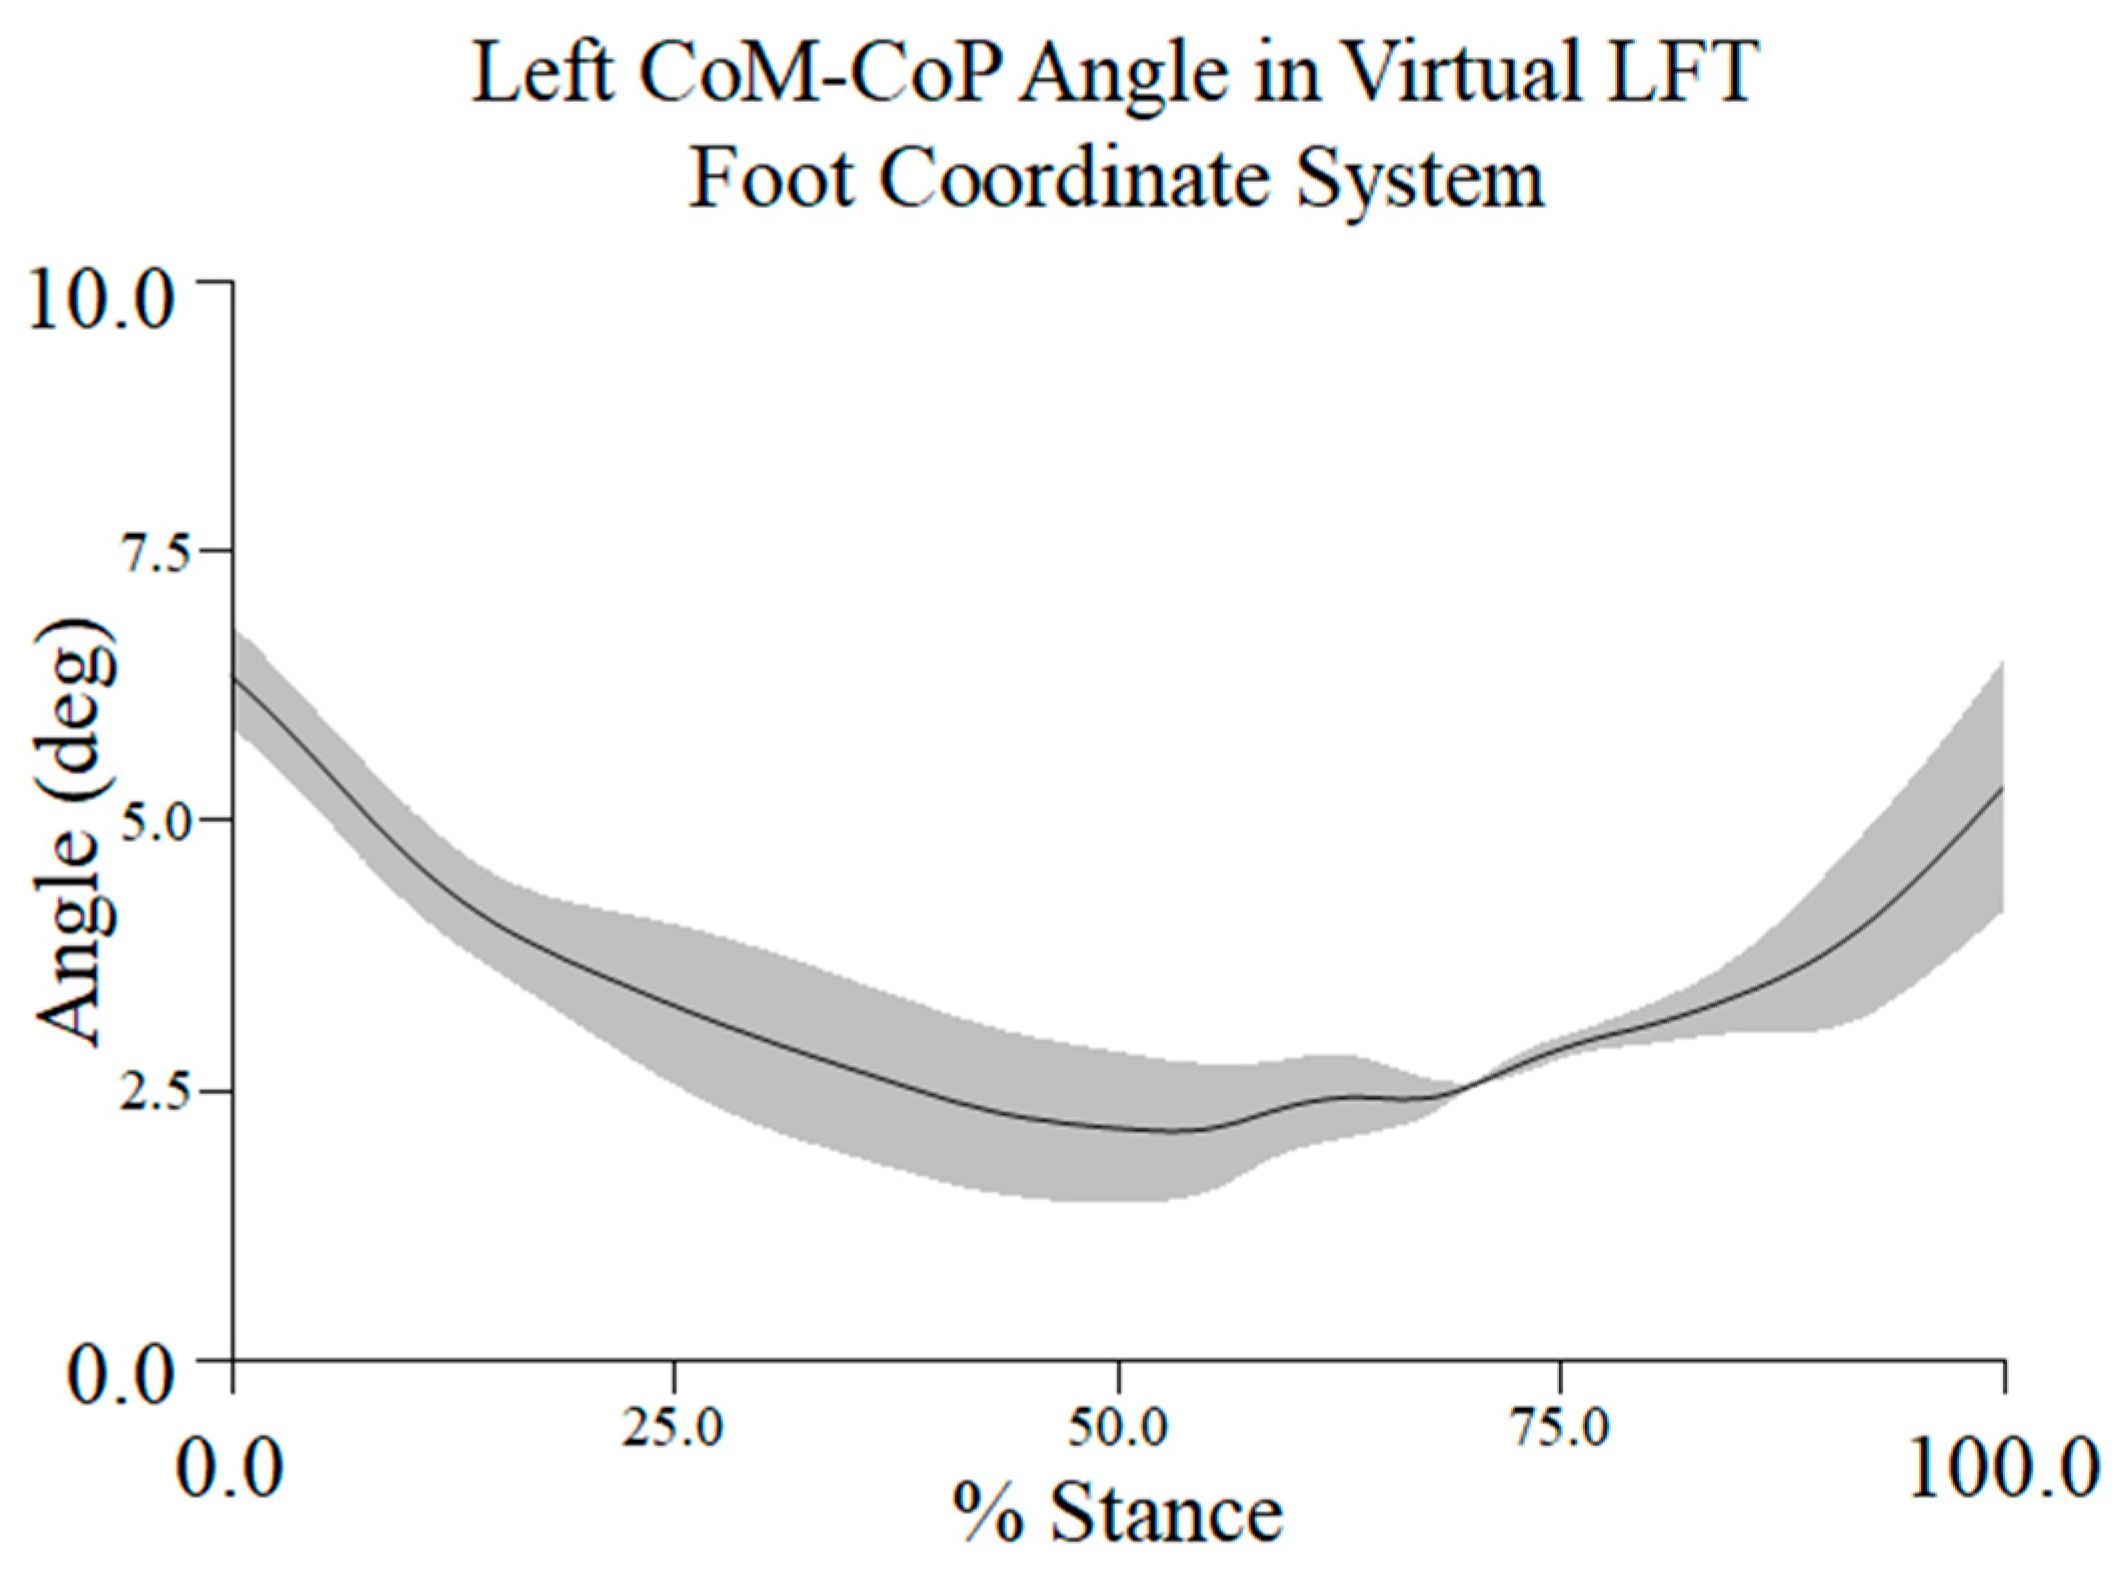
3.3. Topple Angle
4. Discussion
4.1. Rationale for Using Different Coordinate Systems: Comparison of Dynamic Balance Metrics in the LCS Versus the LFT CS
4.2. Margin of Stability
4.3. Topple Angle
4.4. Methodological Limitations
4.5. Implications for Further Research
5. Conclusions
Author Contributions
Funding
Institutional Review Board Statement
Informed Consent Statement
Data Availability Statement
Acknowledgments
Conflicts of Interest
Abbreviations
| IPM | Inverted pendulum model |
| CoM | Center of mass |
| XCoM | Extrapolated center of mass |
| BoS | Base of support |
| CoP | Center of pressure |
| MoS | Margin of stability |
| GRF | Ground reaction force |
| FP | Force plate |
| PiG | Plug-in Gait |
| OFM | Oxford Foot model |
| ASIS | Anterior superior iliac process |
| CPG | Peg marker posterior end of the calcaneus |
| CV% | Coefficient of variation percentage |
| A/P | Anteroposterior |
| M/L | Mediolateral |
| LCS | Laboratory coordinate system |
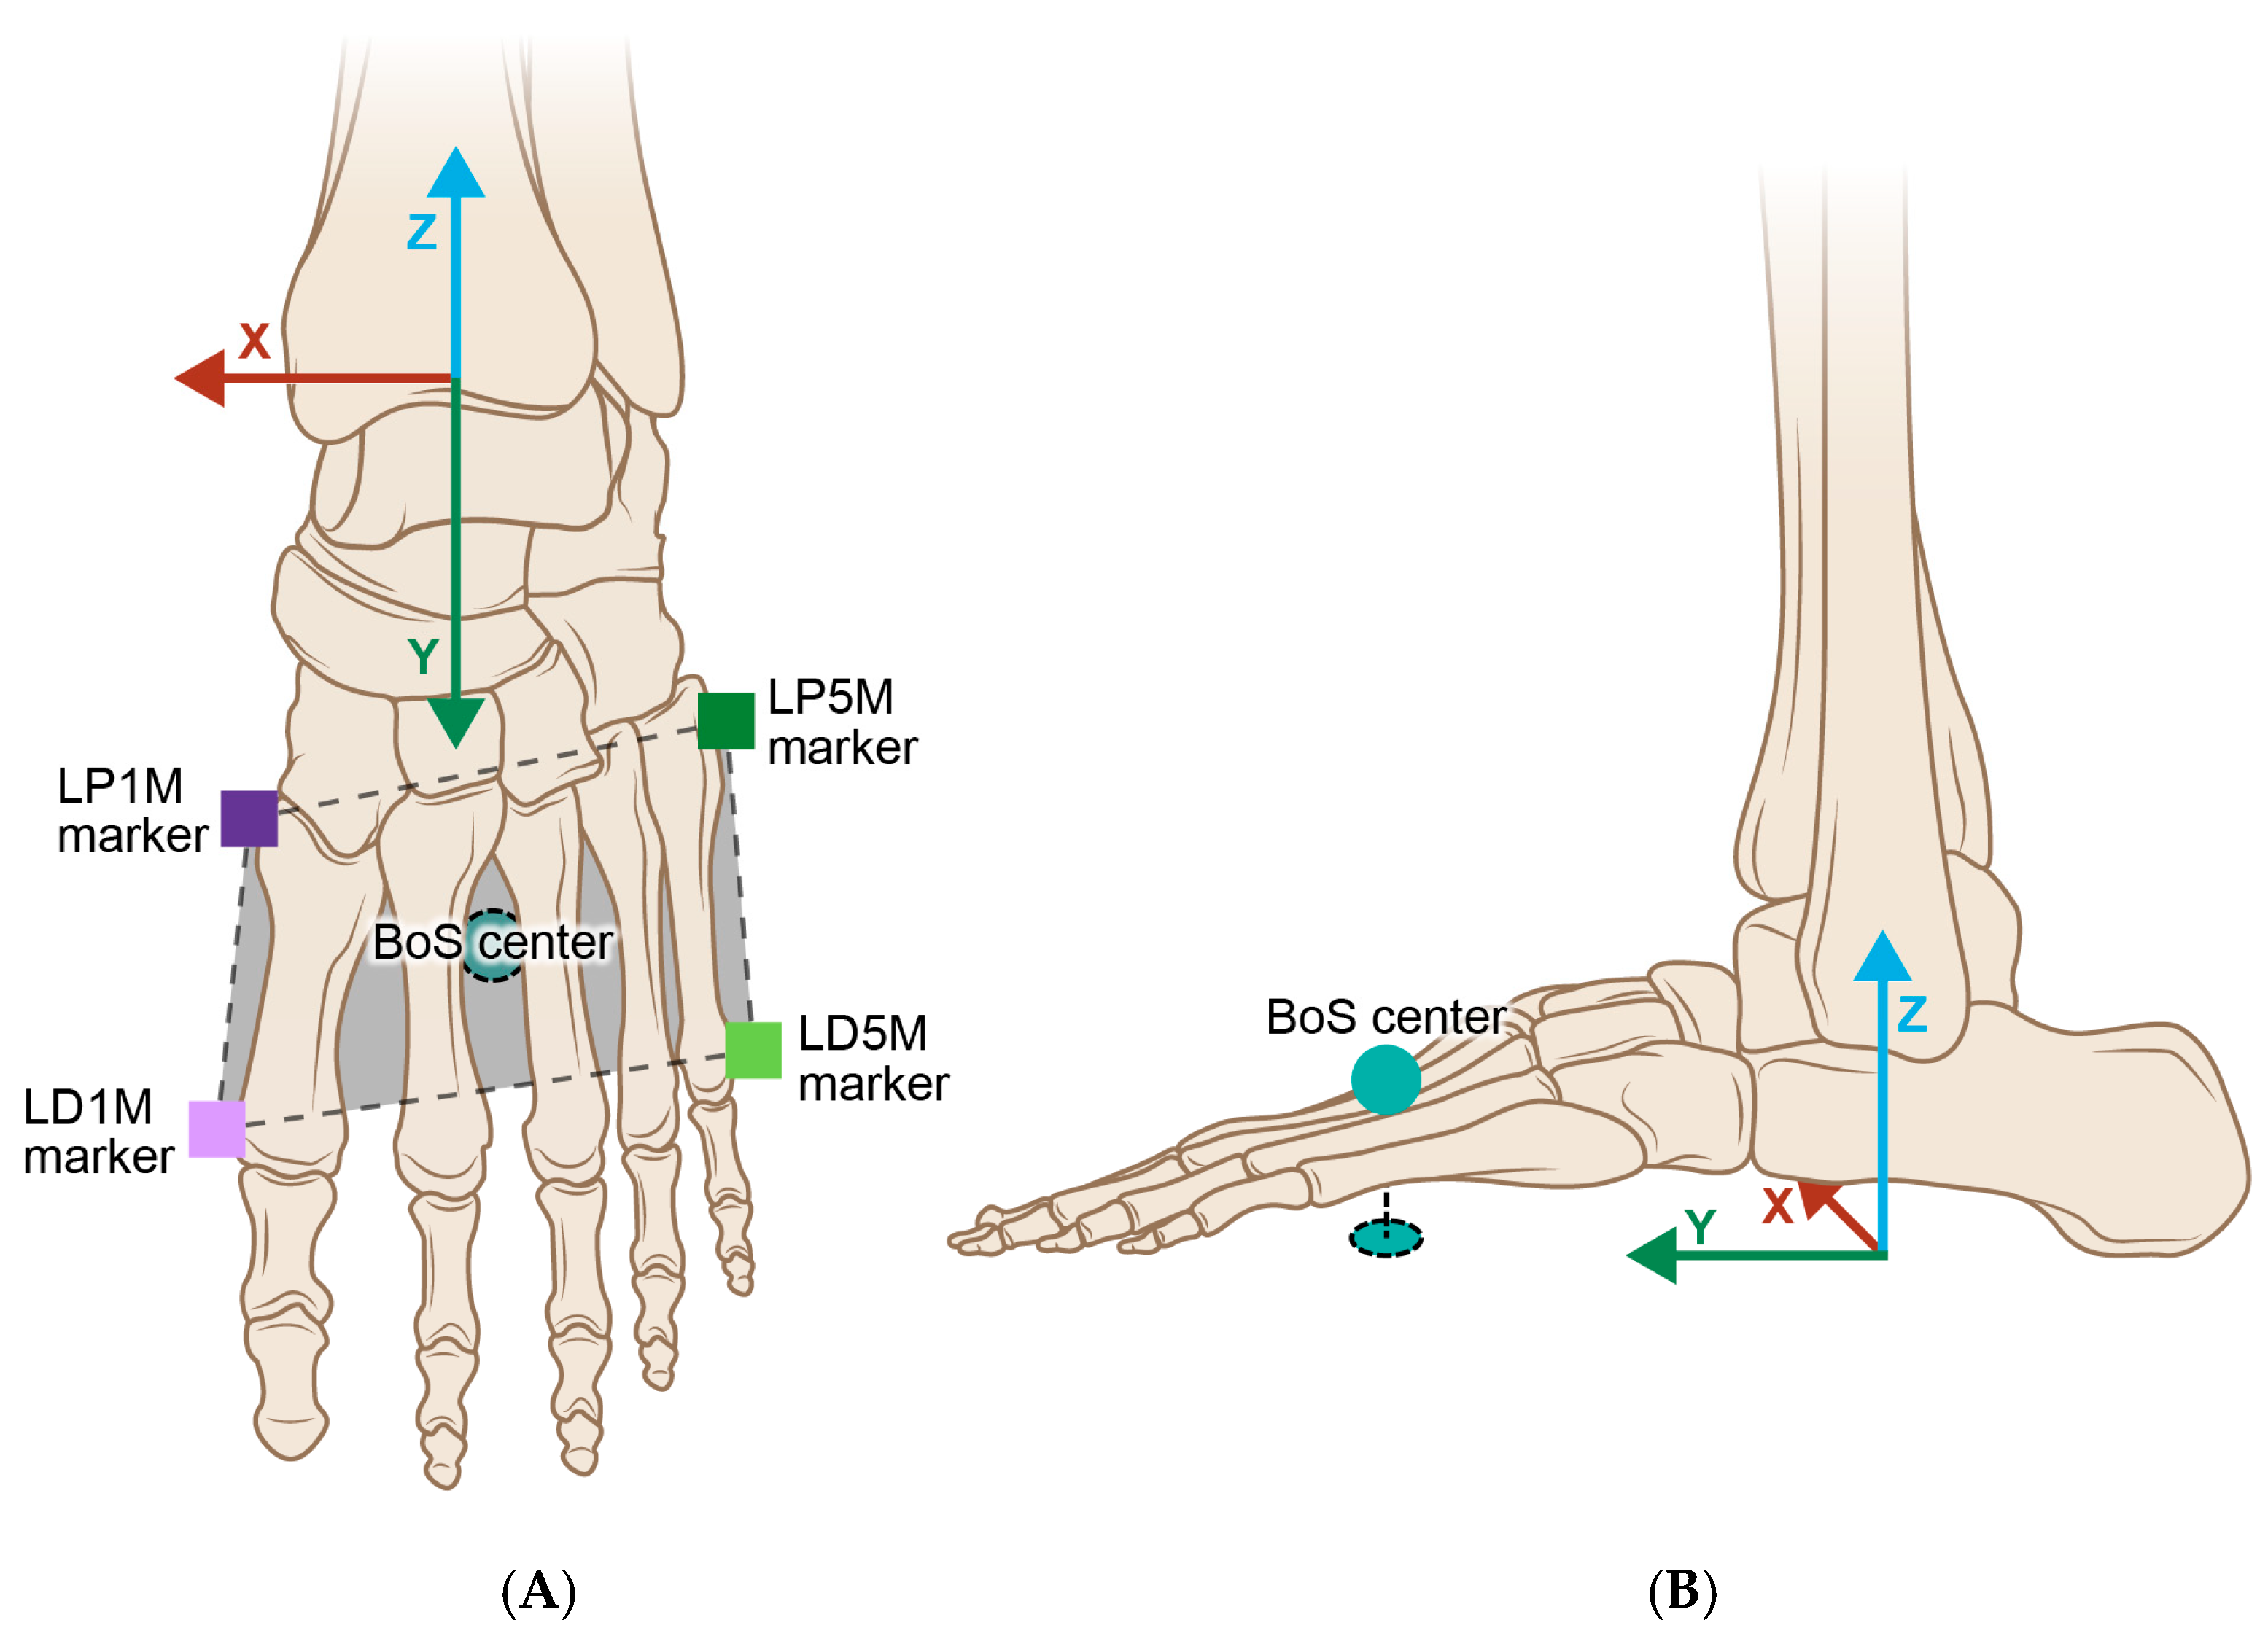
| LFT CS | Virtual left foot coordinate system |
| LP1M | Left proximal first metatarsal |
| LD1M | Left distal first metatarsal |
| LP5M | Left proximal fifth metatarsal |
| LD5M | Left distal fifth metatarsal |
Appendix A
| Marker | Description-Position | Notes | |
|---|---|---|---|
| 1 | RFHD LFHD | Forehead | UBM |
| 2 | RBHD LBHD | Back of head | UBM |
| 3 | RSHO LSHO | Shoulder, Acromioclavicular joint | UBM |
| 4 | RUPA LUPA | Upper arm, 3-marker cluster laterally | UBM |
| 5 | RELB LELB | Elbow, Lateral epicondyle | UBM |
| 6 | RFRM LFRM | Forearm, Lower ⅓ lateral surface | UBM |
| 7 | RWRB LWRB | Wrist marker B, Ulnar styloid process | UBM |
| 8 | RWRA LWRA | Wrist marker A, Radial styloid process | UBM |
| 9 | RFIN LFIN | Finger, Head 3rd metacarpal | UBM |
| 10 | CLAV | Clavicle, Jugular notch | UBM |
| 11 | STRN | Sternum, Xiphoid process | UBM |
| 12 | C7 | Spinus process 7th cervical | UBM |
| 13 | RBAK | Right back (mid scapula) | UBM |
| 14 | T10 | Spinus process 10th thoracic | UBM |
| 15 | RASI LASI | Anterior superior iliac spine | PIG |
| 16 | RPSI LPSI | Posterior iliac spine | PIG |
| 17 | RTHI LTHI | Thigh (mid-lateral) | PIG |
| 18 | RKNE LKNE | Lateral femoral epicondyle | PIG/OFM |
| 19 | RMKNE LMKNE | Medial femoral epicondyle | PIG |
| 20 | RTIB LTIB | Tibia, Mid-lateral | PIG/OFM |
| 21 | RMED LMED | Medial malleoli (apex) | PIG/OFM |
| 22 | RLAT LLAT | Ankle, Lateral malleoli (apex) | PIG/OFM |
| 23 | RTOE LTOE | Midway between 2nd & 3rd metatarsal heads | PIG/OFM |
| 24 | RHEE LHEE | Heel (distal posterior calcaneus) | PIG/OFM |
| 25 | RHFB LHFB | Fibula (head) | OFM |
| 26 | RTUB LTUB | Tibial tubercle | OFM |
| 27 | RSHN LSHN | Mid-tibia (shank) | OFM |
| 28 | RPCA LPCA | Proximal posterior calcaneus | OFM |
| 29 | RSTL LSTL | Sustentaculum tali (apex) | OFM |
| 30 | RLCA LLCA | Lateral calcaneus | OFM |
| 31 | RP1M LP1M | Base 1st metatarsal | OFM |
| 32 | RD1M LD1M | Head 1st metatarsal | OFM |
| 33 | RP5M LP5M | Base 5th metatarsal | OFM |
| 34 | RD5M LD5M | Head 5th metatarsal | OFM |
| 35 | RHLX LHLX | Hallux, 1st proximal phalanx | OFM |
Appendix B
References
- Kim, J.; Wilson, M.A.; Singhal, K.; Gamblin, S.; Suh, C.-Y.; Kwon, Y.-H. Generation of vertical angular momentum in single, double, and triple-turn pirouette en dehors in ballet. Sports Biomech. 2014, 13, 215–219. [Google Scholar] [CrossRef] [PubMed]
- Zaferiou, A.M.; Wilcox, R.R.; McNitt-Gray, J.L. Modification of impulse generation during pirouette turns with increased rotational demands. J. Appl. Biomech. 2016, 32, 425–432. [Google Scholar] [CrossRef] [PubMed]
- Lin, C.W.; Su, F.C.; Wu, H.W.; Lin, C.F. Effects of leg dominance on performance of ballet turns (pirouettes) by experienced and novice dancers. J. Sports Sci. 2013, 31, 1781–1788. [Google Scholar] [CrossRef] [PubMed]
- Winter, D.A.; Patla, A.E.; Prince, F.; Ishac, M.; Gielo-Perczak, K. Stiffness control of balance in quiet standing. J. Neurophysiol. 1998, 80, 1211–1221. [Google Scholar] [CrossRef]
- Gage, W.H.; Winter, D.A.; Frank, J.S.; Adkin, A.L. Kinematic and kinetic validity of the inverted pendulum model in quiet standing. Gait Posture 2004, 19, 124–132. [Google Scholar] [CrossRef]
- Sung, J.-L.; Hong, C.-Y.; Liu, C.-H.; Lee, P.; Guo, L.-Y.; Lin, N.-H.; Yen, C.-W.; Liaw, L.-J. Characterizing the validity of the inverted pendulum model for quiet standing. J. Health Eng. 2021, 2021, 8884614. [Google Scholar] [CrossRef]
- Jian, Y.; Winter, D.A.; Gilchrist, I.L. Trajectory of the body COG and COP during initiation and termination of gait. Gait Posture 1993, 1, 9–22. [Google Scholar] [CrossRef]
- Günther, M.; Grimmer, S.; Siebert, T.; Blickhan, R. All joints contribute to quiet human stance: A mechanical analysis. J. Biomech. 2009, 42, 2739–2746. [Google Scholar] [CrossRef]
- Suzuki, Y.; Nomura, T.; Casadio, M.; Morasso, P. Intermittent control with ankle, hip, and mixed strategies during quiet standing: A theoretical proposal based on a double inverted pendulum model. J. Theor. Biol. 2012, 310, 55–79. [Google Scholar] [CrossRef]
- McGrath, M.; Howard, D.; Baker, R. The strengths and weaknesses of inverted pendulum models during human walking. Gait Posture 2015, 41, 389–394. [Google Scholar] [CrossRef]
- Morasso, P.; Cherif, A.; Zenzeri, J. Quiet standing: The single inverted pendulum model is not so bad after all. PLoS ONE 2019, 14, e0213870. [Google Scholar] [CrossRef] [PubMed]
- Lott, M.B. Translating the base of support: A mechanism for balance maintenance during rotations in dance. J. Dance Med. Sci. 2019, 23, 17–25. [Google Scholar] [CrossRef] [PubMed]
- Hof, A.L.; Gazendam, M.G.J.; Sinke, W.E. The condition for dynamic stability. J. Biomech. 2005, 38, 1–8. [Google Scholar] [CrossRef]
- Hof, A.L. The ‘extrapolate center of mass’ concept suggests a simple control of balance in walking. Hum. Mov. Sci. 2008, 27, 112–125. [Google Scholar] [CrossRef]
- Curtze, C.; Buurke, T.J.W.; McCrum, C. Notes on the margin of stability. J. Biomech. 2024, 166, 112045. [Google Scholar] [CrossRef]
- Lott, M.B.; Laws, K.L. The physics of toppling and regaining balance during a pirouette. J. Dance Med. Sci. 2012, 16, 167–274. [Google Scholar] [PubMed]
- Zaferiou, A.M.; Flashner, H.; Wilcox, R.R.; McNitt-Gray, J.L. Lower extremity control during turns initiated with and without hip external rotation. J. Biomech. 2017, 52, 130–139. [Google Scholar] [CrossRef] [PubMed]
- Imura, A.; Iino, Y. Regulation of hip joint kinetics for increasing angular momentum during the initiation of a pirouette en dehors in classical ballet. Hum. Mov. Sci. 2018, 60, 18–31. [Google Scholar] [CrossRef]
- Zaferiou, A.M.; Wilcox, R.R.; McNitee-Gray, J.L. Whole-body balance regulation during the turn phase of the piqué and pirouette turns with varied rotational demands. Med. Probl. Perform. Art. 2016, 31, 96–103. [Google Scholar] [CrossRef]
- Bierbaum, S.; Peper, A.; Karamanidis, K.; Arampatzis, A. Adaptive feedback potential in dynamic stability during disturbed walking in the elderly. J. Biomech. 2011, 44, 1921–1926. [Google Scholar] [CrossRef]
- Martelli, D.; Luo, L.; Kang, J.; Kang, U.J.; Fahn, S.; Agrawal, S.K. Adaptation of stability during perturbed walking in Parkinson’s disease. Sci. Rep. 2017, 7, 17875. [Google Scholar] [CrossRef]
- Alderink, G.; Harro, C.; Hickox, L.; Zeitler, D.W.; Bourke, M.; Gosla, A.; Rustmann, S. Dynamic measures of balance during a 90° turn in self-selected gait in individuals with Parkinson’s disease. Appl. Sci. 2023, 13, 5428. [Google Scholar] [CrossRef]
- Harro, C.; Alderink, G.; Hickox, L.; Zeitler, D.W.; Avery, M.; Daman, C.; Laker, D. Dynamic measures of balance during obstacle-crossing in self-selected gait in individuals with mild to moderate Parkinson’s disease. Appl. Sci. 2024, 14, 1271. [Google Scholar] [CrossRef]
- Peebles, A.T.; Reinholdt, A.; Bruetsch, A.P.; Lynch, S.G.; Huisinga, J.M. Dynamic margin of stability during gait is altered in persons with multiple sclerosis. J. Biomech. 2016, 49, 3949–3955. [Google Scholar] [CrossRef]
- Anastasi, D.; Lencioni, T.; Carpinella, I.; Castagna, A.; Crippa, A.; Gervasoni, E.; Corrini, C.; Marzegan, A.; Rabuffetti, M.; Ferrarin, M.; et al. Dynamic balance during walking in people with multiple sclerosis: A cross-sectional study. Proc. Inst. Mech. Eng. H 2023, 237, 199–208. [Google Scholar] [CrossRef]
- Tisserand, R.; Armand, S.; Allali, G.; Schnider, A.; Baillieul, S. Cognitive-motor dual-task interference modulates mediolateral dynamic stability during gait in post-stroke individuals. Hum. Mov. Sci. 2018, 58, 175–184. [Google Scholar] [CrossRef] [PubMed]
- Buurke, T.J.W.; Liu, C.; Park, S.; den Otter, R.; Finley, J.M. Maintaining sagittal plane balance compromises frontal plane balance during reactive stepping in people post-stroke. Clin. Biomech. 2020, 80, 105135. [Google Scholar] [CrossRef] [PubMed]
- Hak, L.; van Dieén, J.H.; van der Wurff, P.; Houdijk, H. Stepping asymmetry among individuals with unilateral transtibial limb loss might be functional in terms of gait stability. Phys. Ther. 2014, 94, 1480–1488. [Google Scholar] [CrossRef]
- Curtze, C.; Hof, A.L.; Otten, B.; Postema, K. Balance recovery after an evoked forward fall in unilateral transtibial amputees. Gait Posture 2020, 32, 336–341. [Google Scholar] [CrossRef]
- Rodrigues, F.B.; de Sá e Souza, G.S.; de Mendonça Mesquita, E.; de Sousa Gomide, R.; Baptista, R.R.; Pereira, A.A.; Andrade, A.O.; Fraga Viera, M. Margins of stability of persons with transtibial or transfemoral amputations walking on sloped surfaces. J. Biomech. 2021, 123, 110453. [Google Scholar] [CrossRef]
- Tsubaki, Y.; Kawano, Y.; Lin, C.-F.; Kuno-Mizumura, K. Laterality in body composition of professional and amateur ballet dancers while performing a single pirouette with pointe shoes. Med. Probl. Perform. Art. 2024, 39, 8–17. [Google Scholar] [CrossRef] [PubMed]
- Tsubaki, Y.; Kawano, Y.; Lin, C.-F.; Kuno-Mizumura, M. Differences in the rotation axis between professional and experienced amateur ballet dancers during pirouette en dehors in classical ballet wearing pointe shoes: A pilot study. J. Dance Med. Sci. 2024, 28, 43–50. [Google Scholar] [CrossRef]
- Baker, R. The conventional gait model. In Measuring Walking: A Handbook of Clinical Gait Analysis; Mac Keith Press: London, UK, 2013; pp. 29–49. [Google Scholar]
- Molina-Rueda, F.; Fernández-González, P.; Cuesta-Gómez, A.; Koutsou, A.; Carratalá, M.; Miangolarra-Page, J.C. Test-retest reliability of a conventional gait model for registering joint angles during initial contact and toe-off in healthy subjects. Int. J. Environ. Res. Public Health 2021, 18, 1343. [Google Scholar] [CrossRef] [PubMed]
- Carson, M.C.; Harrington, M.E.; Thompson, N.; O’Connor, J.J.; Theologis, T.N. Kinematic analysis of a multi-segment foot model for research and clinical applications: A repeatability analysis. J. Biomech. 2001, 34, 1299–1307. [Google Scholar] [CrossRef] [PubMed]
- Reay, J.; Leboeuf, F.; Hanssen, B.; Chiu, J.; Jones, R. Repeatability of the Oxford Foot Model: Comparison of a team of assessors with different backgrounds and no prior experience of the Oxford Foot Model. Gait Posture 2022, 92, 191–198. [Google Scholar] [CrossRef]
- Keuhnapfel, A.; Ahnert, P.; Loeffler, M.; Broda, A.; Scholz, M. Reliability of 3D laser-based anthropometry and comparison with classical anthropometry. Sci. Rep. 2016, 6, 26672. [Google Scholar] [CrossRef]
- Neelly, K.; Wallmann, W.; Backus, C.J. Validity of measuring leg length with a tape measure compared to a computed tomography scan. Physiother Theory Pract. 2013, 29, 487–492. [Google Scholar] [CrossRef]
- Harrington, M.E.; Zavatsky, A.B.; Lawson, S.E.M.; Yuan, Z.; Theologis, T.N. Prediction of the hip joint centre in adults, children, and patients with cerebral palsy based on magnetic resonance imaging. J. Biomech. 2007, 40, 595–602. [Google Scholar] [CrossRef]
- Winter, D.A. Biomechanics and Motor Control of Human Movement, 4th ed.; John Wiley & Sons, Inc.: Hoboken, NJ, USA, 2009; pp. 82–106. [Google Scholar]
- Winter, D.A. Human balance and posture control during standing and walking. Gait Posture 1995, 3, 193–214. [Google Scholar] [CrossRef]
- Pai, Y.C.; Patton, J. Center of mass velocity-position predictions for balance control. J. Biomech. 1997, 30, 347–354. [Google Scholar] [CrossRef]
- Townsend, M.A. Biped gait stabilization via foot placement. J. Biomech. 1985, 18, 21–38. [Google Scholar] [CrossRef]
- Terry, K.; Stanley, C.; Damiano, D. A new perspective on the walking margin of stability. J. Appl. Biomech. 2014, 30, 737–741. [Google Scholar] [CrossRef] [PubMed]
- Kazanski, M.E.; Cusumano, J.P.; Dingwell, J.B. Rethinking margin of stability: Incorporating step-to-step regulation to resolve the paradox. J. Biomech. 2022, 144, 111334. [Google Scholar] [CrossRef] [PubMed]
- Lott, M.B.; Xu, G. Joint angle coordination strategies during whole body rotations on a single lower-limb support: An investigation through ballet pirouettes. J. Appl. Biomech. 2020, 36, 103–112. [Google Scholar] [CrossRef]
- Hirashima, M. Induced acceleration of three-dimensional multi-joint movements and its application to sports movements. In Theoretical Biomechanics; Klika, V., Ed.; IntechOpen Limited: London, UK, 2011; pp. 303–318. [Google Scholar] [CrossRef]
- Graham, D.F.; Carty, C.P.; Lloyd, D.G.; Lichtwark, G.A.; Barrett, R.S. Muscle contributions to recovery from forward loss of balance by stepping. J. Biomech. 2014, 47, 667–674. [Google Scholar] [CrossRef] [PubMed]
- Sasagawa, S.; Shinya, M.; Nakazawa, K. Interjoint dynamic interaction during constrained human quiet standing examined by induced acceleration. J. Neurophysiol. 2014, 111, 313–322. [Google Scholar] [CrossRef]
- Ogaya, S.; Okita, Y.; Fuchioka, S. Muscle contributions to center of mass excursion in ankle and hip strategies during forward body tilting. J. Biomech. 2016, 49, 3381–3386. [Google Scholar] [CrossRef]
- Neptune, R.R.; Vistamehr, A. Dynamic balance during human movement: Measurement and control mechanisms. J. Biomech. Eng. 2019, 141, 0708011–07080110. [Google Scholar] [CrossRef]
- Begue, J.; Peyrot, N.; Dalleau, G.; Caderby, T. Age-related changes in the control of whole-body angular momentum during stepping. Exp. Gerontol. 2019, 127, 110714. [Google Scholar] [CrossRef]
- Begue, J.; Peyrot, N.; Lesport, A.; Turpin, N.A.; Watier, B.; Dalleau, G.; Caderby, T. Segmental contribution to whole-body angular momentum during stepping in healthy young and old adults. Sci. Rep. 2021, 11, 19969. [Google Scholar] [CrossRef]
- Provatidis, C.G. Revisiting the spinning top. Int. J. Mater. Mech. Eng. 2012, 1, 71–88. [Google Scholar]
- Błażkiewcz, M. Evaluation of geometric attractor structure and recurrence analysis in professional dancers. Entropy 2022, 24, 1310. [Google Scholar] [CrossRef] [PubMed]
- Stergiou, N. (Ed.) Nonlinear Analysis for Human Movement Variability; CRC Press, Taylor & Francis Group, LLC: Boca Raton, FL, USA, 2016. [Google Scholar]


| Variable | Participant 1 Mean (SD) deg | CV (%) | Participant 2 Mean (SD) deg | CV (%) | Participant 3 Mean (SD) deg | CV (%) | Participant 5 Mean (SD) deg | CV (%) |
|---|---|---|---|---|---|---|---|---|
| CoM to CoP Angle | 3.88 (0.42) | 10.87 | 3.20 (0.52) | 16.30 | 2.75 (0.64) | 23.35 | 3.53 (0.73) | 20.62 |
| Variable | Mean (SD) deg | CV (%) |
|---|---|---|
| CoM to CoP Angle | 3.34 (0.48) | 14.31 |
Disclaimer/Publisher’s Note: The statements, opinions and data contained in all publications are solely those of the individual author(s) and contributor(s) and not of MDPI and/or the editor(s). MDPI and/or the editor(s) disclaim responsibility for any injury to people or property resulting from any ideas, methods, instructions or products referred to in the content. |
© 2025 by the authors. Licensee MDPI, Basel, Switzerland. This article is an open access article distributed under the terms and conditions of the Creative Commons Attribution (CC BY) license (https://creativecommons.org/licenses/by/4.0/).
Share and Cite
Dykstra, A.; Kooistra, A.; Merucci, N.; Zeitler, D.W.; Alderink, G. The Margin of Stability During a Single-Turn Pirouette in Female Amateur Dancers: A Pilot Study. Appl. Sci. 2025, 15, 7519. https://doi.org/10.3390/app15137519
Dykstra A, Kooistra A, Merucci N, Zeitler DW, Alderink G. The Margin of Stability During a Single-Turn Pirouette in Female Amateur Dancers: A Pilot Study. Applied Sciences. 2025; 15(13):7519. https://doi.org/10.3390/app15137519
Chicago/Turabian StyleDykstra, Annalisa, Ashley Kooistra, Nicole Merucci, David W. Zeitler, and Gordon Alderink. 2025. "The Margin of Stability During a Single-Turn Pirouette in Female Amateur Dancers: A Pilot Study" Applied Sciences 15, no. 13: 7519. https://doi.org/10.3390/app15137519
APA StyleDykstra, A., Kooistra, A., Merucci, N., Zeitler, D. W., & Alderink, G. (2025). The Margin of Stability During a Single-Turn Pirouette in Female Amateur Dancers: A Pilot Study. Applied Sciences, 15(13), 7519. https://doi.org/10.3390/app15137519