Article

FF-YOLO: An Improved YOLO11-Based Fatigue Detection Algorithm for Air Traffic Controllers

1
College of Air Traffic Management, Civil Aviation Flight University of China, Guanghan 618307, China
2
Flight Technology and Flight Safety Research Base of the Civil Aviation Administration of China, Civil Aviation Flight University of China, Guanghan 618307, China
3
School of Electronic and Information Engineering, Beihang University, Beijing 100191, China
*
Authors to whom correspondence should be addressed.
Appl. Sci. 2025, 15(13), 7503; https://doi.org/10.3390/app15137503
Submission received: 11 June 2025 / Revised: 1 July 2025 / Accepted: 1 July 2025 / Published: 3 July 2025

Abstract

Real-time detection of fatigue states in air traffic controllers (ATCOs) is crucial for ensuring air traffic safety. Existing methods exhibit limitations such as poor real-time performance, intrusiveness, and susceptibility to lighting and occlusion. This paper proposes FF-YOLO, an improved YOLO11-based deep learning algorithm, to detect ATCO fatigue states through facial feature analysis. A custom dataset comprising 25,154 facial images collected from 10 ATCOs was constructed for model training and validation. The FF-YOLO model introduces the CA-C3K2 module for fine-grained feature extraction under complex lighting, incorporates a spatial–channel attention mechanism for improved detection accuracy during occlusion, and MPDIoU loss for enhanced accuracy on multi-scale facial images with accelerated convergence. Experimental results show FF-YOLO achieves 94.2% mAP@50, 74.7% mAP@50–95, 83.8% precision, and 73.8% recall, with gains of +13.7%, +11.6%, +0.6%, and +5.9% over YOLO11n, respectively, thereby enabling real-time and accurate detection of ATCO fatigue states. Future work will expand datasets with larger and more diverse ATCO populations to enhance generalizability.

1. Introduction

In the air transportation system, air traffic controllers (ATCOs) are responsible for directing aircraft takeoffs, landings, and flights. They must continuously monitor radar data and communication equipment to maintain real-time awareness of aircraft statuses [1]. This work requires ATCOs to remain highly focused for extended periods, leading to significant work intensity and psychological pressure, which can easily induce fatigue [2]. Research indicates that fatigue significantly impairs ATCOs’ cognitive functions [3], manifesting as slower and more unstable reaction times, decreased alertness, and reduced decision-making capabilities [4]. These negative effects directly increase the probability of human errors in air traffic control operations, potentially triggering a chain reaction that poses a serious threat to aviation safety systems [5]. Aviation accident data show that most safety incidents related to ATCOs are caused by fatigue, making the detection of ATCO fatigue states crucial for improving aviation safety [6]. Current mainstream fatigue management methods primarily rely on institutional shift rotation schemes [7]. While these methods can reduce the risk of fatigue accumulation to some extent, they have two fundamental limitations: first, they cannot achieve real-time monitoring of fatigue states, and second, they lack precise judgment tailored to individual differences. Therefore, developing a real-time monitoring method for detecting ATCO fatigue states to understand their work conditions in real time and form a “pre-event warning—dynamic intervention” management model is of great significance for enhancing the proactivity and precision of aviation safety management.
Fatigue detection research can be divided into subjective evaluation methods and objective evaluation methods. Subjective fatigue evaluation methods use standardized questionnaires or scales where ATCOs self-assess based on their own perceptions [8]. Although this approach can accurately assess subjective fatigue states, it cannot achieve real-time detection. Therefore, objective evaluation methods based on physiological indicators are used for ATCO fatigue detection. These methods utilize electrocardiogram (ECG), electroencephalogram (EEG), and electromyogram (EMG) signals as criteria for fatigue assessment [9]. However, such intrusive methods require subjects to wear devices, which can interfere with ATCOs’ normal work [10]. With advancements in computing power and algorithmic innovations, non-intrusive fatigue detection technologies based on machine learning have become a research hotspot in the field of fatigue detection. Several scholars have proposed various machine learning methods for fatigue detection [11]. These methods typically involve extracting facial key points, calculating mouth and eyelid closure degrees, and then using machine learning algorithms to build models for facial fatigue detection. However, machine learning methods are susceptible to various interferences in ATCO work environments. For example, ATCOs need to verbally broadcast control instructions during their work, which can severely affect the accuracy of fatigue detection methods based on mouth opening and closing degrees. Additionally, changes in eyelid closure degrees under different lighting conditions and occlusions, such as wearing glasses, can reduce the accuracy of detection based on the percentage of eyelid closure time, making traditional machine learning methods less practical due to the influence of work characteristics and environmental complexities.
To address the above issues, this paper focuses on ATCOs and proposes a deep learning method for fatigue detection using facial visual features based on an improved YOLO11, named FF-YOLO. The contributions of this paper are as follows:
  • A dataset of facial images of ATCOs under radar control scenarios was established, including facial image data of 10 ATCOs during work. Fatigue states were annotated based on subjective fatigue scale scores and PERCLOS indicators, and the positive and negative sample quantities in the dataset were balanced;
  • The CA-C3K2 feature extraction module was proposed, which introduces a dual-branch channel attention mechanism based on the C3K2 module to enhance cross-channel feature extraction capabilities for extracting fine-grained facial fatigue features such as facial muscle relaxation and lower eyelid swelling in ATCOs. The CA-C3K2 module was adopted in the backbone and neck of the FF-YOLO model to replace the original C3K2 module to improve the fatigue feature extraction capability under complex lighting conditions;
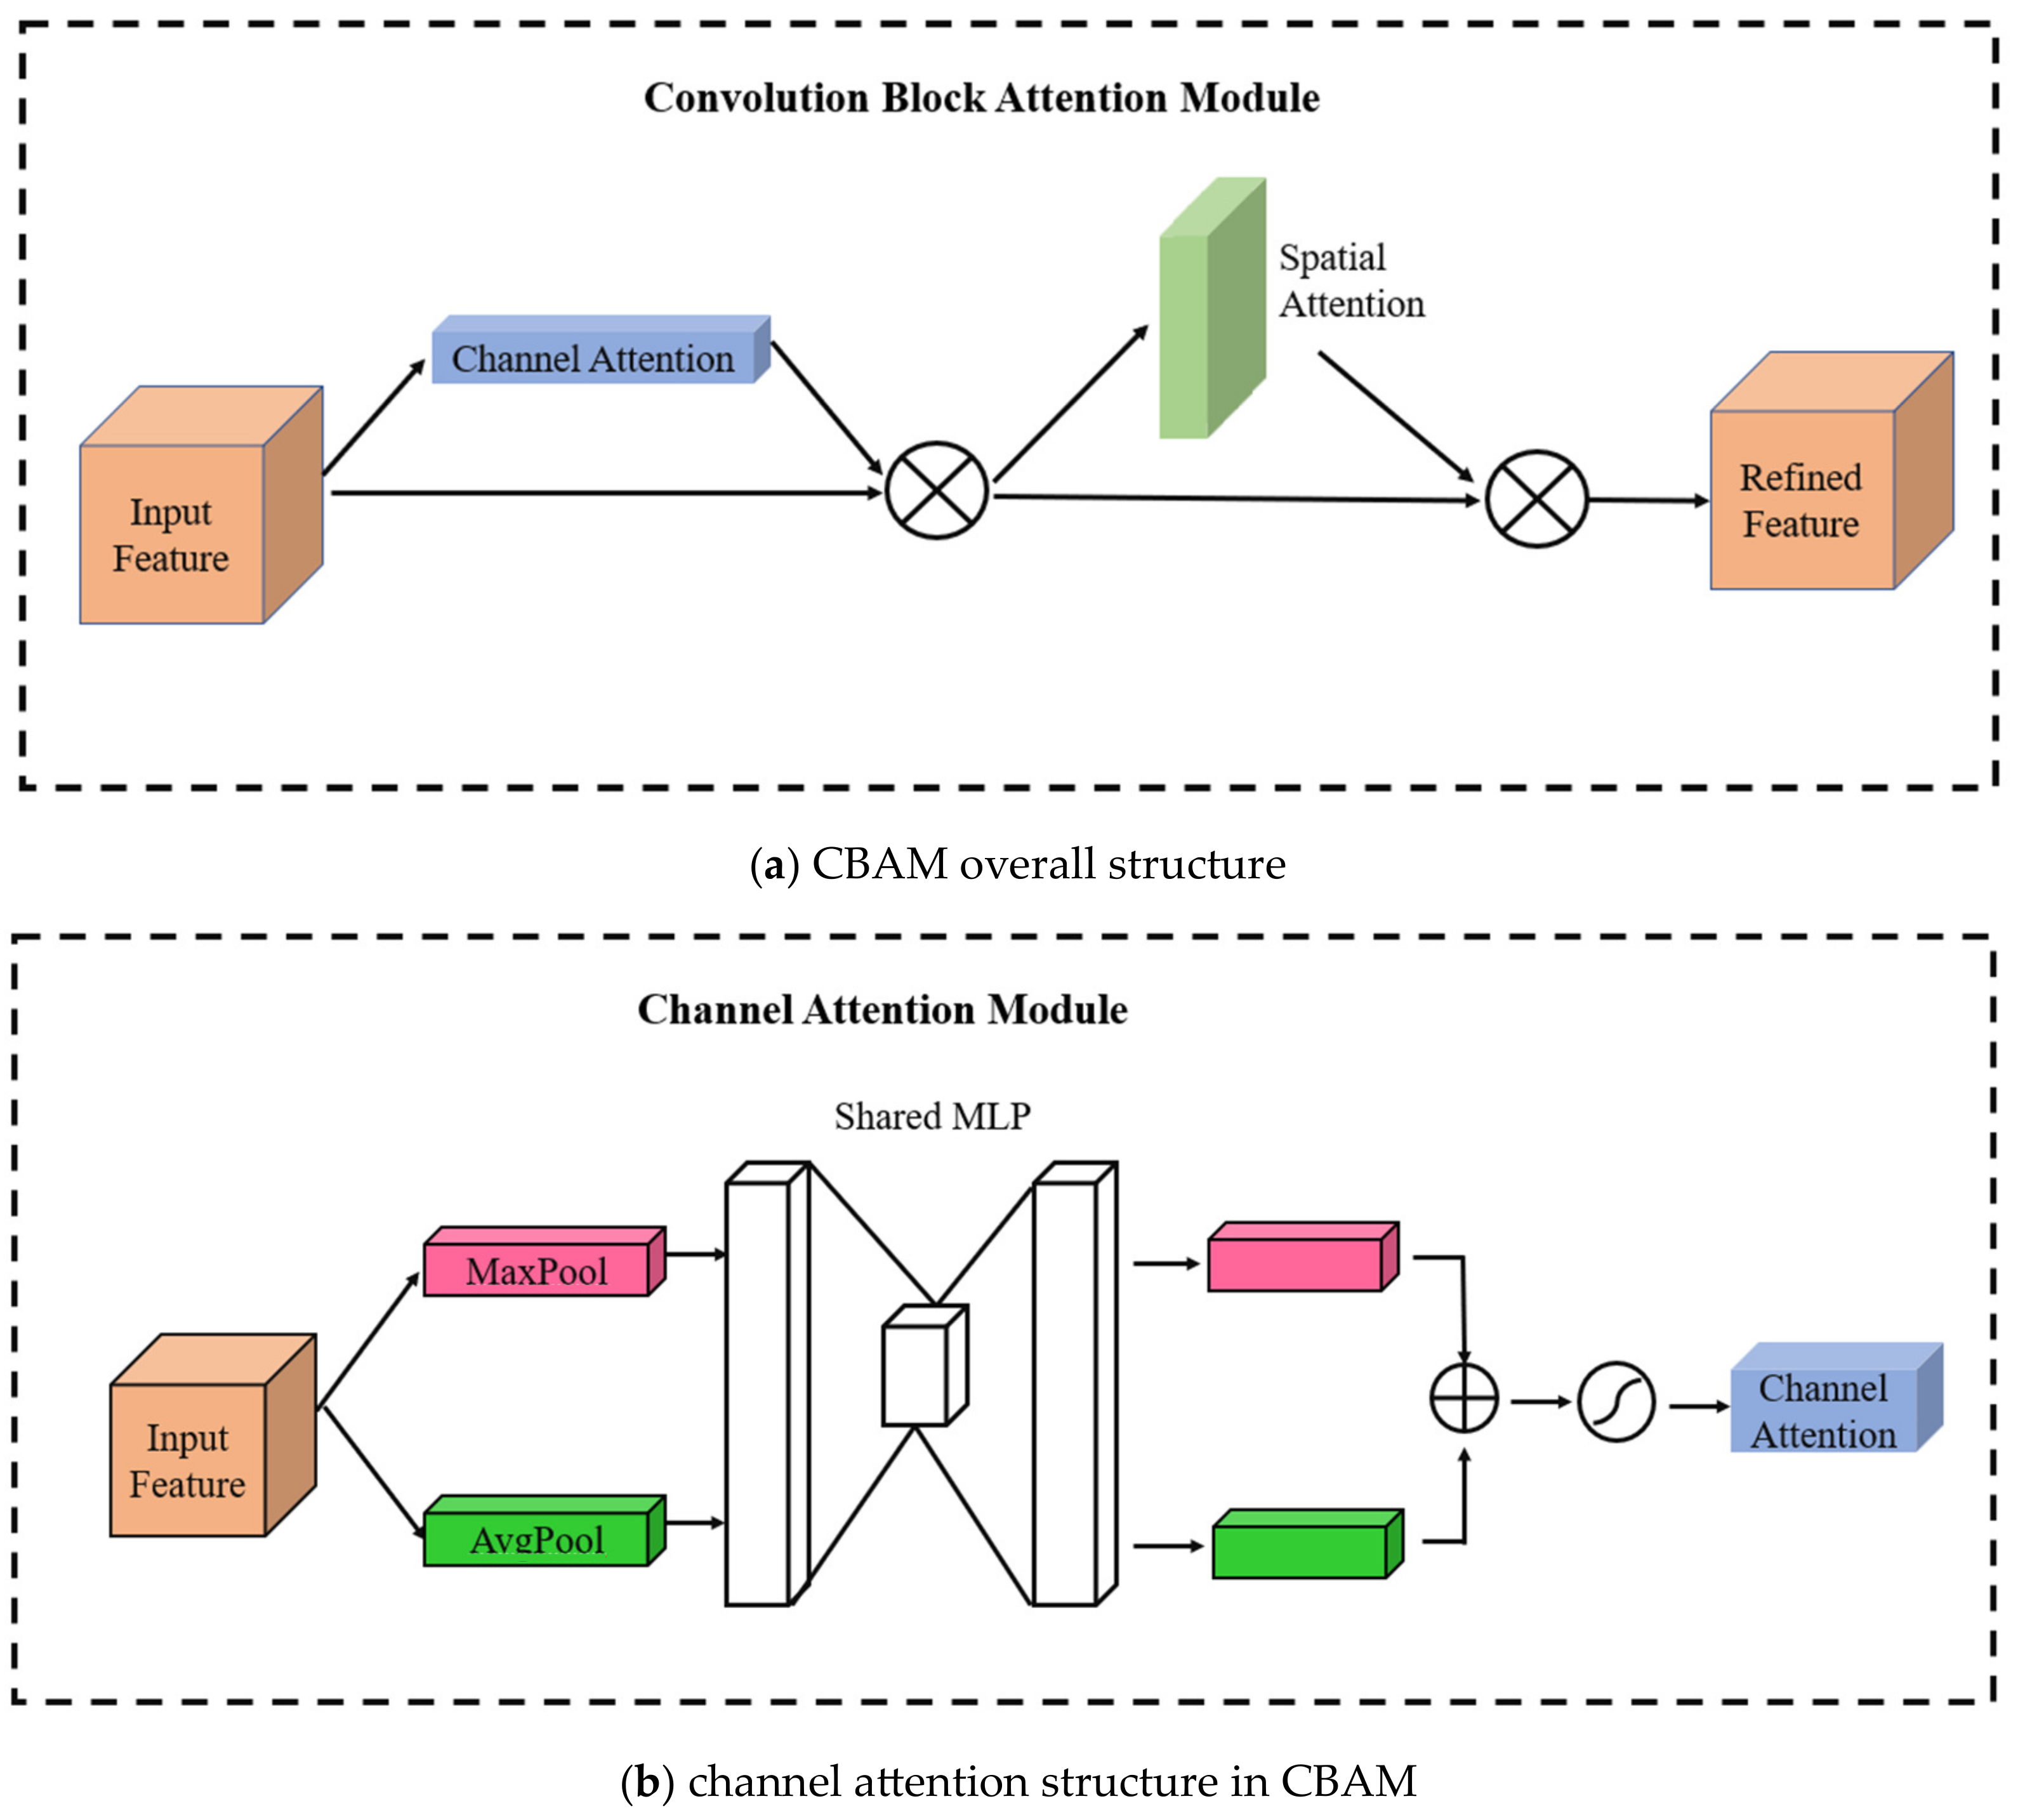
  • The CBAM module was introduced in the detection head to learn the spatial and channel characteristics of fatigue features, thereby improving the accuracy of fatigue detection in the presence of occlusion and head deflection interference;
  • The model’s loss function was replaced with MPDIoU to accelerate model convergence and enhance the accuracy of fatigue detection in facial images of different sizes.

2. Related Works

In the field of fatigue monitoring, commonly used fatigue detection methods are primarily divided into subjective and objective categories. Subjective assessment methods mainly rely on standardized questionnaires or scales, quantifying fatigue levels through self-reports from subjects. For example, Trudie Chalder et al. [8] proposed the Chalder Fatigue Scale (CFS). This scale is based on self-reported subjective reports and includes 14 items divided into two dimensions: physical fatigue and mental fatigue. The scale comprehensively covers both physical and mental fatigue, demonstrating high internal consistency and structural validity. Sandra et al. [12] introduced the NASA-TLX scale, originally designed to assess workload in aerospace tasks. Triyanti et al. [13] applied the NASA-TLX scale to research on ATCO fatigue, illustrating the relationship between workload and ATCO fatigue. The NASA-TLX scale uses weighted scoring across six dimensions, namely, mental demand, physical demand, temporal demand, performance, effort, and frustration, thereby comprehensively reflecting the overall impact of task load on individuals. However, subjective scale methods rely on retrospective self-reports, which suffer from limitations such as time delays, recall biases, and differences in subjective perception. ATCOs engaged in high-intensity tasks cannot interrupt their work to fill out questionnaires, leading to delays in fatigue state detection. Additionally, individual differences in fatigue perception thresholds further diminish the objectivity of the results. Therefore, it is necessary to integrate objective detection methods to compensate for the shortcomings of subjective tools, enhancing the precision and reliability of real-time monitoring.
To achieve real-time detection and eliminate individual subjective differences, objective methods are employed in fatigue detection. Objective methods can be categorized into intrusive and non-intrusive types. Intrusive methods primarily involve directly collecting human physiological signals to quantitatively assess fatigue states, including the detection of electrocardiogram (ECG), electroencephalogram (EEG), and electromyogram (EMG) signals. Hu et al. [14] proposed a multi-branch deep network architecture (STFN-BRPS) based on EEG signals, addressing the shortcomings of existing methods in mining and fusing spatiotemporal EEG features, and achieved accurate recognition of driver fatigue states with an accuracy of 92.43%. Zhao et al. [15] utilized heart rate variability (HRV) features to overcome the deficiencies of traditional methods in distinguishing between blinking and drowsiness, effectively improving the accuracy and stability of fatigue state recognition. Mu et al. [16] introduced a novel fatigue assessment framework that combines ECG and HRV features, extracting multi-scale features from ECG sequences and performing adaptive fusion to accurately detect fatigue during physical activity, achieving an accuracy of 94.0% and a recall rate of 89.3%. Intrusive methods based on physiological signals have also been applied in the situational awareness of ATCOs. Li et al. [17] employed a multimodal approach using EEG and eye-tracking to reveal the intrinsic relationship between psychophysiological indicators and ATCOs’ situational awareness, providing theoretical support for the development of real-time monitoring systems for air transportation safety. Although intrusive methods for objective fatigue monitoring can obtain high-precision physiological data, the equipment requires direct contact with the human body, causing discomfort that may reduce ATCOs’ work efficiency or even lead to psychological resistance. Additionally, these methods are operationally complex and costly, making them difficult to deploy continuously in real-world scenarios. Therefore, non-intrusive methods, which use contactless technologies such as visual analysis to achieve continuous monitoring in natural states, are more practical.
Objective non-intrusive methods typically detect fatigue based on facial features. Conventional approaches often employed machine learning techniques to assess fatigue by measuring the percentage of eyelid closure time (PERCLOS) and yawning frequency based on mouth closure degree [18]. Zhao et al. [19] calculated the mouth aspect ratio (MAR) using oral keypoints and the eye aspect ratio (EAR) using ocular keypoints, subsequently determining fatigue based on the PERCLOS method. Chen et al. [20] proposed a daily facial fatigue detection framework based on a non-local 3D attention network, which extracts spatio-temporal features using 3D-ResNet combined with a non-local attention mechanism for fatigue state classification. This approach achieved an average accuracy of 90.8% in fatigue detection tasks and a validation accuracy of 72.5% in binary classification scenarios. Khan et al. [21] introduced a driver fatigue recognition framework based on intelligent facial expression analysis. It extracts multi-scale features from facial images through techniques including discrete wavelet transform, discrete cosine transform, and entropy analysis, and utilizes support vector machines for classification. This method attained an average expression recognition accuracy of 91.1%, demonstrating high robustness and accuracy under varying image resolutions, noise, and occlusion conditions.
In recent years, significant advancements in hardware have substantially enhanced computer data processing capabilities, leading to the rapid development of deep learning-based object detection technologies. Deep learning-based non-intrusive methods overcome the limitation of manual feature extraction inherent in machine learning. They fully leverage the relationships within data and the learning capacity of the models themselves to automatically select features of the recognition targets, thereby improving detection efficiency and accuracy. The YOLO series models, as commonly used object detection algorithms, are widely applied in personnel fatigue detection due to their high detection accuracy, low parameter count, and fast detection speed. For instance, Li et al. [22] proposed ES-YOLO, an improved driver fatigue detection algorithm based on YOLOv7. To address issues of low fatigue accuracy and susceptibility to light interference, they integrated the CBAM module to enhance attention on crucial spatial locations within images and replaced the loss function with Focal-EIOU Loss to increase focus on hard samples. This network structure effectively ensured detection accuracy for driver fatigue states, achieving a 98.8% mAP on their self-built dataset. However, the model is not optimized for fatigue detection under occlusion. Zhao et al. [23] proposed Yolom-Net, a lightweight fatigue detection network based on YOLOv8. They replaced the original backbone network with MobilenetV3 to reduce computational complexity. Additionally, to focus on important image regions, they employed channel prior convolutional attention (CPCA) to enhance the network’s feature extraction capability. This approach rapidly detected driver states while maintaining high accuracy, achieving 95.75% mAP and 47 fps on their self-built dataset. Yu et al. [24] addressed the problem of inaccurate localization of driver facial fatigue features in real driving environments. They integrated a Gather mechanism from Gold-Yolo into YOLOv7 and reduced feature loss in the original network by adding a PSA module and replacing convolutions. Furthermore, their model incorporated an additional detection layer to enhance the extraction of eye and mouth features. The model has an accuracy of up to 98% on facial datasets, significantly enhancing the model’s ability to locate fatigue facial features. However, the model relies on mouth features to judge fatigue, which is not practical in ATCO fatigue detection.
These deep learning-based fatigue detection methods have enhanced model resistance to light interference, feature extraction capability, and feature localization accuracy, collectively improving detection performance, but they also have limitations. Although non-intrusive methods avoid interfering with the subject’s normal work during real-time detection, existing non-intrusive approaches exhibit limitations in fatigue detection for ATCOs. The ATCO’s continuous verbal interactions during work significantly impact fatigue judgment methods based on mouth opening/closing degree. Factors such as spectacle occlusion and illumination variations in the working environment also reduce detection accuracy.
Through the analysis and summary of the aforementioned studies, it is evident that subjective assessment methods can comprehensively reflect the overall impact of task load on individuals. However, subjective assessment methods rely on retrospective self-reports, which suffer from limitations such as time delays, recall biases, and differences in subjective perception. Objective detection methods can be categorized into intrusive and non-intrusive types. While intrusive methods can obtain high-precision physiological data, they may cause discomfort, leading to decreased work efficiency or even psychological resistance in ATCOs. Non-intrusive methods can achieve real-time detection without interfering with ATCOs’ work, but current non-intrusive methods often experience reduced detection accuracy due to factors such as the need for continuous verbal communication, eyewear occlusion, and lighting interference in the work environment. Therefore, this study proposes a deep learning-based non-intrusive fatigue detection method called FF-YOLO. This method is based on an improved YOLO11 model and enhances fatigue detection accuracy in ATCO work scenarios by identifying fatigue features in facial regions, such as facial muscle relaxation and lower eyelid swelling, through a deep learning model.

3. Materials and Methods

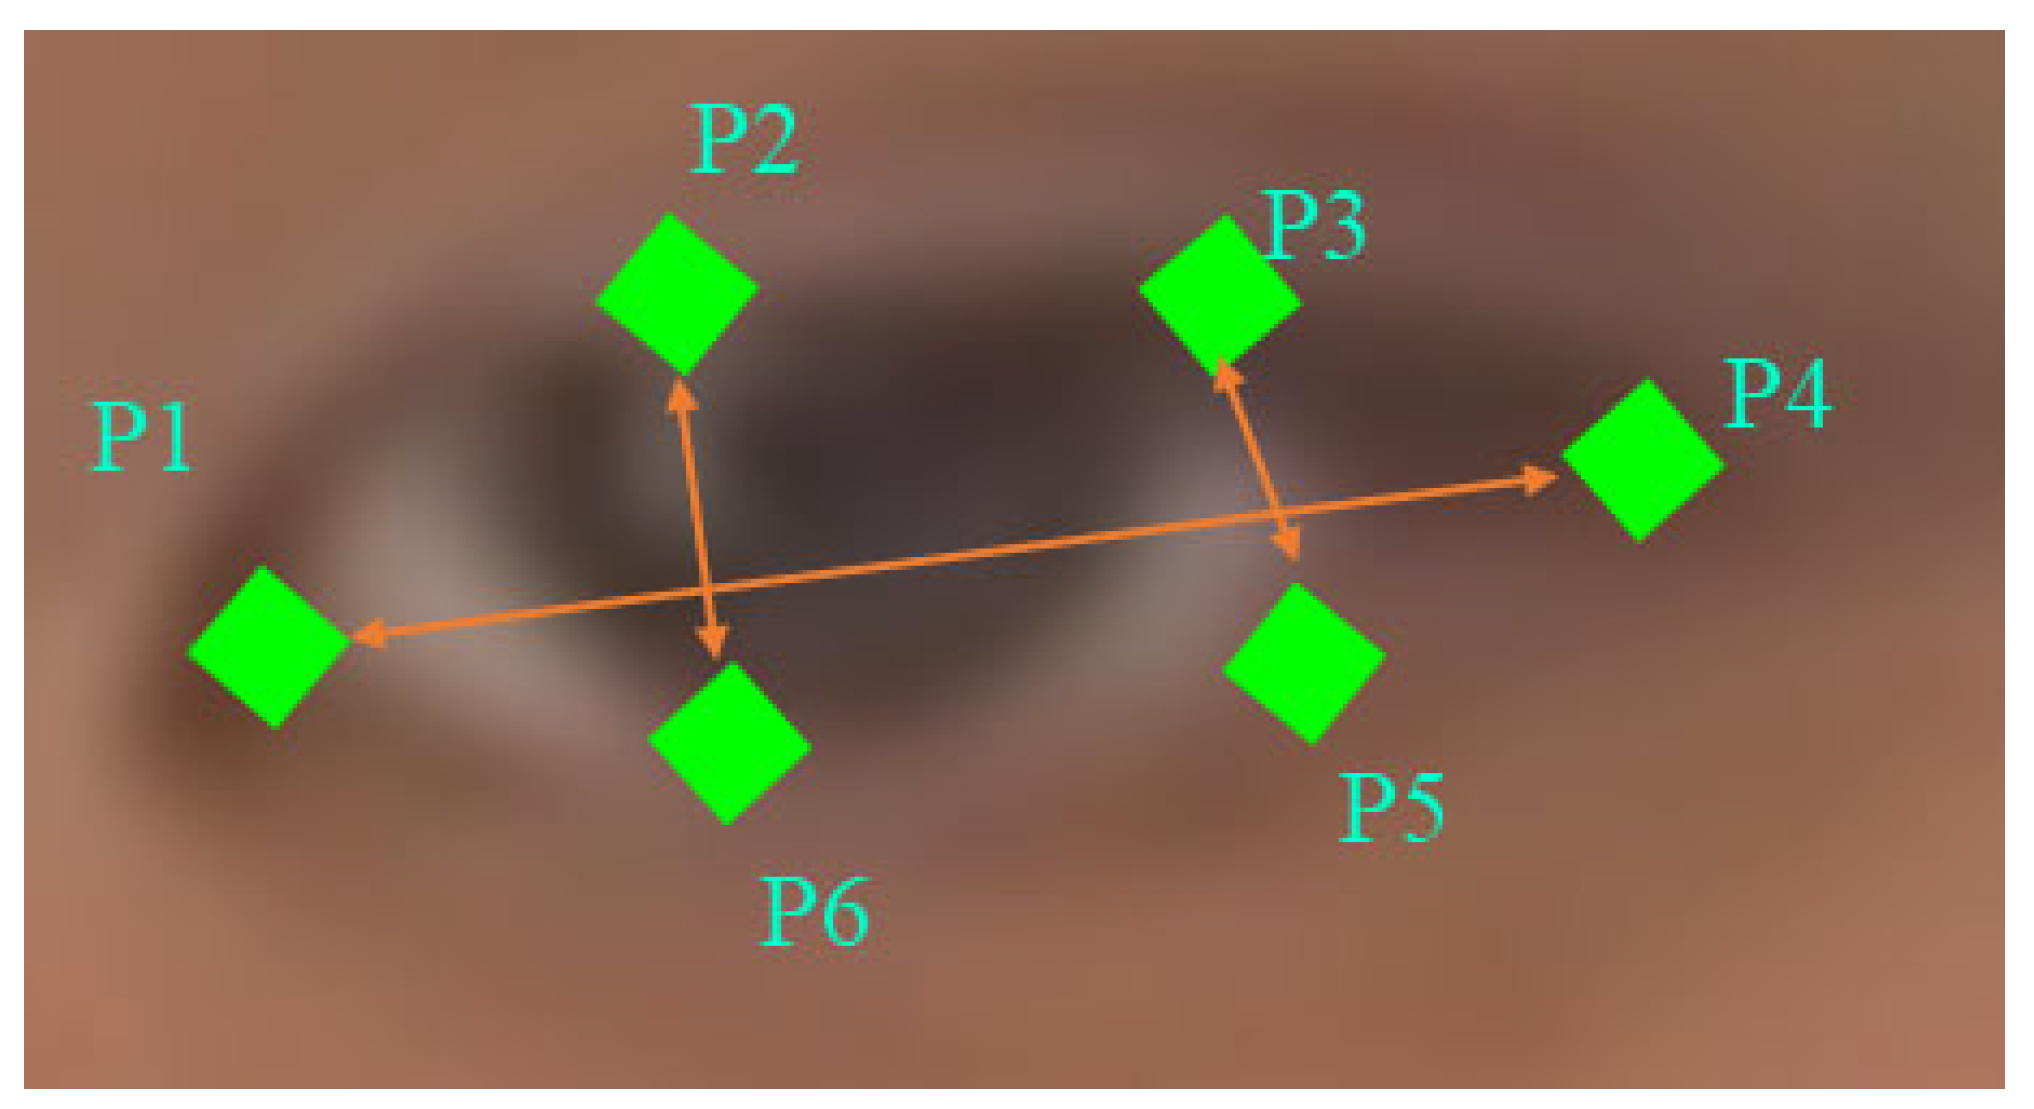
3.1. Dataset Construction

3.1.1. Data Collection

This study was conducted on the radar control simulator at the Key Laboratory of Flight Techniques and Flight Safety CAAC, where a dataset of facial images of ATCOs under working conditions was constructed. The experiment collected facial image data from 10 radar ATCOs. Considering the complex lighting variations in actual air traffic control (ATC) work environments due to natural light changes at different times of day and dynamic interference from indoor equipment and screen reflections, this experiment included data collection of ATCO facial images under different lighting conditions at various times of the day. As shown in Table 1, the experiment adopted three time periods—morning, afternoon, and evening—for data collection to record the impact of natural light changes on the facial images of ATCOs. The design of data collection at different time periods took into account the effects of indoor and outdoor light source transitions on pupil state, facial reflections, and shadow distribution, thereby enhancing the generalization capability of the dataset.
During the experiment, the subjects were required to perform ATC tasks involving large, medium, and small traffic volumes, facing various complex flight situations, such as multiple large, medium, and small aircraft entering the control area simultaneously, and flight adjustments under adverse weather conditions. For safety considerations, these scenarios were all conducted using the radar control simulator system. The experiment arranged for staff to act as the pilot-in-command, responsible for simulating air–ground communications and command confirmations with the subject ATCOs, to recreate the real working environment. The data collection environment is shown in Figure 1. Before the experiment began, all subjects underwent unified training to ensure they were familiar with the experimental procedures and equipment operations. The experiment used air traffic radar control tasks to induce fatigue.
The experiment first collected facial video data of the subjects during the control tasks, then split the video frames at a rate of 1 frame per second, and after cropping, obtained facial image data of ATCOs with a resolution of 900 × 900, totaling 53,756 images, all stored in JPEG format. Figure 2 displays some of the facial images of ATCOs collected in the experiment. It can be seen from the figure that the experiment captured facial images of ATCOs under various conditions, including occlusion by glasses, hand occlusion, head tilt, and different ambient lighting at various times.
After each task, the subjects were required to fill out the NASA-TLX questionnaire. This questionnaire serves as a subjective dimension for assessing fatigue, used to evaluate the workload of individuals during task execution, where higher NASA-TLX scores are correlated with higher levels of fatigue [25]. The NASA-TLX questionnaire used in the experiment is shown in Figure 3. After each air traffic control task, the subjects would receive a pop-up window prompting them to complete the questionnaire. The questionnaire includes six dimensions: mental demand, physical demand, temporal demand, performance, effort, and frustration level. Each dimension has a slidable slider, and the subjects score each indicator by dragging the slider. The score range is from 1 to 10, where 1 indicates “very low” and 10 indicates “very high”.
The NASA-TLX scale employs six dimensions to assess psychological workload: Mental Demand, Physical Demand, Temporal Demand, Performance, Effort, and Frustration Level. The content of each dimension is described as shown in Table 2. In this study, ATCO instructors were invited to conduct pairwise comparisons of the importance of each dimension, taking into account the characteristics of air traffic control tasks—specifically their low physical demand and high mental demand—as well as the requirements of the fatigue detection task. Weights were then derived based on the NASA-TLX weighting calculation method. Since the number in the weight algorithm cannot be divided evenly, the sum of the original weights after rounding is 0.97. To ensure the mathematical validity of the composite assessment score, this study adjusted the weights of the dimensions with the least impact—Physical Demand, Performance, and Frustration Level—from their original values of 0.06, 0.06, and 0.06 to 0.07, 0.07, and 0.07, respectively, ensuring that the total sum of weights was strictly equal to 1. The final weights adopted in this study are presented in Table 2. The specific steps for weight calculation are as follows:
  • Pairwise comparison: The six dimensions were combined in pairs, resulting in 15 combinations, such as comparing Mental Demand with Physical Demand or Mental Demand with Temporal Demand.
  • Selection of the more important dimension: For each pair, participants were asked to select which dimension had a greater impact on workload. For example, in the comparison between Mental Demand and Physical Demand, if the participant deemed Mental Demand to be more important, a count of 1 was added to the tally for Mental Demand.
  • Weight calculation: The number of times each dimension was selected served as its weight. The range of weights was from 0 to 5, as each dimension could be selected a maximum of 5 times.
Each dimension is divided into 10 levels, from easy to difficult, corresponding to the scores of the dimension from small to large. After obtaining the scores of all dimensions by the ATCOs, the score of each dimension is multiplied by its corresponding weight, and then the weighted scores of all six dimensions are added together to obtain the comprehensive evaluation score. The evaluation score calculation formula is as shown in Formula 1, where Evaluation represents the comprehensive evaluation score, and Score and Weight represent the scores of each item and the corresponding weights.
E v a l u a t i o n = i = 1 6 ( S c o r e i × W e i g h t i )
For instance, the NASA-TLX evaluation case of the controller shown in Figure 3 scored 8, 3, 8, 4, 7, and 5 for the six dimensions, which were multiplied by the corresponding dimension weights in Table 2 to obtain a NASA-TLX evaluation score of 6.83.

3.1.2. Dataset Labeling

This study labels the fatigue status of ATCOs based on the subjective and objective fusion method. For the subjective dimension of fatigue assessment, the NASA-TLX scale was employed, with weights for each dimension determined based on the characteristics of the control tasks, thereby quantifying the workload perception of ATCOs. According to related research on the cumulative frequency distribution of NASA-TLX scores for ATC tasks [26], evaluation scores from 7 to 10 are considered indicative of subjective fatigue in ATCOs. For the objective dimension of fatigue assessment, the PERCLOS metric, which is based on the persistence of eyelid closure, was adopted as the standard for judging fatigue. PERCLOS is an effective psychophysiological indicator that assesses an individual’s alertness by calculating the proportion of time the eyelids are closed [27], and it holds significant application value in fields such as driver fatigue detection. This metric quantifies fatigue by calculating the percentage of time within a specific period that the eyelids are closed beyond a certain proportion. A higher proportion indicates a greater degree of fatigue in the individual. Compared to traditional methods that count the number of blinks within a fixed time, PERCLOS reflects slow eyelid drooping actions rather than rapid blinking behaviors, and this slow drooping is more indicative of fatigue states; thus, it was chosen as the primary basis for annotating fatigue states.
To calculate PERCLOS, it is first necessary to determine the shape of the eyes. This paper employs the method from the Dlib library to identify the key points of the ATCO’s eyes based on facial images. Dlib is an open-source machine learning library that provides researchers with complete documentation and corresponding debugging tools for using artificial intelligence technology, and it has wide applications in the fields of computer vision and image processing [28]. This paper utilizes the facial detection tool provided by Dlib by calling its functions to obtain a facial detector. Next, a pre-trained shape_predictor_68_face_landmarks model is loaded, which can accurately locate 68 key points on the face. As shown in Figure 4a, among the 68 key points, six key points related to the eyes are used to calculate the degree of eye closure, thereby inferring the individual’s fatigue level. It should be noted that wearing glasses may impact the extraction of key eyelid landmarks. As shown in Figure 4b, this impact is typically minimal when an ATCO wearing glasses views the screen frontally. However, when the ATCO’s head is turned, occlusion by the frame and light reflections from the lenses may interfere with the accuracy of PERCLOS calculation during specific periods. Given that fatigue is an inherently continuous physiological process rather than an instantaneous event, the PERCLOS metric is designed to compute the proportion of eyelid closure over an extended sampling window. At this temporal scale, transient measurement errors caused by intermittent factors like occlusion and reflections exert limited influence on the overall result. Therefore, despite the potential for measurement bias introduced by eyewear, the PERCLOS-based objective annotation results employed in this study remain effective for characterizing fatigue states over extended time scales. The fatigue labeling method that combines NASA-TLX subjective data for cross-validation and fusion further reduces the impact of bias on the final fatigue judgment.
The eye aspect ratio (EAR) is an indicator used to quantify the degree of eye closure. As shown in Figure 5, this paper uses 6 key points, such as the inner and outer corners of the eyes, the upper and lower eyelids, etc., to calculate the eye aspect ratio EAR. The formula for calculating EAR is given in Equation (2) [29].
E A R = | | P 2 P 6 | | + | | P 3 P 5 | | 2 × | | P 1 P 4 | |
In the formula, P 1 to P 6 represent the position coordinates of the six key points around the eyes, of which P 1 and P 4 are the points of the outer and inner corners of the eyes, and P 2 , P 3 , P 5 , and P 6 are the points of the upper and lower contours of the eyes. By calculating the Euclidean distance between these points, the EAR value can be obtained. When the eyes are open, the EAR value is relatively stable; when the eyes are closed, the EAR value will gradually decrease and approach zero. According to the PERCLOS algorithm, when the eyes are closed for a period of time, it can be judged that the individual may be in a state of fatigue.
The specific method for calculating the PERCLOS value is to use the EAR value to determine the degree of eye closure at different time points. This study uses the P80 standard [27] to assess fatigue by the percentage of time when the eye closure area exceeds 80%, that is, the time Tclose when the EAR < 0.2, in the total observation time T. The calculation formula for the PERCLOS value can be expressed as Equation (3) [30]:
P e r c l o s = T c l o s e T × 100 %
In practical applications, since all collected videos are segmented into facial images at a rate of 1 frame per second, PERCLOS can be expressed as the ratio of the number of facial images with eye closure within one minute to the total number of images. Thus, PERCLOS can be represented as shown in Equation (4). Here, Fclose denotes the number of facial images within one minute where the EAR is less than 0.2, and F represents the total number of facial images within one minute, with F = 60 in this experiment.
P e r c l o s = F c l o s e F × 100 %
The PERCLOS threshold of the P80 standard is set at 30% under high-concentration tasks; that is, when the PERCLOS value is detected to be greater than 30%, it is considered that the controller is objectively in a state of fatigue.
The fatigue labeling, combining subjective and objective measures, adopted the NASA-TLX subjective scale and the PERCLOS method. The fatigue classification standard used in this study is defined as follows: when a subject’s PERCLOS value exceeds 30% and the NASA-TLX composite evaluation score is ≥7, the facial image is classified as a fatigue state and labeled as “Drowsy”; otherwise, it is classified as a non-fatigue state and labeled as “Non-Drowsy”. This classification standard is adopted because a PERCLOS value exceeding 30% indicates that, from a physiological perspective, the ATCO’s eye closure time is excessively long, suggesting physiological signs of fatigue; meanwhile, a NASA-TLX subjective scale score between 7 and 10 reflects significant workload and psychological fatigue perceived by the ATCO. The combination of subjective and objective standards effectively reduces misjudgments that may arise from a single metric, thereby improving the accuracy and reliability of fatigue detection. For example, in practical operations, even if the PERCLOS value slightly exceeds 30%, a low subjective scale score may indicate only momentary distraction or inattention rather than true fatigue; conversely, if the subjective scale score is high but the PERCLOS value does not reach the threshold, it may reflect temporary discomfort due to psychological factors or other reasons without affecting actual performance. Therefore, the combined subjective and objective evaluation method can more accurately identify ATCOs who are truly in a fatigued state.
After labeling, the dataset contains a total of 12,577 “Drowsy” images and 41,179 “Non-Drowsy” images of various ATCOs, as shown in Figure 6. It is evident that the number of fatigue state images is significantly lower than that of non-fatigue state images, as the experiment induced fatigue states through control tasks. However, an imbalanced dataset can lead to a model bias toward the more numerous non-fatigue category, making it difficult for the model to effectively learn representative features of the fatigue category [31]. To address this, the experiment balanced the number of fatigue and non-fatigue images for each ATCO by discarding non-fatigue images equal to the difference between the non-fatigue and fatigue image counts. Ultimately, the dataset used for model training and validation consists of 25,154 images, with a 1:1 ratio of “Drowsy” to “Non-Drowsy” images.

3.2. CA-C3K2 Module

In fatigue detection for ATCOs, the recognition of fine-grained biometric features in facial regions constitutes a critical factor in constructing deep learning detection models. Research [32] has identified several appearance characteristics across different facial regions during fatigue states, specifically manifested as eyelid puffiness, hyperpigmentation caused by dilated infraorbital venous vasculature, and drooping mouth corners due to decreased muscle tone in facial muscle groups. In actual ATC working environments, ATCOs’ faces are often subjected to complex non-uniform illumination caused by mixed indoor and outdoor light sources, screen glare from equipment, and localized shadows. Such interference tends to cause degradation in feature extraction for the YOLO11 model based on the C3K2 module, leading to blurred features in shadowed areas of ATCOs’ facial images and reduced local contrast. This significantly impairs the model’s discriminative capability for key fine-grained fatigue-related biometric features, such as eyelid puffiness, lower-eyelid pigmentation, and lip-corner drooping.
To address the aforementioned issues, this study proposes the CA-C3K2 module incorporating a channel attention mechanism. The CA-C3K2 module improves upon the C3K2 module used in YOLO11. The original structure of C3K2 is shown in Figure 7. When the parameter C3K is True, the module contains n C3K blocks for extracting key features, as illustrated in Figure 7a; when the parameter C3K is False, C3K2 uses n bottleneck modules instead, as shown in Figure 7b. As a key feature extraction component of YOLO11, the C3K2 module introduces a more flexible feature processing mechanism while inheriting the architecture of the C2f module. When feature map x is input to the module, it first undergoes channel adjustment via the CBS module. Equation (5) represents the mathematical expression of this module.
F conv = σ BN Bottleneck ( X )
In the equation, σ denotes the Silu activation function, and BN represents the batch normalization function. After adjustment by the CBS module, the feature map undergoes channel splitting, forming two processing paths: one portion is directly preserved for final concatenation, while the other passes through n intermediate processing modules. The type of these intermediate modules is determined by the parameter C3K, and the number of modules is determined by the parameter n. The output features from all intermediate modules are concatenated along the channel dimension with the initially preserved features, achieving multi-level feature fusion. However, the Bottleneck/C3K modules within the processing branches of the C3K2 module employ standard convolution operations, lacking an explicit cross-channel attention mechanism. This results in insufficient modeling of inter-channel dependencies. Such a design limits the modeling capability of the C3K2 module regarding feature correlations across channel dimensions, thereby impacting the accuracy of fatigue recognition in complex lighting environments.
To address the problems of fine-grained fatigue facial features and feature degradation under complex illumination interference in the ATCO fatigue detection task, CA-C3K2 modifies the C3K2 module architecture by employing two C3K modules for fatigue feature extraction while incorporating channel attention into each branch. This enables dynamic channel-wise weight adjustment of fatigue features, thereby enhancing cross-channel feature extraction and representation capabilities under complex lighting interference. The structure of CA-C3K2 is illustrated in Figure 7c. The shallow branch captures low-level detail features such as edges and textures, while the deep branch extracts high-level semantic information. Equation (6) provides the mathematical expression of the C3K module, where X H × W × C denotes the input feature map, X 1 , X 2 H × W × C 2 represent the two parts split along the channel dimension, and S e q 3 × 3 signifies a bottleneck sequence using 3 × 3 convolution kernels.
C 3 K ( X ) = F c o n v ( C o n c a t [ X 1 , S e q 3 × 3 ( X 2 ) ] )
CA-C3K2 incorporates the channel attention mechanism via the squeeze-and-excitation (SE) module [33]. This module adaptively adjusts the response intensity of feature channels, thereby enhancing the model’s sensitivity to critical fatigue features. Compared to traditional convolution operations that treat channel information equally, the SE module achieves channel-wise focusing capability for fatigue features in the detection task without significantly increasing computational complexity. The structure of the SE module is shown in Figure 8. The workflow of the module can be divided into three stages: squeeze, excitation, and scale. In the squeeze stage, the input feature map U H × W × C aggregates spatial dimension information via global average pooling (GAP) to generate the channel-wise descriptor z C . Equation (7) provides the mathematical expression of the squeeze operation, where u c ( i , j ) represents the feature value at position (i,j) for channel c, and z c denotes the global statistical descriptor for channel c.
z c = 1 H × W i = 1 H j = 1 W u c ( i , j )
The excitation stage captures nonlinear interdependencies among channels through dimensionality reduction and restoration via a bottleneck structure. First, a fully connected layer reduces the dimensionality of the compressed features. After introducing nonlinear transformations via the ReLU activation function, a second fully connected layer restores the original channel dimensionality. Finally, the Sigmoid function generates the channel attention weight vector s C . The mathematical formula of the excitation operation, which is a Sigmoid function, is expressed as Formula 8, where W 1 C r × C and W 2 C × C r are the weight matrices of the two fully connected layers, r is the dimensionality reduction ratio, and δ is the ReLU activation function.
s = σ ( W 2 δ ( W 1 z ) )
In the feature recalibration stage, the learned weight vector s is multiplied channel by channel with the original input feature map U to obtain the final output. Formula 9 is the mathematical expression of the SE module, where represents channel-by-channel multiplication and GAP is global average pooling.
U ~ = U σ ( W 2 R e L u ( W 1 G A P ( U ) ) )
The proposed CA-C3K2 module adopts a dual-branch channel attention mechanism. The SE module in the shallow branch enhances channel responses to low-level texture features, improving the detection capability for subtle edges and local contrast, while the SE module in the deep branch focuses on suppressing redundant channels weakly correlated with semantic categories. CA-C3K2 modifies the original C3K2 to employ two fixed C3K modules to enhance the model’s feature extraction capability while ensuring computational efficiency, and connects an SE module after each bottleneck layer to incorporate channel attention. Equation (10) presents the mathematical computation of the entire CA-C3K2 module. The input feature map X I n p u t H × W × C first undergoes convolution and activation in the CBS module, then is split along the channel dimension into two parts X 1 , X 2 H × W × C 2 , ultimately yielding the CA-C3K2 module output X O u t p u t .
X O u t p u t = F c o n v ( C o n c a t [ X 1 , S E ( C 3 K ( X 2 ) ) , S E ( C 3 K ( C 3 K ( X 2 ) ) ) ] )
CA-C3K2 enhances cross-channel feature extraction capabilities through a dual-branch channel attention mechanism. Its segregated shallow and deep feature processing pathways improve the model’s perception of information. In the shallow branch, input features first undergo the C3K module for local detail extraction, capturing low-level features such as facial edges and textures. Subsequently, the SE channel attention mechanism is introduced, utilizing global average pooling and fully connected layers to generate a channel weight vector, which quantifies the global intensity of illumination influence on each channel. Feature maps are then recalibrated via channel-wise multiplication, enhancing the response of effective channels sensitive to edges and local contrast of fine-grained fatigue features while suppressing channels affected by shadows or over/under-exposure. This process improves recognition capability for local fatigue features under complex illumination. The deep branch directly reuses intermediate features from the shallow branch, extracting high-level semantic information through a second C3K module. The SE module is used to filter the channels that are strongly related to fatigue semantics and suppresses semantic noise channels introduced by illumination interference, thereby enhancing the recognition capability for ATCOs’ facial movements in complex scenarios. By incorporating the dual-branch channel attention mechanism, the CA-C3K2 module effectively improves the model’s accuracy in identifying fine-grained fatigue features on ATCOs’ faces under complex lighting conditions.

3.3. FF-YOLO Network

This study selects YOLO11 as the baseline model for the ATCO fatigue detection task. The YOLO series, as a classic end-to-end detection network [34], demonstrates strong performance in both high precision and efficiency, better satisfying the requirements for real-time fatigue detection. YOLO11, the latest iteration in the series, employs a keypoint prediction mechanism based on an anchor-free detection paradigm. This approach eliminates the constraints of preset anchor boxes, further enhancing the model’s precision and detection performance. Consequently, it achieves higher accuracy and faster recognition speed for fatigue identification in complex backgrounds. However, the YOLO11 model still exhibits limitations. For instance, the fine-grained features differentiating fatigued and alert ATCOs—such as darkened eyelid regions and micro-muscular movements of facial expressions—cause its accuracy to degrade under varying indoor and outdoor lighting conditions. Additionally, it may misidentify fatigue when ATCOs wear glasses. To address these issues, this paper proposes the FF-YOLO model. The structure of the FF-YOLO model is shown in Figure 9. FF-YOLO optimizes the backbone, neck, head, and loss function based on YOLO11.

3.3.1. Backbone and Neck Network

The FF-YOLO model replaces the original C3K2 modules with CA-C3K2 modules in both the backbone and neck networks to enhance detection accuracy under complex lighting conditions. The CA-C3K2 module augments the parallel convolutional branches of C3K2 by adding a parallel channel attention branch. This branch dynamically weights features across different channels through the squeeze-and-excitation mechanism, thereby emphasizing information from critical channels while suppressing redundant features. In fine-grained feature classification tasks, conventional convolution operations alone struggle to capture key image characteristics. By embedding CA-C3K2 modules into multi-level feature fusion paths, FF-YOLO adaptively calibrates feature channels across different hierarchical levels. This optimization enhances cross-channel semantic correlations during feature fusion, significantly strengthening the model’s capability to extract facial fatigue features in complex scenarios like dim lighting.

3.3.2. Head Network with Spatial–Channel Attention Mechanism

In the ATCO fatigue detection task, key fatigue features in facial images can lead to reduced detection accuracy due to interference from factors such as glasses occlusion and head rotation. Although the traditional YOLO11 model possesses object detection capabilities, it struggles to effectively differentiate differential responses in channel dimensions for fatigue-related features like darkened lower eyelid pigmentation and drooping mouth corners under interference conditions such as occlusion and rotation. Additionally, it lacks dynamic focus capability on target spatial regions, causing subtle facial fatigue features to be overlooked. To address this, this study embeds the convolutional block attention module (CBAM) [35] at the neck level of the YOLO11 network.
The overall architecture of CBAM adopts a cascaded dual-attention mechanism, as shown in Figure 10a. Its processing flow follows a “channel-first, spatial-second” cascading paradigm: the input feature tensor first passes through the channel attention module (CAM) to generate a channel-wise attention weight matrix. This adjusts the channel attention weights of the original features via Hadamard product operations, achieving dynamic scaling of the feature map in the channel dimension and strengthening activation responses for task-relevant channels. Subsequently, the channel-optimized feature tensor is fed into the spatial attention module (SAM), which performs dynamic weight modulation on the same positions across multiple channels of the feature map using a spatial dimension weight map, suppressing background noise and enhancing semantic responses in target regions. The synergistic effect of these two submodules forms a staged feature optimization mechanism, where channel attention filters key feature channels through global statistical modeling, while spatial attention focuses on semantically salient regions based on local contextual relationships. This design aligns with the cognitive logic of “feature filtering-spatial localization”. The entire CBAM achieves feature selection in channel and spatial dimensions through two independent yet complementary attention operations while preserving the topological structure of the original feature map. This dual-attention collaborative mechanism enhances the model’s feature representation capability with only a minor increase in parameters.
The architecture of the CBAM is shown in Figure 10b. The module first performs spatial compression operations on the input feature tensor X H × W × C , using global average pooling and global maximum pooling. The feature representations formed by the two concatenate constitute the channel descriptor. The two-way feature is then fed into a multi-layer perceptron (MLP) with shared weights, which implements dimensionality reduction–nonlinear transformation–dimensionality increase operations through a bottleneck structure. After being processed by the two-way feedforward network, the feature vector achieves information aggregation through element-by-element summation and generates channel attention weights through the Sigmoid activation function. The mathematical expression of the channel attention mechanism weight M C 1 × 1 × C in the CBAM is shown in Formula 11.
M C ( X ) = σ ( M L P ( A v g P o o l ( X ) ) + M L P ( M a x P o o l ( X ) ) )
The spatial attention module (SAM) in CBAM dynamically adjusts feature response weights at different spatial positions by modeling spatial dimension relationships within the feature map, thereby guiding the model to focus on salient regions. Its core processing flow is shown in Figure 10c, with the mathematical expression for the spatial attention weight M S H × W × 1 given in Equation (12). Similar to channel attention, the CBAM performs global average pooling and max pooling operations on the channel-attention-enhanced input feature map X H × W × C along the channel dimension, generating two 2D feature maps. The former reflects the average activation intensity at each spatial position, while the latter captures locally salient response features. Subsequently, these two feature maps are concatenated along the channel dimension to form a composite feature descriptor with two channels. This composite feature is then mapped into an attention weight map through a convolutional operation f 7 × 7 with a 7 × 7 kernel size for nonlinear transformation. Finally, the result is normalized to the [0, 1] range via the Sigmoid function to form the final spatial attention weight map.
M S ( X ) = σ ( f 7 × 7 ( C o n c a t [ A v g P o o l ( X ) ) , M a x P o o l ( X ) ] ) )
In the network architecture of FF-YOLO, the CBAM is embedded into the detection head section. As shown in Figure 9, the model incorporates a spatial–channel collaborative attention mechanism at each detection head level, achieving hierarchical calibration and enhancement of multi-scale fatigue features. This design addresses cross-level information fusion issues while improving localization accuracy for facial key regions such as eye sockets and mouth corners through spatial attention, thereby enhancing the model’s capability to capture low-contrast, small-scale fatigue features under occlusion or deflection interference. The model first weights the channel dimension of feature maps via the channel attention module, then weights the spatial dimension of the channel-attention-weighted feature maps through the spatial attention module. This channel–spatial attention fusion mechanism enables the FF-YOLO network to more precisely capture target spatial locations and channel features, consequently strengthening recognition capability for facial fatigue features under occlusion and head rotation interference.

3.3.3. MPDIoU Loss Function

In facial fatigue detection tasks, bounding boxes need to cover dynamically changing facial regions. When the head moves closer to or farther from the camera, detection targets with identical aspect ratios but varying scales are formed. YOLO11 employs the CIoU regression loss function, which optimizes bounding box regression by introducing a center point offset penalty and aspect ratio constraints [36]. However, its aspect ratio penalty term becomes ineffective when predicted and ground-truth boxes share identical aspect ratios, leading to reduced regression efficiency for targets with significant scale differences [37]. Given this, FF-YOLO replaces the CIoU function in YOLO11 with the MPDIoU loss function.
Minimum Point Distance Intersection over Union (MPDIoU) is a loss function designed for bounding box regression tasks [38]. It optimizes geometric similarity measurement by directly minimizing the distances between the top-left and bottom-right corner points of predicted boxes and ground-truth boxes. As shown in Figure 11, the blue box A represents the true box, while the yellow box B represents the predicted box. The MPDIoU loss function calculates the distance d 1 between the top-left corners of boxes A and B, using the squared distance d 1 2 for computational simplicity as specified in Equation (13) [38]. Similarly, it calculates the distance d 2 between the bottom-right corners of boxes A and B, using the squared distance d 2 2 as defined in Equation (14) [38]. The MPDIoU metric is computed based on Equation (15) [38], where w and h represent the width and height of the input image, respectively. The MPDIoU-based loss function is given by Equation (16) [38].
d 1 2 = ( x 1 B x 1 A ) 2 + ( y 1 B y 1 A ) 2
d 2 2 = ( x 2 B x 2 A ) 2 + ( y 2 B y 2 A ) 2
M P D I o U = A B A B d 1 2 w 2 + h 2 d 2 2 w 2 + h 2
L M P D I o U = 1 M P D I o U

3.4. Experimental Environment and Parameter Settings

The ATCO facial image dataset was utilized for training and testing the FF-YOLO model, with images and labels divided into training, validation, and test sets in a 6:2:2 ratio. Specifically, the training set comprises 15,092 images, the validation set contains 5031 images, and the test set consists of 5031 images. The detailed distribution of images across different categories within each subset is presented in Table 3. The experimental environment used in this study is detailed in Table 4. Hyperparameter settings are listed in Table 5.

3.5. Evaluation Metrics

To compare model accuracy, this paper employs the evaluation metrics precision (P), recall (R), mAP@50, and mAP@50-95. Additionally, the P-R curves of different models are compared. Precision (P) is a metric that measures the predictive accuracy of a classification model, reflecting the proportion of actual positive samples among all samples predicted as positive. It is calculated as the ratio of true positives (TP) to the sum of true positives (TP) and false positives (FP). Equation (17) presents the calculation formula for precision, where TP is the number of samples correctly predicted as positive, FP is the number of samples incorrectly predicted as positive, TN is the number of samples correctly predicted as negative, and FN is the number of samples incorrectly predicted as negative [39].
P r e c i s i o n = T P T P + F P × 100 %
Recall (R) is a metric that measures a classification model’s ability to identify positive samples, reflecting the proportion of actual positive samples correctly identified by the model among all actual positive samples. Equation (18) presents the calculation formula for recall. It is calculated as the ratio of true positives (TP) to the sum of true positives (TP) and false negatives (FN) [40].
R e c a l l = T P T P + F N × 100 %
The P-R curve is a plot with recall on the horizontal axis and precision on the vertical axis [41]. In evaluating the performance of facial fatigue detection models, single-point metrics of precision (P) and recall (R) can only reflect the local performance of the model under a specific classification threshold. In contrast, the precision–recall curve (P-R curve) establishes a functional mapping between precision and recall by traversing all possible classification thresholds, quantifying the decision boundary characteristics of the model across the entire threshold domain and avoiding evaluation bias caused by threshold sensitivity. The shape characteristics of the P-R curve reflect the degree of optimization of the classifier’s decision boundary in the feature space, and the convexity variations in the curve morphology can indicate the discriminability of hard samples. The P-R curve can also characterize the model’s class discrimination capability through the area under the curve (AUC), known as the average precision (AP) value. A higher AP indicates better comprehensive performance of the model under different combinations of precision and recall.
Mean average precision (mAP) is an evaluation metric used in object detection to assess model performance, calculating the mean of the average precision across different classes [42]. Specifically, mAP@50 denotes the mean average precision computed at an intersection over union (IoU) threshold of 0.5, primarily measuring the model’s detection capability under that specific overlap degree. Meanwhile, mAP@50-95 represents the average of multiple mean average precision values computed at IoU thresholds ranging from 0.5 to 0.95 (with a step size of 0.05), providing a more comprehensive assessment of the model’s overall performance under varying detection difficulties.

4. Results

4.1. FF-YOLO Network Performance

Figure 12 presents the evolution of key performance metrics for the FF-YOLO model during both training and validation. The left panel of Figure 12 shows that the six kinds of loss metrics, comprising localization loss and classification loss on both the training set and the validation set, consistently decrease as the number of iterations increases. These losses approach stable values around 100 epochs, demonstrating that the model is effectively optimized during training, and its fitting capability improves. This optimization enhances the model’s ability to localize ATCO faces and to classify fatigue states. Concurrently, the right panel of Figure 12 indicates a consistent increase in the model’s precision, recall, and mAP with progressive training iterations. This trend confirms that the model learns more fatigue features from the training data, reducing prediction errors. Consequently, the model’s capability to detect ATCO fatigue is progressively enhanced. The experimental results show that the improved FF-YOLO model performs well in the task of ATCO fatigue detection, with a precision of 83.8%, a recall rate of 73.9%, and average precision mAP@50 and mAP@50-95 of 94.2% and 74.7%, respectively. Overall, the experimental results confirm the effectiveness of the improved FF-YOLO model for ATCO fatigue detection.
Figure 13 shows the detection results of the FF-YOLO model in different scenarios. Figure 13a shows the detection results under daylight conditions, and FF-YOLO successfully detects the fatigue of the ATCO. Figure 13b shows the detection effect under glasses occlusion conditions, and the model can effectively identify fatigue. Figure 13c shows the detection ability under indoor lighting conditions at night. It can be seen that the indoor light is brighter and the outdoor light is dim, which makes the facial features of the controller darker and more blurred. In this case, FF-YOLO still accurately detects the fatigue state of the ATCO. Figure 13d shows that the model can correctly identify fatigue when the head is tilted.

4.2. Ablation Experiment

The FF-YOLO model proposed in this paper is based on YOLO11n and introduces three different improvements. To verify the effectiveness of each improvement in the FF-YOLO model, ablation experiments of the three improved modules were conducted on the ATCO facial fatigue dataset. The experimental results are shown in Table 6, where “×” indicates that a specific module is not used and “√” indicates that the module is used. In Table 6, YOLO-CA denotes YOLO11n with the CA-C3K2 module; YOLO-C refers to YOLO11n incorporating the CBAM in its head network; YOLO-M represents YOLO11n using the MPDIoU loss function; and FF-YOLO combines all three improvements.
Table 6 provides the precision, recall, mAP@50, and mAP@50-95 values of each ablation model. It can be seen that after YOLO-CA replaced all C3K2 modules in YOLO11 with CA-C3K2, mAP@50 and mAP@50-95 increased by 10.4% and 11.3%, respectively, precision increased by 1.1%, and recall increased by 6.2%, at a 24% computational cost. This improvement primarily stems from the channel attention mechanism within the CA-C3K2 module, which dynamically recalibrates channel-wise feature responses. By emphasizing informative channels and suppressing less useful ones, the module enhances fine-grained fatigue feature extraction capability under complex illumination conditions. The model parameter increase is attributed to the replacement of all original C3K2 modules in YOLO11n with CA-C3K2 counterparts, where the latter exhibits marginally higher structural complexity while being extensively employed throughout the network architecture. After YOLO-C added the CBAM attention mechanism to each detection head of the head network, mAP@50 and mAP@50-95 increased by 11.9% and 8.5%, respectively, precision increased by 1.4%, and recall increased by 3.9%. This is attributed to the fact that CBAM can integrate the spatial and channel features of fatigue, improving the model’s fatigue detection ability under occlusion and head deflection. After YOLO-M replaced the original CIoU loss function with the MPDIoU loss function, although the precision dropped by 0.5%, the recall rate increased by 0.4%, and the mAP@50 and mAP@50-95 increased by 2.2% and 0.6%, respectively, while the number of parameters and computational complexity remained unchanged. This shows that the MPDIoU loss function can effectively improve the detection accuracy of the model without affecting detection performance. By integrating all aforementioned enhancement mechanisms, the FF-YOLO model improved mAP@50, mAP@50-95, precision, and recall by 13.7%, 11.6%, 0.6% and 5.9%, respectively, at a 24% additional computational cost, compared with the original YOLO11n model. Ablation experiments demonstrate that each enhancement contributes positively to model performance, validating the effectiveness of the FF-YOLO architecture. The FF-YOLO elevates ATCO fatigue detection accuracy in complex environments as a practical non-intrusive monitoring solution.
Figure 14 shows the P-R curves of each ablation model. Each figure contains the positive and negative samples and the overall P-R curve of the corresponding model. The positive and negative sample curves of the YOLO11n model are clearly separated, and the right half is obviously concave, indicating that the recognition ability of fatigue samples is poor and the model feature discrimination is insufficient; the positive and negative sample curves of the YOLO-CA model are closely adjacent and close to the upper right protrusion, indicating that the model has greatly improved its feature recognition ability after using the CA-C3K2 module, and can capture the distinguishing features of two types of samples at the same time; the overall curve of the YOLO-C model is closer to the upper right than YOLO-CA, but the positive and negative sample curves are separated to a certain extent, indicating that the overall performance of the model is excellent but there is a category bias. The positive and negative sample curves of the YOLO-M model are closer than those of YOLO11n, indicating that the optimization of the loss function helps the model learn the features of different types of samples. The FF-YOLO model curve is the best among them. It is closer to the upper right corner than YOLO-CA, and the distance between the positive and negative sample curves is closer than that of the YOLO-C model, and the AP is also the largest. This shows that FF-YOLO can combine the advantages of various improvements, has strong overall performance, and is more balanced in identifying different categories, which is a significant improvement over YOLO11n.
Figure 15 compares the performance of YOLO11n and FF-YOLO in the precision curve, recall curve, mAP@50 curve, and loss curve. It can be clearly seen that the improved model has significant improvements in the three key indicators of recall rate, mAP@50, and training loss. Although FF-YOLO only improves 0.6% over YOLO11n in terms of precision, it has achieved a 5.9% improvement in recall, which shows that FF-YOLO has enhanced the feature extraction capability through CA-C3K2, improved the model’s recognition ability for blurred samples under light interference, and reduced the missed detection rate. At the same time, the mAP@50 value increased by 13.7%, which also shows that the introduction of the spatial–channel attention mechanism in the neck area can enhance the model’s generalization ability for occluded samples, and can more accurately detect fatigue status when glasses are occluded. It can be seen from Figure 15 that the LOSS value of the FF-YOLO model decreases significantly faster than that of YOLO11n. This is because FF-YOLO uses the MPDIoU loss function, which makes the model converge faster. These improvements fully demonstrate that the FF-YOLO model has better performance and stronger detection capabilities in the task of controller fatigue detection.
The ablation experiment results show that each improvement has a positive impact on the performance of different aspects of the model, verifying the effectiveness of the FF-YOLO model design.

5. Discussion

To address the issues of poor real-time performance with subjective methods, interference with ATCO operations from intrusive methods, and insufficient anti-interference capability of machine learning methods in air traffic controller fatigue detection, this study proposes FF-YOLO, an improved deep learning approach based on facial image features using YOLO11n. First, a facial image dataset of ATCOs under radar control scenarios was constructed, containing facial data from 10 ATCOs. Fatigue states were annotated through subjective fatigue scale ratings and PERCLOS metrics, with category balancing applied to ultimately obtain a dataset of 25,154 fatigue facial images containing an equal number of positive and negative class samples. To enhance detection capability for ATCO facial fatigue features, a CA-C3K2 module was proposed to replace the original C3K2 module. Additionally, a CBAM was incorporated into the network head section to improve detection performance for occluded facial fatigue features. Finally, the original CIoU loss function was replaced with MPDIoU to accelerate model convergence and enhance detection capability for facial images of varying sizes. Experimental results show that the mAP@50, mAP@50-95, precision, and recall of the FF-YOLO model reach 94.2%, 74.7%, 83.8%, and 73.8%, respectively, which are 13.7%, 11.6%, 0.6%, and 5.9% higher than those of YOLO11n. The model can correctly detect ATCO fatigue under conditions of complex light interference, facial occlusion, and facial deflection. The current study has limitations in the current dataset’s scale and diversity, as it comprises fatigue states from only 10 controllers. To strengthen the model’s generalizability, future research will expand the dataset to include larger and more diverse ATCO populations across multiple operational environments. It will further validate the model’s generalizability and robustness in real-world applications and support future work on model improvement.

Author Contributions

Conceptualization, S.T. and W.P.; methodology, S.T.; software, S.T. and L.D.; validation, S.T. and Q.Z.; formal analysis, S.T. and L.D.; investigation, S.T. and. Q.Z.; resources, W.P.; data curation, S.T., L.D., and Y.Z.; writing—original draft preparation, S.T.; writing—review and editing, L.D. and Q.Z.; visualization, S.T. and Y.Z.; supervision, W.P.; project administration, S.T.; funding acquisition, W.P. All authors have read and agreed to the published version of the manuscript.

Funding

This research was funded by the National Natural Science Foundation of China (U2333209), the Key Laboratory of Flight Techniques and Flight Safety CAAC (F2024KF11C), the Fundamental Research Funds for the Central Universities (24CAFUC01002), and the Civil Aircraft Fire Science and Safety Engineering Key Laboratory of Sichuan Province (MZ2024JB01).

Institutional Review Board Statement

The study was conducted in accordance with the Declaration of Helsinki, and approved by the Ethics Committee of the Civil Aviation Flight University of China.

Informed Consent Statement

Informed consent was obtained from all subjects involved in the study. Written informed consent has been obtained from the patients to publish this paper.

Data Availability Statement

The data collected and annotated in this study are not publicly available due to confidentiality agreements and privacy protection concerns for the participants. For requests to access the dataset, please contact the corresponding author at shijie__tan@163.com.

Conflicts of Interest

The authors declare no conflicts of interest.

Abbreviations

The following abbreviations are used in this manuscript:
ATCAir traffic control
ATCOAir traffic controller
FF-YOLOFacial-Features-YOLO
CFSChalder Fatigue Scale
NASA-TLXNASA-Task Load Index
CAACCivil Aviation Administration of China
EAREye Aspect Ratio
MARMouth Aspect Ratio
CA-C3K2Channel-Attention-C3K2
SESqueeze-and-Excitation
CBAMConvolutional Block Attention Module
CAMChannel Attention Module
SAMSpatial Attention Module
P-R CurvePrecision–Recall Curve

References

  1. Schuver-van Blanken, M.; Huisman, H.; Roerdink, M. The ATC Cognitive Process & Operational Situation Model. In Proceedings of the European Association for Aviation Psychology Conference, Budapest, Hungary, 20 September 2010. [Google Scholar]
  2. Zhang, J.; Chen, Z.; Liu, W.; Ding, P.; Wu, Q. A field study of work type influence on air traffic controllers’ fatigue based on data-driven PERCLOS detection. Int. J. Environ. Res. Public Health 2021, 18, 11937. [Google Scholar] [CrossRef] [PubMed]
  3. Li, W.C.; Kearney, P.; Zhang, J.; Hsu, Y.L.; Braithwaite, G. The analysis of occurrences associated with air traffic volume and air traffic controllers’ alertness for fatigue risk management. Risk Anal. 2021, 41, 1004–1018. [Google Scholar] [CrossRef] [PubMed]
  4. Pan, H.; Hu, Y.; Wang, Y.; Duong, V. Fatigue Detection in Air Traffic Controllers: A Comprehensive Review; IEEE Access: Piscataway, NJ, USA, 2024. [Google Scholar]
  5. Mélan, C.; Cascino, N. Contrasting effects of work schedule changes and air traffic intensity on ATCOs’ fatigue, stress and quality of life. In Proceedings of the 33rd Conference of the European Association of Aviation Psychology, Dubrovnik, Croatia, 24–28 September 2018. [Google Scholar]
  6. Yen, J.R.; Hsu, C.C.; Ho, H.; Lin, F.F.; Yu, S.H. Identifying flight fatigue factors: An econometric modeling approach. J. Air Transp. Manag. 2005, 11, 408–416. [Google Scholar] [CrossRef]
  7. Pettersson, M.; Westgren, O. Staff Scheduling in ACC at ATCC Stockholm. Master’s Thesis, Linköping University Electronic Press, Linköping, Sweden, 2013; pp. 12–14. [Google Scholar]
  8. Chalder, T.; Berelowitz, G.; Pawlikowska, T.; Watts, L.; Wessely, S.; Wright, D.; Wallace, E.P. Development of a fatigue scale. J. Psychosom. Res. 1993, 37, 147–153. [Google Scholar] [CrossRef]
  9. Mohanavelu, K.; Lamshe, R.; Poonguzhali, S.; Adalarasu, K.; Jagannath, M. Assessment of human fatigue during physical performance using physiological signals: A review. Biomed. Pharmacol. J. 2017, 10, 1887–1896. [Google Scholar] [CrossRef]
  10. Liang, Q.; Xu, L.; Bao, N.; Qi, L.; Shi, J.; Yang, Y.; Yao, Y. Research on non-contact monitoring system for human physiological signal and body movement. Biosensors 2019, 9, 58. [Google Scholar] [CrossRef]
  11. Hooda, R.; Joshi, V.; Shah, M. A comprehensive review of approaches to detect fatigue using machine learning techniques. Chronic Dis. Transl. Med. 2022, 8, 26–35. [Google Scholar] [CrossRef]
  12. Hart, S.G.; Staveland, L.E. Development of NASA-TLX (Task Load Index): Results of empirical and theoretical research. In Advances in Psychology; North-Holland: Amsterdam, The Netherlands, 1988; Volume 52, pp. 139–183. [Google Scholar]
  13. Triyanti, V.; Azis, H.A.; Iridiastadi, H. Workload and fatigue assessment on air traffic controller. In Proceedings of the 12th ISIEM (International Seminar on Industrial Engineering & Management): “Industrial Intelligence System on Engineering, Information, and Management”, Batu, Malang, East Java, Indonesia, 17–19 March 2020; Volume 847, No. 1. p. 012087. [Google Scholar]
  14. Hu, F.; Zhang, L.; Yang, X.; Zhang, W.A. EEG-Based driver Fatigue Detection using Spatio-Temporal Fusion network with brain region partitioning strategy. IEEE Trans. Intell. Transp. Syst. 2024, 25, 9618–9630. [Google Scholar] [CrossRef]
  15. Zhao, Y.; Xie, K.; Zou, Z.; He, J.B. Intelligent recognition of fatigue and sleepiness based on inceptionV3-LSTM via multi-feature fusion. Ieee Access 2020, 8, 144205–144217. [Google Scholar] [CrossRef]
  16. Mu, S.; Liao, S.; Tao, K.; Shen, Y. Intelligent fatigue detection based on hierarchical multi-scale ECG representations and HRV measures. Biomed. Signal Process. Control 2024, 92, 106127. [Google Scholar] [CrossRef]
  17. Li, Q.; Ng, K.K.; Simon, C.M.; Yiu, C.Y.; Li, F.; Chan, F.T. Using EEG and eye-tracking as indicators to investigate situation awareness variation during flight monitoring in air traffic control system. J. Navig. 2025, 77, 485–506. [Google Scholar] [CrossRef]
  18. Fu, S.; Yang, Z.; Ma, Y.; Li, Z.; Xu, L.; Zhou, H. Advancements in the intelligent detection of driver fatigue and distraction: A comprehensive review. Appl. Sci. 2024, 14, 3016. [Google Scholar] [CrossRef]
  19. Zhao, G.; He, Y.; Yang, H.; Tao, Y. Research on fatigue detection based on visual features. IET Image Process. 2022, 16, 1044–1053. [Google Scholar] [CrossRef]
  20. Chen, Z.; Zhang, X.; Li, J.; Ni, J.; Chen, G.; Wang, S.; Fan, F.; Wang, C.C.; Li, X. Machine vision detection to daily facial fatigue with a nonlocal 3D attention network. arXiv 2021, arXiv:2104.10420. [Google Scholar]
  21. Khan, S.A.; Hussain, S.; Xiaoming, S.; Yang, S. An effective framework for driver fatigue recognition based on intelligent facial expressions analysis. IEEE Access 2018, 6, 67459–67468. [Google Scholar] [CrossRef]
  22. Li, X.; Li, X.; Shen, Z.; Qian, G. Driver fatigue detection based on improved YOLOv7. J. Real-Time Image Process. 2024, 21, 75. [Google Scholar] [CrossRef]
  23. Zhao, S.; Peng, Y.; Wang, Y.; Li, G.; Al-Mahbashi, M. Lightweight YOLOM-Net for Automatic Identification and Real-Time Detection of Fatigue Driving. Comput. Mater. Contin. 2025, 82, 4995–5017. [Google Scholar] [CrossRef]
  24. Yu, N.; Yin, X.; Li, B.; Zhang, X.; Meng, J. Fatigue Driving Recognition Method Based on Improved GD-YOLO. In Proceedings of the 2024 8th Asian Conference on Artificial Intelligence Technology (ACAIT), Fuzhou, China, 8–10 November 2024; IEEE: Piscataway, NJ, USA, 2024; pp. 828–834. [Google Scholar]
  25. Arsintescu, L.; Chachad, R.; Gregory, K.B.; Mulligan, J.B.; Flynn-Evans, E.E. The relationship between workload, performance and fatigue in a short-haul airline. Chronobiol. Int. 2020, 37, 1492–1494. [Google Scholar] [CrossRef]
  26. Grier, R.A. How high is high? A meta-analysis of NASA-TLX global workload scores. In Proceedings of the Human Factors and Ergonomics Society Annual Meeting; Sage Publications: Los Angeles, CA, USA, 2015; Volume 59, No. 1. pp. 1727–1731. [Google Scholar]
  27. Wierwille, W.; Tijerina, L.; Glecker, M.; Duane, S.; Johnston, S.; Goodman, M. PERCLOS: A Valid Psychophysiological Measure of Alertness As Assessed by Psychomotor Vigilance; United States Federal Motor Carrier Safety Administration: Washingtone, DC, USA, 1998. [Google Scholar]
  28. King, D.E. Dlib-ml: A machine learning toolkit. J. Mach. Learn. Res. 2009, 10, 1755–1758. [Google Scholar]
  29. Soukupova, T.; Cech, J. Eye blink detection using facial landmarks. In Proceedings of the 21st Computer Vision Winter Workshop, Rimske Toplice, Slovenia, 3–5 February 2016; Volume 2, p. 4. [Google Scholar]
  30. Wierwille, W.W.; Ellsworth, L.A. Evaluation of driver drowsiness by trained raters. Accid. Anal. Prev. 1994, 26, 571–581. [Google Scholar] [CrossRef]
  31. Kumar, P.; Bhatnagar, R.; Gaur, K.; Bhatnagar, A. Classification of imbalanced data: Review of methods and applications. IOP Conf. Ser. Mater. Sci. Eng 2021, 1099, 012077. [Google Scholar] [CrossRef]
  32. Chen, Y.; Liu, W.; Zhang, L.; Yan, M.; Zeng, Y. Hybrid facial image feature extraction and recognition for non-invasive chronic fatigue syndrome diagnosis. Comput. Biol. Med. 2015, 64, 30–39. [Google Scholar] [CrossRef] [PubMed]
  33. Hu, J.; Shen, L.; Sun, G. Squeeze-and-excitation networks. In Proceedings of the IEEE Conference on Computer Vision and Pattern Recognition, Salt Lake City, UT, USA, 18–22 June 2018. [Google Scholar]
  34. Khanam, R.; Hussain, M. Yolov11: An overview of the key architectural enhancements. arXiv 2024, arXiv:2410.17725. [Google Scholar]
  35. Woo, S.; Park, J.; Lee, J.Y.; Kweon, I.S. Cbam: Convolutional block attention module. In Proceedings of the European Conference on Computer Vision (ECCV), Munich, Germany, 8–14 September 2018; pp. 3–19. [Google Scholar]
  36. Zheng, Z.; Wang, P.; Liu, W.; Li, J.; Ye, R.; Ren, D. Distance-IoU loss: Faster and better learning for bounding box regression. In Proceedings of the AAAI Conference on Artificial Intelligence, New York, NY, USA, 7–12 February 2020; Volume 34, No. 7. pp. 12993–13000. [Google Scholar]
  37. Du, S.; Zhang, B.; Zhang, P.; Xiang, P. An improved bounding box regression loss function based on CIOU loss for multi-scale object detection. In Proceedings of the 2021 IEEE 2nd International Conference on Pattern Recognition and Machine Learning (PRML), Chengdu, China, 16–18 July 2021; pp. 92–98. [Google Scholar]
  38. Ma, S.; Xu, Y. Mpdiou: A loss for efficient and accurate bounding box regression. arXiv 2023, arXiv:2307.07662. [Google Scholar]
  39. Brown, P.F.; Cocke, J.; Della Pietra, S.A.; Della Pietra, V.J.; Jelinek, F.; Lafferty, J.; Mercer, R.L.; Roossin, P.S. A statistical approach to machine translation. Comput. Linguist. 1990, 16, 79–85. [Google Scholar]
  40. Schütze, H.; Manning, C.D.; Raghavan, P. Introduction to Information Retrieval; Cambridge University Press: Cambridge, UK, 2008; Volume 39, pp. 234–265. [Google Scholar]
  41. Davis, J.; Goadrich, M. The relationship between Precision-Recall and ROC curves. In Proceedings of the 23rd International Conference on Machine Learning, Pittsburgh, PA, USA, 25–29 June 2006; pp. 233–240. [Google Scholar]
  42. Lin, T.Y.; Maire, M.; Belongie, S.; Hays, J.; Zitnick, C.L. Microsoft coco: Common objects in context, European Conf. In Computer Vision; Springer: Cham, Germany, 2014; pp. 740–755. [Google Scholar]
Figure 1. ATCO facial data collection environment.
Applsci 15 07503 g001
Figure 2. Extracted facial images of ATCOs.
Applsci 15 07503 g002
Figure 3. NASA-TLX subjective scale evaluation example for ATCOs.
Applsci 15 07503 g003
Figure 4. Selected eye key points. Subfigure (a) shows the positioning of the key points of the eyes when not wearing glasses; Subfigure (b) shows the positioning of the key points of the eyes when wearing glasses and looking directly at the screen. It can be found that although there is a deviation in this case, the impact is minimal.
Applsci 15 07503 g004
Figure 5. Illustration of the EAR calculation method based on six key points.
Applsci 15 07503 g005
Figure 6. Comparison of the original number of positive and negative class images in the dataset.
Applsci 15 07503 g006
Figure 7. Comparison of module structures between C3K2 and CA-C3K2. Subfigure (a) is the structure diagram of the C3K2 module when the C3K parameter is True; Subfigure (b) is the structure diagram of the C3K2 module when the C3K parameter is False; Subfigure (c) is the structure diagram of the CA-C3K2 proposed in this study. The number of C3K modules in Subfigure (a) and the number of Bottleneck modules in Subfigure (b) are both determined by the parameter n.
Applsci 15 07503 g007
Figure 8. SE module working mechanism.
Applsci 15 07503 g008
Figure 9. FF-YOLO network architecture.
Applsci 15 07503 g009
Figure 10. CBAM composition structure. Subfigure (a) is the structural diagram of the CBAM module. The input features first pass through the Channel Attention Module, and its internal structure is shown in Subfigure (b). The intermediate features then pass through the Spatial Attention Module, and its internal structure is shown in Subfigure (c).
Applsci 15 07503 g010aApplsci 15 07503 g010b
Figure 11. Schematic diagram of MPDIoU loss function.
Applsci 15 07503 g011
Figure 12. Experimental results of the FF-YOLO model.
Applsci 15 07503 g012
Figure 13. Controller fatigue detection results under different conditions. Subfigure (a) is under daylight conditions, Subfigure (b) is when ATCO wearing glasses, Subfigure (c) is under indoor lighting conditions at night, and Subfigure (d) is when ATCO’s head is tilted.
Applsci 15 07503 g013
Figure 14. P-R curves of ablation models.
Applsci 15 07503 g014aApplsci 15 07503 g014b
Figure 15. Comparison of training phase performance metrics between FF-YOLO and YOLO11n Models. Subfigure (a) illustrates the variation of Precision metric of the two models with the increase of training epochs. Subfigure (b) depicts the change of Recall metric. Subfigure (c) depicts the change of mAP@50 metric. Subfigure (d) depicts the change of Loss value.
Applsci 15 07503 g015
Table 1. Specific time schedule of each shift.
ShiftsTime Periods
Morning8:30~11:30
Afternoon14:30~17:30
Evening19:30~21:00
Table 2. NASA-TLX scale content and weights.
DimensionsDescriptionsWeights
Mental DemandThe amount of mental and perceptual effort required, such as thinking, deciding, calculating, remembering, observing, and searching. Was the task straightforward or challenging, simple or complex?0.26
Physical DemandThe level of physical effort needed, including activities like pushing, pulling, turning, and controlling. Was the task physically easy or hard, slow or fast, relaxed or strenuous?0.07
Temporal DemandThe sense of time pressure due to the task’s pace. Did you feel the task was leisurely or rushed, slow or fast-paced?0.2
PerformanceYour perceived success in achieving the task objectives. How well did you think you performed in meeting the goals of the task?0.07
EffortThe amount of mental and physical effort you had to exert to achieve your performance level. How hard did you have to work to accomplish the task?0.33
Frustration LevelThe degree of stress, irritation, and annoyance you felt during the task. Did you feel secure, satisfied, content, relaxed, or did you feel insecure, discouraged, irritated, stressed, and annoyed?0.07
Table 3. Distribution of image categories in different subsets.
SubsetsDrowsyNon-Drowsy
Training75467546
Validation25152516
Test25162515
Table 4. Experimental environment configuration.
Environment ConfigurationParameter
Operating systemWindows 11
CPUIntel(R) Core(TM) i5-8300H @2.30 GHz

(Intel, Santa Clara, CA, USA)
GPUNVIDIA GeForce GTX 1060

(NVIDIA, Santa Clara, CA, USA)
Memory16,384 MB RAM
FramePytorch 2.3.1
Operating platformCUDA 12.1
Programming languagePython 3.12.4
Table 5. Hyperparameter configuration.
HyperparameterParameter
Epochs100
Warmup-epochs3
Batch size2
OptimizerSGD
Input image size928
Initial learning rate0.01
Momentum0.937
Table 6. Performance comparison of ablation models.
ModelCA-C3K2CBAMMPDIoUmAP@50 (%)mAP@50-95 (%)P (%)R (%)ParametersFLOPs

(G)
YOLO11n×××80.563.183.267.92,582,3476.3
YOLO-CA××90.974.484.374.13,220,1297.6
YOLO—C××92.471.684.671.82,582,5426.3
YOLO—M××82.763.782.768.32,582,3476.3
FF-YOLO (ours)94.274.783.873.83,220,3247.6
“√” indicates the corresponding module is used in the model. And “×” indicates the module is not used in the model. Bold values denote the best-performing model’s score for each metric.
Disclaimer/Publisher’s Note: The statements, opinions and data contained in all publications are solely those of the individual author(s) and contributor(s) and not of MDPI and/or the editor(s). MDPI and/or the editor(s) disclaim responsibility for any injury to people or property resulting from any ideas, methods, instructions or products referred to in the content.

