Featured Application
This paper presents a model to study the effects of Joule heating on grounding electrodes under fault conditions. An analysis of these effects can contribute to reinforcing and improving the performance of such protection systems.
Abstract
This paper presents a numerical study of the thermal behavior of grounding electrodes subjected to fault currents, focusing on Joule heating within both the electrode and the surrounding soil. A one-dimensional transient model is developed, accounting for heat generation due to both internal resistance in the electrode and current leakage into the soil. The model incorporates the temperature dependence of electrical resistivity, particularly emphasizing the nonlinear and material-specific behavior observed in soils, as captured by three different resistivity models. The temperature–resistivity coupling induces a feedback mechanism that dynamically alters the current distribution and the resulting temperature profiles. A numerical procedure was implemented to simulate this process, following a computational flowchart that captures the interaction between thermal and electrical fields over time. The model was applied to synthetic test cases involving different soil types, segmentation strategies, and resistivity behaviors. The results reveal significant differences between resistivity models, affecting both the magnitude and distribution of grounding potential and temperature fields. In particular, elevated temperatures were observed in regions where current density concentrates—such as corners and exposed ends of the electrode—highlighting the need for targeted reinforcement to prevent thermal degradation. The proposed model provides a practical tool for evaluating the thermal performance of grounding systems under extreme conditions, offering insight into design optimization and material selection.
1. Introduction
Grounding electrodes are essential components in electrical power systems, serving as critical pathways for dissipating fault currents safely into the earth. Their effectiveness is key to ensuring personnel safety, protecting equipment, and maintaining system stability. However, under fault conditions, grounding electrodes experience substantial thermal and electrical stress due to Joule heating, which can significantly impact their performance and the overall system potentials [1,2,3].
Joule heating, also known as resistive heating, occurs when electrical current passes through a conductor, generating heat due to the material resistance. In grounding electrodes, this phenomenon can cause a temperature increase that affects soil conductivity, electrode integrity, and grounding resistance [4,5]. As temperature increases, the surrounding soil may dry out, reducing its conductivity and increasing the overall ground resistance. This change can compromise the efficiency of the grounding system, potentially leading to higher step and touch voltages that pose safety risks. Under high-current fault conditions, the localized heating of both the electrode and adjacent soil modifies their electrical resistivity, introducing nonlinear temperature-dependent feedback that affects current distribution and voltage gradients. These thermal effects are particularly pronounced near geometric discontinuities such as corners and ends of electrodes, where current density tends to be highest. Over time, repeated fault events or a single high-intensity event may cause the localized degradation or even melting of electrode materials, especially if the thermal response is not adequately considered during design.
Previous studies have explored various aspects of electrode performance under fault currents, including analytical and numerical modeling of current dispersion and soil resistivity [6,7]. However, comparatively few works incorporate the dynamic thermal–electrical coupling that arises from temperature-dependent resistivity, especially in realistic multilayer or heterogeneous soil conditions [8,9,10]. The inherent complexity of this coupled process requires numerical approaches capable of simultaneously solving for the evolving thermal and electrical fields. Nevertheless, thermal effects on grounding systems under high fault current have been investigated in some papers. For instance, in references [11,12,13], the authors examined the transient thermal response of grounding rods and found that prolonged fault conditions could cause structural degradation due to repeated thermal cycling. Similarly, in [14], Zhou et al. highlighted that materials such as copper and galvanized steel experience significant changes in electrical resistance at elevated temperatures, affecting the dissipation of fault currents. Moreover, the interaction between thermal and electrical phenomena in soil has been studied, showing that localized soil ionization and dehydration can lead to an increase in ground potential rise (GPR), further impacting grounding system performance [15]. The heat dissipation and electrical performance of buried conductors under load are discussed in [16,17]. Finally, the foundational study [18] uses a finite-difference method to model temperature distribution in soil around HVDC ground electrodes. It provides numerical profiles of heat dissipation under continuous current injection.
Given the critical role of grounding electrodes in electrical safety, understanding the effects of Joule heating under fault conditions is essential for designing more resilient grounding systems. This study aims to analyze the impact of fault-induced heating on system potentials and electrode performance through numerical simulations and experimental validation. This research focuses on evaluating temperature rise, material degradation, and variations in soil conductivity under fault conditions. The findings of this study will contribute to the optimization of grounding system design and enhance fault management strategies in modern power networks.
For this purpose, the present paper is structured as follows. Following this introduction, the proposed model for studying heat transfer both within the conductor and in the surrounding soil is presented, along with its interrelation with the electrode electrical parameters through the temperature dependence of electrical resistivity. In the subsequent section, the model is applied to two synthetic case studies to evaluate its capabilities. The paper concludes with a summary of the main findings.
2. Materials and Methods for Coupled Thermal–Electrical Modeling of the Grounding Electrode
This section presents the model used to study the heating of the grounding electrode and its surrounding environment. A numerical method based on finite differences is then proposed to solve the heat transfer equation between the electrode and the soil. Finally, the interaction between thermal effects and the electrical response of the electrode is incorporated into the calculation through a coupling approach that accounts for the temperature dependence of soil resistivity.
2.1. Electrode–Soil Heat Exchange Model
Consider a conductor in the form of a thin cylindrical wire with radius R1, length L, electrical resistivity ρc, and thermal conductivity k1, which is buried in a horizontal position at a depth p from the surface of a conductive soil with resistivity ρs and thermal conductivity k2. Figure 1 schematically illustrates the problem. The heat generated by the current Ic inside the conductor and the heat generated in the conductive medium by the current that leaks into the ground Is from the exposed surface of the conductor is transmitted by conduction to the horizontal surface of the soil at temperature Ts, and from there to the outside air at temperature Ta by free and/or forced convection with a convection coefficient h.
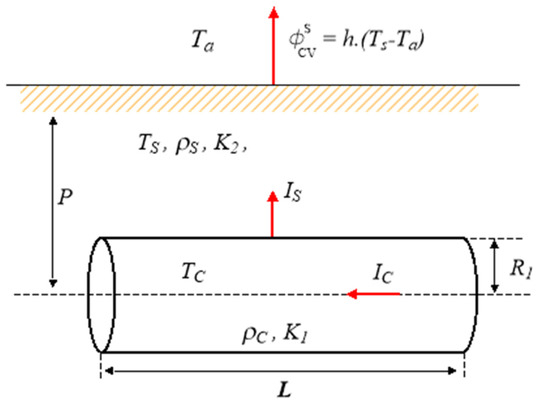
Figure 1.
Schematic of a buried cylindrical conductor with electric and thermal interactions.
From a general perspective, we have a heat transfer problem with two distinct regions: the buried conductor and the semi-infinite external medium limited by the soil surface. In both media, there are heat sources, which are associated with the Joule effect due to the current passing through materials with non-zero resistivity. An initial formulation of the problem would consist of solving the heat equation with internal sources in both regions separately and applying the boundary conditions (BC) and initial conditions (IC), along with the equations for the interface between the two media, which is simply the surface of the buried conductor. A problem that arises is related to the choice of the coordinate system, as neither the Cartesian nor the cylindrical system fully adapts to this problem. The cylindrical system offers certain advantages, provided that the conductor is assumed to have infinite length. Indeed, it is easy to see that, in this case, a cylindrical system whose axis of symmetry aligns with the axis of the conductor leads to a one-dimensional heat conduction problem in the radial and angular variables. Furthermore, if the burial depth p is large compared to the radius of the conductor R1, it can be assumed with little error that there is no angular dependence in the temperature field, at least inside the conductor and in areas of the soil close to it. A better approach to the problem could be achieved by modifying the system geometric configuration, taking advantage of the fact that, in our case, interest is focused on the transient solution over a very short time. In other words, the solution has barely evolved from the initial state. If we consider the soil as a cylindrical layer concentric with the conductor and with radius R2 = p, the equations can be greatly simplified by considering the problem as axisymmetric and one-dimensional in the radial direction.
This is equivalent to assuming that, at short times, both configurations are equivalent. Figure 2 aims to represent this simplification of the problem by showing a cross-sectional view of the conductor (shaded circle), surrounded by a cylindrical layer of soil with radius R2. The Joule power densities and generated in the conductor and the soil by the currents Ic and Is, respectively, are also shown. With these considerations, the equations to be solved are
where is the thermal diffusivity of the medium i (i = 1, 2) and is the power density generated by the internal sources of the medium i (i = 1, 2). If the thermal diffusivity of medium 1 is large and the radius R1 is small, we can ignore the thermal gradients inside this medium and treat it as a lumped-parameter system, which means that it will only be necessary to solve the heat equation in medium 2 and add a boundary condition (BC) at the surface of medium 1, which is the interface with medium 2. Given that the equation satisfied by medium 1 is
where is the power flux leaving the surface S1 of the buried conductor and V1 is its volume, since this equation must be satisfied at the surface of the conductor where , Equation (2) becomes a boundary condition for medium 2:
and the conduction problem to be solved is for medium 2, which is a cylindrical layer with radii R1 and R2, having a thermal diffusivity and thermal conductivity :
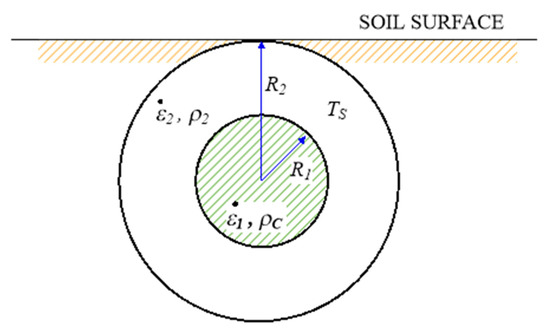
Figure 2.
Reduction of the initial system to a simpler geometry.
Equation (4) contains sources in one of the boundary conditions and also sources within the equation itself. Both types of sources are due to the Joule effect, but they exhibit some essential differences. The sources are generated inside the conductor by the current Ic (A) passing through it, while are generated by the current Is that leaves the conductor through its surface, known as the leakage current. The general expression for the Joule power generated by a current density (A/m2) flowing in a volume region V with electrical conductivity σ, where an electric field exists, is given by
Therefore, the Joule power density is defined from the current density by the expression . For a cylindrical conductor with cross-sectional area S and length L carrying a uniform current Ic (A), the current density can be considered uniform if the conductor is thin, and it is , where is the current density and is a unit vector in the direction of the symmetry axis of the cylindrical conductor. In this case, the Joule power density is , and it is easy to obtain that . The symbol denotes the ohmic resistance of the conductive medium.
A different case occurs when the electric current flows from a cylindrical surface of radius R and length L, very large, toward the outside. Since the current intensity is , with S being any closed surface that encloses the current-emitting cylinder, by symmetry, if we take a cylindrical surface of radius r > R that fully encloses the current-emitting cylinder, it can be easily demonstrated that the current density in the medium is radial and has a value of , so the Joule power density is , which is clearly non-uniform. The total power dissipated in a cylindrical layer of the conductive medium around the electrode, with radii R1 and R2 (R1 being the radius of the cylindrical electrode), is given by , where is the ohmic resistance associated with the cylindrical layer of material. Therefore, due to the previous considerations, in Equation (4), is uniform, while is a known function of the radius r.
2.2. The Finite Differences Method for Heat Equation (4)
To numerically solve Equation (4), this can be achieved using a finite difference scheme in cylindrical coordinates, with the radial variable as the only operative spatial coordinate. In this way, a cross-section of the pipe is considered, where , dividing this domain into N − 1 segments of size , with a total of N nodes ri, i = 1 … N, , and . Similarly, the chosen time interval [ti,tf] is divided into M intervals of size , with and . Equation (4) is discretized as follows:
The convergence is determined by the condition , which limits the value of the time step Δt taken for the evolution of the system. From Equation (6), the first one applies to the internal nodes. For the nodes adjacent to the boundary, when the temperatures at the boundary appear in the calculation, the second equation representing the Neumann boundary condition must be applied. The third equation, Equation (6), represents a Dirichlet boundary condition indicating that the temperature of the boundary node is always Ts and, thus, . This boundary condition can be considered valid as long as the evolution of the system is studied for times that are sufficiently short so that the boundary r = R2 does not show significant changes from its initial state.
Alternatively, for the node adjacent to the boundary R1, that is, node 2, node 1 is located at the left boundary and will satisfy the second Equation (6), so
With these considerations, the equation for the internal nodes becomes
which can be simplified somewhat if is introduced, so that (8) becomes
An important comment must be made at this point regarding (6). The Neuman boundary condition at r = R1 has been discretized at a low order (). We can achieve greater accuracy () by using the so-called ghost nodes method outside the domain. If , where is the temperature of a hypothetical node to the left of the boundary node whose temperature is , then we only need to eliminate the presence of that node through the equation that now satisfies the internal node, which is (9), now being
from which, solving for , we obtain
which, substituted into and solving for results in
This procedure for refining the calculation at the boundary is equivalent to the energy balance method in elementary control volumes around the nodes, as found in [19]. It is important to note that, since we are in a transient regime with sources, the balance is a complex operation, requiring the equation to be formulated for the control volume:
The surface integral must be performed with the outward normal vector so that the net flux has the correct sign.
At this point, it is necessary to complete the scheme by adding some other effects that may arise in practical problems. On the one hand, it is clear that the variation in the resistivities of the conductor and the soil with temperature must be taken into account, as they are found in and . For many types of materials, including metals and small temperature ranges, this variation follows the well-known linear law , where α is the thermal variability coefficient of the material resistivity and T0 is a reference temperature, typically set at 20 °C or 25 °C. For larger temperature ranges, always below the material melting point, the above linear law is often replaced by an exponential law . Furthermore, for conductive materials such as soils, rocks, and similar materials, it is known that electrical resistivity decreases with temperature. In [20], the following law can be found:
with typical values of and . In the same previous reference, the expression can also be found:
where , , , and . Both expressions provide acceptable temperature-dependent decreasing values, although (15) exhibits a more moderate decrease than (14). To complete the variability of the system parameters with temperature, the possible variation of the thermal conductivity of the materials with temperature could be included as a second effect. Here, the model proposed in [21] is cited:
In (16), T is the absolute temperature, and the parameters have the values a = 0.003 K−1 and b = 0.0042 W/mK2. It can be easily verified that, for the soils considered in this work, made up of materials equivalent to clay, the variation of thermal conductivity with temperature is insignificant and, therefore, it will not be considered in the temperature profile calculation.
For any choice of the model, the variability in electrical resistivities and thermal conductivities can affect the values of the longitudinal current Ic and the transversal current Is. Therefore, these two currents must be treated as new variables of the problem, with their own equations associated with the electrical circuit to which the conductor belongs, which will give the values of Ic(t) and Is(t). Therefore, in strict terms, in (7) and (9), the power densities of the sources and , should be replaced by and , respectively, where it is made explicit that there is a time dependence for the currents Ic and Is. In practice, the time loop for the implementation of (9) must also include the algorithm by which these currents are obtained at each time step. The numerical scheme would therefore proceed as follows:
with the heat power densities defined by
for the sources in the conductor and
for the heat sources in the conductive soil. In (18) and (19), ρ0 is the resistivity at the reference temperature T0, and the coefficients α1T, α2T, α3T, α4T, β3T, and γ3T are associated with the variation of resistivity with temperature for the materials. In general, for the common metals used in conductors, the temperature coefficient is positive (for copper, 0.0039 °C−1), meaning that the resistance increases with temperature. For a conductive soil, in the absence of specific additional information, the coefficients will take the typical values mentioned earlier: , , , , and °C−1 with for models in (19).
Given that determining the currents Ic and Is from the material resistivities in the system involves a slow calculation, whereas solving (9) requires a time loop with several thousand steps, an approximation is proposed. In Code (9) to calculate the final temperature, the time interval will be divided into a few temporal segments or intervals, in each of which the currents Ic(t) and Is(t) are considered constant. At the end of each interval, a temperature will be obtained, which will be used to recalculate the values of these currents, which will influence the intensity of the sources. These new source values will be used in the next interval, and the cycle will repeat until the final time is reached.
As a final note, it is necessary to consider that, if there is a temperature profile in an electrically conductive medium such as soil, the electrical resistivity will also have a profile dependent on the location. This is partially reflected in the second equation in (18) and in (19). It is also important to clarify that no significant differences are observed between the simple and improved approximations at the surface temperature of the conductor, i.e., the boundary condition at R1. Therefore, unless further refinements are made, we will continue working at first order in boundary conditions.
Some final comments on the impact of the variation of soil resistivity with temperature are provided below. Since the temperature increase in the soil leads to a decrease in its electrical resistivity around the conductor, this may cause a reduction in its electric potential. The effect would be similar to surrounding the conductor with a layer of soil made of a material with a lower resistivity than the rest of the soil. It can also be thought of as equivalent to increasing the radius of the conductor, as happens in ionization phenomena due to high leakage currents. The magnitude of this increase can be estimated in several ways. In this paper, the decrease in the resistivity of the soil near the conductor is considered through the following reasoning. Since soil resistivity as a function of the radial distance r from the original radius of the conductor R1 to the boundary R2 is available, the theoretical resistance RG of a cylindrical layer [22] with radii R1 and R2 can be approximately calculated by . This resistance is equated to that calculated for a cylindrical layer composed of two juxtaposed layers with constant resistivities ρ1 (close to the conductor resistivity) surrounding the conductor with radii R1 and rb, and a second layer with resistivity ρ2, equal to that of the original soil, with radii rb and R2, as it is shown in Figure 3.
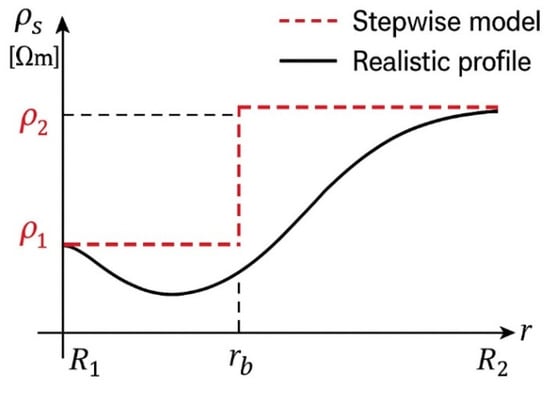
Figure 3.
Radial resistivity profile from cable surface to outer soil boundary.
Through this operation, the optimal value of rb is determined, which will be assigned to the new virtual radius of the conductor. As previously established, the analysis is conducted on a cylindrical segment of bare conductor with radius R1 and length L, encapsulated by a surrounding soil layer extending to an outer radius R2. It can be easily demonstrated that
Consequently, in the computation of electric potentials, current distributions, and other temperature-dependent electrical parameters, the actual electrode radius should be substituted with the effective (or virtual) rb.
It is important to consider that the increase in the radius of the conductor segments should be subordinated to the size of the segments themselves. We know that potential calculations are acceptable when δ > 4r, where δ is the segment length and r is its radius. Therefore, the radius cannot be increased beyond this value, as the potential obtained would become an upper bound to the real value, since increasing the radius results in a decrease in potential. At the same time, the increase in radius causes an increase in the current that leaks into the ground, which in turn raises the temperature, leading to a decrease in the soil resistivity, which again results in an increase in the virtual radius.
2.3. Assembling the Thermal Model with the Electric Calculations
In practice, the model for determining the heating of a conductor is applied to grounding electrodes in electrical installations. These electrodes consist of thin conductive rods that can be segmented into small sections, to which the described model is individually applied. The times involved in the Joule heating process are so short that applying the temperature and resistivity calculation algorithm to each segment individually does not introduce significant error. Since the conductor piece to which the described thermal model is applied undergoes changes in internal resistivity with temperature , in addition to changes in the resistivity of the surrounding soil , these variations result in a modification of the current values Ic and Is, which in turn alters the temperature profiles of the conductor and its surroundings. For this reason, the time interval considered has been divided into several stages, during which these currents are calculated using an electrical calculation software developed by the authors. Subsequently, the internal and external temperatures of the conductor are determined using the described model, in order to evaluate the updated resistivity of the materials involved. These updated values are then integrated into the electrical calculation of the next stage. The aforementioned electrical calculation software [23] considers the internal resistance of the conductors and the modified radii, according to Equation (20), to recalculate the currents Ic and Is. The flowchart in Figure 4 illustrates the calculation procedure for the complete model.
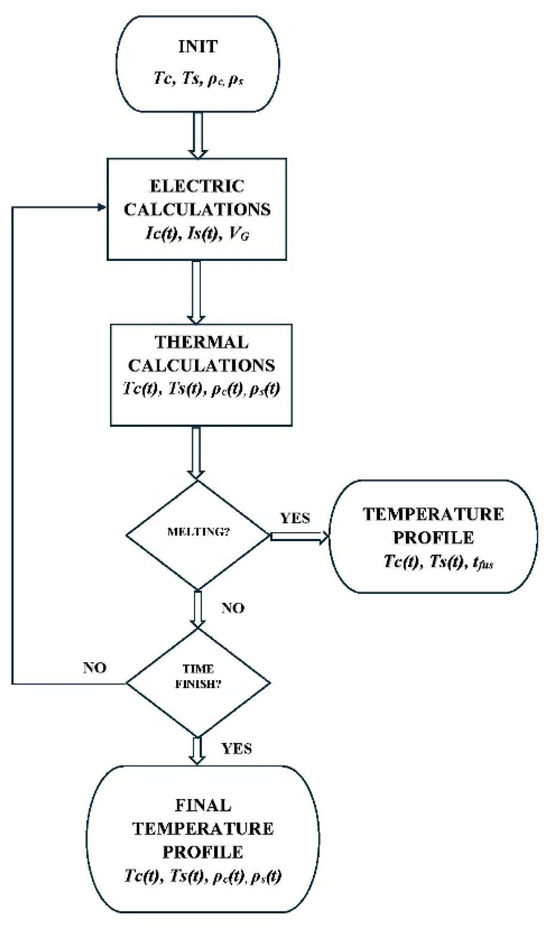
Figure 4.
Flowchart for the calculation of the final temperature and resistivity profiles.
During the calculation process, the grounding potential of the electrode is also obtained, which depends on the current injection point, as well as the data required for calculating the step and touch potentials of the grounding system to which the conductive electrode belongs.
3. Evaluation of the Model Under Controlled Synthetic Conditions
The proposed model for evaluating the heating of grounding electrodes under fault conditions will be validated using synthetic case studies. These application examples will be used to assess the impact of heating on the electrical parameters of the electrode. For most of the case studies considered, the three models for soil resistivity as a function of temperature, given by Expression (19), are applied. From top to bottom in (19), they are referred to as Model 0, Model 1, and Model 2. For all the examples presented, a maximum fault duration of 0.5 s has been set, divided into 20 time steps. Although increasing the number of time steps can improve the numerical stability of the algorithm, the short durations involved in real-world fault scenarios mean that a high number of steps is not necessarily required. In practice, we have verified that, for the selected number of time steps and the types of electrodes considered, the results remain virtually unchanged when a larger number of steps is used.
3.1. Horizontal Grid in Homogeneous Soil
The electrode consists of a basic horizontal grid composed of bare copper rods with a radius of 5 mm, buried at a depth of 0.5 m in homogeneous soil with a resistivity of 50 Ω·m. The fault current injection point—an important consideration in real electrodes with internal resistance—is located at the geometric center of the grid, the point P(0, 0, −0.5), with a current magnitude of 10 kA. This current value was selected because it is on the same order of magnitude as that generated by lightning strikes and is capable of producing high temperatures over short time intervals. In typical fault scenarios, the currents diverted to the grounding system are usually much lower; however, they could also lead to significant temperature rises if not for the prompt action of protection devices, which limit the duration of fault current flow through the grounding electrodes.
Figure 5 provides a graphical representation of the electrode. For the calculation of electrical parameters and the temperature profile, each rod of the electrode is divided into a number of segments per meter of conductor. The temperature profile computation algorithm is applied to the soil surrounding each segment. The calculation is carried out following the flowchart shown in Figure 4, using a time loop of 20 steps for a total fault duration of 0.5 s. The initial soil temperature has been set to Ts(0) = 20 °C. In each simulation, the three models presented in (19) for the temperature dependence of soil resistivity are applied.
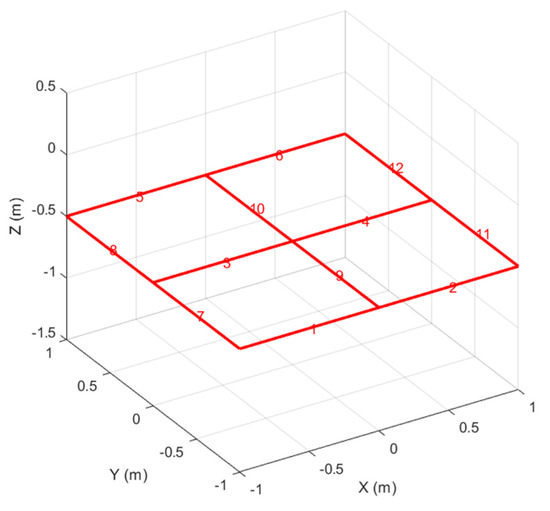
Figure 5.
The test electrode with numbered rods.
For the purpose of comparing results, two different segmentations of the rods have been considered: 7 segments per meter and 11 segments per meter of conductor. The potential acquired by the electrode corresponds to the potential at the fault current injection point. The time evolution of the electrode potential under various scenarios is shown in Figure 6.
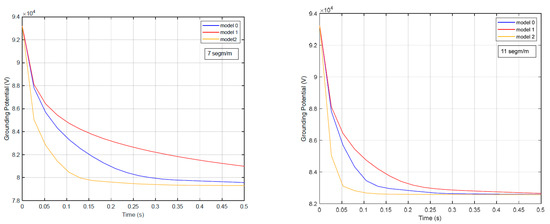
Figure 6.
Grounding potential for the different soil resistivity models and the two types of electrode segmentation.
The left panel of Figure 6 shows the electrode potential as a function of fault duration for the three soil resistivity models dependent on temperature, using a segmentation of seven segments per meter for the rods that make up the electrode. The right panel presents the same results but using a finer segmentation of 11 segments per meter. In this right panel, the saturation effect of the segment equivalent radius is clearly observed, limiting it to no more than one-fourth of the segment length. This effect becomes more pronounced as the segmentation becomes finer. For this reason, the potential curves tend to flatten, meaning that the potential no longer decreases over time, indicating that the actual value of the potential may be lower than that shown in the curves and, therefore, the plotted values should be considered as an upper bound for the grounding potential. Figure 7 illustrates the potential acquired by each node of the electrode, defined as the junction between adjacent segments, at the end of the considered time interval. The figure refers to the application of Model 1 for temperature to the electrode, using a segmentation of 11 pieces per meter. The figure shows that the injection node acquires the highest potential, although, in this example, the differences among the various nodes are not significant. This behavior consistently occurs when the electrode is not large in size and is made of a highly conductive material [24].
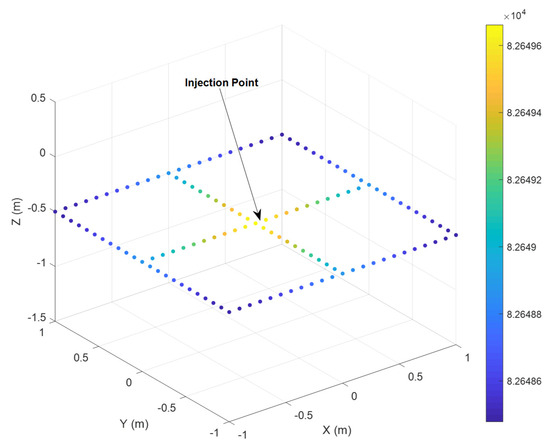
Figure 7.
Potentials of the electrode nodes at the final instant t = 0.5 s of the time interval.
Figure 8 shows the variation over time of the maximum temperature reached by the electrode, which corresponds to one of the segments into which the rods are divided. The solid-colored lines correspond to the segmentation of 7 segments per meter, while the dotted lines represent the finer segmentation of 11 segments per meter.
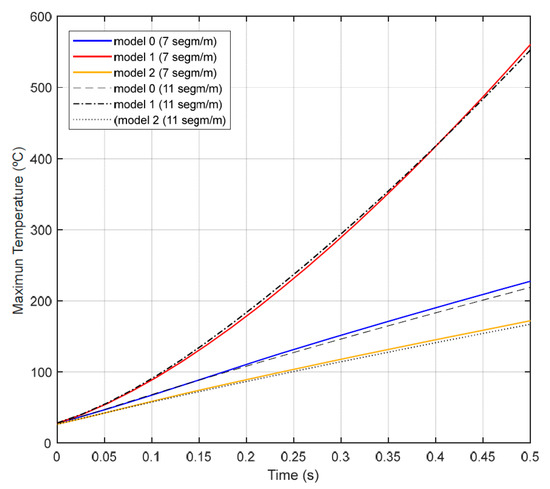
Figure 8.
Time variation of the maximum temperature in the electrode for the different models.
Figure 9 shows the temperature acquired by each segment of the electrode, represented by a point, at the final instant of the time period considered. As in Figure 7, this refers to the electrode with fine segmentation, using Model 1 to calculate the temperature acquired at the final instant of the process.
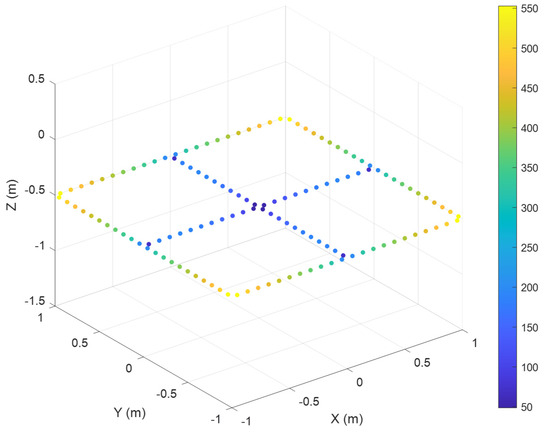
Figure 9.
Temperature reached by the different segments of the electrode under the application of Model 1.
3.2. Large Vertical Rod Driven into a Tri-Layered Soil
The second proposed synthetic example consists of a long bare copper rod, with a length of L = 12 m and a radius of r = 5 mm, vertically driven into a soil modeled as three homogeneous horizontal layers. The layers have resistivities and thicknesses (from the surface) of ρ1 = 50 Ω·m with a thickness of h1 = 2.1 m, ρ2 = 20 Ω·m with a thickness of h2 = 0.9 m, and ρ3 = 100 Ω·m. The fault current injection point, with a magnitude of 10 kA, is located at the upper end of the rod, which corresponds to the point (0, 0, 0).
As for the previous application example, each electrode rod is discretized into several segments per meter to enable the calculation of electrical parameters and the temperature distribution. The algorithm for computing the temperature profile is applied to the soil surrounding each segment. The simulation follows the procedure outlined in the flowchart of Figure 4 and is executed over 20 time steps, corresponding to a total fault duration of 0.5 s. The initial soil temperature is set to Ts(0) = 20 °C. In each case, the three models described in Expression (19) for the temperature dependence of soil resistivity are implemented. Figure 10 shows the time evolution of the electrode potential, which corresponds to the potential at the fault current injection point. The left panel of Figure 10 displays the electrode potential versus fault duration for the three temperature-dependent soil resistivity models, using a discretization of seven segments per meter along the electrode rods. In contrast, the right panel presents the corresponding results obtained with a finer discretization of 11 segments per meter. A saturation of the potential overtime is once again observed, resulting from the segment equivalent radius reaching its predefined limit, set to one-fourth of the segment length.
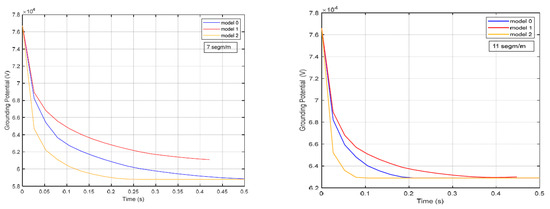
Figure 10.
Grounding potential versus time of the considered electrode for two different segmentations.
In both panels of Figure 10, it can be observed that the curve corresponding to Model 1 ends before the final time t = 0.5. This behavior is attributed to the electrode locally reaching the melting temperature of its material, which has been set to Tf = 1538 °C.
Figure 11 shows the time evolution of the maximum temperature reached by any of the segments of the rod. As in the previously discussed case, the results for the two different electrode segmentations are presented together.
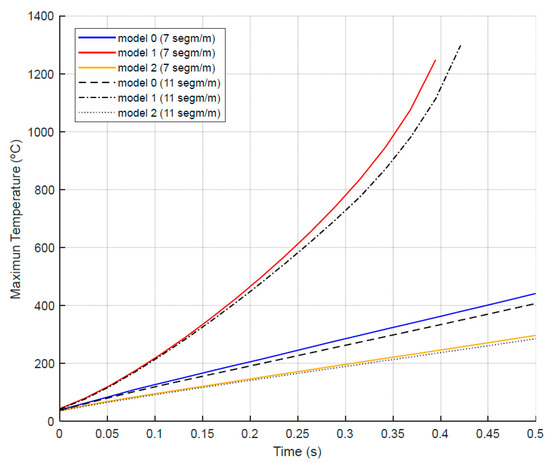
Figure 11.
Time-dependent behavior of the maximum electrode temperature for each model.
Finally, Figure 12 displays the nodal potential along the rod in the left panel, while the right panel shows the temperature of each rod segment for the partition with seven segments per meter. Both panels correspond to Model 2, which accounts for the temperature-dependent variation of soil resistivity, using a segmentation of seven segments per meter.
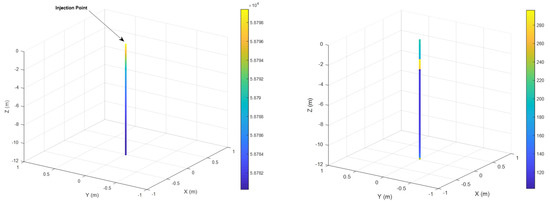
Figure 12.
Nodal potentials in volts (left panel) and final segment temperatures (°C) according to Model 2 (right panel).
The right panel of Figure 12 shows higher temperatures in the rod segments located within the low-resistivity soil layer. This is because these segments inject a higher current into the ground, thereby generating more heat due to the Joule effect and increasing the temperature. Although this temperature rise is partially mitigated by the reduction in soil resistivity, it is not sufficient to prevent these segments from reaching higher temperatures than the rest.
The left panel of Figure 13 displays the soil resistivity profile as a function of radial distance from electrode segments located in different soil layers. The blue line corresponds to a segment within the 20 Ω·m layer, the red line corresponds to a segment in the 50 Ω·m layer, and the orange line corresponds to a segment situated in the highest-resistivity layer of 100 Ω·m, at the final time instant. The right panel shows the temperature as a function of the radial distance from the previously mentioned segments. Both panels display a zoomed-in view of the region closest to the electrode, covering the radial distance from r = 5 mm (the electrode surface) to r = 10 mm. The data shown corresponds to Model 2, which accounts for the temperature-dependent soil resistivity.
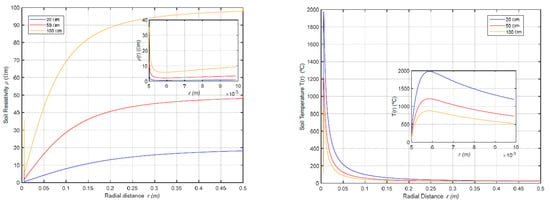
Figure 13.
Soil resistivity and temperature versus the radial distance from some electrode segments.
The results obtained in this synthetic example are consistent with the measurements reported in reference [25], in which an advanced modeling approach for soil resistivity in the vicinity of deep-well electrodes, aimed at accurately capturing the temperature rise caused by HVDC return currents, is presented. The finding that the soil layer with the lowest resistivity near the electrode governs the thermal peaks is consistent with the underlying physics: regions with lower resistivity concentrate higher current densities and, consequently, experience greater heating.
3.3. Very Large Horizontal Electrode in Homogeneous Soil
The proposed model allows for the incorporation of electrodes made from materials other than conventional copper and its alloys. This makes it possible to evaluate, from a thermal perspective, the suitability of alternative conductive materials whose implementation in grounding electrodes may offer economic advantages. As an application example, a large synthetic electrode is considered, which could represent a simplified version of the grounding electrode used in a large-scale photovoltaic installation. Two scenarios are used: one in which bare copper conductors are used, and another in which stainless steel is used instead. In both cases, the electrode conductors have a radius of 7 mm and are buried horizontally at a depth of 0.5 m in a 50 Ω·m homogeneous soil. Due to the large size of the electrode, and in order to avoid excessively long computation times, a segmentation of two elements per meter is assumed. It is acknowledged that the resulting potentials overestimate the actual values since—as is well known—refining the segmentation of the conductors leads to results that more closely approximate the real values. The same applies to temperatures: the calculated values overestimate the actual temperatures at any point on the electrode or in the surrounding soil. Figure 14 shows, in the left panels from top to bottom (a) and (c), the node potentials of the electrode made of hard-drawn copper and zinc-coated steel, respectively. Table 1 summarizes the thermal and electrical properties of both materials used in the proposed model.
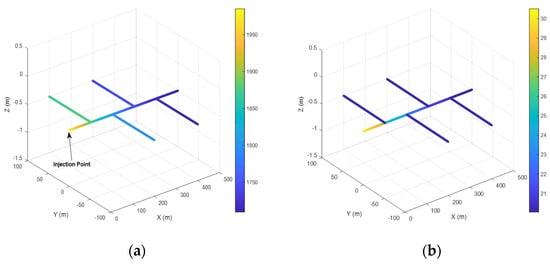
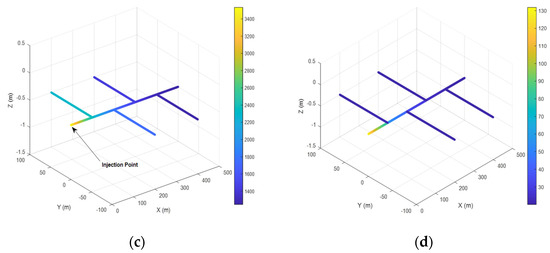
Figure 14.
Node potentials (a,c) and electrode temperature profiles (b,d) for two different conductor materials.

Table 1.
Thermal and electrical properties used for copper and zinc-coated steel.
In the right panels, also from top to bottom (b) and (d), the temperatures of the segments of the hard-drawn copper and zinc-coated steel electrodes are shown. As observed in the figure, the injection point corresponds to the location where the highest temperature is reached in both cases. Note in particular the significant difference in the grounding potential between the two electrodes, which results from the influence of the internal resistance of the material. The model indicates that higher material resistivity leads to a higher temperature at the injection point, with the associated risk that the connection to the grounding electrode could be interrupted due to material melting. Indeed, numerical simulations using this large-scale electrode, made from stainless steel with a resistivity of 6.9 × 10⁻⁷ Ω·m, show that the injection point segment reaches the melting temperature of the material in approximately 0.4 s under a 10 kA current.
4. Conclusions
This study examines the Joule heating experienced by grounding electrodes and the surrounding soil under fault conditions in the electrical installation that they are intended to protect. A one-dimensional model is developed to describe heat transfer within the bare electrode—caused by its internal resistance—and in the adjacent soil, where current leakage occurs due to the potential acquired by the electrode during the fault.
The model incorporates the temperature dependence of electrical resistivity, with particular attention to the non-standard behavior observed in soils, as described by several formulations summarized in Expression (19). This temperature dependence leads to a feedback-driven process: variations in the resistivity of the system components modify the current distribution within the electrode and the leakage into the soil, which in turn modifies the temperature field, further affecting the resistivity.
The evolution of this process is governed by the algorithmic sequence outlined in Figure 4, which captures the interaction between temperature and electrical potential throughout the duration of the fault. A numerical implementation of the model was developed accordingly and applied to two synthetic test cases, allowing for comparison among the three soil resistivity models defined in Expression (19).
While all resistivity models exhibited the expected qualitative trends in electrical potential and temperature distributions, significant quantitative differences were observed. The choice of the soil resistivity model as a function of temperature to be applied in simulations or calculations is crucial for the accurate interpretation of results. It is essential to assign an accurate representation of soil resistivity, which requires appropriate experimental studies conducted in the field.
The computed electrical potentials represent upper-bound estimates of the actual grounding potential, due to the manner in which the variable soil resistivity is incorporated. The electrode temperature distribution, on the other hand, was found to be particularly sensitive to the magnitude of the leakage current, which is known to be high at angular regions, corners, and open ends of electrodes, especially for small- and medium-sized grounding systems. For large electrodes, the current injection point experiences the most intense heating. These areas consequently experience the most intense heating and should be given special design consideration. Reinforcement or localized thickening in these regions can mitigate the risk of thermal degradation.
Acknowledging the current scope of the model, it is important to note that soil moisture variation and three-dimensional thermal–electrical field effects are not yet incorporated into the formulation. These factors could significantly influence the performance of grounding systems, particularly in large-scale installations or in soils with pronounced stratification. Future work will aim to extend the model to account for these phenomena, enabling a more comprehensive representation of grounding behavior under varying environmental and operational conditions.
Author Contributions
Conceptualization, G.A. and E.F.; Methodology, G.A. and E.F.; Software, G.A. and E.F.; Validation, G.A., E.F. and J.M.; Formal analysis, G.A., E.F., J.M. and G.D.; Investigation, G.A., J.M. and D.G.; Resources, J.M., D.G. and G.D.; Writing—original draft, G.A. and E.F.; Writing—review & editing, G.A., E.F., J.M., D.G. and G.D.; Supervision, G.A., J.M., D.G. and G.D. All authors have read and agreed to the published version of the manuscript.
Funding
This research received no external funding.
Institutional Review Board Statement
Not applicable.
Informed Consent Statement
Not applicable.
Data Availability Statement
The original contributions presented in the study are included in the article, further inquiries can be directed to the corresponding author.
Acknowledgments
The authors would like to thank both the Department of Applied Mathematics and the IEEF Department of the Escuela Técnica Superior de Ingeniería y Diseño Industrial (ETSIDI) at the Universidad Politecnica de Madrid (UPM) for their support to the undertaking of the research summarized here. Furthermore, the authors appreciate the collaboration with the firm QUIBAC at Terrassa, Barcelona (Spain), for the technical support.
Conflicts of Interest
The authors declare no conflicts of interest.
References
- Sima, W.; Zhu, B.; Yuan, T.; Yang, Q.; Luo, L.; Wu, P. Influence of soil temperature characteristic on the grounding electrode temperature rise. IET Sci. Meas. Technol. 2015, 9, 410–417. [Google Scholar] [CrossRef]
- Villas, J.E.T.; Portela, C.M. Soil heating around the ground electrode of an HVDC system by interaction of electrical, thermal, and electroosmotic phenomena. IEEE Trans. Power Deliv. 2003, 18, 874–881. [Google Scholar] [CrossRef]
- Flechsig, G.U.; Walter, A. Electrically heated electrodes: Practical aspects and new developments. Electroanalysis 2012, 24, 23–31. [Google Scholar] [CrossRef]
- Greiss, H.; Mukhedkar, D.; Lagace, P.J. Computations of soil temperature rise due to HVDC ground return. In Proceedings of the 1989 ACM/IEEE Conference on Supercomputing, Reno, NV, USA, 12–17 November 1989; pp. 86–95. [Google Scholar] [CrossRef]
- Bragatto, T.; Cerretti, A.; D’Orazio, L.; Gatta, F.M.; Geri, A.; Maccioni, M. Thermal effects of ground faults on MV joints and cables. Energies 2019, 12, 3496. [Google Scholar] [CrossRef]
- Mitolo, M.; Sutherland, P.E.; Natarajan, R. Effects of high fault currents on ground grid design. IEEE Trans. Ind. Appl. 2010, 46, 1118–1124. [Google Scholar] [CrossRef]
- Zhang, Z.; Xu, Z.; Xu, T. Calculating current and temperature fields of HVDC grounding electrodes. J. Mod. Power Syst. Clean Energy 2016, 4, 300–307. [Google Scholar] [CrossRef]
- Wang, Y.; Pan, Z.; Zha, Z.; Tan, B.; Wen, X.; Liu, Y.; Zhang, J.; Lan, L. Numerical simulation and field test of the transient temperature rise of HVdc grounding electrodes. IEEE Trans. Power Deliv. 2017, 33, 22–31. [Google Scholar] [CrossRef]
- Meliopoulos, A.P.; Webb, R.P.; Joy, E.B. Analysis of grounding systems. IEEE Trans. Power Appar. Syst. 2007, PAS-100, 1039–1048. [Google Scholar] [CrossRef]
- Blackburn, T.R.; Domin, M.J. Protective Relaying: Principles and Applications; CRC Press: Boca Raton, FL, USA, 2014; ISBN 1439888116. [Google Scholar]
- Malanda, S.C.; Davidson, I.E.; Singh, E.; Buraimoh, E. Analysis of soil resistivity and its impact on grounding systems design. In Proceedings of the 2018 IEEE PES/IAS PowerAfrica, Cape Town, South Africa, 28–29 June 2018; pp. 324–329. [Google Scholar] [CrossRef]
- Grcev, L.; Popov, M. On high-frequency grounding impedance of vertical rods. IEEE Trans. Power Deliv. 2005, 20, 1598–1603. [Google Scholar] [CrossRef]
- Balakrishnan, V.; Dinh, T.; Phan, H.P.; Dao, D.V.; Nguyen, N.T. A generalized analytical model for Joule heating of segmented wires. J. Heat Transf. 2018, 140, 072001. [Google Scholar] [CrossRef]
- Dan, Y.; Zhang, Z.; Wang, X.; Jiang, Y.; Wang, J. A corrosion degree detection method of grounding electrodes considering lightning grounding performance and thermal stability. Measurement 2024, 238, 115272. [Google Scholar] [CrossRef]
- Kokorus, M.; Zildzo, H.; Gacanovic, R.; Ahmovic, A. Modeling of phenomena in the grounding system including fields correlation. In Proceedings of the IEEE EUROCON 2015-International Conference on Computer as a Tool (EUROCON), Salamanca, Spain, 8–11 September 2015; pp. 1–6. [Google Scholar] [CrossRef]
- Samadinasab, S.; Namdari, F.; Bakhshipour, M. The influence of moisture and temperature on the behavior of soil resistivity in earthing design using finite element method. Indones. J. Electr. Eng. Comput. Sci. 2016, 2, 11–22. [Google Scholar] [CrossRef][Green Version]
- Sreedeep, S.; Reshma, A.C.; Singh, D.N. Generalized relationship for determining soil electrical resistivity from its thermal resistivity. Exp. Therm. Fluid Sci. 2005, 29, 217–226. [Google Scholar] [CrossRef]
- Greiss, A.M.; Radwan, A.A.; El-Naggar, M.K. Calculation of temperature distribution in soil surrounding HVDC ground electrodes. IEEE Trans. Power Deliv. 1987, 2, 819–825. [Google Scholar] [CrossRef]
- Holman, J.P. Heat Transfer, 10th ed.; McGraw-Hill: New York, NY, USA, 2010; ISBN 0-07-352936-2. [Google Scholar]
- Hayley, K.; Bentley, L.R.; Gharibi, M. Time-lapse electrical resistivity monitoring of salt-affected soil and groundwater. Water Resour. Res. 2009, 45, W07425. [Google Scholar] [CrossRef]
- Vosteen, H.-D.; Schellschmidt, R. Influence of temperature on thermal conductivity, thermal capacity and thermal diffusivity for different types of rock. Phys. Chem. Earth Parts A/B/C 2003, 28, 499–509. [Google Scholar] [CrossRef]
- Moreno, J.; Simon, P.; Asensio, G.; Denche, G.; Faleiro, E.; Garcia, D.; Navarro, P.; Pazos, F. Sistemas de Puesta a Tierra en Instalaciones de Alta Tensión; IberGarceta Publicaciones S.L.: Madrid, Spain, 2015; ISBN 978-84-1622-817-1. [Google Scholar]
- Denche, G.; Faleiro, E.; Asensio, G.; Moreno, J. Grounding Electrodes with Internal Resistance: Application to Feasibility Study of the Driven-Rod Method for Modeling the Soil Electrical Resistivity Profile. Appl. Sci. 2021, 11, 5032. [Google Scholar] [CrossRef]
- Denche, G.; Faleiro, E.; Asensio, G.; Moreno, J. A Fast Calculation of Partially Corroded, Grounding-Resistive Electrode Electrical Parameters. Appl. Sci. 2022, 12, 12243. [Google Scholar] [CrossRef]
- Lu, H.; Jing, M.; Cai, H.; Hu, S.; Teng, Y.; Chen, J.; Lan, L.; Wen, X. Soil resistivity modeling for temperature rise calculating of HVDC deep-well earth electrode. Int. J. Electr. Power Energy Syst. 2021, 125, 106537. [Google Scholar] [CrossRef]
Disclaimer/Publisher’s Note: The statements, opinions and data contained in all publications are solely those of the individual author(s) and contributor(s) and not of MDPI and/or the editor(s). MDPI and/or the editor(s) disclaim responsibility for any injury to people or property resulting from any ideas, methods, instructions or products referred to in the content. |
© 2025 by the authors. Licensee MDPI, Basel, Switzerland. This article is an open access article distributed under the terms and conditions of the Creative Commons Attribution (CC BY) license (https://creativecommons.org/licenses/by/4.0/).