1. Introduction
With the rapid acceleration of global urbanization, human activities are increasingly encroaching upon high-quality ecological resources to secure development space, placing unprecedented pressure on ecosystems [
1]. As core indicators for measuring the anthropogenic intensity and ecosystem condition, the human footprint (HF) and ecological quality (EQ) are closely tied to the coordinated development of human–environment relationships. HF reflects human interventions such as land use, infrastructure expansion, and economic activity [
2], while EQ indicates the ecosystem’s capacity to support biodiversity and ecological functions [
3]. Amid rapid global environmental change, the intensifying conflicts between human activity and ecological systems have drawn growing international attention. At the regional scale, the absence of integrated tools and evaluation methods that combine anthropogenic pressures with ecological responses has hindered a deeper understanding of human–environment coupling mechanisms. Therefore, exploring the spatiotemporal interactions between HF and EQ and developing a dual-dimensional integrated management framework that considers both dimensions has become a pressing challenge for achieving coordinated human–environment development.
Lake-ring urban agglomerations, characterized by both high levels of HF and strong EQ foundations, serve as critical governance units for promoting globally coordinated development of human–environment coupled systems. As one of the countries with the most extensive water systems in the world, China possesses 35.49 million hectares of water bodies. Its widely distributed lake resources have given rise to numerous water-dependent urban agglomerations that provide essential ecological support for regional development. Existing research indicates that compared with non-waterfront areas, urban agglomerations centered around lakes and water systems exhibit a more complex relationship between urban expansion and ecological protection, often reflecting more pronounced trade-offs and synergies [
4]. In major freshwater lake regions such as Dongting Lake, Poyang Lake, Taihu Lake, Hongze Lake, and Chaohu Lake, rapid urbanization has triggered land use changes, spatial compression of lake zones, and habitat fragmentation, resulting in a range of systemic risks to regional ecological functions [
5]. Clearly, there is an urgent need to address the imbalance between HF and EQ in lake-ring urban agglomerations from the perspective of coordinated human–environment development and to explore integrated management mechanisms. Doing so not only helps tackle China’s current sustainability challenges but also offers valuable lessons for other economies facing similar issues.
Given the unique geographical conditions of lake-ring urban agglomerations, a critical bottleneck lies in developing an integrated management framework to foster positive interactions between the HF and EQ. However, research on the interaction mechanisms between HF and EQ remains limited, particularly in lake-ring urban agglomerations. To address this gap, this study focuses on the following key research questions:
- (1)
How can a suitable HF–EQ interaction framework be constructed for lake-ring urban agglomerations?
- (2)
What are the spatiotemporal evolution patterns and coupling effects between HF and EQ across different lake-ring urban agglomerations?
- (3)
Which factors primarily drive the spatiotemporal differentiation of the coupling coordination degree (CCD) between HF and EQ?
- (4)
How can a static–dynamic integrated zoning approach achieves coordinated human–environment development in lake-ring urban agglomerations?
Based on the proposed research questions, this study offers three main innovations and contributions: (1) Regarding the research perspective, this study is the first to select typical lake-ring urban agglomerations in China as the research focus. These agglomerations are characterized by aquatic-based production and settlement patterns, expanding the analytical lens for understanding human–environment coordination. (2) Regarding the research framework, the study integrates HF and EQ to construct a static–dynamic dual-dimensional management chain and proposes a human–environment coordination zoning model tailored to lake-ring urban agglomerations. (3) Regarding research content, the study fully considers the spatial heterogeneity among different lake-ring urban agglomerations, adopting a multi-scale framework of “China’s lake-ring urban agglomerations—five urban units—1 km grid” to promote the operational implementation of the dual-dimensional coordination strategy. These contributions provide theoretical value by enriching the perspectives, frameworks, and content for understanding the spatiotemporal interactions between HF and EQ in lake-ring urban agglomerations, offering empirical support for regional human–environment coordination theory. Practically, the study initiates a differentiated pathway toward integrated management across diverse lake-ring urban agglomerations, addressing global sustainability challenges lake-dense urban regions face in balancing ecological integrity and human activity pressures. The proposed integrated framework and findings hold broad applicability and can inform decision-making for coordinated human–environment management in similar watershed regions worldwide.
2. Literature Review
2.1. Assessment Frameworks for Human Activity and Ecological Environment
Establishing a scientifically sound framework for assessing human activity and the ecological environment is a prerequisite for achieving coordinated human–environment development [
6,
7,
8]. From the human activity perspective, current human activity assessment systems mainly rely on composite indicators linked to anthropogenic pressure. The ecological footprint index measures human demand by converting it into biologically productive land area [
9]. While it emphasizes sustainability, it overlooks spatial heterogeneity and regional development variation. The environmental disturbance index quantifies human impacts based on pollution [
10]. Life cycle assessment evaluates resource consumption and environmental impacts across activity stages and is suitable for product- or project-level analysis, but it is less applicable at large spatial scales [
11]. The urban expansion index measures construction land growth but overlooks pressures from population and economic activity. Landscape pattern indices capture spatial configuration changes but ignore underlying human drivers. Although valuable, these methods are limited for comprehensive assessments at the urban agglomeration scale. In contrast, the human footprint index integrates land use, population density, nighttime lights, and transport networks, offering high spatial resolution and temporal comparability [
12]. It more accurately reflects surface-level human activity intensity and is widely used in macro-scale studies of regional development and human–environment interactions. It is well-suited for systematically assessing HF at the urban agglomeration scale in this study.
Regarding the ecological environment dimension, current approaches to measuring EQ can be grouped into three main types. The first approach is based on ecological vulnerability, focusing on how ecosystems respond to natural or human disturbances and their potential risks [
13]. It is helpful for vulnerability zoning and risk warnings but cannot fully capture dynamic ecosystem conditions. The second uses the InVEST model to quantify ecosystem services like water purification, carbon storage, and biodiversity as proxies for ecological quality [
14]. While theoretically robust and highly modular, this method relies heavily on input data, parameters, and geographic context, limiting regional applicability. The third approach uses the Remote Sensing-based Ecological Index (RSEI), which integrates indicators like biological abundance, vegetation cover, and pollution load to reflect ecosystem conditions [
15]. The first two methods are helpful for fine-scale assessments and localized modeling but are constrained by limited spatial coverage, incomplete time series, and inconsistent indicators. In contrast, RSEI requires no manual input and offers high automation, operability, and adaptability. It is particularly effective for large-scale, multi-temporal monitoring and macro-level ecosystem policy analysis. Each method serves a distinct purpose, and the choice should depend on the study area’s characteristics and research goals.
2.2. Mechanisms Linking Human Activity and the Ecological Environment
Exploring the correlation effects between human activities and the ecological environment is a cutting-edge issue in human–environment coordinated development research. Scholars have examined this relationship from various perspectives, using methods such as network analysis, CCD models, fitting correlation analysis, and GeoDetector [
16,
17,
18]. Traditional linear regression can identify trends between variables, but relying on linear assumptions limits its ability to capture nonlinear interactions. These models also ignore spatial heterogeneity, which can obscure regional differences. Compared to traditional regression, the CCD model better supports spatial visualization and coordination assessment and is now widely used. For example, Xiong et al. applied the CCD model and a relative development index to examine spatiotemporal interactions between human activity and ecosystem health [
19]. GeoDetector has emerged as a powerful spatial analysis tool for identifying driving mechanisms. It overcomes the limitations of conventional methods like grey relational analysis and linear regression, which assume variable independence and linearity. GeoDetector effectively identifies interactions among multiple influencing factors. For instance, Yu et al. used it to reveal how land cover change during urbanization affects ecological quality [
20]. Although many studies confirm the interaction between human activity and the ecological environment, HF and EQ are often studied separately. Most research on driving mechanisms focuses on how human activity impacts ecosystems, overlooking how structural features of human–environment systems affect coordination. Therefore, it is crucial to investigate the spatiotemporal interactions between HF and EQ fully to understand their interactive stress relationship.
2.3. Coordinated Management of Human Activity and the Ecological Environment
Given the close interconnections among components of the human–environment system, it is essential to establish an integrated management framework to support decision-making for coordinated development. Common ecological zoning approaches typically rely on the spatial overlay of indicators, coupling coordination degree, and quadrant model results, dividing regions into multiple management types based on predefined thresholds [
21,
22,
23]. For example, Zhou et al. used a four-quadrant model of human activity and landscape patterns to identify harmonious development zones, stable transition zones, environmental regulation zones, and risk prevention zones [
24]. However, these methods are primarily based on static two-dimensional overlays and fail to capture the dynamic coupling mechanisms that evolve within the system, leading to delayed or outdated management responses. Because humans have become a fundamental part of ecosystems, some scholars have begun incorporating human needs into ecological network design. For instance, Jia et al. integrated human demand for ecosystem services into constructing an ecological security pattern in the middle reaches of the Yangtze River urban agglomeration [
25]. Nevertheless, such approaches often focus on static demand at a specific time and are not well-equipped to address ongoing disturbances and feedback associated with rapid urbanization.
To overcome the limitations of static zoning, Lei et al. proposed a new management framework based on the dynamic evolution of the human adaptation index and the ecological environment composite index. Their classification includes four types of regional change: up-up, down-up, down-down, and up-down [
26]. This framework improves upon traditional static approaches by capturing the dynamic information within human–environment systems. However, this method does not thoroughly examine the interaction mechanisms among indicators within the human–environment system and lacks systematic integration with spatiotemporal differentiation patterns. As a result, it remains insufficient to fully address the evolving coupling trends of human and environmental factors. Therefore, it is necessary to develop an integrated management framework that incorporates both the interaction between HF and EQ and the combination of static states and dynamic trends. Using such a framework, this study aims to support more systematic strategies for coordinated human–environment development, particularly in complex systems such as lake-dense urban agglomerations.
2.4. Research Gaps
Recent studies highlight both trade-offs and synergies between urban development and ecological protection. However, key gaps remain in current research. (1) Regarding indicator construction, existing HF and EQ assessment systems have been developed independently within their respective fields without fully considering the suitability of these indicators in lake-ring geographical environments. (2) Regarding interaction effects, studies on the coupling and interaction between HF and EQ are still insufficient. In particular, lake-ring urban agglomerations’ unique water gradient conditions have not been adequately addressed. Moreover, current research on driving mechanisms tends to overlook the influence of specific HF and EQ components on the overall coordination level of the human–environment system. (3) Regarding management mechanisms, most ecological zoning studies use static, time-specific analyses and fail to capture dynamic changes in HF and EQ or their long-term implications for coordinated development.
3. Materials and Methods
3.1. Study Area
This study takes the urban agglomerations surrounding China’s five major freshwater lakes (Poyang Lake, Dongting Lake, Taihu Lake, Hongze Lake, and Chaohu Lake) as research cases (
Figure 1). These include the Poyang Lake Ring Urban Agglomeration (PYU), Dongting Lake Ring Urban Agglomeration (DTU), Taihu Lake Ring Urban Agglomeration (THU), Hongze Lake Ring Urban Agglomeration (HZU), and Chaohu Lake Ring Urban Agglomeration (CHU). The study areas of the five lake-ring urban agglomerations are defined according to the research by Li [
27]. These regions lie within the Yangtze River Basin and the Huaihe River Basin—two critical ecological function zones—and are among China’s most urbanized and socio-economically developed areas. In recent years, increasing human activities in the highly sensitive geographical units of the lake network have led to ecological security issues, including water pollution, land degradation, and biodiversity loss. The human–environment system imbalance is becoming more apparent in these five lake-ring urban agglomerations. Therefore, this study employs the research scale of “China’s lake-ring urban agglomerations—five urban agglomeration units—1 km grid” to conduct dual-dimensional integrated management research focusing on HF and EQ interactions.
3.2. Data Source and Processing
The experimental data involved in this study primarily focus on two components: HF and HQ. For HF, the study used data on land use and land cover change, population density (POP), nighttime light (NL), and GDP density (GDP). The land use and land cover change data came from the Resource and Environment Science and Data Center (
www.resdc.cn, accessed on 22 January 2025). POP data were obtained from the WorldPop website (
https://www.worldpop.org/, accessed on 22 January 2025). NL data were acquired from the NOAA National Centers for Environmental Information (
https://www.ncei.noaa.gov/, accessed on 22 January 2025). GDP data originated from the study by Chen [
28].
For HQ, the study used three Moderate Resolution Imaging Spectroradiometer (MODIS) datasets to calculate the RSEI. MODIS, developed by the National Aeronautics and Space Administration, is a spaceborne remote sensing sensor (
https://earthexplorer.usgs.gov, accessed on 26 January 2025) that supports large-scale ecological monitoring [
29]. Specifically, MOD13A1 calculated the normalized difference vegetation index (NDVI), MOD11A2 estimated land surface temperature (LST), and MOD09A1 derived wetness (WET) and the normalized difference bare soil index (NDBSI). To ensure comparability and temporal consistency, high-quality MODIS images in 2000, 2010, and 2020 were selected. To eliminate interference from large water bodies in the wetness component, the study applied a normalized water index for masking. During data preprocessing, all data were standardized into a 1 km grid using the Krasovsky_1940_Albers projection system.
3.3. Methodology
Figure 2 illustrates the technical route of this study, comprising the following four aspects. (1) Multi-period comprehensive atlas of HF and EQ: The HF atlas was derived using remote sensing image interpretation in ENVI (version 5.3,
https://envi.geoscene.cn/, accessed on 11 December 2024) and spatial analysis techniques in ArcGIS (version 10.6,
https://www.esri.com, accessed on 11 December 2024). Meanwhile, the EQ atlas was derived using the RSEI index. (2) Multi-scale evolution trends of HF and EQ: the spatiotemporal evolution trends of HF and EQ were analyzed using spatial overlay techniques in ArcGIS. (3) Spatiotemporal coupling effects of HF and EQ: The coordinated development level between HF and EQ was quantified using the CCD model. Additionally, HF and EQ’s influence mechanisms on CCD were investigated using the GeoDetector model. (4) Integrated zoning management of HF and EQ: The HF-EQ four-quadrant model was applied for static quadrant combination zoning. Next, the CCD dynamic change rate index was used to determine dynamic matching zoning. Finally, static zoning and dynamic matching were integrated to delineate human–environment coordinated development management zones.
3.3.1. HF Measurement
Human activities primarily affect the ecological environment via factors such as land use, human and economic activities, and infrastructure [
30]. The HF index method accounts for the interaction between human impact and the affected area. Therefore, this study selects the land use intensity index (LUI), POP, NL, and GDP to construct the HF indicator system. The equivalent coefficients for different land use types in the LUI are shown in
Table 1 [
31]. Given that the indicators represent different but complementary aspects of human activities, and that no authoritative weighting system currently exists, this study calculates the human impact index using an equal-weighting method after normalization. This approach has been widely applied in the existing literature and helps maintain the model’s practicality when prior quantitative relationships among indicators are lacking [
32,
33]. The formula for calculating HF is as follows:
where
denotes the cumulative HF at grid
i in year
t; this index combines the impacts of different human factors, including LUI, POP, NL, and GDP. According to the study area’s characteristics, this paper categorizes HF into five levels: very weak (0–0.05), weak (0.05–0.1), moderate (0.1–0.15), strong (0.15–0.2), and very strong (0.2–1).
3.3.2. EQ Measurement
To accurately represent the ecological environment status of lake-ring urban agglomerations, this study employs the RSEI model to measure the spatiotemporal distribution of EQ. Within the Pressure–State–Response conceptual framework, the RSEI index selects NDVI, WET, NDBSI, and LST as EQ indicators from the dimensions of greenness, humidity, dryness, and thermal factors, respectively. Compared to evaluations using a single remote sensing indicator, RSEI more comprehensively captures the response of the ecological environment to human activities, making it more advantageous. The RSEI calculation process does not require manual intervention, yielding objective and reliable results. Due to space limitations, detailed calculation methods for each indicator can be found in the references [
34,
35,
36]. Principal Component Analysis is conducted on the four normalized indicators to extract the first principal component. The initial RSEI undergoes normalization to calculate the final RSEI. The calculation formulas for EQ are as follows:
where
represents the normalized value of the
ith indicator;
is the value of the
ith pixel;
is the indicator’s minimum value;
the indicator’s maximum value. To facilitate statistical analysis, this study categorizes EQ into five levels: very poor (0–0.2), poor (0.2–0.4), moderate (0.4–0.6), good (0.6–0.8), and excellent (0.8–1.0).
3.3.3. Exploring the Spatiotemporal Interaction Effects of HF and EQ
- (1)
CCD model
The CCD reflects the extent of mutual constraint and coordinated development between different systems and serves as an important tool for assessing the synergy and balanced development of regional human–environment systems [
37]. Compared with traditional linear methods such as Pearson correlation, the CCD model considers both the coupling strength and the development level between two systems. This makes it more suitable for evaluating the interaction effects between variables like HF and EQ, which differ in units, scales, and properties. As a result, CCD model has been widely used in geographic and ecological studies. This study uses the CCD model to evaluate the coupling coordination between HF and EQ. The model consists of three components: coupling degree (C), development coordination degree (T), and coupling coordination degree (D). The coupling degree reflects the strength of interaction among systems, while the coordination degree indicates the level of synergy between them. The calculation formulas are as follows:
where
represents the coupling degree;
denotes the coordination degree;
is the CCD;
and
are the normalized values of HF and HQ, respectively. The weights
and
represent the contributions of the two systems. Since both subsystems are equally significant in evaluating the CCD between HF and HQ, they are assigned equal weights (
=
= 0.5). To classify different types of coupling coordination states, this study draws on relevant research in ecological environmental quality assessment and urban coordinated development [
38]. The CCD is divided into seven levels based on the actual distribution characteristics of HF and EQ in the study area (see
Table 2). This classification has shown good adaptability in analyzing ecological–social system coupling.
- (2)
GeoDetector
To further identify the driving mechanisms behind the coupling coordination between HF and EQ, this study applies the GeoDetector model. Unlike traditional regression methods, GeoDetector does not rely on linear assumptions and is unaffected by multicollinearity. It effectively reveals the explanatory power of spatial factors on the distribution of CCD and their interaction mechanisms. As a result, it has been widely used in studies of complex human–environment systems. This study utilized the R package (R version 4.3.3,
https://cran.r-project.org, accessed on 25 February 2025) developed by Song [
39], applying the factor detection and interaction detection modules to identify each driving factor’s stress intensity and interaction mechanisms. Factor detection examines the spatial heterogeneity of influencing factors and their explanatory power about the spatial differentiation of CCD between HF and HQ, with results quantified by the q-value. The calculation formula is as follows:
where
h = 1,…; L indicates the stratification or classification of variable
Y or factor
X;
denotes the number of units in layer
;
is the number of units in the entire region;
represents the variance of
Y values in layer
;
indicates the variance of
Y values across the entire region.
Interaction detection assesses the combined impact of two factors on CCD, examining whether the interaction between factors
X1 and
X2 strengthens or reduces their explanatory power for CCD and whether their effects are independent.
Table 3 shows the five types of interaction effects between the two factors.
3.3.4. Integrated Static–Dynamic Human–Environment Coordination Management of HF and EQ
- (1)
Static quadrant zoning based on the HF-EQ four-quadrant model
The four-quadrant model identifies the matching state between two indicators and has been widely used in regional coordinated development studies [
40]. This study applies the four-quadrant model to conduct static zoning of the interaction stress relationship between HF and HQ in lake-ring urban agglomerations across various periods. The model plots HF on the horizontal axis and HQ on the vertical axis, forming a four-quadrant framework. Based on quadrant differentiation, the model identifies four static matching patterns of HF and HQ: SI (High HF–High HQ), SII (Low HF–High HQ), SIII (Low HF–Low HQ), and SIV (High HF–Low HQ).
- (2)
Dynamic evolution zoning based on CCD change rate
Static zoning offers insights into the HF-HQ matching state at a specific point in time but fails to capture the dynamic evolution of the indicators. Therefore, this study introduces the dynamic change rate of CCD to depict the dynamic matching relationship between HF and HQ. The calculation formula is as follows:
where
denotes the dynamic change rate of CCD;
and
represent the CCD values in years
and
, respectively. Depending on the positive or negative attributes of
, this study defines two dynamic matching categories: D1 (
> 0) indicates a trend towards coordinated development between HF and HQ. D2 (
< 0) denotes a trend towards antagonistic development between HF and HQ.
- (3)
Human–environment coordinated management zoning of HF-HQ
Considering the need for timely management zoning and the discrepancies between static and dynamic zoning, this study initially applied the static quadrant results of HF-HQ in 2020. It combined them with the dynamic CCD zoning to form eight subcategories. Finally, based on the sustainable development potential of each subcategory, this study developed a human–environment synergy management map consisting of five major categories. (1) Human–environment synergy efficiency zone (HSEZ) (SI-D1): Both HF and HQ are at high levels, and the CCD shows an improving trend. These areas exhibit the optimal state of human–environment coordination. (2) Ecological conservation potential zone (ECPZ) (SII-D1): HF is low, but EQ exhibits high quality, with a positive trend in coordinated development. These areas offer significant potential for ecological protection and moderate development. (3) Human–environment restoration synergy zone (HRSZ) (SIII-D1, SIV-D1): The current static state of EQ remains poor, but the CCD shows an improving trend, indicating restoration potential. This zone should strengthen ecological restoration measures to accelerate the recovery of human–environment synergy. (4) Human–environment imbalance regulation zone (HIRZ) (SI-D2, SII-D2): The current state of EQ is relatively good, but the CCD shows a deteriorating trend. These areas have some potential for remediation and should balance the coordinated development of HF and EQ. (5) Human–environment conflict alert zone (HCAZ) (SIII-D2, SIV-D2): The current state of EQ is poor, and the CCD has significantly deteriorated. Strict governance measures must be urgently implemented in this zone to mitigate the risk of human–environment imbalance.
4. Results
4.1. Spatiotemporal Evolution Patterns of HF and EQ
4.1.1. Spatiotemporal Evolution Characteristics of HF
Figure 3a shows the numerical development trend of HF in China’s lake-ring urban agglomerations from 2000 to 2020. Overall, HF values in the lake-ring urban agglomerations exhibited a marked increase over the 20 years. The proportion of low-value areas (Levels I and II) decreased progressively from 74.64% to 62.41%. The buffer zone (Level III) remained stable, fluctuating between 11.70% and 12.58%. The proportion of high-value areas (Levels IV and V) rose from 12.79% to 25.89%, with Level V exhibiting the highest growth rate of 169.11%. For each urban agglomeration, (1) in DTU and PYU, low-value areas predominated, with multi-year average proportions of 87.71% and 90.17%, respectively. Although the high-value areas remained low in proportion, they experienced rapid growth, increasing by 236.20% and 315.71%, respectively. This trend suggests an increasing risk of potential human–environment conflict. (2) CHU and HZU showed significant growth in the buffer zone proportion. The proportion of low-value areas in CHU declined markedly compared to DTU and PYU, approaching the regional average (63.25%). HZU had the highest proportion of buffer zones (30.08%), indicating a marked tension between urban expansion and ecological protection. (3) THU represented the only urban agglomeration where high-value areas form the absolute majority, demonstrating a continuous expansion trend. The Level V increased from 29.19% to 64.03%. This urban agglomeration contributed 119.38% to the increase in V-level areas, making it a critical zone for controlling the further intensification of HF in China’s lake-ring urban agglomerations.
Based on the numerical analysis results, this section further examines the spatiotemporal evolution characteristics of the HF pattern in lake-ring urban agglomerations (
Figure 3b). Overall, the mean HF values from west to east across the urban agglomerations were 0.0525, 0.0452, 0.1052, 0.0928, and 0.2509, respectively, forming a distribution pattern of “higher in the east and lower in the west.”. The HF distribution within the study area demonstrates three distinct spatial patterns among five lake-ring urban agglomerations: (1) DTU and PYU displayed an HF distribution featuring a distinct point-like radial structure, dominated by low-value forested areas at high inland altitudes, with high-value urban centers near the lakeshore interspersed as radiating nodes. This spatial pattern has become increasingly polarized over time. (2) The spatiotemporal distribution pattern of CHU and HZU exhibited a multi-level clustering structure, with dominant central cities as the primary core and prefectural government seat locations as secondary nodes. In CHU, the dominant city was Hefei, the provincial capital located on the western shore of Chaohu Lake, while in HZU, it was Huai’an, a transportation hub city situated north of Hongze Lake. The spatial uniformity of HF became more evident over time. (3) THU displayed an HF distribution featuring a ring-shaped spatial pattern, with clusters of high-value areas around Taihu Lake extending toward the built-up coastal urban areas in the east. In summary, the HF values of the lake-ring urban agglomerations indicate an increasing intensity of human intervention. The spatial development demonstrates a strong hydrophilic tendency, primarily characterized by outward growth from the lake center along river corridors.
4.1.2. Spatiotemporal Evolution Characteristics of EQ
Figure 4a illustrates the numerical development trend of EQ in China’s lake-ring urban agglomerations. Overall, the EQ values in the lake-ring urban agglomerations demonstrated a fluctuating trend over the 20 years. The multi-year average proportion of low-value areas remained relatively low (13.27%), showing a trend of initial decline followed by recovery. The buffer zone decreased from 39.08% to 31.84% in the first 10 years and rose to 36.10%. High-value areas maintained the highest multi-year average proportion (51.06%), increasing from 47.00% to 56.88% before falling back to 49.30%. For the five lake-ring urban agglomerations, the following patterns were observed. For each urban agglomeration, (1) the category proportion ranking for DTU and PYU was low-value areas < buffer zone < high-value areas. The two agglomerations exhibited significantly different evolution trends. DTU displayed a trend of continuous deterioration, with the proportion of low-value areas increasing by 139.14%. In contrast, PYU showed an improving trend, with the high-value area rising to the highest level across the region (64.64%) by 2020. (2) CHU and HZU exhibited a trend of initial improvement followed by deterioration, indicating the high sensitivity of lake-ring urban agglomeration ecosystems to external disturbances. Notably, HZU experienced greater fluctuations than CHU, mainly due to urbanization expansion, changes in lake humidity, and vegetation coverage. (3) As the urban agglomeration with the lowest HQ level, THU showed the highest and lowest multi-year average proportions of low-value and high-value areas, respectively (29.42% and 26.78%). Over time, the buffer zone and high-value areas continuously decreased, while the low-value areas continuously increased, with change rates of −20.11%, −44.81%, and 210.01%, respectively. The deterioration of EQ in THU is likely linked to declining vegetation coverage, surface drying, and degradation of the thermal environment.
Figure 4b presents the raster-based visualization analysis of the spatiotemporal evolution pattern of China’s lake-ring urban agglomerations from 2000 to 2020. Overall, the mean EQ values from west to east were 0.6486, 0.6237, 0.5492, 0.5728, and 0.4799, respectively, forming a distribution pattern opposite to that of HF, with higher values in the west and lower values in the east. For each urban agglomeration, (1) DTU and PYU exhibited a concentric progressive structure. Lake-ring low-value areas occupied the first layer, buffer zones overlapped with croplands to constitute the second layer, and high-value areas composed the third layer in the peripheral forest regions. During the study period, the first layer increasingly converged toward the city center, the second layer displayed an unstable distribution, particularly shifting from the southeast to the northwest in DTU, and the third layer showed weak spatial fluctuations. (2) CHU and HZU underwent significant spatial pattern changes. In 2000, CHU was dominated by the III-level buffer zone. HZU formed a heterogeneous distribution with III-level in the east and II-level in the west, divided by Hongze Lake. By 2010, the I-level low-value areas around the core cities of Hefei and Huai’an had significantly expanded. Additionally, a large portion of the buffer zone shifted to high-value areas. By 2020, the high-value area partially receded, while the low-value area continued expanding toward the outer suburbs of the core cities. (3) THU exhibited a multi-core low-value aggregation pattern centered around cities such as Shanghai, Suzhou, Wuxi, Changzhou, and Hangzhou. The urbanization process drove the expansion of low-value areas along transportation corridors toward suburban areas, forming a lake-ring low-value cluster by 2020. These results suggest that EQ experienced more pronounced fluctuations than HF, emphasizing the urgency of ecological restoration interventions.
4.2. Spatiotemporal Interaction Effects of HF and EQ
4.2.1. Coupling Coordination Level of HF and EQ
Given the high complementarity between the HF and EQ patterns in China’s lake-ring urban agglomerations, this section employs the CCD model to determine their coupling coordination level.
Figure 5a presents the proportion of each CCD category for the five lake-ring urban agglomerations. Overall, the moderate CCD category accounted for the most significant proportion in China’s lake-ring urban agglomerations. The Level V and higher proportions remained relatively low but exhibited an increasing yearly trend. For each urban agglomeration, (1) DTU was dominated by CCD categories III and IV, with Level IV maintaining the highest long-term proportion (38.30%), indicating a relatively good level of human–environment coordination. From 2000 to 2020, the overall CCD pattern in DTU remained stable. Level III showed the highest decrease (−13.12%), while the high-CCD areas of VI and VII levels had a low proportion but grew rapidly. (2) PYU’s CCD primarily consisted of Levels II-IV, with Level III exhibiting the highest multi-year average proportion (31.99%). Over time, Levels I-III displayed a decreasing trend, while Levels IV–VII showed annual increases. (3) CHU’s CCD category proportions resembled those of DTU, but the proportion of Grade IV was higher (50.45%). From 2000 to 2020, Level III exhibited the most substantial decline (−46.63%), while the proportions of Levels V–VII rose markedly, indicating an overall improvement in coordination. (4) HZU mainly consisted of CCD Levels IV and V. Level IV exhibited an overall declining trend followed by a rebound, dropping from 50.23% to 25.36% before rebounding to 34.45%. In contrast, Level V became the dominant category after 2010. (5) THU had the highest CCD level among the five urban agglomerations. Between 2000 and 2020, the proportion of levels below IV decreased, while levels above VI expanded significantly, indicating a gradual improvement in human–environment coordination.
Visualization techniques allowed for a more precise observation of the spatiotemporal evolution process of CCD (
Figure 5b). Overall, the multi-year average CCD values of the five lake-ring urban agglomerations from west to east were 0.3740, 0.3371, 0.4485, 0.4930, and 0.5143, respectively, indicating a gradual upward trend over the years. For each category, (1) high-CCD zones (Levels V–VII) formed a belt or ring-like pattern around the built-up areas of each urban agglomeration. The high-value areas continued expanding, especially in the peripheral transportation corridors of CHU, HZU, and THU, which formed distinct connections. (2) CCD buffer zones (Level IV) were primarily located in lakeside croplands and low-altitude plains, forming well-connected transitional layers. Notably, some city centers also exhibited moderate CCD levels due to overdevelopment. With the intensification of urbanization, the buffer zone has borne the burden of industrial relocation and ecological intervention, showing a trend of transitioning into high-value areas. This trend is particularly evident in the buffer zones of CHU, HZU, and THU plain croplands. (3) Low-CCD zones were concentrated in low-density forested regions distant from the lakes, such as the edges of DTU and PYU and the southern parts of CHU, HZU, and THU. These areas retained relatively intact ecological functions, experienced minimal human activity pressure, and consistently maintained low CCD levels. In summary, the overall CCD of China’s lake-ring urban agglomerations exhibited a positive development trend. The interaction between policy guidance and land use patterns was pivotal in influencing its spatiotemporal differentiation.
4.2.2. Interactive Stress Mechanism of HF and EQ on CCD
Factor Detection Results
Based on a comprehensive analysis of the CCD in China’s lake-ring urban agglomerations, this section explores the driving mechanisms of HF and EQ indicators on CCD.
Figure 6 presents the results of the factor detection model for China’s lake-ring urban agglomerations and each individual agglomeration. The impact of each driving factor on CCD in the study area was statistically significant (
p < 0.05), demonstrating robust and reliable results. For the entirety of China’s lake-ring urban agglomerations (
Figure 6a), the HF dimension factors demonstrated relatively high explanatory power for CCD. The most significant contributing factor to CCD was identified as GDP (q = 0.4218), followed by LUI (q = 0.4183) and NL (q = 0.4068). In contrast, the EQ dimension factors exhibited weaker explanatory power for CCD, with NDVI showing the highest contribution (q = 0.2979). During the study period, LST exhibited the highest increase in explanatory power for CCD, rising from 0.0336 in 2000 to 0.2253 in 2020. NDBSI followed, with its contribution increasing from 0.0985 to 0.1799. In summary, the long-term impact of the HF dimension on CCD exceeded that of other dimensions, highlighting its critical role in human–environment coordinated development. The explanatory power of the HQ dimension for CCD increased more significantly over time compared to the HF dimension, indicating the growing importance of the ecological environment in enhancing human–environment coordination.
The factor detection results for the five lake-ring urban agglomerations (
Figure 6b) showed that the ranking of driving factor contributions to CCD was THU > PYU > DTU > CHU > HZU. From 2000 to 2020, except for a slight decrease in THU (−2.87%), the average contribution of driving factors in other lake-ring urban agglomerations exhibited an increasing trend. For each urban agglomeration, (1) in DTU, LUI consistently remained the dominant factor. NDBSI and LST exhibited substantial growth in explanatory power for CCD, increasing by 248.26% and 194.46%, respectively. This highlights the growing role of bare soil and temperature changes in human–environment coordination. (2) In PYU, the dominant factors included LUI (0.2257), NDVI (0.2810), and NL (0.3281) in order of importance. The contribution of LST increased to 0.2615 by 2020, indicating the growing impact of the thermal environment on human–environment coordination. (3) In CHU, the contributions of NL, GDP, NDVI, and LST showed the most significant increases. NL increased from 0.1781 to 0.3495, emerging as the dominant factor in 2020. In contrast, LUI consistently maintained a high level with minimal fluctuation. (4) In HZU, the contributions of all factors remained relatively weak, showing either stability or mild growth. In 2020, NL and GDP led with values of 0.2875 and 0.2623, respectively, while the growth of EQ-related indicators remained limited. (5) In THU, HF dimension factors consistently remained high, significantly driving CCD development. Although WET and NDVI showed slight declines, they remained higher than those in other urban agglomerations, indicating that EQ regulation still played a crucial role. Overall, THU has developed a stable driving structure, while other urban agglomerations must strengthen EQ regulation capacity to achieve a higher level of human–environment coordination.
Interaction Detection Results
Using interaction detection within the Geographical Detector, this section further discusses the explanatory power of CCD when two factors interact (
Figure 7). Unlike single-factor detection, factor interactions significantly enhanced the influence of each factor on CCD, indicating that a single-factor approach is insufficient to understand CCD changes comprehensively. For the entirety of China’s lake-ring urban agglomerations (
Figure 7a), in 2000, HF factor combinations with other factors primarily showed bi-variable enhancement. The most significant interaction effects were observed in LUI∩GDP (q = 0.55) and LUI∩NL (q = 0.56), indicating that urban expansion and economic development jointly drove the early evolution of human–environment coordination. Although EQ factor combinations exhibited lower contributions (q < 0.4), they demonstrated nonlinear enhancement. In 2010, the interaction patterns of driving factors further intensified. The interaction contributions of LUI∩GDP (q = 0.56), LUI∩NL (q = 0.58), and POP∩GDP (q = 0.47) increased steadily, emphasizing the ongoing dominant role of population and economic activities in CCD changes. While EQ factor combinations maintained nonlinear enhancement, the overall contribution increase was limited. By 2020, the interaction effects grew stronger. The interaction contributions of LUI∩GDP, NL∩NDVI, and NL∩LUI exceeded 0.58, indicating that the coordination mechanism between human activities and the environment became more complex under the dual pressure of economic growth and land use. The interaction between EQ factors, such as NDVI∩NDBSI, and WET∩LST, also increased. Overall, the dominance of socio-economic factor interactions has continued to rise, while the cumulative effects of ecological factors have gradually become more apparent.
The interaction detection results for factor combinations in the five lake-ring urban agglomerations (
Figure 7b) indicated that the ranking of interaction factor contributions to CCD followed the order THU > DTU > PYU > CHU > HZU. From 2000 to 2020, the interaction intensity in DTU, PYU, and CHU increased, while HZU and THU declined in 2010 followed by a rebound. For each urban agglomeration, (1) in DTU, the dominant combinations expanded from LUI-related factors to include EQ dimension factors such as NDVI and LST, highlighting the multidimensional evolution of the human–environment coordination mechanism. (2) In PYU, the interaction intensity was relatively weak in 2000. Starting in 2010, the interaction between NL, GDP, and other factors gradually strengthened and further intensified by 2020. It reflects the driving role of economic activities in optimizing the human–environment system. (3) In CHU, the factor interaction intensity before 2010 was mainly dominated by LUI-related combinations. By 2020, the dominant interactions shifted to NL-related combinations, indicating that urban land expansion and economic development led to CCD evolution. (4) In HZU, the overall interaction strength was relatively weak, with HF dimension factors dominating the combinations. The overall q-value increase for EQ dimension factor combinations such as WET∩NDVI and WET∩NDBSI was limited, indicating that the ecological regulation effect had not yet fully manifested. (5) In THU, the interaction contribution ranked the highest, with NL and GDP-related factor combinations consistently dominating. However, over time, the interaction intensity slightly declined. This reflects that, against stabilized human–environment relationships, the marginal driving effect in THU has weakened, and the system’s response elasticity has slowed.
4.3. Human–Environment Coordinated Development Zoning Management of HF and EQ
4.3.1. Static Quadrant Zoning of HF-EQ
The interactive relationship between HF and EQ highlights the necessity of human–environment coordinated management. This section presents static quadrant zoning for various periods.
Figure 8a illustrates the scatter plot distribution of the static relationship between HF and EQ across three time points. Overall, the sample points exhibited a reverse distribution trend in China’s lake-ring urban agglomerations, suggesting a strong negative correlation between HF and EQ. The density of points in SII consistently remained the highest. The density of points in SIV continued to increase, with the boundary expanding outward to the lower right, reflecting the intensifying stress caused by human activities on the ecosystem and the gradual expansion of non-coordinated areas. For each urban agglomeration, (1) in DTU and PYU, the sample points were concentrated in the SII quadrant. SII and SIII exhibited continuous clustering near the EQ critical value over time. (2) In CHU and HZU, numerous points initially clustered in SIII. From 2010 onwards, SIII gradually transformed into SII and SIV, emphasizing the increasingly intense antagonistic development trend within the human–environment system. (3) In THU, SIV consistently dominated throughout the three periods, with dense points and a wide range. Simultaneously, the boundaries of SIII continuously clustered toward the lower right, indicating that degraded ecological areas are transforming into regions with high human disturbance, further exacerbating non-coordination characteristics.
Figure 8b presents the raster-based visualization of the static quadrant zoning. From an overall spatial pattern perspective, the dominant quadrants of the lake-ring urban agglomerations from west to east are SII (88.68%), SII (76.62%), SII (63.57%), SII (61.85%), and SIV (39.35%), respectively. The overall coordination level of the human–environment system appeared mismatched. For each category, (1) SI had the lowest proportion, forming a peripheral ring around urban built-up areas, indicating a few areas where development and ecological coexistence were achieved. During the study period, SI showed a slight expansion around the built-up areas of DTU, PYU, CHU, and HZU but generally remained low. This suggests that achieving coordination in areas with high development intensity remains challenging. (2) SII had the highest proportion among the five urban agglomerations, primarily in low-interference areas distant from the urban core. Initially, due to surface vegetation and humidity improvements, SII transitioned from SIII in the northern part of CHU and the western part of HZU. Subsequently, as HF increased, SII gradually transformed into SIV, most notably in THU. (3) SIII emerged in a patchy and scattered pattern between SII and SIV, largely overlapping with degraded forest land and low-efficiency cropland. During the study period, SIII mostly transformed into SII or SIV, with only a slight increase in localized irrigation areas in DTU. (4) SIV was predominantly concentrated in each urban agglomeration’s central urban areas, transportation corridors, and lakeside development zones. This quadrant exhibited continuous expansion across all urban agglomerations, most notably in THU, where the area proportion increased from 18.75% to 54.62%. The expansion trend indicates the significant intensification of ecological stress driven by urbanization.
4.3.2. Dynamic Evolution Zoning of HF-EQ
Next, this study calculated the CCD change rate from 2000 to 2020, with the identified dynamic evolution zones presented in
Figure 9. Overall, D1 is the dominant dynamic category among the five lake-ring urban agglomerations. In contrast, D2 decreases progressively from west to east, with proportions of 45.79% in DTU, 29.37% in PYU, 19.03% in CHU, and 10.90% in HZU, but shows a rebound in the easternmost THU (23.53%). This distribution pattern indicates that excessively high and low CCD values can undermine human–environment coordinated development. For each category, (1) D1 displayed a sheet-like or belt-like pattern, widely distributed in each urban agglomeration’s waterfront, low-hill, and plain water network areas. This category often highly overlapped with low-CCD areas. (2) D2 in DTU and PYU was mainly located in urban core areas and ecological forest lands, while in CHU, HZU, and THU, it was primarily found in urban–rural transitional zones, mixed agricultural and construction areas, and ecological edge regions. This category highly overlapped with CCD buffer zones and high-value areas. The above patterns indicate that mixed and transformed land use patterns are key influencing factors for fluctuating human–environment system coordination. As the urbanization process advances, the interplay between HF and EQ becomes increasingly complex, emphasizing the urgent need to strengthen the regulation of deteriorating high-CCD areas.
4.3.3. Human–Environment Coordinated Management Zoning of HF-EQ
This study integrated the static and dynamic HF-EQ categories to classify eight subcategories and five major human–environment coordinated development management zones (
Figure 10).
Figure 10a illustrates the numerical distribution of human–environment coordinated management zones in China’s lake-ring urban agglomerations. Overall, in China’s lake-ring urban agglomerations, ECPZ represented the most significant proportion (45.74%), indicating that most areas remained in a low-development or restoration transition stage. HRSZ and HIRZ comprised 20.63% and 20.57%, respectively. In HIRZ, the proportion of SII-D2 was notably high, indicating that areas with initially good ecological conditions faced significant development pressure. HSEZ and HCAZ each represented less than 10%. For each urban agglomeration, (1) DTU and PYU had ECPZ as the dominant zone (45.38% and 55.60%, respectively), indicating potential for human–environment coordinated development. HIRZ exceeded 20% in both, with the combined SII-D2 proportion reaching 62.22%. This indicates that areas with relatively good ecological conditions were already experiencing significant development pressure. (2) CHU and HZU had similar human–environment management structures, with ECPZ exceeding half (52.99% and 55.46%, respectively). HRSZ also represented a significant proportion (22.19% and 25.76%, respectively). HSEZ and HCAZ proportions were greater than those in DTU and PYU. (3) In THU, HRSZ accounted for the most significant proportion (45.93%), indicating that despite the poor current human–environment coordination, it has potential for restoration. HSEZ and HCAZ in THU had the highest proportions among the five urban agglomerations, accounting for 12.04% and 15.84%, respectively. This suggests that THU’s human–environment system exhibits a governance pattern characterized by the coexistence of synergy restoration and conflict.
To illustrate the dual-dimensional integrated matching of human–environment coordinated management zoning, this study conducted a raster-scale visualization analysis for each category (
Figure 10b). The results indicate that (1) HSEZ formed a ring-shaped pattern around urban built-up areas, particularly in the lakeside plains of THU, HZU, and CHU. HSEZ demonstrated a diversified land use structure, indicating efficient human–environment synergy. (2) ECPZ was predominantly located in each urban agglomeration’s hilly and forested peripheries, particularly widely spread in DTU, PYU, CHU, and HZU. (3) HRSZ consisted of two subcategories: SIII-D1 and SIV-D1. SIII-D1 overlapped mainly with near-water croplands in DTU and PYU, as well as grain production areas in CHU and HZU. SIV-D1 was concentrated in the urban cores of DTU and PYU, as well as in the urban–rural fringe zones of THU, CHU, and HZU. (4) HIRZ was dominated by SII-D2, mainly distributed at the edges of DTU and PYU and in the southwestern ecological forest areas of CHU and THU. This indicates that areas with a good ecological foundation faced coordination imbalances during expansion. SI-D2 mostly appeared at the edges of urban core areas with relatively good ecological conditions, indicating that areas with high EQ under intense development pressure still struggled to achieve coordinated development. (5) HCAZ was primarily composed of the SIV-D2 subcategory, distributed in urban core areas, along major transportation corridors, and in lakeside development zones. SIII-D2 primarily occurred in degraded forest land and low-efficiency croplands. THU and CHU were the urban agglomerations with the highest proportions of these two subcategories. Being the most conflict-prone and high-risk area, HCAZ requires the prioritized implementation of strict human–environment intervention measures.
5. Discussion
5.1. Lake Diffusion Effects of HF and EQ in China’s Lake-Ring Urban Agglomerations
As an essential component of regional ecosystems, lakes provide key ecological services and act as critical spatial supports for urban expansion. From 2000 to 2020, the overall HF in China’s lake-ring urban agglomerations exhibited an evolution trend characterized by a significant increase and lakeward diffusion. The mean HF value increased progressively from west to east, forming a distinct gradient structure among the urban agglomerations. Regarding spatial patterns, the HF distribution in each urban agglomeration consistently exhibited hydrophilic characteristics. DTU and PYU primarily showed point-like diffusion, with high HF values radiating outward from the lakeside urban core. CHU and HZU formed multi-level aggregation patterns. THU exhibited a ring-shaped high-value zone around the lake and continued to expand along transportation corridors and coastal directions, reflecting the strong dependence of urban construction intensity on lake spaces. This “lake-centered” urban expansion pattern not only enhanced land development efficiency but also intensified stress on lake ecosystems [
41].
Compared to the continuous increase of HF, EQ exhibited a more fluctuating spatiotemporal evolution pattern, reflecting the ecosystem’s complex response to urban expansion disturbances. Overall, the mean EQ values showed a “higher in the west, lower in the east” pattern, with the change process exhibiting significant phase characteristics and regional differences. CHU and HZU displayed frequent EQ pattern changes. Urban expansion significantly compressed high-EQ areas, leading to a continuous outward spread of low-EQ zones along the waterfront. The most typical case is THU, where EQ exhibited low-value clustering characteristics. They are densely distributed around the lake areas of cities like Shanghai and Suzhou, rapidly expanding along transportation corridors. This indicates that high-intensity urbanization activities have posed systemic impacts on ecosystems.
The spatiotemporal evolution patterns of HF and EQ reveal a typical “lake diffusion effect,” where urban expansion concentrates near lakes due to a strong dependence on lake ecological resources during urban development [
42]. Without ecological red lines and land-use zoning constraints, this trend will significantly reduce the lake ecosystems’ carrying capacity. This phenomenon has also been reflected in previous studies. For example, Grant pointed out that urban growth tends to “grow toward the lake [
43].”. Chen et al. also pointed out that the development of urban infrastructure has led to habitat degradation in the Dongting Lake region [
44]. Without ecological red lines and land-use zoning constraints, this trend may reduce the lake ecosystems’ carrying capacity. This study validated this trend on a scale of lake-ring urban agglomerations. Lake-ring urban agglomerations are both urban expansion frontiers and ecologically sensitive areas. The intersection of HF and EQ spatiotemporal patterns makes lake surroundings the most prominent zones of human–environment conflict [
45]. As spatial carriers of human–environment system evolution, the lake-ring diffusion paths of HF and EQ profoundly affect the coordinated development level of urban agglomerations.
5.2. Spatiotemporal Mismatch Patterns of HF and EQ in China’s Lake-Ring Urban Agglomerations
CCD serves as a key indicator for assessing the interactive relationship between human activities and the ecological environment [
46]. In lake-dense regions, the relationship between urban development and ecological regulation functions is complex and nuanced [
47]. Although the HF and EQ patterns in China’s lake-ring urban agglomerations are complementary, their CCD indicates significant mismatches in the human–environment system across spatiotemporal dimensions. The results of
Section 4.2.1 showed that from 2000 to 2020, CCD levels in China’s lake-ring urban agglomerations gradually improved. The proportion of high-CCD areas significantly increased, especially in eastern urban agglomerations such as CHU, HZU, and THU. However, the spatial pattern of the human–environment system continued to exhibit considerable mismatches. For instance, in western DTU and PYU, low-disturbance forest areas maintained good EQ but had low CCD due to insufficient HF. Despite having high HF levels, some urban core areas struggled to achieve high coordination due to ecosystem degradation. A similar phenomenon was also reported in the study by Wan et al. [
48].
The above spatiotemporal mismatch pattern indicates that HF and EQ do not simply correlate positively. The strength of HF does not determine the quality of EQ; the key lies in their coordinated development. This finding aligns with the study by Jing in the Yangtze River Delta Urban Agglomeration, which suggested that rational development can achieve a high coordination level on the urban periphery [
49]. However, this study further indicates that the spatial context of water–land interlacing in lake-ring urban agglomerations makes coordinated improvement more reliant on land function restructuring and use transformation. For example, the cropland–forest buffer zones on the outskirts of CHU and HZU gradually transitioned from Level IV to Level V, forming a typical “belt-shaped high coordination zone.” This indicates that agricultural-dominated areas can transform from ecological deficit to ecological surplus through landscape optimization and ecological farmland construction. This trend has also been validated by Deng [
50].
The spatial mismatch between HF and EQ mainly stems from three mechanisms. First, the imbalance in urban functional layout causes high-intensity human activity areas to overlap with ecologically sensitive zones spatially. For example, the edges of transportation corridors in THU and CHU form low-CCD zones of “high HF–low EQ” by compressing ecological spaces. Second, areas with favorable ecological conditions but lacking proper guidance form low-CCD zones characterized by “high EQ–low HF.”. Typical areas include the forest edges of DTU and PYU. Third, policy coordination issues and other institutional factors lead to regional differences in the integration level of human–environment systems. This further exacerbates the spatial inequality of CCD. Moreover, Ni pointed out that ecological vulnerability in watershed areas is more likely to amplify mismatch effects [
51]. These mechanisms collectively drive the persistent mismatch between HF and EQ. Improving the CCD of lake-ring urban agglomerations in the future requires coordinated regulation of development intensity, ecological foundations, and governance strategies.
5.3. Driving Mechanisms of CCD Between HF and EQ in China’s Lake-Ring Urban Agglomerations
Scholars have extensively researched human-driven mechanisms affecting ecosystems in recent years using models such as geographically weighted regression (GWR), Barrier, and Tobit models [
52,
53]. Although these methods can quantify human–environment relationships, they do not account for the influence of HF and EQ on CCD. Furthermore, these models overlook the reinforcing or weakening effects of interactions between influencing factors on CCD. Unlike previous studies, this research introduced the GeoDetector model to address these shortcomings.
The GeoDetector’s factor detection results indicate that in China’s lake-ring urban agglomerations, HF-related indicators exhibit stronger explanatory power for CCD, especially GDP, LUI, and NL. These indicators represent the dominant influence of economic growth, land expansion, and human activity intensity on the level of coordination in human–environment systems. This result aligns with the study by Wan [
54], confirming the decisive role of socio-economic factors in the coastal eco-environmental complex system. At the same time, although EQ-related indicators such as NDVI, LST, and NDBSI show relatively weaker explanatory power, they have exhibited a significant upward trend over the study period. This pattern reflects ecological conditions’ increasingly prominent regulatory role in shaping human–environment interactions. The underlying mechanism can be understood in two ways. First, as land development pressure increases and ecological degradation risks intensify, LST and NDBSI have become more sensitive in reflecting ecological stress, thereby contributing more strongly to CCD. Second, implementing ecological restoration projects across regions, including wetland recovery and green space construction, has enhanced NDVI values and strengthened its effectiveness in indicating coordination levels. These trends suggest that ecological regulation is shifting from a passive response toward proactive intervention, and the role of ecosystem conditions in the evolution of human–environment systems are becoming increasingly significant. This trend is also supported by the study of Zhang in the middle reaches of the Yangtze River urban agglomeration, validating the positive feedback of ecological restoration [
29].
Interaction detection results reveal synergistic mechanisms are increasingly driving coupling coordination in lake-ring urban agglomerations among multiple factors rather than a single driver. Within the HF dimension, combinations such as LUI∩GDP, NL∩GDP, and LUI∩NL consistently showed strong enhancement effects from 2000 to 2020. NL intensity, as a proxy for population activity and infrastructure density, reinforces the “concentration–expansion” pattern of urban growth when combined with GDP and LUI. This interaction leads to a more pronounced nonlinear response in coupling human and environmental systems. Meanwhile, increasing interactions among EQ-related factors are also noteworthy. Combinations such as NDVI∩NDBSI and WET∩LST showed increased explanatory power, suggesting that ecosystems are responding to external pressures through complex feedback mechanisms. NDVI∩NDBSI reflects a dynamic trade-off between green space degradation and land exposure. Urban expansion may fragment or replace green space, but vegetation recovery offers a restorative effect on CCD. WET∩LST reflects a coupled response between moisture and thermal conditions. As surface water declines and thermal stress rises, ecosystem regulation is pushed to its limits, resulting in asymmetric feedback in the human–environment coupling. As these ecological interactions intensify, the system shows increasing regulatory capacity under development pressure, indicating emerging self-buffering behavior. Compared to Qin [
55], who emphasized that “rational development can achieve human–environment coordination,” this study further indicates that the driving mechanism of CCD has shifted from a single expansion-driven model to an “economic-ecological” cross-linked model.
Regional difference analysis shows that THU possesses the most mature human–environment coordinated development mechanism, with the contribution of its driving factors consistently remaining high. This indicates that the marginal driving effect in this urban agglomeration’s human–environment system stabilization phase has weakened. The driving structure of DTU and PYU is characterized by “HF dominance and EQ growth.” The increase in the explanatory power of EQ indicators such as NDVI, LST, and NDBSI reflects the growing pressure on ecological regulation faced by low-development areas. CHU and HZU exhibited a structural transition from LUI dominance to NL and GDP dominance. The regional differences further support the findings of Wang [
56].
5.4. Policy Implications for Human–Environment Coordinated Management Zoning in China’s Lake-Ring Urban Agglomerations
In rapid urban expansion and increasingly vulnerable ecosystems, constructing a scientific human–environment coordinated pathway is crucial for regional sustainable development [
57]. This study innovatively integrates the static and dynamic characteristics of HF and EQ, proposing a dual-dimensional human–environment management zoning method. This method considers the spatiotemporal heterogeneity of human development intensity and ecosystem response, addressing the limitations of traditional static and subjective ecological zoning [
58]. The findings provide a more practical management tool for complex lake-ring urban agglomerations.
Targeted governance strategies should be implemented according to different regions: (1) HSEZ should act as a model zone for human–environment coordination, prioritizing urban functions with high ecological benefits. Promoting green infrastructure and eco-friendly urban renewal can maintain ecosystem stability under high-intensity development. (2) ECPZ should adhere to a protection-first principle. Transforming the value of ecological products, establishing ecological compensation mechanisms, and moderately guiding low-impact development can prevent the paradox of “ecological surplus but functional inefficiency.” (3) HRSZ should expedite ecological restoration of degraded cropland and urban–rural fringe areas. For instance, promoting rural-urban integrated development can facilitate cropland remediation, green industry integration, and ecological corridor connectivity, enhancing system functional reorganization. (4) Although HIRZ has a strong ecological foundation, high development intensity significantly hinders coordinated development. Strengthening land use regulation and defining ecological control zones and construction boundaries can prevent further EQ degradation. (5) HCAZ represents the most prominent area of human–environment conflict and the highest ecological risk. Priority should be given to implementing ecological restoration, land reforestation, lakeside retreat, and restricting high-intensity construction. Strengthening ecological early warning mechanisms and promoting cross-regional collaborative governance are also recommended.
5.5. Limitations and Future Directions
The following research limitations need further investigation to achieve coordinated human–environment management of HF and EQ in China’s lake-ring urban agglomerations. First, the representativeness of the indicator system can be further improved. Currently, the quantification of HF and EQ mainly relies on remote sensing indicators and land use data. In the future, incorporating multi-source data could improve the perception depth of the human–environment system. Second, the dual-dimensional HF–EQ classification framework effectively captures the spatiotemporal interactions of the human–environment system. Future research could further explore functional extensions supported by multi-source data to enhance the practical value of zoning results. Third, as this study focuses on China’s lake-ring urban agglomerations, the findings’ adaptability to other geomorphic units remains unverified. Future research could apply this management framework to different regions to test its generalizability. Meanwhile, efforts should focus on integrating research findings into territorial spatial planning practices and developing mechanisms to implement zoning results in land use control.
6. Conclusions
This study introduces an innovative human–environment coupled system coordination framework specifically designed for China’s lake-ring urban agglomerations. The framework reveals the spatiotemporal coupling effects of HF and EQ in five typical freshwater lake urban agglomerations in China. It constructs a dual-dimensional human–environment coordination zoning management mechanism, providing practical guidance for sustainable development in lake-ring urban agglomerations. The study finds that from 2000 to 2020, HF in China’s lake-ring urban agglomerations increased steadily, while EQ fluctuation declined. HF expansion occurred mainly around lakefronts and transportation corridors, while EQ degradation was concentrated on urban edges and lakeside areas. The CCD between HF and EQ gradually increased in lake-ring urban agglomerations. High-CCD areas spread along urban edges and transportation corridors, while low-CCD areas are clustered in sparsely populated forested regions far from lakes. CCD is primarily driven by HF dimension factors, with economic activities and land use jointly dominating the coordination mechanism. EQ factors, though less influential, showed a noticeable interaction enhancement trend. Integrating the static quadrant distribution and dynamic evolution trend of HF and EQ, the study identified five types of human–environment coordinated development zones. HSEZ has a diversified land use structure, reflecting efficient coordinated development of the human–environment system. ECPZ is predominantly found in low-disturbance forested hills, acting as a key area for balancing ecological protection and moderate development. HRSZ is concentrated in croplands and urban–rural fringes with restoration potential, requiring urgent ecological restoration projects. HIRZ is mainly found in areas with a strong ecological base but increasing development intensity, requiring stricter land use control and green transformation. HCAZ is concentrated in urban cores, major transportation corridors, and lakeside development zones. These areas represent the highest-risk zones of human–environment conflict, requiring strict intervention measures. This study offers a scientific foundation for achieving differentiated human–environment coordination in China’s lake-ring urban agglomerations.
Author Contributions
Conceptualization, S.X. and F.Y.; methodology, S.X.; software, S.X.; validation, S.X. and F.Y.; formal analysis, S.X.; investigation, F.Y.; resources, F.Y.; data curation, S.X. and F.Y.; writing—original draft preparation, S.X. and F.Y.; writing—review and editing, S.X.; visualization, S.X.; supervision, F.Y.; project administration, F.Y.; funding acquisition, F.Y. All authors have read and agreed to the published version of the manuscript.
Funding
This research was funded by National Natural Science Foundation of China, grant Nos. 72174211, 51608535; Hunan Provincial Natural Science Foundation, grant No. 2018JJ3667; Philosophy and Social Science Foundation of Hunan Province, grant No. 19YBA347; Postgraduate Teaching Reform Project of Central South University, Grant No. 2020JGB139.
Institutional Review Board Statement
Not applicable.
Informed Consent Statement
Not applicable.
Data Availability Statement
The datasets generated and/or analyzed during the current study are not publicly available due project requirements but are available from the corresponding author on reasonable request.
Acknowledgments
The authors are grateful to the editor and reviewers for their valuable comments and suggestions.
Conflicts of Interest
The authors declare no conflicts of interest.
Abbreviations
| Abbreviation | Full name |
| EQ | Habitat quality |
| HF | Human footprint |
| CCD | Coupling coordination degree |
| RSEI | Remote Sensing-based Ecological Index |
| PYU | Poyang Lake Ring Urban Agglomeration |
| DTU | Dongting Lake Ring Urban Agglomeration |
| THU | Taihu Lake Ring Urban Agglomeration |
| HZU | Hongze Lake Ring Urban Agglomeration |
| CHU | Chaohu Lake Ring Urban Agglomeration |
| POP | Population density |
| NL | Nighttime light |
| GDP | GDP density |
| NDVI | Normalized difference vegetation index |
| LST | Land surface temperature |
| WET | Wetness |
| NDBSI | Normalized difference bare soil index |
| LUI | Land use intensity index |
| HSEZ | Human–environment synergy efficiency zone |
| ECPZ | Ecological conservation potential zone |
| HRSZ | Human–environment restoration synergy zone |
| HIRZ | Human–environment imbalance regulation zone |
| HCAZ | Human–environment conflict alert zone |
References
- Amponsah, O.; Boakye, O.; Tagnan, J.N.; Azunre, G.A.; Frempong, F.; Takyi, S.A.; Nanor, M.A. Why are ecologically sensitive areas (ESAs) in African cities encroached on? Unveiling the encroachers’ outlook. Cities 2025, 159, 105761. [Google Scholar] [CrossRef]
- Xu, L.; Chen, S.S. Coupling coordination degree between social-economic development and water environment: A case study of Taihu lake basin, China. Ecol. Indic. 2023, 148, 110118. [Google Scholar] [CrossRef]
- Chen, Y.; Zhang, F.; Lin, J. Projecting Future Land Use Evolution and Its Effect on Spatiotemporal Patterns of Habitat Quality in China. Appl. Sci. 2025, 15, 1042. [Google Scholar] [CrossRef]
- Tao, Y.; Li, Z.; Sun, X.; Qiu, J.; Pueppke, S.G.; Ou, W.; Guo, J.; Tao, Q.; Wang, F. Supply and demand dynamics of hydrologic ecosystem services in the rapidly urbanizing Taihu Lake Basin of China. Appl. Geogr. 2023, 151, 102853. [Google Scholar] [CrossRef]
- McKenna, J.E.; Chalupnicki, M.; Dittman, D.; Watkins, J.M. Simulation of rapid ecological change in Lake Ontario. J. Great Lakes Res. 2017, 43, 871–889. [Google Scholar] [CrossRef]
- Liu, J.; Dietz, T.; Carpenter, S.R.; Taylor, W.W.; Alberti, M.; Deadman, P.; Redman, C.; Pell, A.; Folke, C.; Ouyang, Z.; et al. Coupled human and natural systems: The evolution and applications of an integrated framework: This article belongs to Ambio’s 50th Anniversary Collection. Theme: Anthropocene. Ambio 2021, 50, 1778–1783. [Google Scholar] [CrossRef]
- Fu, B.; Wu, X.; Wang, Z.; Wu, X.; Wang, S. Coupling human and natural systems for sustainability: Experience from China’s Loess Plateau. Earth Syst. Dyn. 2022, 13, 795–808. [Google Scholar] [CrossRef]
- Ismailov, T.; Aleksandrova, A.; Todorov, L. Relation Between Financial Literacy and Carbon Footprint: Review on Implications for Sustainable Development. Econ. Ecol. Socium 2023, 7, 24–40. [Google Scholar] [CrossRef]
- Puangkaew, N.; Ongsomwang, S. Remote Sensing and Geospatial Models to Simulate Land Use and Land Cover and Estimate Water Supply and Demand for Water Balancing in Phuket Island, Thailand. Appl. Sci. 2021, 11, 10553. [Google Scholar] [CrossRef]
- Lomnicky, G.A.; Herlihy, A.T.; Kaufmann, P.R. Quantifying the extent of human disturbance activities and anthropogenic stressors in wetlands across the conterminous United States: Results from the National Wetland Condition Assessment. Environ. Monit. Assess. 2019, 191, 324. [Google Scholar] [CrossRef]
- Wang, Y.Y.; Yeung, C.H.; Hu, X.M.; Li, X.Y. An integrated framework of life-cycle environmental, human health, and economic impact assessment for urban water systems. Water Res. 2025, 278, 123383. [Google Scholar] [CrossRef]
- Liu, H.; Fan, J.; Zhou, K.; Xu, X.; Zhang, H.; Guo, R.; Chen, S. Assessing the dynamics of human activity intensity and its natural and socioeconomic determinants in Qinghai–Tibet Plateau. Geogr. Sustain. 2023, 4, 294–304. [Google Scholar] [CrossRef]
- Peng, Q.; Shen, L.; Lin, W.; Fan, S.; Su, K. Land-Use Transitions Impact the Ecosystem Services Value in a Coastal Region by Coupling the Geo-Informatic Tupu and Benefit-Transfer Method: The Case of Ningde City, China. Appl. Sci. 2024, 14, 3643. [Google Scholar] [CrossRef]
- Kou, L.; Wang, X.; Wang, H.; Wang, X.; Hou, Y. Spatiotemporal analysis of ecological benefits coupling remote sensing ecological index and ecosystem services index. Ecol. Indic. 2024, 166, 112420. [Google Scholar] [CrossRef]
- Zhang, L.; Li, X.; Liu, X.; Lian, Z.; Zhang, G.; Liu, Z.; An, S.; Ren, Y.; Li, Y.; Liu, S. Dynamic monitoring and drivers of ecological environmental quality in the Three-North region, China: Insights based on remote sensing ecological index. Ecol. Inform. 2025, 85, 102936. [Google Scholar] [CrossRef]
- Shen, Z.; Gao, Y.; Wang, L.; Xia, Z.; Liu, H.; Deng, T. Non-stationary response of complex ecosystem service networks to urbanization: Evidence from a typical eco-fragile area in China. Geogr. Sustain. 2025, 6, 100214. [Google Scholar] [CrossRef]
- Yang, Z.; Liu, Y.; Su, H.; Liu, X. Exploring complex place-based coevolution of ecosystem and human activities: A case study of Qilian Mountain area in China. Int. J. Appl. Earth Obs. Geoinf. 2022, 115, 103091. [Google Scholar] [CrossRef]
- Huang, Z.; Chen, Y.; Zheng, Z.; Wu, Z. Spatiotemporal coupling analysis between human footprint and ecosystem service value in the highly urbanized Pearl River Delta urban Agglomeration, China. Ecol. Indic. 2023, 148, 110033. [Google Scholar] [CrossRef]
- Xiong, S.; Yang, F. Multiscale exploration of spatiotemporal dynamics in China’s largest urban agglomeration: An interactive coupling perspective on human activity intensity and ecosystem health. J. Environ. Manag. 2025, 376, 124375. [Google Scholar] [CrossRef]
- Yu, G.; Liu, T.; Wang, Q.; Li, T.; Li, X.; Song, G.; Feng, Y. Impact of Land Use/Land Cover Change on Ecological Quality during Urbanization in the Lower Yellow River Basin: A Case Study of Jinan City. Remote Sens. 2022, 14, 6273. [Google Scholar] [CrossRef]
- Jiang, X.; Wang, B.; Fang, Q.; Bai, P.; Guo, T.; Wu, Q. Ecological Zoning Management Strategies in China: A Perspective of Ecosystem Services Supply and Demand. Land 2024, 13, 1112. [Google Scholar] [CrossRef]
- Liu, Y.; Yang, R.; Sun, M.; Zhang, L.; Li, X.; Meng, L.; Wang, Y.; Liu, Q. Regional sustainable development strategy based on the coordination between ecology and economy: A case study of Sichuan Province, China. Ecol. Indic. 2022, 134, 108445. [Google Scholar] [CrossRef]
- Karpunina, M.; Sochynska-Sybirtseva, I.; Chmutova, I.; Guo, X. Assessment of China’s Macro-Readiness for Integrated Innovative Management Technologies Employment. Econ. Ecol. Socium 2023, 7, 40–53. [Google Scholar] [CrossRef]
- Zhou, Z.; Li, H.; Li, J.; Lu, Y.; Gao, C.; Yang, D. Human–Land Coupling Relationship in Lushan National Park and Its Surrounding Areas: From an Integrated Ecological and Social Perspective. Land 2024, 13, 1240. [Google Scholar] [CrossRef]
- Jia, Q.; Jiao, L.; Lian, X.; Wang, W. Linking supply-demand balance of ecosystem services to identify ecological security patterns in urban agglomerations. Sustain. Cities Soc. 2023, 92, 104497. [Google Scholar] [CrossRef]
- Lei, K.; Zhang, H.; Qiu, H.; Liu, Y.; Wang, J.; Hu, X.; Cui, Z.; Zheng, D. A two-dimensional four-quadrant assessment method to explore the spatiotemporal coupling and coordination relationship of human activities and ecological environment. J. Environ. Manag. 2024, 370, 122362. [Google Scholar] [CrossRef]
- Li, T.; Liu, Y.; Ouyang, X.; Zhou, Y.; Bi, M.; Wei, G. Sustainable development of urban agglomerations around lakes in China: Achieving SDGs by regulating Ecosystem Service Supply and Demand through New-type Urbanization. Habitat Int. 2024, 153, 103206. [Google Scholar] [CrossRef]
- Chen, J.; Gao, M.; Cheng, S.; Hou, W.; Song, M.; Liu, X.; Liu, Y. Global 1 km x 1 km gridded revised real gross domestic product and electricity consumption during 1992-2019 based on calibrated nighttime light data. Sci. Data 2022, 9, 202. [Google Scholar] [CrossRef]
- Zhang, X.; Fan, H.; Liu, F.; Lv, T.; Sun, L.; Li, Z.; Shang, W.; Xu, G. Coupling coordination between the ecological environment and urbanization in the middle reaches of the Yangtze River urban agglomeration. Urban Clim. 2023, 52, 101698. [Google Scholar] [CrossRef]
- Dem, P.; Hayashi, K.; Fujii, M. Resources time footprint for assessment of human influence on ecosystem service from a sustainability standpoint. J. Clean. Prod. 2024, 436, 140612. [Google Scholar] [CrossRef]
- Wen, X.; Yao, S. Spatial and temporal changes of vegetation coverage response to human activity intensity in the middle and upper reaches of the Yellow River. J. Fujian Agric. For. Univ. (Nat. Sci. Ed.) 2018, 47, 607–614. [Google Scholar] [CrossRef]
- Qing, L.; Huanhuan, F.; Fuqing, Z.; Wenbo, C.; Yuanping, X.; Bing, Y. The dominant role of human activity intensity in spatial pattern of ecosystem health in the Poyang Lake ecological economic zone. Ecol. Indic. 2024, 166, 112347. [Google Scholar] [CrossRef]
- Chen, S.; Yan, J.; Wang, Y.; Chang, Z.; Yu, G.; Li, J.; Jiang, J.; Wang, L.; Zhang, S.; Chen, Y.; et al. Analysis of Spatio-Temporal Relationship Between Ecosystem Services and Human Footprints Under Different Human Activity Gradients: A Case Study of Xiangjiang River Basin. Remote Sens. 2024, 16, 4212. [Google Scholar] [CrossRef]
- Lobser, S.E.; Cohen, W.B. MODIS tasselled cap: Land cover characteristics expressed through transformed MODIS data. Int. J. Remote Sens. 2007, 28, 5079–5101. [Google Scholar] [CrossRef]
- Cao, J.; Wu, E.; Wu, S.; Fan, R.; Xu, L.; Ning, K.; Li, Y.; Lu, R.; Xu, X.; Zhang, J.; et al. Spatiotemporal Dynamics of Ecological Condition in Qinghai-Tibet Plateau Based on Remotely Sensed Ecological Index. Remote Sens. 2022, 14, 4234. [Google Scholar] [CrossRef]
- Tian, Y.; Wang, Z.; Ji, C.; Feng, Z.; Lu, X. The Influence of Human Activities and Climate Change on the Spatiotemporal Variations of Eco-Environmental Quality in Shendong Mining Area, China from 1990 to 2023. Appl. Sci. 2025, 15, 2296. [Google Scholar] [CrossRef]
- Chen, F.; Li, Y.; Liu, Y. Spatial-temporal evolution and coupling coordination of land use functions across China by fusing multiple-source heterogeneous data. Land Use Policy 2025, 155, 107590. [Google Scholar] [CrossRef]
- Xiong, S.; Yang, F.; Gu, C. Exploring spatiotemporal coupling effects between built environment and ecosystem health: Toward static–dynamic sustainable management in waterfront cities. J. Clean. Prod. 2025, 503, 145389. [Google Scholar] [CrossRef]
- Song, Y.; Wang, J.; Ge, Y.; Xu, C. An optimal parameters-based geographical detector model enhances geographic characteristics of explanatory variables for spatial heterogeneity analysis: Cases with different types of spatial data. GIScience Remote Sens. 2020, 57, 593–610. [Google Scholar] [CrossRef]
- Su, R.; Duan, C.; Chen, B. The shift in the spatiotemporal relationship between supply and demand of ecosystem services and its drivers in China. J. Environ. Manag. 2024, 365, 121698. [Google Scholar] [CrossRef]
- Pazmiño, Y.C.; Felipe, J.J.d.; Vallbé, M.; Pazmiño, Y. Modeling the Influence of Changes in the Edaphic Environment on the Ecosystem Valuation of the Zone of Influence of the Ozogoche and Atillo Lake Systems in Ecuador. Appl. Sci. 2024, 14, 2249. [Google Scholar] [CrossRef]
- Wen, C.; Zhan, Q.; Zhan, D.; Zhao, H.; Yang, C. Spatiotemporal Evolution of Lakes under Rapid Urbanization: A Case Study in Wuhan, China. Water 2021, 13, 1171. [Google Scholar] [CrossRef]
- Grant, L.; Vanderkelen, I.; Gudmundsson, L.; Tan, Z.; Perroud, M.; Stepanenko, V.M.; Debolskiy, A.V.; Droppers, B.; Janssen, A.B.G.; Woolway, R.I.; et al. Attribution of global lake systems change to anthropogenic forcing. Nat. Geosci. 2021, 14, 849–854. [Google Scholar] [CrossRef]
- Chen, Z.; Liu, Y.; Chen, D.; Peng, B. Exploring the impacts of land use and land cover change on ecosystem services in Dongting Lake, China: A spatial and temporal analysis. Front. Environ. Sci. 2024, 12, 1395557. [Google Scholar] [CrossRef]
- Leu, M.; Hanser, S.E.; Knick, S.T. The human footprint in the west: A large-scale analysis of anthropogenic impacts. Ecol. Appl. 2008, 18, 1119–1139. [Google Scholar] [CrossRef] [PubMed]
- Yang, C.; Su, Q.; Liang, J. Conflict or Coordination? A Coupling Study of China’s Population–Urbanization–Ecological Environment. Appl. Sci. 2024, 14, 7539. [Google Scholar] [CrossRef]
- Wang, X.; Cheng, Y. Urban Lake Health Assessment Based on the Synergistic Perspective of Water Environment and Social Service Functions. Glob. Chall. 2024, 8, 2400144. [Google Scholar] [CrossRef] [PubMed]
- Wan, J.; Li, Y.; Ma, C.; Jiang, T.; Su, Y.; Zhang, L.; Song, X.; Sun, H.; Wang, Z.; Zhao, Y.; et al. Measurement of Coupling Coordination Degree and Spatio-Temporal Characteristics of the Social Economy and Ecological Environment in the Chengdu-Chongqing Urban Agglomeration under High-Quality Development. Int. J. Environ. Res. Public Health 2021, 18, 11629. [Google Scholar] [CrossRef]
- Jing, X.; He, Y.; Sun, Y.; Wang, M.; Wang, X. Spatial–Temporal Divergence and Coupling Analysis of Land Use Change and Ecosystem Service Value in the Yangtze River Delta Urban Agglomeration. Sustainability 2024, 16, 6624. [Google Scholar] [CrossRef]
- Deng, Z.; Chen, Y.; Jiang, F.; Zhang, Y.; Xie, Z.; Zhang, Y.; Zhao, L. Spatio-temporal study on coupling coordination between urbanization and eco-resilience in the Erhai Lake Basin. All Earth 2024, 36, 1–20. [Google Scholar] [CrossRef]
- Ni, B.; Xing, S.; Ren, J.; Wang, W.J.; Wang, L.; Zou, Y.; Cong, Y. Human activities weaken the topographic regulation of vegetation dynamics in response to climate change in the Amur River Basin. Ecol. Front. 2025. [Google Scholar] [CrossRef]
- Guo, K.; Niu, X.; Wang, B.; Xu, T.; Ma, X. Dynamic Changes in Habitat Quality and the Driving Mechanism in the Luoxiao Mountains Area from 1995 to 2020. Ecosyst. Health Sustain. 2023, 9, 0080. [Google Scholar] [CrossRef]
- Hu, H.; Lv, T.; Zhang, X.; Xie, H.; Fu, S.; Wang, L. Spatiotemporal coupling of multidimensional urbanization and resource–environment performance in the Yangtze River Delta urban agglomeration of China. Phys. Chem. Earth Parts A/B/C 2023, 129, 103360. [Google Scholar] [CrossRef]
- Wan, L.; Wang, X.H.; Gao, G.D.; Wu, W. Evaluation of the coordinated development level in the coastal eco-environmental complex system: A case study of Jiaozhou Bay, China. Mar. Environ. Res. 2024, 198, 106515. [Google Scholar] [CrossRef]
- Qin, Q.; He, W.; Yuan, L.; Degefu, D.M.; Ramsey, T.S. Coupled and coordinated development of water-energy-food-ecology-land system in the Yangtze River Delta, China. npj Clean Water 2025, 8, 38. [Google Scholar] [CrossRef]
- Wang, G.; Liu, J.; Wang, Z.; Xiang, Y.; Heng, C.K.; Li, X. Spatiotemporal evolution and interaction of water constraints and their socio-ecological drivers in the Taihu Lake Basin. Sci. Total Environ. 2024, 949, 175155. [Google Scholar] [CrossRef]
- Cantasano, N.; Pellicone, G. Marine and river environments: A pattern of Integrated Coastal Zone Management (ICZM) in Calabria (Southern Italy). Ocean Coast. Manag. 2014, 89, 71–78. [Google Scholar] [CrossRef]
- Chen, Z.-A.; Gao, H.; Chen, L. Comprehensive zoning study based on the identification of spatial conflicts and ecosystem service values—A case study of urban agglomeration around Poyang Lake, China. Environ. Earth Sci. 2024, 84, 22. [Google Scholar] [CrossRef]
| Disclaimer/Publisher’s Note: The statements, opinions and data contained in all publications are solely those of the individual author(s) and contributor(s) and not of MDPI and/or the editor(s). MDPI and/or the editor(s) disclaim responsibility for any injury to people or property resulting from any ideas, methods, instructions or products referred to in the content. |
© 2025 by the authors. Licensee MDPI, Basel, Switzerland. This article is an open access article distributed under the terms and conditions of the Creative Commons Attribution (CC BY) license (https://creativecommons.org/licenses/by/4.0/).


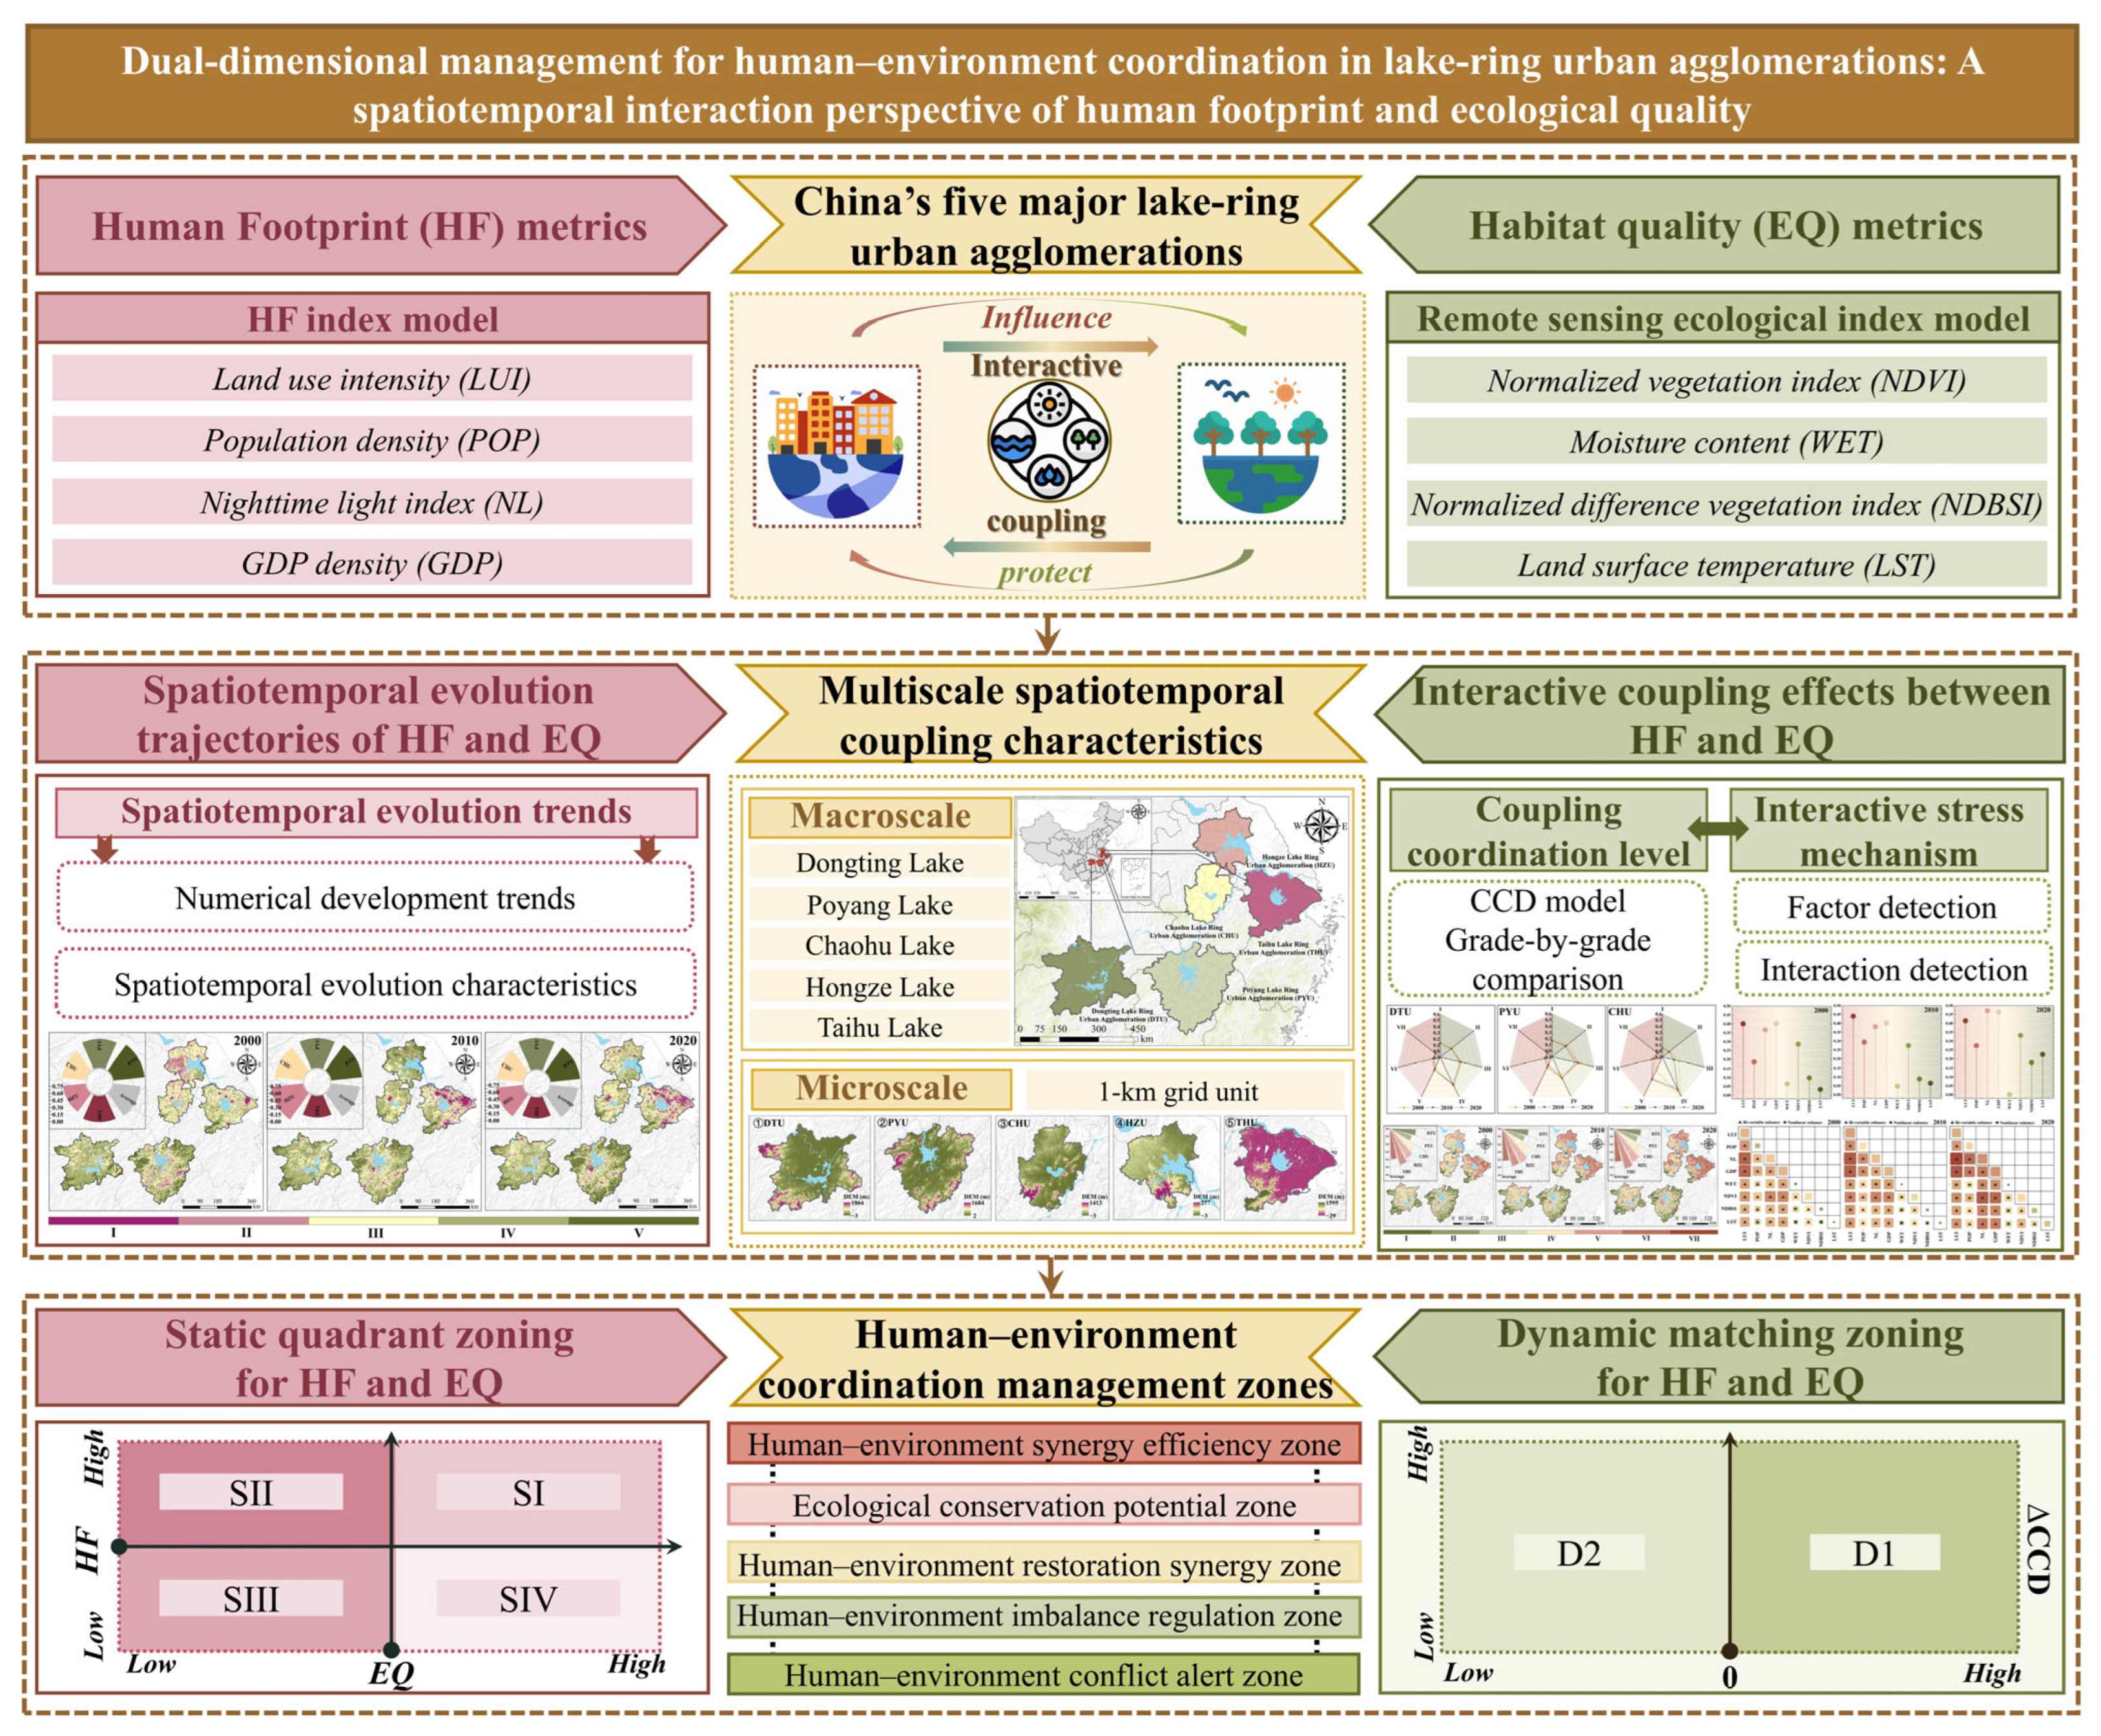


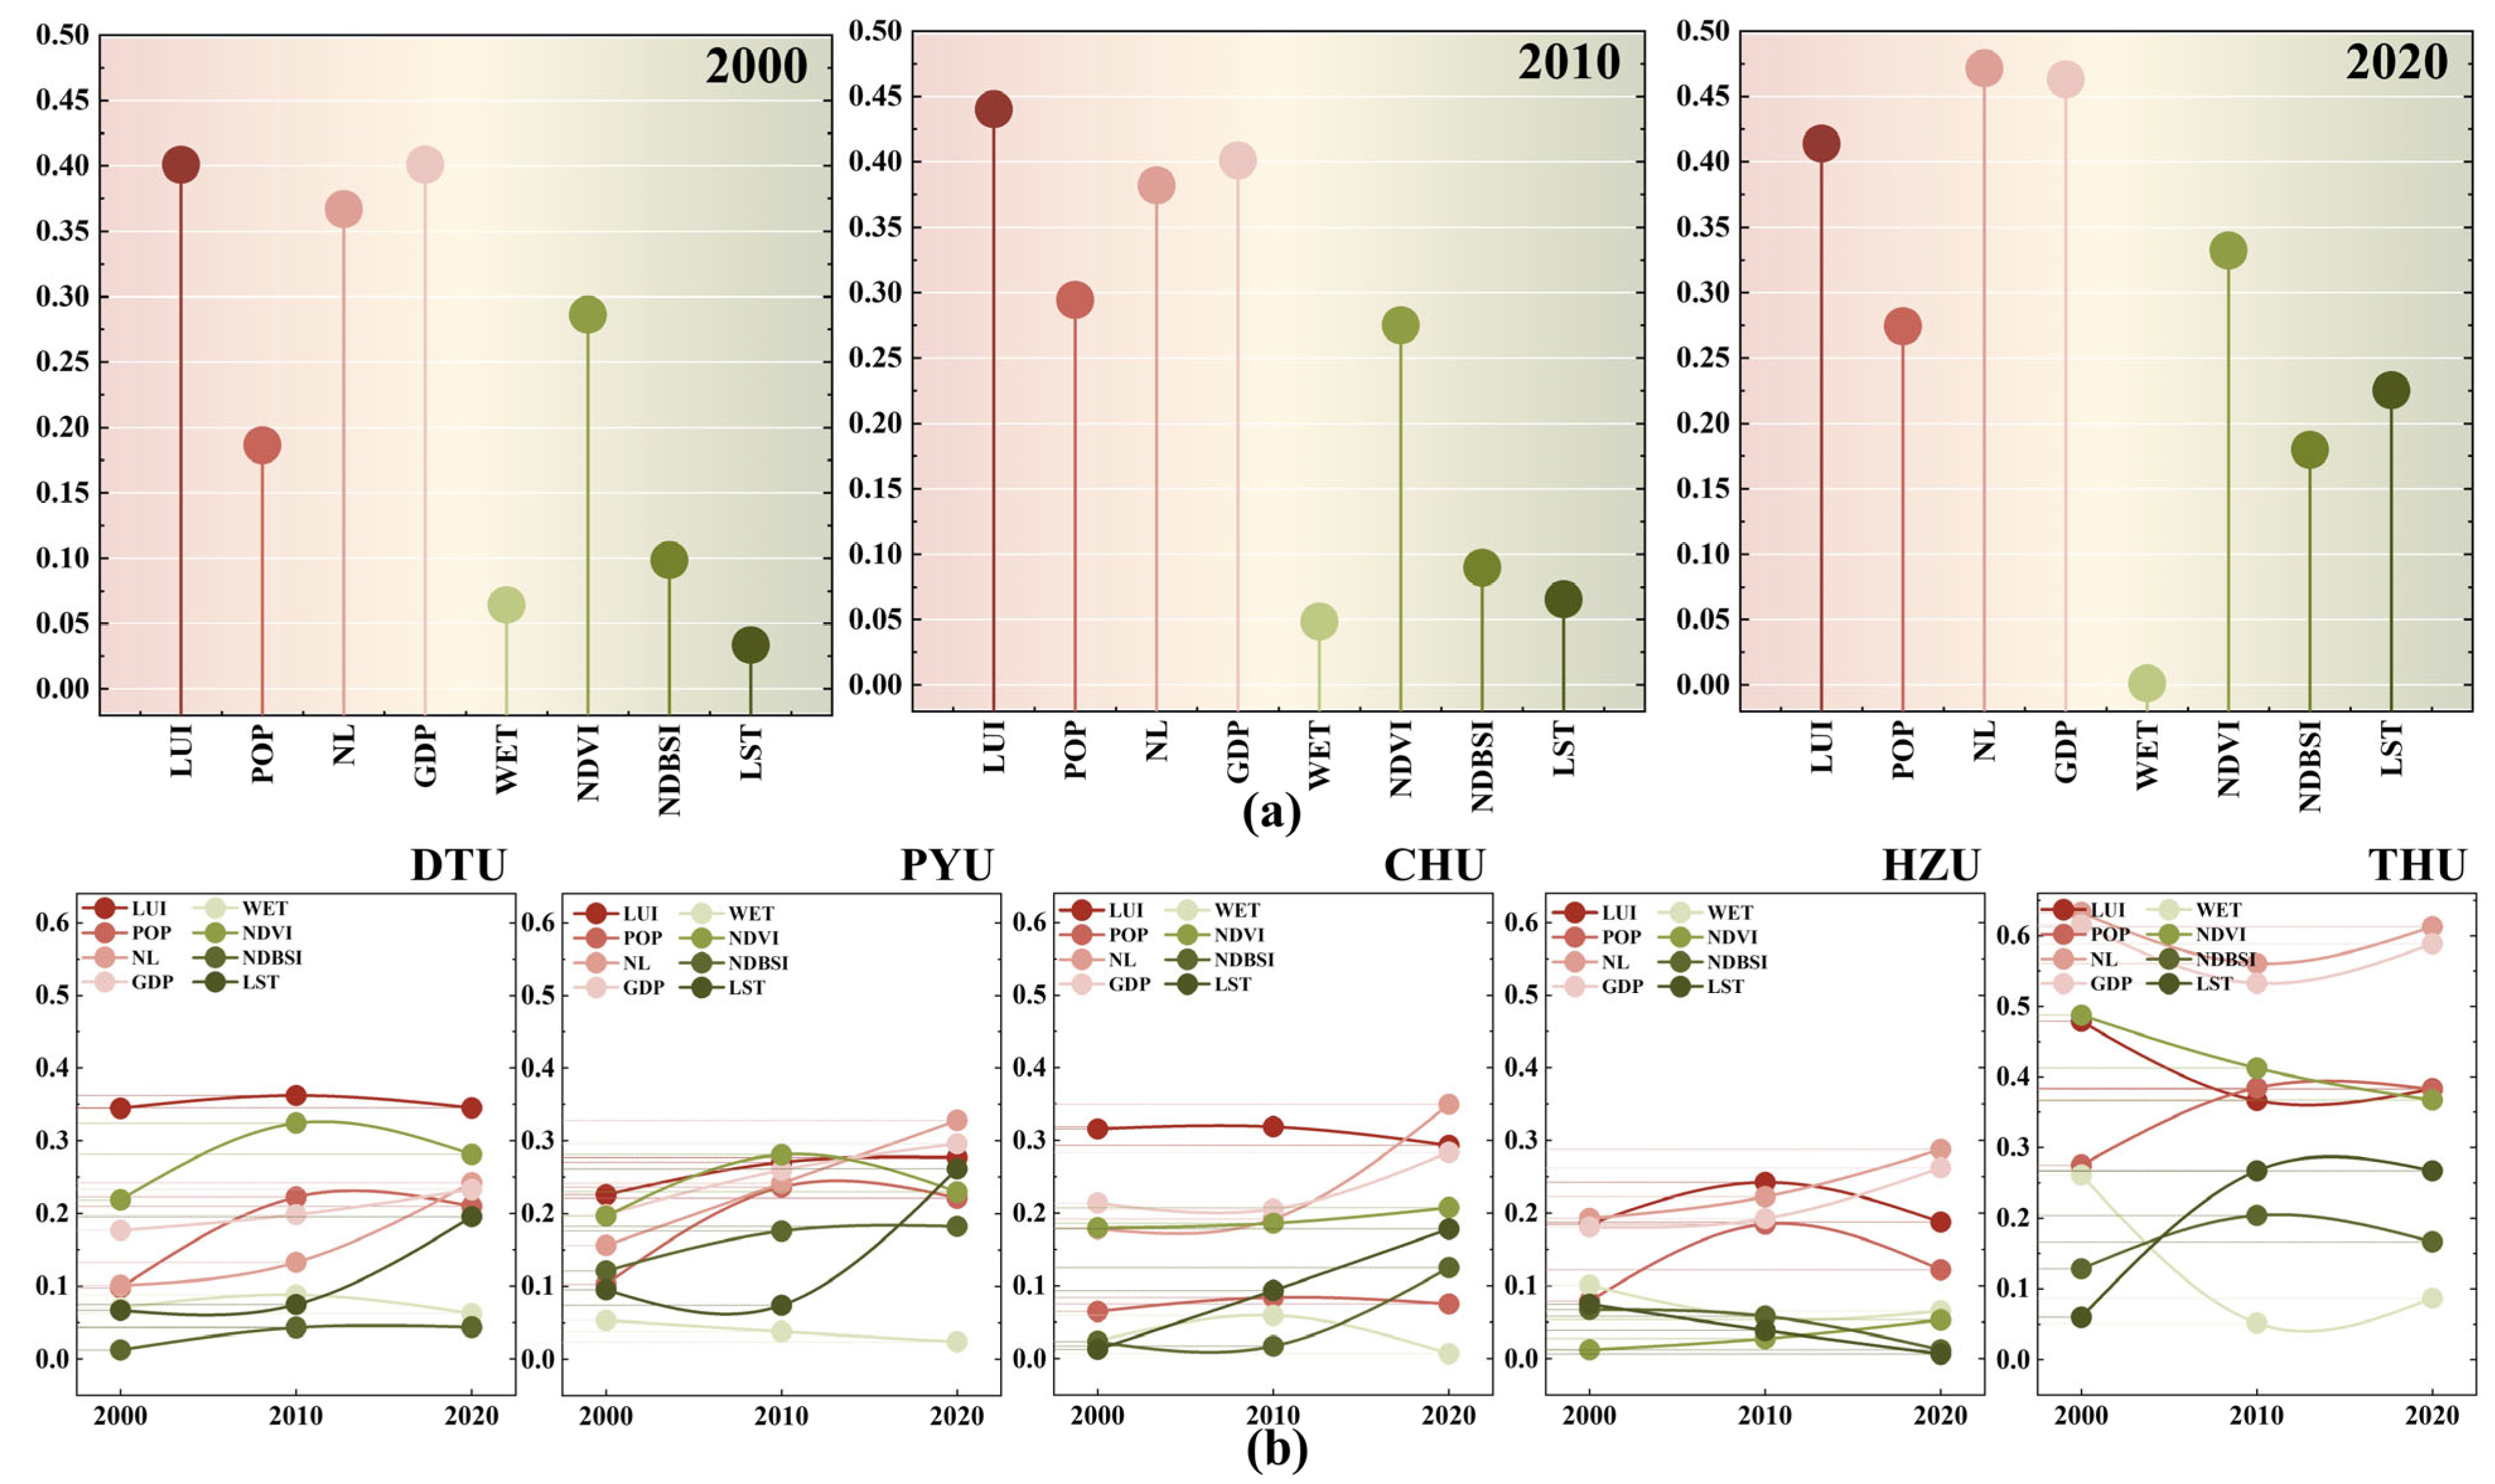
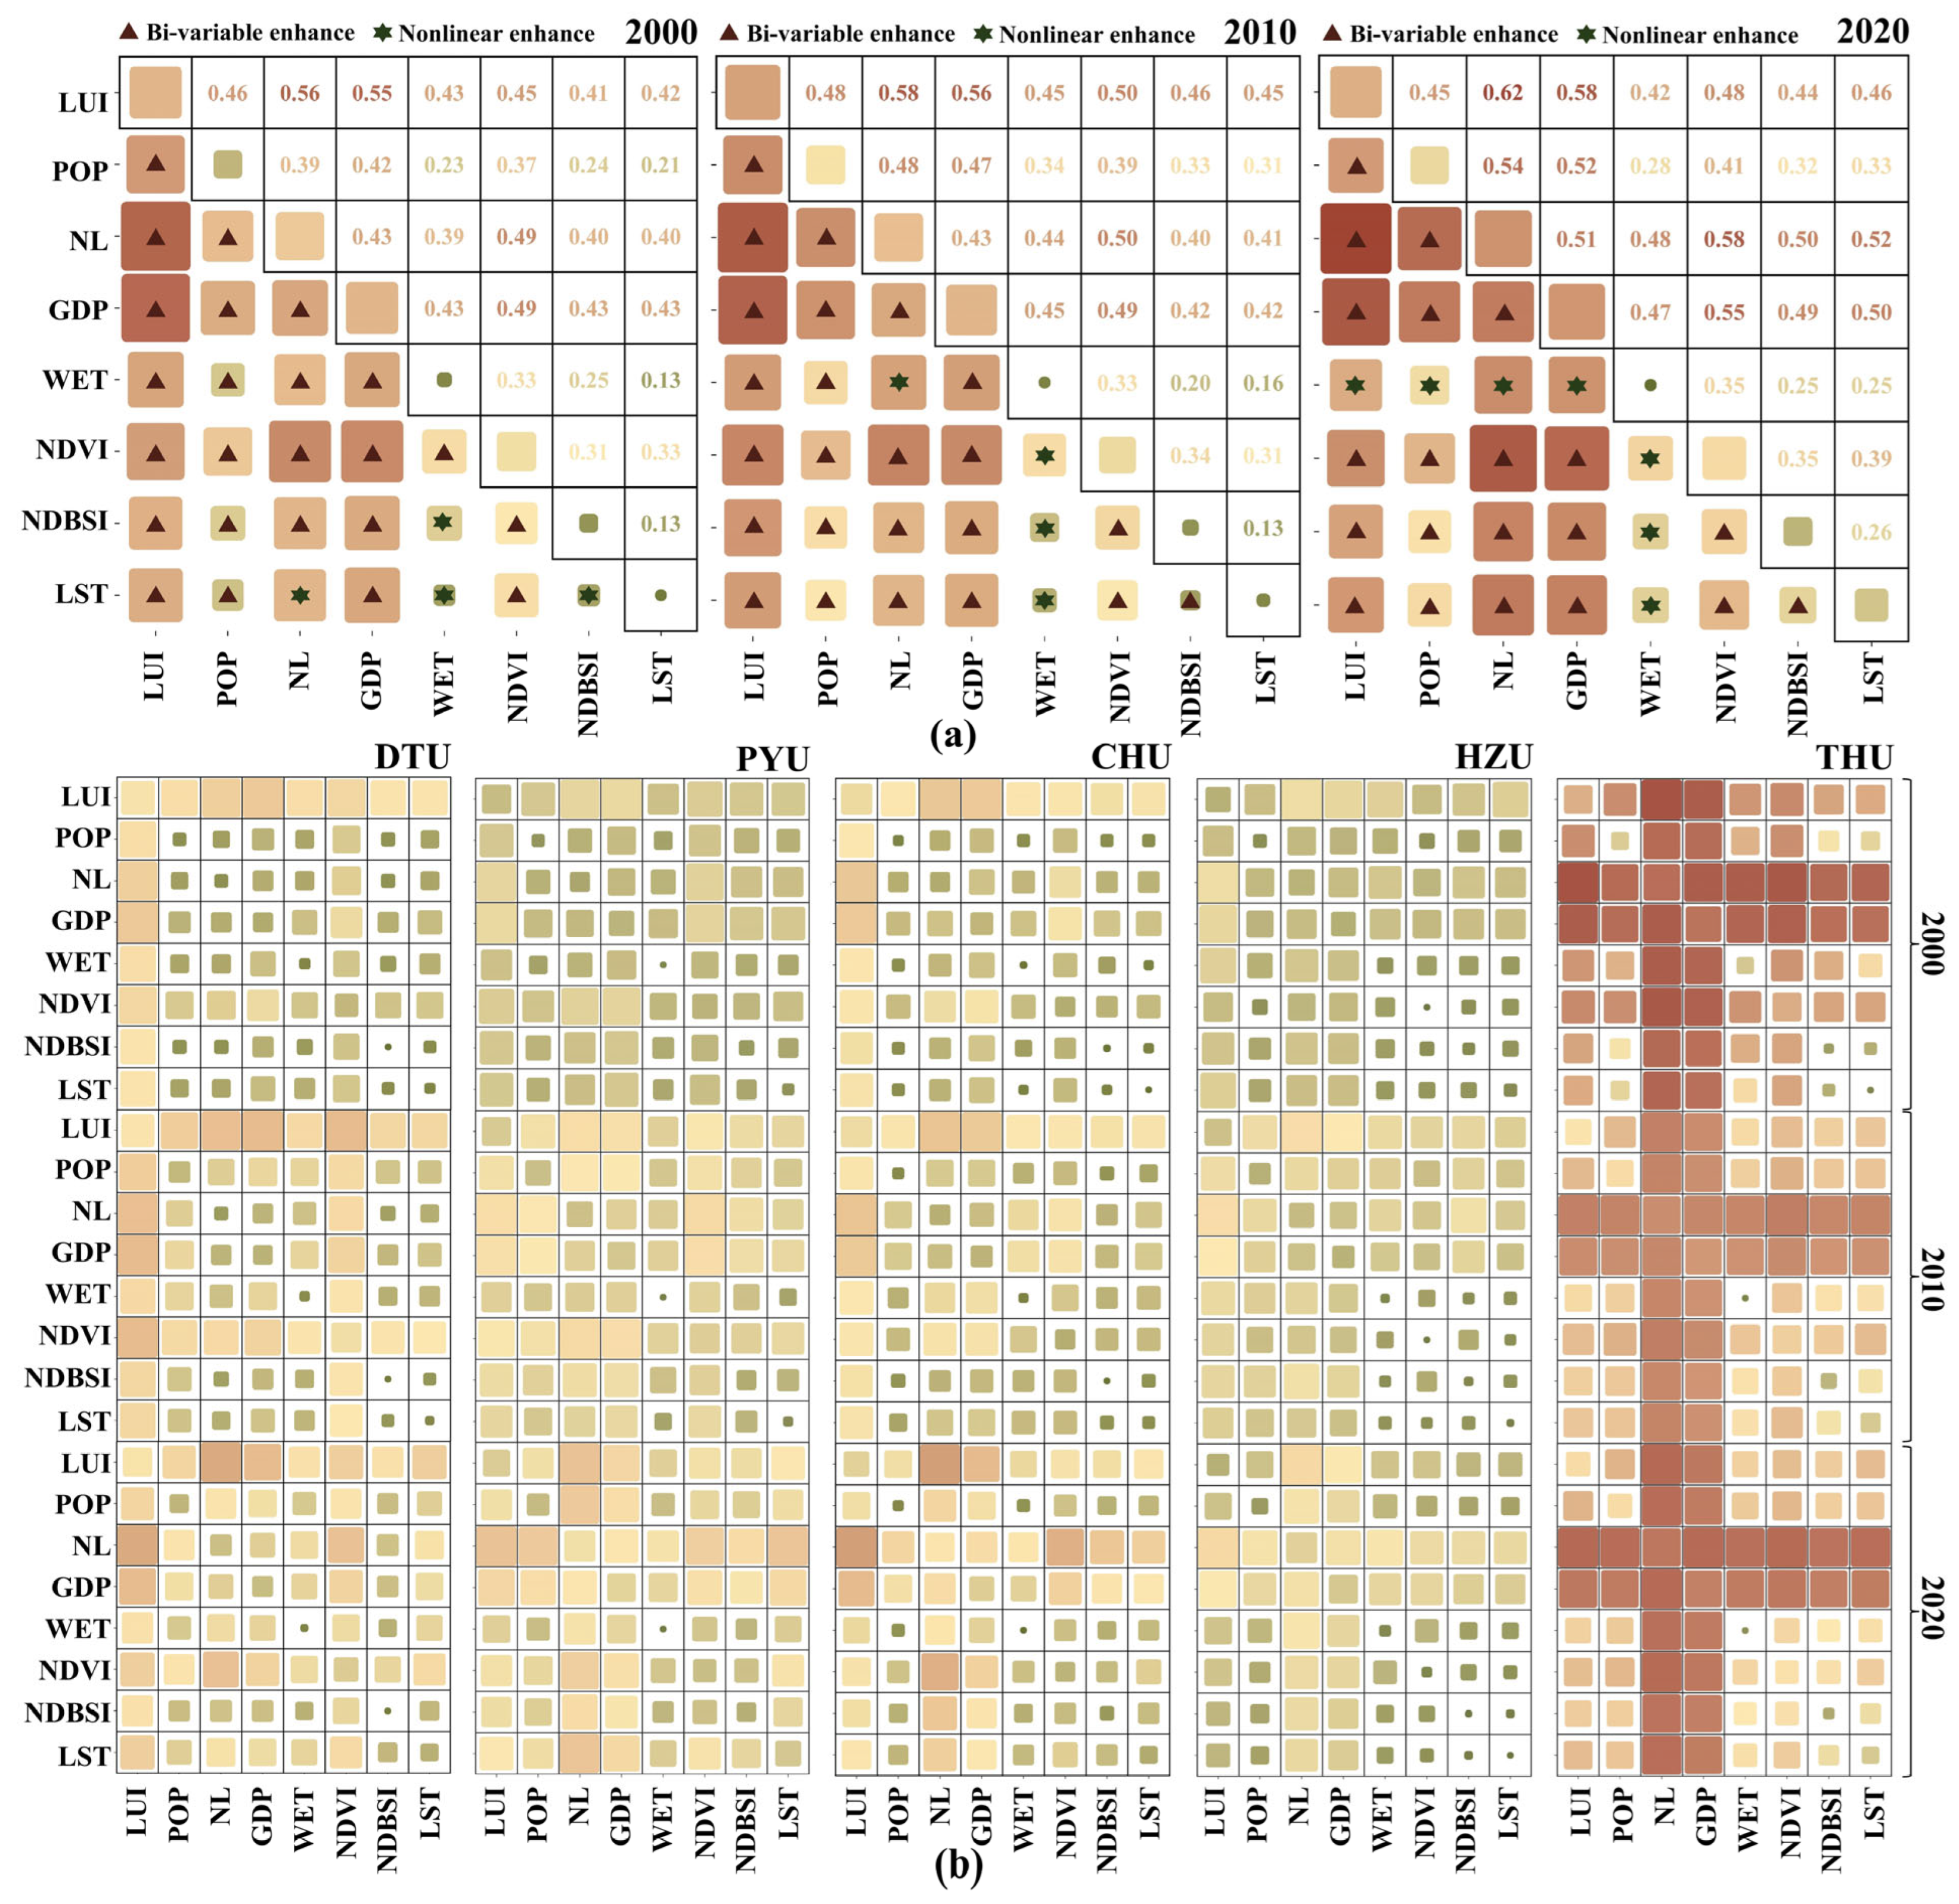


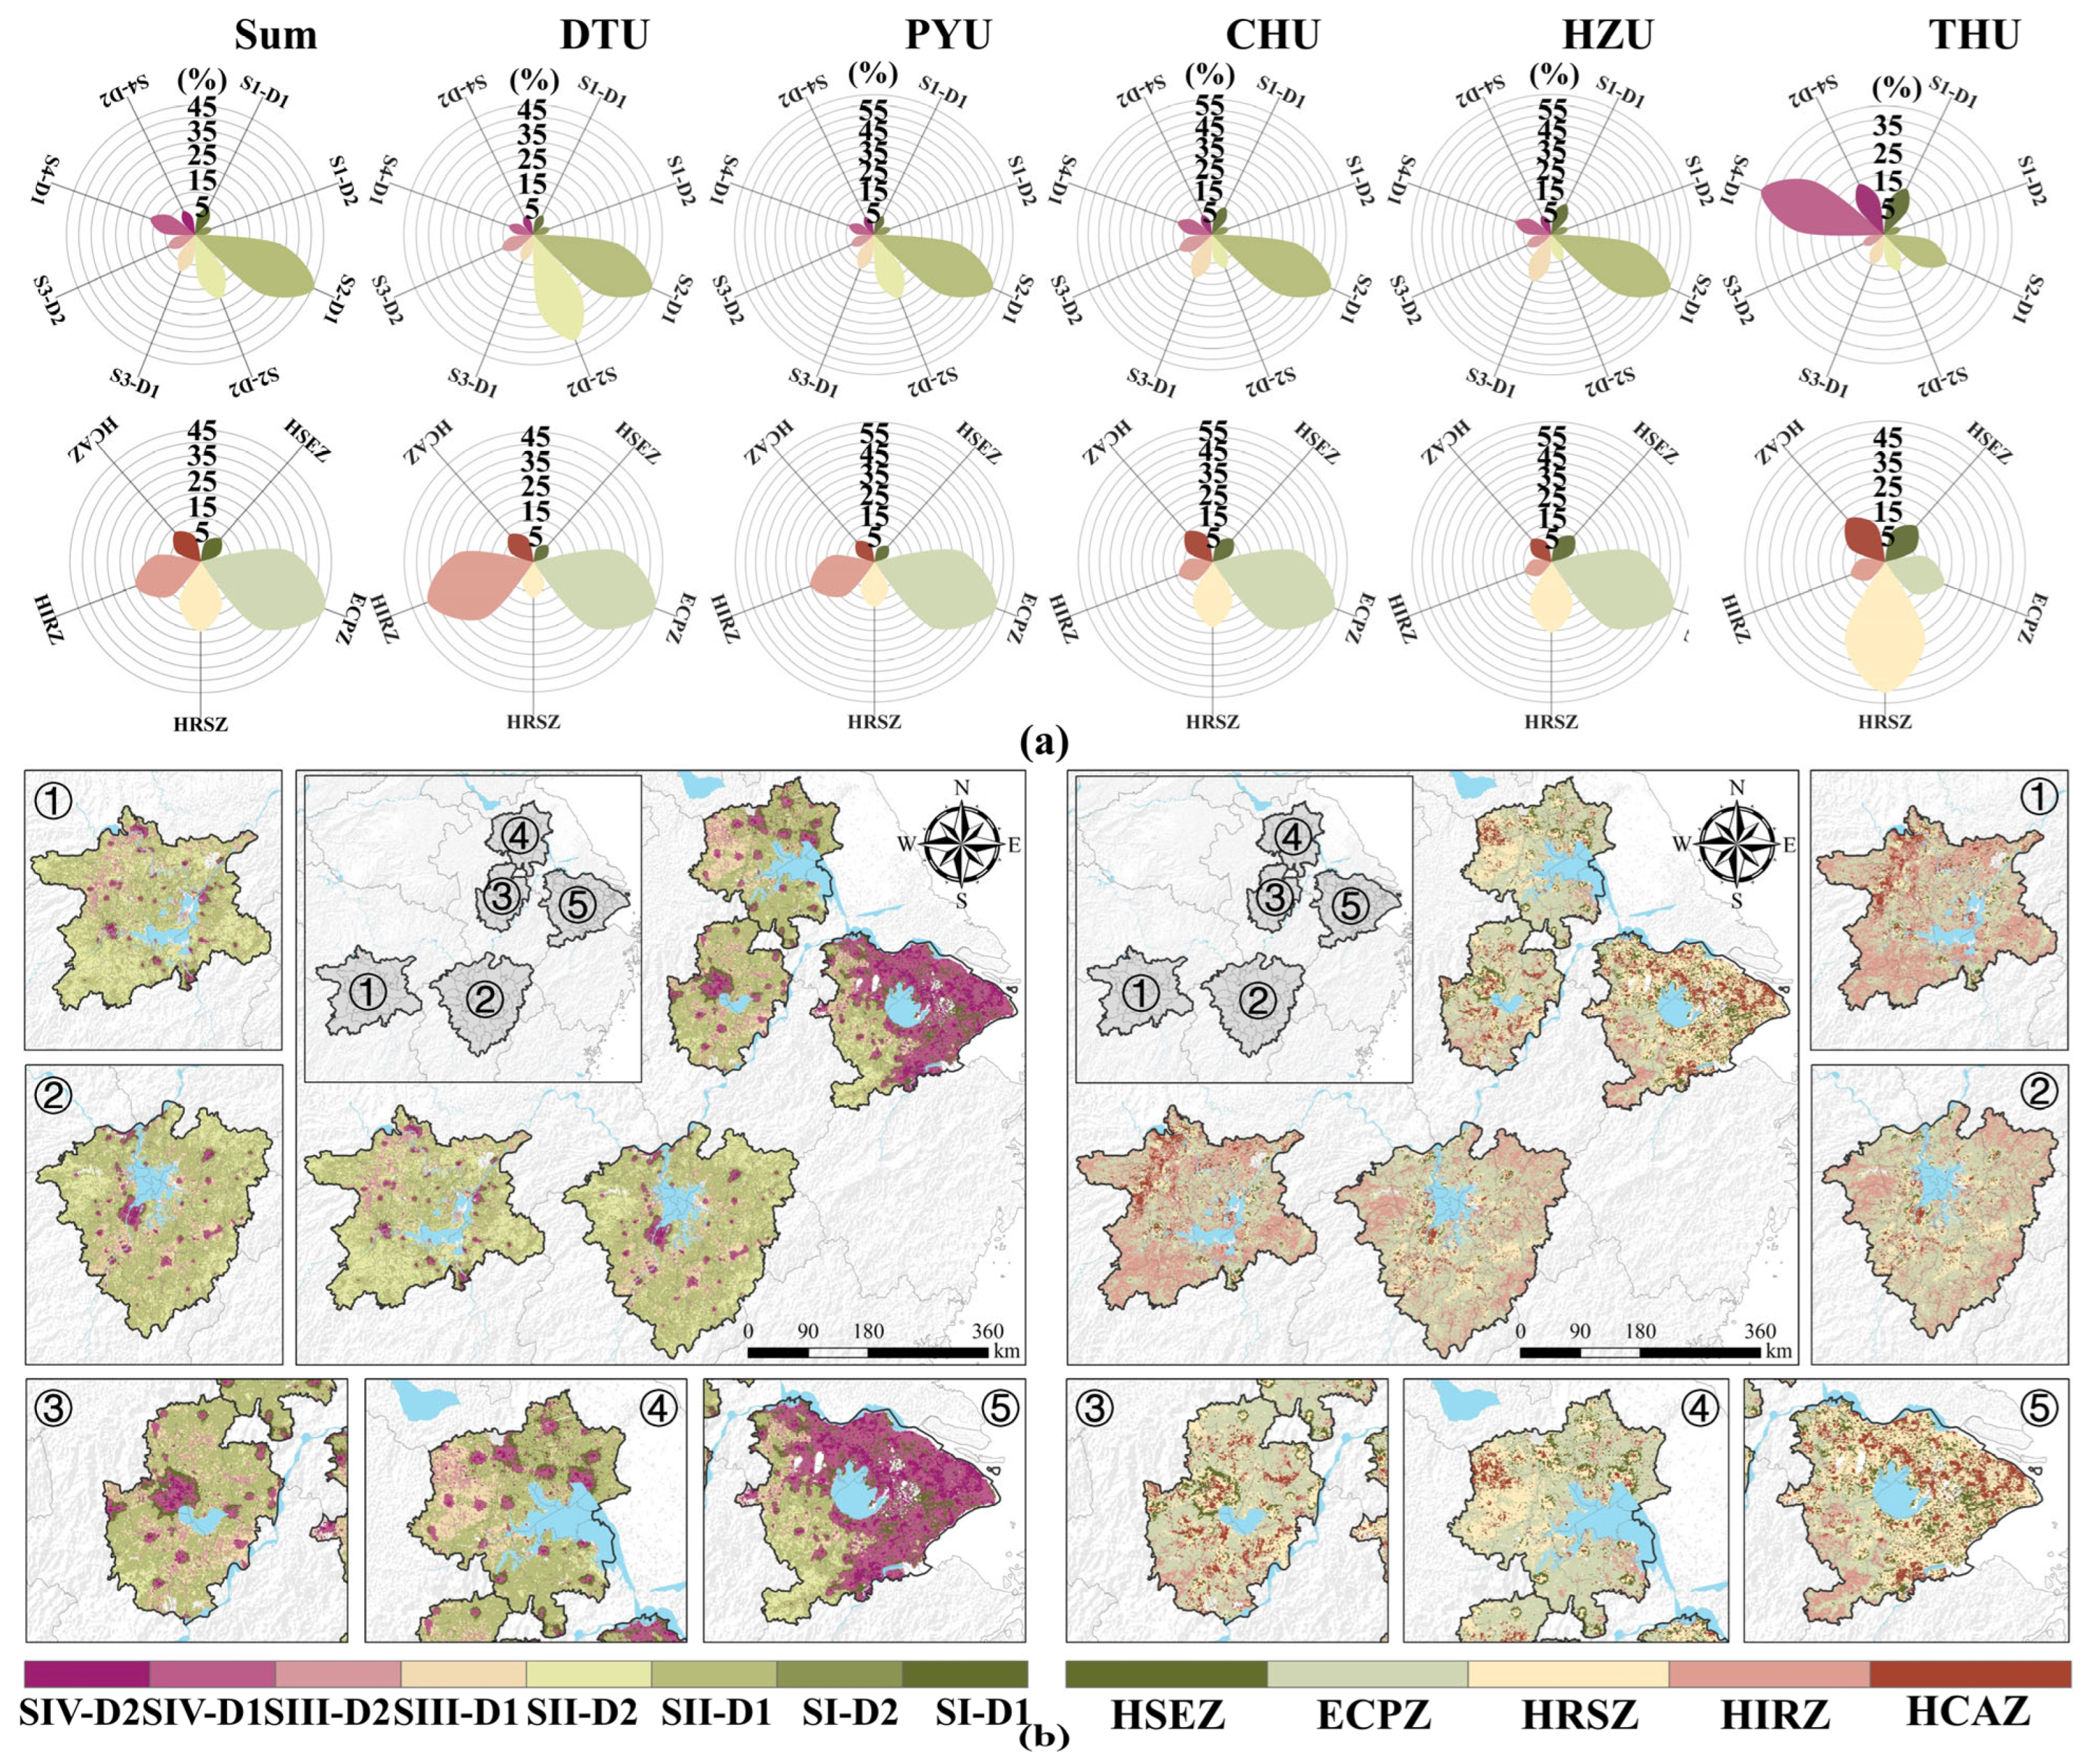
