Abstract
Significant regional environmental differences result in varied patterns of pavement temperature changes. To enhance the cross-regional adaptability of temperature prediction models, transfer learning (TL) was introduced into the random forest (RF) model to improve its generalization capability. Firstly, meteorological data on air temperature, solar radiation, relative humidity, and wind speed were collected from different regions. Pavement temperatures at various depths were also monitored over a long period. Secondly, prediction models were constructed using the RF method. The prediction performance of the models was evaluated. Thirdly, the RF model was optimized using TL with a feature enhancement strategy. Finally, the optimized model was validated using data from other regions not included in the initial training set. The results indicated that although the RF model achieved good prediction accuracy within individual regions, its performance declined when applied across different regions. After optimization through TL with feature enhancement, the model’s prediction accuracy in target regions was significantly improved. Specifically, the mean squared error was reduced from 44.91 to 14.88, the mean absolute error from 4.91 to 2.78, and the coefficient of determination increased from 0.75 to 0.92. Further validation revealed that the determination coefficient exceeded 0.94 and the mean absolute error remained below 2.3 °C at all depths. In summary, the transfer learning approach based on the random forest model demonstrates strong adaptability to different regions. It effectively addresses the issue of reduced prediction accuracy caused by regional differences and provides a reliable method for accurate pavement temperature prediction across multiple regions.
1. Introduction
Asphalt pavement, as a typical temperature-sensitive structure, is significantly influenced by variations in ambient temperature throughout its service life [1,2,3]. Temperature not only directly affects the mechanical behavior of pavement materials but also alters the internal stress state of the structure, potentially leading to various temperature-related distresses. For instance, rutting tends to occur under high temperatures, while cracking is more common under low-temperature conditions [4,5,6].
Moreover, daily temperature fluctuations and seasonal changes can cause uneven thermal responses within the pavement structure [7]. These effects are further intensified by the distinct environmental characteristics of different climatic zones, which greatly influence the long-term performance and durability of pavements [8]. Accurate temperature prediction can offer theoretical guidance for structural design, material selection, and mitigation of temperature-induced distresses.
To address the above needs, researchers have developed a range of pavement temperature prediction methods [9]. These methods can be broadly categorized into two types. The first type is based on meteorological principles and numerical heat transfer models [10,11,12]. Such approaches generally offer good structural interpretability and regional adaptability, making the methods applicable across various pavement types and climatic conditions. However, the prediction accuracy depends on the precise calibration of the thermal parameters of pavement materials and the assumptions or simplifications adopted in the modeling process. Any mismatch in parameters or oversimplification may result in considerable prediction errors.
The second category includes statistical and empirical models, such as regression-based techniques [13,14,15]. These approaches are simpler to implement and can effectively reflect the combined impact of multiple environmental factors. As a result, they are widely used in engineering applications. Nevertheless, most of these models are trained on data from specific regions, and their generalizability across regions remains limited. Some studies have attempted to improve adaptability by introducing region-specific correction factors [16,17], but these require large volumes of local data, involve complex modeling steps, and lack scalability for broader applications.
In this context, the rapid advancement of artificial intelligence (AI) offers promising alternatives. Machine learning and deep learning techniques have been increasingly applied to engineering prediction tasks, including pavement temperature field modeling [18,19,20]. Compared with traditional methods such as multiple nonlinear regression, machine learning models offer distinct performance advantages. These include the ability to capture complex nonlinear relationships, manage multicollinearity, and handle high-dimensional, multi-source data efficiently. Furthermore, ensemble techniques such as random forest provide strong generalization capability due to their robustness to outliers, resistance to overfitting, and ability to interpret variables’ importance [21,22,23,24,25]. Unlike parametric regression models, random forest does not require strong assumptions about data distribution, offering greater modeling flexibility. However, differences in data distribution across regions still pose challenges for cross-regional applications.
To address this issue, transfer learning has emerged as an effective cross-domain modeling strategy [26,27]. By leveraging knowledge from a source domain, transfer learning improves feature learning in target domains with limited data. This approach has shown promising results in remote sensing, traffic forecasting, and other engineering fields [28,29,30], although its potential in pavement temperature prediction remains underexplored. The integration of transfer learning with machine learning models is expected to enhance both predictive accuracy and cross-regional adaptability, offering an intelligent and scalable solution.
In view of this, a pavement temperature prediction method combining random forest with transfer learning is proposed in the present study. The aim is to improve the model’s adaptability and prediction accuracy across different regions. Firstly, meteorological and measured pavement temperature data from several typical climatic regions are collected and organized. Correlation analysis between meteorological factors and pavement temperature is then conducted. Secondly, random forest models are separately constructed for each region to establish a baseline prediction framework. Thirdly, a transfer learning strategy is introduced to effectively enhance the model’s adaptability in the target region by transferring feature information from the source region. Finally, the proposed models are validated and compared using measured data to evaluate their prediction accuracy and generalization ability under various regional conditions. This study provides a practical AI-based solution to address the limited regional applicability of existing temperature prediction models, and it offers technical support for intelligent pavement thermal environment control, climate-resilient infrastructure design, adaptive maintenance planning, real-time pavement condition forecasting, and the development of smart transportation systems.
2. Methodology
2.1. Dataset Construction
The data used in this study mainly included meteorological factors and pavement temperature at different depths. Air temperature, solar radiation intensity, relative humidity, and wind speed were selected as meteorological factors. These data were obtained from the WheatA V1.5.7 system [31]. Pavement temperature data were collected through long-term monitoring. Temperature sensors were buried in actual service pavements. Measurements were taken at depths of 0 cm, 5 cm, 12 cm, and 30 cm. Temperature monitoring was conducted in five cities: Ordos, Korla, Zhenjiang, Zhangzhou, and Kashgar. For clarity, the five cities were labeled as Site01, Site02, Site03, Site04, and Site05, respectively. Ordos (Site01), located in northern China, experiences a semi-arid continental climate characterized by substantial seasonal temperature variations. The average annual temperature is 6.2 °C, with extreme highs of 38 °C and lows of −31.4 °C. The region receives approximately 348.3 mm of annual precipitation, about 70% of which occurs between July and September. The average annual evaporation is around 2506.3 mm, roughly 7.2 times the total rainfall. Prevailing winds primarily come from the west and northwest. Korla (Site02), located in northwestern China, features a warm, temperate, arid climate typical of the Eurasian inland. The region receives abundant solar radiation, with approximately 2990 h of sunshine annually, and has an average annual temperature of 11.4 °C. It experiences a frost-free period of around 210 days, while its annual precipitation is extremely low, averaging only 58.6 mm. In contrast, the potential annual evaporation reaches up to 2788.2 mm. The prevailing wind direction is from the northeast. Zhenjiang (Site03), located in eastern China, has a subtropical monsoon climate characterized by hot, humid summers and mild winters. The average annual temperature is approximately 15.5 °C, and the annual precipitation is around 1100–1200 mm, mostly concentrated from May to September. The area is also influenced by typhoons and seasonal winds. Zhangzhou (Site04), located in southeastern coastal China, has a typical subtropical monsoon climate. The region receives abundant rainfall and sunshine, with an average annual temperature of approximately 21 °C and precipitation exceeding 1600 mm. Summers are long and hot, while winters remain short and mild. Coastal winds and typhoons are common during the summer and early autumn months. Kashgar (Site05), located in the southwestern region of China’s Xinjiang Uygur Autonomous Region, has a typical continental climate with distinct seasons, intense solar radiation, and large diurnal and annual temperature variations. The annual average temperature ranges between 11 and 13 °C. Summers are hot, with maximum temperatures above 40 °C, while winters are relatively long and cold, with lows below −20 °C. Annual precipitation is minimal, ranging from 50 to 100 mm, and is primarily concentrated between June and August. Data from Site01 to Site04 were used for model training and prediction. Data from Site05 were used for independent validation. This approach was used to evaluate the cross-regional generalization ability of the model. Table 1 provides an overview of the meteorological factors and temperature data at each depth for all sites. It should be noted that the temperature sensor at 30 cm depth at Site04 experienced a malfunction during monitoring. As a result, the data at this depth were missing. These data were excluded from the subsequent analysis and modeling process. Figure 1a illustrates the process of the dataset construction.

Table 1.
Information of meteorological and pavement temperature data at each site.
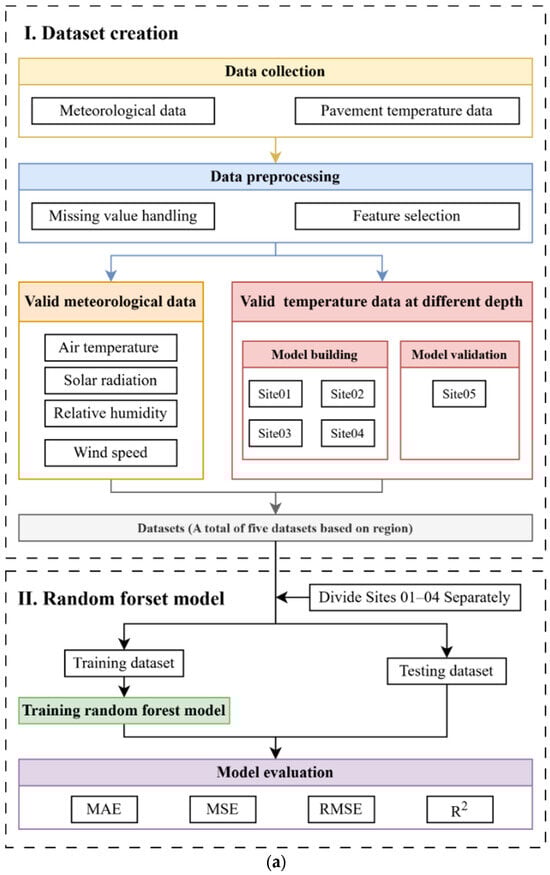
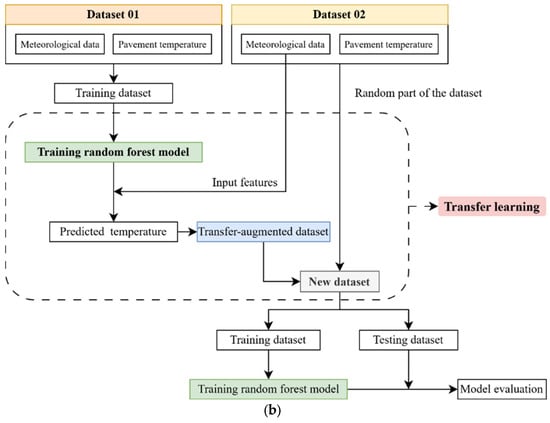
Figure 1.
Schematic diagram of the proposed methodology. (a) Dataset creation and random forest model development. (b) Transfer learning framework based on the random forest model.
2.2. Random Forest Models
Random forest (RF) is a regression method that enhances prediction accuracy and model robustness by integrating multiple decision trees [32]. The bootstrap sampling method with replacement is used to generate multiple subsets from the original training data. Each decision tree is trained on a different subset to enhance the generalization ability. During the construction of each tree, the Classification and Regression Trees (CART) algorithm is adopted. At each node, a random subset of meteorological features is selected for optimal splitting. This helps reduce the impact of feature correlation on model performance. Finally, the predictions from all decision trees are averaged to produce the final temperature prediction. In this study, RF was applied to develop a pavement temperature prediction model. The model development and application were carried out on the MATLAB R2019a platform. Meteorological factors were used as input variables, and pavement temperatures at different structural depths were set as the target outputs. An integrated regression model was built using the fitrensemble function, with the bagging strategy applied. Regression trees were selected as base learners. The number of learning rounds and tree structure parameters were set to train a stable prediction model. Figure 1a presents the workflow of the random forest model.
2.3. Transfer Learning Framework
Due to substantial differences in meteorological and geographical conditions across regions, models trained in one area often exhibit poor performance when directly applied to another. Transfer learning (TL) is a machine learning technique that enhances model performance in a target domain by leveraging knowledge gained from a related source domain [33]. It is particularly effective when data distributions differ but the prediction tasks remain similar. In this study, a transfer learning framework based on random forest (TL-RF) was proposed to improve the generalization ability of pavement temperature prediction models across regions. The RF model was initially trained using complete meteorological data from the source region. The learned model structure, including decision tree configurations and feature importance rankings, was then used as initialization for transfer. In the target region, a small set of representative meteorological and temperature samples was employed to fine-tune the model. This enabled rapid adaptation to new data distributions and significantly improved the accuracy and robustness of cross-regional predictions. Figure 1b depicts the implementation framework for transfer learning using a random forest approach.
2.4. Model Evaluation Metrics
After model training, the predict function in MATLAB was used to generate predictions for the test samples. The model’s performance in different regions was evaluated using several standard regression metrics. These metrics reflect both prediction accuracy and fitting quality. The mean absolute error (MAE) was used to assess the average deviation between the predicted and actual values. A lower MAE indicates higher prediction accuracy. The mean squared error (MSE), calculated as the average of squared errors, reflects the overall fitting quality and is more sensitive to large deviations. The root-mean-square error (RMSE), derived from the square root of the MSE, shares the same unit as the predicted target and provides a more intuitive understanding of prediction deviation. The coefficient of determination (R2) was used to represent the proportion of variance in the observed data that was explained by the model. In addition, to ensure the statistical significance of the correlation analysis, critical correlation coefficients were determined based on hypothesis testing at the 0.05 significance level in this study. The formulae for each evaluation metric are presented in Equations (1)–(4):
where is the measured temperature value, is the predicted temperature value, is the average value of the measured temperature, and n is the number of data points.
3. Analysis of Meteorological Characteristics
3.1. Meteorological Characteristics
To analyze the meteorological characteristics across different regions, the data on air temperature, solar radiation, relative humidity, and wind speed from Site01 to Site04 were statistically summarized. The distribution patterns of each variable were illustrated using histograms and relative frequency distribution curves, as shown in Figure 2. Overall, significant regional variations in these meteorological factors were observed, highlighting the distinct climatic conditions of each site. Table 2 shows the normal distribution fitting results for meteorological data across regions.

Figure 2.
Meteorological characteristics in different regions.
Table 2.
Normal distribution fitting results for meteorological data across regions.
As shown in Figure 2a, notable differences in air temperature distribution were observed among the regions. At Site01, the air temperature ranges from −15 °C to 35 °C. A higher relative frequency is observed in the 0 °C to 20 °C interval. This pattern indicates pronounced seasonal variation and considerable temperature fluctuation. Site02 exhibits a broader temperature span, from −15 °C to 40 °C, suggesting the presence of seasonal variability. In contrast, Site03 shows a more uniform distribution, predominantly between 5 °C and 25 °C, which implies a relatively mild climate with limited diurnal temperature variation. Site04 displays the most concentrated temperature range, primarily between 25 °C and 30 °C. This steep distribution curve reflects high temperature stability, while the distinct peak indicates infrequent occurrences of extreme values. Overall, the most pronounced temperature variability is found at Site01, while Site04 demonstrates the greatest thermal stability. Site02 and Site03 fall between these extremes, each exhibiting different degrees of seasonal transition.
Figure 2b presents the distribution pattern of solar radiation across the regions. A typical single-peak pattern can be observed in all four regions, indicating that the highest frequency occurs near a specific radiation intensity. Despite the overall similarity, differences are evident in the peak positions and curve shapes among the regions. These variations suggest distinct solar radiation characteristics. At Site03, the distribution is the most concentrated, mainly between 0.5 MJ/m2 and 1.5 MJ/m2. The steep curve indicates stable radiation intensity with limited fluctuation. The peak positions of Site01, Site02, and Site04 are close to that of Site03; however, the peak heights are lower, suggesting similar typical radiation levels. Compared to Site03, greater daily or seasonal fluctuations are implied, and the radiation stability is relatively reduced.
Figure 2c further illustrates the regional characteristics of relative humidity at each site. At Site01, relative humidity is mainly concentrated between 20% and 60%, with a higher frequency observed below 50%. This indicates a generally dry climate, where humid conditions are relatively infrequent. At Site02, the humidity distribution shifts upward, to the 40–80% range. Although slightly more humid than Site01, the region still remains relatively dry. In contrast, the distributions at Site03 and Site04 are skewed toward higher humidity levels, primarily between 65% and 95%. The steep curves reflect strong concentration and low variability. This suggests a generally more humid and stable climate. Site03, in particular, shows the most concentrated humidity distribution. This may be influenced by geographic factors, such as proximity to water bodies and local topography, resulting in a significantly wetter environment.
Finally, regional differences in wind speed distributions are illustrated in Figure 2d. At Site02, Site03, and Site04, the wind speeds are mainly concentrated around 2 m/s. The steep distribution curves suggest limited variability and a relatively stable wind environment, with a low likelihood of extreme wind events. In contrast, Site01 exhibits a broader wind speed range, primarily between 2 m/s and 4 m/s. The maximum wind speed at this site exceeds 10 m/s, which is significantly higher than in the other regions. This indicates greater variability and an increased potential for extreme wind conditions. In summary, substantial differences were observed in the distribution characteristics of key meteorological variables, including air temperature, solar radiation, relative humidity, and wind speed, across the studied regions. These variations reflect the diversity in geographic settings, climate types, and natural conditions. Such regional disparities reveal the spatial heterogeneity of meteorological patterns. These differences also pose challenges for developing and generalizing temperature prediction models. Therefore, regional variability must be carefully considered to enhance models’ adaptability and improve their prediction accuracy.
3.2. Pavement Temperature Characteristics
The temperature distribution characteristics at various depths across different sites are shown in Figure 3. From this, the layered response pattern of temperature variation within the pavement structure can be identified. In general, both the maximum temperature and the temperature variation range decrease significantly with increasing depth. The most pronounced fluctuations occur at the surface layer (0 cm), where the widest temperature distribution is observed. This indicates that the surface is directly exposed to environmental conditions and is highly sensitive to meteorological influences. At Site01, for instance, the surface temperatures exceed 60 °C, with frequent occurrences above 40 °C. This further confirms the strong environmental impact in this region. At depths of 5 cm and 12 cm, the temperature fluctuations are reduced but still notable. As the depth increases to 30 cm, the temperature variation becomes more stable. The maximum temperature drops below 35 °C, and extreme values are significantly reduced. The distribution curve flattens, indicating that deeper layers are largely insulated from short-term meteorological fluctuations.
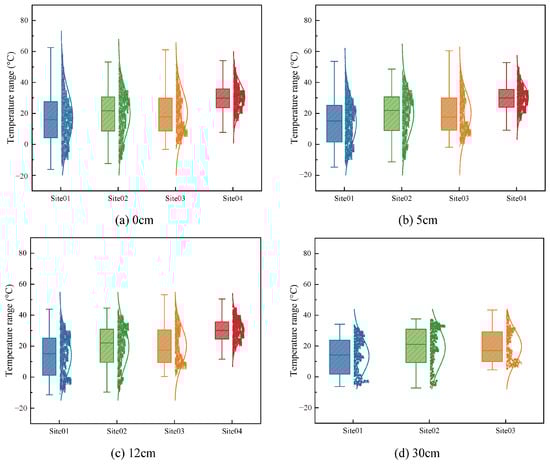
Figure 3.
Pavement temperature characteristics at different depths in different regions.
Regarding regional differences, notable variations in temperature patterns across sites are observed. At a depth of 0 cm, Site01, Site02, and Site03 exhibit wide temperature ranges, with minimum values falling below 0 °C. Among these, the maximum temperatures at Site01 and Site03 exceed 60 °C, indicating pronounced temperature extremes and high fluctuation intensity. This reflects substantial diurnal or seasonal variation. In contrast, Site04 displays the most concentrated distribution. Although the overall temperature range remains relatively high, the median and interquartile range are more stable. This suggests a more regular and predictable temperature pattern. In terms of statistical characteristics, the median temperatures at Site01 and Site03 are close to 20 °C. The data distributions are relatively balanced, but the long whiskers reflect large fluctuations and strong influence from extreme values. Site02 has a slightly higher median, at around 25 °C, but a considerable portion of low-temperature data is present, indicating a generally cooler temperature profile. Site04 records the highest median temperature, at approximately 30 °C, with a narrow distribution. This reflects a warmer and more stable regional climate.
Further comparison of the extreme ranges indicates that Site01 exhibits the widest upper and lower whiskers. This suggests that the temperature variation at this site is the most pronounced. In contrast, the distributions at Site02 and Site03 are more convergent; however, a difference in temperature bias is still evident. The minimum value at Site02 is lower than that at Site03, while the maximum value at Site03 exceeds that of Site02. This implies that the temperature amplitude at both sites is similar, but Site02 is generally colder, while Site03 is slightly warmer. Although the extreme range at Site04 is narrower, a higher data density is observed. This reflects strong temperature stability within a typical range. From the perspective of distribution density, most of the temperature values at Site01, Site02, and Site03 fall within 15 °C to 30 °C. In contrast, the dense region of Site04 shifts toward 30 °C to 40 °C, confirming both its higher temperature level and stronger thermal stability. As depth increases, the differences in temperature distributions across sites become less pronounced; however, relative distinctions remain. The regional characteristics in terms of amplitude, extreme values, and distribution patterns are still evident at deeper layers, although the overall temperature variation decreases. In summary, the internal temperature of the pavement structure is affected by both depth and regional conditions. With increasing depth, the temperature response becomes progressively attenuated, shifting from strong fluctuations at the surface to relative thermal stability in deeper layers. Regional influences are reflected in the amplitude of temperature variation, the occurrence of extreme values, and the characteristics of statistical distributions. These differences highlight the fundamental variations in pavements’ thermal behavior under distinct climatic environments.
3.3. Correlation Analysis Between Meteorological Factors and Pavement Temperature
IBM SPSS Statistics 27 was applied to examine how pavement temperatures at different depths relate to four meteorological variables in various regions. These variables included air temperature (AT), solar radiation (SR), relative humidity (RH), and wind speed (WS). The results in Table 3 show that the strength of the correlations changes with depth and region. This suggests that the effect of meteorological factors on pavement temperature is not consistent across different spatial locations and layers.
Table 3.
Results of correlation analysis between temperature and meteorological factors.
To ensure the statistical significance of the correlation analysis, the critical correlation coefficients at the 0.05 significance level for each study region were calculated. Based on these thresholds, only the correlation coefficients exceeding the corresponding critical values were considered statistically significant. As shown in Table 3, AT exhibits a strong and stable positive correlation with pavement temperature across all depths. In all four regions, the correlation coefficients generally exceed 0.85 within the 0–30 cm range, indicating that AT serves as a primary meteorological factor influencing pavements’ thermal behavior. The correlation coefficients first increase with depth and then decrease slightly. A high level is still maintained at 30 cm, indicating that the influence of air temperature extends to deeper pavement layers. SR also demonstrates a significant impact on surface and shallow pavement temperatures. Most of the correlation coefficients fall between 0.47 and 0.72. Notably, at Site01, the coefficient between SR and surface temperature reaches 0.719, highlighting a strong solar-driven effect on near-surface thermal conditions. However, the correlations decrease markedly with depth. At 30 cm, the lowest values are observed, indicating that the influence of solar radiation is primarily limited to the surface layers, with a reduced conductive impact on deeper sections.
The correlation between RH and pavement temperature varies significantly across regions. At Site01, Site03, and Site 04, a negative correlation is observed, indicating that higher humidity tends to coincide with lower pavement temperatures. In contrast, a positive correlation is found at Site02, with the strength of the correlation increasing with depth. At 30 cm at Site02, the coefficient reaches 0.582, which exceeds the critical correlation threshold, indicating a statistically significant relationship. These results imply that the impact of humidity is closely related to geographic and climatic conditions, and that the underlying mechanism is complex. In comparison, WS shows a generally weak correlation with pavement temperature. Both positive and negative values appear, suggesting that WS has only a limited direct effect on pavements’ thermal behavior. In summary, significant variations can be observed in the correlation between pavement temperature and meteorological factors at different depths across the four regions. Air temperature was identified as the primary influencing factor, while the impacts of solar radiation, relative humidity, and wind speed are more complex and exhibit strong regional dependence. To further investigate these relationships, data from the four regions were aggregated for correlation analysis. The correlation thermograms between pavement temperature at different depths and the four meteorological factors for the four regions are shown in Figure 4.
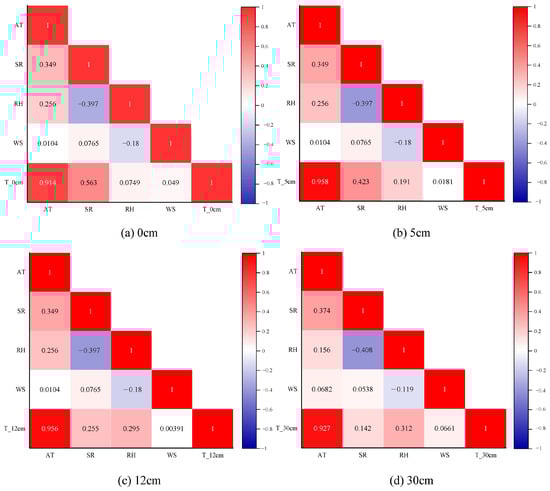
Figure 4.
Correlation analysis between temperature at different depths and meteorological characteristics.
A consistently strong positive correlation can be observed between AT and pavement temperature across all depths, with the correlation coefficients exceeding 0.9. The correlation increases with depth initially and then slightly decreases, yet remains at a high level, demonstrating the persistent influence of AT on subsurface thermal behavior. SR exhibits a moderate correlation with surface temperature, which declines significantly with increasing depth. At 30 cm, the correlation coefficient drops to approximately 0.14, indicating that the influence of SR is mainly limited to the shallow pavement layers, with weakened transmission to deeper layers. The correlation between RH and pavement temperature is generally low, with little variation across depths. The highest coefficient reaches 0.312. WS presents the weakest correlation across all regions and depths, suggesting a limited direct impact on the pavements’ thermal response. These correlation patterns reveal the varying influence levels of different meteorological factors. Regional climatic characteristics play a key role in shaping pavements’ thermal behavior. Distinct responses can be observed across the four study regions. These findings highlight the necessity of incorporating regional heterogeneity. Such consideration is essential for the development and generalization of pavement temperature prediction models.
4. Results and Discussion
4.1. Pavement Temperature Prediction Based on Ensemble Models
Among the studied meteorological factors, air temperature was found to be the primary factor influencing pavement temperature, while solar radiation, relative humidity, and wind speed showed varying degrees of correlation, depending on the region and depth. Considering these factors, this study selected air temperature, solar radiation, relative humidity, and wind speed as input features, and we used pavement temperature at different depths as the prediction target. An RF model was developed to perform the temperature predictions. Table 4 presents the model performance in each region on the training and testing datasets. The training and testing data, based on samples from the region, were divided at a ratio of 7:3.
Table 4.
Evaluation results of RF model’s training and testing datasets from different regions.
The results demonstrate that the RF model achieves high overall accuracy in pavement temperature prediction, confirming its effectiveness for this task. To better illustrate the model’s performance across regions, the evaluation metrics at different depths were averaged, as shown in Figure 5. The figure indicates that the model maintained stable predictive performance on both the training and testing datasets. However, the prediction accuracy varied among regions due to differences in local meteorological and temperature conditions. For example, the R2 value on the testing set reached 0.96 at Site01, while it was 0.89 at Site04. It should be noted that these R2 values represent the average goodness of fit across all measured depths, reflecting the overall prediction performance at each site. These results suggest that, although regional performance varies, training and testing within each region yield acceptable prediction accuracy. This can be attributed to the robustness of RF in modeling nonlinear relationships, as well as its tolerance to noise and outliers. Furthermore, the model achieves strong accuracy and generalization without extensive parameter tuning, even under varying regional data distributions.
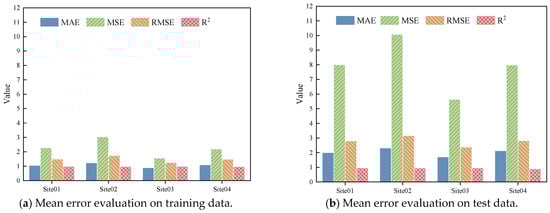
Figure 5.
Comparison of average prediction errors on training and test datasets.
To further evaluate the model’s cross-regional adaptability, data from Site01 were used for training, while the RF model was applied to predict pavement temperatures at Site02. The measured and predicted values are shown in Figure 6. Although both sites are located in northern China and share similar climate conditions, the model’s prediction accuracy at Site02 was limited. The R2 value for surface temperature prediction was only 0.72, indicating a considerable error and highlighting the model’s limitations in cross-regional applications. This result was mainly due to the fact that the model was trained using local features such as temperature, solar radiation, relative humidity, and wind speed, which vary between regions. Without adaptation, the model lacks the ability to account for inter-regional climate differences, leading to reduced accuracy when applied to new locations.
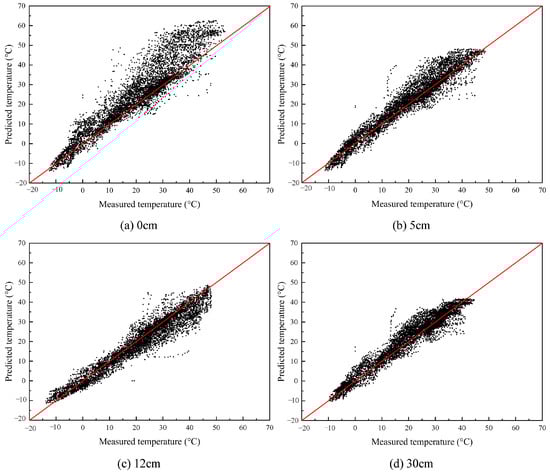
Figure 6.
Predicted and measured temperatures at Site02 using an RF model trained on Site01 data.
Similarly, the model trained on Site01 data was used to predict pavement temperatures at different depths at Site03 and Site04, as shown in Figure 7. The results indicate that the highest prediction accuracy was achieved only at Site01, with a correlation coefficient of approximately 0.98. In contrast, the prediction performance declined notably at Site03 and Site04, particularly at Site04, where the R2 for surface temperature prediction dropped to just 0.51. These findings highlight that although the random forest model performed well within the training region, its generalization ability across regions is limited and highly sensitive to environmental differences. Relying solely on local data for model training makes it difficult to achieve accurate cross-regional predictions. Therefore, it is essential to enhance the modeling approach to improve adaptability in varying climatic conditions.
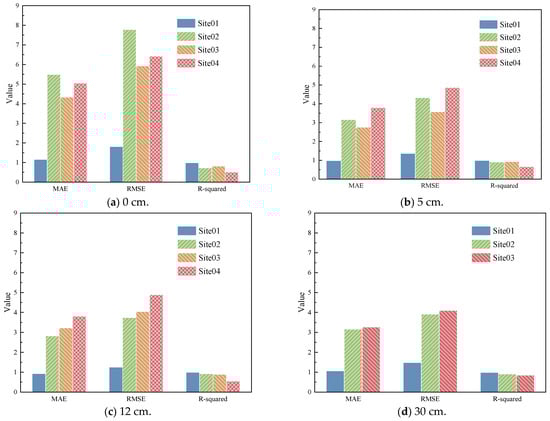
Figure 7.
Model evaluation for temperature prediction in different regions using an RF model trained on Site01 data.
4.2. Cross-Regional Prediction Using Transfer Learning Based on Random Forest
To improve the regional adaptability of the model, transfer learning (TL) was incorporated into the RF model. Firstly, the model was trained using data from Site01, and transferable features were extracted by applying it to samples from other regions. These features were then fused with the original input data of the target region to generate an augmented dataset. This dataset was re-divided into training and testing sets, and transfer learning was applied to retrain the model. As shown in Figure 8, Figure 9 and Figure 10, the predicted values closely matched the measured data in each region, indicating that the model’s prediction performance was significantly enhanced.
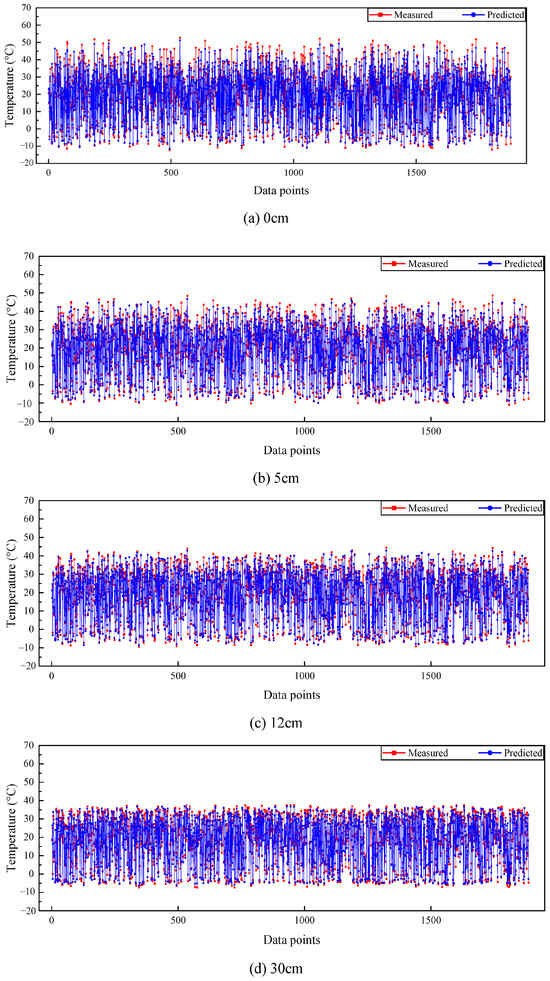
Figure 8.
Predicted and measured temperature at Site02.
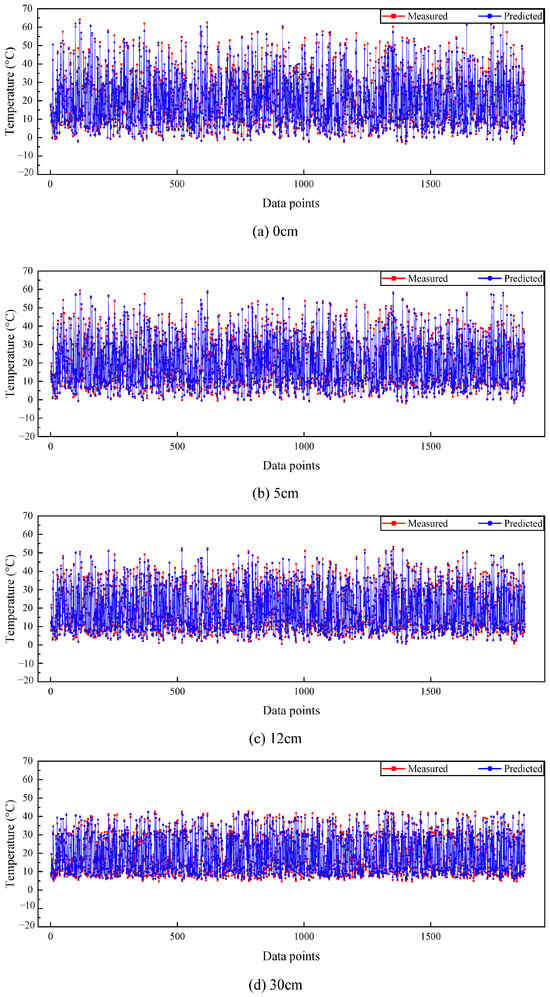
Figure 9.
Predicted and measured temperature at Site03.

Figure 10.
Predicted and measured temperature at Site04.
To further validate the effectiveness of the transfer learning approach, data from the Site01 region were selected as the source-domain training set, while 30% of the samples from each target region were used as the testing set. The model’s performance before and after optimization was compared, and the evaluation results are shown in Figure 11. As illustrated, the introduction of transfer learning significantly improved the prediction accuracy across all regions. For instance, in the Site02 region, the RMSE of the surface temperature prediction decreased from 7.83 to 3.78, the MAE dropped from 5.54 to 2.68, and R2 increased from 0.74 to 0.94. At Site03, the RMSE declined from 5.75 to 2.46, the MAE from 4.23 to 1.73, and R2 rose to 0.97. Similarly, at Site04, the RMSE was reduced from 6.48 to 3.03, the MAE from 5.08 to 2.28, and R2 improved significantly to 0.89. In addition, the prediction performance at different pavement depths (5 cm, 12 cm, and 30 cm) was also evaluated. Table 5 presents the corresponding improvements in evaluation metrics before and after optimization for each region. These results confirm that the TL-RF model effectively improves regional adaptability in pavement temperature prediction and demonstrates strong potential for broader cross-regional application.
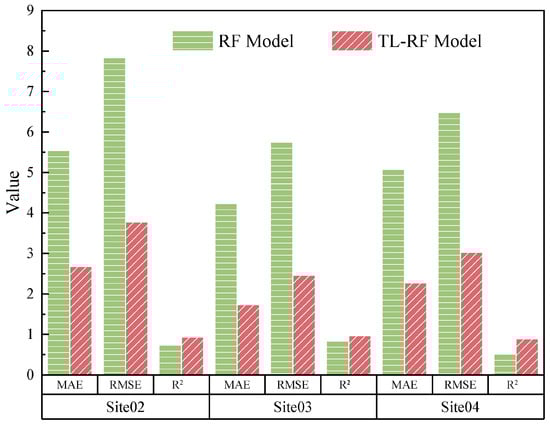
Figure 11.
Model evaluation at Site02 using a TL-RF model trained on Site01 data.
Table 5.
Model evaluation in different regions using a TL-RF model trained on Site01 data.
4.3. Integrated Prediction Across All Regions via Enhanced Transfer Learning
To improve the model’s generalization capability and enhance its prediction accuracy in multi-region scenarios, a transfer learning framework based on multiple target regions was developed, building upon the single-region transfer approach. In this framework, the Site01 region was designated as the source domain, while the combined data from Site02, Site03, and Site04 formed the target domain. Using RF as the base learner, TF was performed through feature enhancement. This strategy enabled the model to capture shared patterns across regions and achieve integrated prediction of pavement temperature variations in diverse climatic environments. The prediction results of the RF and the TL-RF models at different depths were compared, as shown in Figure 12. As shown in the figure, the prediction performance of the TL-RF model was better than that of the RF, with more data points near the y = x line.
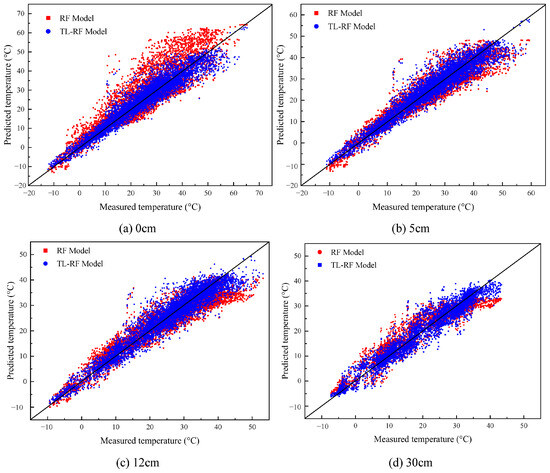
Figure 12.
Predicted and measured temperature using RF and TL-RF models.
The comparative evaluation metrics of the models at different depths are presented in Figure 13. The results indicate that, after data fusion from multiple target regions, the TL-RF model achieved lower MSE and MAE values, along with a significant improvement in R2. Specifically, for surface temperature prediction, the TL-RF model showed significant improvements over the RF model. The RMSE decreased from 6.7 to 3.86, the MAE from 4.91 to 2.78, and the R2 improved from 0.75 to 0.92. Furthermore, a comparison of prediction performance at different depths revealed that both models exhibited improved accuracy with increasing depth. The prediction accuracy at the road surface was the lowest, primarily because surface temperature is more susceptible to fluctuations caused by meteorological conditions. Notably, the TL-RF model substantially reduced prediction errors at the surface level, demonstrating enhanced adaptability to varying environmental factors across regions. These results further validate the effectiveness of feature enhancement and multi-region data fusion in temperature prediction. In conclusion, the transfer learning strategy based on feature enhancement not only enhances the model’s adaptability and robustness across different regions but also provides a practical pathway for developing cross-regional models in engineering applications, such as pavement temperature monitoring, road maintenance planning, intelligent transportation systems, and climate-responsive infrastructure design.
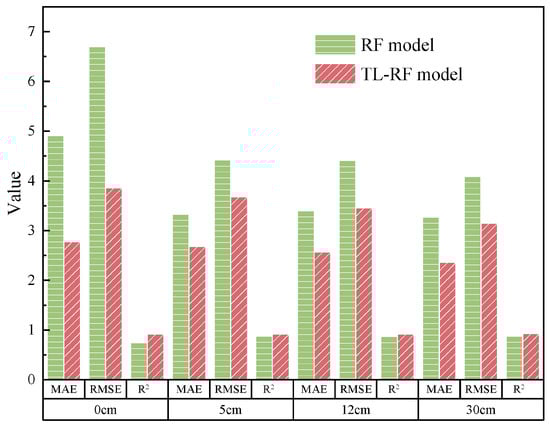
Figure 13.
Comparison of model prediction results at different depths.
4.4. Model Validation Using Independent Regional Data
To evaluate the generalization ability and practical applicability of the proposed temperature prediction model, Site05 was used as an independent validation site. Local meteorological and pavement temperature data were collected and compared with the model outputs. The model was initially trained using data from Site01 to Site04 through a TL model enhanced with feature augmentation. This trained model was then applied to predict temperatures at Site05. A comparison between the predicted results and the measured data is shown in Figure 14. The results indicate a high degree of agreement between the predicted and measured values, with most of the data points distributed closely along the y = x line, demonstrating the model’s strong adaptability and generalization capability. Specifically, the R2 at depths of 0 cm, 5 cm, 12 cm, and 30 cm was 0.96, 0.97, 0.96, and 0.94, respectively, while the MAE was 2.1 °C, 1.88 °C, 1.92 °C, and 2.23 °C, respectively, indicating a high level of overall prediction accuracy. These results confirm the model’s high predictive accuracy under unfamiliar climatic conditions, demonstrating its suitability for practical engineering use.
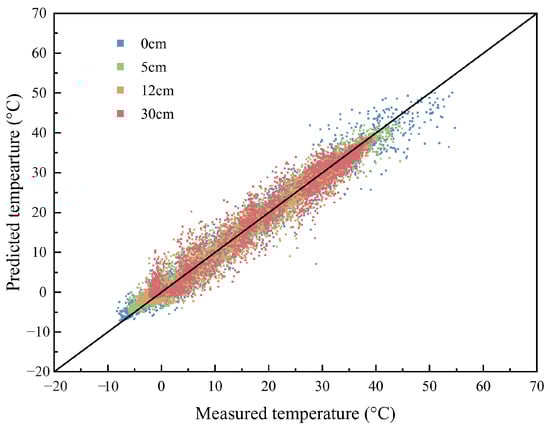
Figure 14.
Validation results of the TL-RF model based on Site05.
In addition, a region-based k-fold cross-validation was implemented to further assess the model’s cross-regional adaptability. The five study sites were treated as separate folds. In each round, one site served as the target region, while the remaining four provided the source data. A base random forest model was first trained on the combined source datasets and then applied to the target site for initial predictions. These predictions were integrated with the original inputs to create an augmented feature set. Subsequently, 70% of the target site’s data were used for model fine-tuning, and the remaining 30% were used for evaluation. Metrics such as prediction error and R2 were computed for each fold. This process was repeated for all five regions, yielding a comprehensive validation scheme. The results, summarized in Table 6, demonstrate the model’s consistent accuracy and stability across different climatic zones, underscoring its strong potential for cross-regional pavement temperature prediction.
Table 6.
Prediction performance of the TL-RF model using k-fold cross-validation, by region.
5. Conclusions
To address the poor adaptability of traditional models in different climatic regions, a transfer learning model based on random forest was proposed for improving the accuracy of pavement temperature prediction under cross-regional conditions. Firstly, a correlation analysis was conducted between meteorological factors and pavement temperature at various depths. Secondly, the meteorological factors were selected as the model inputs, and the random forest model was built with the pavement temperatures at different depths as the prediction targets. Thirdly, a transfer learning approach was applied. The model was optimized by using the feature enhancement strategy to improve its generalization ability in the target regions. This enabled high-precision temperature prediction across different regions. The main conclusions of this study are as follows:
- The correlation analysis reveals both commonalities and regional differences in the relationships between pavement temperature and meteorological factors. Across all study areas, pavement temperature consistently exhibits strong correlations with air temperature and solar radiation, indicating that these two factors are the dominant drivers of pavements’ thermal behavior. However, the influence of relative humidity and wind speed varies among regions. At Site01 and Site03, the pavement temperature is significantly affected by both relative humidity and wind speed, whereas at Site02 and Site04, the correlation with relative humidity is weak. These regional variations highlight the need to consider localized climatic characteristics when developing and applying predictive models.
- The random forest model achieves high accuracy when predicting pavement temperatures within the same region. For example, using meteorological data from Site01 to predict temperatures at Site01 yields an R2 of 0.98, indicating excellent performance. However, when the same model is applied to Site02, Site03, and Site04, its accuracy declines significantly, with the R2 values falling to 0.72, 0.82, and 0.51, respectively. This performance gap highlights the model’s strong reliance on region-specific data and its limited ability to generalize across varying climatic conditions. As a result, it is essential to improve the model’s adaptability to ensure accurate and scalable pavement temperature predictions across multiple regions.
- By introducing feature enhancement strategies based on multi-regional data, the TL-RF model demonstrates significant improvements in predictive performance. Compared to the RF model, the TL-RF model reduces the RMSE from 6.7 to 3.86 and the MAE from 4.91 to 2.78, while the R2 increases markedly from 0.75 to 0.92. These improvements reflect the model’s enhanced generalization ability and robustness in adapting to regional variability. The findings demonstrate that the proposed approach provides a practical and scalable solution to the limitations of traditional models in cross-regional pavement temperature prediction.
- To evaluate the generalization capability and practical applicability of the proposed TL-RF model, independent validation was performed using data from a region excluded from the training process. The model maintained high prediction accuracy across various depths, with an average R2 of 0.95, indicating strong transferability and robustness under unfamiliar climatic conditions. While these results are promising, future research should explore the model’s scalability to broader climatic regions and finer temporal resolutions. Utilizing public datasets and integrating deep learning-based ensemble methods may further improve the computational efficiency and predictive performance.
Author Contributions
Conceptualization, J.Y., L.S. and Y.C.; Data Curation, J.Y. and M.L.; Formal Analysis, J.Y.; Funding Acquisition, H.C.; Investigation, R.Y. and M.L.; Methodology, T.J.; Resources, H.C.; Software, R.Y.; Supervision, L.S. and Y.C.; Validation, T.J.; Writing—Original Draft, J.Y., H.C. and T.J.; Writing—Review and Editing, J.Y., H.C., L.S., Y.C., R.Y., T.J. and M.L. All authors have read and agreed to the published version of the manuscript.
Funding
This work was supported by the Key Engineering Science and Technology Project of Jiangxi Provincial Department of Transportation (2024ZG006), the Research Project of Anhui Transportation Holdings Group (JKKJ-2023-12), the Fundamental Research Funds for the Central Universities (22120250142), and the 2023 Annual Open Project of Transportation Industry Key Laboratory of Highway Construction and Maintenance Technology in Loess Region (KLTLR-Y23-15).
Institutional Review Board Statement
Not applicable.
Informed Consent Statement
Not applicable.
Data Availability Statement
The original contributions presented in this study are included in the article. Further inquiries can be directed to the corresponding author.
Conflicts of Interest
Author Yadong Cao was employed by the company Shanghai Highway and Bridge Co., Ltd. The remaining authors declare that the research was conducted in the absence of any commercial or financial relationships that could be construed as a potential conflict of interest. The authors declare that this study received funding from Anhui Transportation Holdings Group. The sponsors had no role in the design, execution, interpretation, or writing of the study.
References
- Assogba, O.C.; Tan, Y.; Zhou, X.; Zhang, C.; Anato, J.N. Numerical investigation of the mechanical response of semi-rigid base asphalt pavement under traffic load and nonlinear temperature gradient effect. Constr. Build. Mater. 2020, 235, 117406. [Google Scholar] [CrossRef]
- Xue, Q.; Liu, L.; Zhao, Y.; Chen, Y.-J.; Li, J.-S. Dynamic behavior of asphalt pavement structure under temperature-stress coupled loading. Appl. Therm. Eng. 2013, 53, 1–7. [Google Scholar] [CrossRef]
- Cheng, H.; Liu, J.; Sun, L.; Liu, L. Critical position of fatigue damage within asphalt pavement considering temperature and strain distribution. Int. J. Pavement Eng. 2021, 22, 1773–1784. [Google Scholar] [CrossRef]
- Zhang, Q.; Yang, S.; Chen, G. Regional variations of climate change impacts on asphalt pavement rutting distress. Transp. Res. Part D Transp. Environ. 2024, 126, 103968. [Google Scholar] [CrossRef]
- Ma, R.; Li, Y.; Cheng, P.; Chen, X.; Cheng, A. Low-temperature cracking and improvement methods for asphalt pavement in cold regions: A review. Buildings 2024, 14, 3802. [Google Scholar] [CrossRef]
- Yang, R.; Liu, L.; Sun, L.; Jin, T.; Cheng, H.; Yuan, J. Effective temperature model for rutting prediction considering temperature distribution inside the asphalt pavements. Road Mater. Pavement Des. 2025, 1–20. [Google Scholar] [CrossRef]
- Wang, T.-H.; Su, L.-J.; Zhai, J.-Y. A case study on diurnal and seasonal variation in pavement temperature. Int. J. Pavement Eng. 2014, 15, 402–408. [Google Scholar] [CrossRef]
- Cheng, H.; Wang, Y.; Chong, D.; Xia, C.; Sun, L.; Liu, J.; Gao, K.; Yang, R.; Jin, T. Truck platooning reshapes greenhouse gas emissions of the integrated vehicle-road infrastructure system. Nat. Commun. 2023, 14, 4495. [Google Scholar] [CrossRef]
- Adwan, I.; Milad, A.; Memon, Z.A.; Widyatmoko, I.; Ahmat Zanuri, N.; Memon, N.A.; Yusoff, N.I.M. Asphalt pavement temperature prediction models: A review. Appl. Sci. 2021, 11, 3794. [Google Scholar] [CrossRef]
- Sreedhar, S.; Biligiri, K.P. Development of pavement temperature predictive models using thermophysical properties to assess urban climates in the built environment. Sustain. Cities Soc. 2016, 22, 78–85. [Google Scholar] [CrossRef]
- Chandrappa, A.K.; Biligiri, K.P. Development of pavement-surface temperature predictive models: Parametric approach. J. Mater. Civ. Eng. 2016, 28, 04015143. [Google Scholar] [CrossRef]
- Athukorallage, B.; Senadheera, S.; James, D. Temporal and spatial temperature predictions for flexible pavement layers using numerical thermal analysis and verified with large datasets. Case Stud. Constr. Mater. 2023, 18, e02008. [Google Scholar] [CrossRef]
- Saliko, D.; Ahmed, A.; Erlingsson, S. Development and validation of a pavement temperature profile prediction model in a mechanistic-empirical design framework. Transp. Geotech. 2023, 40, 100976. [Google Scholar] [CrossRef]
- Ntramah, S.; Tutu, K.A.; Tuffour, Y.A.; Adams, C.A.; Adanu, E.K. Evaluation of selected empirical models for asphalt pavement temperature prediction in a tropical climate: The case of Ghana. Sustainability 2023, 15, 15846. [Google Scholar] [CrossRef]
- Walia, A.; Rastogi, R.; Kumar, P.; Jain, S. Development of a temperature prediction model for asphalt pavements considering air temperature data of preceding hours. Int. J. Pavement Eng. 2023, 24, 2132245. [Google Scholar] [CrossRef]
- Li, Y.; Liu, L.; Sun, L. Temperature predictions for asphalt pavement with thick asphalt layer. Constr. Build. Mater. 2018, 160, 802–809. [Google Scholar] [CrossRef]
- Diefenderfer, B.K.; Al-Qadi, I.L.; Diefenderfer, S.D. Model to predict pavement temperature profile: Development and validation. J. Transp. Eng. 2006, 132, 162–167. [Google Scholar] [CrossRef]
- Ghalandari, T.; Shi, L.; Sadeghi-Khanegah, F.; Vuye, C. Utilizing artificial neural networks to predict the asphalt pavement profile temperature in western Europe. Case Stud. Constr. Mater. 2023, 18, e02130. [Google Scholar] [CrossRef]
- Xu, B.; Dan, H.-C.; Li, L. Temperature prediction model of asphalt pavement in cold regions based on an improved BP neural network. Appl. Therm. Eng. 2017, 120, 568–580. [Google Scholar] [CrossRef]
- Kebede, Y.B.; Yang, M.-D.; Huang, C.-W. Real-time pavement temperature prediction through ensemble machine learning. Eng. Appl. Artif. Intell. 2024, 135, 108870. [Google Scholar] [CrossRef]
- Liu, P.; Wang, L.; Ranjan, R.; He, G.; Zhao, L. A survey on active deep learning: From model driven to data driven. ACM Comput. Surv. 2022, 54, 221. [Google Scholar] [CrossRef]
- Joo, C.; Park, H.; Lim, J.; Cho, H.; Kim, J. Development of physical property prediction models for polypropylene composites with optimizing random forest hyperparameters. Int. J. Intell. Syst. 2022, 37, 3625–3653. [Google Scholar] [CrossRef]
- Kwak, S.; Kim, J.; Ding, H.; Xu, X.; Chen, R.; Guo, J.; Fu, H. Machine learning prediction of the mechanical properties of γ-TiAl alloys produced using random forest regression model. J. Mater. Res. Technol. 2022, 18, 520–530. [Google Scholar] [CrossRef]
- Rostami, M.A.; Frontalini, F.; Giordano, P.; Francescangeli, F.; Martins, M.V.A.; Dyer, L.; Spagnoli, F. Testing the applicability of random forest modeling to examine benthic foraminiferal responses to multiple environmental parameters. Mar. Environ. Res. 2021, 172, 105502. [Google Scholar] [CrossRef]
- Fox, E.W.; Hill, R.A.; Leibowitz, S.G.; Olsen, A.R.; Thornbrugh, D.J.; Weber, M.H. Assessing the accuracy and stability of variable selection methods for random forest modeling in ecology. Environ. Monit. Assess. 2017, 189, 316. [Google Scholar] [CrossRef]
- Zheng, H.; Wang, R.; Yang, Y.; Yin, J.; Li, Y.; Li, Y.; Xu, M. Cross-domain fault diagnosis using knowledge transfer strategy: A review. IEEE Access 2019, 7, 129260–129290. [Google Scholar] [CrossRef]
- Gholizade, M.; Soltanizadeh, H.; Rahmanimanesh, M.; Sana, S.S. A review of recent advances and strategies in transfer learning. Int. J. Syst. Assur. Eng. Manag. 2025, 16, 1123–1162. [Google Scholar] [CrossRef]
- Pires de Lima, R.; Marfurt, K. Convolutional neural network for remote-sensing scene classification: Transfer learning analysis. Remote Sens. 2019, 12, 86. [Google Scholar] [CrossRef]
- Zhang, Z.; Yang, H.; Yang, X. A transfer learning–based LSTM for traffic flow prediction with missing data. J. Transp. Eng. Part A Syst. 2023, 149, 04023095. [Google Scholar] [CrossRef]
- Ma, Y.; Chen, S.; Ermon, S.; Lobell, D.B. Transfer learning in environmental remote sensing. Remote Sens. Environ. 2024, 301, 113924. [Google Scholar] [CrossRef]
- Muñoz Sabater, J. ERA5-Land Hourly Data From 1950 to Present. Copernicus Climate Change Service (C3S) Climate Data Store (CDS). 2019. Available online: https://cds.climate.copernicus.eu/datasets/reanalysis-era5-land?tab=overview (accessed on 31 October 2024).
- Parmar, A.; Katariya, R.; Patel, V. A review on random forest: An ensemble classifier. In Proceedings of the International Conference on Intelligent Data Communication Technologies and Internet of Things; Springer: Cham, Switzerland, 2018; pp. 758–763. [Google Scholar] [CrossRef]
- Weiss, K.; Khoshgoftaar, T.M.; Wang, D. A survey of transfer learning. J. Big Data 2016, 3, 9. [Google Scholar] [CrossRef]
Disclaimer/Publisher’s Note: The statements, opinions and data contained in all publications are solely those of the individual author(s) and contributor(s) and not of MDPI and/or the editor(s). MDPI and/or the editor(s) disclaim responsibility for any injury to people or property resulting from any ideas, methods, instructions or products referred to in the content. |
© 2025 by the authors. Licensee MDPI, Basel, Switzerland. This article is an open access article distributed under the terms and conditions of the Creative Commons Attribution (CC BY) license (https://creativecommons.org/licenses/by/4.0/).