Article

A Multi-Scale Approach for Finite Element Method Structural Analysis of Injection-Molded Parts of Short Fiber-Reinforced Polymer Composite Materials

1
MDT Laboratory, TRINITY Engineering Co., Ltd., Seoul 07997, Republic of Korea
2
Department of Mechanical Engineering, Kunsan National University, Gunsan 54150, Republic of Korea
3
The Innovation Research Center for Giant Wind Turbine System, Kunsan National University, Gunsan-si 54150, Republic of Korea
4
Daeheung R&T, Gimhae-si 50872, Republic of Korea
5
Reclaimed Land Agriculture Research Center, National Institute of Crop and Food Science, Rural Development Administration, Wanju 55365, Republic of Korea
*
Authors to whom correspondence should be addressed.
Appl. Sci. 2025, 15(13), 7434; https://doi.org/10.3390/app15137434
Submission received: 22 May 2025 / Revised: 25 June 2025 / Accepted: 26 June 2025 / Published: 2 July 2025
(This article belongs to the Special Issue Optimized Design and Analysis of Mechanical Structure)

Abstract

Short fiber-reinforced polymer composites are extensively used in automotive structural components, such as engine mounts and motor mount brackets, due to their favorable strength-to-weight ratio. For motor mount brackets, accurate structural analysis requires consideration of fiber orientation, as it significantly affects the mechanical behavior of the composite. This study aims to investigate the influence of fiber orientation heterogeneity on the mechanical properties of short fiber-reinforced polymer composites formed by injection molding. The spatial variation of the fiber orientation tensor, which evolves from the gate to the flow end during molding, presents challenges in experimental characterization. To address this, microscale analysis was conducted using injection-molded tensile specimens, followed by mesoscale modeling through representative volume elements (RVEs). Homogenization techniques were applied to predict effective mechanical properties, which were subsequently used to evaluate the performance of actual components at the macroscale. The findings demonstrate the importance of multi-scale modeling in capturing the anisotropic behavior of fiber-reinforced composites and provide a framework for more reliable structural analysis in automotive applications.

1. Introduction

Multi-scale modeling is a widely adopted approach in various scientific and engineering disciplines including physics, chemistry, materials science, and structural engineering to study systems or phenomena that span multiple spatial or temporal scales [1,2,3]. This approach is not only used to predict the mechanical properties of fiber-reinforced polymer (FRP) composites, such as those reinforced with glass or carbon fibers, but also to investigate failure mechanisms [4]. For example, J. Llorca proposed a bottom–up multi-scale modeling strategy that integrates material behavior from the nanoscale to the macroscale, enabling high-fidelity virtual mechanical testing of composite structures [5]. Eleftherios developed a multi-scale material model capable of capturing the coupled damage and healing behavior of epoxy matrices in composites by integrating nonlinear mean-field homogenization with continuum damage-healing mechanics [6].
The core concept of multi-scale modeling is to integrate information from nano- and microscale material structures into macroscopic models, thereby enabling a comprehensive understanding of system behavior. In materials science and structural engineering, this approach is particularly important for analyzing complex materials and structures, as it helps bridge the gap between microscopic features such as fiber orientation, fiber structure, and resin-to-fiber weight ratio and macroscopic properties like strength and elasticity.
Short fiber-reinforced plastic (SFRP) composites are typically manufactured via injection molding, where the fiber orientation and resin-to-fiber weight ratio significantly influence the mechanical properties [7]. In this context, H. Mehdipour developed a constitutive model that captures the nonlinear mechanical behavior of SFRPs, incorporating plasticity-induced deformation and post-yield damage through a non-local damage framework. This model, implemented in ABAQUS via a UMAT subroutine, effectively simulates the anisotropic and rate-dependent response of short fiber composites and has been validated against experimental tensile and compression data for PA6 with GF60 [8].
Analysis of fiber orientation in injection-molded SFRP composites reveals its sensitivity to shear rate. Near the surface, increased shear rate aligns fibers parallel to the flow direction, while in the core, reduced shear rate results in perpendicular or random orientations [9]. Micro-CT imaging of actual tensile specimens confirms that fiber orientation varies significantly from the surface to the core. These variations are reflected in the fiber orientation tensor, which differs across the cross-section due to the flow characteristics of the injection molding process.
This study also confirms that tensile specimens molded in different orientations such as flat molds versus standard tensile specimen molds exhibit different stress–strain behavior, highlighting the influence of fiber orientation on mechanical properties. Since fiber orientation strongly affects the anisotropic behavior of SFRP composites [10], multi-scale modeling is essential for accurate property prediction [11].
In the case of FRP composites, 3D printing technology has enabled the design of various fiber orientations, represented by fiber orientation tensors. Studies have shown that mechanical properties vary significantly depending on these tensors [12]. However, producing tensile specimens for every fiber orientation is impractical, making it difficult to evaluate material properties experimentally. As a result, structural simulations often rely on anisotropic properties derived from flat-molded specimens, using only the principal direction of the fiber orientation tensor for each mesh element. This simplification limits the accuracy of conventional finite element methods (FEMs) in predicting the behavior of SFRP composites [13].
To overcome these limitations, this study estimates effective material properties of SFRP composites using FFT-based homogenization methods [14,15,16,17,18]. PA66 with 50 (wt%) glass fiber (GF50) was selected as the representative material. Injection molding simulations were conducted to obtain fiber orientation tensors, which were then used to construct representative volume elements (RVEs) for each mesh in the FEM model. Microscale modeling was applied to incorporate both fiber orientation and resin-to-fiber weight ratios. Using homogenization, orthotropic properties were generated for each mesh element, reflecting the predominant fiber orientation.
The proposed multi-scale modeling approach was validated by comparing simulation results with experimental hammering test data for a key electric vehicle component: the motor mount bracket. The results confirmed that the model effectively captures fiber orientation and orthotropic mechanical behavior in injection-molded SFRP composites.

2. Materials and Methods

2.1. Materials

In this study, the selected material was polyamide 66 (PA66) reinforced with 50 wt% (32 vol%) glass fiber, a composite widely utilized in injection molding applications. PA66/GF50 (wt%) offers an excellent balance of mechanical strength, thermal stability, and processability, making it particularly suitable for structural components. Among fiber-reinforced thermoplastics, this formulation is one of the most commonly adopted in the automotive and industrial sectors due to its proven performance under demanding mechanical and thermal conditions [19].
The Zytel 101L NC010 (DuPont, Wilmington, DE, USA) used in this study is a lubricated polyamide 66 (PA66) resin specifically engineered for injection molding applications. E-glass fiber was selected as the reinforcing agent due to its high strength-to-weight ratio and cost efficiency, making it a standard choice in fiber-reinforced plastics. The fibers used in the composite had an average length of approximately 180 µm and a diameter of about 10 µm, which are representative of the fiber geometry typically observed in molded PA66 composites.
Table 1 presents the mechanical properties of PA66 and glass fiber, including Young’s modulus, Poisson’s ratio, bulk modulus, and shear modulus. The properties of PA66 were determined through experimental testing using tensile specimens supplied by the manufacturer, while those of the glass fiber were compiled from technical datasheets provided by the supplier.
Figure 1 illustrates the rheological and thermodynamic characteristics of PA66 reinforced with 50 wt% glass fiber: (a) viscosity as a function of shear rate, and (b) the isobaric pressure–volume–temperature (PVT) curve. Viscosity measurements were conducted in accordance with ASTM D3835 [20], while PVT data were obtained following ASTM D792 [21].

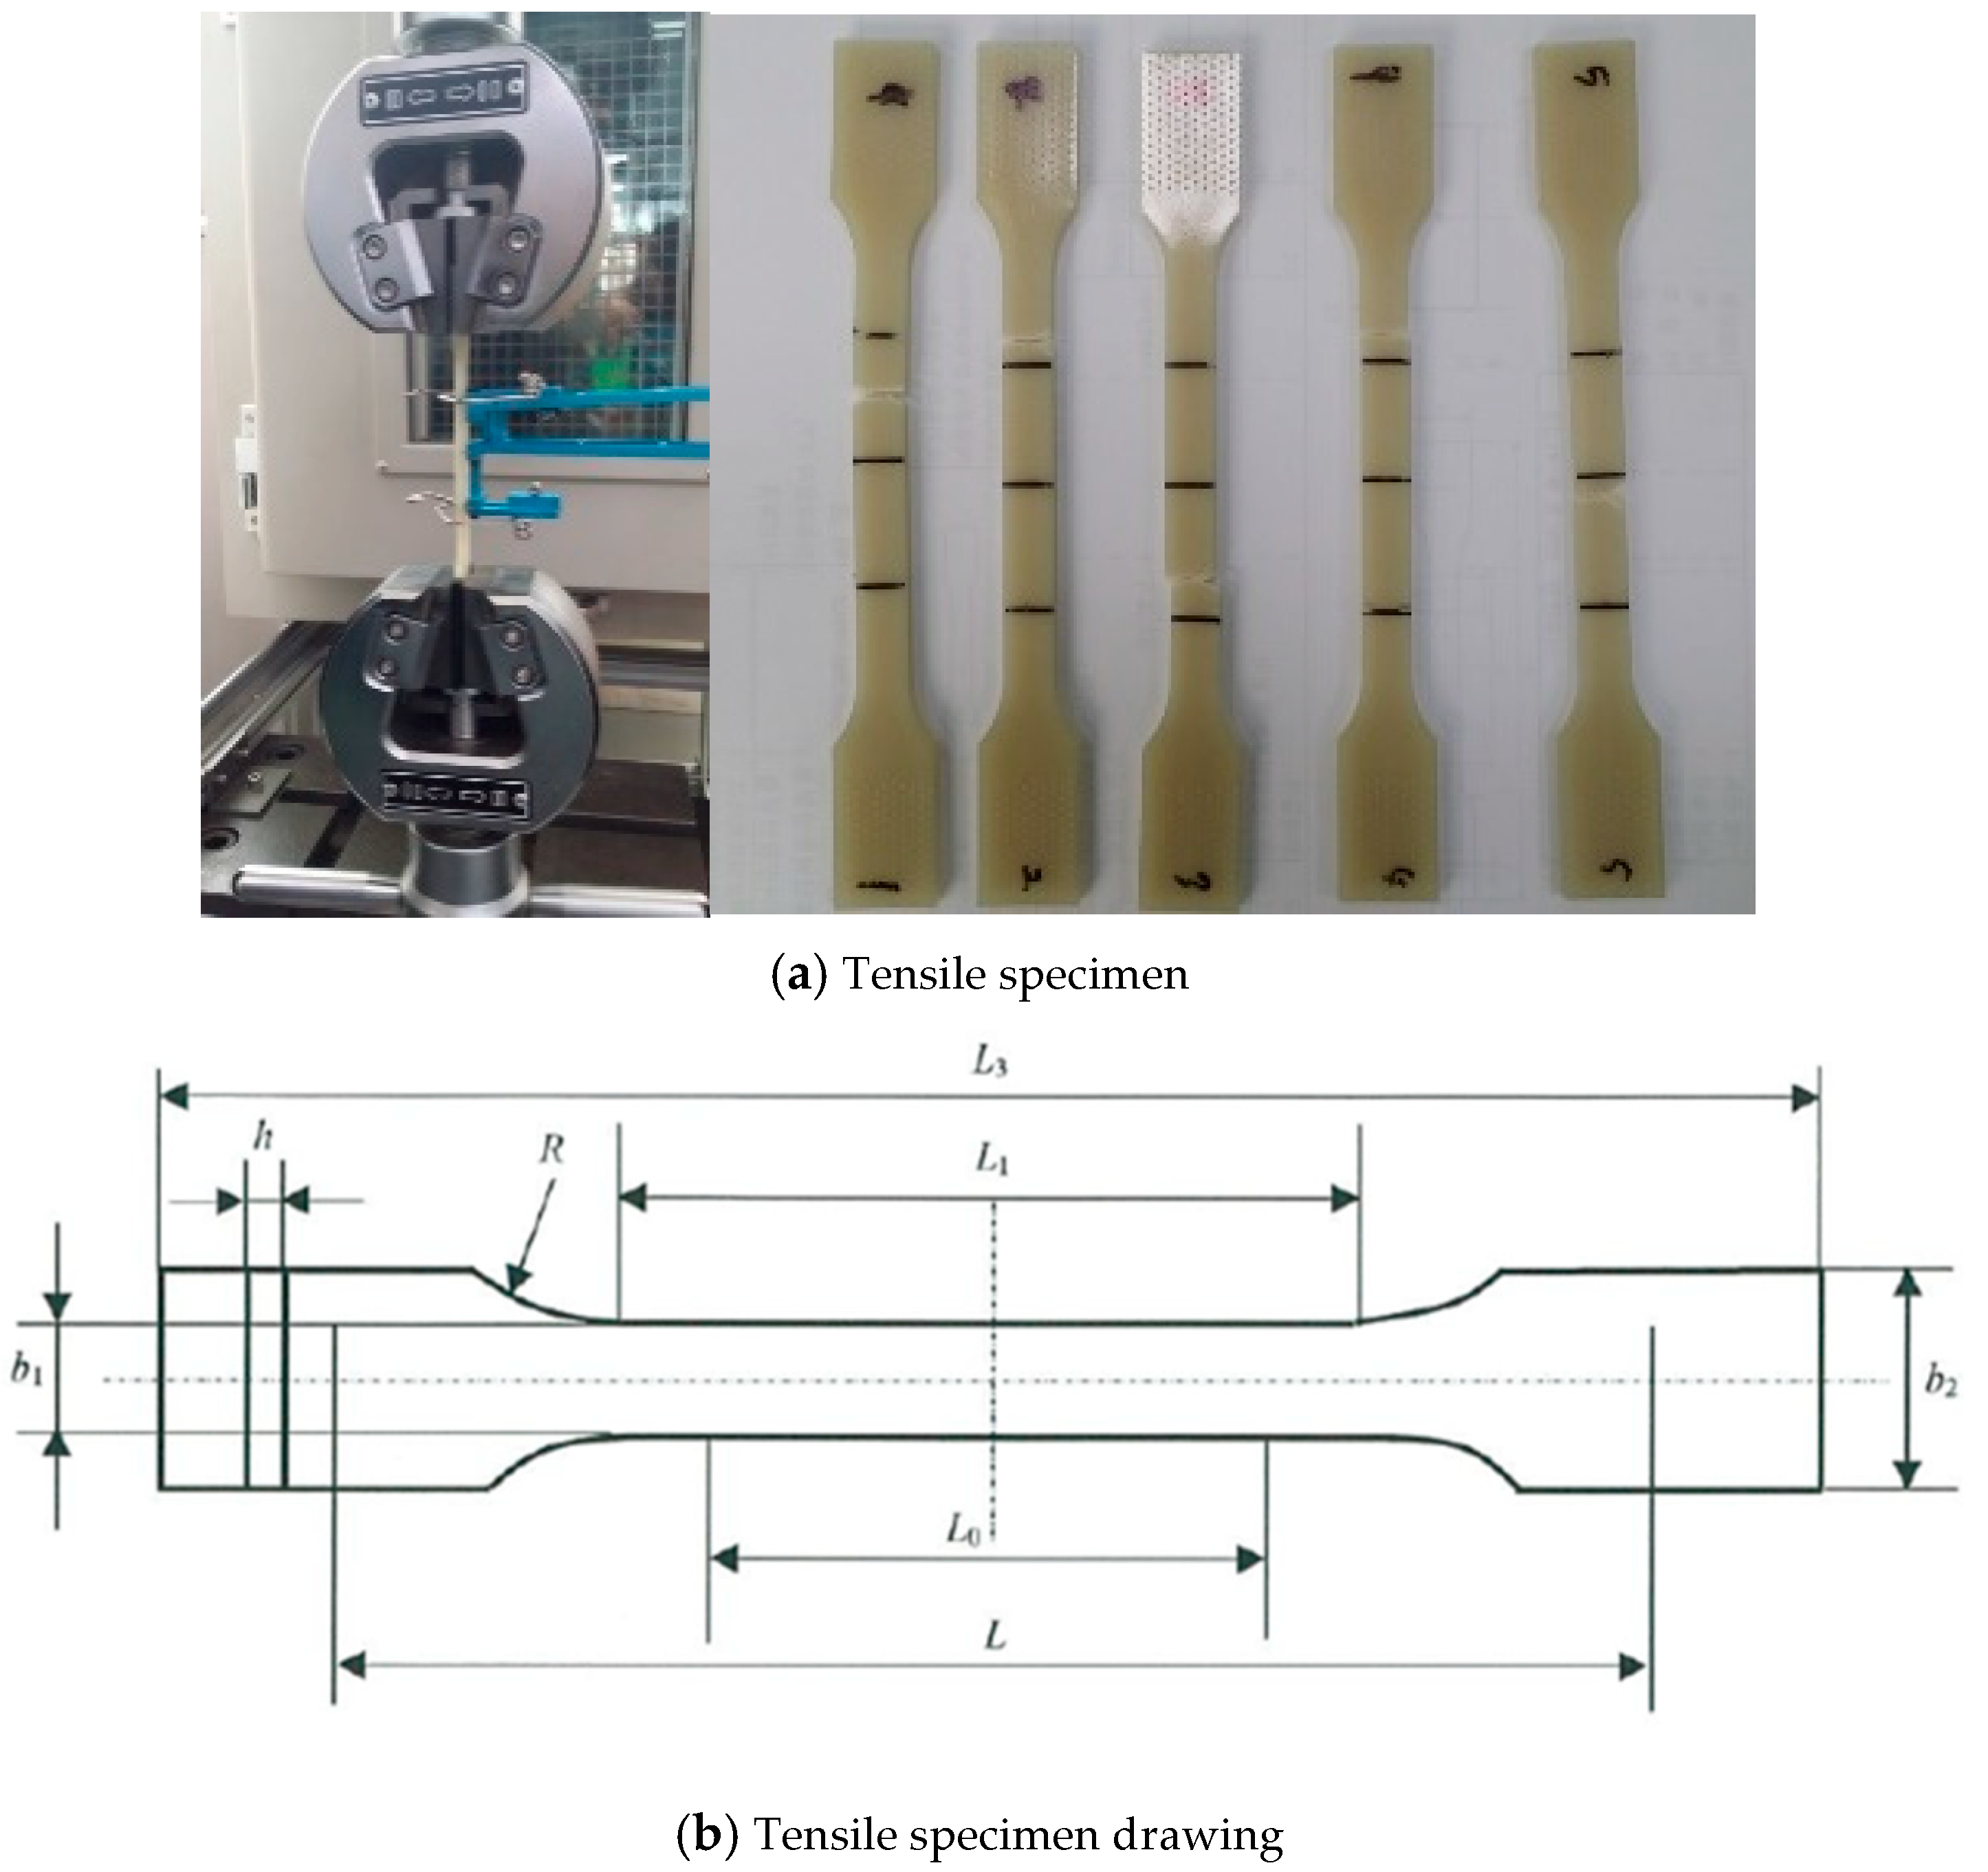
2.2. Specimen of Tensile Test Preparation and Testing Methods

Figure 2 depicts the preparation process for tensile test specimens. A flat plate was first produced via injection molding, after which specimens were precisely machined using CNC equipment to prevent processing-induced damage. Tensile specimens were extracted at orientations of 0° (parallel to the flow direction), 45°, and 90° relative to the injection flow.
Figure 3 shows the heating zones within the cylinder of the injection molding machine, configured according to the conditions listed in Table 2. Table 2 details the molding parameters for the flat plate mold. NH (Nozzle Heating) indicates the nozzle temperature, while H1, H2, and H3 correspond to the temperatures of sequential zones within the cylinder, with H1 being closest to the nozzle. The molding conditions were optimized to minimize deformation of the molded plates. Injection molding was primarily controlled by time, with pressure and speed set as percentages of the equipment’s maximum capacity rather than absolute values. These settings—typically between 80% and 90%—were used to determine actual pressure and speed values, which were back-calculated based on the predefined injection time. Real-time monitoring of the molding behavior was performed using pressure gauges installed on the equipment. The same control strategy was applied in the process simulation, where injection time was fixed and holding pressure was defined as a percentage of the calculated injection pressure, ensuring consistency between experimental and simulated conditions.
A total of 20 flat plates were fabricated. Based on surface quality and dimensional consistency, 10 plates were selected for specimen preparation. From each selected plate, tensile specimens were machined at orientations of 0°, 45°, and 90° relative to the flow direction using CNC equipment to prevent processing damage. For each condition, five replicate tensile tests were conducted, and the average values were used for analysis.
To prepare dumbbell-shaped specimens for tensile testing, flat-shaped molds (180 × 180 × 4 mm) were used to produce specimens oriented at 0°, 45°, and 90° with respect to the injection flow direction. Figure 4 presents the geometry of the tensile specimens used in accordance with the ASTM D638M standard [22]. The dimensional specifications of the specimens are provided in Table 3, while the tensile test conditions are detailed separately in Table 4. Figure 4a shows a photograph of the tensile specimen, and Figure 4b illustrates the schematic drawing of the specimen. For each orientation, five replicate tensile tests were conducted, and the average values were used for analysis.

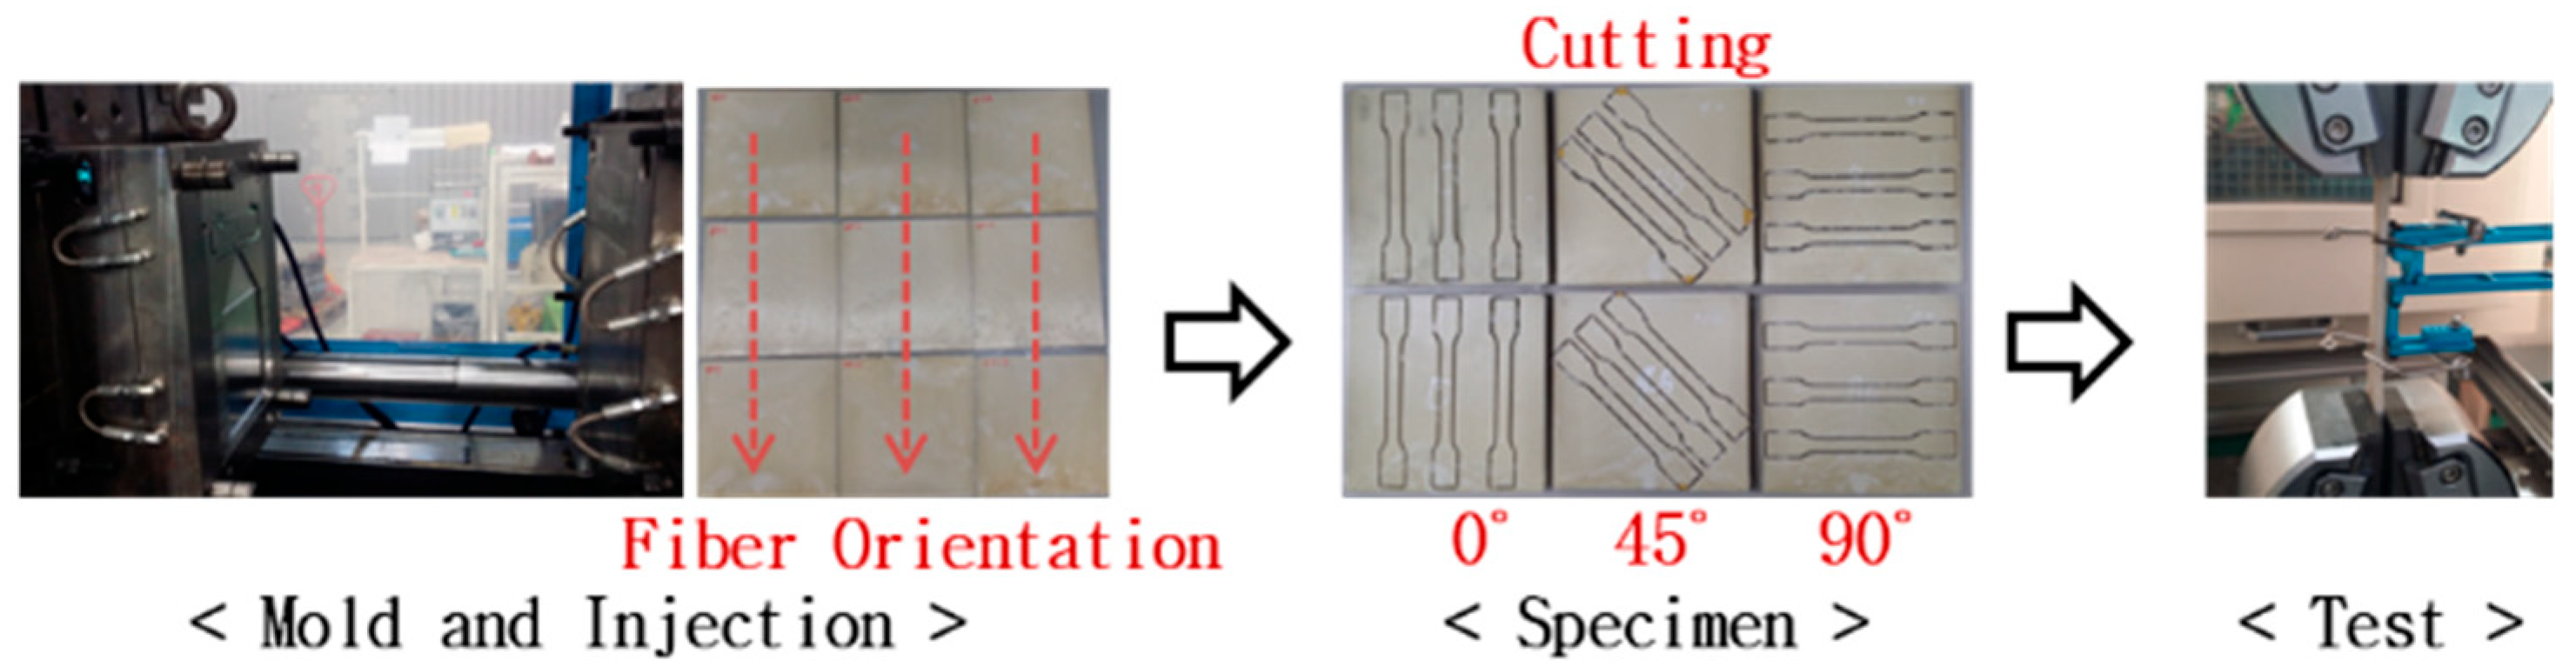
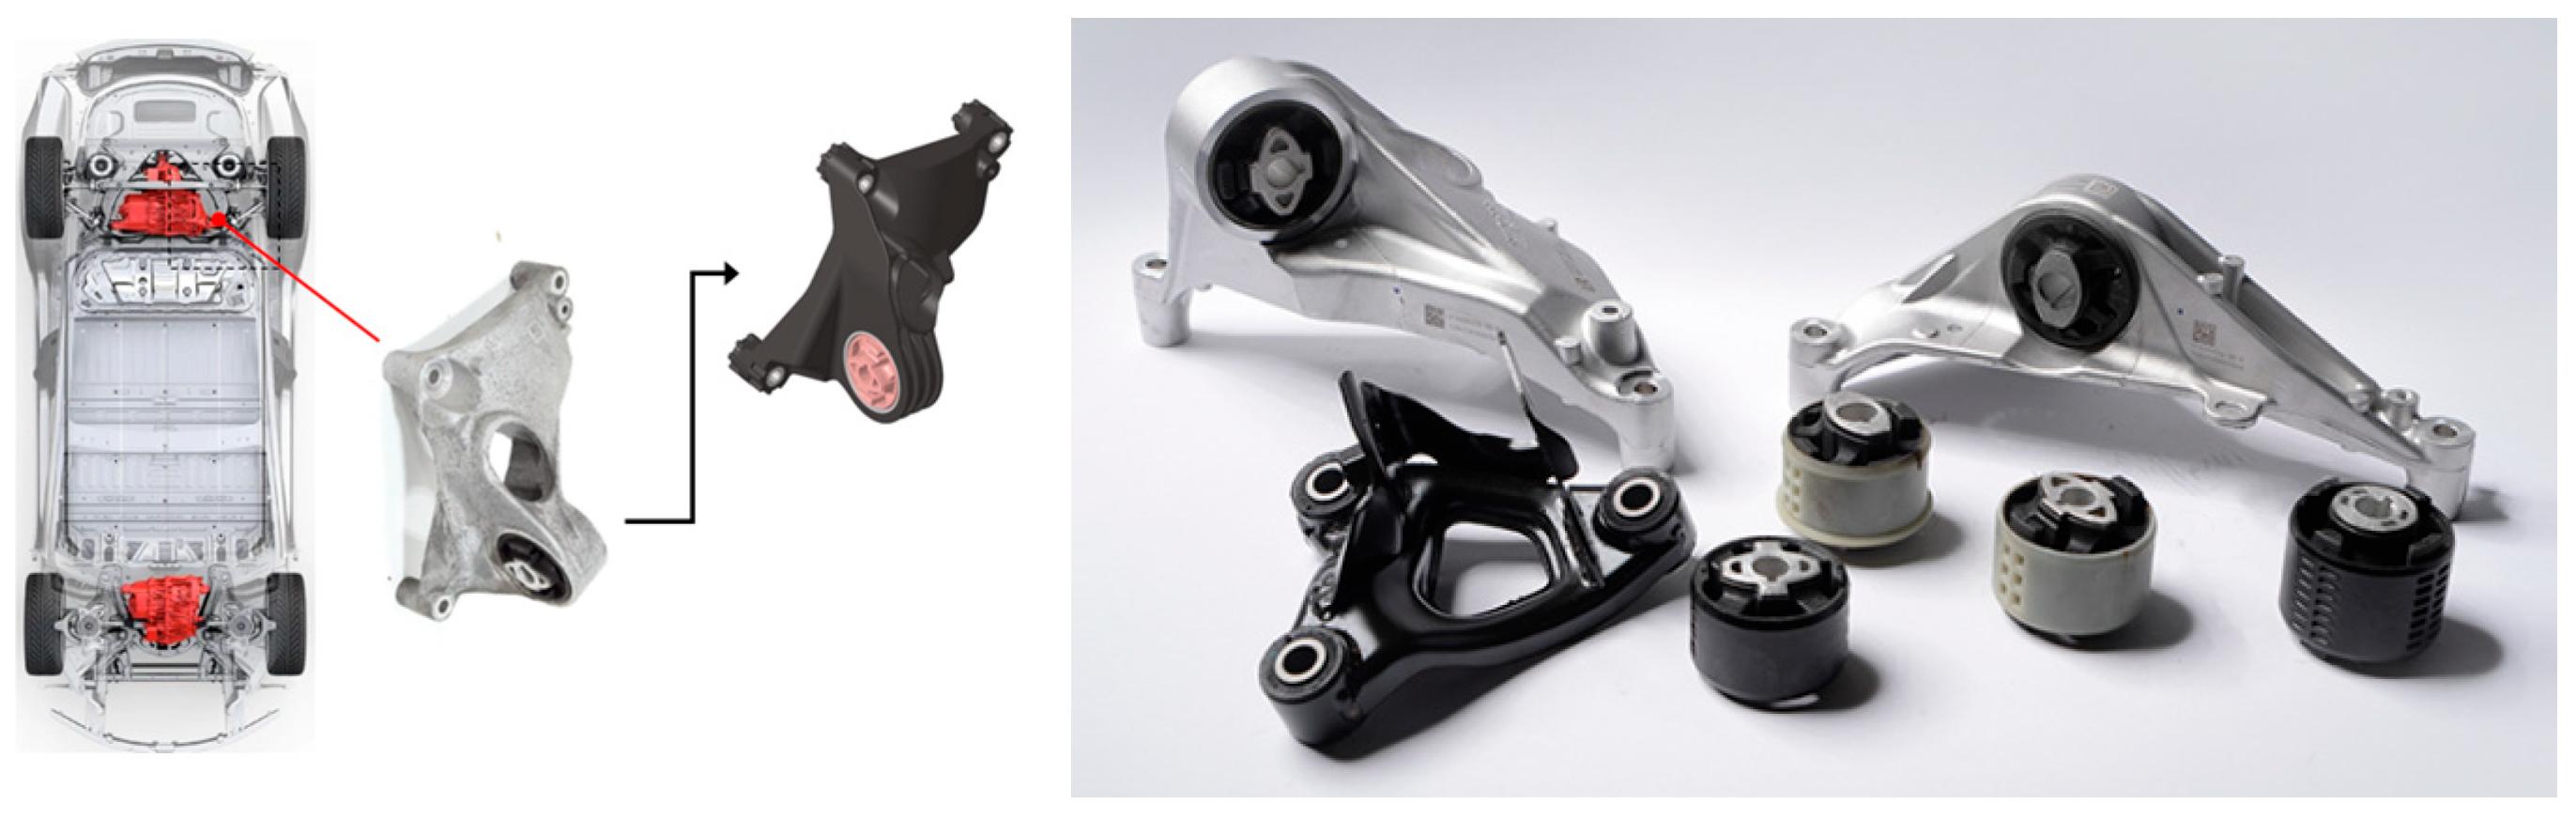
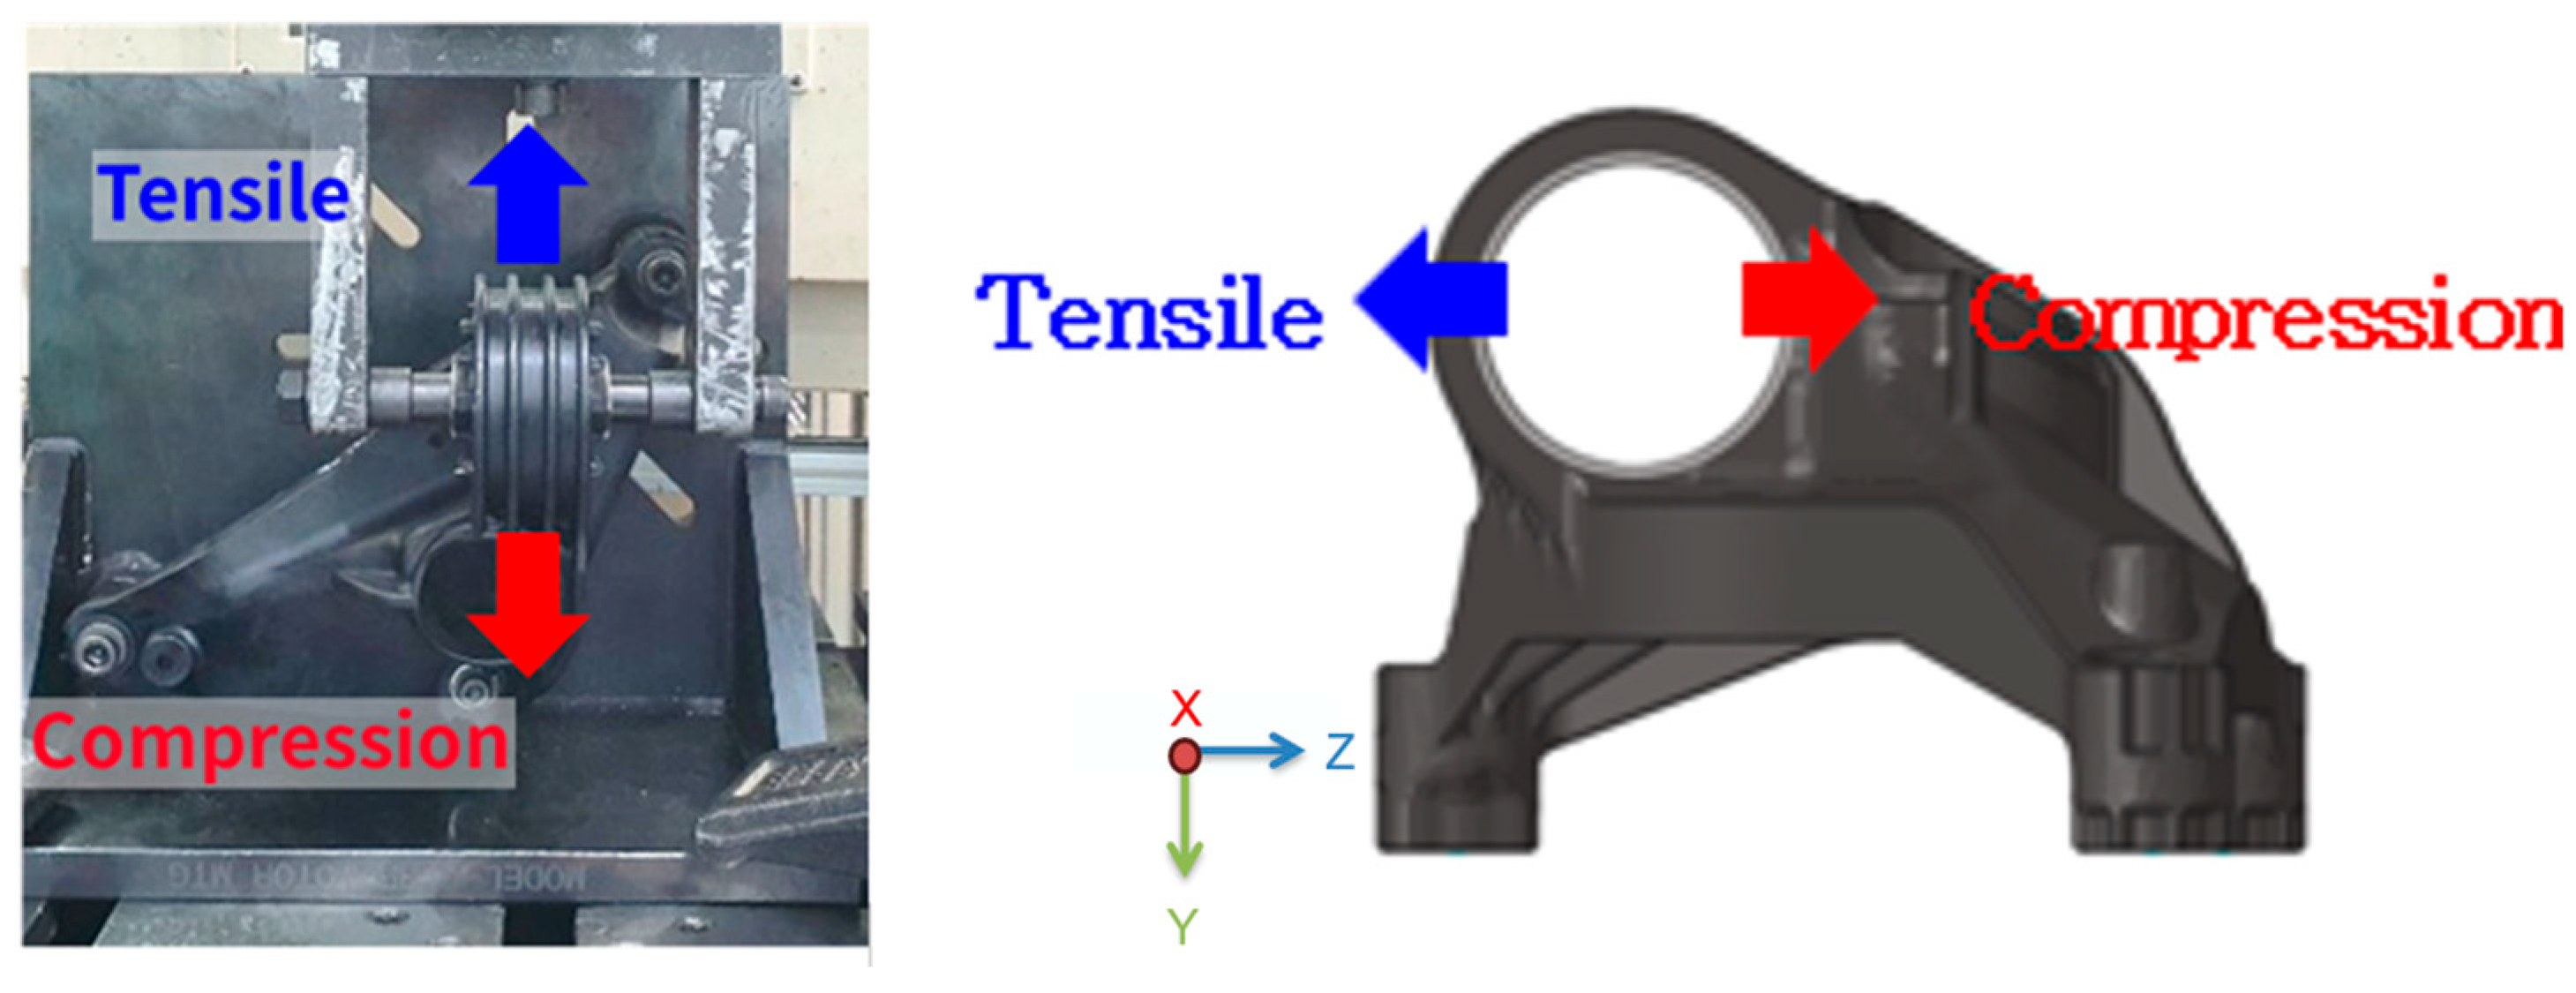
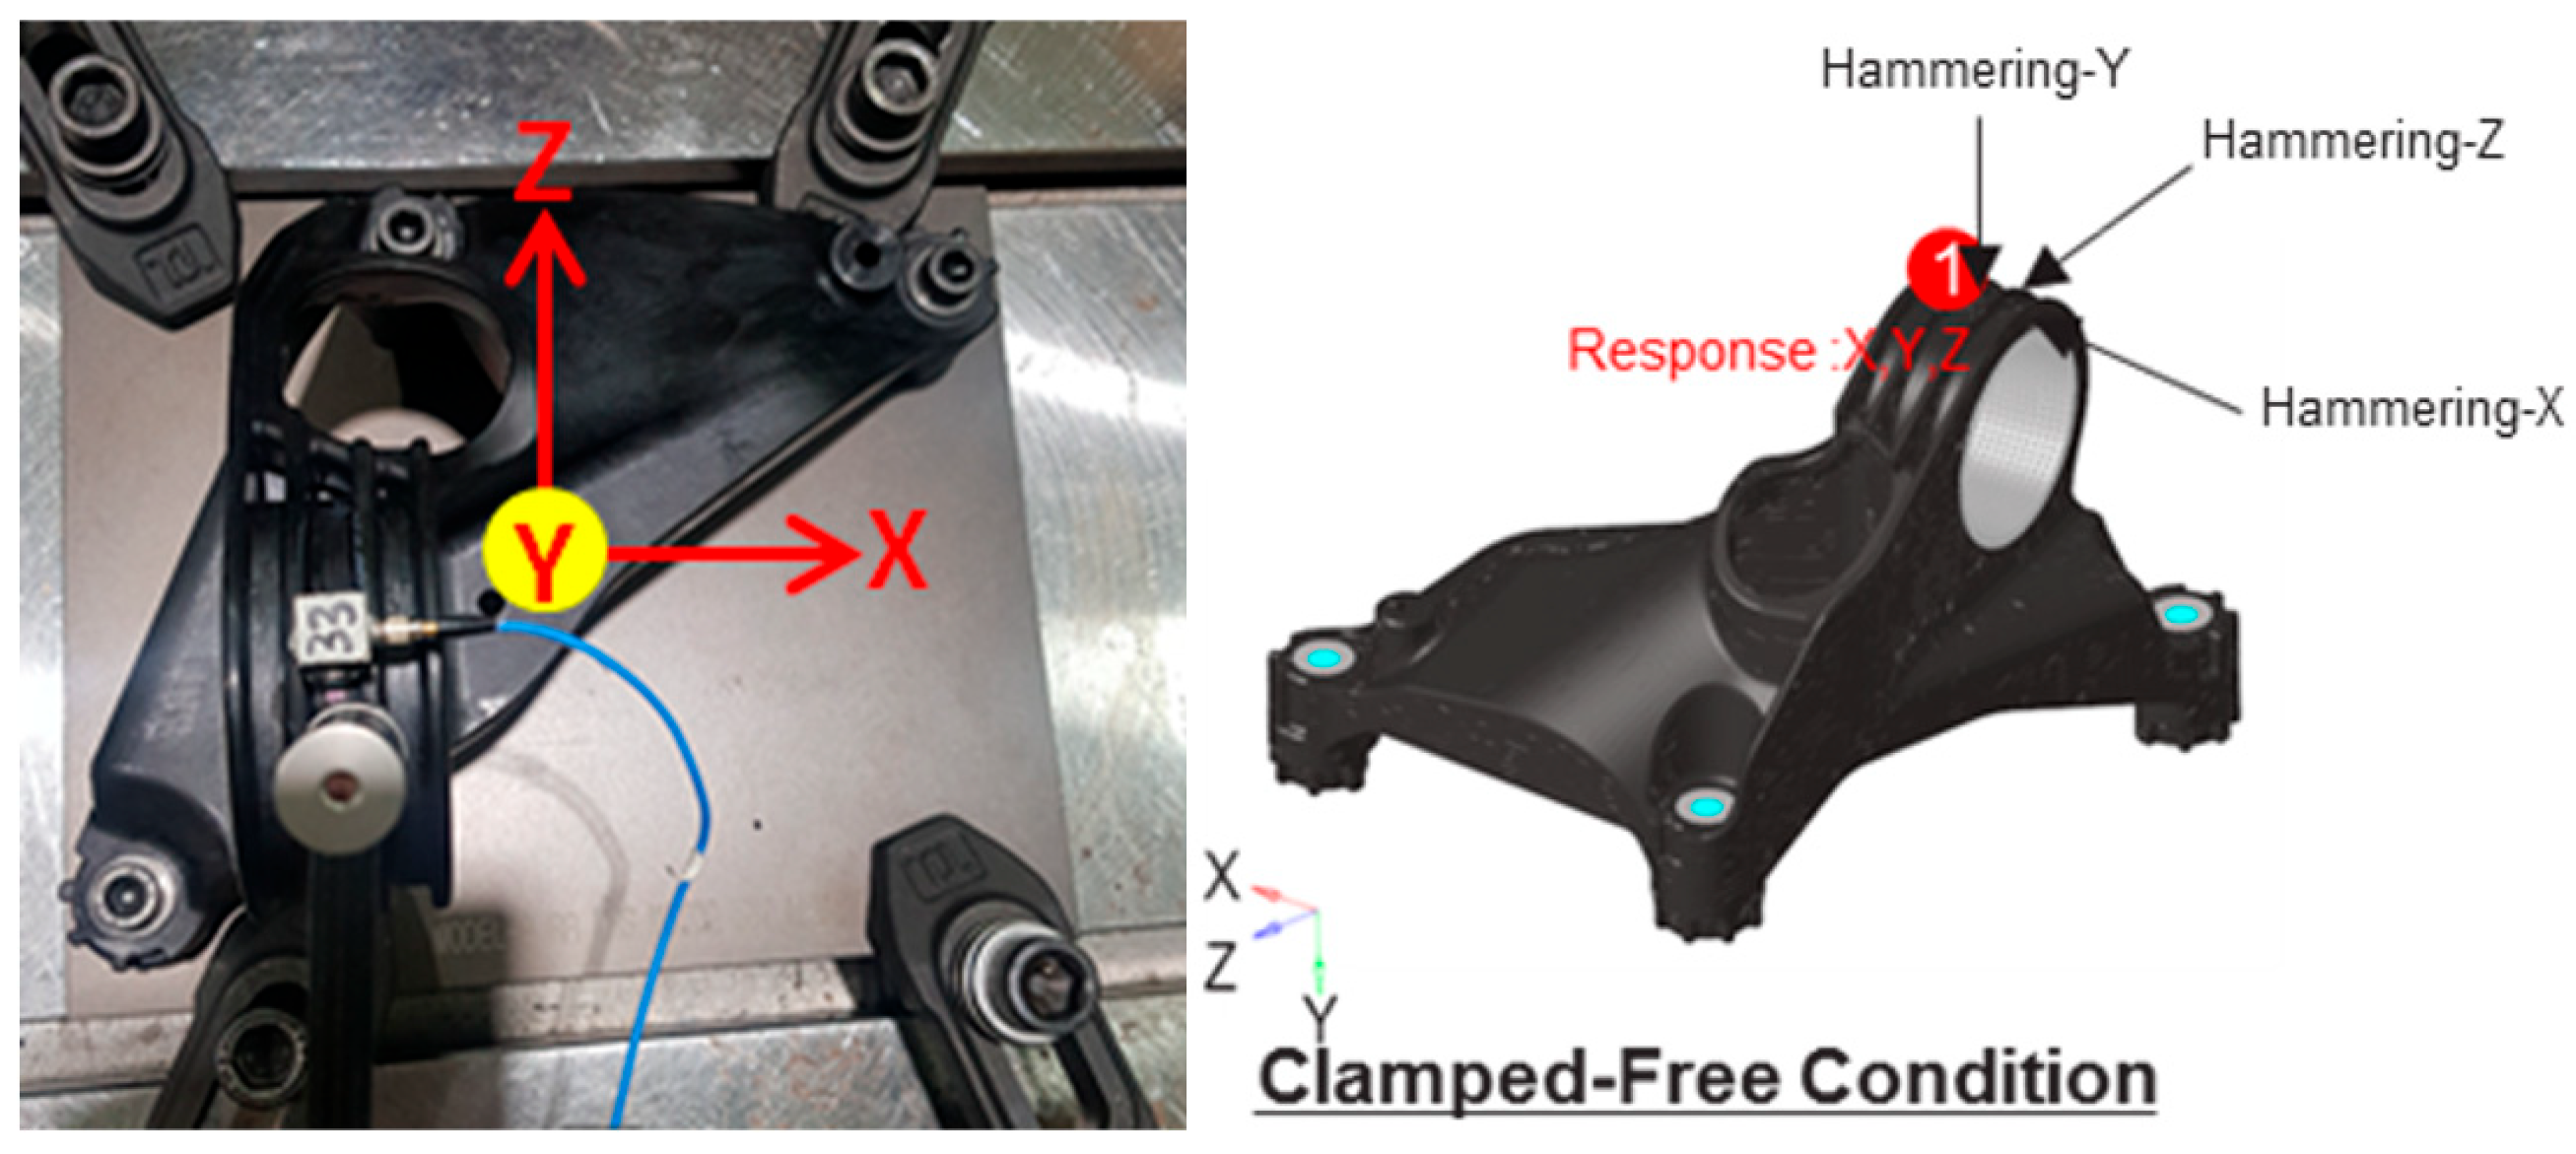
2.3. Product Manufacturing and Testing Methods

Figure 5 illustrates the development and application of the motor mount bracket in an electric vehicle. Initially manufactured from aluminum, the bracket was redesigned using a short fiber-reinforced polymer composite to reduce overall vehicle weight. The final product was fabricated via injection molding and subsequently assembled with a rubber bush through a pressing process. The bracket is installed on the vehicle chassis to suppress noise and vibration from the cotter and must meet a strength requirement of 20 kN. The composite material used is identical to that employed in the tensile test specimens. Figure 6 presents the mechanical testing setup used to evaluate the tensile and compressive strength of the motor mount bracket. The left panel shows the actual test configuration, where tensile (blue arrow) and compressive (red arrow) loads are applied. The right panel provides a schematic diagram indicating the force application points and restraint conditions. To simulate operational loading, three-point restraints were applied to the vehicle structure, enabling accurate assessment of the bracket’s performance under both tension and compression.
Figure 7 depicts the hammering test method used to measure dynamic stiffness. The left panel shows the experimental setup with axes labeled X, Y, and Z, representing the directions of impact. Sensors were installed at designated response points (marked as “1”) to capture vibrational data during hammer excitation. The right panel illustrates the schematic of the clamped-free condition, highlighting the hammering directions and sensor locations. This method enables multi-directional dynamic characterization of the bracket under realistic boundary conditions.

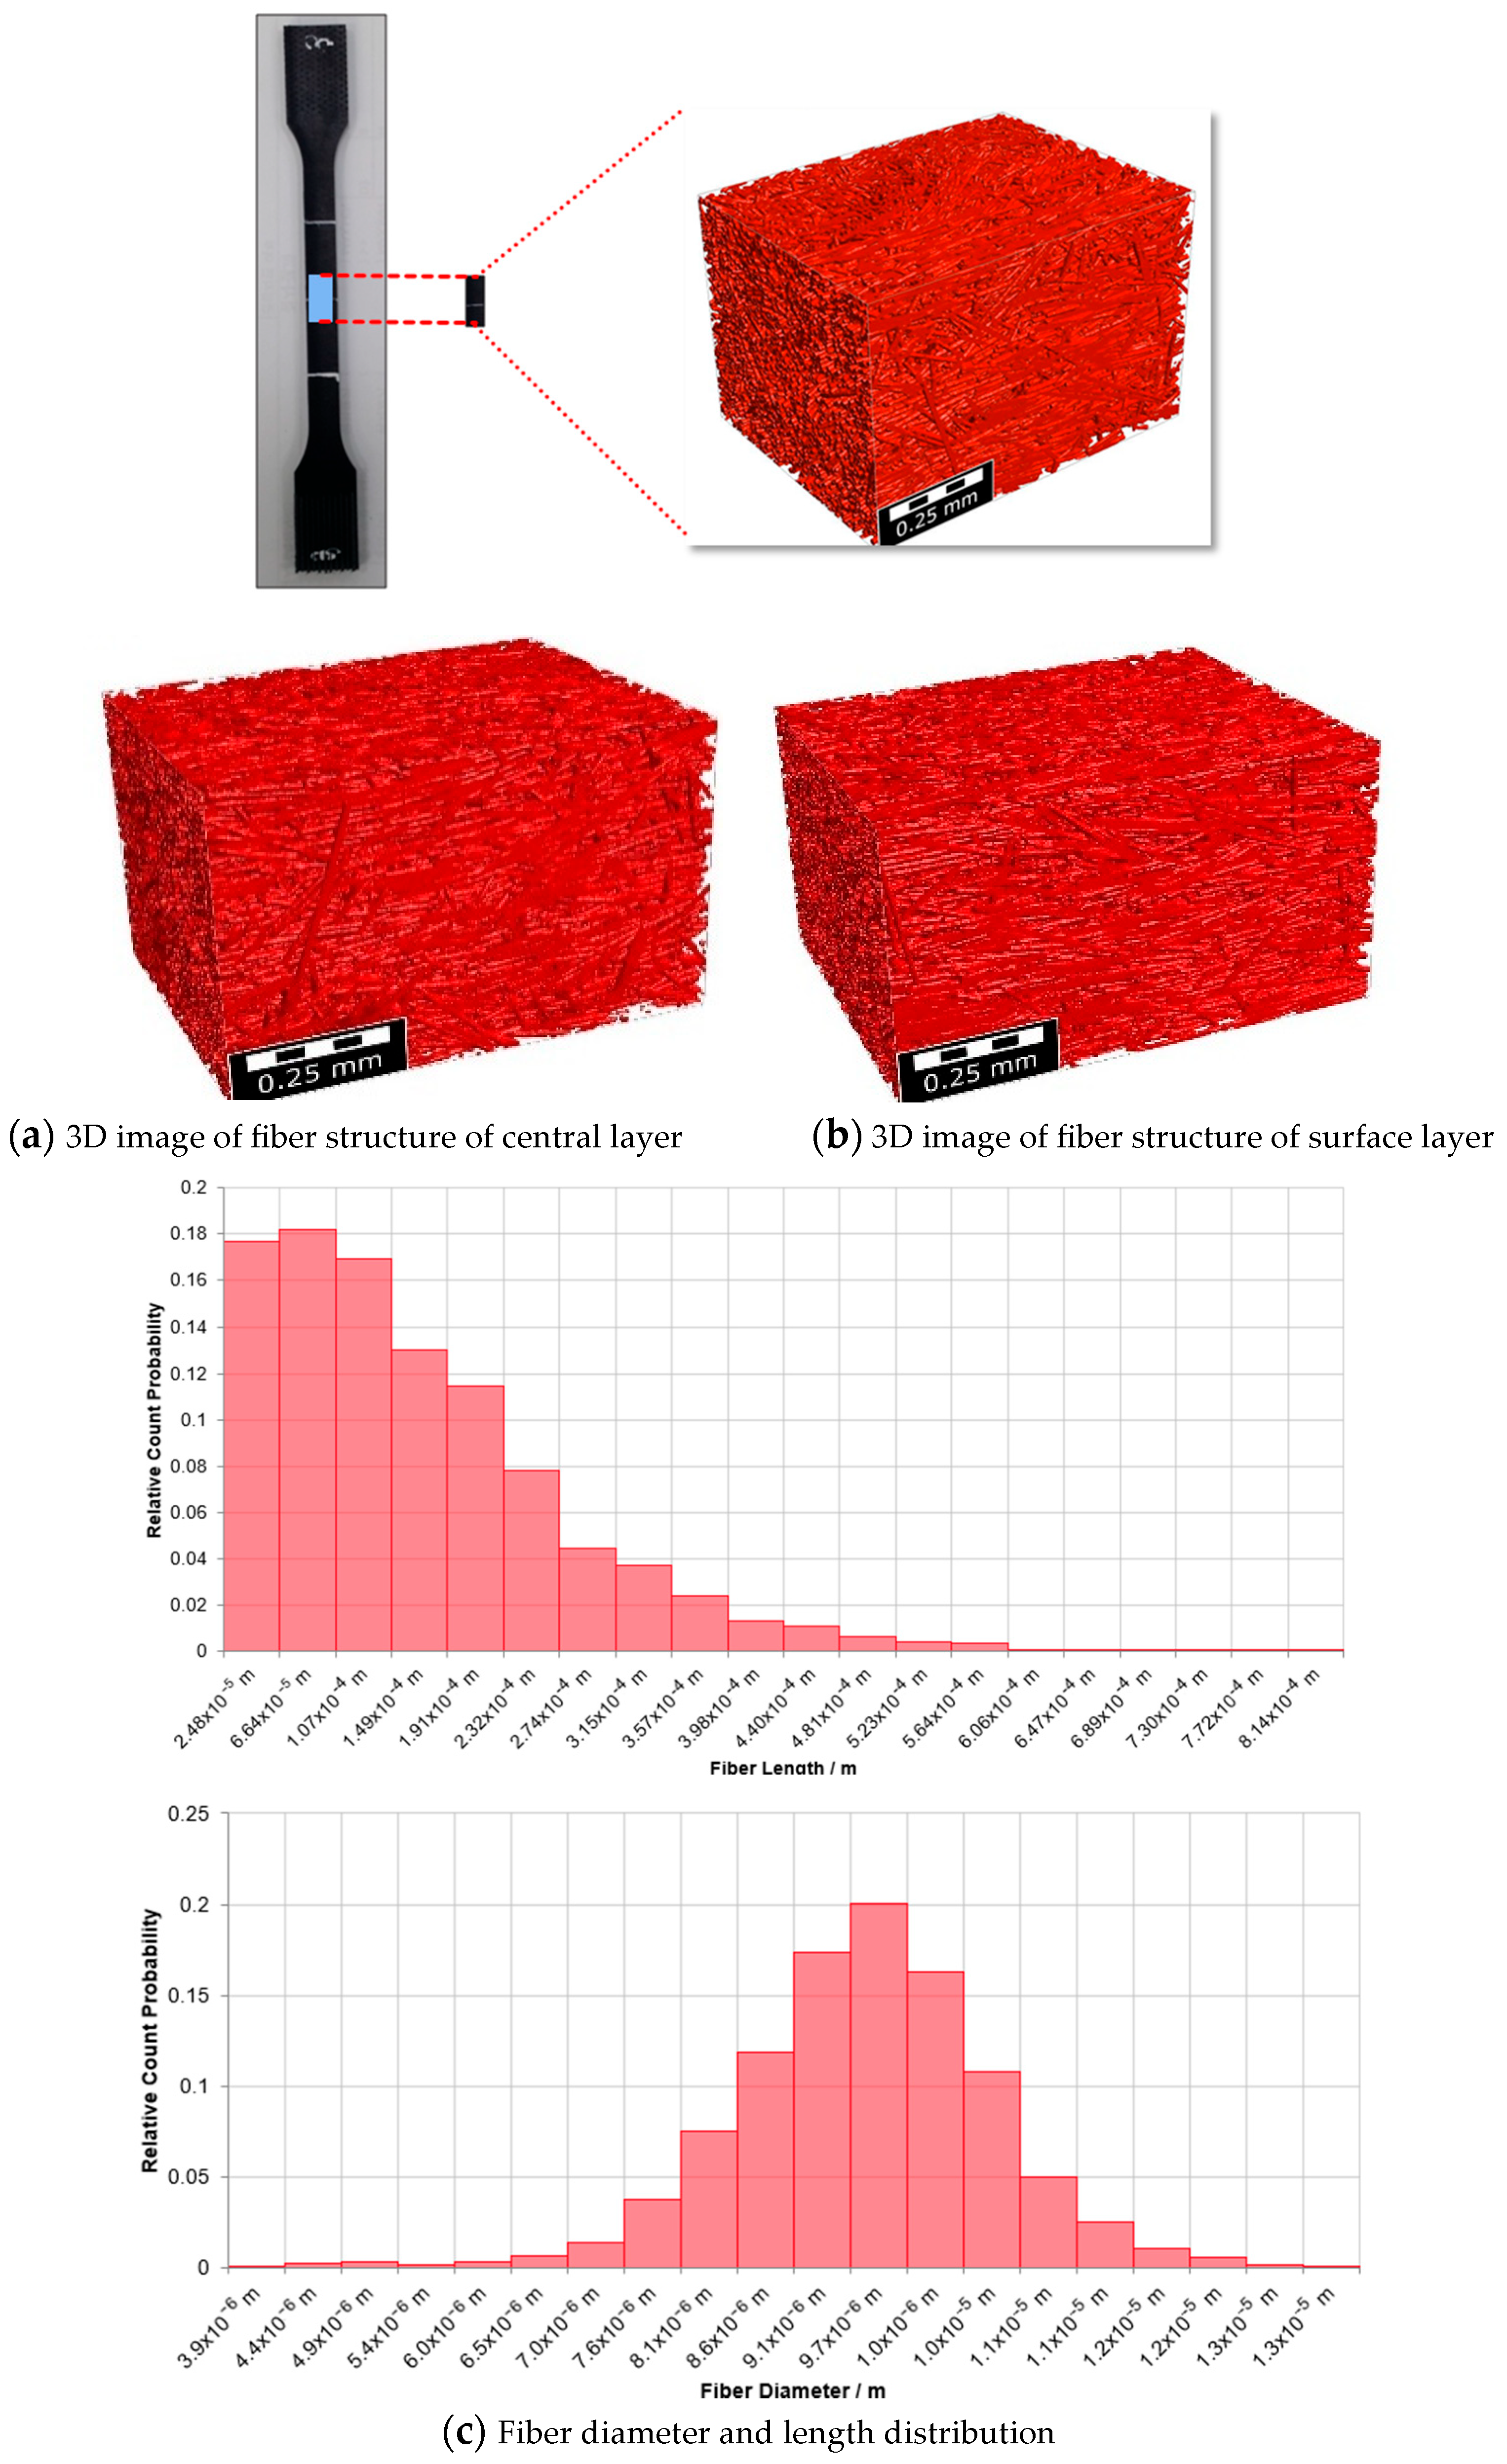
2.4. Fiber Structure Analysis and Generating Mechanical Properties Method

2.4.1. Fiber Orientation Tensor Method and RVE Modeling Method

Jeffery proposed a theoretical model for the rotational motion of ellipsoidal particles in a viscous fluid [23], which has become a fundamental theory in theoretical studies of fiber orientation. To date, the Folar–Tucher model has been the best available description for short-fiber-orientation representation in concentrated suspensions [24,25,26].
To obtain fiber orientation tensor results, SIGMAsoft was used, and fiber orientation tensor of each element of the mesh model for structural analysis was reviewed and reflected in RVE modeling.
To perform RVE modeling (as shown in Figure 8), 3D micro-XRM imaging was conducted on both the surface and core layers of the injection-molded tensile specimens. The resulting images were analyzed using the FiberFind AI module in GeoDict to extract quantitative data, including fiber orientation tensors (XX, YY, ZZ), volume fractions, lengths, and diameters. Figure 8 presents a structured table dividing each region into four sub-layers, with specific orientation and volume fraction values. Additionally, graphical plots of fiber length and diameter distributions were added to improve the interpretability of the microstructural data.
As part of the microstructural characterization, Figure 8a,b present 3D micro-CT images of the tensile specimen taken at the mid-length position, with a resolution of 1 μm. The specimen, with a total thickness of 3.92 mm, was divided into a 1 mm core layer and a 1 mm surface layer for analysis.
Table 5 shows the results of fiber orientation tensor and fiber volume fraction analysis, conducted using the FiberFind AI module of the GeoDict2024 software based on the 3D micro-CT data. The specimen thickness was segmented into eight layers from the core to the surface, and average values were calculated for each layer.
The analysis reveals that fiber alignment in the flow direction (X-axis) increases toward the surface. Specifically, the average fiber orientation in the core region is approximately 65%, while in the surface region it increases to around 81%, indicating a clear gradient in orientation across the thickness.
Figure 8c illustrates the distribution of fiber length and diameter within the composite. The average fiber length and diameter were approximately 180 µm and 10 µm, respectively, representing the typical fiber geometry observed in the molded material. These geometric characteristics, previously described in the Section 2, were utilized in the RVE modeling process. An average fiber volume fraction of 32% was applied. During the RVE modeling, the fiber orientation ratios for both the flat plate and engine mount components were obtained using the fiber orientation tensor results from the SIGMAsoft Virtual Molding 6.1.1 software.

2.4.2. Mechanical Properties Method

By averaging the strain in the structure, it is impossible to obtain the Hooke’s law for the general anisotropic case.
σ i j = r , s = 1 3 c i j r s ϵ r s   i , j   { 1 , 2 , 3 }
Here, the tensor c is a symmetric fourth-order tensor and is referred to as the elasticity tensor. Typically, the elasticity tensor, stresses, and strains are written in Voigt notation. In this method, the elasticity tensor takes the form of a 6 × 6 matrix, and the stresses and strains can be expressed as 6 × 1 vectors.
In Table 6, symbols for representing the stresses of each component are organized. Subscripts x, y, and z signify the geometric x-axis, y-axis, and z-axis, respectively. The stress tensor σij and the strain εij can be expressed in Voigt notation.
σ = σ 11 σ 22 σ 33 σ 23 σ 31 σ 12   ε = ε 11 ε 22 ε 33 ε 23 ε 31 ε 12
Accordingly, Hooke’s law can be expressed as a matrix vector product.
σ 11 σ 22 σ 33 σ 23 σ 31 σ 12 = c 11 c 12 c 13 c 14 c 15 c 15 c 12 c 22 c 23 c 24 c 25 c 26 c 13 c 23 c 33 c 34 c 35 c 36 c 14 c 24 c 34 c 44 c 45 c 46 c 15 c 25 c 35 c 45 c 55 c 56 c 16 c 26 c 36 c 46 c 56 c 66 ε 11 ε 22 ε 33 ε 23 ε 31 ε 12
This is the stress–strain relationship of an anisotropic material where there is no symmetry between the material properties.
Considering SFRP composite materials as orthotropic materials, if the properties are symmetric with respect to each symmetrical plane for E1, E2 and E3, the general form of the stress–strain relationship for an orthotropic material can be expressed as follows.
σ 11 σ 22 σ 33 σ 23 σ 31 σ 12 = c 11 c 12 c 13 0 0 0 c 12 c 22 c 23 0 0 0 c 13 c 23 c 33 0 0 0 0 0 0 c 44 0 0 0 0 0 0 c 55 0 0 0 0 0 0 c 66 ε 11 ε 22 ε 33 ε 23 ε 31 ε 12
The mechanical properties can be represented by Cij, and in finite element analysis, if the values of E1, E2, E3, G12, G23, G31, and νij (i, j = 1, 2, 3) are known for each element, the relationship between the components of the general anisotropic elastic tensor and the anisotropic engineering constant is as follows:
C 11 = 1 ν 23 ν 32 E 2 E 3 Δ ,   C 22 = 1 ν 13 ν 31 E 1 E 3 Δ ,   C 33 = 1 ν 12 ν 21 E 1 E 2 Δ ,
C 12 = ν 12 + ν 31 ν 23 E 2 E 3 Δ = ν 12 + ν 32 ν 13 E 1 E 3 Δ
C 23 = ν 12 + ν 31 ν 23 E 2 E 3 Δ = ν 12 + ν 32 ν 13 E 1 E 3 Δ
C 13 = ν 12 + ν 31 ν 23 E 2 E 3 Δ = ν 12 + ν 32 ν 13 E 1 E 3 Δ
C 44 = G 23   ,   C 55 = G 31 ,   C 66 = G 12
where Δ = 1 ν 12 ν 21 ν 23 ν 32 ν 31 ν 13 2 ν 21 ν 32 ν 13 E 1 E 2 E 3 .
To define the properties of an orthotropic material, nine elasticity tensors are required, namely C11, C22, C33, C44, C55, C66, C12, C13, C23 [19,20]. In finite element analysis, mechanical property characteristic values (E1, E2, E3, G12, G23, G31, νij (i, j = 1, 2, 3)) were predicted using the orientation distribution of glass fibers obtained from injection molding process simulation results at positions corresponding to each element, utilizing GEODICT. These predicted mechanical property values were then used in structural analysis.
RVE modeling was conducted using the FiberGeo module of the GeoDict software. The key parameters include fiber diameter, fiber length, fiber volume fraction, and the fiber orientation tensor values.
In the injection molding simulation of the motor mount, fiber orientation tensor results were obtained for each mesh element using SIGMAsoft software. The orientation ratio in the primary flow direction varied across the model, ranging from approximately 35% to 90%. However, due to the computational limitations of generating a unique RVE model for each element, a representative approach was adopted.
Elements with fiber orientation ratios between 35% and 40% were grouped and modeled using an RVE corresponding to 40% orientation. Similarly, elements with orientation ratios of 81% or higher were modeled using the 90% orientation RVE. Intermediate ranges were assigned to the nearest 10% increment (e.g., 50%, 60%, 70%, etc.).
In the RVE modeling, the X-axis value of the fiber orientation tensor was used as the primary reference for flow direction alignment. The Y-axis and Z-axis components were held constant across all RVE models to maintain consistency in transverse dispersion. This approach allowed for a practical yet representative mapping of fiber orientation effects into the multi-scale simulation framework.
Table 7 summarizes the fiber orientation tensor values used for each RVE model. The table presents the representative orientation ratio ranges, the corresponding X-axis tensor values applied in the RVE generation, and the fixed Y and Z components. This classification enabled efficient yet accurate integration of orientation-dependent mechanical behavior into the multi-scale analysis.

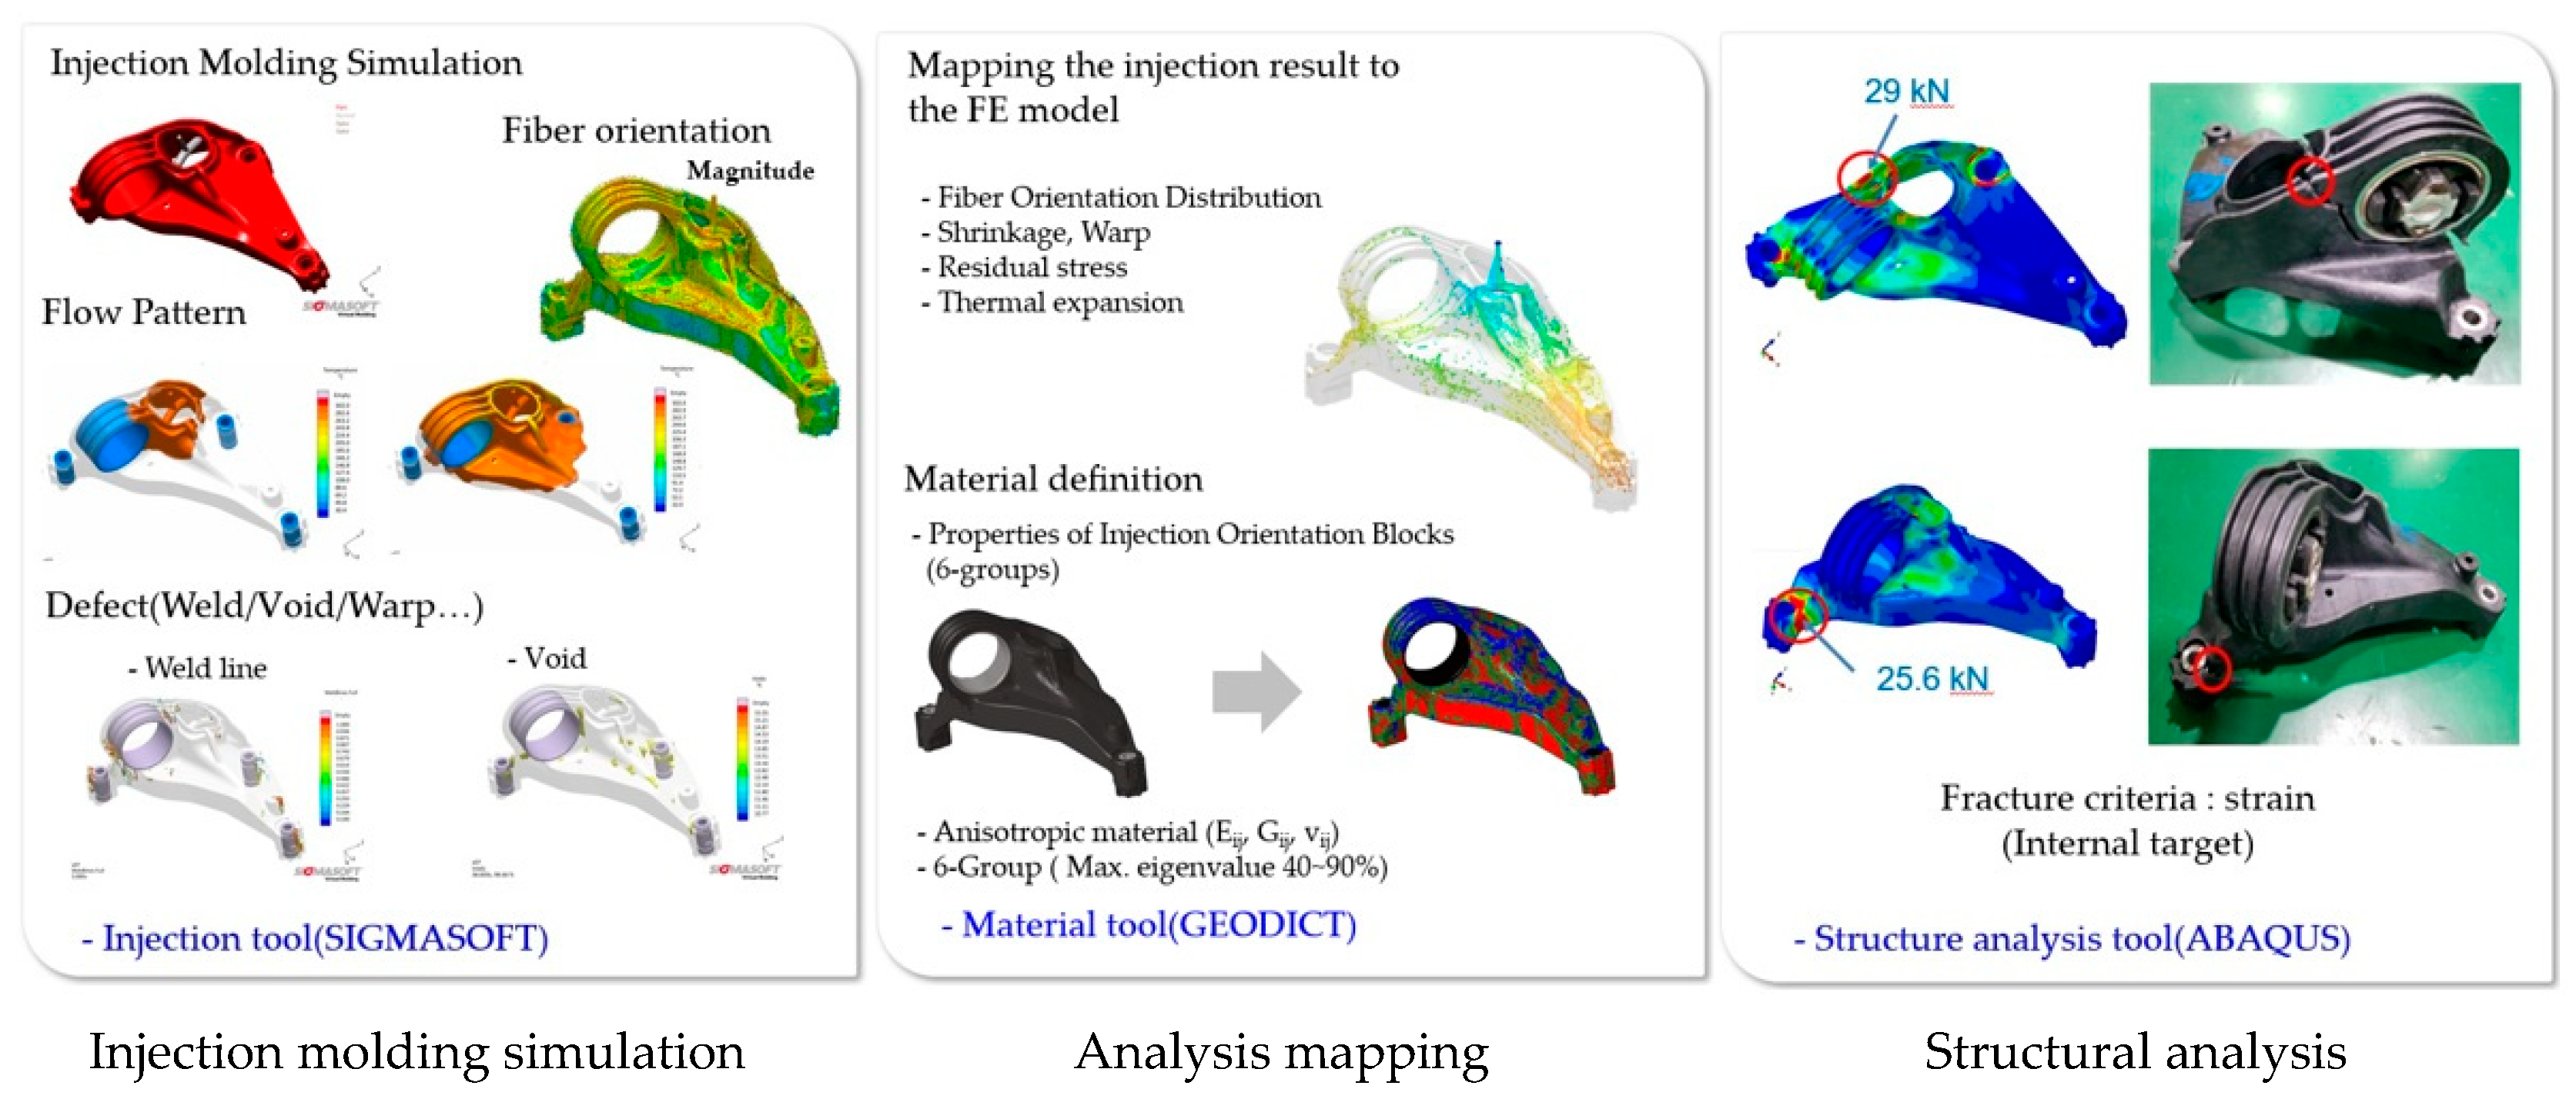
2.4.3. Simulation Process

Figure 9 illustrates the simulation workflow, spanning from injection molding process simulation to structural simulation. The injection molding simulation was conducted using SIGMASoft, employing a material card for PA66/GF50 (wt%) provided by DatapointLabs (Ithaca, NY, USA).
The mesh model generated for injection molding analysis cannot typically be directly used for structural simulation due to differences in modeling requirements. Therefore, residual stress results were generated for each element of the mesh model during the injection molding simulation. These results were then mapped onto the corresponding elements of the structural analysis mesh model, which was created using Abaqus. The mapping process was performed using the mapping module provided by SIGMASoft.
The fiber orientation tensor results were further utilized in the structural simulation to define orthotropic material properties. Specifically, the orientation tensor values were used to assign directional elastic moduli (E1, E2, E3) for each element in the structural mesh model.
The injection molding analysis results, along with information such as fiber orientation and residual stress, were utilized in structural analysis. In structural analysis, interpretations were conducted for tension specimens at 0 degrees, 45 degrees and 90 degrees with respect to the flow direction, based on flat specimens. Additionally, analyses were performed for the hammering test on the motor mount bracket product.

3. Results and Discussion

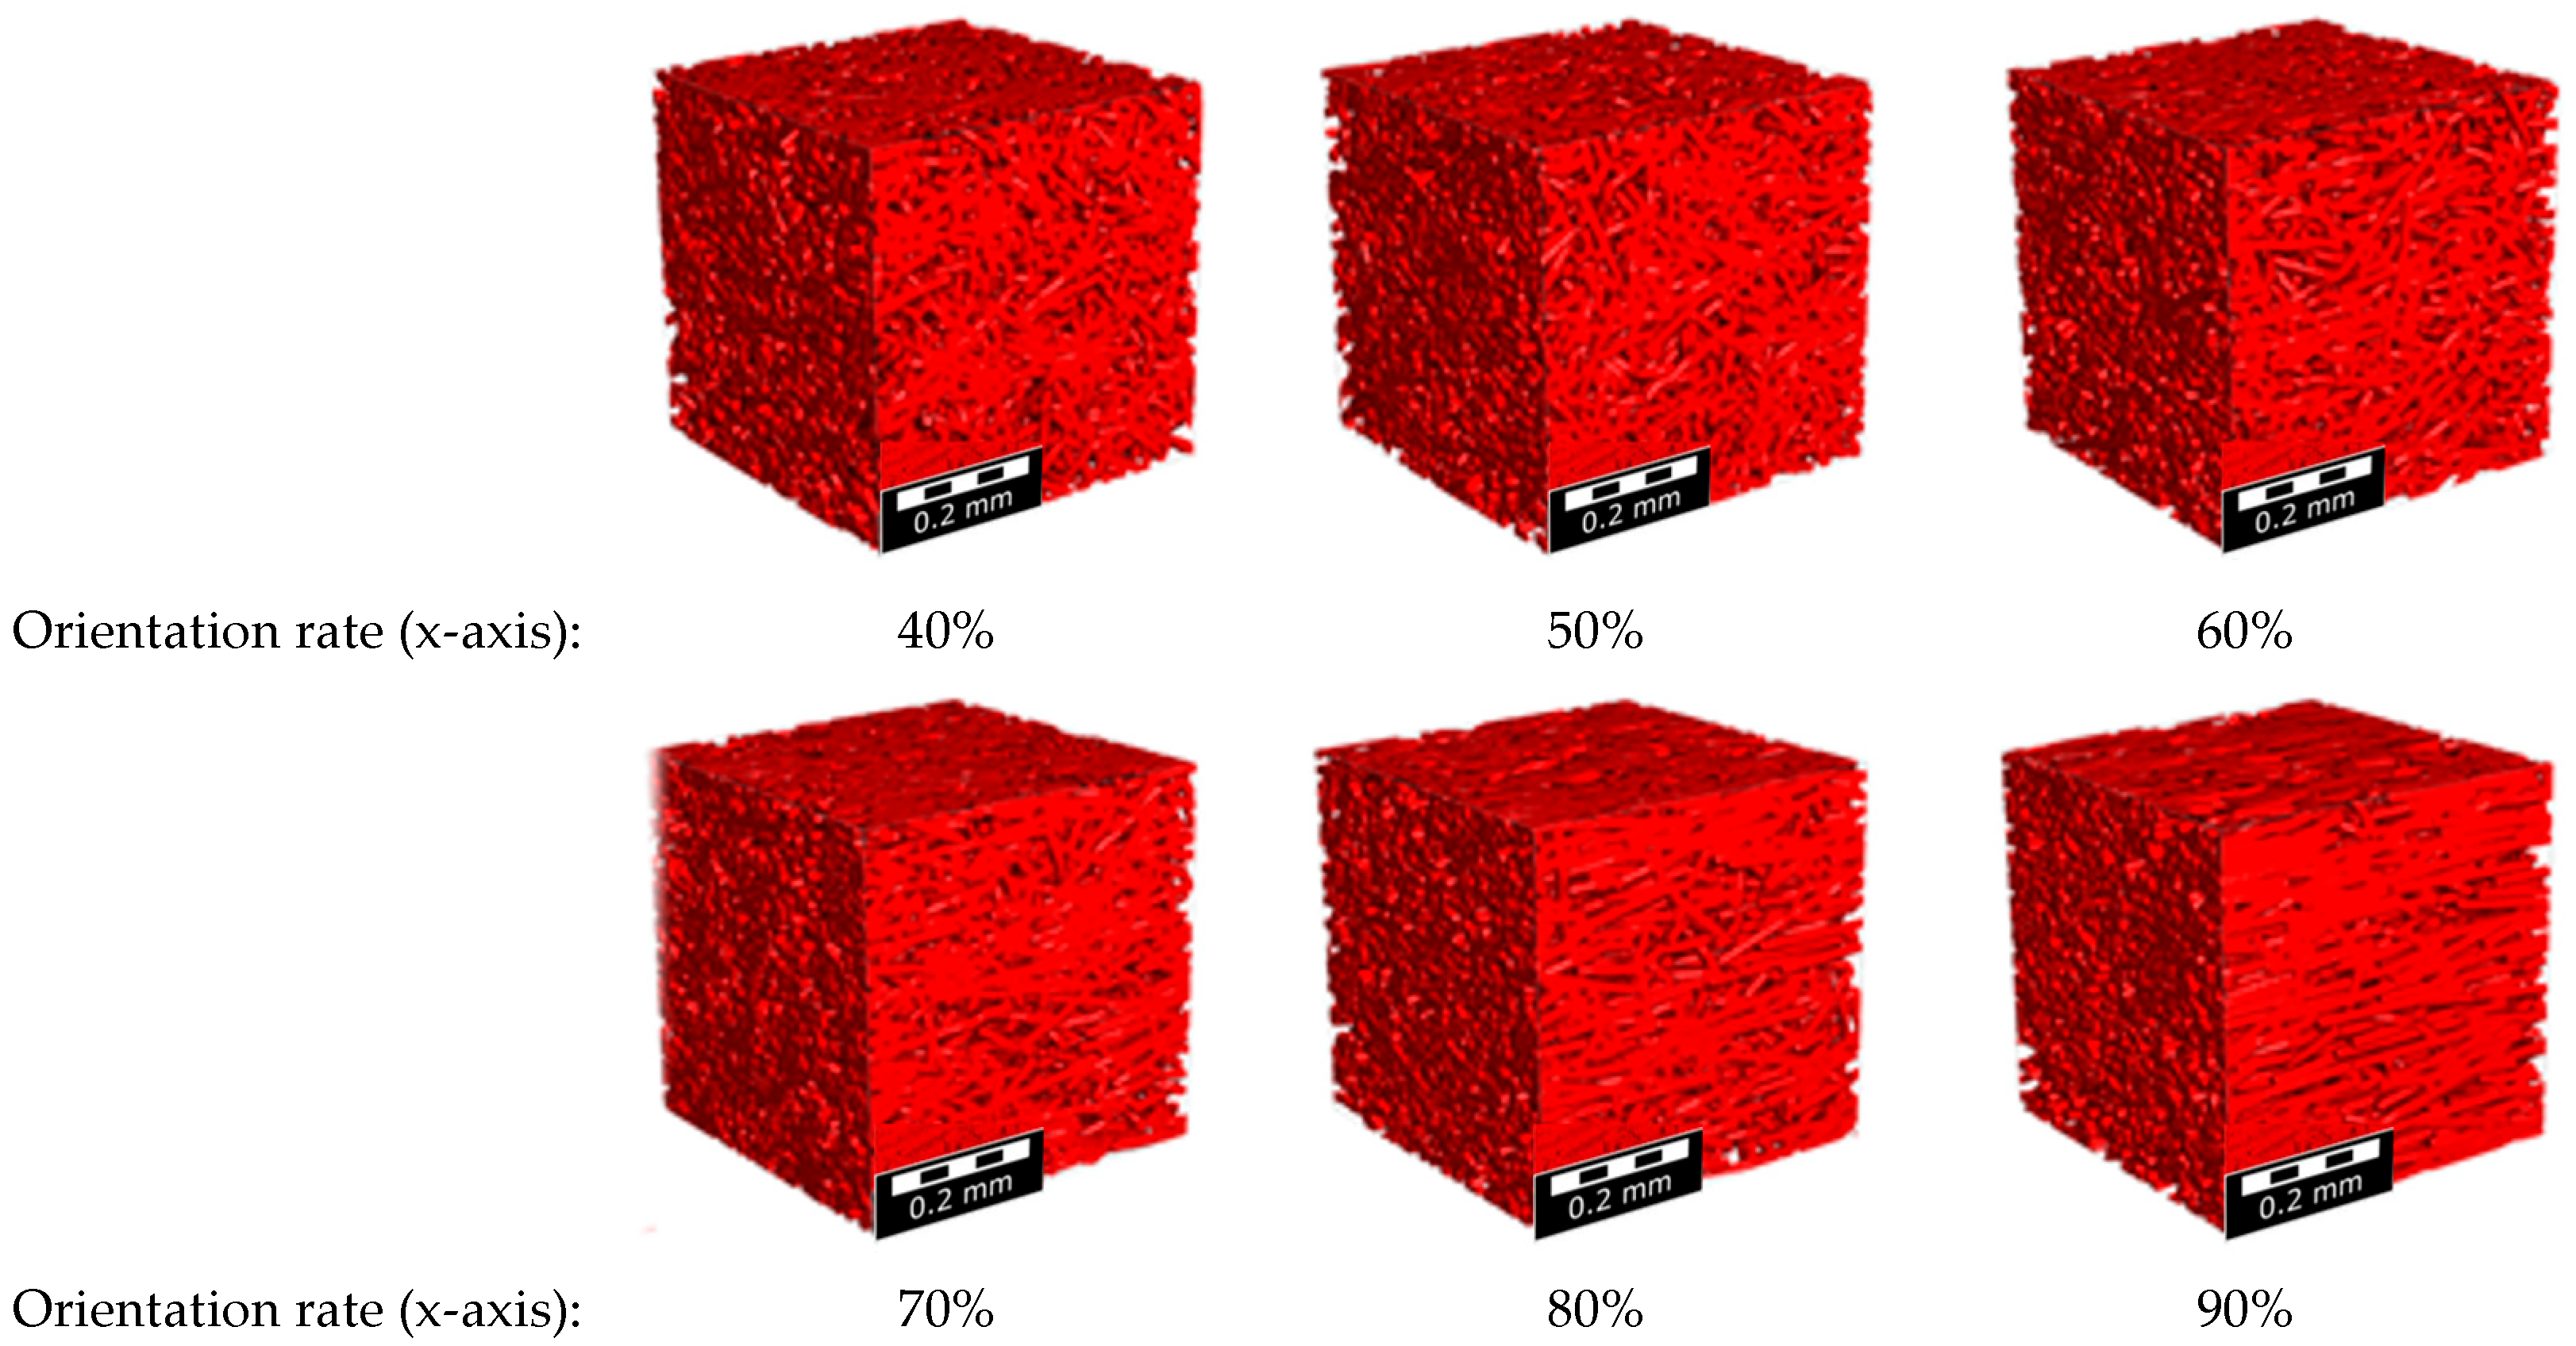
3.1. RVE-Based Prediction of Orthotropic Material Properties for PA66/GF50 (wt%)

The fiber volume fraction was set to 32%, and periodic boundary conditions were applied to ensure accurate homogenization. FEA was performed to extract the orthotropic stiffness matrix, from which the elastic moduli, Poisson’s ratios, and shear moduli were calculated.
Figure 10 illustrates the RVE model generation results for different fiber orientation ratios, visually representing the microstructural variations. Table 8 presents the corresponding orthotropic material properties derived from each RVE model, which are used to assign accurate anisotropic behavior in the FEM analysis. The RVE cubes are therefore not arbitrary but are directly linked to the fiber orientation tensor values obtained from injection molding simulation. Each RVE cube corresponds to a specific fiber orientation ratio in the primary flow direction (X-axis), and the table provides the resulting orthotropic elastic constants (E1, E2, E3), Poisson’s ratios (ν12, ν13, ν23, etc.), and shear moduli (G12, G13, G23). As the fiber orientation ratio increases from 40% to 90%, a clear trend is observed: the stiffness in the flow direction (E1) increases significantly, from 4.97 GPa at 40% to 9.88 GPa at 90%. This demonstrates the strong anisotropic behavior of the composite and highlights the importance of accurately capturing fiber orientation in multi-scale modeling.

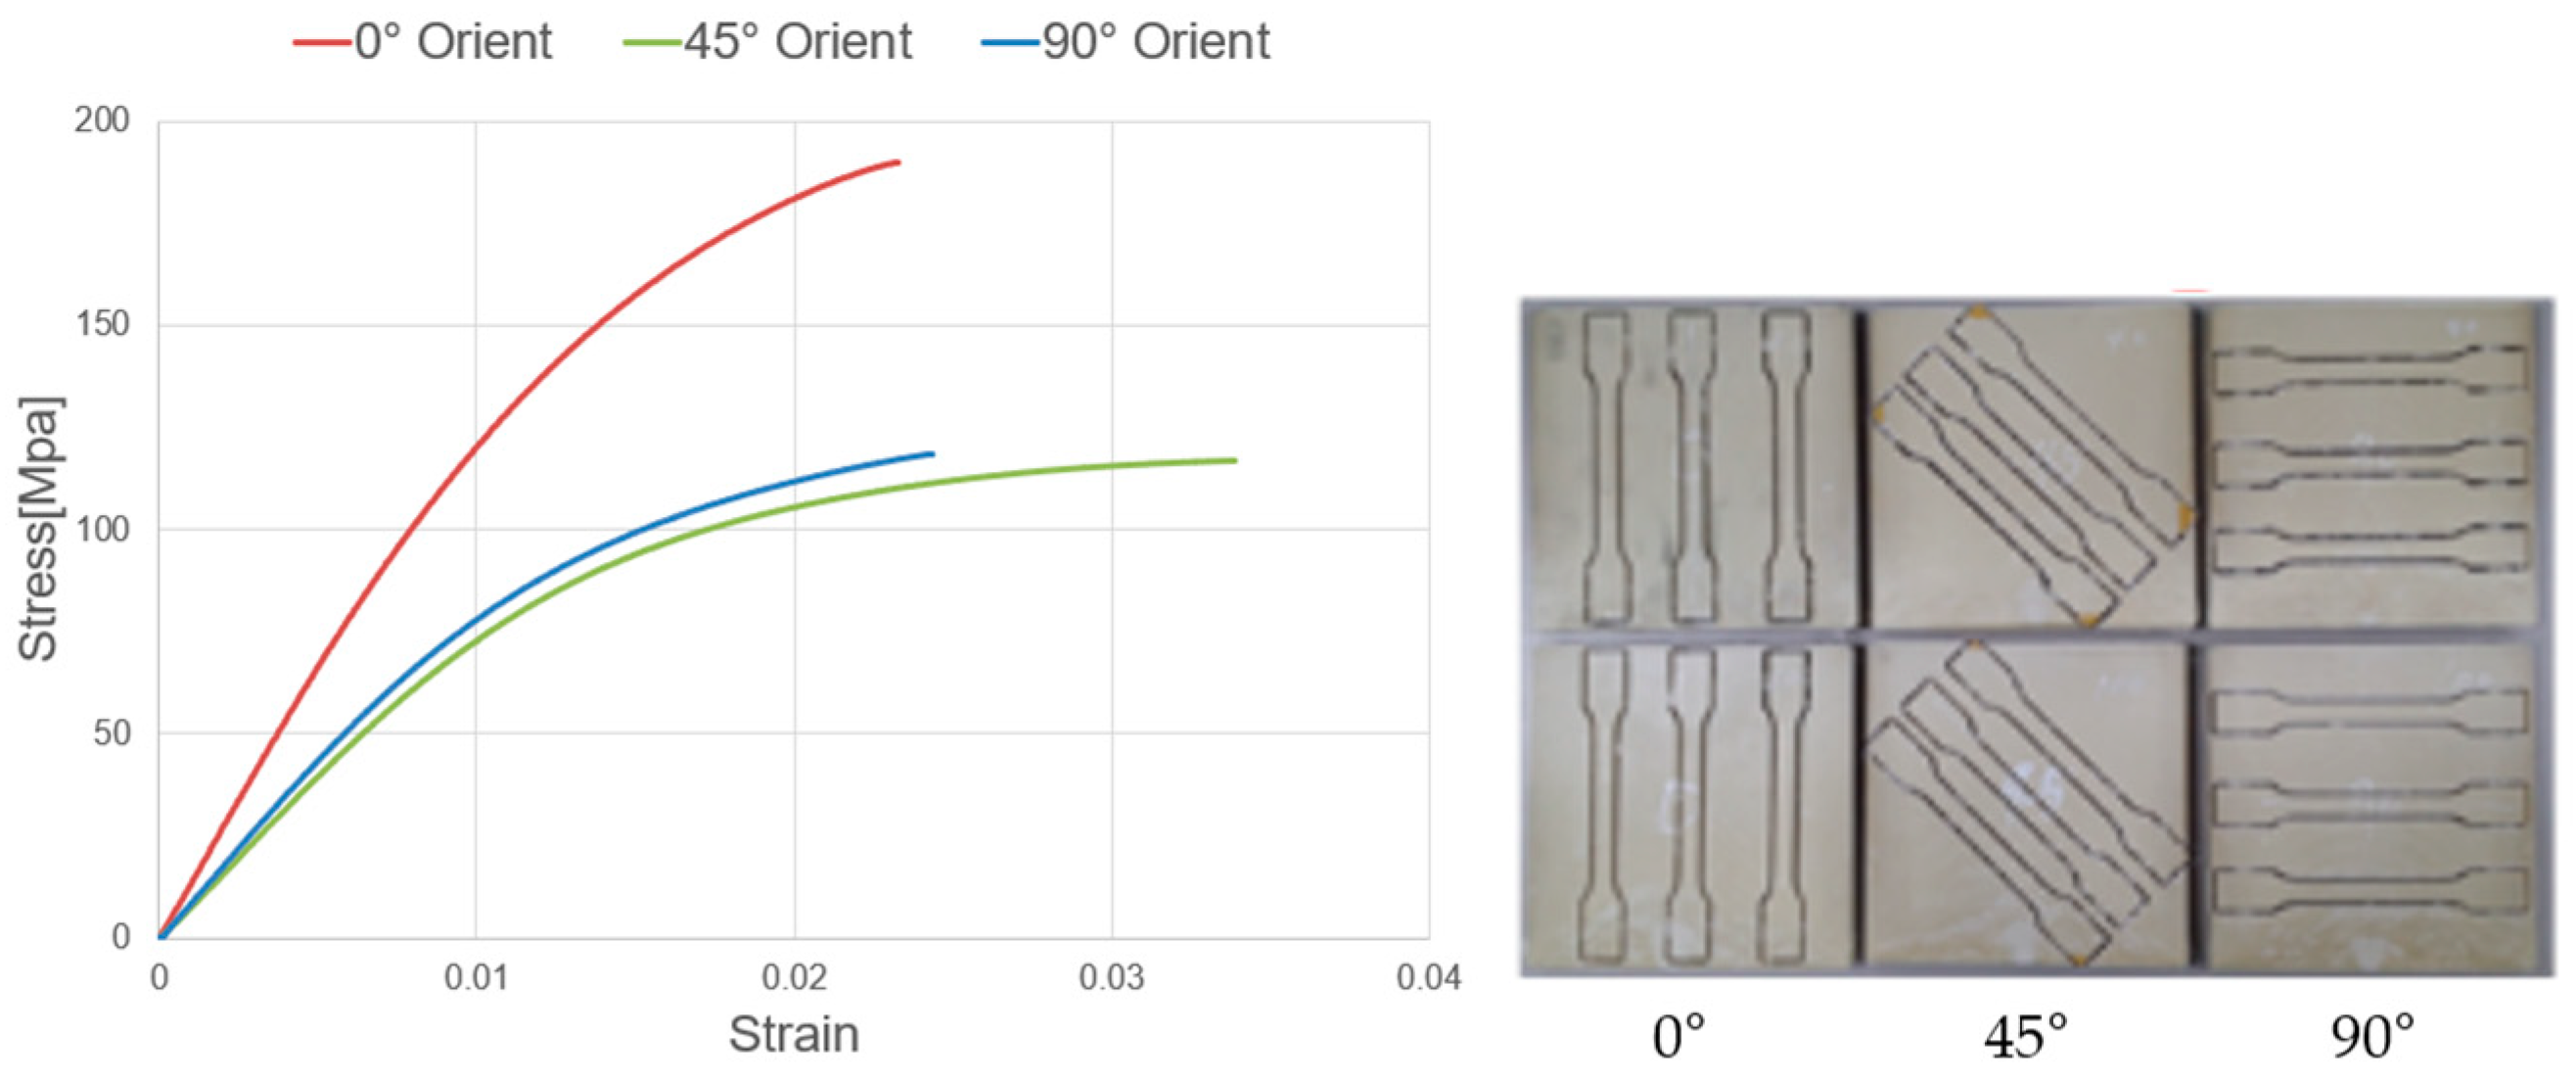
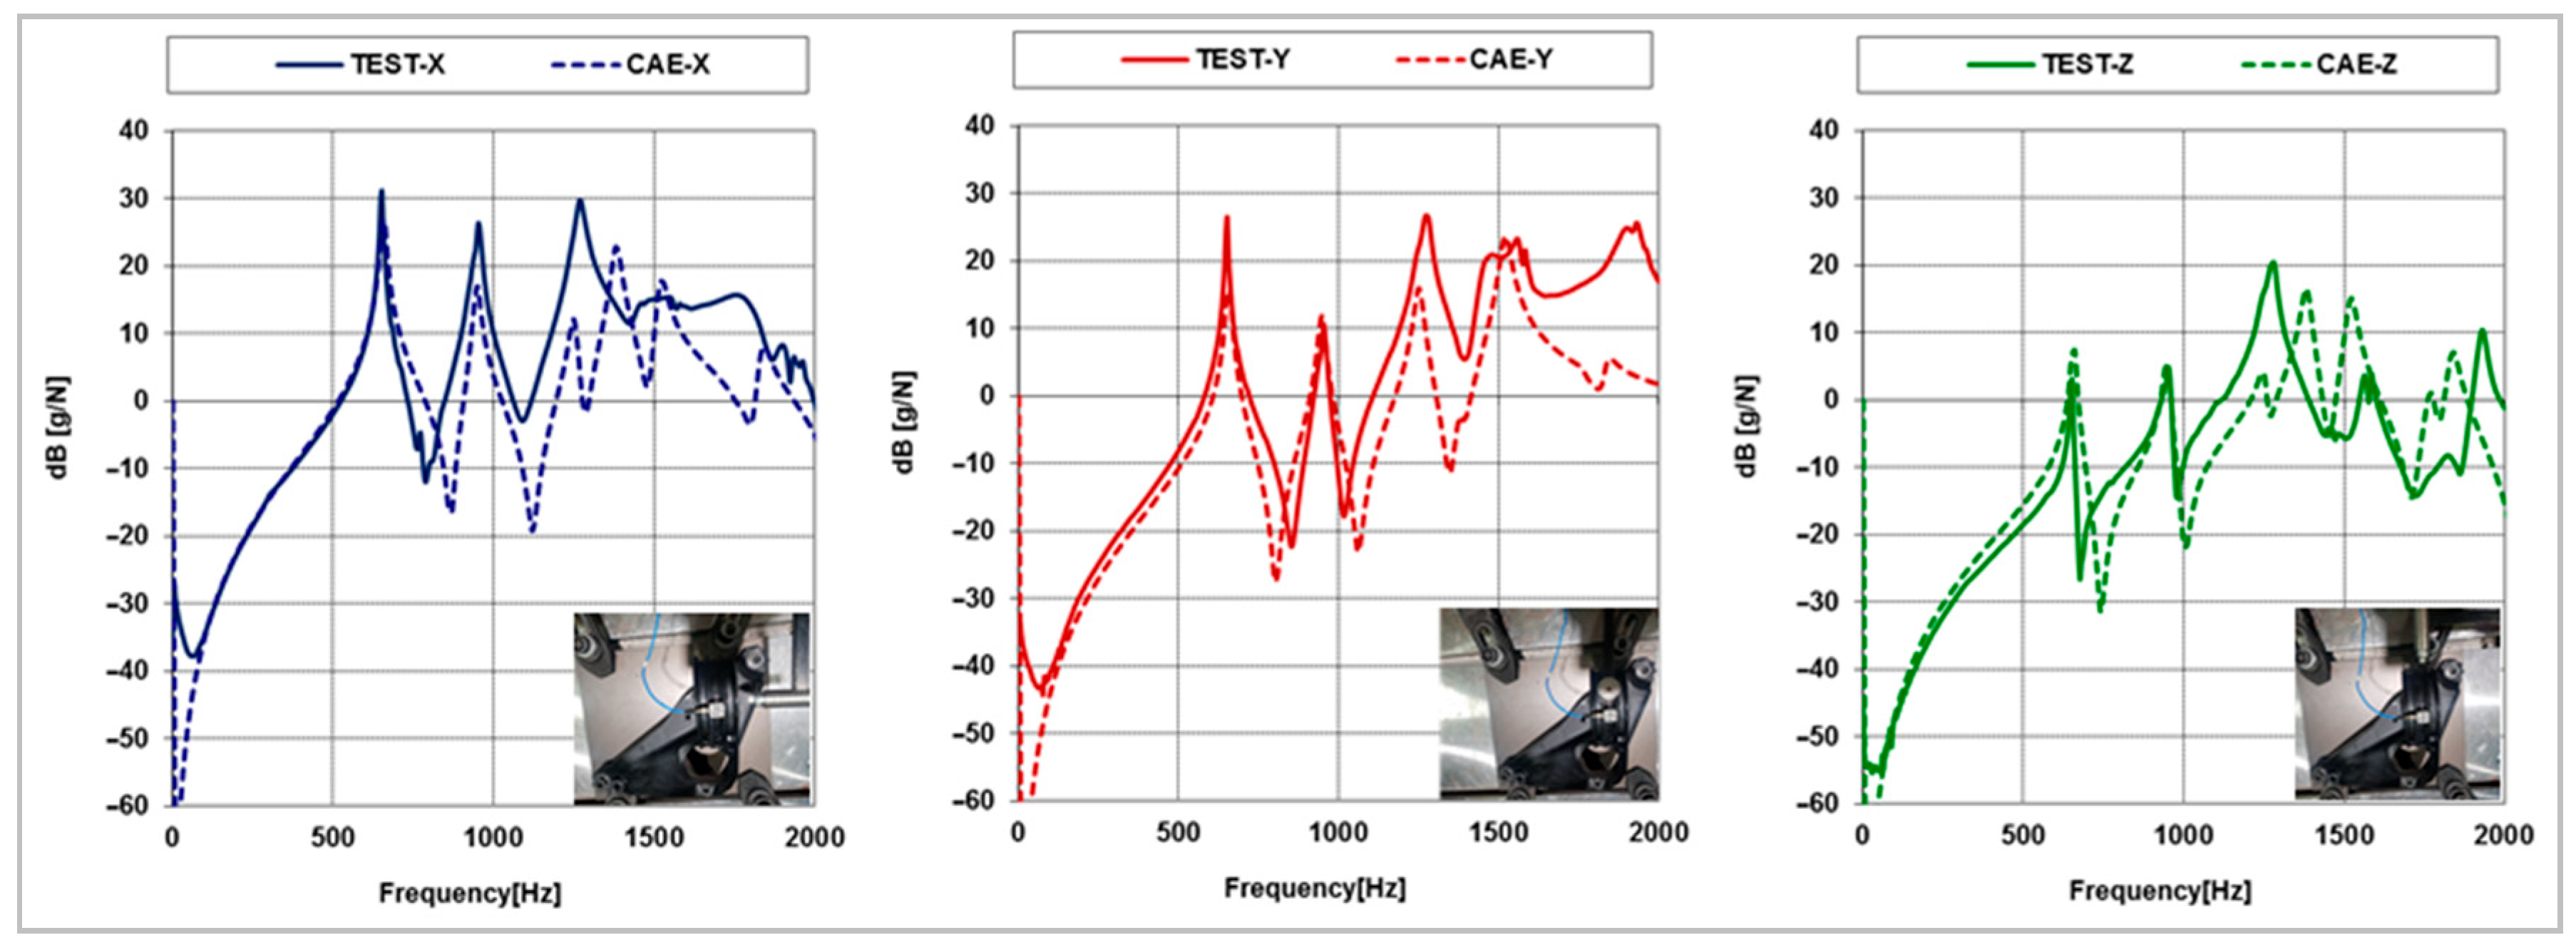
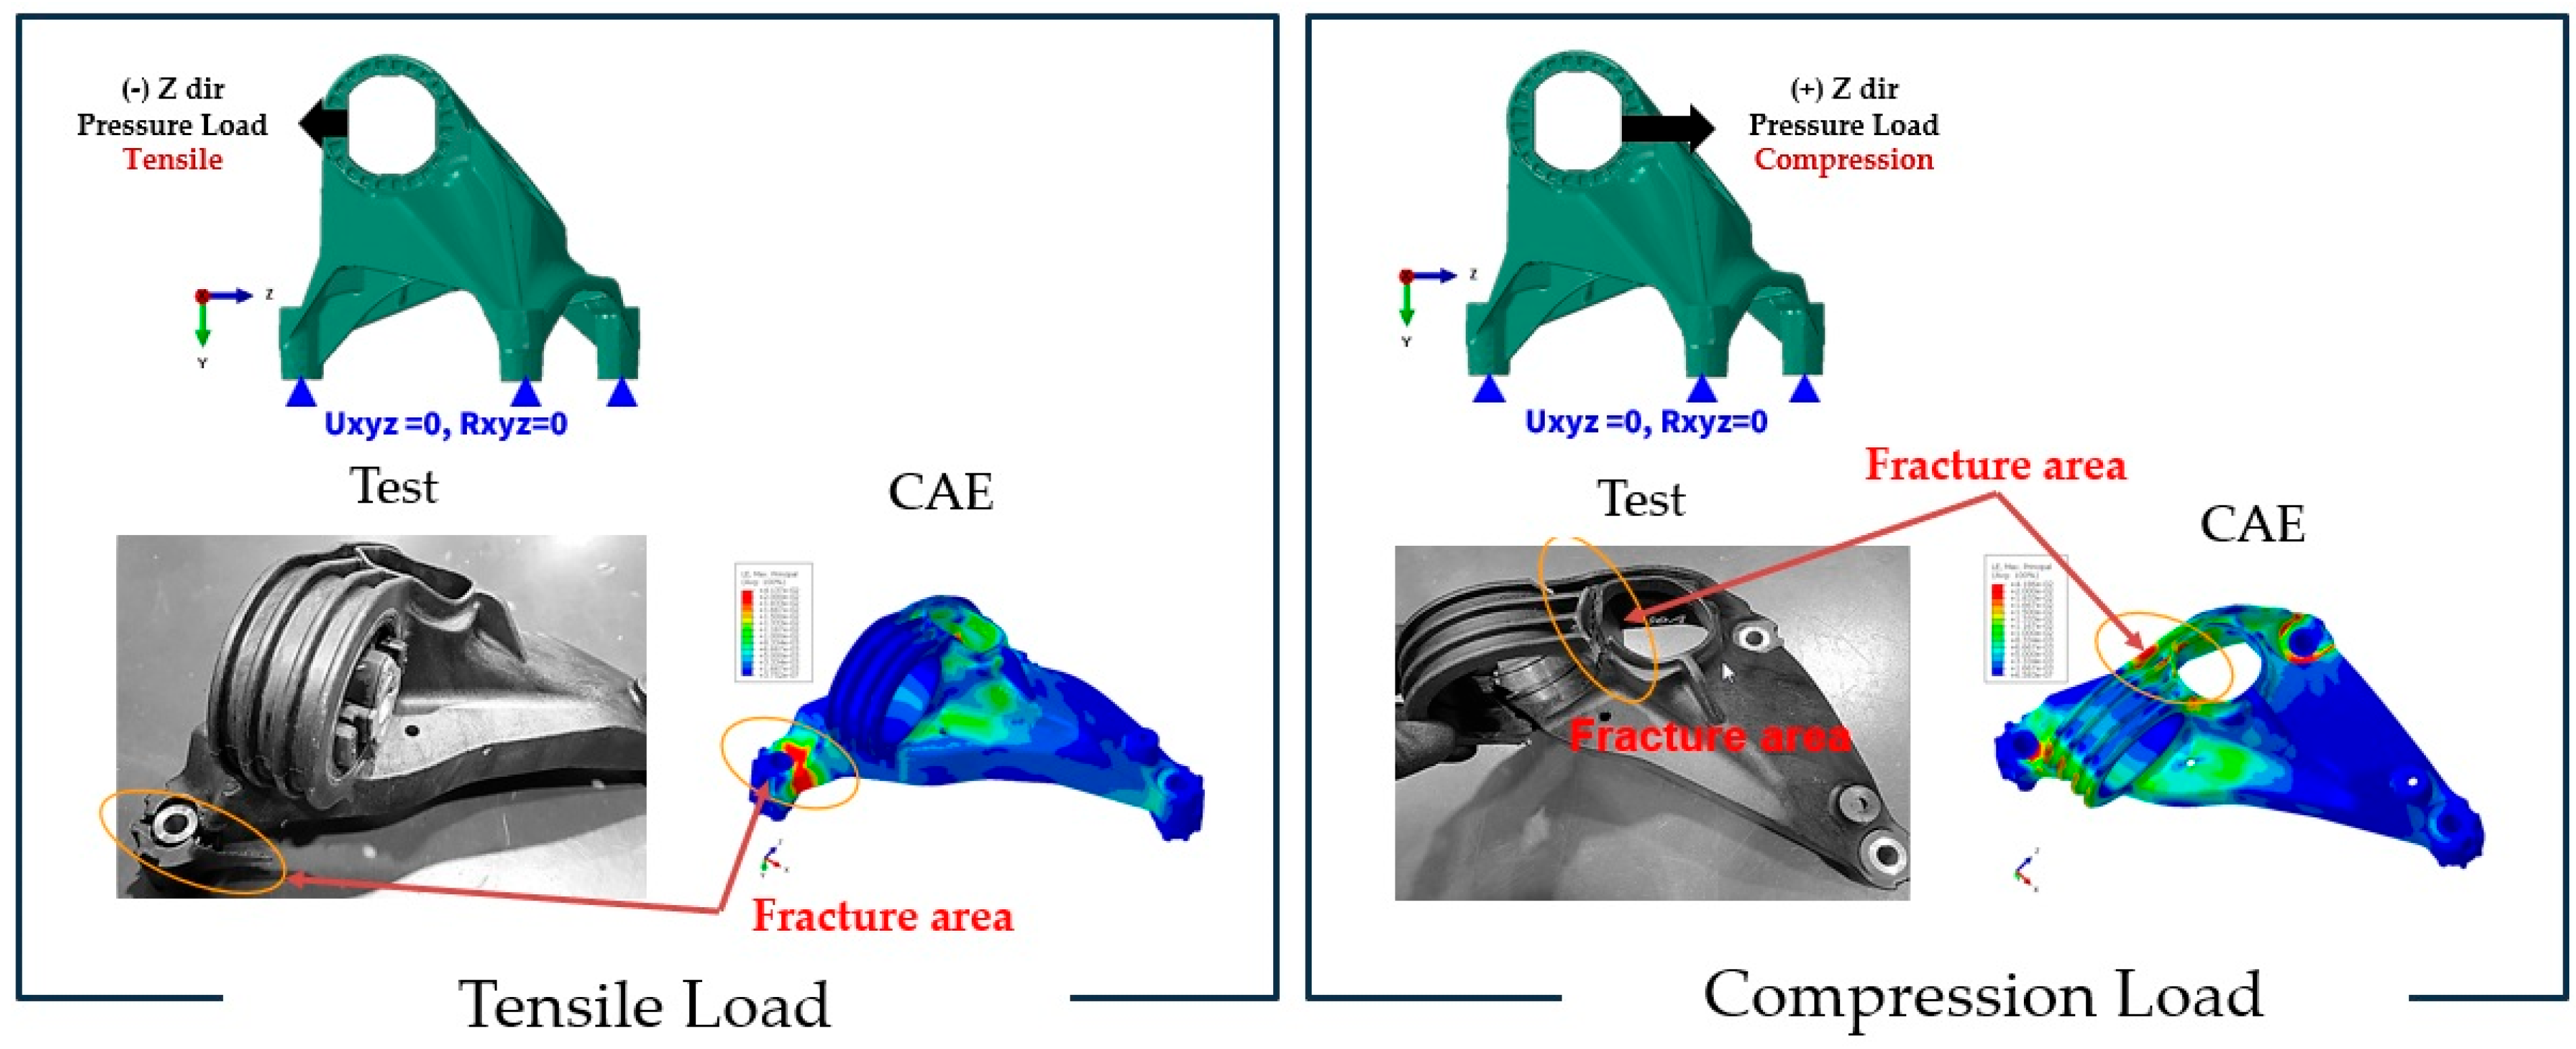
3.2. Experimental Test Results and Simulation Results

As shown in Figure 11, the tensile test results of flat-molded specimens in different flow directions reveal distinct stress–strain responses. These differences clearly demonstrate the anisotropic mechanical behavior of the material, which is strongly influenced by the fiber orientation resulting from the injection molding process.
Figure 12 presents the comparison between experimental tensile test results and simulation predictions for specimens oriented at 0°, 45°, and 90° relative to the injection flow direction. The simulation demonstrates high reliability in capturing the anisotropic mechanical behavior of short fiber-reinforced polymer (SFRP) composites. The flat specimen geometry used in the simulation matches that of the actual test specimens, allowing for direct validation of the fiber direction-dependent mechanical response.
Figure 13 illustrates the injection molding simulation results, highlighting the influence of flow patterns on fiber orientation distribution. The simulation provides detailed outputs including fiber orientation tensors, shrinkage, warpage, residual stresses, and the principal direction ratio (SIGMAsoft Max. Eigenvalue). These parameters are visualized across the molded part and are critical for understanding the internal structure and anisotropic behavior of the composite.
The fiber orientation is shown to align strongly with the injection flow, particularly in regions of high shear near the gate. This directional alignment significantly affects local mechanical properties. The integration of these simulation results into the finite element method (FEM) framework enables accurate mapping of material properties, improving the predictive capability for structural performance under real-world loading conditions.
The simulation results for the product, as shown in Figure 14, can be observed to closely match the test results in terms of fracture location. The strength analysis results show tensile strength of 23.8 kN, and compressive strength of 26.5 kN, with a reliability level of approximately 93%.
To further validate the dynamic stiffness characteristics, hammering tests and FRF (frequency response function) analysis were conducted, as illustrated in Figure 15.
In mode analysis, accurate representation of anisotropic stiffness can enhance the reliability of predicting dynamic stiffness since it is predominantly influenced by the M (mass) and K (structure stiffness) characteristics.

3.3. Discussion

This study addresses several key technical challenges in accurately predicting the anisotropic mechanical behavior of SFRP composites. One of the primary challenges lies in capturing the complex relationship between fiber orientation strongly influenced by the injection molding process and the resulting mechanical properties. To overcome this, we employed a multi-scale modeling approach that integrates fiber orientation tensor data from injection molding simulations into representative volume element RVE-based FEA analysis. This integration allows for the derivation of orthotropic material properties that reflect the actual microstructural characteristics of the molded part.
A notable innovation in this study is the direct mapping of fiber orientation data to RVE models, enabling the prediction of direction-dependent stiffness values. As demonstrated in Table 8, the elastic modulus in the primary flow direction (E1) increases significantly with higher fiber alignment, confirming the strong anisotropic behavior of the composite. This highlights the importance of incorporating process-informed microstructural data into structural simulations.
Another technical advancement is the validation of simulation results through both static and dynamic experimental tests. The tensile and compressive test results show strong agreement with simulation predictions, particularly in terms of fracture location and strength values. To quantitatively assess this agreement, we compared the maximum tensile stress values from both experimental and simulation data across three fiber orientations (0°, 45°, and 90°). The calculated mean absolute error (MAE) was approximately 6.67 MPa, and the root mean square error (RMSE) was approximately 7.07 MPa, indicating a high level of accuracy in the static mechanical predictions.
Furthermore, the use of frequency response function (FRF) analysis and hammering tests provides additional confirmation of the model’s ability to capture dynamic stiffness characteristics, which are highly sensitive to anisotropic stiffness distributions. The estimated MAE and RMSE for the frequency response in the X, Y, and Z directions were approximately 1.0 dB/g, further validating the model’s predictive capability in dynamic conditions.
Compared to conventional modeling approaches that assume isotropic or simplified anisotropic behavior, our method offers a more accurate and scalable framework for predicting the performance of SFRP components under real-world loading conditions. This is particularly valuable in automotive applications, where material behavior must be precisely understood to ensure safety and performance.

4. Conclusions

The findings of this study collectively confirm that the integration of process-informed fiber orientation data into a multi-scale modeling framework enables a highly accurate prediction of both static and dynamic mechanical behavior in SFRP components. The simulation results, validated through tensile and compressive testing as well as dynamic modal analysis, demonstrate strong agreement with experimental observations, particularly in terms of fracture location, strength values, and vibrational response.
To quantitatively evaluate the accuracy of the simulations, error metrics were calculated for both static and dynamic tests. For tensile strength predictions across three fiber orientations (0°, 45°, and 90°), the mean absolute error (MAE) and root mean square error (RMSE) were approximately 6.67 MPa and 7.07 MPa, respectively. In dynamic hammering tests, the estimated MAE and RMSE for frequency response in the X, Y, and Z directions were approximately 1.0 dB/g, further validating the model’s predictive capability.
The ability to reflect anisotropic stiffness characteristics, influenced by fiber orientation and molding conditions, significantly enhances the reliability of structural simulations. This approach not only supports the prediction of performance variations due to changes in fiber content, gate position, and part geometry, but also facilitates the design and optimization of composite materials tailored to specific functional requirements. Therefore, the proposed methodology provides a robust and scalable foundation for advancing the predictive engineering of fiber-reinforced polymer components in automotive and other high-performance applications.

Author Contributions

Formal analysis, Writing—original draft preparation: Y.S.C.; Resources: B.J.; Data curation: J.M.; Supervision, Writing—review and editing: K.K. and H.L.; Project administration: Y.S.C. All authors have read and agreed to the published version of the manuscript.

Funding

This work was partly supported by Korea Institute of Energy Technology Evaluation and Planning (KETEP) grant funded by the Korea government (MOTIE) (No. 20224000000040, Innovation Research Center for Giant Wind Turbine) and Korea Institute of Energy Technology Evaluation and Planning (KETEP) grant funded by the Korea government (MOTIE) (No. 20228520020050, Development of 25 MW Offshore Wind Turbine Reference Model and Conceptual Design Technology).

Institutional Review Board Statement

Not applicable.

Informed Consent Statement

Not applicable.

Data Availability Statement

The data presented in this study are available on request from the corresponding author.

Conflicts of Interest

Author Young Seok Cho was employed by the company TRINITY Engineering Co., Ltd. and Author Juwon Min was employed by the company Daeheung R&T. The remaining authors declare that the research was conducted in the absence of any commercial or financial relationships that could be construed as a potential conflict of interest.

References

  1. Wei, H.; Wu, C.T.; Lyu, D.; Hu, W.; Rouet, F.H.; Zhang, K.; Ho, P.; Oura, H.; Nishi, M.; Naito, T.; et al. Multiscale Simulation of Short-Fiber-Reinforced Composites: From Computational Homogenization to Mechanistic Machine Learning in LS-DYNA. In Proceedings of the 13th European LS-DYNA Conference 2021, Ulm, Germany, 5–7 October 2021. [Google Scholar]
  2. Zhao, J.; Guo, C.; Zuo, X.; Román, A.J.; Nie, Y.; Su, D.X.; Turng, L.S.; Osswald, T.A.; Cheng, G.; Chen, W. Effective mechanical properties of injection-mfolded short fiber reinforced PEEK composites using periodic homogenization. Adv. Compos. Hybrid Mater. 2022, 5, 2964–2976. [Google Scholar] [CrossRef]
  3. Agrahari, R.; Kushwaha, R.; Verma, A.; Banerjee, S. Reinforced Multiscal Polymer Compositer, Properties and Applications. In Polymer Composites; Springer: Singapore, 2024; pp. 153–179. [Google Scholar] [CrossRef]
  4. Li, Z.; Lu, J.; Qiu, R.; Liu, A.; Zhu, P. Multiscale modeling based failure criterion of injection modlede SFRP composites considering skin-core-skin layered microstructure and variable parameters. Compos. Struct. 2022, 286, 115277. [Google Scholar] [CrossRef]
  5. Llorca, J.; Gonzalez, C.; Molina-Aldareguia, J.M.; Lopes, C.S. Multiscale Modeling of Composites: Toward Virtual Testing… and Beyond. JOM 2013, 65, 215–225. [Google Scholar] [CrossRef]
  6. Lu, G.; Kaxiras, E. An Overview of Multiscale Simulation of Materials. arXiv 2004, arXiv:cond-mat/0401073. Available online: https://arxiv.org/pdf/cond-mat/0401073 (accessed on 20 June 2025).
  7. Karim, M.A.; Abdullah, M.Z.; Ahmed, T. An overview: The processing methods of fiber-reinforced polymers(FRPS). Int. J. Mech. Eng. Technol. 2021, 12, 10–24. [Google Scholar] [CrossRef]
  8. Mehdipour, H.; Camanho, P.; Belingardi, G. Elasto-plastic constitutive equations for short fiber reinforced polymers. Compos. Part B Eng. 2019, 165, 199–214. [Google Scholar] [CrossRef]
  9. Oubellaouch, K.; Pelaccia, R.; Bonato, N.; Bettoni, N.; Carmignato, S.; Orazi, L.; Donati, L.; Reggiani, B. Assessement of fiber orientation models predictability by comparison with X-ray µCT data in injection-molded short glass fiber-reinforced polyamide. Int. J. Adv. Manuf. Technol. 2024, 130, 4479–4492. [Google Scholar] [CrossRef]
  10. Marr, J.; Zartmann, L.; Reinel-Bitzer, D.; Andra, H.; Muller, R. Multiscale optimization of the viscoelastic behavior of short fiber reinforced composites. Int. J. Mech. Mater. Des. 2023, 19, 501–519. [Google Scholar] [CrossRef]
  11. Kuś, W.; Mucha, W.; Jiregna, I.T. Multiscale Analysis of Composite Structures with Artificial Neural Network Support for Micromodel Stress Determination. Materilas 2024, 17, 154. [Google Scholar] [CrossRef] [PubMed]
  12. Yu, S.; Bale, H.; Park, S.; Hwang, J.Y.; Hong, S.H. Anisotropic microstructure dependent mechanical behavior of 3D-printed basalt fiber-reinforced thermoplastic composites. Compos. Part B 2021, 224, 109184. [Google Scholar] [CrossRef]
  13. Tanaka, S.; Ichikawa, M.; Akita, S. A Probabilistic Investigation of Fatigue Life and Comulative Cycle Ratio. Eng. Fract. Mech. 1984, 20, 501–513. [Google Scholar] [CrossRef]
  14. Moulinec, H.; Suquet, P. A numerical method for computing the overall response of nonlinear composites with complex microstructure. Comput. Methods Appl. Mech. Eng. 1998, 157, 69–94. [Google Scholar] [CrossRef]
  15. Browaeys, J.T.; Chevrot, S. Decomposition of the elastic tensor and geophysical applications. Geophys. J. Int. 2004, 159, 667–678. [Google Scholar] [CrossRef]
  16. Rutka, V.; Wiegmann, A. Explicit jump immersed interface method for virtual material design of the effective elastic moduli of composite materials. Numer. Algorithms 2006, 43, 309–330. [Google Scholar] [CrossRef]
  17. Rutka, V.; Wiegmann, A.; Andrä, H. EJIIM for Calculation of Effective Elastic Moduli in 3D Linear Elasticity; Berichte des Fraunhofer ITWM: Kaiserslautern, Germany, 2006; Nr. 93; pp. 1–22. [Google Scholar]
  18. Kabel, M.; Merkert, D.; Schneider, M. Use of composite voxels in FFT-based homogenization. Comput. Methods Appl. Mech. Eng. 2015, 294, 168–188. [Google Scholar] [CrossRef]
  19. Santharam, P.; Parenteau, T.; Charrier, P.; Taveau, D.; Le Saux, V.; Marco, Y.; Hénaff, G. Complex fibers ori-entation distribution evaluation in short glass fiber-reinforced thermoplastic (PA66 GF50). MATEX Web Conf. 2018, 165, 22026. [Google Scholar] [CrossRef]
  20. ASTM, D792-98; Standard Test Methods for Density and Specific Gravity (Relative Density) of Plastics by Displacement. ASTM International: West Conshohocken, PA, USA, 1998.
  21. ASTM D683M-96; Standard test method for tensile properties of Plastics(Metric). ASTM International: West Conshohocken, PA, USA, 1998.
  22. ASTM D3835-9602; Standard test Method for Determination of Properties of Polymeric Materials by Means of a Capillary Rheometer. ASTM International: West Conshohocken, PA, USA, 1996.
  23. Jeffery, G.B. The motion of ellipsoidal particles immersed in a viscous fluid. Proc. R. Soc. London Ser. A 1922, 102, 161–179. [Google Scholar] [CrossRef]
  24. Advani, S.G.; Trucker, C.L. The Use of Tensors to Describe and Predict Fiber Orientation in Short Fiber Composites. J. Rheol. 1987, 31, 751–784. [Google Scholar] [CrossRef]
  25. Kagan, V.A.; Roth, C. The Effects of Weld Geometry and Glass-fiber-orientation on the Mechanical Performance of Joints-PartⅡ: Kinetics of Glass-fiber-orientation and Mechanical Performance. J. Reinf. Plast. Compos. 2004, 23, 167–175. [Google Scholar] [CrossRef]
  26. Chung, D.H.; Kwon, T.H. Fiber orientation in the processing of polymer composites. Korea-Aust. Rheol. J. 2022, 14, 175–188. [Google Scholar]
Figure 1. Rheological and PVT characteristics of PA66/GF50 (wt%).
Applsci 15 07434 g001
Figure 2. Tensile testing according to fiber orientation.
Applsci 15 07434 g002
Figure 3. Schematic of the injection molding screw and barrel configuration with designated heating zones. NH represents the nozzle heater, while H1–H3 denote the sequential barrel heating zones used to control the temperature during polymer melting and transport.
Applsci 15 07434 g003
Figure 4. Photograph and technical drawing of the tensile test specimen.
Applsci 15 07434 g004
Figure 5. Motor mount bracket of electronic vehicle.
Applsci 15 07434 g005
Figure 6. Strength test of motor mount bracket of electronic vehicle.
Applsci 15 07434 g006
Figure 7. Hammering test of motor mount bracket of electronic vehicle.
Applsci 15 07434 g007
Figure 8. Fiber structure analysis result of PA66/GF 50 (wt%).
Applsci 15 07434 g008
Figure 9. Simulation process from injection molding to structural analysis.
Applsci 15 07434 g009
Figure 10. RVE model for generating the material properties of PA66/GF50 (wt%).
Applsci 15 07434 g010
Figure 11. Result of tensile testing according to fiber orientation.
Applsci 15 07434 g011
Figure 12. Result of tensile testing and simulation result.
Applsci 15 07434 g012
Figure 13. Injection molding simulation results.
Applsci 15 07434 g013
Figure 14. Motor mount test results and simulation results.
Applsci 15 07434 g014
Figure 15. Hammering test results and simulation results by X, Y, Z direction.
Applsci 15 07434 g015
Table 1. Mechanical properties of PA66 and GF.
MaterialYoung’s Modulus
E (GPa)
Poisson RatioBulk Modulus
K (GPa)
Shear Modulus
G (GPa)
PA660.9860.41.6440.352
Glass fiber720.2242.85729.508
Table 2. Injection molding process conditions.
Cylinder Head Temperature (°C)Injection Molding Conditions
NHH1H2H3Pressure (%)Time (s)
315310290280804
Holding Pressure Conditions
Pressure (%)Time (s)
3010
Table 3. Dimensions of the tensile specimen.
Specimen
Dimension
[mm]
b1b2hL3LtA
9.8619.823.92172.64115338.65 mm2
Table 4. Tensile test conditions.
Temperature26 °C
Humidity43%
Speed2.4 mm/min
Gauge Length50 mm
Table 5. Fiber orientation tensors and fiber volume fraction of central layer and surface layer.
Fiber Orientation Components
by Layer (vol.%)
Fiber OrientationVf (%)
X-Axis (%)Y-Axis (%)Z-Axis (%)
Micro-CT analysis
(Core layer)
1st Layer63.047717.695619.256731.8003
2nd Layer66.184418.265515.550231.9499
3rd Layer70.901515.039314.059232.2798
4th Layer76.176711.367512.455832.0796
Micro-CT analysis
(Surface layer)
1st Layer81.44517.795410.756532.7301
2nd Layer79.83697.951812.211332.4027
3rd Layer80.04057.821512.137832.3877
4th Layer81.23747.482311.280232.7593
Table 6. Index assignment.
Tensor notationindex(ij)11223323, 3231, 1312, 21
Voigt notationindexxxyyzzyzzxxy
123456
Table 7. Fiber orientation tensor values for RVE modeling.
Fiber Orientation Ratio
(Based on the X-Axis)
Fiber Orientation Tensor Value
X-AxisY-AxisZ-Axis
90%0.90.050.05
80%0.80.10.1
70%0.70.150.15
60%0.60.20.2
50%0.50.250.25
40%0.40.30.3
Table 8. Orthotropic material properties for PA66/GF50 (wt%).
X-Axis (Ratio) E 1
(GPa)
E 2
(GPa)
E 3
(GPa)
ν 12 ν 13 ν 23 ν 21 ν 31 ν 23 G 12
(GPa)
G 13
(GPa)
G 23
(GPa)
90%9.8813.4973.5070.3870.3860.4990.1370.1370.4991.3581.3711.132
80%8.5643.7363.6770.3840.3980.4990.1670.1710.4991.5261.5371.229
70%7.4613.9293.9820.3910.3840.4690.2060.2050.4761.6151.6291.327
60%6.4244.0534.1130.3880.3840.4370.2450.2460.4431.6761.7191.427
50%5.6324.2904.2250.3730.3830.4120.2840.2870.4061.7221.7271.535
40%4.9674.4624.4840.3660.3680.3750.3290.3320.3791.6991.7191.620
Disclaimer/Publisher’s Note: The statements, opinions and data contained in all publications are solely those of the individual author(s) and contributor(s) and not of MDPI and/or the editor(s). MDPI and/or the editor(s) disclaim responsibility for any injury to people or property resulting from any ideas, methods, instructions or products referred to in the content.

