Featured Application
This study provides a simple approach by employing truck count and real-time UFP monitoring to estimate ultrafine particulate matter (UFP) dosage concentrations from diesel emissions.
Abstract
Diesel particulate matter—primarily ultrafine particles (UFPs), defined as particles smaller than 0.1 µm—are released by diesel-powered vehicles, especially those used in heavy-duty hauling. While much of the existing research on traffic-related air pollution focuses on urban environments, limited attention has been paid to how complex topography influences the concentration of UFPs, particularly in areas with significant truck traffic. With a focus on Morgantown, West Virginia, an area distinguished by a steep topography, this study investigates how travel over two different terrain conditions affects UFP concentrations close to roadways. Specifically, we sought to determine if the truck count taken from simultaneous video evidence could be used as a surrogate for varying topography in determining the concentration of UFPs. This study shows that “TRUCK COUNT” and “TRUCK SPEED” have a linear relationship and yield a possible surrogate measure of the lung dose of UFP number concentration. Our results demonstrate a statistically significant (p < 0.1) linear relationship between truck count and UFP number concentration (R = 0.77 and 0.40), validating truck count along with truck speed as a medium effect surrogate for estimating near-road UFP exposure. Dose estimation using the Multiple-Path Particle Dosimetry (MPPD) model further revealed that approximately 30% of inhaled UFPs are deposited in the alveolar region, underscoring the public health relevance of this exposure pathway in topographically complex areas. This method ultimately awaits comparison with health effects to determine its true potential as a useful exposure metric.
1. Introduction
1.1. Background
Globally, air pollution is now one of the main environmental health concerns. The emissions generated by burning fossil fuels affect the environment by causing global warming, and human exposure to particulate matter also increases the risk of respiratory complications [1]. With respect to known air pollutants, Marcella et al. add that ultrafine particles (UFPs), particles smaller than 0.1 µm (100 nm), are regarded as harmful among known air pollutants owing to their unique features and ability to cause adverse health outcomes [1]. Unlike larger particles, Ali et al. argue that UFPs have a high surface area-to-mass ratio, enabling them to penetrate deep into the human respiratory system [2]. According to Calderón-Garcidueñas and Ayala, the use of fossil fuels, particularly in diesel truck engines, accounts for the greatest percentage of UFPs emitted into the environment, especially in urban settings where concentrations are much higher along busy highways and airports [3]. In addition to the contribution of diesel trucks, the concentration levels of UFPs in a particular area are influenced by factors such as traffic density and driving conditions. A site’s topography, defined by the uphill and downhill movement of trucks, truck size, truck speed, and loading condition, may also affect UFP concentrations. These topographical features influence the concentration, distribution and emission of ultrafine particles and could potentially add complexity to the assessment of community exposures.
A key, novel aspect of this study is the use of truck counts as a validated surrogate for ultrafine particle (UFP) exposure in a complex terrain setting. While prior research has established links between traffic density and particulate pollution in urban environments, few studies have assessed how topographical features interact with diesel truck activity to influence near-road UFP concentrations. By integrating video-based truck counts with real-time UFP monitoring across a steep roadway (Brockway Avenue), this study introduces a practical and replicable approach for evaluating pollutant exposure in challenging terrain where continuous UFP instrumentation may be limited.
There is little research on how the uphill movement, downhill movement, loading condition, speed and size of heavy diesel trucks affect the spread and concentration of UFPs in environments despite their increasing relevance and the health hazards they pose. The current study therefore aims to investigate the intersection of these factors with an overall objective of determining the influence of topography on the health and environmental impact of UFPs near roadways with high diesel truck traffic rates.
Research on the health effects of air pollution has shown that long-term exposure to ultrafine particles poses a high risk of cardiovascular and respiratory health problems [4]. Prolonged exposure to ultrafine particles can also increase the irritation of the airways; in patients with existing conditions like asthma, this could lead to exacerbation in children, while in adults, it increases the risk of mortality from ischemic heart diseases [5]. As noted earlier, UFPs are significantly smaller in size when compared with other particulate matter, a unique feature that allows them to penetrate deep into the alveolar regions of the lungs [6]. Apart from the respiratory effects of their deposition in the lungs, this quality lets UFPs enter the bloodstream, where they create significant cardiovascular health issues and other systemic problems [6]. The associated health risks make UFP exposure a growing public health concern, especially in areas that not only experience high density traffic but also have different topographical features that concentrate UFP levels and, in turn, result in a higher risk of exposure [7].
As per Moreira et al., an essential step in addressing the above issue is the need to develop simplified methodologies for measuring UFP concentrations [8]. Currently, most investigations must rely on complex data collection processes and expensive equipment that makes research into the subject prohibitive. Linking UFP levels to diesel truck traffic counts offers an inexpensive option, especially for regions with minimal monitoring infrastructure [9]. Such an approach has the potential to enable more targeted mitigation strategies, such as traffic management or the implementation of green infrastructure, to reduce exposure. Regions such as Morgantown, WV, USA that have unique features like steep inclines and complex terrain present ideal locations for investigations into the influence of topography on the dispersion of UFPs.
To address the issue of determining UFP concentrations in Appalachian regions like Morgantown that have varying complex topographies, the current study seeks to address the critical knowledge gaps in our understanding of UFP emissions in such regions. The findings from the data analyzed here will offer critical guidance into UFP exposure prevention through optimal urban planning strategies like better zoning and location of busy highways far from complex topographical locations.
This research seeks to enhance the estimation of ultrafine particle (UFP) concentrations in complex topographical regions by creating a simplified, cost-effective methodology that associates heavy diesel truck traffic with UFP levels. This study will provide more information on the relationship between UFP concentrations and traffic emissions, offering critical insights for air pollution mitigation, transportation planning, air quality legislation, and public health risk evaluation.
Overview of the Studied Appalachian Region
The Appalachian region is characterized by its mountainous terrain. High truck traffic presents unique challenges for air pollution monitoring [10]. Steep landscapes can lead to increased UFP pollutants. As diesel trucks move uphill and downhill, this leads to high UFP concentrations. This phenomenon poses a significant risk to communities near transportation corridors. Additionally, the combination of increased traffic from diesel-powered vehicles, rugged terrain, and industrial activities such as mining and unconventional natural gas drilling (UNGD), creates a complex environmental scenario [7]. Currently, this remains underexplored in air quality research [10].
Current methodologies for monitoring UFP concentrations rely on advanced instruments and sophisticated modeling techniques. While accurate, these techniques are often expensive and impractical for widespread use in resource-limited settings [11]. This limitation hinders efforts to assess community-level exposure risks and implement effective mitigation strategies. Moreover, the lack of studies examining the interplay between heavy diesel truck traffic, traffic pattern, topography, truck speed, engine size and truck loading conditions in rural and semi-urban regions limits the ability to generalize findings from urban areas to Appalachian regions [11].
This study sought to address these critical gaps by developing a simplified, cost-effective methodology to estimate UFP concentrations in relation to heavy-duty diesel truck traffic volume, specifically in areas with both flat and complex terrain. In this study, topography is significant because diesel truck uphill and downhill movement, engine size, loading condition, and truck speed in complex terrain may affect UFP concentrations. Trucks that climb steep inclines need more engine power, which increases fuel burning and raises UFP concentrations in complex terrains. By establishing a correlation between UFP levels, traffic patterns, and topographical features, this research aims to provide actionable data for policymakers, urban planners, and public health professionals. The findings will support the development of targeted interventions to reduce air pollution exposure, mitigate health risks, and enhance the quality of life for populations in challenging topographical environments. This work is particularly relevant as regions like Appalachia continue to experience industrial growth and increased transportation activity, intensifying the need for effective air quality management solutions. The central aim of this paper is to develop a correlation equation between heavy-duty truck traffic volume and ultra-fine particulate matter concentration (as determined by the number concentration and real-time size distribution measurements).
1.2. The Physics of Ultrafine Particles
Recent studies on air pollution have shown that ultrafine particles have physical properties that are significantly different from larger PM particles (Table 1); the standard measure of larger PM particles is the mass concentration of particles, to which ultrafine particles contribute virtually undetectable amounts. The appropriate measure of UFPs has been shown to be the number concentration, which the current standards and the agencies enforcing them are not equipped to appropriately measure [12]. Kwon et al., for instance, explored the unique physicochemical properties of ultrafine particles to determine the potential health risks of prolonged exposure [6]. The researchers reviewed the existing literature on UFPs, including physical characteristics compared with larger particles in urban settings. Kwon et al. also noted that UFPs are generated in vast quantities and have a high surface area, which, when coupled with their small size, translate to increased risk of exposure as they can penetrate airway tissues, thereby increasing the risk of health complications like asthma and chronic obstructive pulmonary disease [6].

Table 1.
Principal classification of EPA National Ambient Air Quality Standards (NAAQS) compared with UFP criteria.
Findings by Vaze et al. also affirmed the unique physical properties of UFPs [13]. The study analyzed the physicochemical properties of PM in parking garages at a New Jersey hospital during the summer and winter seasons. Real-time monitoring revealed high concentrations of 48.7 nm UFPs, with 3137.87 (±774.57) particles/cm3, and according to Rajagopal et al., they accounted for between 60 and 80 percent of the mass of particulate matter [13,14].
1.3. Sources and Concentrations of Ultrafine Particles
With the rising concerns around the environmental and health effects of air pollution, Smichowski and Gómez note that there has been growing attention toward particulate matter, especially strategies aimed at minimizing sources and related activities [15]. Groma et al. [16] conducted a 10-day intensive measurement campaign of particulate matter in a high-traffic urban area of Budapest, Hungary. Using an aethalometer model and positive matrix factorization, they identified six major sources of ultrafine particles, three of which were directly attributable to traffic emissions, most notably from heavy-duty diesel trucks. Traffic-related sources were found to contribute approximately 31% of total submicron PM, making them the dominant contributor to the most harmful particles observed during the study.
A global review by Hopke et al. [17] showed that concentrations of ultrafine particles are much higher near traffic highways and airports, which affirmed findings of previous studies. That same review also found that UFP concentrations within an 8 to 10 km radius of airports were four to five times higher than typical background levels. Finally, a similar trend was observed in urban settings where proximity to busy traffic highways or regions with industrial activities had higher concentrations of UFPs when compared with residential areas with low traffic. A national-scale empirical model of UFP concentrations in the United States developed by Saha et al. [18] also revealed a similar trend in which busy highway traffic, commercial land use, and urban-related variables accounted for much of the spatial variability in UFP concentrations throughout the continental US. This analysis of ∼6 million census blocks across the U.S. from 2016 to 2017 showed that UFP concentrations could be found to range between 1800 and 26,600 particles/cm3, often located near highways, airports, and industrial regions.
1.4. Health Effects of Ultrafine Particles
Exposure to UFPs generally occurs through inhalation, making respiratory complications like asthma one of the key health risks. A 2021 computational fluid dynamics (CFD) study by Dong et al. [19] found that for particles of less than 10 nm, Brownian diffusion remains the dominant particle deposition mechanism. Those researchers employed two respiratory tract models, the Kitaoka (KG model) and a computed tomography-based patient-specific airway, while UFP deposition efficiency was calculated utilizing data published by The International Commission on Radiological Protection. Dong et al.’s findings showed that the respiratory deposition of particles <10 nm was significantly higher when compared with >10 nm particles, highlighting the health implications of UFP exposure.
On the other hand, Zhai et al. used a high-mass-resolution single-particle aerosol mass spectrometer to assess the respiratory deposition of UFPs among residents of urban Shenzhen, China, during the summer [20]. These researchers found that particles consisting primarily of elemental carbon (0.05–0.1 μm) were the dominant components of UFP emissions, a factor that significantly increases deposition and respiratory health complications. Compared with general particulate matter, Zhai et al. found that residents are exposed to 0.1 μm particles with a daily dose of ~2.08 ± 0.67 billion particles, which significantly increases the risk of such particles being deposited into deeper sections of the respiratory tract due to their small size. Elemental carbon particles, which are significantly small, were also found to account for approximately 85.7% of the UFPs inhaled by residents of the region, further demonstrating the potential deposition of such particles into deeper sections of the respiratory tract. Research indicates that UFPs can penetrate deep into the lungs, including the alveolar region, where they can cause inflammation and oxidative stress [2]. A review study by Vallabani et al. investigated the toxicity and health effects of ultrafine particles and found that, compared with larger particles of >2.5 μm, exposure to UFPs was associated with increased pulmonary inflammation [21]. Robinson et al. examined the risk of UFP exposure among urban school children using a sample of 8–11-year-old schoolchildren attending 25 elementary schools in Queensland, Australia [22]. Increased exposure to UFPs in this group was associated with lung inflammation and a diminished capacity, as characterized by greater lung stiffness.
A common health implication is asthma, which, according to Agache et al., is a chronic respiratory condition that affects airways in the lungs [23]. Exposure to UFPs can cause asthma by triggering inflammation and the narrowing of the airways, which, according to Anderson et al., will result in difficulty breathing and sensitivity of the airways over time [24]. Turner and colleagues, for instance, conducted a one-week sampling campaign using a sample of adolescents with and without asthma [25]. The measurements of lung function by these investigators using the ATS/ERS criteria revealed a significant decline in lung function and an exacerbation of asthma symptoms among those with preexisting diagnoses. Wright et al. also explored the potential effects of ambient UFP exposure among infants and found that prenatal UFP exposure led to an increased risk of asthma development in children [26]. Sivakumar and Kurian exposed Female Wistar rats to particulate matter for 21 days and found that the specimens developed a wide range of cardiovascular complications, including heart muscle hypertrophy, vascular calcification, and alterations in cardiac electrophysiology [27].
A meta-analysis of several studies by Lachowicz and Gać also concluded that exposure to UFPs was associated with a higher risk of cardiovascular events, such as heart attacks and strokes [28]. These findings showed that individuals exposed to UPF exhibited an increase in blood pressure, which returned to baseline a few hours after exposure was eliminated. Additionally, persistent exposure to UFPs could result in worsening cardiovascular complications like hypertension, thrombosis, or arrhythmias.
Qi et al. also reported on the hidden dangers of UFP exposure, especially given the fact that respiratory health risks seem to attract more attention compared with systemic health complications [29]. That study specifically investigated the association between long-term exposure to UFPs and mortality in New York State, and the findings showed that long-term UFP exposure significantly increases the risk of non-accidental mortality, with cerebrovascular and pulmonary heart diseases being leading causes of death. Even in short-term exposure cases, Zhang et al. found that UFP exposure was associated with increased heart rate variability (HRV), which is a major cardiovascular health risk factor [30].
1.5. Topographic Influences
Topography plays a significant role in the concentration of UFPs, influencing their distribution and concentration in the environment because of the complicated effects of truck size, loading condition, speed, and the uphill and downhill movement of trucks on UFP emissions. In complex terrains, higher UFP concentrations occur because of the increased fuel burning caused by trucks requiring more engine power to ascend steep inclines.
As Carnerero Quintero notes, mountainous regions with rugged terrains are prone to trap pollutants near the ground, leading to elevated concentrations [31]. A study by Tran et al. found that UFP concentrations near diesel truck routes in hilly areas were significantly higher than in flat terrains [32].
A literature review study by Lv, Wu, and Zang, for instance, found that particulate matter tends to accumulate in steep regions [33]. Truck traffic near steep terrains enhances the emission of UFPs. Understanding these interactions is crucial for developing effective strategies to mitigate UFP pollution. This includes designing urban environments that minimize the adverse effects of topography on air quality, as well as implementing targeted emission controls and green spaces to improve ventilation and reduce particle buildup.
2. Materials and Methods
This study aimed to investigate the influence of topography and truck traffic on ultrafine particle (UFP) concentrations through near-roadway air quality monitoring and data-driven analysis in Morgantown, West Virginia, USA. Morgantown, WV, USA, was chosen as a surrogate site for this study due to its diverse topographical characteristics, which provide a natural setting to analyze the influence of terrain on ultrafine particle (UFP) concentrations and truck emissions. The city’s unique mix of steep inclines, valleys, and flat terrains makes it an ideal location to investigate how topography affects near-roadway air pollution dispersion.
2.1. Justification for Using Morgantown, WV, as a Surrogate Site
Morgantown, WV, USA, (Figure 1) includes both steep and flat terrains within a compact urban area, allowing for controlled comparisons between different roadway conditions. This natural variation helps isolate the impact of topographic complexity on air pollution without introducing confounding variables from multiple cities. Morgantown, WV, USA, serves as a major transportation corridor, with heavy diesel trucks frequently traveling through the region, making it a suitable site to study the impact of truck emissions on UFP accumulation. The high truck traffic density provides a real-world setting for assessing how emissions behave in different terrains. Many urban areas in the U.S. feature a combination of complex and flat terrains with heavy truck traffic (e.g., Appalachia). Morgantown provides a surrogate model for studying how emissions behave in different topographic scenarios, offering insights that can be applied to similar locations anywhere.
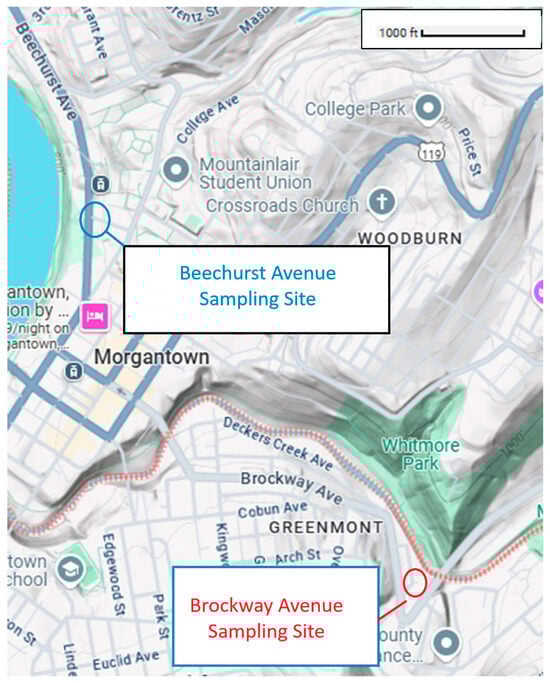
Figure 1.
Topography of Morgantown, WV, USA and location of air quality monitoring and instrumentation sites within that city. (Source: Google maps).
2.2. Study Locations
2.2.1. Brockway Avenue (Surrogate for Rough and Complex Topography)
The first site targeted by the investigators was Brockway Avenue, which is located between Decker’s Creek and Cobun Avenue in the southern part of Morgantown, WV, USA. The Brockway Avenue corridor is currently zoned for low-density commercial use and is an area with steep slopes in some locations. This site features steep inclines and irregular road geometry, creating an environment where UFP concentration may be influenced by traffic condition, loading condition, engine size and truck speed. The elevation of Brockway Avenue is about 305 m (1000.66 feet), with a barometric pressure of 98 kPa. The steep inclines coupled with low elevation and surrounding real estate projects make Brockway Avenue a suitable location for analyzing the impact of topography on UFP concentration. The site serves as a model location for areas with mountainous or hilly topographies, where emissions might accumulate differently than in flat areas.
2.2.2. Beechurst Avenue (Surrogate for Flat Topography)
The second location sampled was Beechurst Avenue, located in the heart of Downtown Morgantown. The avenue is situated next to West Virginia University and is thus a state-maintained road. This location represents flat road conditions with heavy diesel truck traffic, allowing for the analysis of direct exhaust emissions without significant elevation effects. The area is relatively flat, with the Monongahela River nearby, which makes it an ideal location for investigating the effect of flat topography on exhaust emissions and UFP concentrations. The area also includes a mixture of high-rise commercial and residential buildings, even though the ground is generally flat, with the road traversing no notable hills or steep inclines but being set in a river valley (Figure 1). The elevation of Beechurst Avenue is about 280 m above sea level. These features mean that the location has the potential to serve as a baseline for comparing how UFP concentrations behave in a level urban setting versus a complex terrain.
2.3. Exposure Monitoring
An ultrafine particle electrical mobility size analyzer and counter, (TSI Model 3910, Shoreview, MN, USA, referred to simply as the NanoScan) is an advanced, portable, manufacturer-calibrated, particle size analyzer used for quantifying ultrafine particle concentrations across diverse environmental and industrial settings [34]. The 3910 model is noted for its high sensitivity and precision in quantifying particles ranging from 5 to 1000 nanometers, making it a vital instrument for researchers and professionals in environmental science, occupational health, and air quality monitoring [34,35]. In addition to its abilities, the TSI MODEL 3910 is also known for its small size, battery operation and portability, which is a major advantage for field studies.
The NanoScan SMPS was deployed to continuously measure UFP concentrations and size distributions in real-time at each site. This instrument provides high-resolution particle sizing within the 10–420 nm range, with a sampling interval of one minute [36]. It accomplishes this by integrating a TSI Scanning Mobility Particle Sizer (SMPS™, TSI Model 3938, Shoreview, MN, USA,) spectrometer into a portable unit approximately the dimensions of a basketball [37]. A bipolar aerosol charger, powered by a long-column differential mobility analyzer (DMA, TSI, Model 3083, Shoreview MN, USA), maintains particles within a defined charge distribution, facilitating the precise categorization of size and number based on electrical mobility [35,37]. Studies have consistently shown that the NanoScan SMPS Nanoparticle Sizer 3910 is well-suited for applications that involve the sampling and analysis of particulate matter composition and concentrations in the air. The NanoScan has the ability to isolate the counts from one size bin to be used as the prime indicator of total UFP exposure. These are graphed as “counts” for the sum of all the bin sizes if no bin size is specified, or, for select sizes, the particle size of the selected bin that was used is appended to the “count” title. In theory, a total count could be calculated from the counts in a single bin if the size distribution can be assumed to remain constant. Sampling was done only days forecast to have low wind speeds and no precipitation with little difference between sites and no evidence of ground level valley inversions (Table 2).
Table 2.
Weather information for Beechurst Avenue and Brockway Avenue locations (all sampling conducted was under dry atmospheric conditions only).
Yuan et al., for instance, conducted a study to validate the accuracy of scanning mobility particle analyzers based on models developed with COMSOL software [38]. A differential mobility analyzer (DMA) consisting of a semi-ellipsoidal gas flow conditioner, a multi-hole ring, and an anti-turbulent slit was used to enhance particle size resolution. The study findings showed that instruments such as the NanoScan that employ a long-column differential mobility analyzer (DMA) have higher accuracy and are suitable for sampling and measuring particle size and concentrations in a specific location. For the current study, the NanoScan monitor was positioned at approximately 1.5 m above ground level, aligning with the breathing zone for pedestrians and commuters [35]. The instrument at each site was positioned upwind, ideally at the center of the location. This ensured the direct exposure of the sampling inlet to the air stream and that samples were collected from suitably representative locations.
One of the key features of the NanoScan is its high sensitivity and precision. As noted by Singh and Kuang, the NanoScan employs scanning mobility particle sizing (SMPS), a mobility principle that allows it to detect and count individual particles [37]. This portable version of the SMPS has been a recent development, especially in the measurement of ultrafine particles, which are significantly smaller in size and thus difficult to detect [39]. The NanoScan utilizes SMPS technology to effectively analyze and measure UFP concentrations globally. The high sensitivity enabled us to detect concentrations of ultrafine particles, which was crucial for the precise evaluation of air quality at each site.
The NanoScan is also able to capture and measure a wide range of particle sizes using 13 size bins and allows for real-time data collection, which is an essential component of ultrafine particle concentration analysis [40]. According to Shirman et al., the model can measure particles as small as 10 nm in diameter all the way to 420 nm in diameter, which makes it a suitable instrument for UFP classification and concentration measurement [41]. The NanoScan’s dynamic range enables it to accommodate various particle sizes and concentrations, including the measurement of the ultrafine particle concentrations required in this study [40]. The NanoScan has the ability to isolate the counts from one size bin to be used as the prime indicator of total UFP exposure. These are graphed as “counts” for the sum of all the bin sizes if no bin size is specified, or, for select sizes, the particle size of the selected bin that was used is appended to the “count” title. In theory, a total count could be calculated from the counts in a single bin if the size distribution can be assumed to remain constant, which was not investigated here. As noted by Liati et al., a considerable portion of UFPs are generated by diesel combustion engines, whose use significantly varies depending on location and time of day [42]. The NanoScan features an advanced computer system for real-time data logging, facilitating the continuous monitoring of ultrafine particle concentrations [40] at a minimum of 1 min for a complete scan of all particle size bins. In pilot efforts at the locations chosen for sampling, it was found that approximately 5 min was needed for the particle counts to return to a baseline level found when there were periods of no truck passage. An integrated traffic count period of 15 min was therefore established to avoid the extensive overlap of concentration between periods while still accumulating enough truck counts to allow for a range of the discrete number of vehicles being counted.
2.4. Traffic Data Collection and Classification
2.4.1. Traffic Pattern Analysis
The generation and accumulation of ultrafine particles is directly related to traffic conditions. As such, part of the study activities was to collect traffic data to help determine and classify these heavy diesel trucks and their contribution to UFP concentrations. For this study, we used a video camera for traffic monitoring that was positioned to capture truck traffic at the two sites where the study was conducted. The visual examination of this video by two of the researchers separately followed by the adjustment of any discrepancies between them on joint viewing allowed for both the measurement and inter-researcher data verification of truck movement, truck speed, engine size and loading condition. This comparison assured a thorough, repeatable, analysis of traffic patterns. Data collection occurred over a six-day period at each location to account for variations in traffic patterns. The prolonged sampling duration yielded a more comprehensive dataset for statistical examination. One of the primary metrics evaluated during the exercise was the truck count every 15 min. Truck density and patterns in traffic flow were found by counting the number of trucks that passed through the monitoring location at 15 min intervals. The sampling period, which ran from 6:00 AM to 10:00 AM, coincided with high traffic volumes brought on by industrial activity and early commutes. This time was chosen to determine the peak concentration of ultrafine particles from diesel truck emissions. The average speed was measured by manually timing the truck passage through the frame of the video against known (and measured) background distance indicators.
Truck categorization was conducted with the help of the School of Engineering. This characterization was based on engine type, loading condition, traffic pattern, and speed, as well as truck count and truck size, which distinguished between small, medium, and large diesel-powered trucks. Due to their differing emission profiles, small, medium, and large diesel-powered trucks were easier to distinguish according to this classification [43]. Larger trucks with more powerful engines may tend to produce higher levels of ultrafine particles (UFPs), highlighting the need for a greater focus in terms of UFP exposure prevention measures, as are specifically defined by the EPA.
The School of Engineering’s, Mechanical and Aerospace Engineering Department expert advice was used for engine categorization from video footage to increase the accuracy of emission source identification. Experts classified theoretical engine exhaust potential based on EPA regulation requirements.
Truck loading conditions (full or empty loads) were assumed based on the direction of the travel of the truck. The trucks travelling into town were most likely coming from a limestone mine to a barge loading dock on the river, downtown. Trucks travelling in the other direction were likely to be unloaded and returning to the only likely destination for a large heavy-duty truck to which the two chosen sampling site streets led—the mine from which the now unloaded trucks had originally come, which is the only working mine for some distance around.
This standardized method ensured data consistency and enhanced the reliability of UFP source attribution. Older, less efficient engines are associated with higher emissions of ultrafine particles (UFPs) in comparison with newer, more advanced models. This facilitated distinctions among source categories, enhancing the reliability of UFP source attribution. To show the strength of the relationships between the dependent variable (UFP concentration) and independent factors (traffic and terrain), we produced scatterplots and performed correlation analyses. The graphical plots (Figure 2 and Figure 3) show a visual representation of the data, helping with the identification of potential linear correlations to quantify the strength and direction of the relationships among the variables. These trucks were coming from a source of materials to a shipping port, so their direction of travel on the street indicated whether they were loaded or empty, changing the power needed by the engine to drive the truck at a particular speed that could be measured by timing the transit of the vehicle across the video screen on the recording.
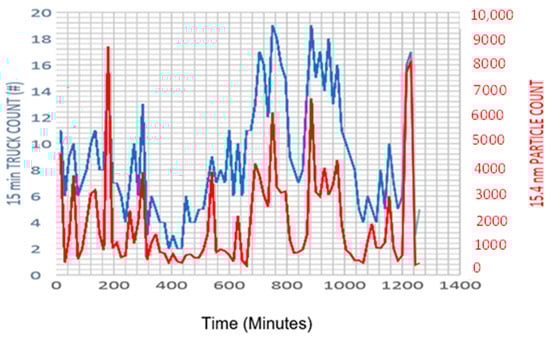
Figure 2.
Time series plot showing the truck traffic count and UFP concentration over an ongoing monitoring period (in minutes) at the Brockway location. Clear spikes in UFP concentration (red line) closely corresponded to variations in truck traffic (blue line). This indicated that truck activity might be a major contributor to near-roadway UFP pollution.
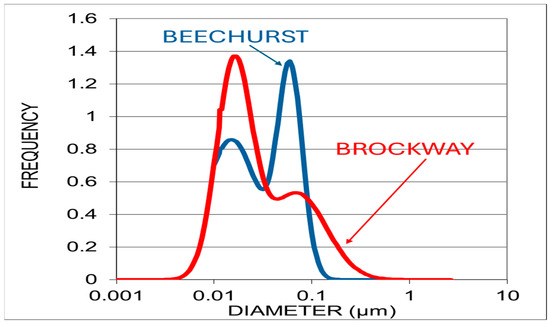
Figure 3.
Particle number size distributions simultaneously collected during sampling from NanoScan data for UFPs that are generally smaller than 0.1 µm [42]. The particle distribution was bimodal for both locations and similar at both locations, with geometric mean count diameters of 0.07 µm (geometric standard deviation of 2.0) and 0.016 µm (geometric standard deviation of 1.52) for Brockway and geometric mean count diameters of 0.06 µm (geometric standard deviation of 1.34) and 0.015 µm or 15 nm (geometric standard deviation of 1.9) for Beechurst.
2.4.2. Configuration and Inputs for the Deposition Modelling
We utilized the Stahlhofen et al. model to enhance our understanding of the dose estimate associated with ultrafine particle (UFP) exposure in each study location [44]. This model has been used previously to help in accounting for dose estimation [45].
During data collection, the following parameters were configured in the deposition model. The first was particle size distribution based on input from the NanoScan using size bins within the 10–420 nm range. Due to variations in elevation and topographic features, distinct distributions were employed for Brockway and Beechurst Avenues, reflecting the differences in UFP concentrations and exposure risk. The second parameter was breathing conditions, which affect the uptake and retention of particles in tissues [46]. A tidal volume of 700 mL was employed, accompanied by a respiratory rate of 7 breaths per minute and with nasal breathing, reflecting standard resting conditions.
2.5. Statistical Analysis and Data Processing
We subjected the data to statistical analysis utilizing JMP Pro 18 (Statistical Discovery LLC, Cary, NC, USA) and Microsoft® Excel® for Microsoft 365 MSO (Version 2503 Build 16.0.18623.20266, 64-bit) to investigate the relationships between truck traffic, topography, and UFP concentration. Multiple sources were used in obtaining these datasets, including a video-based traffic monitoring system and the NanoScan. We evaluated the concentrations and distributions among study locations using descriptive statistical analysis after data collection and preparation.
Descriptive statistics, including mean, mode, standard deviation, scatterplots and dual-axis time series plots, were used to examine UFP concentration distribution over several sites. This set the standard for the comparison of UFP values and the finding of notable differences. Traffic data were combined with UFP concentrations using descriptive statistics to enable a complete understanding of normal traffic patterns at every site and their effects on UFP exposure.
We utilized linear regression modeling to evaluate the impact of topographic elevation on UFP concentrations. This study involved modeling UFP concentration as the dependent variable and truck count as the independent variable. The coefficient of determination (R2) and p-values were employed to evaluate the strength and significance of the relationship. Additionally, dual-axis time series plots were developed to visualize the relationship between truck traffic and UFP concentrations over the study period. As evidenced in Figure 1, the x-axis represents the number of trucks recorded during the study period while the y-axis represents computed changes in UFP concentration. This graphic depiction helped to clearly spot trends and patterns that might not have been obvious from raw data. A p-value < 0.05 was considered statistically significant.
2.6. Multiple-Path Particle Dosimetry (MPPD) Data Analysis
The deposition analysis was conducted using the MPPD regional deposition fraction model. Specifically, the percentage of particles deposited in the thoracic, tracheobronchial, and alveolar regions of the respiratory tract were analyzed to determine dose [44]. Dose response estimation based on lung deposition data was used to estimate the potential health risks associated with exposure at each of the two locations.
3. Results
3.1. Time Series Plot 3.1 Analysis of Temporal Trends in Truck Traffic and UFP Levels
At the simplest level, the investigation looked at simultaneous trends in truck traffic count and particle number count for the smallest particle size, assuming it would be the size most likely attributable to diesel particulate matter at the site where engine exhaust was also the most visible. Figure 2 strongly indicates there may have been a correlation for those variables alone. At Brockway Avenue and Beechurst Avenue, the particle size distribution modes were characterized by a proportion of smaller particles, with a dominant peak near 0.015 µm (Figure 3). The selection of this size channel of the UFP aerosol was thus considered as a likely indicator of related truck traffic in this investigation. This suggests that a substantial fraction of the UFPs present at this location are freshly emitted nucleation-mode particles, likely originating from diesel truck emissions [47].
Thus, a considerable portion of the generated UFPs (60%) at Brockway Avenue appear to be attributable to diesel trucks (Figure 4). The F-statistics, which measured how well the model explained variance relative to unexplained variables, returned a reading of 124.82, which suggests that the model was highly significant overall with an extremely small p-value (<0.0001). As with the first site, a positive correlation was observed between truck count and UFP concentration at the Beechurst Avenue site (Figure 5). The plot illustrates a positive correlation, suggesting that an increase in truck count was associated with a rise in UFP concentration. The regression analysis indicated that, despite a lower slope at Beechurst Avenue compared with Brockway Avenue, an increase in truck traffic correlated with elevated UFP concentrations. In contrast to Brockway, where pollutant entrapment was more pronounced due to the terrain, the flatter topography at Beechurst Avenue allowed for enhanced dispersion, resulting in relatively lower peak UFP levels than Brockway Avenue (Figure 6). The results from Figure 2, Figure 3 and Figure 4 provide a narrative on the influence of diesel truck traffic on ultrafine particle (UFP) pollution at the Brockway Avenue site.
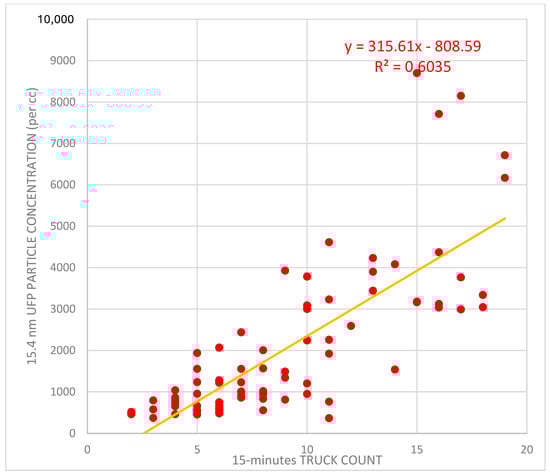
Figure 4.
Linear regression relationship between truck count (x-axis) and UFP concentration (y-axis). This regression analysis model for the Brockway site’s 15.4 nm particle count (per cc) vs. truck count, accounting for variability in terrain, resulted in an R squared value of 0.6035.
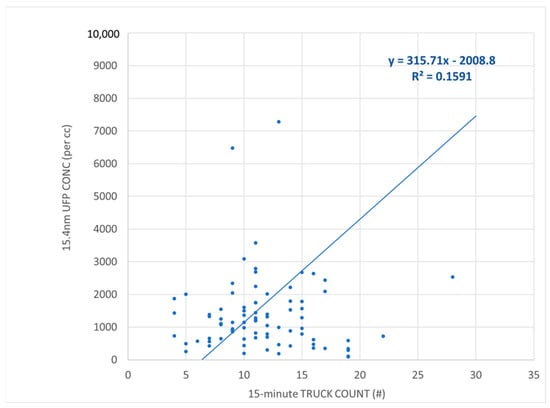
Figure 5.
Scatter plot demonstrating the lower overall concentrations at the flatter, more open, Beechurst site and the slightly less but still statistically significant (p < 0.0002) linear regression correlation between truck count and UFP concentration (15.4 nm particle count per cc).
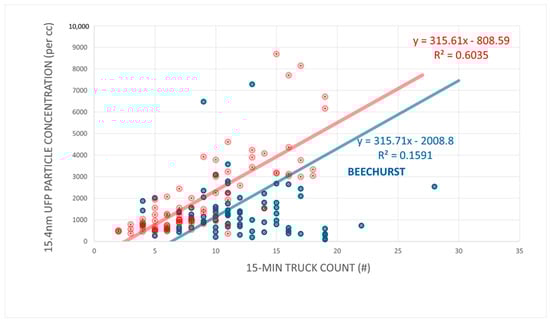
Figure 6.
The linear regression plot shows similar slopes for both sites but potentially slight topographic and subsequent engine load impacts on 15.4 nm UFP concentrations at Beechurst (blue) and Brockway (red).
Figure 2 presents a time series analysis of truck traffic count and UFP concentrations measured at minute-level intervals. The data show that sharp increases in UFP concentration (red line) frequently coincided with peaks in truck activity (blue line), indicating a strong temporal association between vehicle presence and pollutant levels. These synchronous spikes suggest that real-time truck traffic is a proximate contributor to near-road UFP emissions, consistent with the expected emission patterns from heavy-duty diesel engines during uphill climbs.
Figure 3 further substantiates the source and nature of UFPs through particle number size distributions captured during the sampling period. The bimodal distribution observed at Brockway Avenue (with geometric mean count diameters of 0.07 µm and 0.016 µm) reflects the emission profile typical of combustion sources, especially diesel exhaust. The smaller mode (~15.4 nm) corresponds to freshly nucleated particles, while the second mode (~70 nm) likely results from particle growth due to coagulation and condensation. The similarity of the bimodal pattern across both terrain types suggests a consistent emission source, but the elevated concentrations and sharper modes at Brockway point toward greater accumulation due to both higher emission intensity and topographic constraints on dispersion.
Figure 4 shows the statistical confirmation of this single variable relationship with a distinct upward trend, suggesting that UFP concentration rises in correlation with increased truck counts. The differences in the correlation coefficients between the two sites were concerning. Having strongly considered the possibility that the relationship might be multicausal, a multivariate analysis was therefore conducted while considering the particle size distributions (using both total and individual bin counts), the loading conditions (loaded versus unloaded), the transit times of the trucks through the sampling locations, and the associated speeds.
This model quantifies the contribution of truck traffic to localized UFP levels, particularly highlighting how truck-induced emissions significantly drive the concentration of the smallest and most respirable particle fractions, which are known to deeply penetrate the alveolar regions of the lungs. The moderate-to-strong R2 value implies that truck activity alone accounted for over 60% of the variation in near-road UFP levels during the monitoring period. Together, these three figures support the hypothesis that diesel truck traffic, amplified by steep terrain, is a major determinant of localized UFP pollution at Brockway. The combination of a real-time spike (Figure 2), emission-related particle size profiles (Figure 3), and a strong statistical association (Figure 4) creates an argument for both the source and behavior of UFPs in this microenvironment.
3.2. Analysis of Particle Size Distribution at Brockway and Beechurst Avenue Sites and Its Implication for Lung Dose Estimation Using a Deposition Model
There is a Multiple-Path Particle Dosimetry (MPPD) model yielding estimates of lung deposition that offers a vital framework for analyzing the deposition of ultrafine particulate matter across various regions of the human respiratory system [44]. The results from Brockway Avenue and Beechurst Avenue, as indicated by their respective particle size distributions, have significant implications for inhalation exposure and potential health risks. The similarity in particle size distributions between these two locations suggests a potentially easy applicability of the UFP techniques described herein in source characterization, as well as in atmospheric transformation processes and dispersion mechanisms, all of which directly impact where and how these particles deposit within the lungs.
The risk due to variation in particle size related lung deposition exposure (Figure 3) was indicated for both sites by the broader bimodal distribution, with both sites having two significant peaks, similar in size but differing in proportion, relative to the total distribution. The first peak (~15.4 nm) represents smaller, perhaps more freshly emitted and less agglomerated UFPs, likely from diesel combustion and the most likely choice for indicating the presence of diesel traffic in subsequent analyses. The second peak (~0.07 µm–0.1 µm) suggests the presence of larger, accumulation-mode (perhaps agglomerated) particles representing a proportionately lesser impact for Brockway Avenue (40% of total) and a greater relative impact at Beechurst Avenue (60% of total). The thoracic deposition rate (the sum of alveolar and tracheobronchial deposition) was approximately 62% for Beechurst Avenue, with an alveolar deposition dose of approximately 30% of the total number concentrations occurring at the levels shown in Figure 6; we measured 62% for thoracic deposition and 31% for alveolar deposition at Brockway Avenue.
Due to significant roadway variation differences, the correlation at Beechurst Avenue (designated as “Flat”) was weaker than at Brockway Avenue (designated as “Hilly”). The extent of UFP pollution elevation caused by terrain is one important issue. The uphill and downhill movement of diesel trucks at Brockway Avenue in steep terrain affects UFP emissions (Figure 7) and accumulation, as does the speed of the trucks (9 miles per hour on Brockway versus 17 miles per hour on Beechurst, as seen in both concentration and size differences in the box and whisker plots in Figure 8) at those locations. Therefore, topography is significant in this research. Trucks need greater engine power when they ascend steep slopes and decreasing speeds in complex terrains, which cause more fuel combustion and higher UFP concentrations.
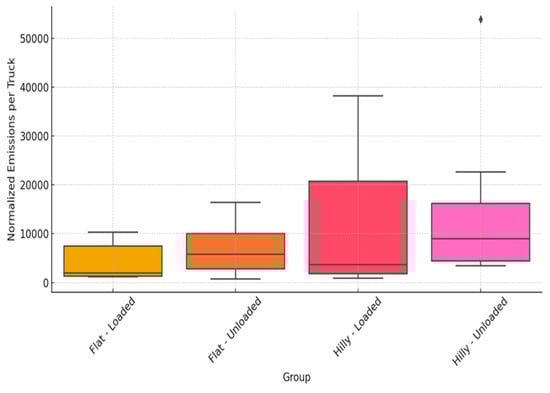
Figure 7.
Box and whisker plot of average emissions (particle counts/cm3) by truck group, terrain, and load status, with “Flat” being the Beechurst Avenue site and “Hilly” being the Brockway Avenue site. The “Loaded” or “Unloaded” designations are based on the assumptions described in Section 2.4.1. with only one single outlying point (and above 50,000 particles per cc) occurring beyond the upper quartile for unloaded trucks on hilly (Brockway Avenue) terrain.
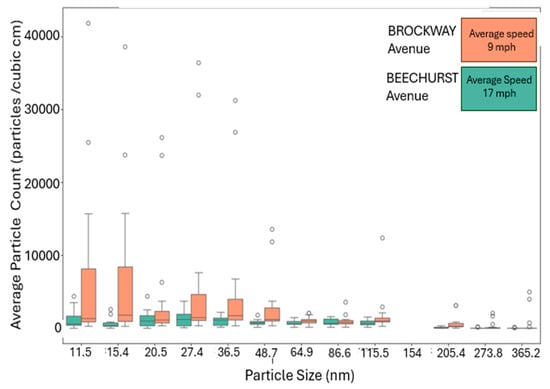
Figure 8.
Box and whisker plot of average UFP concentrations by sampling site particle count and particle size, which shows an inverse correlation between decreasing average site speed, decreasing average number of trucks per hour by site, and increasing particle concentration, particularly for the 13 NanoScan bin sizes in the instrument’s full size range.
3.3. Multivariate Analysis
Beechurst Avenue benefits from easier truck mobility and smoother traffic flow due to its flat topography and improved road conditions because the flat terrain promotes natural air flow and helps to efficiently dilute emissions. Enhanced road conditions permit the better dispersion of pollutants. UFP pollutants are more effectively dispersed than in Brockway Avenue, which has rougher roads and a more complex topography. The overall concentration of ultrafine particles (UFPs) is lower even though truck emissions continue to contribute to UFP concentrations.
The way traffic flows at Beechurst Avenue may be an important element. Due to crossings, traffic lights, and congestion, the site probably sees a more varied mix of cars, fluctuating speeds, and stop-and-go traffic because of its open location. Under these circumstances, any constant contributions of trucks to UFP levels may be sporadically offset by a mixture from other sources, including passenger cars and public transit not producing the UFP concentrations associated with the trucks. A multiple linear regression analysis was performed using the truck count videos to derive some other easily measured variables to determine its relative importance in enabling the goal of a simple sampling technique.
To address that underlying variability, a multiple linear regression analysis was carried out to assess how traffic activity, directional movement, and vehicle loading affected the concentration of ultrafine particles (UFPs), with the highest correlation detected at the 64.9 nm size fraction. The model contained the following predictors: X1 = location (Beechurst Avenue vs. Brockway Avenue), X2 = truck loading condition, X3 = direction of travel (Downhill), and X4 = number of trucks and vehicle speed. In particular, the multiple linear regression model was expressed as the following equation:
where ε is measurement error. Of these factors, vehicle speed stood out as the only statistically significant predictor (estimate = −128.29; p = 0.0426). It is known that lower speeds are linked to higher engine torque. This mechanical stress causes incomplete combustion and, in turn, leads to elevated UFP levels. Also, at slower speeds, trucks spend a greater amount of time within the valley confines of both the Brockway Avenue and Beechurst Avenue areas, suggesting a Box Model situation (similar to a car idling in a garage longer, producing an increasingly higher exhaust concentration). The tortuous turn on Brockway Avenue produced a slower average speed (9 mph), and fewer trucks per hour (42.5), whereas the straight multilane Beechurst Avenue provided a straight, flat, and more expeditious route that resulted in a higher average speed (17 mph) and more trucks per hour (47.75) on average during the sampling period of 6 days at each location with a posted speed limit of 25 mph in both places.
UFPs = β0 + β1 X1 + β2 X2 + β3 X3 + β4 X4 + ε,
The model variables in the regression model (Equation (1)) including location, loading condition, travel direction, and truck count showed impacts on emissions (e.g., higher emissions from loaded trucks on steeper terrain), but speed was the most statistically significant predictor. With Brockway Avenue (Figure 9) having a Pearson correlation coefficient value of 0.77 and Beechurst Avenue (Figure 10) having a Pearson correlation coefficient value of 0.40 and a projected RMSE of 406.75, the general multivariate model performance showed a moderate degree of explanatory and predictive power, as defined by Cohen [48].
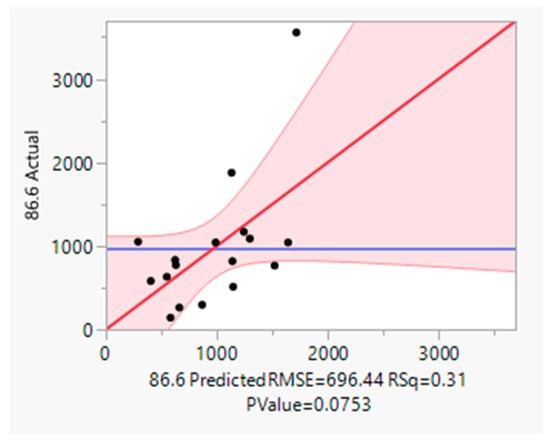
Figure 9.
Multivariate analysis of Brockway Avenue UFP concentration with a Pearson correlation coefficient (R) of 0.77 (reaching its maximum correlation coefficient value for particle counts in the 86.6 nm size bin).
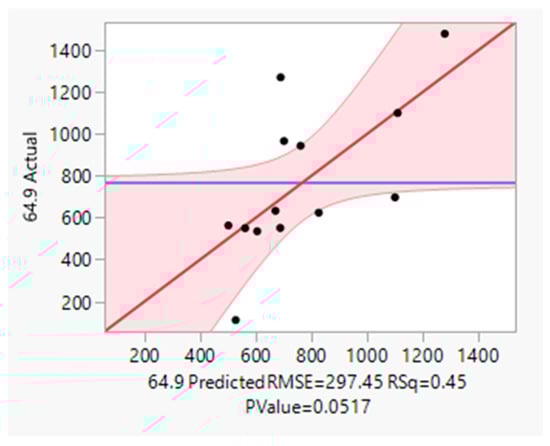
Figure 10.
Multivariate analysis of Beechurst Avenue UFP concentration with a Pearson correlation coefficient (R) of 0.4 (reaching its maximum correlation coefficient value for particle counts in the 64.9 nm size bin).
The multivariate analysis of the combined variables of the number of trucks and speed of trucks result in a statistically significant correlation (p < 0.05) with the particle count from specific bins (particle sizes) shown in Figure 9 and Figure 10 at each of the two sampling sites, as seen in Table 3.
Table 3.
Multivariate regression analysis for number and speed of trucks at both sampling sites. (* means that value has a probability of p < 0.05).
4. Discussion
This study’s findings provide reasonable evidence to conclude that further study may be warranted to better understand how the number of trucks may significantly impact the correlation between speed and particle concentration, particularly for the UFP size range factor, in determining the concentration of UFPs close to roads. The difference between Brockway Avenue and Beechurst Avenue, the two sampling locations, was noted for the entire UFP size range counts on the NanoScan. Truck activity was responsible for 60.35% of the variation in UFP concentration at Brockway according to the correlation between truck count and 15.4 nm UFP particle concentration (Figure 3). This result is consistent with previous studies showing that emissions from diesel engines are the main source of ultrafine particles, especially in regions with high truck traffic [49]. The increased loading of on-road trucks also directly influences engine operation by raising the torque demand required to maintain truck momentum. This higher torque demand necessitates greater fuel injection rates and may also alter injection timing, both of which significantly affect the combustion process and emissions [50].
The study’s central hypothesis that heavy-duty diesel truck activity increases UFP levels in near-road environments was also supported by the Beechurst results, which showed a positive correlation between truck count and UFP concentrations. By demonstrating that truck traffic is a strong predictor of local air pollution, a crucial component in evaluating the public health concerns associated with diesel emissions, this study advances the larger research goal.
Due to significant roadway variations, the correlation at Beechurst Avenue was weaker than at Brockway Avenue. The extent of UFP pollution elevation caused by terrain is one important issue. The uphill and downhill movement of diesel trucks at Brockway Avenue in steep terrain affects UFP emissions and accumulation, so topography is significant in this research field. Trucks need greater engine power when they ascend steep slopes, which causes more fuel combustion and higher UFP concentrations in complex terrains. The increased loading of on-road trucks directly influences engine operation by raising the torque demand required to maintain truck momentum. This higher torque demand necessitates greater fuel injection rates and may also alter injection timing, both of which significantly affect the combustion process and emissions [50].
Beechurst benefits from easier truck mobility and a smoother traffic flow due to its flat topography and improved road conditions because the flat terrain promotes natural air flow and helps to efficiently dilute emissions. Enhanced road conditions permit the better dispersion of pollutants. UFP pollutants are more effectively dispersed at Beechurst than at Brockway, which has rougher roads and a more complex topography. The overall concentration of ultrafine particles (UFPs) is lower even though truck emissions continue to contribute to UFP concentrations.
Despite these variations, Beechurst’s positive correlation nevertheless supports the study’s methodology and emphasizes the steady influence of diesel truck emissions on UFP pollution. The results highlight how crucial it is to take site-specific topographical aspects into account when assessing the quality of the air close to roads.
The Multiple-Path Particle Dosimetry (MPPD) model [46] yields similar estimates to those provided previously by Stahlhofen et al. [44] that offers a vital framework for analyzing the deposition of ultrafine particulate matter across various regions of the human respiratory system. The results from Brockway and Beechurst, as indicated by their respective particle size distributions, have significant implications for inhalation exposure and potential health risks. The similarity in particle size distributions between these two locations suggests a potentially easy applicability of the UFP techniques described herein in source characterization, atmospheric transformation processes, dispersion mechanisms, all of which directly impact where and how these particles deposit within the lungs.
These smaller particles exhibit higher deposition efficiencies in the alveolar region of the lungs, which is the deepest portion of the respiratory tract where gas exchange occurs. Due to their small size, these particles have a greater likelihood of translocating across the alveolar epithelium into the bloodstream, leading to systemic health effects such as oxidative stress, cardiovascular disease, and neuroinflammation [51]. The MPPD model predicts that a significant proportion of these sub-30 nm particles will evade upper airway filtration and penetrate deep into the lung tissue, thereby increasing the risk of adverse respiratory and cardiovascular outcomes.
In understanding the need to spend the extra effort to calculate dose, it appears that Beechurst exhibited a particle size distribution that is slightly shifted toward larger UFPs, with a peak around 0.03 µm. This shift suggests that the aerosols at Beechurst may have undergone some degree of atmospheric aging, possibly through coagulation or agglomeration, that led to an increase in particle size. The appearance of these larger UFPs in the 30–100 nm range can therefore be believed to have different deposition characteristics compared with smaller UFPs. According to the lung dose model, these particles might be considered more likely to deposit in the tracheobronchial and extra thoracic regions, meaning they are more effectively removed by mucociliary clearance mechanisms before reaching the deep lung [52]. However, when performing the actual calculations, there was not a true difference in dose between the two sites. Deposition was nearly identical, as was dose (note the lack of significant difference between the two regression lines in Figure 6). Initial appearances did not eliminate health concerns. Dose is the bottom line, and it should be calculated. The minor differences in the deposition patterns between Brockway and Beechurst highlight the possibility that significant differences in site-specific factors may not result in actual health risk differences. In essence, by integrating particle size distribution lung deposition data with MPPD-type models, researchers can improve the accuracy of exposure assessments and develop more targeted mitigation strategies.
In general, the application of a lung deposition model to the Brockway and Beechurst data has provided valuable insights into the respiratory deposition dynamics of UFPs in different topographical settings. Understanding these patterns is essential for developing effective public health policies aimed at minimizing exposure risks and mitigating the long-term health effects associated with ultrafine particulate pollution.
5. Conclusions
The findings of this study demonstrate that diesel truck count has a linear relationship with truck speed and yields a possible surrogate measure of the lung dose of UFP number concentration using video information alone. However, the findings also show that topography significantly influences UFP concentration as trucks move uphill and downhill in complex terrain environments (with speed as an obvious covariant). Valleys and complex terrain contribute to the higher retention of UFPs due to truck speed, road conditions, and traffic conditions compared with flatter regions where the road conditions and topography are more likely to produce dilution. The takeaway lesson for pollution control is obviously to have truck routes that allow for quicker transit, especially through potentially heavily populated areas (either by themselves or in combination with just avoiding heavily populated areas to reduce the number of people at risk from exposure). For future studies that plan to address the issue of UFP exposure, the findings also show that the integration of truck count and UFP monitoring can provide a cost-effective methodology that can be applied with only a few hours of preliminary sampling at various roadway settings, including dose estimation from particle size estimates, to better understand and mitigate public health risks from diesel emissions.
With respect to the current study, the particle size distribution analysis revealed that both Brockway Avenue and Beechurst Avenue had similar amounts of deposition and dose. This makes it possible that video imaging and truck count may be useful in health effect epidemiology studies needing UFP dose estimation to determine localized exposures to heavy-duty trucking along regular truck routes. The integration of the NanoScan particle size distribution data with the lung deposition model provided a detailed assessment of how ultrafine particles were deposited in the human respiratory tract. These findings may help in understanding site-specific inhalation risks and inform targeted air pollution control strategies. In general, by applying a physiologically relevant lung deposition model, this study enhances the accuracy of exposure assessments and supports health risk evaluation for populations exposed to diesel-related UFP emissions.
Limitations and Future Directions
As evidenced in the above findings, Appalachian-type settings, especially those in developed nations like the United States, are currently well-placed to allow for reliable estimations of current UFP levels and the appropriate measures that need to be taken to control exposure. However, the measurement and tracking of UFPs remain a major challenge, largely due to a lack of technical standardization and clear guidelines. The lack of clear guidelines tends to hamper policy development, highlighting the need for future research to create comprehensively new ambient UFP particle estimations and, in turn, better standards for regulation. As part of this initiative, we collaborated with the Mechanical Engineering Department to work on analyzing how engine design, loading conditions, truck speed, and uphill or downhill movement affect ultrafine particle concentrations across varying topographies using multivariate analyses. Evidence of the role of topography, as noted earlier, is still limited despite the inherent health risks associated with UFP exposure in low-lying areas.
Using one single location (Morgantown, WV) with less than 2 weeks of sampling, as was done here, will not ultimately be sufficient. Concentrations of ultrafine particles in complex terrains and inclines can be significantly more variable and have potentially higher exposure. Should weather conditions develop to trap UFPs, an issue arises that must be taken into consideration when assessing regional exposure risk and the potential for public health issues with these particles. We were able to choose sunny, light wind and dry conditions for our short sampling times. Fog-inducing valley stagnations are often apparent at the two sampling sites. Morgantown is a topographic twin located just upstream from Donora, PA, site of one of the historic examples of valley stagnation. Appalachia hosts a bounty of similar sites with similar opportunities for similar environmental calamities and poses significant potential for understanding those risks.
Also, we tested only one sampling integration period of 15 min. While we do not believe this is an important consideration, future testing should include variable integration times to ascertain the validity of that assumption. This multidisciplinary approach will help researchers further understand the role of traffic conditions such as uphill and downhill truck movement and truck characteristics such as engine size, speed, and loading condition in UFP emissions, as well as their distribution in different topographical settings.
We are suggesting the conduction of a health effect study to assess the impact of these particles on public health using the method we have described herein with the goal of establishing a dose-exposure limit. More research into UFP emissions in different environments is essential in accurately determining levels of exposure and potential health risks. More importantly, such research will provide valuable insights for developing strategies to mitigate UFP pollution in areas with diverse topographical features.
Author Contributions
Conceptualization, N.O.I., O.A.T. and M.M.; methodology, N.O.I.; software, B.R.; validation, N.O.I. and B.R.; formal analysis, N.O.I.; investigation, N.O.I.; resources, M.M.; data curation, N.O.I.; writing—original draft preparation, N.O.I.; writing—review and editing, M.M., T.K. and A.C.N.; visualization, M.M.; supervision, A.C.N., S.W., T.K., M.C. and M.M.; project administration, R.M. All authors have read and agreed to the published version of the manuscript.
Funding
This research received no external funding.
Institutional Review Board Statement
Not applicable.
Informed Consent Statement
Not applicable.
Data Availability Statement
The data, in particular the video data, presented in this study are available on request from the corresponding author. The data are not publicly available due to uncertainty of displaying license plates without them being blurred which would have to be requested with longer response delays if truck count checks are desired.
Acknowledgments
The authors wish to acknowledge the support of the West Virginia University and its School of Public Health for their administrative and financial support of the first author during the course of this research as well as providing the equipment, sampling locations and laboratory space as well as the oversight of the faculty from both the West Virginia University and the University of Pittsburgh School of Public Health and the Benjamin M. Statler College of Engineering and Mineral Resources.
Conflicts of Interest
There are no conflicts of interest.
Abbreviations
The following abbreviations are used in this manuscript:
| MPPD | Multiple-Path Particle Dosimetry model for particle deposition |
| R | Pearson correlation coefficient |
| UFP | Ultrafine Particle (a particle less than 0.1 µm) |
References
- Marcella, S.; Apicella, B.; Secondo, A.; Palestra, F.; Opromolla, G.; Ciardi, R.; Tedeschi, V.; Ferrara, A.L.; Russo, C.; Galdiero, M.R.; et al. Size-based effects of anthropogenic ultrafine particles on activation of human lung macrophages. Environ. Int. 2022, 166, 107395. [Google Scholar] [CrossRef] [PubMed]
- Ali, M.U.; Lin, S.; Yousaf, B.; Abbas, Q.; Munir, M.A.M.; Rashid, A.; Zheng, C.; Kuang, X.; Wong, M.H. Pollution characteristics, mechanism of toxicity and health effects of the ultrafine particles in the indoor environment: Current status and future perspectives. Crit. Rev. Environ. Sci. Technol. 2022, 52, 436–473. [Google Scholar] [CrossRef]
- Calderón-Garcidueñas, L.; Ayala, A. Air Pollution, Ultrafine Particles, and Your Brain: Are Combustion Nanoparticle Emissions and Engineered Nanoparticles Causing Preventable Fatal Neurodegenerative Diseases and Common Neuropsychiatric Outcomes? Environ. Sci. Technol. 2022, 56, 6847–6856. [Google Scholar] [CrossRef]
- Presto, A.A.; PSaha, K.; Robinson, A.L. Past, present, and future of ultrafine particle exposures in North America. Atmos. Environ. X 2021, 10, 100109. [Google Scholar] [CrossRef]
- Bergmann, M.L.; Andersen, Z.J.; Massling, A.; Kindler, P.A.; Loft, S.; Amini, H.; Cole-Hunter, T.; Guo, Y.; Maric, M.; Nordstrøm, C.; et al. Short-term exposure to ultrafine particles and mortality and hospital admissions due to respiratory and cardiovascular diseases in Copenhagen, Denmark. Environ. Pollut. 2023, 336, 122396. [Google Scholar] [CrossRef]
- Kwon, H.-S.; Ryu, M.H.; Carlsten, C. Ultrafine particles: Unique physicochemical properties relevant to health and disease. Exp. Mol. Med. 2020, 52, 318–328. [Google Scholar] [CrossRef]
- McCawley, M.A. Does increased traffic flow around unconventional resource development activities represent the major respiratory hazard to neighboring communities? Knowns and unknowns. Curr. Opin. Pulm. Med. 2017, 23, 161–166. [Google Scholar] [CrossRef]
- Moreira, F.M.R.d.S. Ultrafine Particles: World Characterization, Occupational Assessment and Effects on Human Health; Universidade Fernando Pessoa: Porto, Portugal, 2023. [Google Scholar]
- Lewis, A.; Carslaw, D.; Moller, S.J. Ultrafine Particles (UFP) in the UK; Research Report; Defra: London, UK, 2018. [Google Scholar]
- Christian, W.J.; Flunker, J.; May, B.; Westneat, S.; Sanderson, W.T.; Schoenberg, N.; Browning, S.R. Adult asthma associated with roadway density and housing in rural Appalachia: The Mountain Air Project (MAP). Environ. Health 2023, 22, 28. [Google Scholar] [CrossRef]
- Chauhan, B.V.S.; Corada, K.; Young, C.; Smallbone, K.L.; Wyche, K.P. Review on Sampling Methods and Health Impacts of Fine (PM2.5, ≤2.5 µm) and Ultrafine (UFP, PM0.1, ≤0.1 µm) Particles. Atmosphere 2024, 15, 572. [Google Scholar] [CrossRef]
- Ohlwein, S.; Kappeler, R.; Joss, M.K.; Künzli, N.; Hoffmann, B. Health effects of ultrafine particles: A systematic literature review update of epidemiological evidence. Int. J. Public Health 2019, 64, 547–559. [Google Scholar] [CrossRef]
- Vaze, N.; Calderon, L.; Tsiodra, I.; Mihalopoulos, N.; Serhan, C.N.; Levy, B.D.; Demokritou, P. Assessment of the Physicochemical Properties of Ultrafine Particles (UFP) from Vehicular Emissions in a Commercial Parking Garage: Potential Health Implications. Toxics 2024, 12, 833. [Google Scholar] [CrossRef] [PubMed]
- Rajagopal, K.; Ramachandran, S.; Mishra, R.K. Seasonal variation of particle number concentration in a busy urban street with exposure assessment and deposition in human respiratory tract. Chemosphere 2024, 366, 143470. [Google Scholar] [CrossRef] [PubMed]
- Smichowski, P.; Gómez, D. An overview of natural and anthropogenic sources of ultrafine airborne particles: Analytical determination to assess the multielemental profiles. Appl. Spectrosc. Rev. 2023, 59, 355–381. [Google Scholar] [CrossRef]
- Groma, V.; Alföldy, B.; Börcsök, E.; Czömpöly, O.; Füri, P.; Kéri, A.H.; Kovács, G.; Török, S.; Osán, J. Sources and health effects of fine and ultrafine aerosol particles in an urban environment. Atmos. Pollut. Res. 2022, 13, 101302. [Google Scholar] [CrossRef]
- Hopke, P.K.; Feng, Y.; Dai, Q. Source apportionment of particle number concentrations: A global review. Sci. Total Environ. 2022, 819, 153104. [Google Scholar] [CrossRef]
- Saha, P.K.; Hankey, S.; Marshall, J.D.; Robinson, A.L.; Presto, A.A. High-Spatial-Resolution Estimates of Ultrafine Particle Concentrations across the Continental United States. Environ. Sci. Technol. 2021, 55, 10320–10331. [Google Scholar] [CrossRef] [PubMed]
- Dong, J.; Li, J.; Tian, L.; Tu, J. Transport and deposition of ultrafine particles in the upper tracheobronchial tree: A comparative study between approximate and realistic respiratory tract models. Comput. Methods Biomech. Biomed. Engin 2021, 24, 1125–1135. [Google Scholar] [CrossRef]
- Zhai, J.; Shao, S.; Yang, X.; Zeng, Y.; Fu, T.-M.; Zhu, L.; Shen, H.; Ye, J.; Wang, C.; Tao, S. Chemically Resolved Respiratory Deposition of Ultrafine Particles Characterized by Number Concentration in the Urban Atmosphere. Environ. Sci. Technol. 2024, 58, 16507–16516. [Google Scholar] [CrossRef]
- Vallabani, N.S.; Gruzieva, O.; Elihn, K.; Juárez-Facio, A.T.; Steimer, S.S.; Kuhn, J.; Silvergren, S.; Portugal, J.; Piña, B.; Olofsson, U.; et al. Toxicity and health effects of ultrafine particles: Towards an understanding of the relative impacts of different transport modes. Environ. Res. 2023, 231 Pt 2, 116186. [Google Scholar] [CrossRef]
- Robinson, P.D.; Salimi, F.; Cowie, C.T.; Clifford, S.; King, G.G.; Thamrin, C.; Hardaker, K.; Mazaheri, M.; Morawska, L.; Toelle, B.G.; et al. Ultrafine particle exposure and biomarkers of effect on small airways in children. Environ. Res. 2022, 214, 113860. [Google Scholar] [CrossRef]
- Agache, I.; Eguiluz-Gracia, I.; Cojanu, C.; Laculiceanu, A.; del Giacco, S.; Zemelka-Wiacek, M.; Kosowska, A.; Akdis, C.A.; Jutel, M. Advances and highlights in asthma in 2021. Allergy 2021, 76, 3390–3407. [Google Scholar] [CrossRef] [PubMed]
- Andersen, M.H.G.; Saber, A.T.; Frederiksen, M.; Clausen, P.A.; Sejbaek, C.S.; Hemmingsen, C.H.; Ebbehøj, N.E.; Catalán, J.; Aimonen, K.; Koivisto, J.; et al. Occupational exposure and markers of genetic damage, systemic inflammation and lung function: A Danish cross-sectional study among air force personnel. Sci. Rep. 2021, 11, 17998. [Google Scholar] [CrossRef]
- Turner, A.; Brokamp, C.; Wolfe, C.; Reponen, T.; Ryan, P. Personal exposure to average weekly ultrafine particles, lung function, and respiratory symptoms in asthmatic and non-asthmatic adolescents. Environ. Int. 2021, 156, 106740. [Google Scholar] [CrossRef] [PubMed]
- Wright, R.J.; Hsu, H.-H.L.; Chiu, Y.-H.M.; Coull, B.A.; Simon, M.C.; Hudda, N.; Schwartz, J.; Kloog, I.; Durant, J.L. Prenatal Ambient Ultrafine Particle Exposure and Childhood Asthma in the Northeastern United States. Am. J. Respir. Crit. Care Med. 2021, 204, 788–796. [Google Scholar] [CrossRef]
- Sivakumar, B.; Kurian, G.A. Exposure to real ambient particulate matter inflicts cardiac electrophysiological disturbances, vascular calcification, and mitochondrial bioenergetics decline more than diesel particulate matter: Consequential impact on myocardial ischemia-reperfusion injury. Environ. Sci. Pollut. Res. 2023, 30, 97518–97530. [Google Scholar]
- Lachowicz, J.I.; Gać, P. Short- and Long-Term Effects of Inhaled Ultrafine Particles on Blood Pressure: A Systematic Review and Meta-Analysis. J. Clin. Med. 2024, 13, 6802. [Google Scholar] [CrossRef] [PubMed]
- Qi, Q.; Yu, F.; Nair, A.A.; Lau, S.S.; Luo, G.; Mithu, I.; Zhang, W.; Li, S.; Lin, S. Hidden danger: The long-term effect of ultrafine particles on mortality and its sociodemographic disparities in New York State. J. Hazard. Mater. 2024, 471, 134317. [Google Scholar] [CrossRef]
- Zhang, S.; Breitner, S.; Pickford, R.; Lanki, T.; Okokon, E.; Morawska, L.; Samoli, E.; Rodopoulou, S.; Stafoggia, M.; Renzi, M.; et al. Short-term effects of ultrafine particles on heart rate variability: A systematic review and meta-analysis. Environ. Pollut. 2022, 314, 120245. [Google Scholar] [CrossRef]
- Carnerero Quintero, C. Dynamics of Ultrafine Particles and Tropospheric Ozone Episodes. Ph.D. Thesis, Universitat Politècnica de Catalunya, Barcelona, Spain, 2021. [Google Scholar] [CrossRef]
- Tran, K.L. Air Pollution in Different Microenvironments in Vietnam. Ph.D. Thesis, Queensland University of Technology, Brisbane, Australia, 2022. [Google Scholar]
- Lv, W.; Wu, Y.; Zang, J. A Review on the Dispersion and Distribution Characteristics of Pollutants in Street Canyons and Improvement Measures. Energies 2021, 14, 6155. [Google Scholar] [CrossRef]
- Henderson, M.R. Characterization of Scanning Mobility Particle Sizers for Use with Nanoaerosols. Ph.D. Thesis, University of South Florida, Tampa, FL, USA, 2018. [Google Scholar]
- Duelge, K.; Mulholland, G.; Zachariah, M.; Hackley, V.A. Accurate Nanoparticle Size Determination using Electrical Mobility Measurements in the Step and Scan Modes. Aerosol Sci. Technol. 2022, 56, 1096–1113. [Google Scholar] [CrossRef]
- Goodsite, M.E.; Hertel, O.; Johnson, M.S.; Jørgensen, N.R.; Johnson, M.S. Urban Air Quality: Sources and Concentrations. In Air Pollution Sources, Statistics and Health Effects; Goodsite, M.E., Johnson, M.S., Hertel, O., Eds.; Springer: New York, NY, USA, 2021; pp. 193–214. [Google Scholar]
- Kuang, A.S.C. Scanning Mobility Particle Sizer (SMPS) Instrument Handbook; DOE/SC-ARM-TR-147; U.S. Department of Energy, Atmospheric Radiation Measurement User Facility: Richland, WA, USA, 2024. [Google Scholar]
- Yuan, Y.; Yu, T.; Yang, Y.; Gui, H.; Liu, J. Design and Experimental Validation of a High-Resolution Nanoparticle Differential Mobility Analyzer. Instrum. Exp. Tech. 2023, 66, 649–660. [Google Scholar] [CrossRef]
- Jakubiak, S.; Oberbek, P. Determination of the Concentration of Ultrafine Aerosol Using an Ionization Sensor. Nanomaterials 2021, 11, 1625. [Google Scholar] [CrossRef] [PubMed]
- TSI. Nanoscan SMPS Nanoparticle Sizer Model 3910, Expanding Nanoparticle Measurement Capabilities. 2023. Available online: https://tsi.com/getmedia/b2cdf436-3299-496e-b067-59bc18937e76/NanoScan_SMPS_Theory_of_Operation_US_SMPS-005A-web?ext=.pdf (accessed on 10 June 2025).
- Shirman, T.; Shirman, E.; Liu, S. Evaluation of Filtration Efficiency of Various Filter Media in Addressing Wildfire Smoke in Indoor Environments: Importance of Particle Size and Composition. Atmosphere 2023, 14, 1729. [Google Scholar] [CrossRef]
- Liati, A.; Schreiber, D.; Dasilva, Y.A.R.; Eggenschwiler, P.D. Ultrafine particle emissions from modern Gasoline and Diesel vehicles: An electron microscopic perspective. Environ. Pollut. 2018, 239, 661–669. [Google Scholar] [CrossRef] [PubMed]
- Patra, A.K.; Kolluru, S.S.R.; Penchala, A.; Kumar, S.; Mishra, N.; Sree, N.B.; Santra, S.; Dubey, R. Assessment of seasonal variability of PM, BC and UFP levels at a highway toll stations and their associated health risks. Environ. Res. 2024, 245, 118028. [Google Scholar]
- Stahlhofen, W.; Rudolf, G.; James, A.C. Intercomparison of Experimental Regional Aerosol Deposition Data. J. Aerosol Med. 1989, 2, 285–308. [Google Scholar] [CrossRef]
- Hewett, P. Limitations in the Use of Particle Size-Selective Sampling Criteria in Occupational Epidemiology. Appl. Occup. Environ. Hyg. 1991, 6, 290–300. [Google Scholar] [CrossRef]
- Borisova, A.; Rudus, K.; Pavlovska, I.; Martinsone, Ž.; Mārtiņsone, I. Multiple path particle dosimetry model concept and its application to determine respiratory tract hazards in the 3d printing. In Environment. Technologies. Resources. Proceedings of the International Scientific and Practical Conference; RTU Rezekne Academy: Rēzekne, Latvia, 2023; Volume 2, pp. 23–27. [Google Scholar]
- Balmes, J.R.; Hansel, N.N. Tiny Particles, Big Health Impacts. Am. J. Respir. Crit. Care Med. 2024, 210, 1291–1292. [Google Scholar] [CrossRef]
- Cohen, J. Statistical Power Analysis for the Behavioral Sciences, 2nd ed.; Lawrence Erlbaum Associates: Hillsdale, NJ, USA, 1988. [Google Scholar]
- Campagnolo, D.; Cattaneo, A.; Corbella, L.; Borghi, F.; Del Buono, L.; Rovelli, S.; Spinazzé, A.; Cavallo, D.M. In-vehicle airborne fine and ultra-fine particulate matter exposure: The impact of leading vehicle emissions. Environ. Int. 2019, 123, 407–416. [Google Scholar] [CrossRef]
- Kittelson, D.B. Ultrafine Particle Emission & Control Strategies, in South Coast Air Quality Management District Conference on Ultrafine Particles: The Science, Technology, and Policy Issues; Wilshire Grand Hotel: Los Angeles, CA, USA, 2006. [Google Scholar]
- Hussain, R.; Graham, U.; Elder, A.; Nedergaard, M. Air pollution, glymphatic impairment, and Alzheimer's disease. Trends Neurosci. 2023, 46, 901–911. [Google Scholar] [CrossRef]
- Dong, J.; Shang, Y.; Tian, L.; Inthavong, K.; Qiu, D.; Tu, J. Ultrafine particle deposition in a realistic human airway at multiple inhalation scenarios. Int. J. Numer. Method. Biomed. Eng. 2019, 35, e3215. [Google Scholar] [CrossRef] [PubMed]
Disclaimer/Publisher’s Note: The statements, opinions and data contained in all publications are solely those of the individual author(s) and contributor(s) and not of MDPI and/or the editor(s). MDPI and/or the editor(s) disclaim responsibility for any injury to people or property resulting from any ideas, methods, instructions or products referred to in the content. |
© 2025 by the authors. Licensee MDPI, Basel, Switzerland. This article is an open access article distributed under the terms and conditions of the Creative Commons Attribution (CC BY) license (https://creativecommons.org/licenses/by/4.0/).