Article

The Impact of Seasonality on Air Quality in Terms of Pollution with Substances Hazardous to the Environment

by
Małgorzata Kida
* and
Sabina Ziembowicz
Department of Chemistry and Environmental Engineering, Faculty of Civil and Environmental Engineering and Architecture, Rzeszow University of Technology, Ave Powstańców Warszawy 6, 35-959 Rzeszów, Poland
*
Author to whom correspondence should be addressed.
Appl. Sci. 2025, 15(12), 6551; https://doi.org/10.3390/app15126551
Submission received: 16 April 2025 / Revised: 8 June 2025 / Accepted: 9 June 2025 / Published: 10 June 2025
(This article belongs to the Special Issue Advances in Air Pollution Detection and Air Quality Research)

Abstract

:

Featured Application

Analysis of seasonal patterns in particulate matter emissions enables the forecasting of PM concentration changes and air quality. It also facilitates the identification of factors influencing their variability and potential health impacts, thereby supporting preventive actions and effective air quality management.

Abstract

The study presents an analysis of the concentrations of polycyclic aromatic hydrocarbons (PAHs) and particulate matter with a diameter of less than 10 µm (PM10) in the air across various locations, as well as their impact on human health. Research in this area was conducted at eight stations as part of the national environmental monitoring system run in Poland by the Chief Inspectorate for Environmental Protection. Daily measurement data of PM10 and the concentrations of PAHs associated with these particles were analyzed for the period from January to December 2023. The results showed that pollutant concentrations in the atmosphere vary depending on location, season, and meteorological conditions. The highest concentrations were observed during the winter season, when the combustion of solid fuels increases, while the lowest concentrations were recorded in the summer. The total concentration of PAHs ranged from 0.35 to 34.50 ng/m3. The annual average concentration of PM10 at the analyzed stations was 19.29 ± 3.01 µg/m3. Principal component analysis indicated that PAHs in the air primarily originate from emissions related to transportation, biomass combustion, and industry. Furthermore, the estimated health risk, considering the Incremental Lifetime Cancer Risk (ILCR) index, showed that the risk of cancer associated with inhaling PAHs by children and adults did not exceed the permissible limits. The main contributor to the total carcinogenic activity of the PAH mixture was benzo(b)fluorantene (BbF) (31.5%), followed by benzo(a)pyrene (BaP) (5.5%), indeno(1,2,3-cd)pyrene (IP) (18.2%), benzo(j)fluorantene (BjF) (12.9%), benzo(k)fluorantene (BkF) (8.5%), benzo(a)anthracene (BaA) (2.5%), and dibenzo(a,h)anthracene (DBahA) (1.0%).

1. Introduction

Atmospheric pollution, particularly particulate matter (PM) and PAHs, poses one of the most significant environmental threats to ecosystems and human health. The International Agency for Research on Cancer (IARC) [1] has classified air pollution and particulate matter as carcinogenic to humans. Air pollution causes more than six million premature deaths worldwide each year [2,3,4,5]. People exposed to high levels of PM10 are at increased risk of chronic respiratory diseases, lung cancer, and cardiovascular disease. The health effects of PM10 are related to the chemical composition of the particles, mainly toxic heavy metals and PAHs. These substances undergo adsorption on the surface of dust particles due to their physicochemical properties, such as the hydrophobicity of PAHs and the ability of heavy metals to form bonds with functional groups present on the particle surfaces. Adsorption facilitates their transport in the atmosphere and affects the persistence and toxicity of these pollutants [5].
Particulate matter in the atmosphere is a heterogeneous, complex mixture of organic and inorganic compounds originating from both natural and anthropogenic sources. PM10 is most commonly emitted into the air from opencast mines. Its chemical composition can vary significantly depending on location, season, source type, and atmospheric processes [3,4]. The chemical composition of PM determines such physical properties of PM as surface area, density, optical properties, and hygroscopicity. These properties are responsible for the impact of atmospheric aerosol on the Earth’s radiation balance, atmospheric precipitation, cloud processes, heterogeneous chemical reactions, and human health [3,5,6,7].
The concentrations of PAHs associated with PM in the air are subject to very marked spatial and seasonal fluctuations; these changes are rarely proportional to the changes in PM concentration in the air. They are influenced not only by differences in PAH emissions in different areas and seasons, but also by meteorological conditions and the fractional and chemical composition of PM of different fractions. PAHs are produced during the incomplete combustion and pyrolysis of organic substances, as well as from unrefined petroleum products. The primary sources of PAHs are anthropogenic, particularly traffic emissions, residential heating, biomass burning, and industrial processes [3]. For this reason, there is a need to conduct detailed studies on the relationships between PAH concentrations and particulate matter at specific locations in order to better understand the mechanisms of their formation and dispersion, which will enable more effective prevention and reduction in emissions of these harmful compounds.
These compounds are widely distributed in the atmosphere, and their toxicity varies: as the molecular weight of PAHs increases, so does their carcinogenicity, although their acute toxicity decreases. Inhalation of atmospheric PAHs can contribute to respiratory issues, impair lung function, and increase the risk of bronchitis [1,2,3,4,5,6,7]. Among the PAHs with known carcinogenic and teratogenic effects are benz(a)anthracene (BaA), benzo(b)fluoranthene (BbF), benzo(j)fluoranthene (BjF), benzo(k)fluoranthene (BkF), benzo(a)pyrene (BaP), indeno(1,2,3-cd)pyrene (IP), and dibenz(a,h)anthracene (DBahA) [7,8,9,10,11,12]. While sixteen PAHs have been designated as priority pollutants by the U.S. Environmental Protection Agency (U.S. EPA), many other PAHs are present in the environment, with limited research into their carcinogenic properties [8,9]. Eastern Europe bears the highest health burden from air pollution—both in terms of premature deaths and cardiovascular disease [13].
In many Central and Eastern European countries, industrial and energy infrastructure development relies heavily on solid fuels, which influences the seasonal distribution of particulate emissions. Like in Poland, these countries experience the highest particulate concentrations during winter months [6,12,13]. This pattern is expected to be similar across Central and Eastern Europe, where the “heating season” causes a seasonal rise in air pollution levels, mirroring the situation in Poland. Seasonal variations in pollutant concentrations are driven by several factors. In warmer months, higher temperatures promote the presence of pollutants in vapor form. During winter, emissions increase significantly due to the intensive burning of fossil fuels and biomass for residential heating. Additionally, winter atmospheric conditions, such as reduced air dispersion and a lower atmospheric mixing height, lead to a greater accumulation of pollutants. Lower temperatures in colder months also favor the condensation of PAHs onto atmospheric particulate matter. Moreover, photolysis and photochemical degradation of pollutants are limited in winter due to lower temperatures, reduced sunlight, and decreased levels of atmospheric oxidants. Local meteorological conditions, particularly wind direction and speed, have a significant impact on seasonal and daily variations in air quality, as they determine the dispersion, accumulation, and transport of atmospheric pollutants. In winter, low temperatures, weak winds, and frequent temperature inversions limit pollutant dispersion, leading to their accumulation near the ground. In summer, higher temperatures and stronger air circulation promote better atmospheric mixing and the dispersion of pollutants [3,5,6,13,14].
The aim of this study was to thoroughly examine and understand the impact of seasonal changes in particulate emissions on air quality and public health, taking into account the climatic specifics of Poland. The analysis conducted included: (a) the identification and evaluation of seasonal patterns in PMs content using Poland as a case study, which allowed for the estimation that countries with similar geographical latitude and continental climates, may exhibit similar trends in seasonal variations in particulate concentrations and air quality; (b) the assessment of health risks associated with prolonged exposure to PM10 and PAH pollutants, considering the seasonal variability in their concentrations, which offers a new perspective on health risks related to different times of the year; (c) the analysis of the relationships and correlations between PM10 and PAH concentrations and other environmental and meteorological parameters, which enabled a deeper understanding of the interactions between these substances, as well as the identification of factors that may intensify or mitigate their impact on health.

2. Methodology

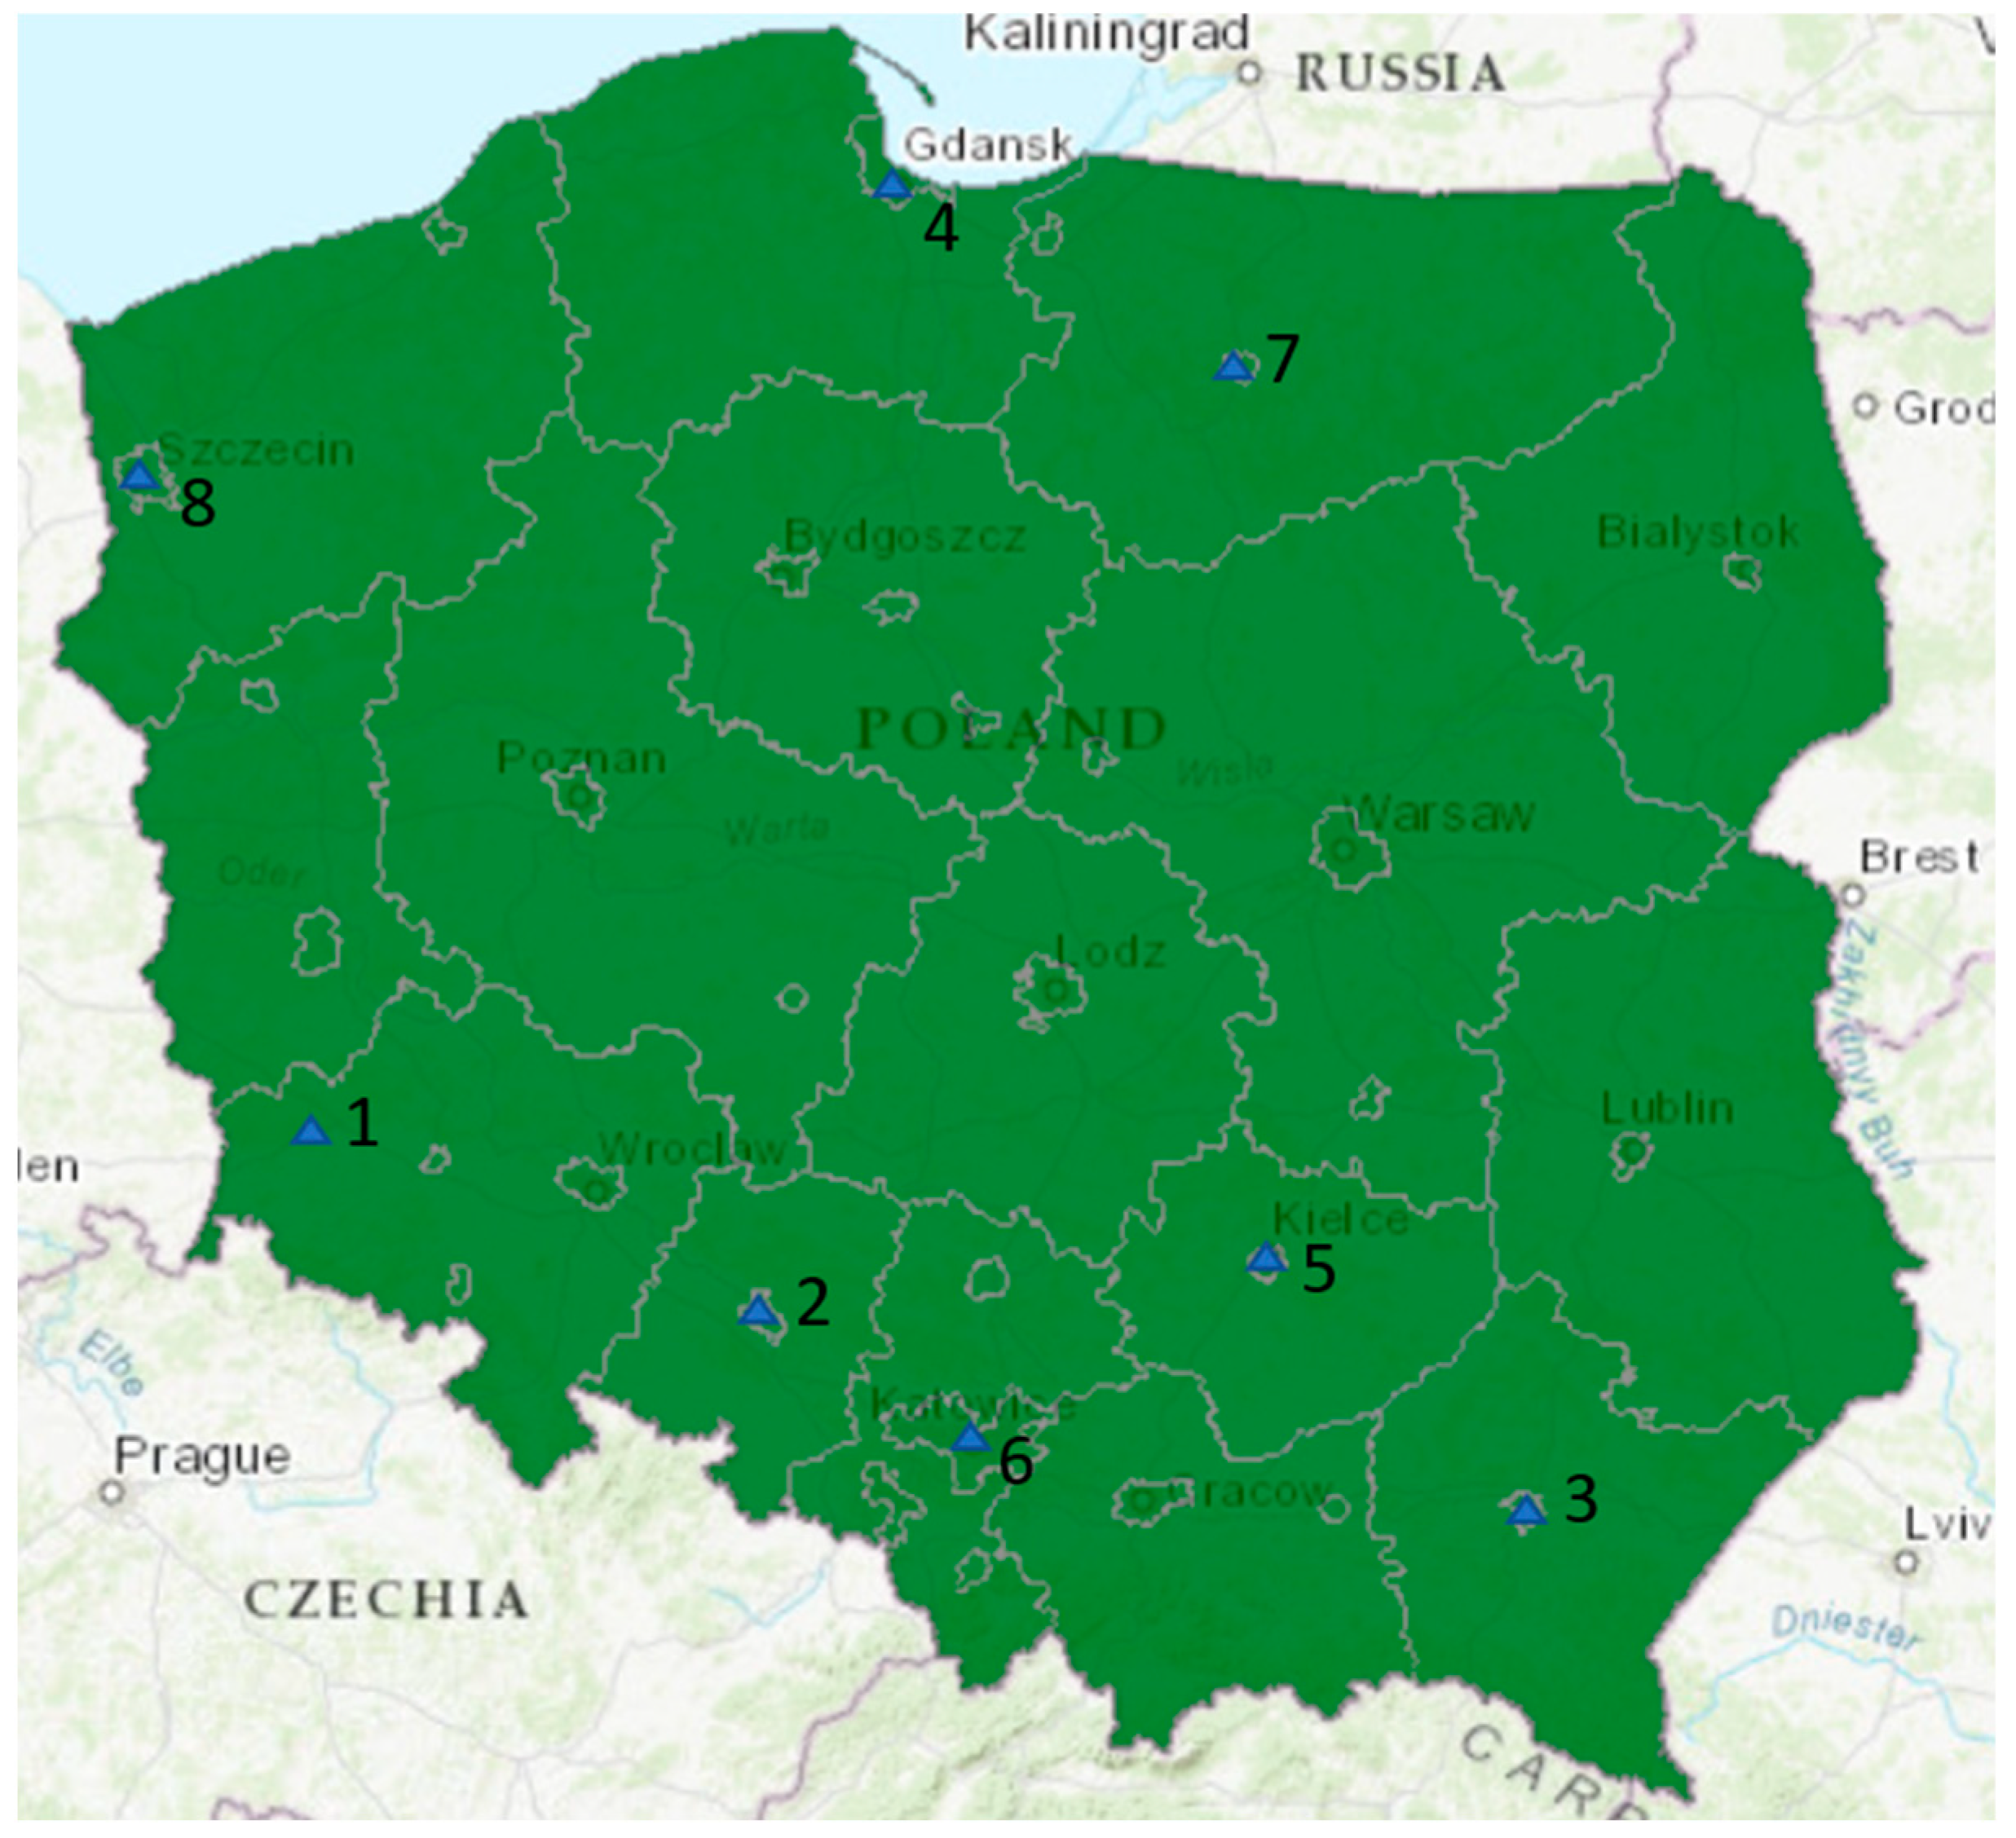
2.1. Monitoring Sites

The results of the study on the concentration of PM10 and PAHs included data from 8 monitoring stations representing different regions of Poland. Data on the amount of collected PM10 and the concentration of PAHs (benzo(a)pyrene, benzo(a)anthracene, benzo(b)fluoranthene, benzo(j)fluoranthene, benzo(k)fluoranthene, indeno(1,2,3-cd)pyrene, and dibenzo(a,h)anthracene) were obtained from the database of the Chief Inspectorate of Environmental Protection [15].
Research in this area is conducted at rural background stations as part of the national environmental monitoring system. Daily measurement data for PM10 concentrations from January to December 2023 were collected from 8 monitoring and control stations (Figure 1, Table S1, Supplementary Materials).

2.2. Measurement Method

The research is based on standardized methods and performed by national environmental protection inspectorates. Two complementary methods are used in studies of PM10 content in the air. These are the gravimetric method (reference method), which is recognized and widely used worldwide as the most precise measurement technique, and the automatic method, which has been proven to be equivalent to the reference method. The gravimetric method (manual method) involves measurements taken using dust samplers. Every two weeks, 14 disposable filters are placed in the sampler, with the filters automatically changed every 24 h. Before weighing, the filter is conditioned under controlled conditions (constant humidity and temperature) to achieve a stable mass. The filter is then weighed. The filter is placed in a vacuum pump, which draws ambient air through the filter for 24 h. The measurement device ensures the correct fraction, meaning it only allows particles with an aerodynamic diameter ≤ 10 µm, i.e., PM10, to pass through. After 14 days, the filters are removed, placed in special containers, and transported to the laboratory. The determination of PM10 concentration is based on weighing the dust sample collected on the filter before and after exposure. The filters collected from the samplers are also used to measure PAHs in the dust [15].

2.3. Health Risk Assessment

Health risk assessment can be conducted by considering exposure to PAHs through ingestion, inhalation, or dermal contact (U.S. EPA 2005) [16]. In this study, due to the results concerning the concentration of these substances in the air, the findings related to the inhalation of PAH-contaminated air are presented. Due to the varying carcinogenic potential of individual substances within the PAH group, risk assessment cannot be based solely on their total concentration. To determine their carcinogenic potential relative to benzo(a)pyrene and estimate the benzo(a)pyrene equivalent concentration (BaPeq), toxicity equivalency factors (TEFs) were used [17,18]. The total carcinogenicity associated with PAHs was calculated using Equation (1).
B a P e q = Σ C P A H i T E F P A H i
The incremental lifetime cancer risk (ILCR) in humans can be determined by calculating the lifetime average daily dose (LADD) of PAHs according to USEPA guidelines (USEPA 2013) [19]. The equations used for estimating LADD and ICLR were as follows (Equations (2) and (3)).
L A D D = C s · I R · E T · E F · E D B W · A T · C F
I L C R = L A D D · C S F
The average concentration of a specific PAH (Cs) is measured in ng/m3. The intake rate (IR) varies for different age groups, with adults having an intake rate (IRA) of 0.83 m3/h and children under six years (IRc) at 0.5 m3/h. Exposure time (ET) is considered to be 21 h per day, and exposure frequency (EF) is assumed to be 350 days per year. The exposure duration (ED) differs by age group: 70 years for adults (EDA) and six years for young children (EDC). A unit conversion factor (CF) of 10−6 is applied. Average body weight (BW) was estimated at 70 kg for adults (BWA) and 15 kg for children (BWC). For average timing (AT), values of 25,550 days (70 years) and 2190 days (6 years) were assumed for adults (ATA) and children (ATC), respectively, based on Bortey-Sam et al. (2015) [18]. Carcinogenic slope factor (CSF) values for PAHs were obtained from USEPA (2005) [16]. Using these values, Lifetime Average Daily Dose (LADD) for both adults and children was calculated, along with the Incremental Lifetime Cancer Risk (ILCR) for seven PAHs classified as carcinogenic by IARC (2016) [1].

2.4. Statistical Analysis

Data analysis was performed using Statistica 13 and MS Excel 2013. Due to uneven variances in the datasets, non-parametric statistical tests were applied directly to the raw data. Homogeneity of variance was assessed with the Levene and Brown-Forsythe tests. Hypothesis testing focused on identifying significant differences with a threshold of α ≤ 0.05. For multiple comparisons, including pairwise contrasts, the Kruskal–Wallis ANOVA with post hoc testing was employed, and this test was specifically used to analyze concentration differences. To assess the influence of variability in the concentrations of analyzed air pollutants, a principal component analysis (PCA) was conducted. PCA is a multidimensional statistical tool that facilitates the reduction of a set of original variables, enabling the extraction of a small number of latent factors known as principal components. This allows for the analysis of relationships among the observed variables.

3. Results and Discussion

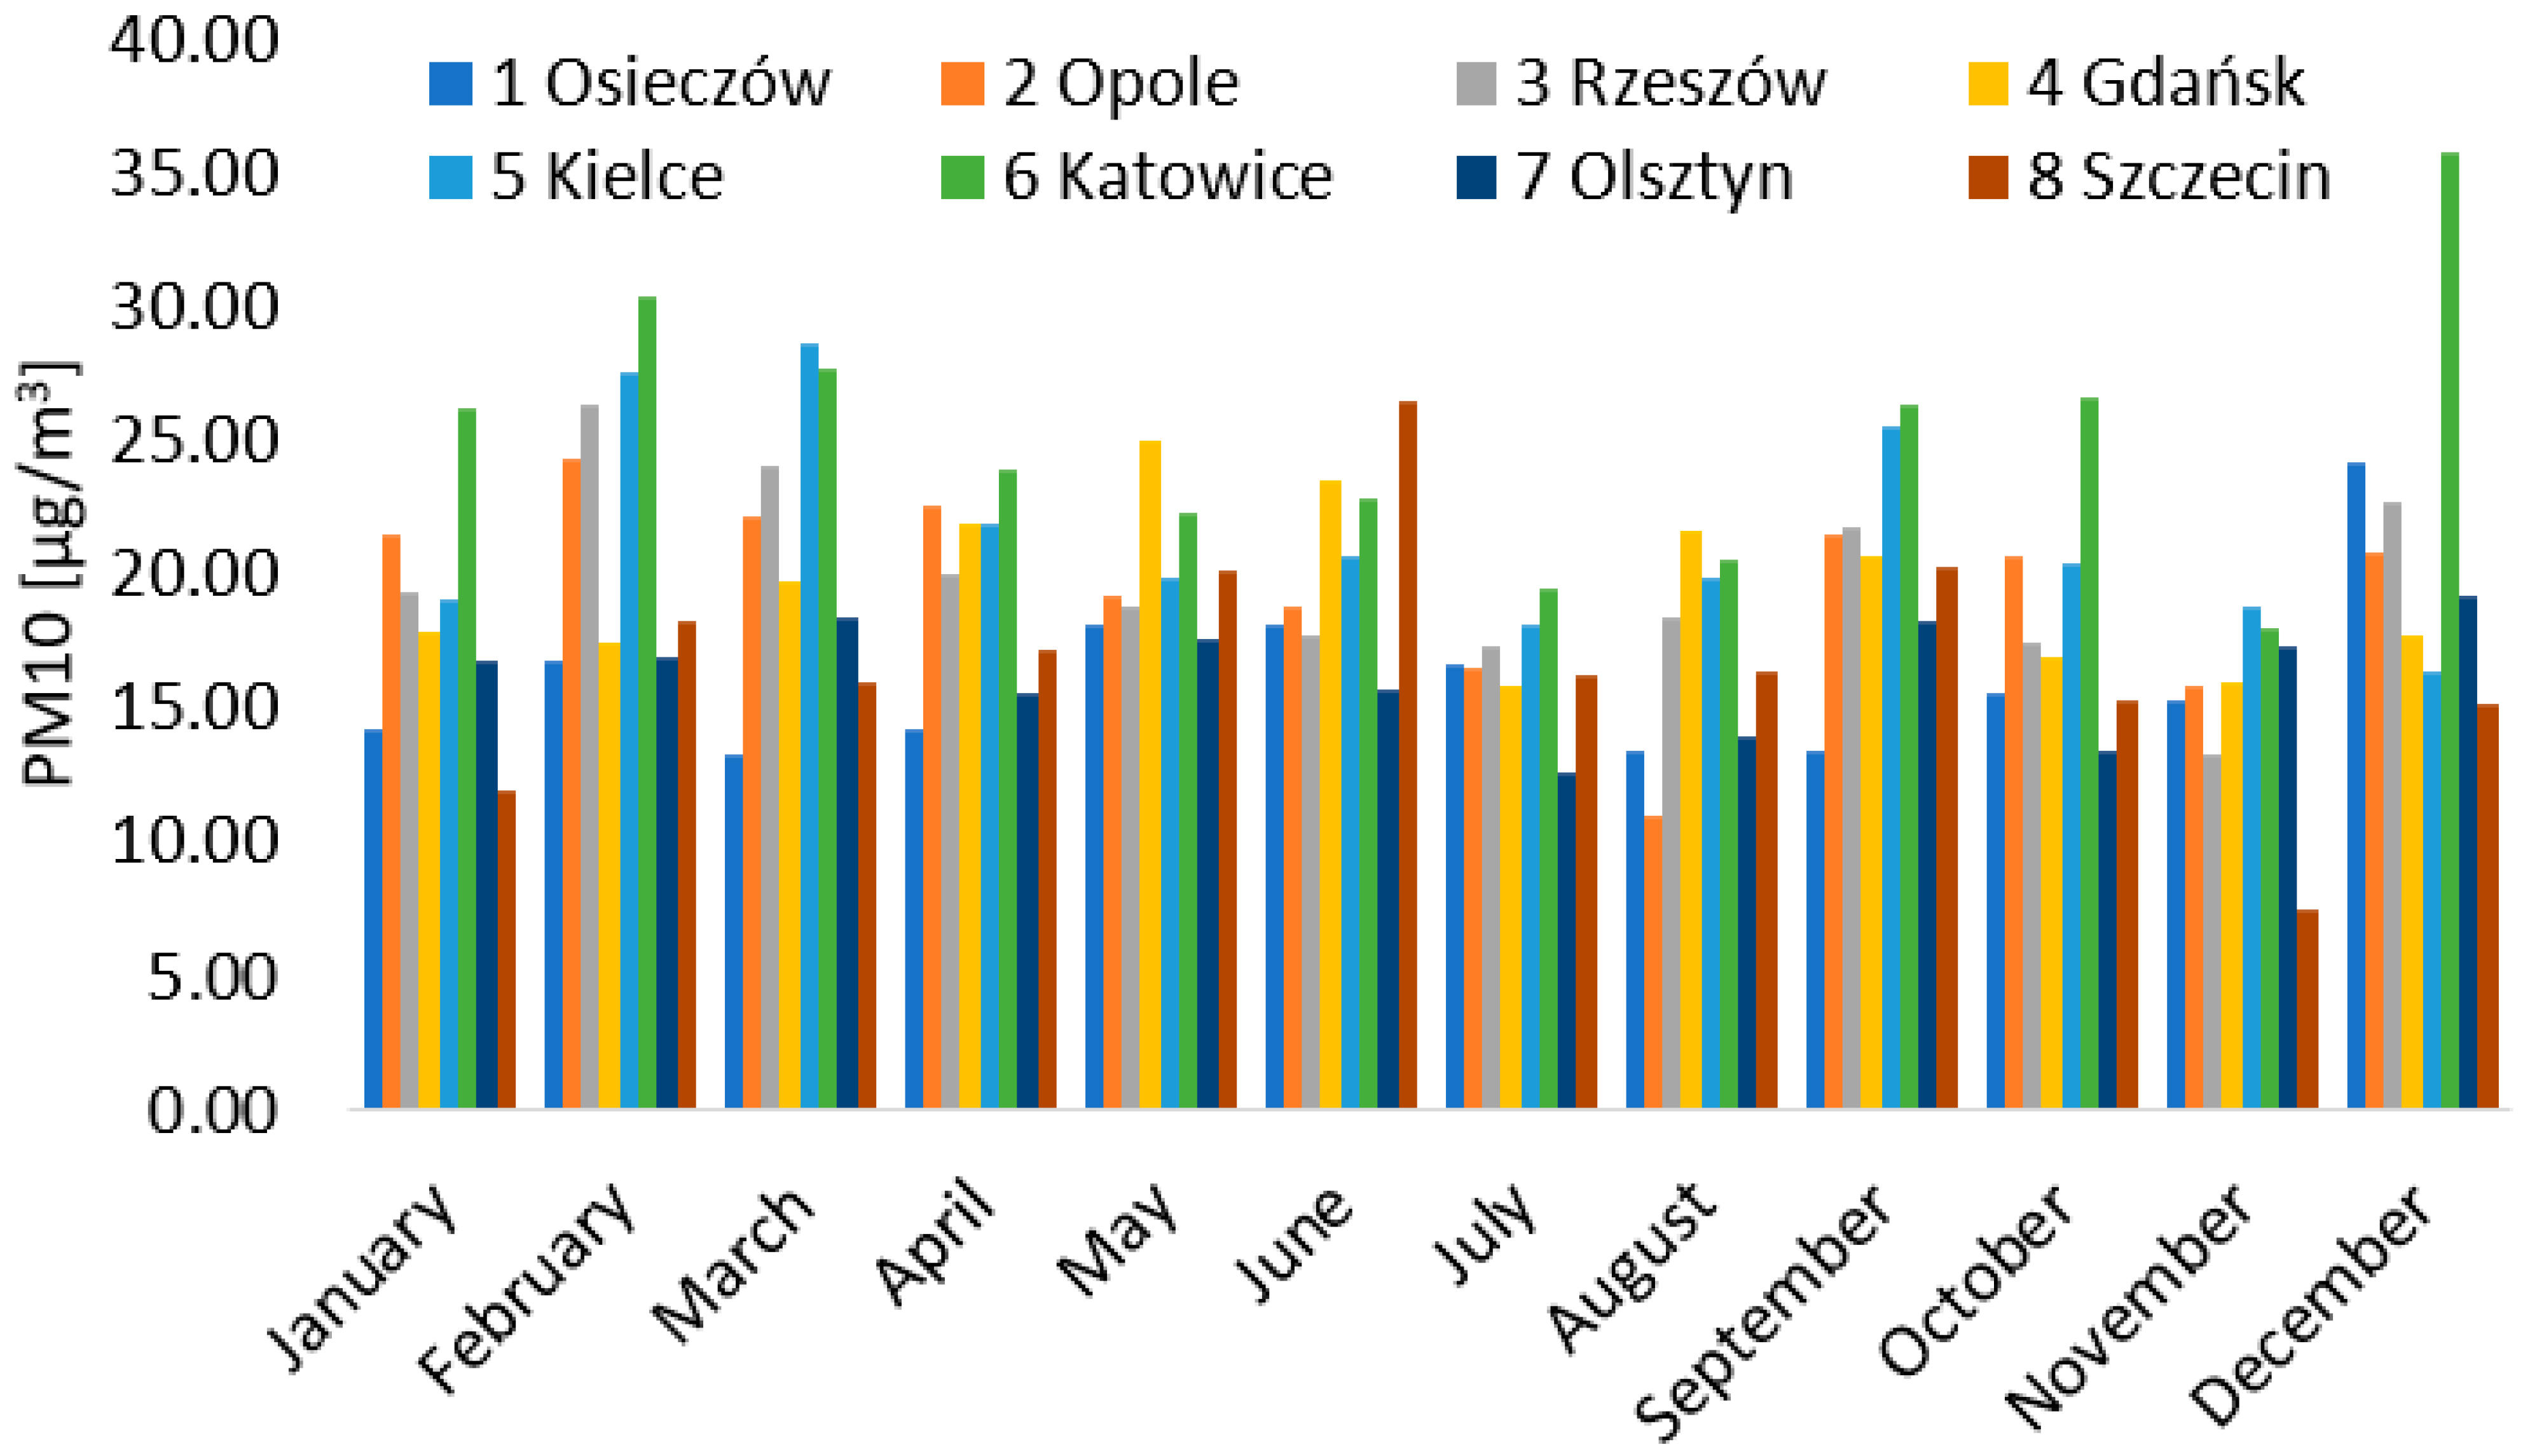
3.1. Concentration of PM10 in the Atmosphere

The annual average concentration of PM10 at the analyzed stations was 19.29 ± 3.01 µg/m3. The lowest value was recorded at station 1 with a concentration of 16.09 ± 3.09 µg/m3, while the highest value was observed at station 6, with a concentration of 25.02 ± 4.99 µg/m3 (Figure 2). The highest daily PM10 concentration was recorded in February at station 6, reaching 104 µg/m3. According to the EU Air Quality Directive (2008/50/EC) [20], the annual limit for PM10 is 40 µg/m3, and the daily limit is 50 µg/m3, which cannot be exceeded more than 35 times per year. However, the WHO recommends an annual limit for PM10 of 15 µg/m3 and a daily limit of 45 µg/m3. Station 1 is located in Osieczów, a small town with a lower degree of urbanization and industrialization, which results in lower levels of particulate pollution. In contrast, station 6 is located in Katowice, a city situated in the highly urbanized and industrialized region of Upper Silesia. In Katowice, the main sources of PM10 emissions are the combustion of fossil fuels in industry, energy production, and emissions from transport, which contribute to higher pollution levels. As of 31 December 2024, 7410 mining plants, including 7276 open-pit mines, were subject to supervision and control by mining offices in Poland (Figure S1, Supplementary Materials).
It was noted that precipitation had no effect on the value of PM10 at individual stations (Tables S2–S9, Supplementary Materials). Similarly, wind speed did not affect the value of these parameters. No statistically significant differences were found between the cold and warm seasons (p < 0.05), which is also supported by the results of Lara et al. (2022) [7]. Similar values for PM10 were recorded in Spain, in the La Mancha region, where the concentrations ranged from 4.3 to 44.7 μg/m3 (Lara et al., 2022) [7]. The highest average PM10 concentration was recorded in autumn (22 μg/m3), followed by summer (20 μg/m3), spring (17 μg/m3), and winter (13 μg/m3). In other urban areas of Spain, such as Zaragoza, slightly higher average concentrations were observed, reaching 34.4 μg/m3 [21], and in A Coruña, the concentration was 24 μg/m3 [22].

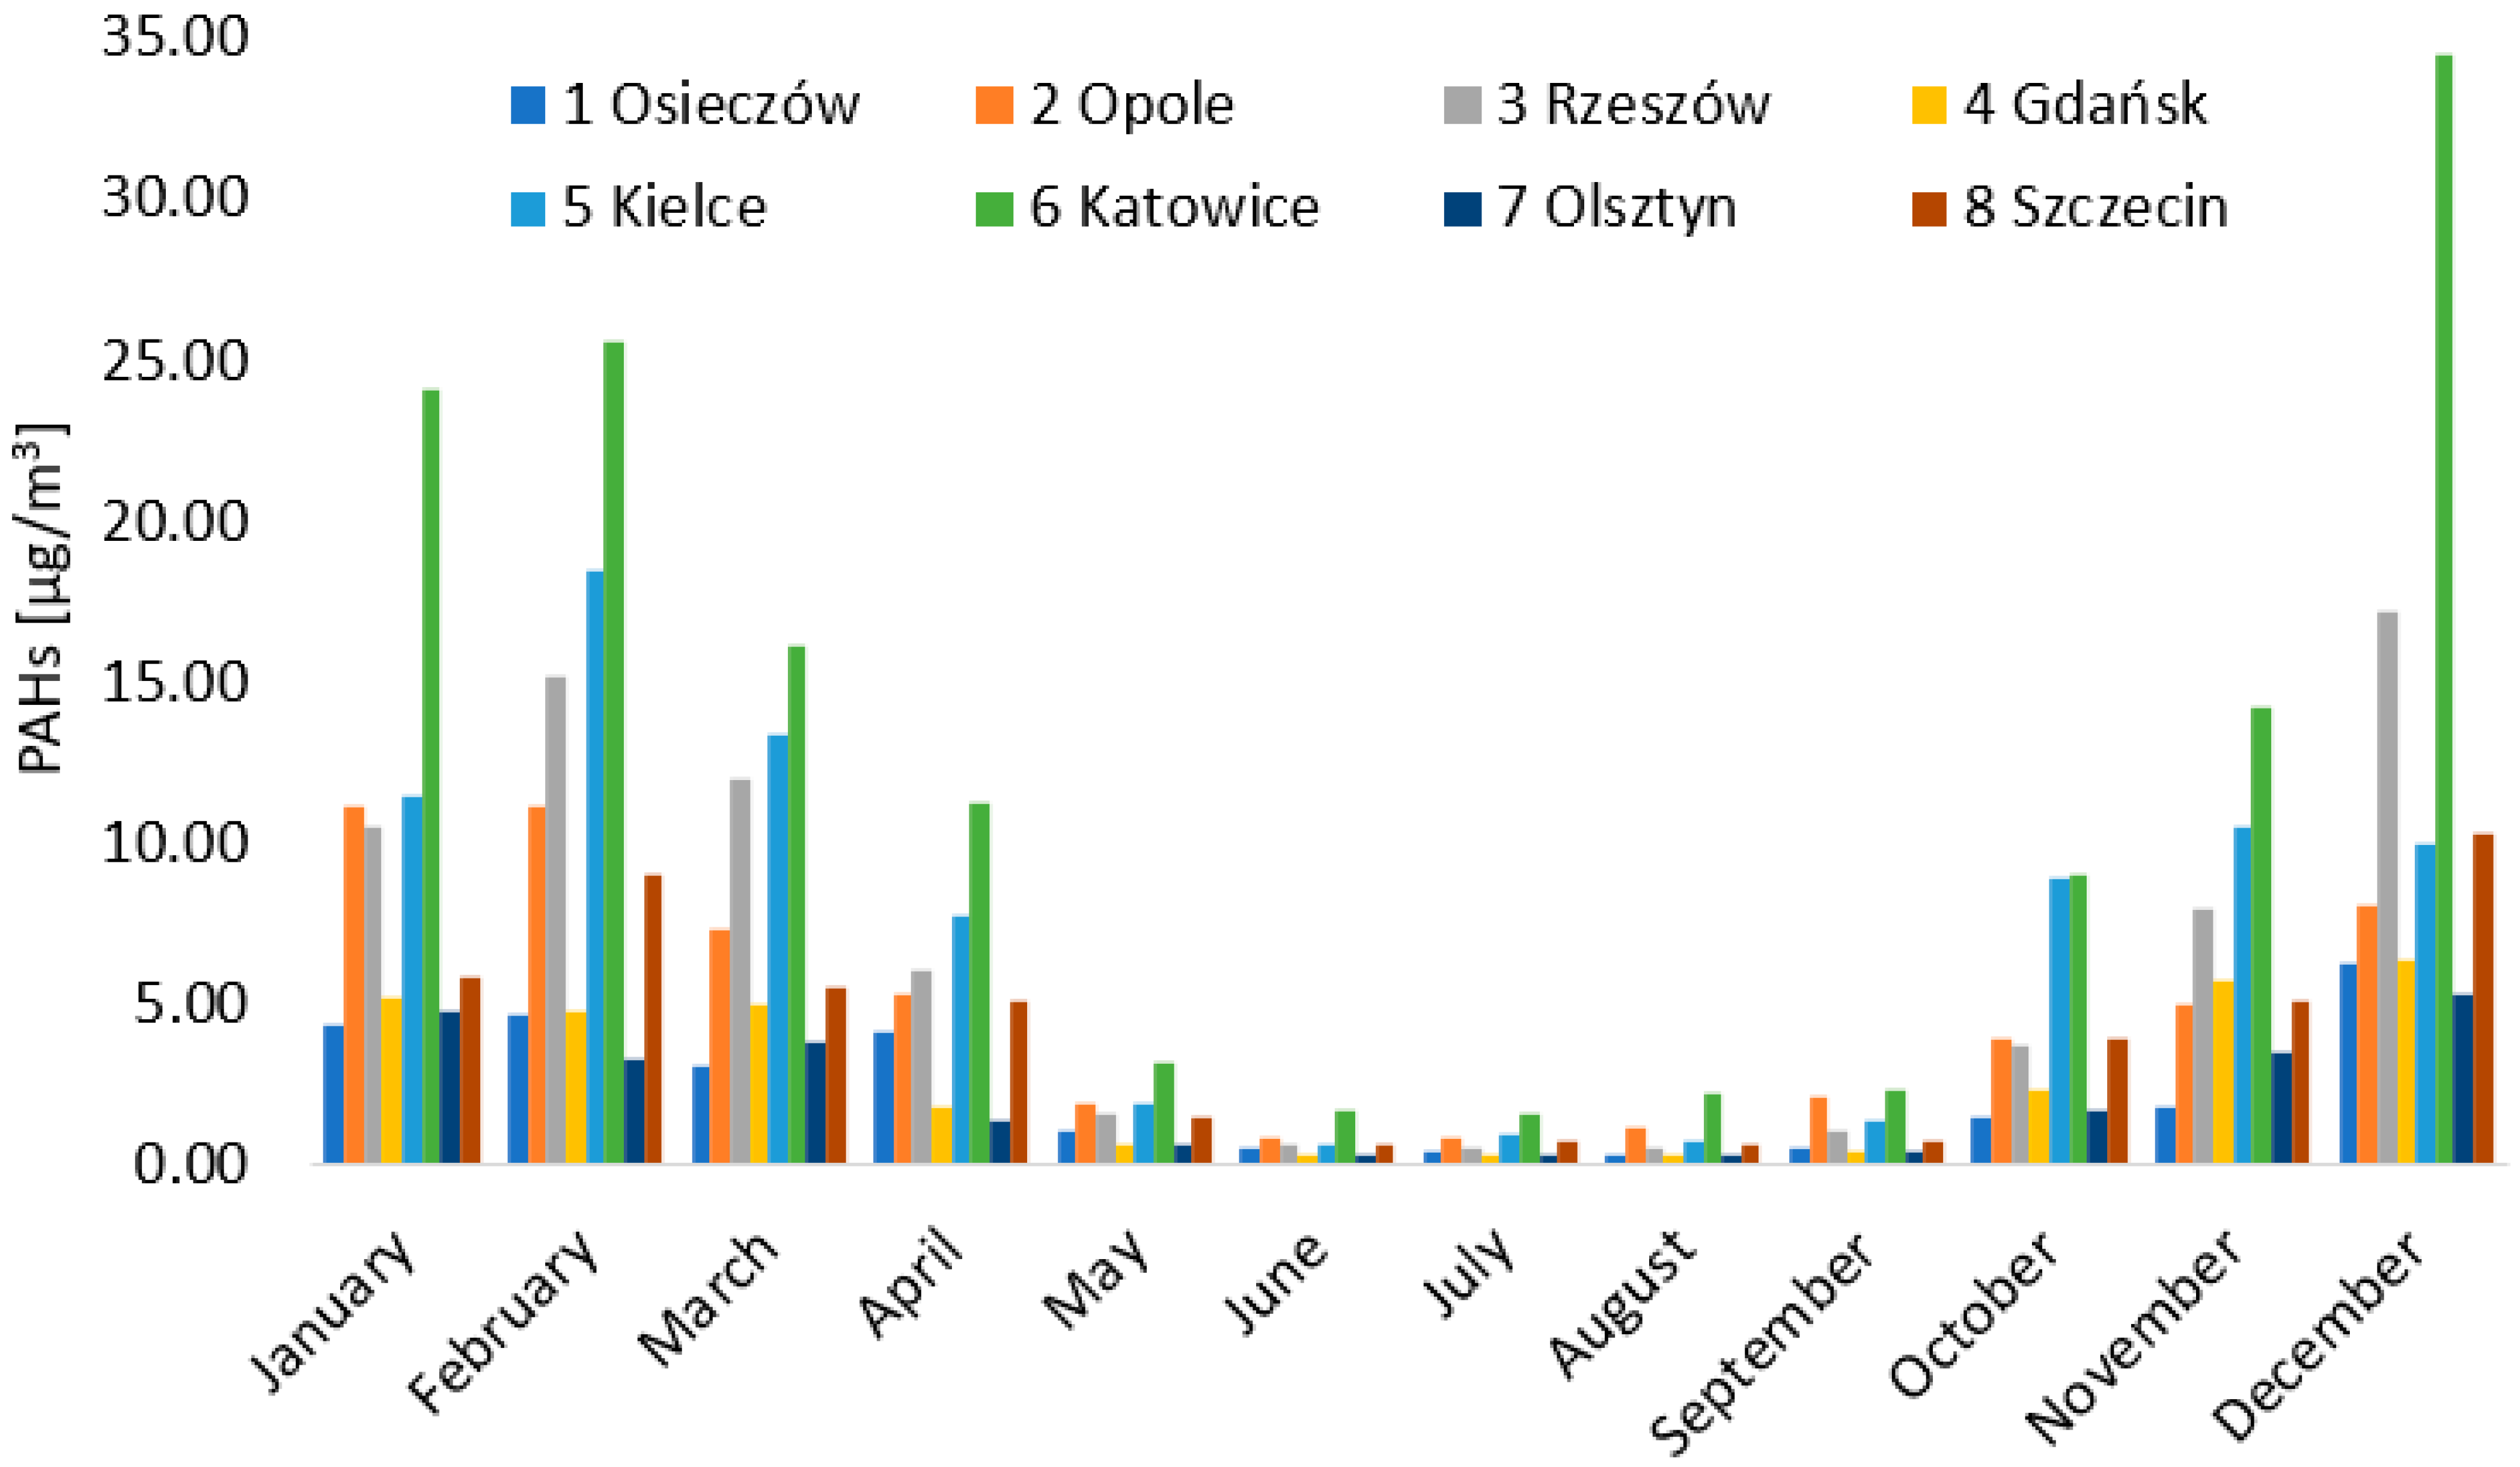
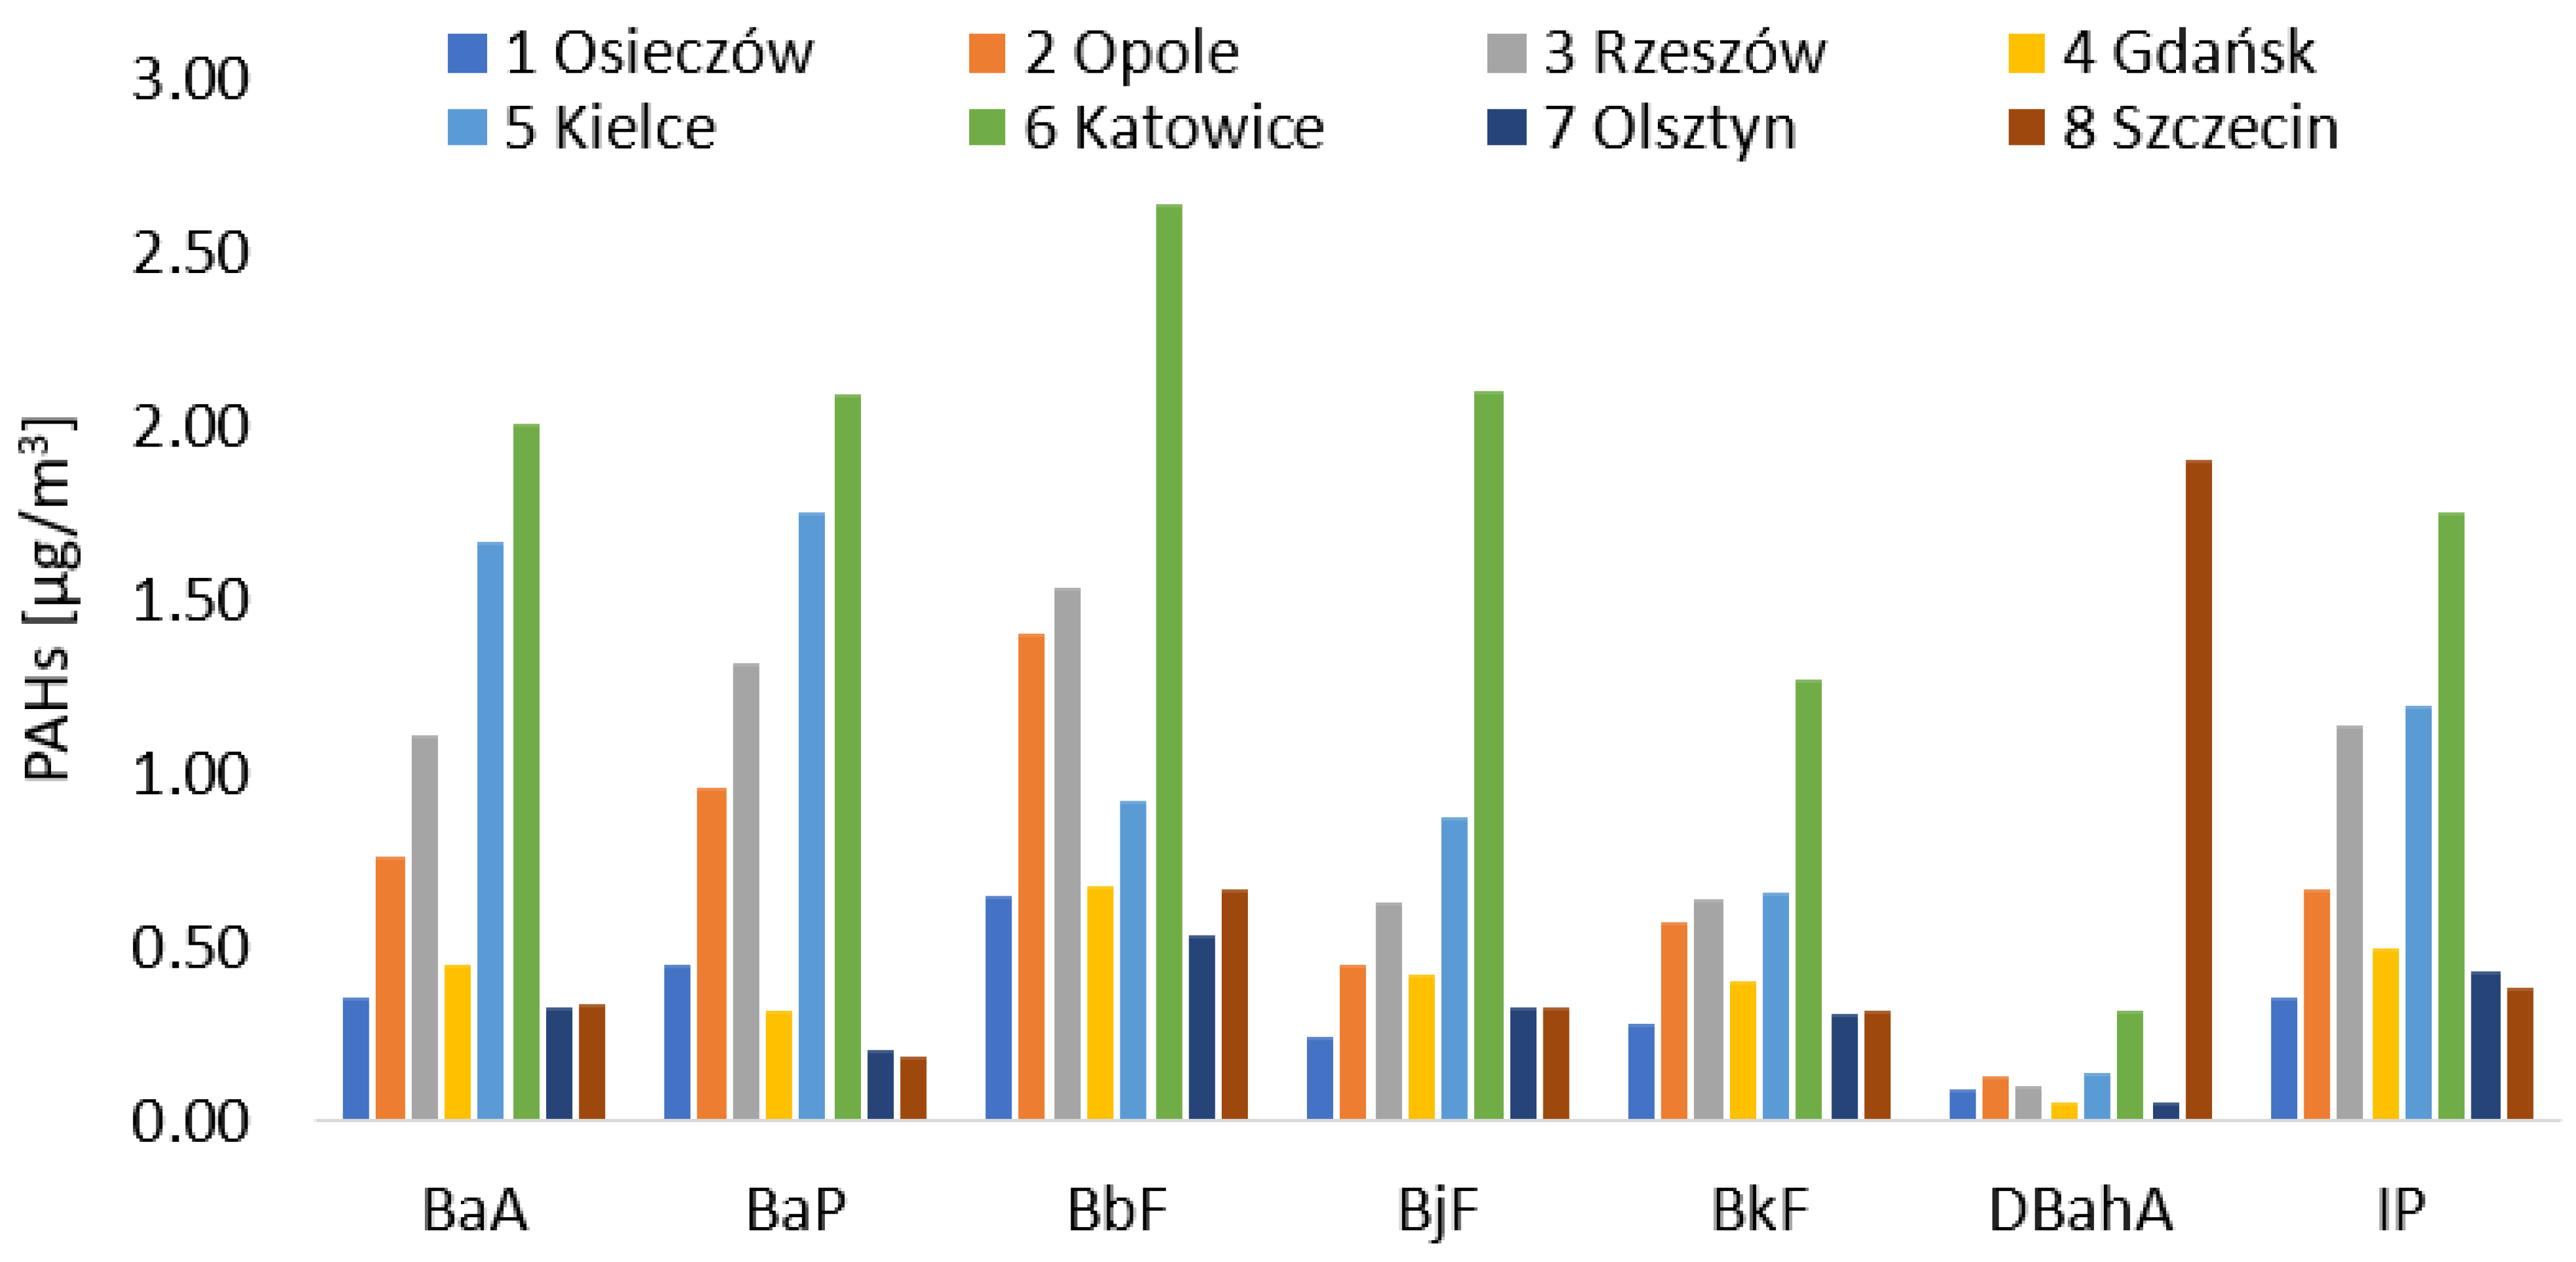
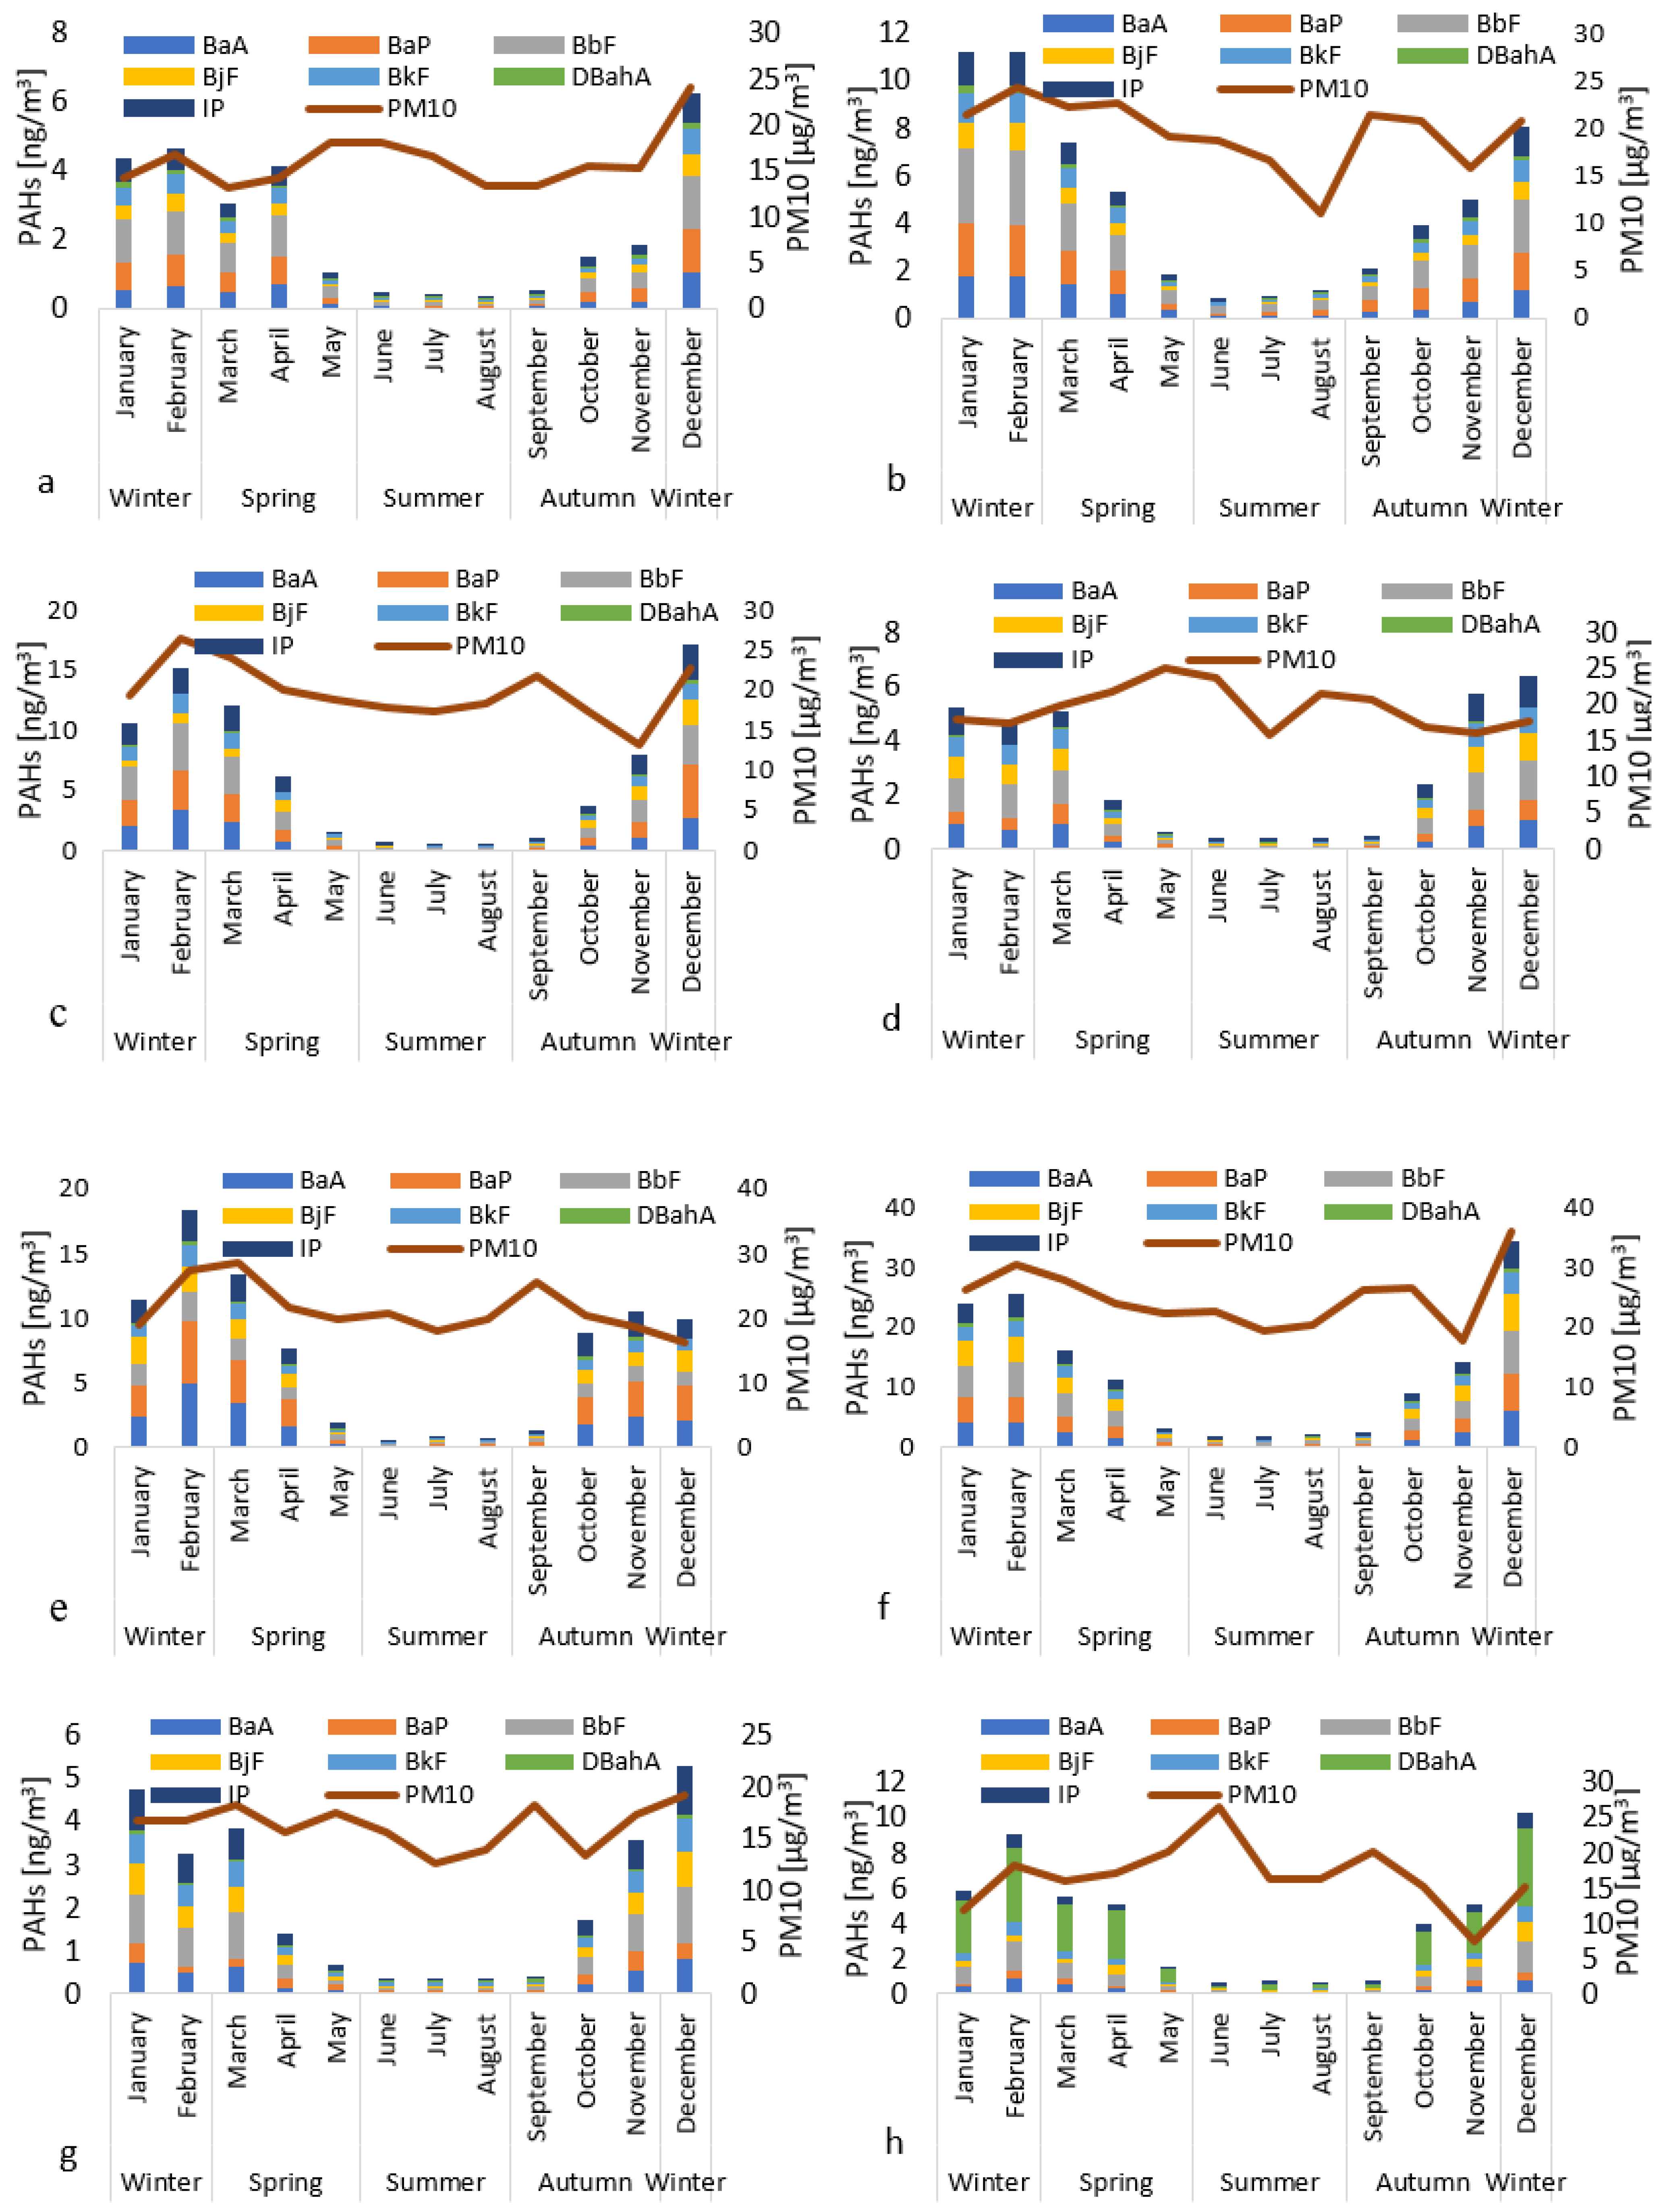
3.2. Concentration of PAHs

The study of the presence of PAHs at 8 monitoring points revealed the presence of 7 analyzed substances from this group, including benzo(a)anthracene, benzo(a)pyrene, benzo(b)fluoranthene, benzo(j)fluoranthene, benzo(k)fluoranthene, dibenzo(a,h)anthracene, and indeno(1,2,3-cd)pyrene. The concentrations of total PAHs in the air varied depending on the location (Figure 3). The highest total PAH concentration was recorded at 34.50 ng/m3 (station 6), while the lowest concentration reached 0.35 ng/m3 (station 1). These differences are the result of varying intensities of industrial and transport activities, as well as local emission sources.
The highest annual average concentration of PAHs was recorded for BbF at 2.64 ng/m3 (Figure 4). In contrast, the lowest concentration was for dibenzo(a,h)anthracene, which was 0.05 ng/m3. The concentration of DBahA was the lowest at all analyzed monitoring points, except for the measurement station 8 in Szczecin, where the value reached 1.80 ng/m3. The concentration of dibenzo(a,h)anthracene at this point during the year ranged from 0.16 to 4.41 ng/m3. The higher concentrations of DBahA in Szczecin may result from several factors. The complexity of dibenzo(a,h)anthracene emission sources in Szczecin stems from a combination of industrial and transport activities, as well as local heating methods. DBahA may be emitted from specific sources present in Szczecin, such as local transport, industrial processes, or combustion, which are less intense in other locations. The diagnostic index BbF/BkF allows differentiation between emissions related to industry and those from transport and biomass combustion. A BbF/BkF value > 0.5 indicates emissions associated with coal and biomass combustion, while a BbF/BkF value < 0.5 suggests emissions related to road traffic, primarily from internal combustion vehicles, especially diesel. In Szczecin, this value ranged from 1.81 to 2.74, while for the entire country, it oscillated between 1.39 and 2.45. Additionally, the presence of BaP and BjF will indicate emissions from fossil fuel combustion, while the presence of BaA will suggest biomass and wood combustion, and the presence of BaP, IP, and DBahA will be associated with transport emissions.
The concentration of benzo(a)pyrene ranged from 0.18 to 2.09 ng/m3. These values exceed the permissible annual limit set by European Union regulations, which is 1 ng/m3. According to this regulation, no exceedance of the permissible benzo(a)pyrene concentration in the air should occur. The highest concentration of BaP was observed at station 6, located in Katowice, while the lowest was recorded in Szczecin (station 8). The observed concentrations may induce DNA damage. BaP is recognized as a potential reference mutagen and is frequently used as an indicator for PAHs, with the WHO considering it a reliable measure of PAH toxicity. Similar research was conducted by Hong et al. (2007) [6]. They also showed that the PAH levels in coastal cities were much lower than those in inland cities, primarily due to the significant influence of sea conditions on their weather. In a study by Teixeira et al. (2024) [23], BaP levels in ambient particulate matter were reported to range between 0.01 and 15.0 ng/m3. Total PAH concentrations were lowest in rural areas (0.03–0.60 ng/m3) and highest in industrial and densely urbanized regions, with values ranging from 1344.4 to 12,300 ng/m3. Arregocés et al. (2023) [5] conducted a study in Colombia. The average daily concentrations of BaP ranged from 0.41 to 0.60 ng/m3, with the maximum recorded concentration reaching 0.92 ng/m3. The authors indicate a significant variation in PAH levels depending on the location, with the highest concentrations observed in areas directly associated with mining activities.
Additionally, the European Environmental Agency reported that 15% of urban residents in Europe were exposed to annual BaP concentrations above the guideline of 1 ng/m3, and approximately 75% were exposed to levels surpassing the WHO’s reference limit of 0.12 ng/m3 [23]. Andersen et al. (2025) [13] indicate that despite progress in recent years, further decisive reductions in air pollutant emissions are necessary in Poland, especially in the residential sector, to improve the quality of life of residents in the near future. A serious problem in Poland resulting from the widespread combustion of solid fuels (coal and wood) is the above-average high emissions of benzo(a)pyrene, which result in the highest concentration of this substance among all EU countries. In 2022, the median annual concentrations of this carcinogenic compound exceeded 2 ng/m3, and the maximum value reached almost 9 ng/m3.

3.3. Seasonal Variations

PM10 emissions during the analyzed period were higher in the winter season. In January, concentrations ranged from 11.92 µg/m3 in Szczecin to 26.25 µg/m3 in Katowice (Figure 5). In December, the highest concentration was also recorded in Katowice (35.85 µg/m3), and the lowest in Szczecin (15.19 µg/m3). This phenomenon is associated with increased combustion of fossil fuels for heating purposes during the winter season. In spring, PM10 levels decrease compared to winter but remain relatively high in some locations. High concentrations of particulate matter in May and June were observed at two stations in Szczecin and Gdańsk. Summer months typically show lower levels of particulate pollution, which may be due to unfavorable weather conditions (lack of wind, high humidity, or thermal inversion phenomena) that can limit the dispersion of pollutants in the atmosphere. Analyzing the year 2023 in relation to meteorological conditions, it can be seen that in Poland, the colder months of the year were humid and the warmer ones were dry. The only exception was the extremely humid August. January, February, and November were very humid months in terms of pluvial conditions, and October and December were extremely humid. May and September were very dry months, and June was a dry month. Particularly in coastal areas, variable conditions can cause pollutants to persist in the air for longer periods. Additionally, Gdańsk and Szczecin are among the largest ports in Poland, and the summer season is associated with increased port and maritime activity. Cargo handling, exhaust emissions from vessels, and emissions from port operations can lead to periodic increases in particulate concentrations, especially under unfavorable weather conditions. Summer PM10 concentrations are at their lowest levels for the year due to better dispersion conditions and reduced emissions from heating. In July, the lowest concentrations were recorded, ranging from 12.64 µg/m3 (Olsztyn) to 19.41 µg/m3 (Katowice). In this case, precipitation had no effect on the PM10 value (Tables S7 and S8, Supplementary Materials). With the start of the heating season in the fall, PM10 concentrations increased again. No statistically significant differences were observed between the cold and warm seasons for PM10 (p < 0.05), which was the result of higher concentrations in certain locations during the summer months due to specific processes, such as dusting or changes in the transport of pollutants, which is also observed in other Central European countries.
For PAHs, the lowest concentrations were also observed during the summer season, while the highest values of total PAH concentrations were recorded in the winter season (34.50 ng/m3), followed by spring (16.19 ng/m3), autumn (14.22 ng/m3), and the lowest in summer (2.21 ng/m3) (Figure 3). A similar seasonal pattern was observed for BaP, with the highest concentration occurring in winter (6.20 ng/m3), followed by spring (4.81 ng/m3), autumn (2.71 ng/m3), and summer (0.33 ng/m3). Hong et al. (2007) [6] studied the air pollution levels of PAHs in Xiamen, where the BaP concentration ranged from 0.04 ng/m3 to 1.5 ng/m3.
According to EU standards, as outlined in Directive 2004/107/EC [24], the permissible annual concentration of benzo(a)pyrene in the air was not exceeded only during the summer season. Higher concentrations of PAHs in the molecular phase in winter/autumn than in summer are probably related to lower temperature, weaker radiation intensity, and more emission sources.
The statistical analysis of the seasonal impact on individual PAHs for the entire area, as well as for individual stations, revealed statistically significant differences between the warm and cold seasons (p < 0.05). Significant differences (p < 0.05) were observed between winter and summer, winter and spring, winter and autumn, as well as between spring and summer for the individual PAHs, suggesting that seasonal changes affect their concentration. No significant differences (p > 0.05) were found between spring and autumn, indicating that sources and atmospheric conditions may influence PAH levels in these two seasons in a similar manner. No direct effect of atmospheric precipitation on the concentration of PAHs was recorded at individual stations (Tables S2–S9, Supplementary Materials). Seasonal differences are influenced by several factors. This may result from a greater shift to vapor in the warmer season, meaning increased pollution in the colder months is a result of poorer dispersion conditions and lower mixing heights. Additionally, higher emissions of pollutants may occur in winter due to increased combustion of fossil fuels and biomass for heating purposes. In the winter season, photolysis and photochemical degradation are also reduced due to lower temperatures, less radiation, and lower levels of atmospheric oxidants [14]. PAHs can experience photolysis and oxidation through interactions with hydroxyl radicals, ozone, nitrogen oxides, or other potent oxidizing agents. The duration of photolysis reactions is significantly shorter for PAHs found in airborne particulate matter compared to their presence in water or organic solvents [7].
In other Central and Eastern European countries located in the temperate climate zone with a similar geographical latitude, such as the Czech Republic, Slovakia, Hungary, Ukraine, and the Baltic States, during the heating season (winter, early spring, and late autumn), emissions of particulate matter will also increase due to the heating of households. This leads to a seasonal rise in PM10 concentrations and other air pollutants such as PAHs. This is due to similar climatic conditions, including a clear division into four distinct seasons.

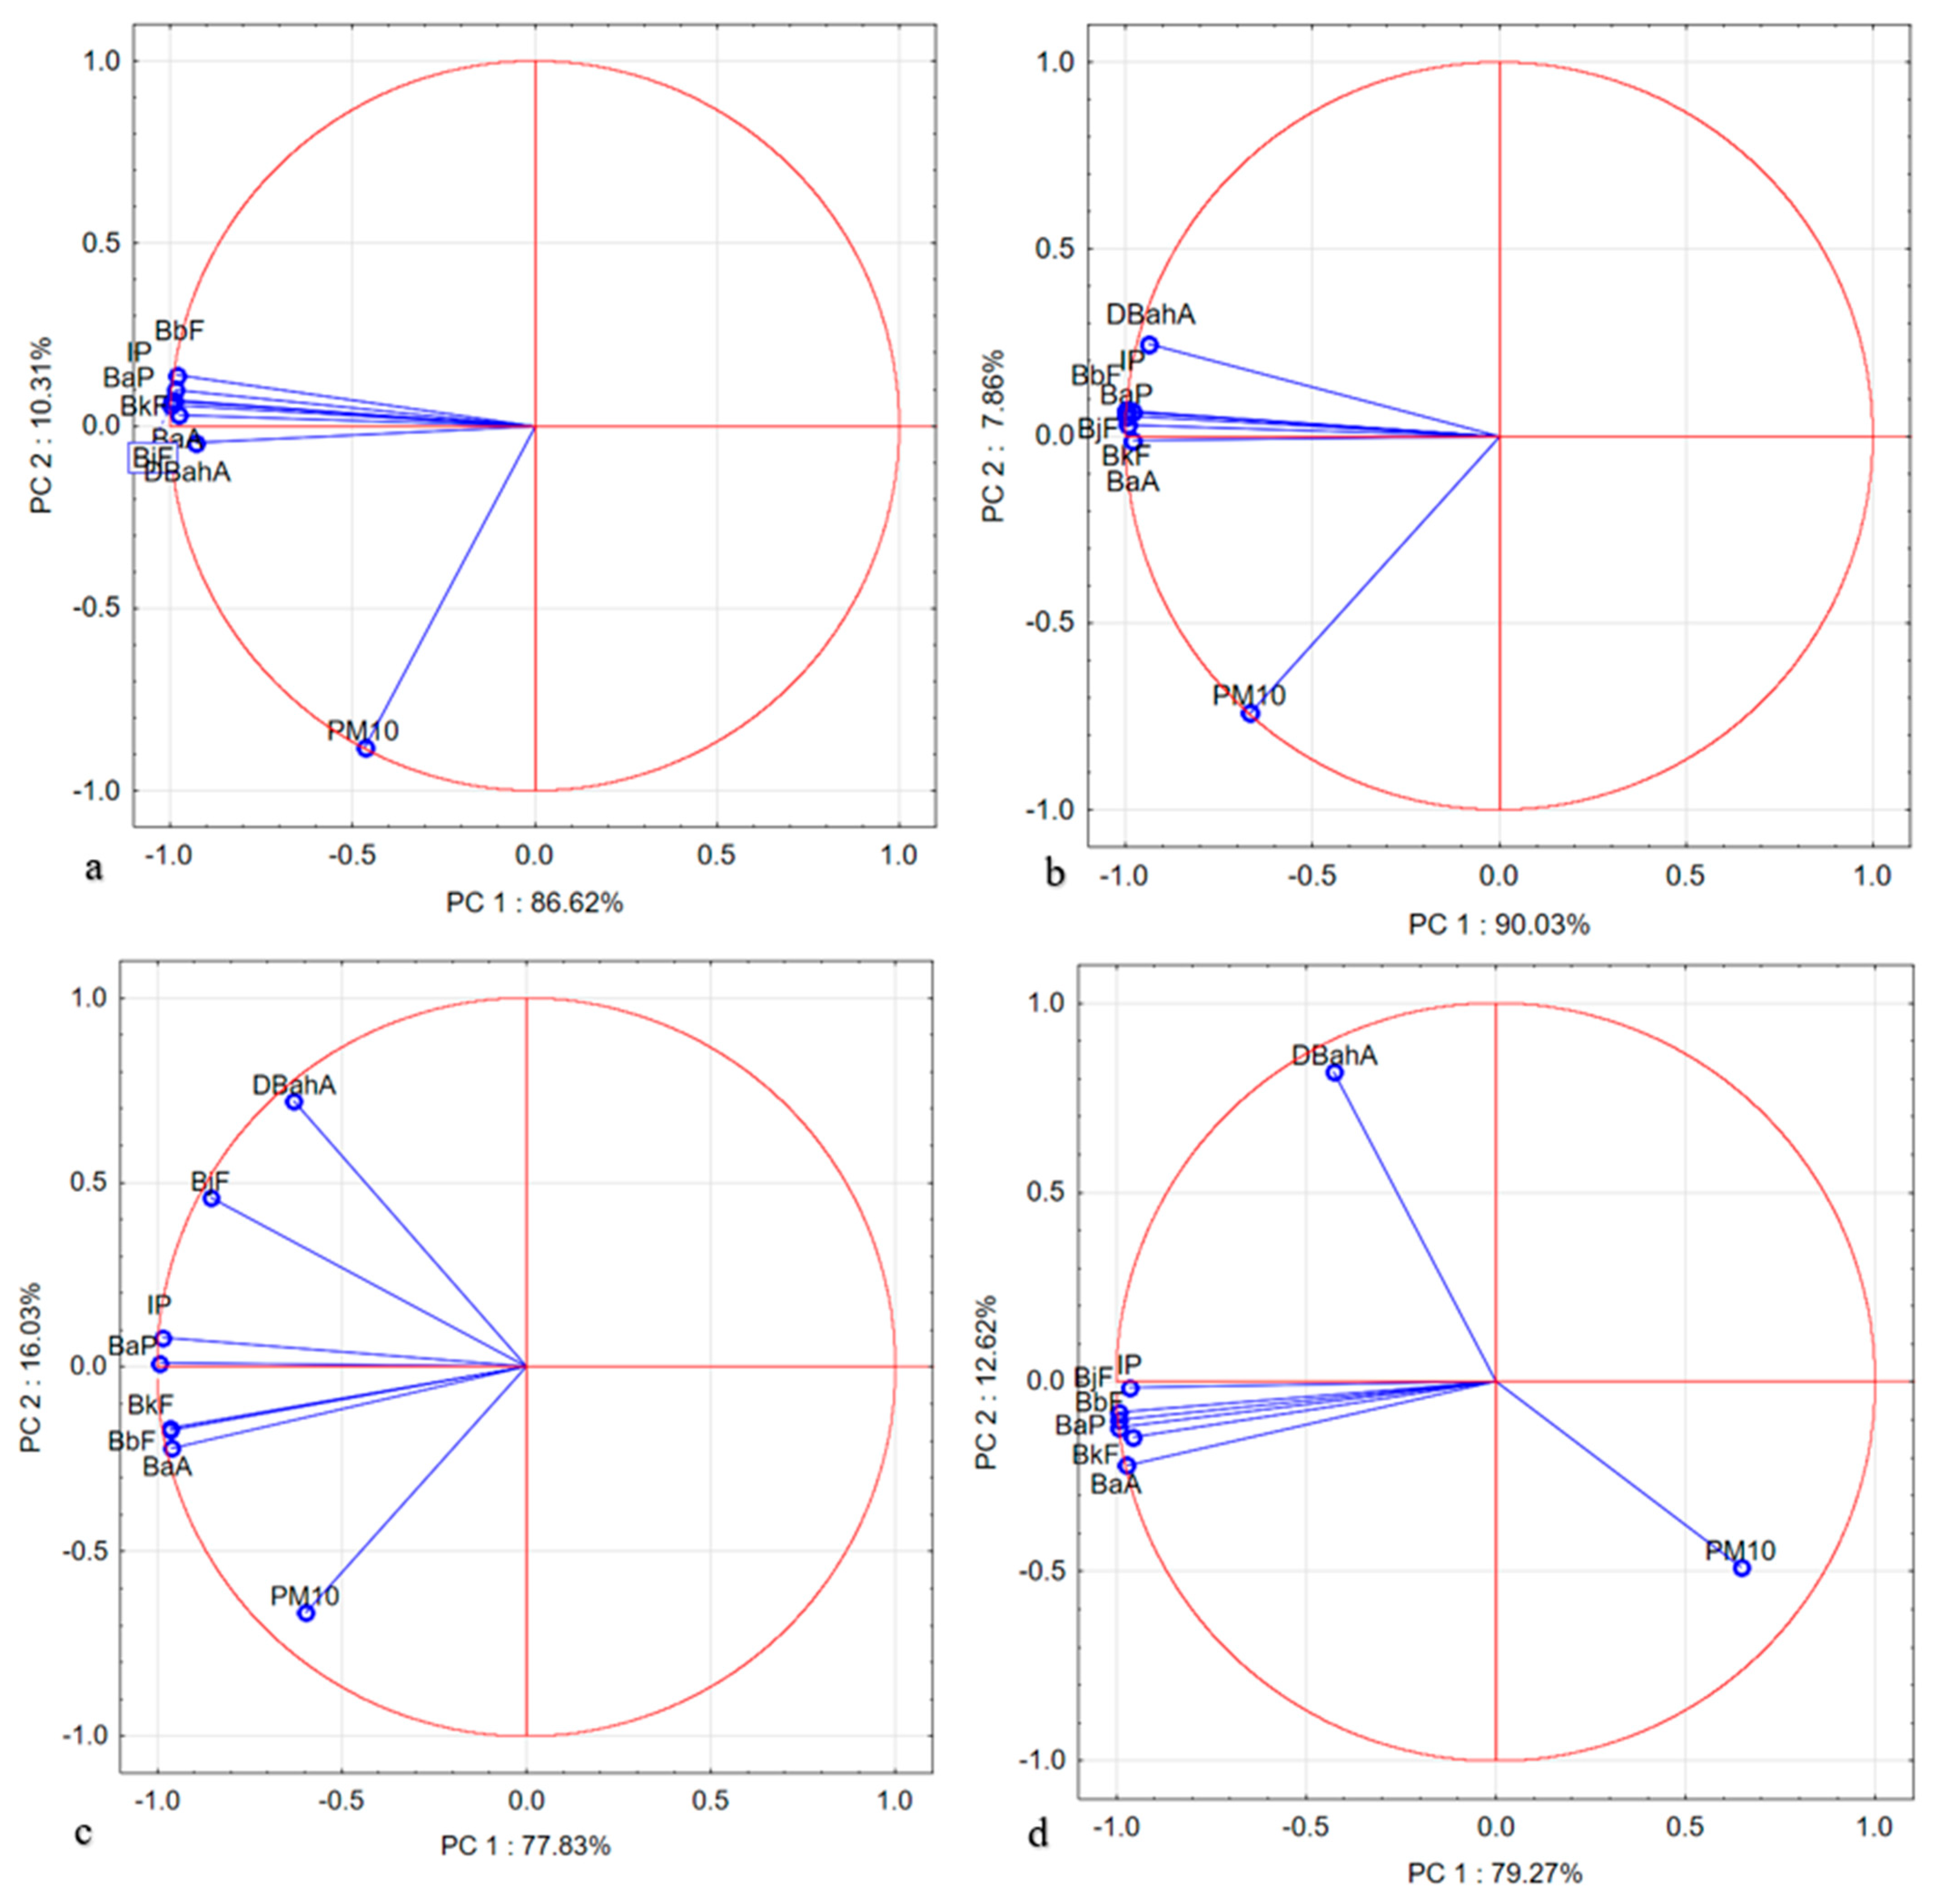
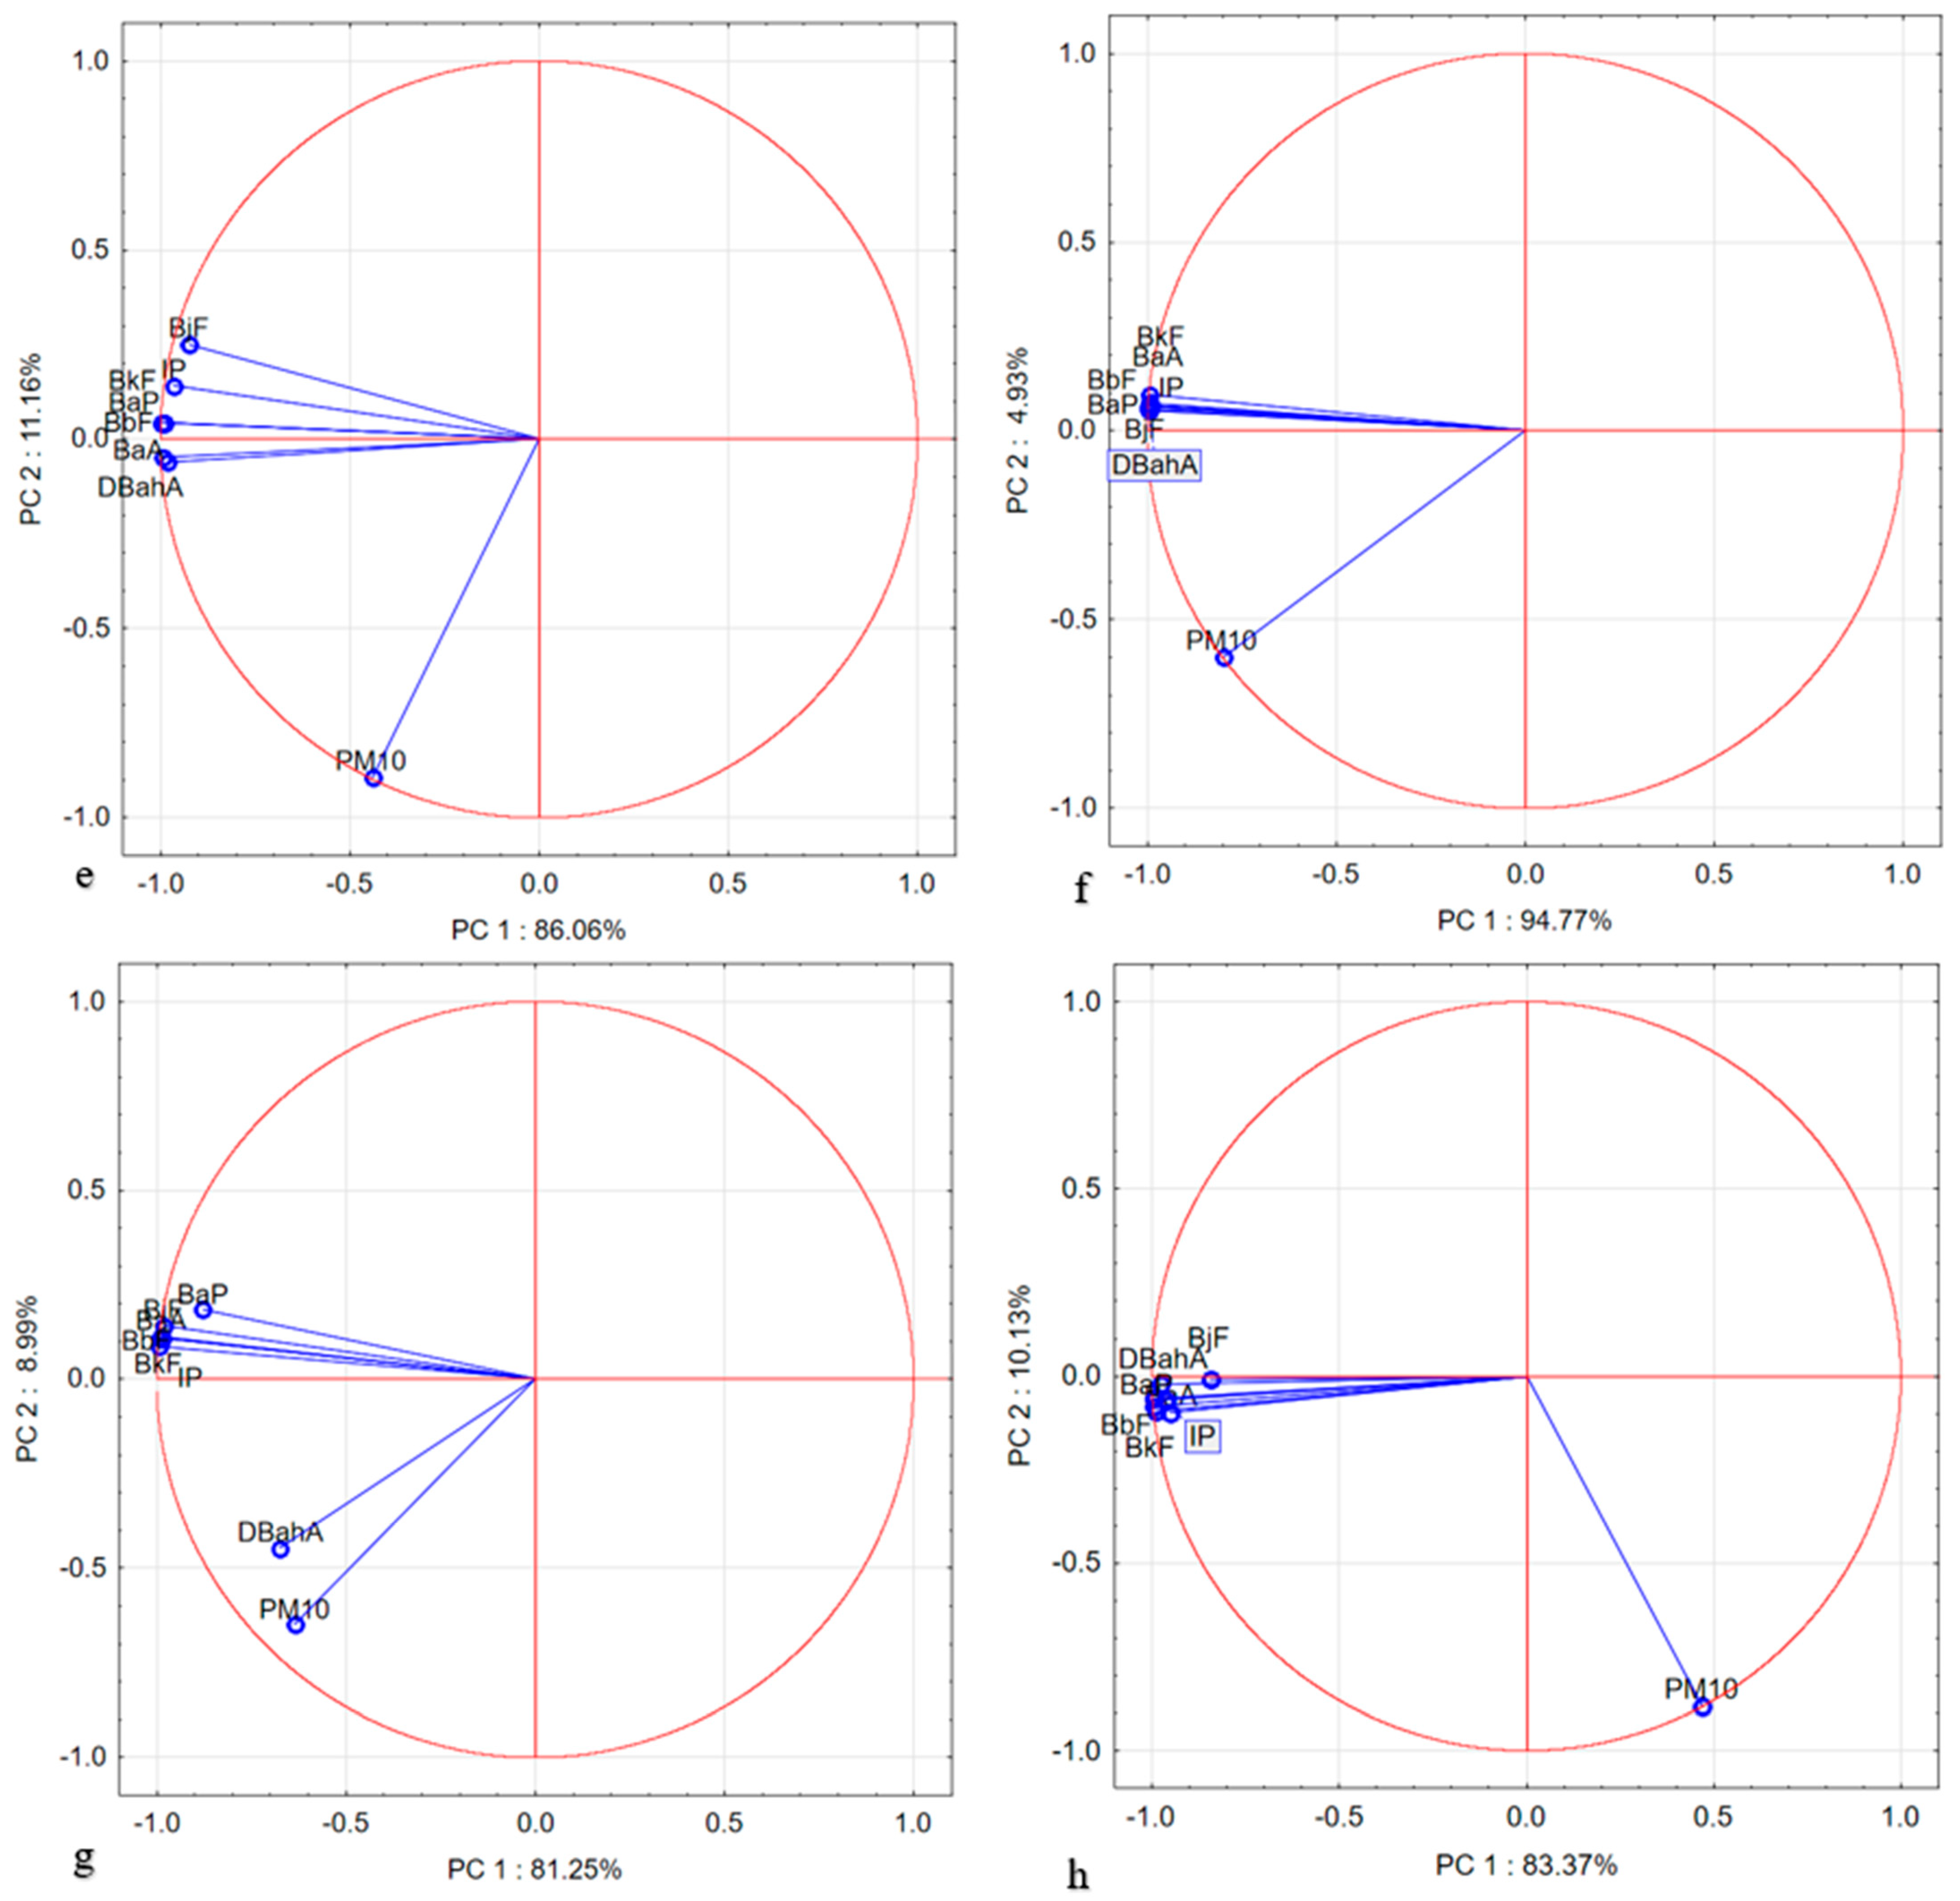
3.4. Correlation Analysis of Different Pollutant Concentrations

The analysis of interactions between the studied substances and PM10 revealed strong correlations between the concentrations of the individual PAHs, which may indicate similar sources of these compounds (Figure 6, Tables S10, S12, S14, S16, S18, S20, S22, and S24, Supplementary Materials). The correlation coefficients between PAHs and PM10 at stations 1, 4, 5, 7, and 8 are moderately low. This indicates a certain degree of co-variation between these pollutants; however, the relationship is not strong, suggesting that PM10 in these locations originates from different sources. On the other hand, statistically significant strong correlations between PAHs and PM10 were observed at station 6. A strong correlation was also found between the cold and warm seasons (R² = 0.966) for the analyzed PAHs and PM10 across all monitoring stations. The observed spatial variability in PAH–PM10 correlations highlights the complexity of emission sources and atmospheric processes influencing air pollution in different locations. The strong correlations at some stations, contrasted with weaker relationships elsewhere, underscore the importance of considering local emission profiles and environmental conditions. This site-specific insight extends previous findings by demonstrating that uniform regulatory approaches may not be equally effective across regions with distinct pollution sources. The results of the study conducted by Jakovljević et al. (2018) [24] in Zagreb confirm significant relationships between PAH concentrations and different particulate matter fractions (PM10, PM2.5, and PM1). It was observed that a larger portion of PAHs is associated with smaller particle fractions, especially during the winter season. In the study conducted by Naydenova et al. (2022) [25], strong and statistically significant correlations were found between PAH concentrations and particulate matter fractions PM2.5 and PM10. These correlations indicate the combined influence of local emission sources and environmental conditions on pollution levels. It was observed that PAHs with medium and high molecular weights (MMW and HMW) exhibited higher correlation coefficients with particulate matter fractions than low molecular weight (LMW) PAHs. This is because LMW PAHs tend to exist in the gaseous phase, whereas MMW and HMW PAHs are more strongly associated with particulate matter.
All PCA results are presented in Supplementary Materials (Tables S1–S16). The results of the principal component analysis showed that at all stations, two factors explained over 90% of the data variance (Figure 6). According to this finding, the first two components provide important information relevant to all the analyzed monitoring stations. Factor 1 was strongly associated with BaA, BaP, BbF, BjF, BkF, and IP compounds. The analyzed PAHs negatively correlated with PC1 in each case. Factor 2 was associated with PM10 (except at stations 4, 6, and 7) and DBahA at stations 3, 4, and 7. Literature identifies BaP, IP, and DBahA as indicators of emissions related to vehicles and gasoline exhausts. BkF also indicates emissions from coal combustion and natural gas emissions. BaP also points to stationary emission sources using heating oils as fuel [7,26,27,28].
PC1 represents the dominant component, explaining a significant portion of the total variance. All the analyzed PAHs show quite similar variable contributions, suggesting that they are interconnected and may originate from similar emission sources. PC1 reflects a widely spread, universal source of pollution, such as transportation or biomass burning, operating throughout the studied region. In contrast, the lower loadings for PC2 indicate that this component explains only a small part of the variance in PAHs. PC2 has less significance for the overall variability of these pollutants and may be related to more localized, specific sources with a smaller share in the total pollution level, such as coal burning at selected stations or local industrial emissions. Hong et al. (2007) [6], using PCA, demonstrated that the main sources of particle-bound PAHs were primarily exhaust emissions from gasoline and diesel vehicles, along with contributions from coal combustion, industrial activities, and cooking sources. The dominant PAH components across all seasons were low and medium-molecular-weight compounds, including phenanthrene, pyrene, fluoranthene, and chrysene.

3.5. Health Risk Analysis

PAHs are carcinogenic substances, which makes it essential to assess the cancer risk associated with inhaling these compounds adsorbed onto PM10 in the atmosphere. This risk is estimated using the toxic equivalent factor for benzo(a)pyrene. According to WHO (2000) [9], the equivalent concentration of BaP that causes an excessive lifetime cancer risk of 1/10,000 is approximately 1.2 ng/m3. The equivalent concentration of carcinogenic PAHs in the air was 3.54 ng BaPeq/m3 (Table 1). The average concentration of BaP was 0.90 ng/m3. The main contributor to the total carcinogenic activity of the PAH mixture was BbF (31.5%), followed by BaP (5.5%), IP (18.2%), BjF (12.9%), BkF (8.5%), BaA (2.5%), and DBahA (1.0%). BaPTEQ for station 6, where the concentrations of individual PAHs were highest, showed that the winter value (7.75 ng/m3) was the highest, followed by spring (2.85 ng/m3), autumn (2.46 ng/m3), and summer (0.50 ng/m3). These values were higher and comparable to other urban atmospheres in Europe. In Naples, Italy, this parameter ranged from 0.48 to 1.06 ng/m3 [29], while in Dettenhausen, Germany, it was at 2.7 ng/m3 [30]. In contrast, Lara et al. (2022) [7] reported lower BaPeq values, averaging at 0.18 ng BaPeq/m3.
To assess the health risk for humans, it was assumed that both adults and children are exposed to airborne PAHs through the inhalation of PM10. The estimates were made considering LADD and the corresponding ILCR. The LADD for children ranged from 0.34·10−7 to 17.70·10−6, while for adults it ranged from 1.2·10−8 to 6.3·10−7. The ILCR for children ranged from 7.34·10−7 to 7.79·10−6, while for adults it ranged from 0.3·10−8 to 3.04·10−6. The acceptable ILCR was not exceeded for either children or adults. According to US EPA guidelines, the acceptable ILCR range typically lies between 1 × 10⁻⁶ and 1 × 10⁻⁴, indicating that the cancer risk associated with exposure to PAHs bound to PM10 is within acceptable levels for the studied population [16]. The highest values were recorded at station 6, where during the winter season, this parameter was over 15 times higher compared to the summer season.

4. Conclusions

The concentrations of PAHs in the air vary depending on location, season, and meteorological conditions. In urban areas, where there is intense industrial activity and high traffic volume, these values are generally higher than in rural areas. During the winter months, due to increased heating and the use of solid fuels, PAH concentrations may rise. Monitoring the concentration of PAHs in the air is an important aspect of air quality assessment due to their toxic properties, including potential carcinogenic effects.
The results of the PCA showed that the first principal component explains a significant portion of the total variance, suggesting that it may represent more universal sources of pollution, such as road traffic or diffuse combustion sources. In contrast, the second principal component may indicate more specific, local sources, such as coal burning, industrial emissions, or increased presence of dust associated with industrial activity. The correlation analysis revealed varied, site-specific relationships between PAH and PM10 concentrations, indicating a diverse emission source profile across different regions. Particularly strong correlations were observed in areas with intensive industrial and traffic activities.
Regarding the assessment of health risk for adults and children exposed to airborne PAHs through inhalation of PM10, the results indicate that the permissible ILCR values were not exceeded for either age group. The cancer risk based on ILCR remained within acceptable limits for both children and adults, meaning that the risk thresholds defined by the U.S. EPA.
However, PAH concentrations and the associated health risks remain a significant issue, particularly during the winter season and in areas with high industrial and transport activity, which requires further monitoring and actions aimed at improving air quality.
A detailed analysis of the seasonal and spatial variability of PAH concentrations associated with PM10 was conducted in areas of Poland with different emission characteristics. Furthermore, the application of PCA combined with health risk assessment allowed for better differentiation between universal and local pollution sources and their potential impact on residents’ health. The results emphasize the importance of continuous monitoring and an integrated approach to air quality management, which is crucial for the effective development of environmental policies in Poland and countries with similar emission profiles.

Supplementary Materials

The following supporting information can be downloaded at: https://www.mdpi.com/article/10.3390/app15126551/s1.

Author Contributions

Conceptualization, M.K.; methodology, M.K. and S.Z.; software, M.K.; formal analysis, M.K.; investigation, M.K. and S.Z.; data curation, M.K.; writing—original draft preparation, M.K.; writing—review and editing, M.K.; visualization, M.K.; supervision, S.Z. All authors have read and agreed to the published version of the manuscript.

Funding

Financed by the Minister of Science and Higher Education Republic of Poland within the program “Regional Excellence Initiative”.

Institutional Review Board Statement

Not applicable.

Informed Consent Statement

Not applicable.

Data Availability Statement

Data is contained within the article or Supplementary Materials. The original contributions presented in this study are included in the article/Supplementary Materials. Further inquiries can be directed to the corresponding author.

Conflicts of Interest

The authors declare no financial interests/personal relationships that may be considered as potential competing interests.

References

  1. IARC. Outdoor Air Pollution. In Monographs on the Evaluation of Carcinogenic Risks to Humans; IARC Publications: Lyon, France, 2016; Volume 109. [Google Scholar]
  2. WHO. Billions of People Still Breathe Unhealthy Air: New WHO Data. 2022. Available online: https://www.who.int/news/item/04-04-2022-billions-of-people-still-breathe-unhealthy-air-new-who-data (accessed on 14 May 2025).
  3. Tobiszewski, M.; Namieśnik, J. PAH diagnostic ratios for the identification of pollution emission sources. Environ. Pollut. 2012, 162, 110–119. [Google Scholar] [CrossRef] [PubMed]
  4. Książek, S.; Kida, M.; Koszelnik, P. The occurrence and source of polycyclic aromatic hydrocarbons in bottom sediments of the Wisłok river. Polish J. Natural Sci. 2016, 31, 373–386. [Google Scholar]
  5. Arregocés, H.A.; Bonivento, G.J.; Ladino, L.A.; Beristain-Montiel, E.; Restrepo, G.; Miranda, J.; Alvarez-Ospina, A.; Rojano, R. Human health risk assessment of PM10-bound heavy metals and PAHs around the Latin America’s Largest opencast coal mine. Environ. Sci. Pollut. Res. 2023, 30, 125915–125930. [Google Scholar] [CrossRef]
  6. Hong, H.; Yin, H.; Wang, X.; Ye, C. Seasonal variation of PM10-bound PAHs in the atmosphere of Xiamen, China. Atmos. Res. 2007, 85, 429–441. [Google Scholar] [CrossRef]
  7. Lara, S.; Villanueva, F.; Martín, P.; Salgado, S.; Moreno, A.; Sánchez-Verdú, P. Investigation of PAHs, nitrated PAHs and oxygenated PAHs in PM10 urban aerosols. A comprehensive data analysis. Chemosphere 2022, 294, 133745. [Google Scholar] [CrossRef] [PubMed]
  8. IARC. Some Non-Heterocyclic Polycyclic Aromatic Hydrocarbons and Some Related Exposures. In IARC Monographs on the Evaluation of Carcinogenic Risks to Humans; IARC Publications: Lyon, France, 2010; Volume 92, p. 1. [Google Scholar]
  9. IARC. Monographs on the Identification of Carcinogenic Hazards to Humans; IARC Publications: Lyon, France, 2021. [Google Scholar]
  10. Ravindra, K.; Sokhi, R.; Vangrieken, R. Atmospheric polycyclic aromatic hydrocarbons: Source attribution, emission factors and regulation. Atmos. Environ. 2008, 42, 2895–2921. [Google Scholar] [CrossRef]
  11. Gajewska, M.; Artichowicz, W.; Kida, M.; Kołecka, K.; Fitobór, K.; Ulańczyk, R. Occurrence of specific pollutants in a mixture of sewage and rainwater from an urbanized area. Sci. Rep. 2024, 14, 18119. [Google Scholar] [CrossRef]
  12. Jandacka, D.; Durcanska, D.; Nicolanska, M.; Holubcik, M. Impact of Seasonal Heating on PM10 and PM2. 5 Concentrations in Sučany, Slovakia: A Temporal and Spatial Analysis. Fire 2024, 7, 150. [Google Scholar] [CrossRef]
  13. Andersen, Z.J.; Badyda, A.; Tzivian, L.; Dzhambov, A.M.; Paunovic, K.; Savic, S.; Jacquemin, B.; Dragic, N. Air pollution inequalities in Europe: A deeper understating of challenges in Eastern Europe and pathways forward towards closing the gap between East and West. Environ. Epidemiol. 2025, 9, e383. [Google Scholar] [CrossRef]
  14. Bandowe, B.A.M.; Meusel, H.; Huang, R.J.; Ho, K.; Cao, J.; Hoffmann, T.; Wilcke, W. PM2.5-bound oxygenated PAHs, nitro-PAHs and parent-PAHs from the atmosphere of a Chinese megacity: Seasonal variation, sources and cancer risk assessment. Sci. Total. Environ. 2014, 473, 77–87. [Google Scholar] [CrossRef]
  15. Chief Inspectorate of Environmental Protection (GIOŚ). Air Quality Report in Poland 2022. 2023. Available online: https://powietrze.gios.gov.pl/pjp/archives (accessed on 6 December 2024).
  16. USEPA (United States Environmental Protection Agency). Guidelines for Carcinogenic Risk Assessment. 2005. Available online: https://www.epa.gov/risk/guidelines-carcinogen-risk-assessment (accessed on 26 January 2025).
  17. Nadal, M.; Schuhmacher, M.; Domingo, J.L. Levels of PAHs in soil and vegetation samples from Tarragona County, Spain. Environ. Pollut. 2004, 132, 1–11. [Google Scholar] [CrossRef]
  18. Bortey-Sam, N.; Ikenaka, Y.; Akoto, O.; Nakayama, S.M.; Yohannes, Y.B.; Baidoo, E.; Mizukawa, H.; Ishizuka, M. Levels, potential sources and human health risk of polycyclic aromatic hydrocarbons (PAHs) in particulate matter (PM10) in Kumasi, Ghana. Environ. Sci. Pollut. Res. 2015, 22, 9658–9667. [Google Scholar] [CrossRef] [PubMed]
  19. USEPA (United States Environmental Protection Agency). 2013. Available online: https://cfpub.epa.gov/si/si_public_record_report.cfm?dirEntryId=284802&Lab=NHSRC&fed_org_id=1253&subject=Homeland%20Security%20Research&view=desc&sortBy=pubDateYear&showCriteria=1&count=25&searchall=decontamination%20AND%20conference (accessed on 26 January 2025).
  20. Directive 2008/50/EC of the European Parliament and of the Council of 21 May 2008 on ambient air quality and cleaner air for Europe. Off. J. Eur. Union. 2008, 152, 1–44.
  21. Callén Romero, M.S.; Iturmendi, A.; López Sebastián, J.M.; Mastral Lamarca, A.M. Source apportionment of the carcinogenic potential of polycyclic aromatic hydrocarbons (PAH) associated to airborne PM10 by a PMF model. Environ. Sci. Pollut. Res. 2013, 21, 2064–2076. [Google Scholar] [CrossRef] [PubMed]
  22. Sanchez-Pinero, J.; Moreda-Pineiro, J.; Concha-Grana, E.; Fernandez-Amado, M.; Muniategui-Lorenzo, S.; Lopez-Mahía, P. Inhalation bioaccessibility estimation of polycyclic aromatic hydrocarbons from atmospheric particulate matter (PM10): Influence of PM10 composition and health risk assessment. Chemosphere 2021, 263, 127847. [Google Scholar] [CrossRef]
  23. Teixeira, J.; Delerue-Matos, C.; Morais, S.; Oliveira, M. Environmental contamination with polycyclic aromatic hydrocarbons and contribution from biomonitoring studies to the surveillance of global health. Environ. Sci. Pollut. Res. 2024, 31, 54339–54362. [Google Scholar] [CrossRef] [PubMed]
  24. Jakovljević, I.; Pehnec, G.; Vađić, V.; Čačković, M.; Tomašić, V.; Jelinić, J.D. Polycyclic aromatic hydrocarbons in PM 10, PM 2.5 and PM 1 particle fractions in an urban area. Air Qual. Atmos. Health 2018, 11, 843–854. [Google Scholar] [CrossRef]
  25. Naydenova, S.; Veli, A.; Mustafa, Z.; Hudai, S.; Hristova, E.; Gonsalvesh-Musakova, L. Atmospheric levels, distribution, sources, correlation with meteorological parameters and other pollutants and health risk of PAHs bound in PM2. 5 and PM10 in Burgas, Bulgaria—A case study. J. Environ. Sci. Health Part A 2022, 57, 306–317. [Google Scholar] [CrossRef]
  26. Directive 2004/107/EC of the European Parliament and of the Council relating to arsenic, cadmium, mercury, nickel and polycyclic aromatic hydrocarbons in ambient air. Off. J. Eur. Union. 2005, 23, 3–16.
  27. Khalili, N.R.; Scheff, P.A.; Holsen, T.M. PAH source fingerprints for coke ovens, diesel and, gasoline engines, highway tunnels, and wood combustion emissions. Atmos. Environ. 1995, 29, 533–542. [Google Scholar] [CrossRef]
  28. Park, S.S.; Kim, Y.J.; Kang, C.H. Atmospheric polycyclic aromatic hydrocarbons in Seoul, Korea. Atmos. Environ. 2002, 36, 2917–2924. [Google Scholar] [CrossRef]
  29. Di Vaio, P.; Cocozziello, B.; Corvino, A.; Fiorino, F.; Frecentese, F.; Magli, E.; Onorati, G.; Saccone, I.; Santagada, V.; Settimo, G.; et al. Level, potential sources of polycyclic aromatic hydrocarbons (PAHs) in particulate matter (PM10) in Naples. Atmos. Environ. 2016, 129, 186–196. [Google Scholar] [CrossRef]
  30. Bari, M.A.; Baumbach, G.; Kuch, B.; Scheffknecht, G. Particle-phase concentrations of polycyclic aromatic hydrocarbons in ambient air of rural residential areas in southern Germany. Air Qual. Atmos. Health 2010, 3, 103–116. [Google Scholar] [CrossRef] [PubMed]
Figure 1. Location of monitoring points: 1 Osieczów, 2 Opole, 3 Rzeszów, 4 Gdańsk, 5 Kielce, 6 Katowice, 7 Olsztyn, 8 Szczecin.
Applsci 15 06551 g001
Figure 2. PM10 dust concentration at individual measuring stations.
Applsci 15 06551 g002
Figure 3. The concentration of total PAHs at individual monitoring stations.
Applsci 15 06551 g003
Figure 4. The annual average concentration of individual PAHs at the analyzed monitoring stations.
Applsci 15 06551 g004
Figure 5. Concentration of PM10 and individual PAHs; (a) station 1; (b) station 2; (c) station 3; (d) station 4; (e) station 5; (f) station 6; (g) station 7; (h) station 8.
Applsci 15 06551 g005
Figure 6. PCA for individual measurement stations; (a) station 1; (b) station 2; (c) station 3; (d) station 4; (e) station 5; (f) station 6; (g) station 7; (h) station 8.
Applsci 15 06551 g006aApplsci 15 06551 g006b
Table 1. BaPeq, LADD, and ILCR of PAHs.
PAHsBaPeqLADD [mg/kg/d]ILCR
ChildAdultChildAdult
BaA0.03–0.202.14·10−7–13.44·10−77.6·10−8–4.78·10−71.31·10−7–8.2·10−74.6·10−8–2.92·10−7
BaP0.04–3.661.2·10−7–14.04·10−74.3·10−8–4.99·10−77.34·10−7–8.56·10−62.61·10−7–3.04·10−6
BbF0.06–2.423.54·10−7–17.70·10−712.6·10−8–6.3·10−70.22·10−7–1.08·10−70.8·10−8–3.8·10−8
BjF0.02–1.831.59·10−7–14.09·10−75.7·10−8–5.01·10−70.1·10−7–0.86·10−70.3·10−8–3.01·10−8
BkF0.03–0.831.88·10−7–8.53·10−76.7·10−8–3.04·10−70.11·10−7–0.52·10−70.4·10−8–1.9·10−8
DBahA0.005–0.100.34·10−7–12.77·10−71.2·10−8–4.54·10−72.09·10−7–7.79·10−67.4·10−8–2.77·10−6
IP0.04–2.082.36·10−7–11.77·10−78.4·10−8–4.19·10−71.44·10−7–7.18·10−75.1·10−8–2.55·10−7
Disclaimer/Publisher’s Note: The statements, opinions and data contained in all publications are solely those of the individual author(s) and contributor(s) and not of MDPI and/or the editor(s). MDPI and/or the editor(s) disclaim responsibility for any injury to people or property resulting from any ideas, methods, instructions or products referred to in the content.

