Article

An Optimally Oriented Coherence Attribute Method and Its Application to Faults and Fracture Sets Detection in Carbonate Reservoirs

1
State Key Laboratory of Petroleum Resources and Engineering, China University of Petroleum, Beijing 102249, China
2
Research Institute of Petroleum Exploration and Development, Northwest, Lanzhou 730020, China
*
Authors to whom correspondence should be addressed.
Appl. Sci. 2025, 15(13), 7393; https://doi.org/10.3390/app15137393
Submission received: 17 May 2025 / Revised: 25 June 2025 / Accepted: 27 June 2025 / Published: 1 July 2025
(This article belongs to the Section Earth Sciences)

Abstract

Faults and fracture sets in carbonate reservoirs are key geological features that govern hydrocarbon migration, accumulation, and wellbore stability. Their accurate detection is essential for structural interpretation, reservoir modeling, and drilling risk assessment. In this study, we propose an Optimally Oriented Coherence Attribute (OOCA) method that integrates geological guidance with multi-frequency structural analysis to achieve enhanced sensitivity to faults and fractures across multiple scales. The method is guided by depositional and tectonic principles, constructing model traces along directions with maximal structural variation to amplify responses at geological boundaries. A distance-weighted computation and extended directional model trace strategy are adopted to further enhance the detection of fine-scale discontinuities, overcoming the limitations of traditional attributes in resolving subtle structural features. A Gabor-based multi-frequency fusion framework is employed to simultaneously preserve large-scale continuity and fine-scale detail. Validation using physical modeling and field seismic data confirms the method’s ability to enhance weak fault imaging. Compared to traditional attributes such as C3 coherence, curvature, and instantaneous phase, OOCA delivers significantly improved spatial resolution. In zones with documented lost circulation, the identified structural features align well with drilling observations, demonstrating strong geological adaptability and engineering relevance. Overall, the OOCA method offers a geologically consistent and computationally efficient solution for high-resolution fault interpretation and drilling risk prediction in structurally complex carbonate reservoirs.

1. Introduction

With the gradual advancement of oil and gas exploration and development from conventional structures to concealed and complex areas, reservoir characterization has become increasingly crucial for boosting development efficiency and managing geological risks [1]. Especially in tectonic zones caused by faults and abrupt lithological changes, accurately delineating reservoir boundaries, faults, and heterogeneity zones remains a key technical issue for improving the oil and gas discovery rate and development benefits [2]. Seismic attribute analysis has emerged as a critical bridge between seismic data and geological structure, playing an essential role in reservoir prediction, tectonic interpretation, and sedimentary system analysis [3,4,5]. The typical structural attributes include curvature, coherence, variance, phase, and ant tracking. Among these, coherence attributes are particularly valued for the ability to detect spatial discontinuity [6,7,8]. Thus, they are considered as vital tools to identify faults, channels, and other subsurface discontinuities [9,10].
Coherence is essentially a similarity measure to capture lateral inconsistencies in seismic events due to variations of tectonics and strata. Since the introduction of the first-generation coherence algorithm by Bahorich and Farmer [11], the technique has undergone extensive development. The second-generation methods incorporated various similarity metrics, such as structural similarity and energy consistency [12,13], while the third-generation approaches based on structure tensors and eigenvalue decomposition significantly improved sensitivity to local structure [14,15]. Tensor-based methods [16,17] further enhanced the ability to characterize the geometric shape of events. Additional improvements, such as dynamic time warping [18] and a series of post-processing techniques [19,20,21,22,23,24,25,26,27,28], to a certain extent, not only contribute to noise suppression but also clarify boundaries.
To further expand the coherence attributes, various strategies have been proposed in terms of model trace construction, frequency fusion, and azimuth enhancement. Lu et al. [29] introduced the concept of “super-traces” combined with adjacent traces using fourth-order statistics to detect subtle features. Li and Lu [30] fused coherence slices across different frequency bands using RGB techniques for multi-scale geological body identification. Building on this, Li [31], inspired by Sui [32], applied multi-spectral covariance matrices and eigenvalue decomposition, overcoming the three-frequency limitation of traditional RGB fusion. Qi [33] proposed coherence calculations based on data divided by azimuth to assist with velocity analysis. Yuan [34] integrated geologically steered complex coherence [35] with instantaneous phase [36] to produce a phase-guided coherence volume for 3D discontinuity detection. Zhao [37] further introduced weighted functions and dip-scanning strategies to enhance breakpoint localization and noise robustness. Yuan [38] proposed conducting geological-oriented coherence attribute analysis based on intelligent high-resolution seismic processing and validated the reliability of the high-resolution and structure-guided coherence computation using drilling engineering data. In recent years, deep learning-based fault detection methods have also made certain progress [39,40,41]. Nevertheless, they remain limited by high dependence on labeled data and insufficient ability to cross-regional generalization.
However, conventional coherence-based methods still face two fundamental challenges when applied to structurally complex settings. First, most approaches rely on fixed-direction windows or symmetric weighting schemes, which lack adaptability to variations in reflector orientation. This limitation becomes particularly pronounced near fault bends, flexures, or stratigraphic unconformities, where structural boundaries often become blurred or misaligned. Second, although some recent studies have explored frequency-dependent structural responses [42,43,44], most methods remain limited to separate frequency band computations without true fusion. Existing fusion strategies typically apply fixed energy-based weighting, which fails to fully exploit the complementary information across frequency bands. As a result, these approaches struggle to simultaneously preserve large-scale fault continuity and resolve fine-scale fracture details. To overcome these limitations, we propose an Optimally Oriented Coherence Attribute (OOCA) method that integrates geological guidance with multi-frequency structural analysis. The method constructs a set of structure-oriented paired complex model traces based on local dip estimation, enabling directional coherence evaluation across dip-orthogonal trace pairs. The direction with the lowest coherence—indicating maximum discontinuity—is automatically selected as the optimal direction. A distance-weighted scheme is further introduced to enhance local structural sensitivity, and a Gabor-based multi-frequency fusion strategy is employed to jointly enhance the expression of both large-scale fault frameworks and subtle discontinuities. This approach offers a more adaptive, geologically consistent, and computationally efficient solution for fault and fracture detection in carbonate reservoirs.

2. Methodology

2.1. Directional Framework for Discontinuity Detection

In sedimentary and structural settings, regions such as intra-channel zones or the same side of a fault often belong to a unified depositional system or structural unit, characterized by consistent lithologic composition, physical properties, and sedimentary architecture (indicated by the green arrow in Figure 1). As a result, when observed along the channel axis or fault strike direction, lateral geological variations are relatively subtle, and seismic reflections tend to exhibit limited structural contrast. In contrast, observation paths oriented perpendicular to the structural trend are more likely to intersect different facies belts, opposing fault blocks, or lithological transition zones, leading to pronounced geological differences. These differences typically manifest in seismic data as enhanced amplitude variations, phase discontinuities, and other strong lateral changes. This sedimentary-geological principle provides a physical basis for directional structural detection: by scanning directions and selecting the one that best highlights lateral variations, it becomes possible to more effectively delineate geological discontinuities such as faults and channels.
In this study, we introduce a directional coherence strategy based on the principle of maximizing central trace prediction error. The core idea is as follows: if the analysis point lies on a fault or channel boundary, the predicted center trace generated from the direction perpendicular to the structural trend will differ significantly from that generated in the parallel direction. As a result, the cross-correlation between these two predicted traces will reach its minimum. Unlike traditional methods, this strategy uses prediction consistency as a direction selection criterion, making the search more geologically meaningful and sensitive to discontinuities. Moreover, it achieves optimal direction identification with reduced computational cost. The following sections provide a detailed explanation of the method’s underlying principles.

2.2. Dip Estimation Based on Structure Tensor

In coherence-based structural analysis, dip estimation is a critical step to ensure that reflector-parallel features are preserved during attribute calculation. Local dip vectors define the dominant orientation of seismic events and are used to guide directional trace construction and alignment. In this study, we adopt a structure tensor–based approach for dip estimation, which offers robustness to noise and high precision in complex geological settings.
To enhance the structural sensitivity of dip estimation and reduce the impact of amplitude variations, the real-valued seismic trace x t is first converted into its complex analytic form using the Hilbert transform [45]:
z t = x t + i · H ( x ( t ) ) = A ( t ) e i φ ( t ) ,
where H ( x ( t ) )   denotes the Hilbert transform of the original signal x t , i is imaginary unit, A ( t ) is the instantaneous amplitude, and   φ ( t )   is the instantaneous phase.
In order to ignore the amplitude, the instantaneous complex seismic trace is usually normalized as
y ( t ) = z ( t ) z ( t ) = e i φ ( t )
This normalized complex trace preserves the reflector geometry while suppressing amplitude discontinuities. It also improves the stability and accuracy of subsequent gradient and tensor calculations.
To estimate local reflector orientation, spatial gradients of the normalized phase-only trace y ( t ) are computed in three orthogonal directions: vertical (z), inline (x), and crossline (y). The partial derivatives G z , G x , G y represent the rate of phase change in each respective direction. These gradient components are used to construct the local structure tensor T R 3 × 3 , defined as
T = G z 2 G z G x G z G y G x G z G x 2 G x G y G y G z G y G x G y 2 ,
where · denotes local Gaussian-weighted averaging to suppress high-frequency noise. The structure tensor captures the directional variance of seismic waveform changes within a neighborhood, providing a compact and robust representation of local structural orientation.
It can be seen from Equation (3) that the structure tensor T is a symmetric positive semi-definite matrix, so its eigenvalues are non-negative. Then, eigenvalue decomposition is performed on the structure tensor:
T = λ 1 v 1 v 1 + λ 2 v 2 v 2 + λ 3 v 3 v 3 ,
where λ 1 λ 2 λ 3 0 are the eigenvalues, and v i R 3 × 3 are the corresponding unit eigenvectors. The eigenvector v 1 = ( u z , u x , u y ) associated with the largest eigenvalue represents the direction of maximum local phase coherence, which is orthogonal to the seismic reflector. Based on this orientation vector, the apparent dips in inline and crossline directions are computed as
α = u x u z , β = u y u z ,
where α and β represent the slope (dip) of reflectors in the x and y directions, respectively. These dip fields serve as geometric constraints for directional trace alignment in the following steps.
To prevent local dip vectors from becoming unstable due to noise or low signal quality, we apply a slope-clipping operation to limit extreme values. Specifically, the apparent dips in inline and crossline directions are constrained as
α c l i p = s g n ( α ) · m i n ( α , α m a x ) ,
β c l i p = s g n ( β ) · m i n ( β , β m a x ) ,
where · denotes the absolute value, s g n ( · ) returns 1 when the input is positive, −1 when the input is negative, and 0 when it is zero; m i n ( · ) obtains the minimum value in the input array. Here, α m a x , β m a x are predefined maximum allowable dip values. This prevents excessive misalignment during structural correction.
Using the clipped dip fields, each trace within the analysis window is realigned to match the local structural trend of the central trace. The corrected trace at index ( i , j ) is interpolated in the time domain as
y ¯ ( t , i , j ) = x t + α c l i p ( i M + 1 2 ) x + β c l i p ( j N + 1 2 ) y ,
where M × N denotes the size of the lateral coherence window; x and y are spatial sampling intervals of inline and crossline.

2.3. Distance-Weighted Structure-Oriented Paired Model Trace Construction

To begin with, a certain number of direction pairs are set to form the model trace. The directions perpendicular to each other are considered as a pair, as shown in Figure 2b with straight lines of the same color. Note that it may be necessary to form some pseudo seismic traces as hollow circles, as shown in Figure 2b. It can be calculated via the inverse distance weighted averaging method, leveraging the two adjacent traces of each hollow circle. Then, all seismic traces, including the pseudo ones, are assigned weights based on the distance from the center trace. In this paper, the Gaussian function is used to weight the seismic traces. Greater weight is assigned to the adjacent traces of the center trace, while smaller weight is allocated to those farther away from it.
To form a model trace in each direction, the inverse distance weighted averaging method is also adopted, while the center trace is removed, as shown in Figure 2c. Subsequently, recalculate the weights to ensure the sum of seismic trace weights in each direction equals one. For the lth direction, the weights are recalculated as
w l , j = w l , j j = 1 J l w l , j ,   j J l + 1 2
where J l is the number of seismic traces in the l direction, and   w l , j is the weight of the j trace in the l direction. It must be pointed out that the number of seismic traces in each direction is singular, and the trace number of the center trace in the l direction is always J l + 1 2 . However, since the center trace is removed during model trace construction, the number of traces involved in model trace calculation is even. The model trace in l direction can be written by following
y ^ l = j = 1 J l w l , j y ¯ l , j , j J l + 1 2
where y ¯ l , j is the j trace after dip correction in the l direction. The model trace construction is essentially to predict the center trace in different directions.

2.4. Optimally Oriented Coherence Calculation with Multi-Frequency Fusion

To further enhance the multi-scale responsiveness of the optimally oriented coherence attribute in complex structural interpretation, this study introduces a Gabor-based multi-frequency decomposition strategy into the directional coherence framework. The Gabor transform combines the temporal localization of a Gaussian window with the spectral resolution of the Fourier transform, enabling effective extraction of localized frequency features at different scales. This strategy allows us to obtain structural responses across multiple frequency channels from seismic signals, thereby improving the imaging capability for discontinuities of varying scales, such as small faults and narrow channels.
Specifically, given a directionally guided model trace y ^ l constructed under local dip constraints, the complex response of the lth direction at frequency f i obtained via the Gabor transform can be expressed as [46]
G l ( t , f i ) = y l ( τ ) · e ( t τ ) 2 2 σ 2 · e i 2 π f i τ d τ ,
where y l denotes the normalized complex-valued model trace along the l direction. The parameter σ controls the width of the Gaussian window function, and f i represents the center frequency of the Gabor kernel. By specifying a set of discrete frequency points f 1 , f 2 , f 3 , , f N , each directional model trace can be decomposed into multiple frequency scales, resulting in a sequence of complex-band responses G l ( t , f i ) . Here, τ is the integration variable corresponding to the time axis.
Following the Gabor-based multi-frequency decomposition of the directional model traces, complex-valued cross-correlation is performed between each pair of orthogonal directions to evaluate structural coherence at each frequency scale. Let G l ( t , f i ) and G l ( t , f i ) denote the complex Gabor responses at frequency f i along the l direction and its orthogonal counterpart l , respectively. The normalized complex cross-correlation coefficient between these two directional responses at frequency f i is then defined as
ρ l ( f i ) = t = K K ( G l ( t , f i ) G l ¯ ( f i ) ) · ( G l ( t , f i ) G l ¯ ( f i ) ) ( 2 K + 1 ) · σ G l ( f i ) · σ G l ( f i ) ,
where G l ¯ ( f i ) and G l ¯ ( f i ) denote the mean values of the complex Gabor responses along the l and l directions at frequency f i , respectively. The terms σ G l ( f i ) and σ G l ( f i ) represent the corresponding standard deviations, and the superscript asterisk ( · ) indicates the complex conjugate operation.
After obtaining the cross-correlation coefficients across all frequency components, a multi-band weighted fusion strategy is introduced to construct a comprehensive directional coherence indicator. Let the total number of frequency bands be N; the fused result can be expressed as
ρ l f u s e d ( t ) = i = 1 N w i · ρ l ( f i ) ( t ) .
To integrate directional coherence responses across different frequency scales, we adopt an energy-based weighting scheme. The fused coherence ρ l f u s e d ( t ) is computed as the weighted sum of normalized cross-correlation coefficients ρ l ( f i ) ( t ) over all frequency bands. The weight w i is determined by its relative energy contribution, defined as
w i = E i j = 1 N E j ,
where the energy E i is calculated as the sum of squared magnitudes of the Gabor responses along both the l and l directions:
E i = t G l ( t , f i ) 2 + t G l ( t , f i ) 2 .
After computing the fused coherence coefficients across all orthogonal direction pairs, we adopt a minimum-coherence selection strategy to enhance sensitivity to structural discontinuities. Specifically, let the fused coherence values corresponding to all directional pairs be defined as
c o h ( t ) = m i n ρ 1 f u e s d ( t ) , ρ 2 f u e s d ( t ) , , ρ L / 2 f u e s d ( t ) ,
where L / 2 denotes the number of orthogonal directional pairs, and c o h ( t ) represents the final coherence attribute extracted by selecting the minimum fused response across all directions at time sample t.
Conventional directional coherence methods typically rely on a set of predefined orientations, compute coherence values based on the similarity between windowed traces on either side of a central trace, and select the direction with the minimum coherence as the final result. While this approach is relatively robust, it lacks geological context, is sensitive to noise, and often incurs high computational costs. More importantly, it does not guarantee alignment with the true structural orientation, making it difficult to reliably identify the optimal direction.
Figure 3 compares the differences between the published geosteering coherence method [47] and the method proposed in this paper. In the published method, for each direction, two model traces (left and right) are constructed (magenta and cyan circles shown in Figure 3a). Then, a cross-correlation operation is performed on each direction to obtain the correlation coefficient. Finally, the minimum is considered as the final coherence. While, in this paper, only one model trace is built for each direction, and the center trace is removed. Also, the model traces in the vertical direction are subjected to cross-correlation operations. Finally, in line with the first method, the minimum is taken as the coherence.
The new method has two main advantages: higher accuracy to identify minor discontinuities and higher computational efficiency. Firstly, the method proposed by Wang (2018) [47] essentially reflects the differences between the leftmost and the rightmost seismic trace in each direction, as shown in Figure 3a. During model construction, other seismic traces, including their weights, are completely the same. Small differences between the leftmost and rightmost seismic traces caused the two model traces to be similar, yielding a high correlation coefficient. Therefore, it is difficult to identify the minor discontinuities within the analysis window. However, in the proposed method, the same seismic traces are not involved in the model trace construction. From another perspective, it is equivalent to predicting the center trace in two vertical directions. Throughout the scanning, the model traces constructed perpendicular and parallel to the discontinuities will differ significantly, thus lowering the correlation coefficient, which is beneficial to identify minor discontinuities. Secondly, unlike traditional approaches that compute symmetric cross-correlations within a moving window, OOCA constructs only one structure-oriented model trace per direction and excludes the central trace, reducing the number of cross-correlation operations by approximately 50%. Moreover, the new method, which employs the gradient structure tensor method for dip estimation, is more robust to noise than the method of estimating time shift via cross-correlation used in the first method. Therefore, the proposed method is more stable and reliable.

2.5. Methodological Workflow

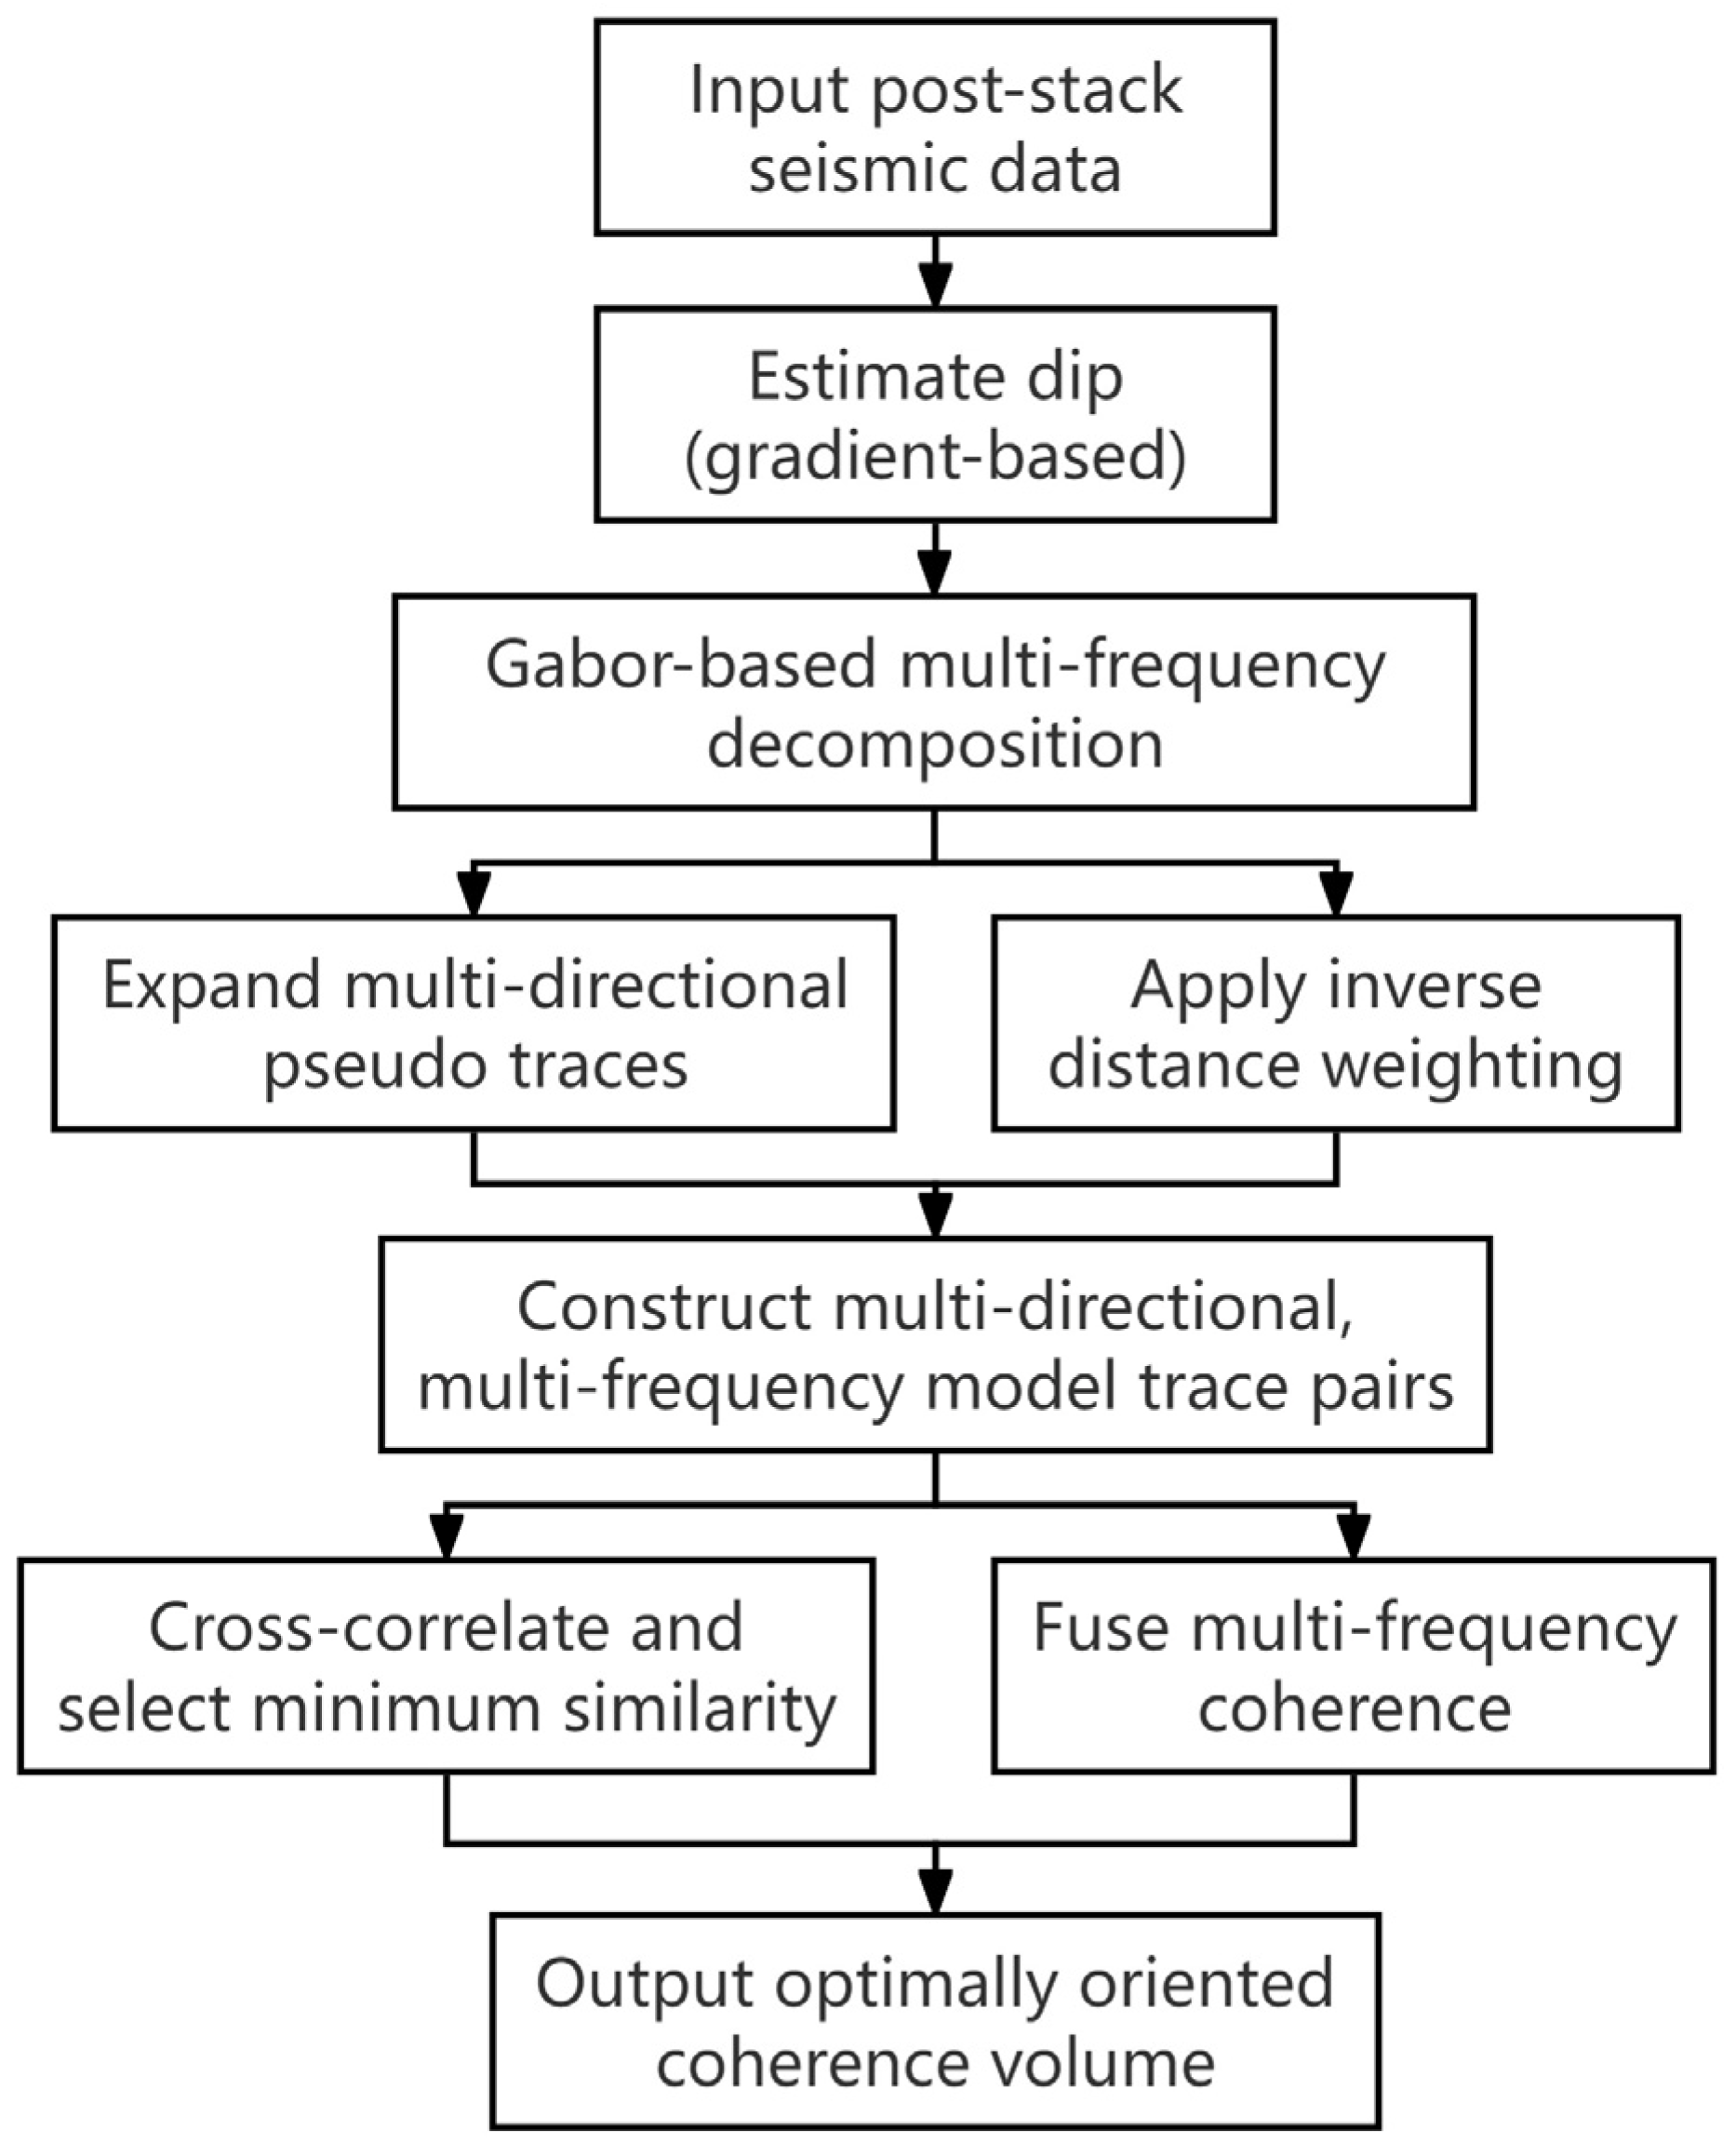
To improve clarity and reproducibility, the methodological workflow of the proposed OOCA method is summarized in Figure 4. The process begins with post-stack seismic data as input, followed by local dip estimation using a gradient-based approach. A Gabor transform is then applied for multi-frequency decomposition to capture structural variations across spectral scales. Pseudo seismic traces are extended in multiple directions and enhanced via inverse distance weighting. These components are used to construct multi-frequency, multi-direction structure-oriented model trace pairs. Cross-correlation is performed to evaluate coherence in each direction, and the direction with the lowest similarity is selected as optimal. Finally, an energy-weighted fusion of multi-frequency coherence volumes is conducted to generate a structure-consistent, high-resolution coherence attribute that simultaneously highlights large-scale faults and fine-scale discontinuities.
The method was implemented in MATLAB 2024b and tested on a Windows 11 workstation equipped with an Intel i7-12700K CPU, supporting multi-frequency and multi-core parallel computation, ensuring practical feasibility and reproducibility for researchers working with similar seismic datasets.

3. Results

3.1. Physical Modeling Data Example

To evaluate the effectiveness and robustness of the proposed optimal direction-guided coherence method in delineating subtle structural discontinuities, we first apply it to a physical modeling data set [47]. This model was designed to simulate typical subsurface complexities in deep formations, such as reverse faults, fracture systems, and lateral heterogeneity. It consists of six geological layers (Figure 5a), among which the fourth layer is selected as the target formation due to its richness in structural features.
The southern part of this layer contains four nearly east–west trending reverse faults (f1–f4) with varying displacements, cutting through multiple horizons. These faults are accompanied by several groups of intersecting fractures with variable lengths and dips, forming a tectonically intense deformation zone characterized by high-angle disruptions and discontinuous reflectors. In contrast, the northern part of the layer includes systematically configured fracture sets (marked as the black numbers 1–8) with controlled variations in density, spacing, orientation, and dip angle (Figure 5b). This design allows us to test coherence attribute responses across both complex and semi-regular discontinuity patterns.
The seismic dataset was generated via convolution between layer-based reflectivity and a 40 Hz Ricker wavelet, followed by conventional post-stack processing. This controlled experiment offers an ideal benchmark for assessing the multi-scale and multi-orientation sensitivity of the proposed coherence technique under deep exploration conditions.
As an initial validation, the proposed coherence enhancement method is first applied to three high-dimensional phase coherence volumes derived from Gabor decomposition at 10 Hz, 30 Hz, and 45 Hz, as illustrated in Figure 6a–c. The low-frequency 10 Hz coherence slice (Figure 6a) clearly delineates the large-scale fault structures in the southern part of the model, particularly capturing the overall fault trajectories (indicated by green arrows). However, it shows limited ability to detect subtle discontinuities within the northern fracture zones, as reflected by the weak responses inside the blue dashed box. The 30 Hz coherence slice (Figure 6b) achieves a balanced performance between fault clarity and noise suppression, enhancing the visibility of the northern fracture sets (blue box) while maintaining relatively low background noise. The 45 Hz coherence result (Figure 6c) further improves the resolution of small-scale features, offering sharper imaging of Fractures 1, 2, and 4 in the northern section, as well as fracture clusters adjacent to the southern main faults. Nonetheless, it introduces a considerable amount of high-frequency noise across the section.
In contrast, the fused coherence result (Figure 6d) demonstrates better overall structural imaging performance. It successfully retains the low-frequency response to large-scale fault outlines while integrating the high-frequency fracture details, thereby enhancing both structural continuity and spatial resolution. However, this fusion strategy is not without limitations. For example, the southern fault boundary becomes partially blurred due to interference from adjacent high-frequency fracture responses. This highlights a typical trade-off in multi-frequency fusion: while improving structural completeness, it may also amplify local artifacts in regions with dense discontinuities.
To compare the structural interpretation capabilities of different methods, a horizon slice from the target layer was selected to evaluate the original seismic amplitude, instantaneous phase, traditional C3 coherence, and the proposed OOCA coherence, as shown in Figure 7. The original amplitude slice (Figure 7a) exhibits continuous reflectors but lacks structural contrast in fault- and fracture-rich areas, particularly in the northern and central parts of the section, making it difficult to identify discontinuity boundaries. The instantaneous phase attribute (Figure 7b) exhibits certain structural responses to the southern fault and northern fracture sets; however, the overall imaging remains blurred, with poorly defined boundaries.
The traditional C3 coherence slice (Figure 7c) improves lateral discontinuity contrast compared to amplitude and phase attributes and delineates some fault and fracture boundaries. However, the overall fault continuity remains blurry, and responses to small-scale structures are weak, especially in the densely fractured northern region (blue box). In contrast, the OOCA coherence slice (Figure 7d) demonstrates superior performance in structural imaging. It provides clear and continuous boundaries of southern reverse faults (indicated by red arrows), accurately delineates multiple fracture sets in the north (blue and red boxes), and enhances both structural continuity and spatial resolution. Furthermore, the method preserves background reflector consistency while effectively suppressing noise, offering improved interpretability in complex areas such as fracture–fault intersections. In addition to enhancing structural imaging, the proposed OOCA method offers a practical balance between resolution and computational efficiency. Benchmark evaluation on a 3D seismic model with dimensions of 1500 × 625 × 625 under parallel computation showed that OOCA completed in 21 min, compared to 16 min for C3 coherence and 13 min for the instantaneous phase method. These results demonstrate that the method improves imaging performance without incurring excessive computational cost, making it feasible for practical applications.
To further quantify the performance differences among various methods, we conducted a comparative analysis from two perspectives: overall detection accuracy in the northern fracture zone and the minimum resolvable scale for localized discontinuities. As illustrated in Figure 5b, the northern region contains eight designed fracture sets, totaling 95 individual fractures. The proposed OOCA method successfully identifies 88 fractures, achieving a detection accuracy of 92.6%, whereas C3 coherence and instantaneous phase attributes identify 71 and 76 fractures, yielding detection rates of 74.7% and 80.0%, respectively (Table 1).
Additionally, within the red-boxed area in the northern target layer—corresponding to Fracture Set 1 (Figure 5b)—three fault groups with widths of 10 m, 20 m, and 30 m were embedded. The C3 attribute (Figure 7c) only resolves the 30 m fault, while the instantaneous phase (Figure 7b) identifies both 20 m and 30 m faults. In contrast, the OOCA method (Figure 7d) clearly delineates all three faults, including the 10 m feature. These results demonstrate that the OOCA achieves a lateral resolution of approximately 10 m under the current model configuration, significantly outperforming conventional attributes and offering notable advantages in characterizing densely distributed or fine-scale fracture systems in structurally complex settings.

3.2. Field-Data Example

The study area is located in a typical strike-slip fault zone in western China, covering approximately 100 km2. The region is characterized by complex structural settings, predominantly controlled by NE-trending strike-slip faults. Multiple sets of secondary and intersecting faults are developed within the fault zone, forming diverse structural patterns. The target interval is the Ordovician Yijianfang Formation, which is primarily composed of marine carbonate sediments. The strata are generally subhorizontal, with dense lithology and well-developed fractures. Reservoir properties are highly heterogeneous and largely controlled by the development of the fault-fracture system. Notably, due to the intensive faulting and fracturing, the target interval exhibits weak and discontinuous seismic reflections with a relatively low signal-to-noise ratio, which presents challenges for structural interpretation. In particular, internal secondary faults and small-scale fractures play a critical role in controlling reservoir connectivity and fluid migration pathways, making their accurate identification essential for reliable reservoir characterization.
It is worth noting that several wells in this area have experienced severe lost circulation while drilling through fault-intensive zones, indicating high permeability and connectivity within the structurally controlled fracture networks. This further underscores the urgent need for high-resolution structural identification in engineering practice. In this study, the seismic dataset used consists of 800 inlines (W–E) × 800 crosslines (S–N), with a time sampling interval of 1 ms and a spatial sampling interval of 25 m in both directions. This dataset provides the necessary foundation for identifying small-scale structures and discontinuities.
To assess the effectiveness of multi-frequency OOCA coherence in resolving fault structures of different scales, Figure 8 presents directional coherence slices extracted at 10 Hz, 25 Hz, and 35 Hz, along with the fused result. At 10 Hz (Figure 8a), the major strike-slip fault extending from south to north is clearly delineated, exhibiting strong continuity along its length (blue arrows). This low-frequency component effectively enhances large-scale reflector alignment but shows limited ability to resolve internal fault complexity or minor discontinuities.
In the 25 Hz coherence slice (Figure 8b), several secondary faults begin to emerge within the main fault zone (yellow arrows). These structures are partially resolved but remain blurred or discontinuous in certain segments, suggesting an improved but still limited response to medium-scale deformation. The 35 Hz slice (Figure 8c) highlights small-scale details more distinctly. Secondary faults are better separated and more clearly defined (green arrows); however, the continuity of the main fault deteriorates, with noticeable interruptions along its trace, indicating a trade-off between resolution and structural coherence at higher frequencies.
The fused result (Figure 8d) successfully integrates the complementary advantages of all frequency components. It maintains the strong lateral continuity of the main strike-slip fault while enhancing the clarity of secondary fault patterns within and around it (red arrows). Both fault boundaries and internal fracture details are well preserved, offering improved structural completeness and interpretability. This fusion result demonstrates the proposed method’s capacity to simultaneously image large-scale tectonic frameworks and fine-scale discontinuities, which is essential for accurate structural interpretation in fault-dominated reservoirs.
To comprehensively evaluate the suitability and imaging effectiveness of different seismic attributes in fault detection, we extracted horizon slices at the same target interval using the original seismic amplitude, maximum positive curvature, C3 coherence, and the proposed OOCA coherence attribute, as shown in Figure 9a–d.
The original amplitude slice (Figure 9a) mainly reflects seismic energy distribution, displaying amplitude anomalies near structural zones. However, it provides limited delineation of fault boundaries and internal details. The maximum positive curvature attribute (Figure 9b) shows sensitivity to major fault boundaries and partially reveals local secondary faults (highlighted by red and blue dashed boxes) yet lacks clarity and structural continuity in detail. The C3 coherence slice (Figure 9c) effectively enhances lateral discontinuities, clearly imaging the main fault boundaries. Nevertheless, it exhibits poor resolution of smaller-scale features in structurally complex areas such as fault intersections (see red and blue boxes).
In comparison, the OOCA coherence slice (Figure 9d) demonstrates superior continuity along the main fault and provides clearer imaging of internal small-scale faults. Areas such as the fault intersection zone (red box) and the southern branching fracture clusters (blue box) are distinctly and continuously resolved. These results confirm that the OOCA method offers improved structural continuity and spatial resolution, providing reliable attribute support for high-precision seismic interpretation in structurally complex regions.
Figure 10 shows detailed horizon slices (a–c), extracted from the area marked by the red dashed box in Figure 9, and corresponding vertical cross-sections (d–f) through exploration well W1 along the yellow dashed line. At the slice scale, both maximum positive curvature (Figure 10a) and C3 coherence (Figure 10b) attributes partially identify major and secondary faults. However, despite some structural responses near well W1, neither clearly resolves these secondary faults effectively. In contrast, the OOCA coherence slice (Figure 10c) distinctly illustrates the spatial distribution and detailed geometry of secondary faults and branching fracture systems.
During drilling, when well W1 reached a depth of 3124 m in the fourth hole section, drilling parameters included a weight on bit of 3–6 t, flow rate of 2500–2800 L/min, pump pressure of 10–19 MPa, and rotation speed of 50–60 r/min. The on-site monitoring indicated an abrupt decrease in returns, approximately 2 MPa drop in pump pressure, rapid fluid level drop in the circulation tank, and total lost returns in the annulus, with an instantaneous leakage rate of up to 90 m3/h. After unsuccessful plugging attempts, drilling was terminated. In vertical cross-sections through well W1 (Figure 10d–f), neither the maximum positive curvature (Figure 10d) nor the C3 coherence (Figure 10e) clearly delineates the spatial extent and continuity of faults near the wellbore. Conversely, the OOCA coherence profile (Figure 10f) significantly enhances spatial resolution and clearly images detailed and continuous fault systems around the well, particularly at the severe lost circulation zone marked by the blue arrow. This directly highlights the spatial relationship between the drilling incident and complex fault development, further validating the effectiveness of the proposed OOCA method for detailed structural interpretation and drilling risk prediction in structurally complex areas.

4. Discussion

This section provides a critical evaluation of the proposed OOCA method based on the experimental findings. We examine its performance in comparison with conventional seismic attributes, clarify the contributions of its core components, explore its geological and engineering applicability, discuss limitations observed during implementation, and highlight the method’s technical innovations and broader implications.
(1)
Performance Comparison
Both physical model tests and field data applications consistently show that the OOCA method improves fault and fracture detection over conventional attributes. In controlled modeling scenarios, OOCA achieved a detection accuracy of 92.6%, substantially exceeding that of C3 coherence (74.7%) and instantaneous phase (80.0%). It also demonstrated superior spatial resolution by identifying fractures as narrow as 10 m, compared to the 20–30 m threshold of traditional methods. In field applications, OOCA effectively delineated secondary and branching fractures within complex strike-slip fault systems, addressing the long-standing trade-off between large-scale continuity and small-scale resolution that limits fixed-window and single-frequency techniques.
Despite its algorithmic sophistication, OOCA remains computationally efficient. Processing a typical 3D seismic volume required 21 min, comparable to C3 coherence (16 min), but with notably improved structural clarity. This makes it a practical alternative for workflows requiring both speed and resolution.
(2)
Frequency Integration
OOCA’s use of Gabor-based multi-frequency decomposition is central to its ability to extract structural information at multiple scales. Low-frequency components capture regional structural frameworks, while high-frequency components enhance resolution of fine-scale features such as fractures and small discontinuities. This integration enables the method to overcome the resolution–continuity trade-off commonly seen in single-frequency approaches.
The current fusion scheme employs energy-based weighting, which—while computationally efficient—may suppress important signals in low-energy bands, potentially resulting in partial blurring of features in densely fractured zones. Moreover, the method’s performance depends on the empirical selection of center frequencies and window parameters, which may limit adaptability across datasets. Future work may benefit from adaptive fusion strategies informed by spectral entropy, coherence metrics, or local structural complexity, enabling more context-aware integration.
(3)
Geological and Engineering Relevance
OOCA’s directional strategy is conceptually grounded in structural geology, reflecting the tendency for lithological changes to occur perpendicular to major structural trends. This allows the method to emphasize discontinuities that are more likely to be geologically meaningful. It is particularly suited for settings with intersecting faults or distributed fracture systems, where small-scale discontinuities may coincide with operational risks.
Field validation shows that OOCA-detected features spatially correlate with lost circulation events observed during drilling. While such correlations do not establish causality, they suggest that the method may aid in the early identification of structurally sensitive intervals. In this capacity, OOCA could serve as a useful complement to conventional pre-drill risk screening tools, especially in reservoirs with structural complexity that affects borehole stability or fluid migration.
(4)
Limitations and Influencing Factors
Although OOCA offers clear advantages, several limitations merit consideration. The use of fixed energy-based frequency weighting may underrepresent structurally relevant signals in low-energy bands, particularly in noisy or fracture-rich zones. The method also depends on dip estimation derived from structure tensors, which can degrade under poor seismic quality, potentially leading to misalignment of model traces and reduced coherence reliability.
In addition, OOCA’s effectiveness is sensitive to key parameters such as window size, directional sampling density, and dip constraints. These settings require tuning based on data characteristics and structural context. To date, validation has focused on strike-slip carbonate settings; its applicability to clastic formations, salt-influenced regions, or anisotropic media remains to be tested. These limitations should be acknowledged when extending the method to broader geological settings or integrating it into real-time workflows.
(5)
Methodological Innovation and Broader Implications
The OOCA method introduces three key innovations. First, it replaces fixed or symmetric analysis windows with a data-driven orientation strategy, selecting the optimal analysis direction by identifying orthogonal trace pairs with minimal correlation. Second, its distance-weighted model trace construction increases sensitivity to structural variations near the analysis center. Third, Gabor-based multi-frequency fusion enables balanced imaging of both large-scale continuity and small-scale discontinuities.
These developments provide practical and theoretical value. OOCA improves the clarity and reliability of fault and fracture detection, especially in complex carbonate reservoirs. Its outputs may support early identification of high-risk zones, such as densely fractured corridors, that are relevant to drilling risk mitigation. Moreover, its orientation-aware, scale-adaptive design offers a reference framework for future seismic attribute development, promoting more intelligent, geology-informed, and computationally efficient approaches to structural interpretation.

5. Conclusions

This study introduces an OOCA method designed to enhance the detection of faults and fractures in structurally complex subsurface environments. By integrating geological guidance with multi-scale frequency analysis, the method demonstrates clear advantages in both imaging quality and engineering relevance. The results from physical modeling and field seismic applications validate its robustness and applicability in real-world exploration settings.
(1)
The proposed approach is fundamentally guided by structural geology. It employs local dip estimation to construct structure-oriented paired model traces and incorporates a distance-weighted scheme to improve spatial response. This configuration enhances sensitivity to reflector geometry variations and lateral discontinuities, enabling more precise delineation of fault boundaries and structural edges.
(2)
A Gabor-based multi-frequency fusion strategy is employed to capture both low-frequency continuity and high-frequency structural detail. This fusion enables coherent imaging of large-scale fault zones while simultaneously highlighting subtle secondary fractures, thus achieving enhanced resolution across multiple spatial scales.
(3)
Comprehensive validation using both physical models and field data demonstrates that the OOCA method outperforms conventional coherence attributes—including amplitude, curvature, and traditional C3 coherence—in terms of structural clarity, resolution, and noise resistance. Notably, in areas with documented lost circulation events, the method exhibits strong alignment with engineering observations, significantly improving the reliability of pre-drilling structural interpretation and risk prediction.
In summary, the OOCA method offers a geologically consistent, directionally adaptive, and computationally efficient solution for high-resolution fault and fracture characterization. Its dual value in geophysical interpretation and drilling risk assessment highlights its potential for broad application in complex carbonate reservoirs.

Author Contributions

S.C.: Writing—original draft; S.L.: Methodology; Q.M.: Data curation; S.Y.: Supervision; L.Q.: Validation. All authors have read and agreed to the published version of the manuscript.

Funding

This work was supported in part by the R&D Department of China National Petroleum Corporation (2022DQ0604-01), Prospective, Basic, and Strategic Technology Research Project of PetroChina (2021DJ0606), and Gansu Science and Technology Program (23ZDGA004), and the CNPC Digital and Intelligent China Major Project “Petroleum and Petrochemical Industry Software”—Drilling Safety Control Software (2024ZZ46-05).

Institutional Review Board Statement

Not applicable.

Informed Consent Statement

Not applicable.

Data Availability Statement

The original contributions presented in this study are included in the article. Further inquiries can be directed to the corresponding author.

Conflicts of Interest

All the authors declare that the research was conducted in the absence of any commercial or financial relationships that could be construed as potential conflicts of interest. The funder was not involved in the study design, collection, analysis, interpretation of data, writing of this article, or decision to submit it for publication.

References

  1. Dou, L.R.; Wen, Z.X.; Wang, J.J.; Wang, Z.M.; He, Z.J.; Liu, X.B.; Zhang, N.N. Analysis of the world oil and gas exploration situation in 2021. Pet. Explor. Dev. 2022, 49, 1195–1209. [Google Scholar] [CrossRef]
  2. Zheng, L.H.; Wei, P.F.; Zhang, Z.; Nie, S.S.; Lou, X.Q.; Cui, K.X.; Fu, Y.W. Joint exploration and development: A self-salvation road to sustainable development of unconventional oil and gas resources. Nat. Gas Ind. B 2017, 4, 477–490. [Google Scholar] [CrossRef]
  3. Zhou, J.; Wu, Y.; Zhang, Q.; Nie, Z.; Ding, T.; Zhu, G. Accurate Delimitation of Mine Goaves Using Multi-Attribute Comprehensive Identification and Data Fusion Technologies in 3D Seismic Exploration. Appl. Sci. 2024, 14, 5012. [Google Scholar] [CrossRef]
  4. Shi, X.; Yang, Y.; Wu, Q.; Li, Y.; He, Y.; Tian, H.; Jiang, Z.; Bi, Z.; Miao, H. The Distribution Characteristics and Genesis Analysis of Overpressure in the Qiongzhusi Formation in the Zizhong Area, Sichuan Basin. Appl. Sci. 2025, 15, 2888. [Google Scholar] [CrossRef]
  5. Zhan, X.L.; Lu, C.; Hu, G.M. 3D structural modeling for seismic exploration based on knowledge graphs. Geophysics 2022, 87, IM81–IM100. [Google Scholar] [CrossRef]
  6. Zhang, X.M.; Ma, J.W.; Zhang, H. Curvature-regularized manifold for seismic data interpolation. Geophysics 2023, 88, WA37–WA53. [Google Scholar] [CrossRef]
  7. Liao, Z.H.; Hu, L.Y.; Huang, X.D.; Carpenter, B.M.; Marfurt, K.J.; Vasileva, S.; Zhou, Y. Characterizing damage zones of normal faults using seismic variance in the Wangxuzhuang oilfield, China. Interpretation 2020, 8, SP53–SP60. [Google Scholar] [CrossRef]
  8. Xie, Q.H.; Zhao, C.D.; Rui, Z.F.; Guan, S.J.; Zheng, W.T.; Fan, H.C. An improved ant-tracking workflow based on divided-frequency data for fracture detection. J. Geophys. Eng. 2022, 19, 1149–1162. [Google Scholar] [CrossRef]
  9. Meng, Z.W.; Sun, Z.D.; Li, G.F. A case study of complex carbonate reservoir connectivity analysis, Tarim Basin, China. Interpretation 2021, 9, B77–B87. [Google Scholar] [CrossRef]
  10. Petkovsek, C. Multilayer 3D seismic attribute analysis and fault framework modeling of shallow extensional fault systems in the Delaware Basin. Interpretation 2024, 12, T399–T412. [Google Scholar] [CrossRef]
  11. Bahorich, M.S.; Farmer, S.L. 3-D seismic discontinuity for faults and stratigraphic features: The coherence cube. Lead. Edge 1995, 14, 1053–1058. [Google Scholar] [CrossRef]
  12. Marfurt, K.J.; Kirlin, R.L.; Farmer, S.L.; Bahorich, M.S. 3-D seismic attributes using a semblance-based algorithm. Geophysics 1998, 63, 1150–1165. [Google Scholar] [CrossRef]
  13. Marfurt, K.J.; Sudhaker, V.; Gersztenkorn, A.; Crawford, K.D.; Nissen, S. Coherency calculations in the presence of structural dip. Geophysics 1999, 64, 104–111. [Google Scholar] [CrossRef]
  14. Gersztenkorn, A.; Marfurt, K.J. Eigenstructure-based coherence computations as an aid to 3-D structural and stratigraphic mapping. Geophysics 1999, 64, 1479–1486. [Google Scholar] [CrossRef]
  15. Fehmers, G.C.; Höcker, C.F.W. Fast structural interpretation with structure-oriented filtering. Geophysics 2003, 68, 1286–1293. [Google Scholar] [CrossRef]
  16. Wu, X. Directional structure-tensor based coherence to detect seismic faults and channels. Geophysics 2017, 82, A13–A17. [Google Scholar] [CrossRef]
  17. Priezzhev, I.; Danko, D.; Veeken, P.; Strecker, U.; Nikiforov, A. New High-Resolution Fault Detection Based on Dynamic Time Warping Discontinuity Edge Attribute. In Proceedings of the 81st EAGE Annual Conference & Exhibition, London, UK, 3–6 June 2019. [Google Scholar] [CrossRef]
  18. Chen, G.F.; Shi, Y.; Yang, H.D.; Song, B.Q.; Wang, W.H.; Yu, B.; Xiong, X.D. Fault identification method of attribute fusion based on seismic optimized frequency of seismic data. Chin. J. Geophys. 2023, 66, 1232–1243. [Google Scholar] [CrossRef]
  19. Li, C.; Xu, G.; Xu, F.; Yu, Q.; Liang, H. A model for faults to link the Neogene reservoirs to the Paleogene organic-rich sediments in low-relief regions of the South Bohai Sea, China. J. Pet. Sci. Eng. 2021, 200, 108360. [Google Scholar] [CrossRef]
  20. Wang, H.; Niu, R.; Han, Y.; Deng, Q. Construction of a Geological Fault Corpus and Named Entity Recognition. Appl. Sci. 2025, 15, 2465. [Google Scholar] [CrossRef]
  21. La Bruna, V.; Bezerra, F.H.; Souza, V.H.; Maia, R.P.; Auler, A.S.; Araujo, R.E.; Cazarin, C.L.; Rodrigues, M.A.; Vieira, L.C.; Sousa, M.O. High-permeability zones in folded and faulted silicified carbonate rocks implications for karstified carbonate reservoirs. Mar. Pet. Geol. 2021, 1, 105046. [Google Scholar] [CrossRef]
  22. Tian, F.; Zheng, W.; Zhao, A.; Liu, J.; Liu, Y.; Zhou, H.; Cao, W. Seismic Identification and Characterization of Deep Strike-Slip Faults in the Tarim Craton Basin. Appl. Sci. 2024, 14, 8235. [Google Scholar] [CrossRef]
  23. Qi, J.; Machado, G.; Marfurt, K.J. A workflow to skeletonize faults and stratigraphic features. Geophysics 2017, 82, O57–O70. [Google Scholar] [CrossRef]
  24. Zhao, Y.; Niu, F.; Zhang, Z.; Li, X.; Chen, J.; Yang, J. Signal detection and enhancement for seismic crosscorrelation using the wavelet-domain Kalman filter. Surv. Geophys. 2021, 42, 43–67. [Google Scholar] [CrossRef]
  25. Qi, J.; Lyu, B.; AlAli, A.; Machado, G.; Hu, Y.; Marfurt, K. Image processing of seismic attributes for automatic fault extraction. Geophysics 2018, 84, O25–O37. [Google Scholar] [CrossRef]
  26. Dar, A.M.; Bukhari, S.K.; Gull, D.S. The applications of hyperspectral remote sensing techniques in the identification of subsurface faults. An experimental study. Remote Sens. Appl. Soc. Environ. 2023, 29, 100904. [Google Scholar] [CrossRef]
  27. Gao, K.; Huang, L.; Cladouhos, T. Three-dimensional seismic characterization and imaging of the soda lake geothermal field. Geothermics 2021, 90, 101996. [Google Scholar] [CrossRef]
  28. Liu, J.; Wu, G.; Li, H.; Zhang, W.; Zheng, M.; Long, H.; Li, C.; Deng, M. Identification of Strike-Slip Faults and Their Control on the Permian Maokou Gas Reservoir in the Southern Sichuan Basin (SW China): Fault Intersections as Hydrocarbon Enrichment Zones. Energies 2024, 17, 6438. [Google Scholar] [CrossRef]
  29. Hu, S.; Alves, T.M.; Omosanya, K.O.; Li, W. Geometric and kinematic analysis of normal faults bordering continental shelves: A 3D seismic case study from the northwest South China Sea. Mar. Pet. Geol. 2021, 133, 105263. [Google Scholar] [CrossRef]
  30. Li, F.; Lu, W. Coherence attribute at different spectral scales. Interpretation 2014, 2, SA99–SA106. [Google Scholar] [CrossRef]
  31. Li, F.; Qi, J.; Lyu, B.; Marfurt, K.J. Multispectral coherence. Interpretation 2017, 6, T61–T69. [Google Scholar] [CrossRef]
  32. Sui, J.; Zheng, X.; Li, Y. A seismic coherency method using spectral amplitudes. Appl. Geophys. 2015, 12, 353–361. [Google Scholar] [CrossRef]
  33. Qi, J.; Li, F.; Marfurt, K.J. Multiazimuth coherence. Geophysics 2017, 82, O83–O89. [Google Scholar] [CrossRef]
  34. Yuan, S.; Su, Y.; Wang, T.; Wang, J.; Wang, S. Geosteering phase attributes: A new detector for the discontinuities of seismic images. IEEE Geosci. Remote Sens. Lett. 2019, 16, 145–149. [Google Scholar] [CrossRef]
  35. Wang, S.X.; Yuan, S.Y.; Yan, B.P.; He, Y.X.; Sun, W.J. Directional complex-valued coherence attributes for discontinuous edge detection. J. Appl. Geophys. 2016, 129, 1–7. [Google Scholar] [CrossRef]
  36. Barnes, A.E. A tutorial on complex seismic trace analysis. Geophysics 2007, 72, W33–W43. [Google Scholar] [CrossRef]
  37. Zhao, X.; Wang, S.; Yuan, S. An efficient and robust scheme for the implementation of eigenstructure-based coherency algorithms. Geophysics 2020, 85, O97–O108. [Google Scholar] [CrossRef]
  38. Yuan, S.; Xu, Y.; Xie, R.; Chen, S.; Yuan, J. Multi-scale intelligent fusion and dynamic validation for high-resolution seismic data processing in drilling. Petrol. Explor. Dev. 2025, 52, 607–617. [Google Scholar] [CrossRef]
  39. Dou, Y.; Li, K.; Dong, M.; Xiao, Y. FaultSSL: Seismic fault detection via semisupervised learning. Geophysics 2024, 89, M79–M91. [Google Scholar] [CrossRef]
  40. Gao, K.; Huang, L.; Zheng, Y.; Lin, R.; Hu, H.; Cladouhos, T. Automatic fault detection on seismic images using a multiscale attention convolutional neural network. Geophysics 2021, 87, N13–N29. [Google Scholar] [CrossRef]
  41. Zhang, Z.; Yan, Z.; Li, H.; Jing, J.; Yan, H.; Gu, H. 3-D Seismic Fault Detection Using Fault Orthogonal Annotation and Barely Supervised Learning. IEEE Trans. Geosci. Remote Sens. 2025, 63, 5904711. [Google Scholar] [CrossRef]
  42. Zhang, Z.; Liu, N.; Liu, R.; Lu, M.; Wei, T.; Gao, J. Adaptive Multifrequency Attribute Analysis and Its Application on Reservoir Characterization. IEEE Trans. Geosci. Remote Sens. 2024, 62, 1–10. [Google Scholar] [CrossRef]
  43. Zhang, H.; Liu, N.; Wang, Z.; Zhang, Y.; Gao, J.; Wang, J. Sand Bodies Delineation by Fusing Multifrequency Attributes via t-SNE. IEEE Geosci. Remote Sens. Lett. 2023, 20, 7501205. [Google Scholar] [CrossRef]
  44. Wang, Z.; Wang, Y.; Wang, B.; Xiang, M.; Wang, R.; Xu, W.; Song, C. Multi-Frequency Interferometric Coherence Characteristics Analysis of Typical Objects for Coherent Change Detection. Remote Sens. 2022, 14, 1689. [Google Scholar] [CrossRef]
  45. Li, Z.; Li, L.; Huang, K.; Xue, L.; Jiang, T.; Dong, J.; Wang, C.; Ding, H. The Seismic Dynamic Response Characteristics of the Steep Bedding Rock Slope Are Investigated Using the Hilbert–Huang Transform and Marginal Spectrum Theory. Appl. Sci. 2025, 15, 3078. [Google Scholar] [CrossRef]
  46. Ma, Y.W.; Margrave, G.F. Seismic depth imaging with the Gabor transform. Geophysics 2008, 73, S91–S97. [Google Scholar] [CrossRef]
  47. Wang, S.X.; Yuan, S.Y.; Wang, T.Y.; Gao, J.H.; Li, S.J. Three-dimensional geosteering coherence attributes for deep-formation discontinuity detection. Geophysics 2018, 83, O105–O113. [Google Scholar] [CrossRef]
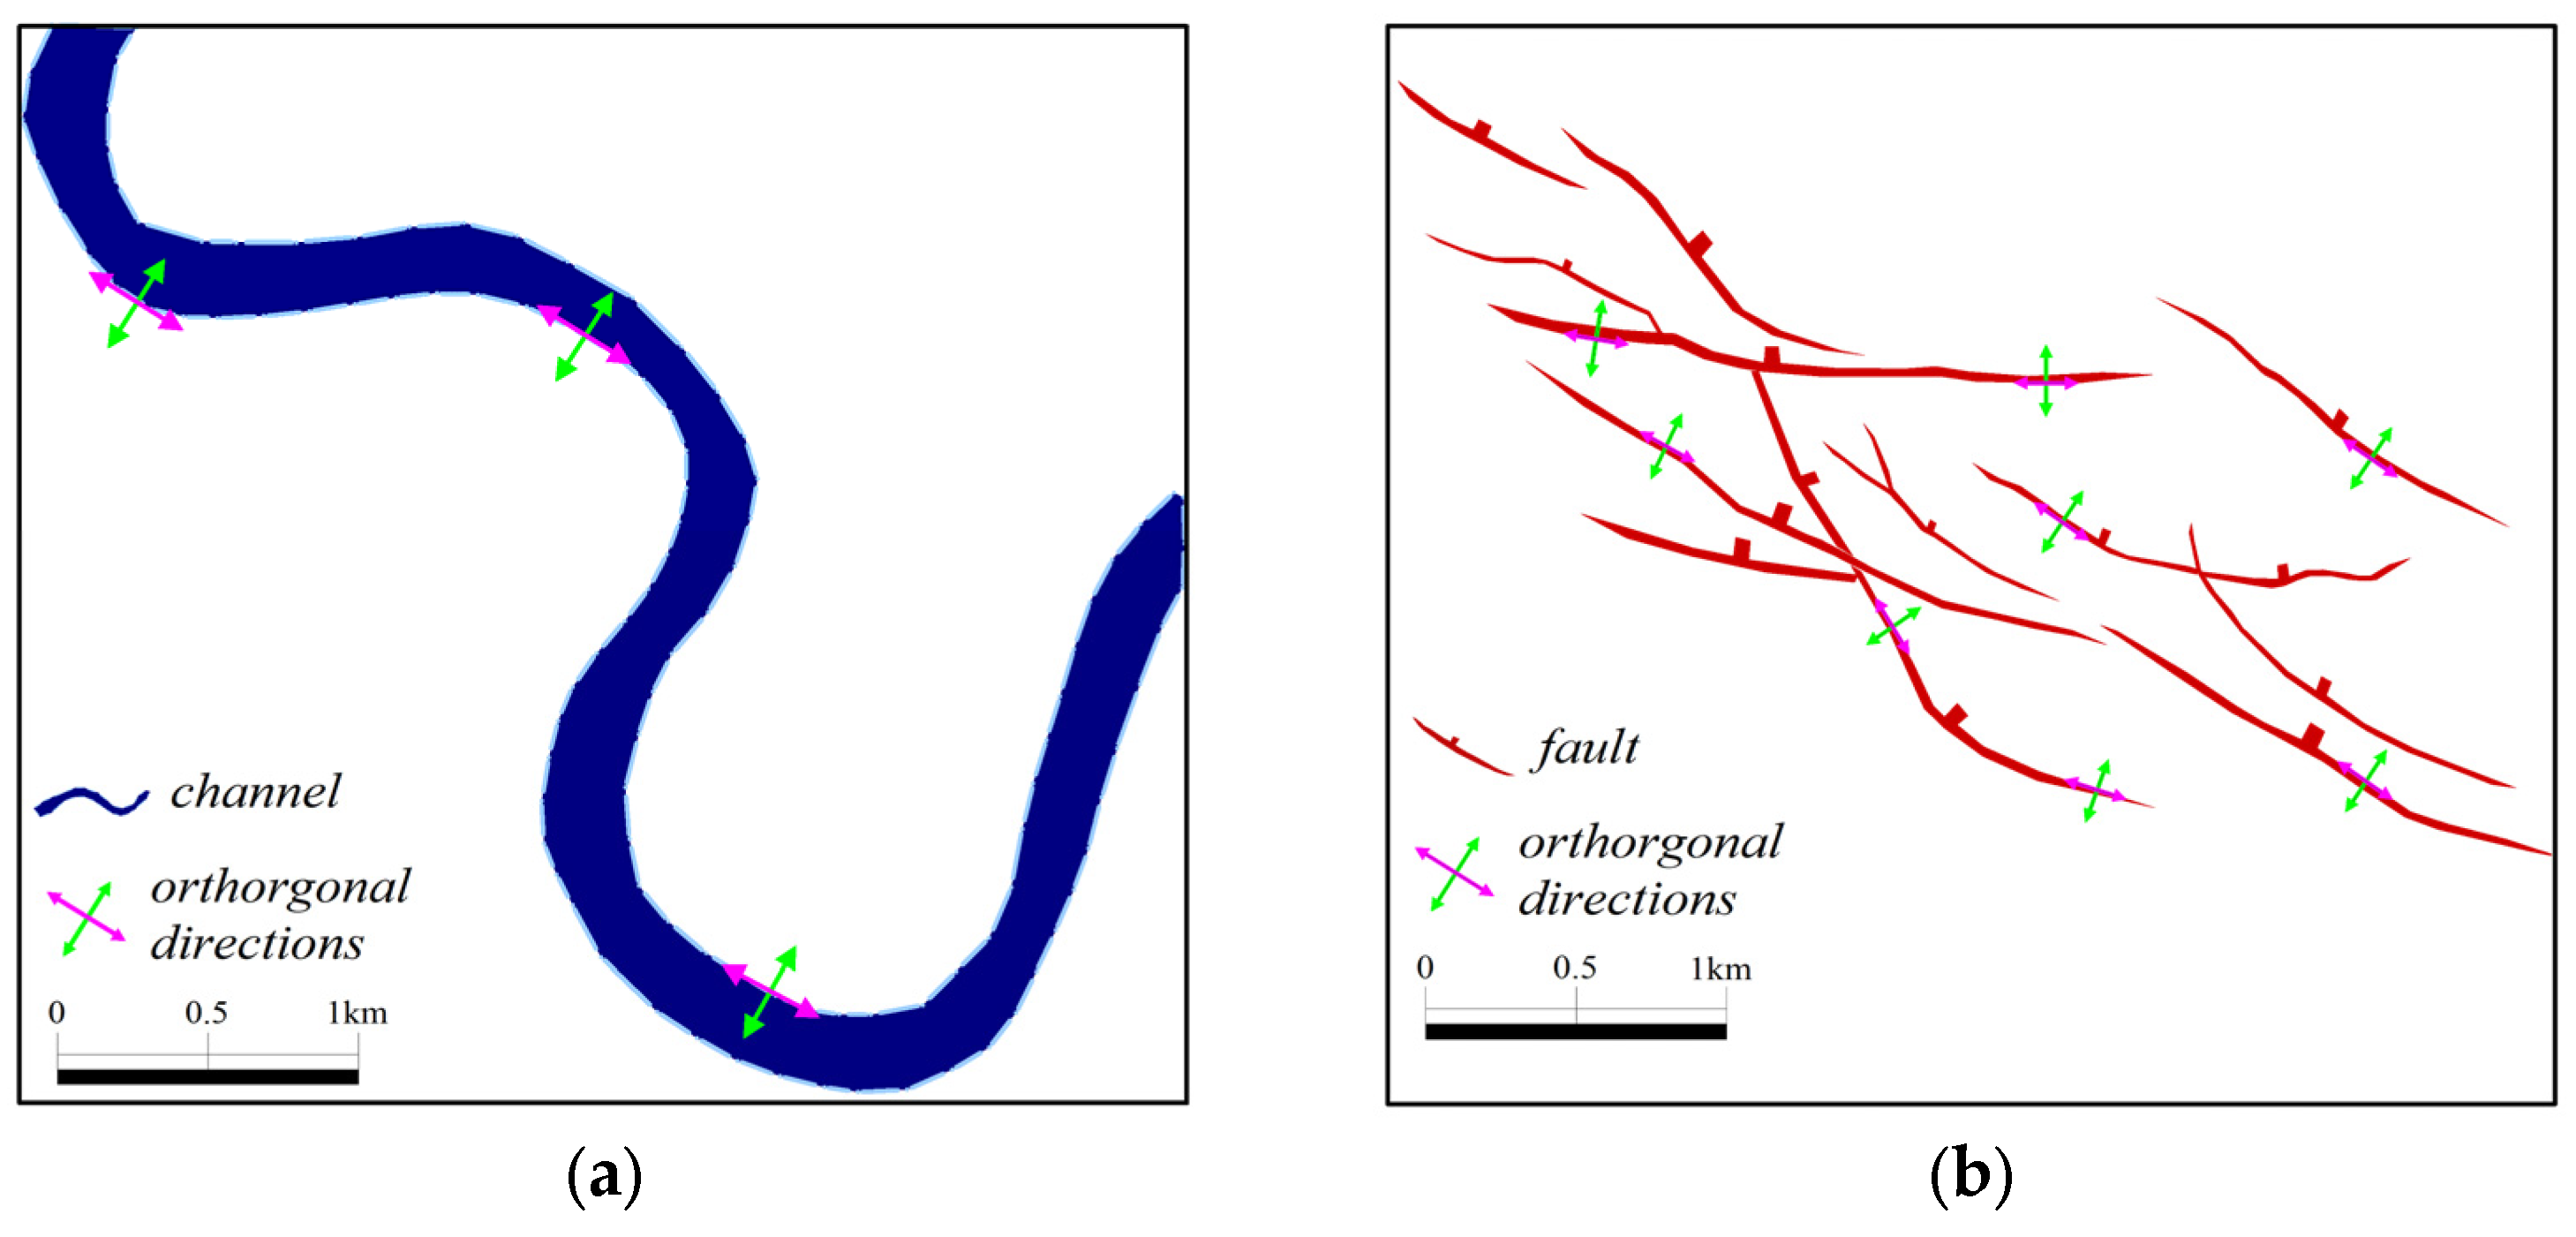
Figure 1. Schematic diagram of geological discontinuities: (a) channel; (b) fault. Green and pink arrows indicate directions perpendicular to and parallel to the discontinuities, respectively.
Applsci 15 07393 g001
Figure 2. Illustration of the original lateral analysis window (a) and the lateral analysis windows overlaid by user-defined directions (b) and after interpolation (c). Note that the red circle in (a,b) denotes the center trace, and the empty circles in (b) denote traces that need to be interpolated by their most nearby seismic traces. The colors of the circles in (c) are associated with the weights indicated by the color bar. Colored lines in (b,c) represent different directional pairs.
Applsci 15 07393 g002
Figure 3. Comparison of the geosteering coherence method in Wang (2018) [47] (a) and the proposed geosteering coherence method (b). The red circle denotes the center trace, and and denote weighted average and cross-correlation operations, respectively.
Applsci 15 07393 g003
Figure 4. Workflow of the proposed OOCA method.
Applsci 15 07393 g004
Figure 5. (a) The designed 3D physical model proposed by Wang (2018) [47] and (b) the horizon sketch of the target layer. The physical model used in this study, consisting of six layers. The fourth layer (shaded in color) is selected as the target due to its abundant structural features. The southern region includes four east–west trending reverse faults (F1–F4) and multiple intersecting fracture groups (marked as the red numbers 1–7). Colored circles indicate the locations of fracture clusters associated with different faults. The northern region contains eight systematically arranged fracture sets (marked as the black numbers 1–8), with controlled variations in density, spacing, and orientation.
Applsci 15 07393 g005
Figure 6. OOCA coherence slices at different Gabor frequencies: (a) 10 Hz, (b) 30 Hz, (c) 45 Hz, and (d) fused result. Green arrows in (a) indicate southern faults; red arrows in (ac) highlight northern fractures and southern clusters. Blue dashed boxes show frequency-dependent visibility. The fused result (d) enhances continuity but introduces slight blurring near high-frequency zones.
Applsci 15 07393 g006
Figure 7. Vertical slices of amplitude (a), instantaneous phase (b), C3 coherence (c), and OOCA coherence (d). The OOCA result in (d) shows enhanced structural clarity compared to other attributes. The red arrows indicate the superior continuity and delineation of southern reverse faults achieved by the proposed method. The blue and red boxes in the northern section highlight a dense fracture zone, where the OOCA method better captures fine-scale discontinuities compared to the C3 and phase attributes.
Applsci 15 07393 g007
Figure 8. OOCA coherence slices at (a) 10 Hz, (b) 25 Hz, (c) 35 Hz, and (d) the fused result. The main fault is highlighted in (a) (blue arrows); secondary faults become clearer in (b,c) (yellow and green arrows). The fused result ((d), red arrows) shows both high continuity and detail.
Applsci 15 07393 g008
Figure 9. Attribute slices extracted along the same horizon: (a) original seismic amplitude, (b) maximum positive curvature, (c) C3 coherence, and (d) directional coherence using the proposed OOCA method. Red and blue dashed boxes highlight areas where fault clarity and fracture detail vary significantly across methods. The OOCA result (d) offers improved fault continuity and enhanced imaging of small-scale discontinuities.
Applsci 15 07393 g009
Figure 10. Detailed attribute slices (ac), extracted from the red dashed-box area in Figure 9, and corresponding vertical cross-sections (df) passing through exploration well W1 along the yellow dashed line: (a,d) maximum positive curvature, (b,e) C3 coherence, (c,f) proposed OOCA. The red solid line indicates the well trajectory of W1, the green dashed line marks the slice position, the yellow dashed lines indicate cross-section locations, and the blue arrows denote the severe lost circulation zone encountered by well W1.
Applsci 15 07393 g010
Table 1. Detection performance on physical model data.
MethodFractures Identified (Out of 95)Detection Accuracy (%)Minimum Resolvable Width (m)
C3 Coherence7174.730
Instantaneous Phase768020
OOCA8892.610
Disclaimer/Publisher’s Note: The statements, opinions and data contained in all publications are solely those of the individual author(s) and contributor(s) and not of MDPI and/or the editor(s). MDPI and/or the editor(s) disclaim responsibility for any injury to people or property resulting from any ideas, methods, instructions or products referred to in the content.