Abstract
The pathways and mechanisms of primary hydrocarbon migration, which are still not well understood, are of great significance for evaluating both conventional and unconventional oil and gas resources, understanding the mechanisms of shale oil retention, and predicting sweet spots. To investigate the petrography, geochemistry, and pore systems of organic-rich mudstones and organic-lean sand-silt intervals in core samples from the Yanchang shale in the Ordos Basin, China, we conducted thin-section observation, X-ray diffraction, Rock-Eval pyrolysis, field emission scanning electron microscopy (FE-SEM), and porosity analysis. Sand-silt intervals are heterogeneously developed within the Yanchang shale. The petrology, mineral composition, geochemistry, type, and content of solid organic matter as well as the pore type, pore size, and porosity of these intervals differ significantly from those of mudstones. Compared with mudstones, sand-silt intervals typically have coarser detrital grain sizes, higher contents of quartz, feldspar, and migrated solid bitumen (MSB), larger pore sizes, higher porosity, and higher oil saturation index (OSI). In contrast, they have lower contents of clay minerals, total organic carbon (TOC), free liquid hydrocarbons (S1), and total residual hydrocarbons (S2). The sand-silt intervals in the Yanchang shale serve as both pathways for hydrocarbon primary migration and “micro reservoirs” for hydrocarbon storage. The interconnected inorganic and organic pore systems, organic matter networks, fractures, and sand-silt intervals form the hydrocarbons’ primary migration pathways within the Yanchang shale. A model for the primary migration of hydrocarbons within the Yanchang shale is proposed.
1. Introduction
Primary migration is the process by which hydrocarbons generated from organic matter in source rocks are expelled into adjacent reservoirs or carrier beds [1,2,3]. The primary migration of hydrocarbons not only affects the expulsion efficiency but also determines the amount and distribution of retained hydrocarbons within the source rocks [4,5,6,7,8]. Therefore, studying the mechanisms of primary migration is of great significance for the evaluation of both conventional and unconventional oil and gas resources, understanding shale oil retention and enrichment mechanisms, and predicting sweet spots [4,5,6,7,8].
The study and discussion of the mechanisms of primary migration have a long history. Before this century, most research was primarily focused on the phase, driving forces, and pathways of oil migration, as well as the fractionation of oil components caused by migration and the efficiency of hydrocarbon expulsion [9,10,11,12,13,14,15,16]. Since the beginning of this century, driven by technological advancements and the in-depth study of organic-rich shales, our understanding of their petrography, petrology, pore systems and structures, migration pathways, and organic–inorganic interactions has become more profound [17,18,19,20,21,22,23,24,25,26,27,28,29]. In addition, the physical and chemical fractionation of hydrocarbons during the migration process, the possible primary migration pathways within source rocks revealed by geochemical parameters, the organic–inorganic interactions and their effects on primary migration, and the mechanisms of migration have become hot research topics [4,5,6,7,30,31,32,33,34,35]. Previous studies have confirmed that petroleum migrates within source rocks and is expelled to reservoirs and carrier beds through bulk flow as a separate organic fluid phase [16,19,31]. Overpressure generated by compaction and hydrocarbon generation is considered the most important driving force for primary migration [8,14,16,17]. Significant progress has been made in the study of migration pathways and mechanisms of primary migration. However, there are still divergences in understanding these aspects [4,5,6,7,8,9,15,16,17,18,19,20,21,22,23,24,25,26,27,28,29].
Organic-rich mudstones and shales typically have high solid organic matter content, and some of them contain organic pores [19,20,21,22,23,24,25]. When the solid organic matter content is between 2% and 6%, a connected network of organic matter and organic pores can form in three-dimensional space, which serves as the main pathway for primary migration within source rocks [9,11,13,15,20,21,22,23]. However, because kerogen is often dispersed within source rocks or coexists with clay minerals, the organic matter is generally non-connected in three-dimensional space when the TOC is less than 6%. Instead, it forms interconnected networks in two-dimensional space when the TOC exceeds 4% [15]. Therefore, it is challenging to explain primary migration in source rocks with a TOC lower than 4% solely through the solid organic matter network.
Mature and over-mature organic-rich shales contain not only kerogen but also a significant amount of solid bitumen [20,21,22,23,25,27]. Both kerogen and solid bitumen often develop a large number of organic pores [20,21,22,23,25,27]. These organic pores are interconnected in three-dimensional space, forming a pore network that is considered an important pathway for primary migration [20,21,22,23,25,27]. Within the oil-generating window, the pore types of lacustrine shales are predominantly inorganic pores, which are also considered important pathways for primary migration [25,36,37,38,39].
A large number of fractures can be observed in organic-rich shales [25,40,41,42,43,44,45,46], which are often filled with liquid hydrocarbons and solid bitumen [25,42,43,47]. Hydrocarbon inclusions can also be observed within the fillings of some fractures [40,42,48,49]. The formation, growth, and eventual interconnection of micro-fractures to create a micro-fracture network have been observed through oil generation and expulsion modeling [17,46,50,51]. By comparing the changes in matrix permeability and fracture permeability of shale samples before and after oil generation and expulsion experiments, it has been concluded that the fracture network is the most important pathway for primary migration [17,46,50,51]. However, the number, length, and width of fractures in shales are relatively limited, and their total volume is small [13,41,52]. Lash et al. [41] noted that micro-fractures in shales can form local fracture networks, but on a larger scale, these networks may be isolated from one another. Moreover, some fractures cemented by calcite and quartz show no signs of oil migration [17,43]. There is a significant difference between the total volume of micro-fractures and the amount of free hydrocarbons retained in source rocks [13,41]. This suggests that, in addition to micro-fractures, there are other pathways for primary migration within source rocks.
Numerous organic-lean siltstone, sandstone, carbonate laminae, and interbeds can be observed within organic-rich source rocks [4,5,6,7,24,25,26,53,54,55,56,57]. Compared with organic-rich mudstones and shales, these organic-lean intervals typically exhibit larger pore sizes as well as higher porosity and permeability [25,29,53,54,55,56,57]. Additionally, the interfaces between these organic-lean intervals and the organic-rich mudstones often feature a higher density of micro-fractures and enhanced pore connectivity [25,29,53,54,55,56,57]. These characteristics make organic-lean intervals important pathways for the primary migration of hydrocarbons [7,25,29,53,54,55,56,57].
Though considerable progress has been made, there is still no consensus on the migration pathways and corresponding migration models in organic-rich shale systems. Therefore, the Triassic lacustrine Yanchang shale in the Ordos Basin was selected to further investigate the primary migration pathways and develop corresponding migration models. This shale has reached maturity within the oil window and is the most important source rock in the Mesozoic strata of the Ordos Basin in China [4,58,59]. The Yanchang shales contain numerous millimeter- to decimeter-scale organic-lean siltstone and sandstone laminae and intervals [4,25,29,56], which are referred to as “sand-silt intervals” in this paper. In this study, samples from the Yanchang shale with maturity in the oil window were selected, and the petrography, geochemistry, pore system, pore size, and porosity of organic-rich mudstones and organic-lean sand-silt intervals were investigated using thin-section observation, X-ray diffraction, Rock-Eval pyrolysis, field-emission scanning electron microscopy (FE-SEM), and porosity analysis. The main objectives of this study are to (1) determine the differences in petrography, geochemistry, pore system, pore size, and porosity between organic-rich mudstones and organic-lean sand-silt intervals; (2) discuss the role of organic-lean sand-silt intervals in primary migration and the pathways for hydrocarbon primary migration, and (3) propose a possible hydrocarbon primary migration model for the Triassic lacustrine Yanchang shale in the Ordos Basin.
2. Geological Background
The Ordos Basin, located in the central part of China, is one of the most important petroliferous basins in China. It has undergone multiple tectonic cycles and developed on the Paleozoic North China Craton [59,60]. The Basin can be subdivided into the Jinxi Flexure Belt, Tianhuan Depression, Western Thrust Belt, Weinan Uplift, Yimeng Uplift, and Yishan Slope [59,60]. The Yi-Shan slope is a west-dipping monocline with a dip angle of 1 to 3 degrees and features several local low-relief folds [59,60]. The study area is located in the southern part of the Yishan slope (Figure 1A).
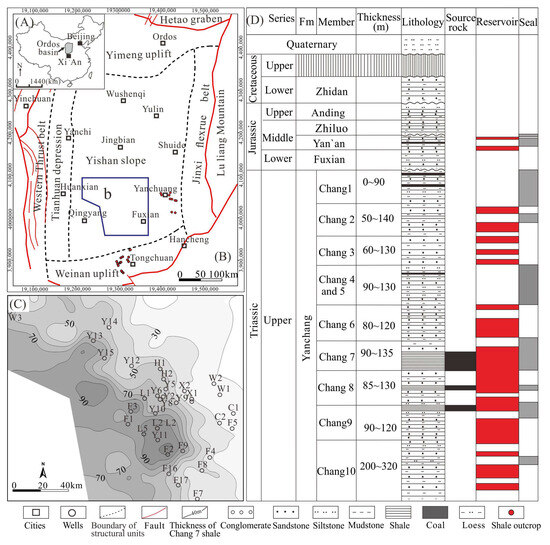
Figure 1.
(A) Map showing the Ordos Basin in China. Box is the map area in (B). (B) Map showing the tectonic unit of the Ordos Basin and the location of study area (modified from Lei et al. [15]). The blue box indicates the area shown in (C). (C) Contour map of shale thickness in the lower part of Member 7 of Yanchang Formation. (D) Chart showing chrono- and litho-stratigraphy, lithology, source rocks, potential reservoirs, and seals of the petroleum system.
During the period from the Upper Triassic to the Cretaceous, the Ordos Basin deposited multi-cyclic fluvial-lacustrine clastic sediments of the Triassic, Jurassic, and Cretaceous systems (Figure 1B). The Late Triassic Yanchang Formation is divided into ten members, which record a complete cycle of lacustrine basin initiation, development, and cessation [60]. The organic-rich shales of the Yanchang Formation are primarily distributed in the top of Member 9, the lower part of Member 7, and the middle part of Member 8, with thicknesses ranging from 0 to 40 m, 20 to 110 m, and 0 to 40 m, respectively (Figure 1B,C). The Yanchang shale contains type I and type II1 organic matter (OM) with a TOC of 1% to 16% and up to 30% [36,37,58,59,60,61,62,63,64,65]. The hydrogen index (HI) varies between 50 and 300 mg HC/g TOC, and the vitrinite reflectance (Ro) ranges from 0.7% to 1.28% [36,37,58,59,60,61,62,63,64,65]. The Yanchang shale is not only the principal source rock for Mesozoic reservoirs but also an important exploration target for shale oil and gas in the Ordos Basin.
3. Materials and Methods
In this study, siltstone and sandstone intervals with thicknesses greater than 0.5 cm, separated from core samples, are referred to as “sand-silt intervals.” The shale core samples without visible siltstone laminae are referred to as mudstones. Those with visible siltstone laminae thinner than 0.5 cm that cannot be separated are referred to as mudstones with interlayers. Systematic observations were conducted on core samples from 34 representative wells. Based on comprehensive petrographic observations, representative samples of sand-silt intervals, mudstones, and mudstones with interlayers were selectively collected to ensure the representativeness of the samples used in this study. The locations of the sampling wells and observation outcrops are shown in Figure 1. Sixty-eight Mineral composition datasets derived from X-ray diffraction (XRD) analysis were compiled from previous studies (representing 275 samples in this study) (Lei et al. [25,29]; Cheng et al. [56]; Gou et al. [63]; and Yu et al. [65]). Additionally, 30 organic geochemistry datasets (435 samples) were obtained from Lei et al. [29], Cheng et al. [56], Gou et al. [63], and Yu et al. [65]. Porosity data comprised 52 measurements (290 samples) from Lei et al. [25], Cheng et al. [56], and Yu et al. [65].
3.1. Observation of Sand-Silt Intervals
Considering the differences in the minimum thickness of siltstone laminae that can be identified by the naked eye in shale outcrops and core samples, different methods and criteria were adopted for the observation and measurement of sand-silt intervals in cores and outcrops in this study. The locations of the observed outcrops and sampling wells are shown in Figure 1.
The observed outcrops were divided into grids with a certain spacing, and the centerline of each grid was used as the reference line for measurement. A ruler (with an accuracy of 0.1 cm) was used to measure the thicknesses and density of sand-silt intervals on the outcrops.
After splitting the core samples into two halves, the centerline of the fresh core section was chosen as the reference line for measurement. Then, a vernier caliper (with an accuracy of 0.02 mm) was used to measure the thickness and density of sand-silt intervals.
3.2. Thin-Section Microscopy
Doubly polished thin sections for petrographic observation were prepared to be approximately 100 μm thick. Petrographic studies were conducted using a Nikon 80I microscope (Nikon Corporation, Tokyo, Japan) under both transmitted and ultraviolet (UV) light. The wavelength of the emitted fluorescence exceeded 420 nm. The grain size of detrital grains was measured on thin-section images using Image-Pro Plus 6.0 software [66,67].
3.3. Scanning Electron Microscopy (SEM)
The selected samples were milled using an Ar-ion beam in a Leica EM TIC 3X device (Leica Microsystems GmbH, Wetzlar, Hessen, German), and imaged using a Zeiss Merlin field-emission scanning electron microscopy (FE-SEM) (Carl Zeiss AG, Jena, Thuringia, German) at 1.2 kV at the Key Laboratory of Deep Petroleum Intelligent Exploration and Development, Institute of Geology and Geophysics, Chinese Academy of Sciences. The organic matter (OM) and minerals were identified using energy-dispersive spectroscopy (EDS) with a Bruker Quan tax system equipped with the Esprit 1.9 software (Bruker AXS GmbH, Karlsruhe, Baden-Württemberg, German). Pore sizes were measured on SEM images using Image-Pro Plus 6.0 software [66,67].
The areas of primary POM and MSB were measured based on SEM images using Image-Pro Plus 6.0 software, and the proportions of POM and MSB areas to the total organic matter area were calculated by Equations (1) and (2).
RPOM = SPOM/(SPOM + SMSB) × 100
RMSB = SMSB/(SPOM + SMSB) × 100
Here, SPOM represents the total pixel area of POM, SMSB represents the total pixel area of MSB, RPOM is the proportion of the POM area to the total organic matter area (%), and RMSB is the proportion of the MSB area to the total organic matter area (%).
3.4. X-Ray Diffraction Analysis
Samples were crushed and sieved to a 200-mesh size (<0.075 mm) and then subjected to X-ray diffraction analysis. The analysis was performed using a Rigaku D/MAX-2500 diffractometer (Rigaku Copration, Tokyo, Japan).
3.5. TOC and Rock-Eval Pyrolysis
Samples were crushed to 200-mesh size, and approximately 100 mg was treated with a 5% HCl solution at 80 °C for an hour to decalcify and remove inorganic carbon. The total organic carbon (TOC) content was determined with a Leco C230 carbon analyzer (LECO Corporation, St. Joseph, MI, USA).
Another 70 mg of the sample was weighted for Rock-Eval pyrolysis. The hydrogen index (HI), the amount of free liquid hydrocarbons (S1), and the total residual hydrocarbons (S2) were determined using a Vinci Rock-Eval 6 instrument (Vinci Technologies, Nanterre, Hauts-de-Seine, France).
3.6. Porosity Measurement
The samples for porosity measurement were cut into core plugs with a diameter of 2.54 cm and a length of 3–5 cm and then dried under vacuum conditions. In accordance with the standard; GB/T 29172-2012; Practices for Core Analysis. Standards Press of China: Beijing, China 2012, the porosity of the samples was measured using the PoroPDP helium porosimeter (Jiangsu Tuochuang Scientific Instruments Co., Ltd, Nantong, Jiangsu, China).
4. Results
4.1. Petrology and Geochemistry
In the outcrop sections of the Yanchang shale, sand-silt intervals with even, wavy, vein-like, and lenticular shapes can be observed (Figure 2A–E). The even sand-silt intervals typically consist of a single layer or a group of nearly parallel laminations, which can extend laterally for several meters to tens of meters in the direction parallel to the bedding. The thickness of sand-silt intervals observed in outcrops ranges from 0.1 cm to 20 cm, with a maximum thickness of up to 1.5 m. Sand-silt intervals with thicknesses less than 10 cm account for approximately 87.0% of the total sand-silt intervals (N = 656), while those with thicknesses less than 2 cm account for 67% of the total.
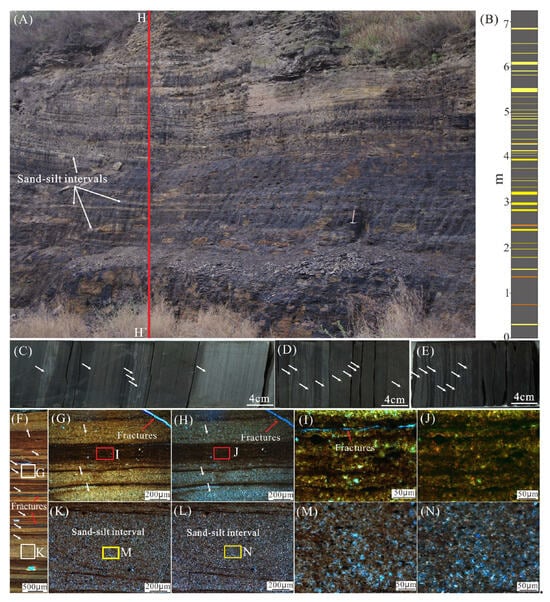
Figure 2.
Photographs of sand-silt intervals and organic-rich intervals in Yanchang shale. (A) Sand-silt intervals in Yanchang shale of outcrop in Tongchuan. (B) The sand-silt intervals (yellow) in section H-H′, with the orange areas representing tuff and the dark grey areas representing mudstone; location is shown in (A). (C–E) Core photographs displaying even, lens-shaped, and wavy silty laminae and intervals, well Y10. (F–H) Thin-section image of sand-silt intervals and organic-rich intervals in Yanchang shale, well Y11. (I,J) Thin-section images of organic-rich intervals. (K–N). The white arrows indicate the sand-silt intervals. Images (F,G,I,K,M) are under transmitted light, while (H,J,L,N) are under cross-polarized light.
The thickness of sand-silt intervals observed in core samples primarily ranges from 0.05 cm to 10 cm, with a maximum thickness up to 1.5 m. Sand-silt intervals with thicknesses less than 3 cm account for approximately 85.5% of the total sand-silt intervals (N = 6336), while those with thicknesses less than 1 cm account for 75.4% of the total (Figure 3A). Sand-silt intervals thicker than 5 cm account for approximately 10.2% of the total. The frequency of these intervals ranges from 4 to 32, with an average of 15, and up to 170 laminae per meter (Figure 3B).
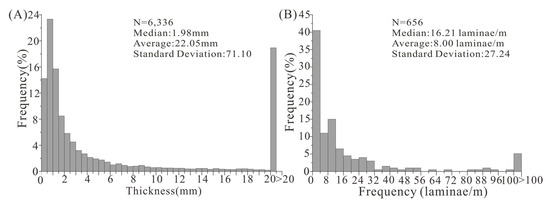
Figure 3.
Histograms showing the thickness (A) and frequency (B) of sand-silt intervals.
There are differences in petrology and mineral composition between sand-silt intervals and mudstones (Figure 2F–N, Table 1). The grain size of sand-silt intervals ranges from 5 to 250 μm, with an average of 45.1 μm and a median grain size of 37.2 μm (Figure 4A). In contrast, the grain size of mudstones is smaller than 20 μm, with an average grain size of about 8.8 μm (Figure 4B). Compared to mudstones, sand-silt intervals have higher contents of quartz (13.7% to 67.4%, averaging 32.9%) and feldspar (9.0% to 51.0%, averaging 31.4%) and relatively lower clay mineral content (10.9% to 55.8%, averaging 26.5%). Mudstones contain 7.3% to 45.0% quartz, with an average of 22.4%, and 7.0% to 43.9% of feldspar (averaging 20.5%). Meanwhile, the clay mineral content in mudstones varies from 13.9% to 74.4% (averaging 48.3%). The contents of feldspar, quartz, and clay minerals in mudstones with interlayers are intermediate between those of sand-silt intervals and mudstones (Table 1).

Table 1.
Mineralogy and geochemistry of mudstones, sand-silt intervals, and mudstones with interlayers.
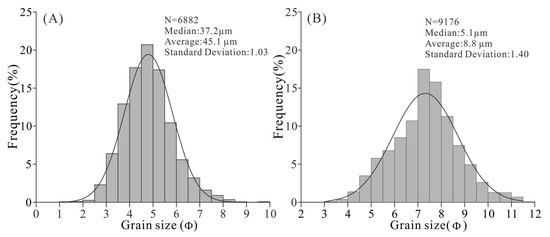
Figure 4.
Histograms showing detrital grain size of sand-silt intervals (A) and mudstones (B).
Compared to mudstones, sand-silt intervals have relatively lower contents of TOC, S1, S2, HI, and extractable organic matter (EOM) but a relatively higher oil saturation index (OSI = [S1/TOC] × 100; see Table 1). The TOC in sand-silt intervals varies from 0.39% to 7.36%, with an average of 2.32%, which is lower than that of mudstones (ranging from 1.37% to 20.27% and averaging 5.86%). Similarly, the S1 and S2 values in sand-silt intervals range from 0.17% to 6.86% (averaging 2.29%) and from 0.25% to 15.22% (averaging 4.44%), respectively. These values are lower than those of mudstones, which range from 1.24% to 13.09% (averaging 4.37%) and 0.39% to 48.29% (averaging 11.52%), respectively. The average values of EOM and HI in sand-silt intervals are 0.6% and 181 mg/g TOC, respectively, which are lower than those in mudstones (0.89% and 197 mg/g TOC, respectively). Meanwhile, the OSI of sand-silt intervals ranges from 21 to 212 mg/g TOC and averages 105 mg/g TOC, which is greater than that of mudstones (ranging from 10 mg/g TOC to 247 mg/g TOC and averaging 82 mg/g TOC; see Table 1). The geochemical parameters of mudstones with interlayers are intermediate between those of sand-silt intervals and mudstones (Table 1, Figure 5).
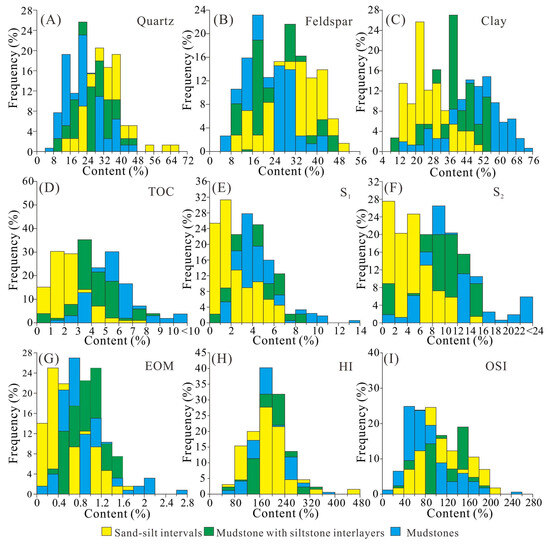
Figure 5.
Histograms showing the quartz (A), feldspar (B), clay mineral (C), TOC (D), S1 (E), S2 (F), EOM (G), HI (H) and OSI (I) of mudstones, sand-silt intervals, and mudstones with interlayers.
4.2. Characteristics of Organic Matter (OM)
Based on its source and origin, the organic matter in source rocks can be categorized into primary and secondary organic matter [27,68,69]. Primary organic matter (POM) is the product of the decomposition of depositional organic matter during diagenesis [27,68,69]. Secondary solid organic matter includes migrated solid bitumen, which forms through the metamorphism of hydrocarbons generated from primary organic matter and subsequently migrates to adjacent pores. It also includes pyrobitumen, which is insoluble in organic solvents and results from the secondary cracking of oil [68,69].
In the Yanchang shale, primary organic matter (POM) has various occurrences, including isolated patches, elongated patches distributed along the bedding planes, and organic–clay mineral complexes (Figure 5). The distribution of POM is highly heterogeneous. Elongated POM patches along bedding planes typically contain detrital quartz, feldspar, and clay minerals. Compaction causes the POM to deform and intrude into the interP pores between adjacent rigid particles. Plastic materials such as mica and clay platelets, which surround the organic matter, are also deformed by compaction and are distributed around the OM and rigid particles (Figure 5A,F). Some terrestrial POM exists as discrete particles, with distinct boundaries separating them from detrital minerals (Figure 5B). Additionally, within some POM particles, detrital quartz, feldspar, and clay minerals can also be observed (Figure 5C,F). POM coexisting with clay minerals forms an organic–clay complex formed during sedimentation. The organic matter in these complexes has an amorphous boundary and is dispersed among flocculent, acicular, and hair-like clay platelets (Figure 5D,E). The organic–clay complex primarily occurs in mudstones.
Given that the organic maturity of the Yanchang shales is generally less than 1.3% [36,37,58,59,60,61,62,63,64,65], the solid bitumen present in these Yanchang shales is predominantly migrated solid bitumen (MSB), with no significant development of pyrobitumen. The MSBs are primarily found filling interP pores between detrital particles, in dissolution pores of soluble feldspar and siderite, and in mineral cleavage seams. Additionally, MSBs can be observed in intercrystalline pores of clay and pyrite aggregates (Figure 6H–L). MSBs do not have a specific shape. Instead, their morphology is usually consistent with that of the pores that they fill. For example, the boundaries of MSBs filling the interP pores between rigid particles such as quartz and feldspar are mostly straight (Figure 6I,K,L). In contrast, those filling the dissolution pores of feldspar and siderite are mostly dendritic and embayed (Figure 6J,K,L).
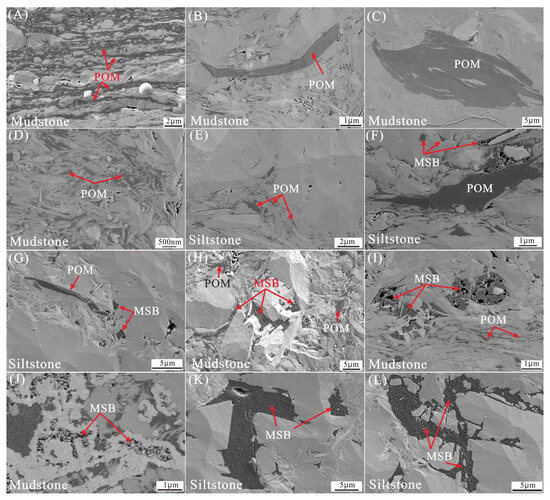
Figure 6.
SEM photographs showing the types and occurrences of solid organic matter. (A) Primary solid organic matter distributed along the bedding plane, well W3. (B) Dispersed POM with no organic pores, well Y5. (C) Dispersed POM containing deformed detrital clay minerals, well C3. (D) Clay–organic matter complex, well Y5. (E) Dispersed POM and clay–organic complex preserved in compaction-resistant pressure shadows, well Y8. (F) Dispersed POM with spongy organic pores, well Y8. (G) Dispersed POM without organic pores, well W3. (H) MSB with spongy OPs filling inter-particle and dissolution pores, well Y12. (I) MSB with spongy, bubble OPs, well Y8. (J) MSB with spongy OPs filling dissolution pores, well Y8. (K,L) MSB with spongy OPs filling inter-particle and dissolution pores, well W3.
There are significant differences in the proportion of POM and MSB to the total solid organic matter content between sand-silt intervals and mudstones (Figure 5 and Figure 6). In sand-silt intervals, the proportion of MSB to the total solid organic matter content ranges from 61.6% to 98.8%, with an average of 75.28%. This is significantly higher than that in mudstones, where the proportion of MSB ranges from 6.2% to 49.0% and averages 25.43%. Mudstones with interlayers have the intermediate proportion of MSB, ranging from 43.4% to 69.4% and averaging 51.0% (Figure 7).
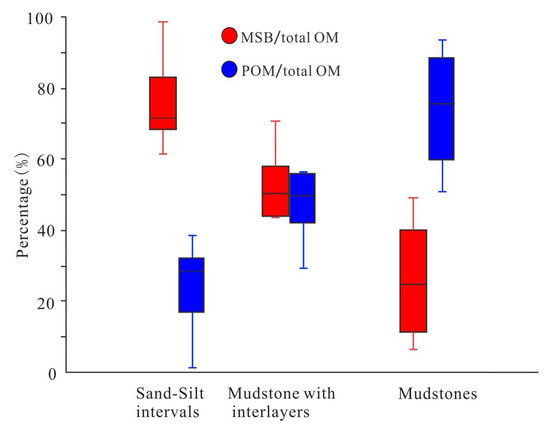
Figure 7.
Box plots of the proportion of POM and MSB to total OM in mudstones, mudstones with siltstone interlayers, and sand-silt intervals.
4.3. Pore System and Pore Size
Organic-rich shales contain abundant pores developed within both the matrix and organic matter. Various pore classification schemes have been proposed based on their origin, formation mechanisms, pore size, morphology, distribution, and geometric relationships between pores and surrounding grains [21,36,70,71,72,73,74,75,76]. Referring to the mudrock pore classification developed by Loucks et al. (2012) and Loucks and Reed (2014) [21,72], the pore systems in the organic-rich Yanchang shales were divided into inorganic pores, organic pores (OPs) and fractures. The inorganic pores were subdivided into interparticle pores (interP) and intraparticle (intraP) pores.
4.3.1. Inorganic Pores
Inorganic interP pores are the pore spaces between detrital particles such as feldspar, quartz, and clay platelets formed through sedimentation and diagenesis. InterP pores can also be found in authigenic minerals, including quartz, calcite, pyrite, and siderite [21]. The size and shape of interP pores are influenced by detrital type, grain size, sorting, and particle arrangement [21]. InterP pores between rigid grains such as quartz and feldspar are well-developed, typically exhibiting a polygonal shape and lacking obvious orientation. Additionally, the edges of these pores are usually relatively straight (Figure 6K and Figure 8A,B). The dissolution of the edges of easily soluble detrital particles, such as feldspar and calcite, results in a zigzag appearance of the pore edges (Figure 6J,L and Figure 8A,J). The size of interP pores ranges from 10 nm to 600 nm, with an average of 154 nm, and can reach several micrometers.
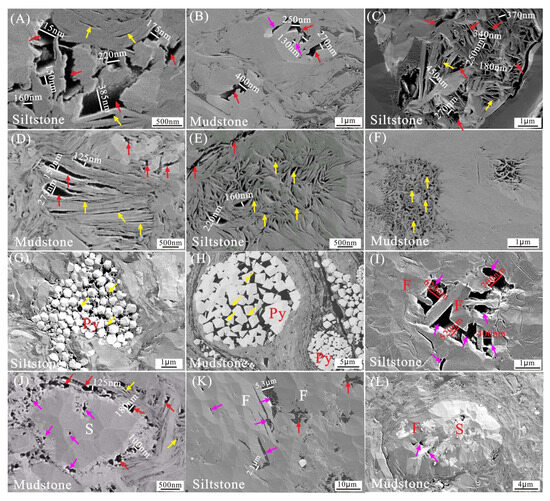
Figure 8.
SEM photographs showing interP and intraP pores. (A) Primary interP pores and intraP pores, well Y8. (B) Primary interP pores and dissolution pores, well Y8. (C) Primary interP pores in clay platelets and intraP pores in clay aggregates, well Y11. (D) Primary interP pores in clay platelets and siderites, and intraP pores in clay aggregates, well Y5. (E,F) IntraP pores in clay aggregates, well Y8. (G) IntraP pores within pyrite aggregates, well Y10. (H) IntraP pores within pyrite aggregates, well W3. (I) Dissolution pores within feldspar, well W3. (J) Dissolution pores of siderite, interP pores, and intraP pores, well Y5. (K) Cleavage and dissolution pores in feldspar, well W3. (L) Dissolution pores in feldspar and siderite, well Y10. Red arrows—interP pores, yellow arrows—intraP pores, purple arrows—dissolution pores.
Some interP pores between rigid particles and clay minerals, as well as among clay platelets, were preserved in compaction-protected shadows. The pores between clay platelets are often elongated, triangular, or irregular in shape (Figure 8C,D). The interP pores between clay platelets tend to be oriented due to compaction (Figure 8D). The pore sizes between rigid particles and clay minerals, as well as among clay platelets, range from 5 nm to 200 nm, with a maximum size of up to 800 nm and an average size of 54 nm.
Inorganic intra-particle pores (intraPs) are also common in the Yanchang shales. These include pores or cleavages within detrital grains and authigenic minerals, as well as pores within pyrite and clay aggregates. IntraP pores can be categorized into residual primary intraP pores and diagenetic intraP pores. Pores and cleavages within feldspar, calcite, clay minerals, mica, and fossils were preserved under compaction as residual intraP pores (Figure 8A,D,K). In contrast, intracrystalline pores within pyrite and clay aggregates (Figure 8E–H), intraP pores, cleavages, and dissolution pores within authigenic calcite, dolomite, feldspar, and siderite (Figure 6H,J,L and Figure 8I–L) are classified as diagenetic intraP pores. The size of most intraP pores ranges from 2 nm to 100 nm, with some reaching several micrometers. The intracrystalline pores within authigenic pyrite are relatively large, with pore sizes typically ranging from 20 nm to 400 nm (Figure 8E,F).
The dominant inorganic pore types and sizes in sand-silt intervals and mudstones exhibit significant differences. Sand-silt intervals, characterized by a high content of rigid detrital such as feldspar and quartz, as well as larger grain sizes, have rigid particles that support each other to resist compaction. This results in a greater number of residual interP pores being preserved in compaction-protected shadows. Additionally, due to their relatively good permeability, soluble minerals like feldspar and siderite are dissolved, leading to the development of interP dissolution-enlarged pores and intraP dissolution pores. Therefore, the inorganic pores in sand-silt intervals are larger in size, ranging from several nanometers to tens of micrometers. Most of the pores are smaller than 300 nm (accounting for 79% of the total), with a median pore size of approximately 110 nm. Pores larger than 500 nm account for about 9.6% of the total (Figure 9A).
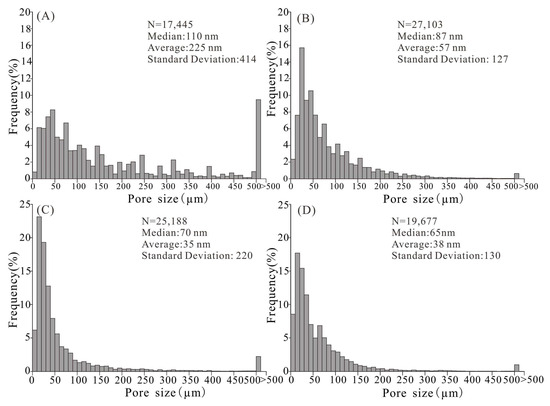
Figure 9.
Histograms of pore sizes measured from SEM images. (A) Pore size distribution of inorganic pores of sand-silt intervals. (B) Pore size distribution of OPs of sand-silt intervals. (C) Pore size distribution of inorganic pores of mudstones. (D) Pore size distribution of OPs of mudstones.
In contrast, the inorganic pores in mudstone are mostly smaller than 150 nm (accounting for 91.0% of the total), with a median pore size of about 40 nm. Pores larger than 500 nm represent approximately 1.2% of the total (Figure 9C).
4.3.2. Organic Pores
In addition to inorganic pores, organic pores (OPs) are also common in the Yanchang shale (Figure 10). These include spongy, bubble-like, slit-like OPs, modified Ops, and shrinkage seams in the original organic matter and migrated solid bitumen [21,36,56].
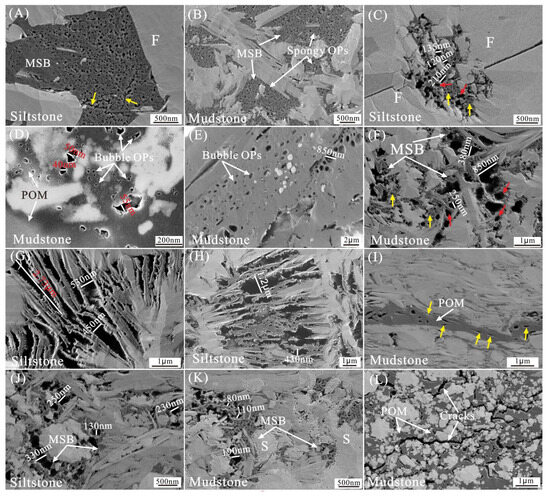
Figure 10.
SEM photographs showing organic pores in POM and MOM. (A) Spongy OPs and cracks (yellow arrows) in MSB filled in interP pores, well W3. (B) Spongy OPs in MSB filling interP and intraP pores, well Y10. (C) Spongy (red arrows) and bubble (yellow arrows) OPs in MSB, well Y8. (D) Bubble OPs in POM, well W1. (E) Bubble OPs in POM, well C3. (F) Spongy and bubble OPs in MSB, well Y8. (G) OPs developed along the orientations of clay minerals, well W3. (H) OPs developed along the orientations of clay minerals and interconnected to form complex pores, well W3. (I) Elongated OPs in POM aligned the laminations of shale, well Y8. (J) Spongy and bubble OPs in MSBs, well Y8. (K) Spongy and bubble OPs in MSBs, well Y8. (L) Spongy OPs and cracks in POM, well Y11.
OPs are rare in most of the primary organic matter (POM) in the Yanchagn shale (Figure 5A–E). However, in some parts of the POM, bubble-like, spongy pores and shrinkage seams can be observed (Figure 6F and Figure 10D,I). Circular, subcircular, polygonal, and irregular spongy OPs are relatively common within the MSB of the Yanchang shale, with pore sizes generally less than 100 nm (Figure 6H–L and Figure 10A–C,F,J,K). Circular, subcircular, and oval bubble-like OPs in the MSB have significantly larger pore sizes compared to those of spongy OPs (Figure 10). Most of these bubble-like pores have diameters greater than 50 nm, and pores with sizes in the hundreds of nanometers are also relatively common (Figure 10D–F,J,K). Additionally, some bubble pores and spongy pores are interconnected, forming a complex organic pore network (Figure 10C,F,J,K).
The organic matter in sand-silt intervals is primarily characterized by spongy OPs, with a few bubble-like organic pores also present. Due to the shielding effect of rigid particles, the OPs within the OM hosted in interP and dissolution pores of rigid particles have not undergone deformation as a result of compaction (Figure 6K,L and Figure 10A–C). Some elongated organic pores can be observed within clay platelets or clay aggregates hosted in interP pores of rigid particles (Figure 10G,H). These pores are primarily developed in sand-silt intervals. However, a few can also be observed in the mudstones. In the sand-silt intervals, most of the OPs have diameters less than 200 nm, accounting for 91.9% of the total counted pores, with a median pore size of approximately 87 nm. OPs larger than 300 nm account for 2.8% of the total (Figure 9B).
In mudstones, organic pores are primarily characterized by bubble-like and spongy OPs (Figure 10B,D,F,K–L). Some of these pores may deform due to compaction, with the long axis oriented parallel to the bedding planes (Figure 10I). Additionally, shrinkage seams are commonly observed within the organic matter as a result of contraction (Figure 6H–L and Figure 10A,L). Compared to sand-silt intervals, the size of the OPs in mudstones is relatively smaller. Most OPs have diameters less than 150 nm, accounting for 92.6% of the total counted pores, with a median pore size of approximately 65 nm. OPs larger than 300 nm account for about 2.0% of the total (Figure 9D).
4.3.3. Fractures
High-angle fractures, low-angle fractures, and fractures parallel to bedding are observed in the Yanchang shale at outcrop, core, and pore scales (Figure 11). The high-angle fractures are primarily structural joints, with dips generally greater than 75° (Figure 11A,D). These predominantly trend in the near east–west direction (approximately 260~280°), and some north–south-trending (approximately 0°~20°) high-angle fractures, nearly perpendicular to the east–west trending fractures, can be observed in the Yanchang shale (Figure 10B). The spacing for the east–west-trending high-angle fractures ranges from 6 to 174 cm, with an average of 54 cm (Figure 11C). In contrast, the pacing of the north–south-trending high-angle fractures ranges from 10 to 228 cm, with an average of 62 cm (Figure 11C).
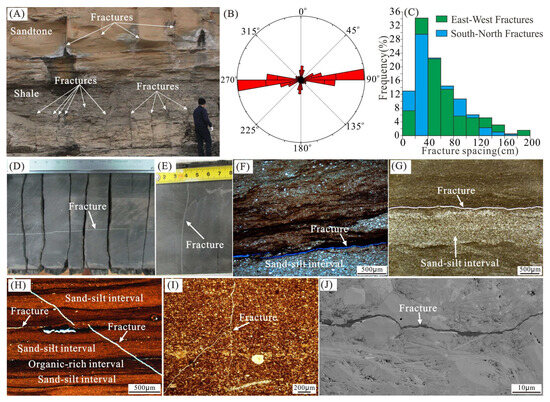
Figure 11.
Photographs of fractures in the Yanchang shale from outcrops and cores. (A) Fractures (joints) in Yanchang shale at an outcrop in Yanhe. (B) Rose diagram showing the trend directions of high-angle fractures from outcrops. (C) Frequency histogram of fracture spacing for fractures in Yanchang shale outcrops. (D) Core photograph of a high-angle fracture, well Y8. (E) Core photograph of bed-parallel fracture, well Y10. (F) A bed-parallel fracture filled with calcite, well Y2. (G) An open bed-parallel fracture, well X1. (H) Low-angle fracture filled with calcite, well Y11. (I) Low-angle and high-angle fractures, well F4. (J) SEM image of an open bed-parallel fracture filled with bitumen, well Y8.
4.4. Porosity
The porosity of the Yanchang shales ranges from 0.54% to 8.37%, with an average of approximately 3.57%. However, there are significant differences in porosity between mudstones, sand-silt intervals, and mudstones with interlayers (Figure 12). Sand-silt intervals exhibit the highest porosity, varying from 0.83% to 8.37%, with an average porosity of 4.32% (Figure 12A). Mudstone has the lowest porosity, mainly ranging from 0.74% to 7.34%, with an average porosity of about 3.24% (Figure 12C). The porosity of mudstones with interlayers varies from 0.54% to 7.70%, averaging 3.76% (Figure 12B).
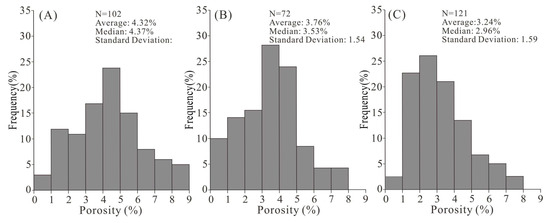
Figure 12.
Histograms of porosity. (A) Sand-silt intervals. (B) Mudstone with siltstone interlayers. (C) Mudstones.
5. Discussion
5.1. The Role of Sand-Silt Intervals in Primary Migration
As mentioned above, compared with mudstones, sand-silt intervals have higher contents of quartz and feldspar, as well as greater OSI and RMSB values. They also exhibit larger detrital grain sizes and pore diameters, higher porosity, and relatively lower values of TOC, S1, S2, and EOM. As shown in Figure 13A, the sand-silt interval is characterized by high contents of feldspar and quartz, as well as large grain sizes. The interP pores between rigid particles and the dissolution pores of feldspar are very well developed, with pore diameters ranging from tens of nanometers to tens of micrometers (Figure 13A,G,H). Additionally, there are a few interP and intraP pores of clay minerals, as well as intercrystalline pores of pyrite. The surface porosity of inorganic pores is approximately 4.3% (Figure 13B).
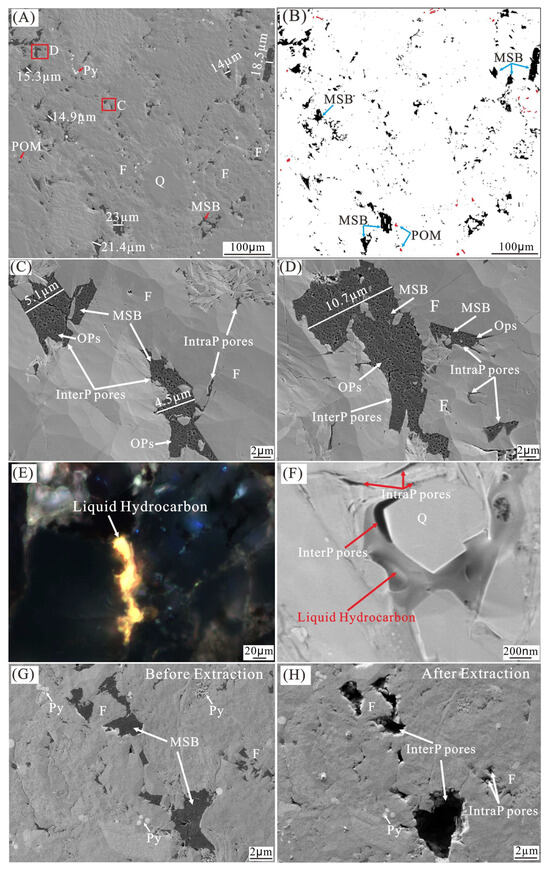
Figure 13.
Photographs of pores, organic matter, and liquid hydrocarbons in the sand-silt interval from well Y2. (A) SEM image showing inorganic pores and organic matters. (B) Image showing POM (red color) and MSB (black color). (C,D) SEM images showing MSBs filling inorganic pores; the location of (C,D) is shown in (A). (E) Thin-section image under UV light showing liquid hydrocarbons. (F) SEM image showing liquid hydrocarbon filling interP pores. (G) SEM image showing inorganic pores and OMs before extraction. (H) SEM image showing inorganic pores after extraction.
As shown in Figure 13C,D, most of the pores in the sand-silt interval are filled with MSB that hosts organic pores, and most of the MSB is soluble in organic solvents (Figure 13G,H). Additionally, some pores are filled with liquid hydrocarbons (Figure 13E,F). The sand-silt interval has a low content of POM, while the RMSB reaches up to 98.8% (Figure 12B). The MSB forms when the oil generated from kerogen is released, migrates into adjacent pores, and undergoes metamorphism [21]. Therefore, the distribution and abundance of MSB can be used as an indicator for studying the primary migration of hydrocarbons. In Figure 13A, the MSBs and liquid hydrocarbons are oils generated from kerogen in adjacent organic-rich mudstones that have migrated into the inorganic pores of the sand-silt interval, with some undergoing metamorphism to form solid bitumen.
The oil saturation index (OSI = [S1/TOC] × 100) defined by Jarvie et al. [77] can be used to evaluate the relative content of “free” oil, which can overcome the sorption threshold exerted by the organic matters. The OSI serves as an indication of migrated and retained oil in shales [24,77]. As shown in Figure 14, in the Yanchang shale of well Y8, although the S1, S2, EOM, and TOC values in the sand-silt intervals are significantly lower than those in the mudstones, the OSI and porosity are relatively higher. This indicates that the “free” oil content in the sand-silt intervals is higher than that in the mudstones. In the Yanchang shales, the OSI and RMSB values in the sand-silt intervals are also significantly higher than those in the mudstones (Table 1, Figure 6). Similar characteristics have also been observed in the Kimmeridge Clay Formation in the North Sea [24].
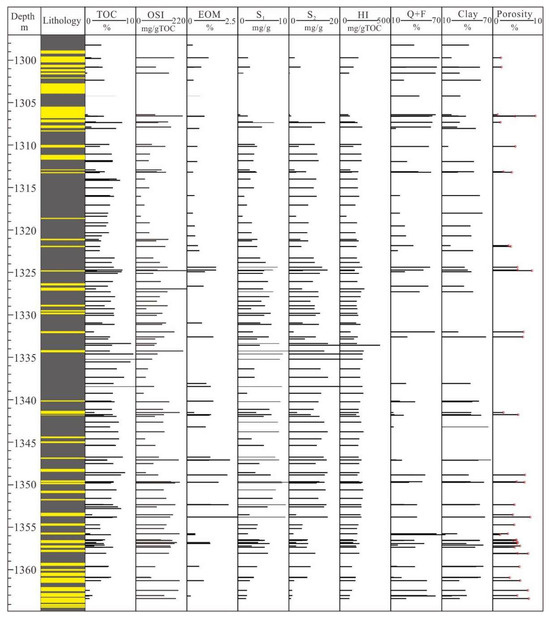
Figure 14.
Vertical section of well Y8 showing lithology, mineral composition, geochemical data, and porosity of Yanchang shale. The yellow color indicates organic-lean sand-silt intervals.
The mudstones adjacent to sand-silt intervals contain more open pores and micro-fractures, which are interconnected to form a pore network [45,53,54]. Furthermore, the EOM of the sand-silt intervals have lower sorption affinities and contain more light oil, with fewer polar compounds and asphaltenes [10,24,77]. This is attributed to the compositional fractionation by adsorption or migration [10,78,79,80]. Therefore, the sand-silt intervals function as “micro reservoirs” within source rocks. Hydrocarbons generated and expelled from kerogen migrate to these sand-silt intervals and accumulate. When the temperature and pressure increase and the fractures open, part of the accumulated hydrocarbons migrate and form solid bitumen.
The lower and upper parts of the organic-rich Yanchang shale do not show significant differences in S1, S2, EOM, TOC, and OSI compared to the middle part (Figure 14). This indicates that hydrocarbons generated in the middle part of the source rock have also been expelled through primary migration. The interbedded sand-silt intervals in organic-lean mudstones facilitate the migration and expulsion of hydrocarbons within the thick source rock. In summary, these organic-lean sand-silt intervals serve as both migration pathways and “micro reservoirs” during hydrocarbon primary migration.
5.2. The Primary Pathways for Hydrocarbon Migration
The primary migration pathways in source rocks have been extensively investigated across numerous previous studies. A continuous kerogen network or solid bitumen, in combination with kerogen, serve as pathways for primary migration [9,11,13,15,20,21,22,23]. Other researchers have suggested that micro-fractures or inorganic pores play important roles in primary migration [25,36,37,38,39,50,51].
The interP and intraP pores are well developed in areas where rigid grains with larger grain size and soluble minerals such as feldspar, siderite, calcite are abundant in both the mudstones and sand-silt intervals in the Yanchang shale (Figure 6H,J–L, Figure 8, Figure 13, and Figure 15A,B,F–K). Dissolution pores can merge with residual primary interP and intraP pores to form interconnected and complex pore networks (Figure 8I,J, Figure 10F,J,K, Figure 13A,B, and Figure 15A,B,F,G–K). The presence of MSB and liquid hydrocarbons within inorganic pores indicates that these pores serve as one of the important storage spaces and potential migration pathways for hydrocarbons. However, not all portions of the inorganic pore networks are filled with MSB and liquid hydrocarbons (Figure 15E,F), suggesting that the hydrocarbon primary migration within source rocks is heterogeneous.
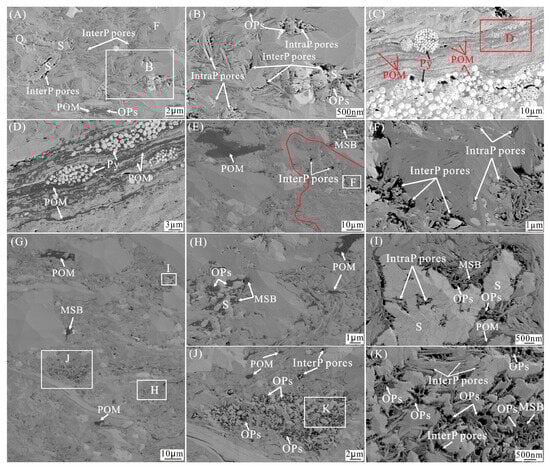
Figure 15.
SEM photographs showing organic matter and pore networks in the Yanchang shale. (A) Pore networks formed by dominant inorganic pores and a few organic pores, well Y5. (B) Inorganic and organic pore networks, located as shown in (A). (C) Primary organic matters parallel to bedding, well W3. (D) Primary organic matters, located as shown in (C). (E) Some inorganic pores are filled with OM, while others are not filled with OM or liquid hydrocarbons (as indicated by the areas marked with red lines), well Y8. (F) The inorganic pore network not filled with OM or liquid hydrocarbons; the location is shown in (E). (G–K) Local pathway networks composed of organic matter, inorganic pores, and organic pores, well Y8.
Although OM can locally form interconnected and continuous networks (Figure 5A and Figure 15C,D), its distribution is highly heterogeneous. Moreover, a significant amount of OM is dispersed (Figure 5B,E–G and Figure 15E). OM with abundant organic pores fills inorganic pores, connecting together to form local pore networks. However, the distribution of these networks is also heterogeneous (Figure 10, Figure 13A–D, and Figure 15G). When the TOC is less than 4%, the connectivity of pore networks composed of organic matter and OPs is poor [15]. Therefore, a network composed solely of organic matter and organic pores appears to be insufficient for primary oil migration within source rocks.
The heterogeneous distribution of organic and inorganic pores in shale significantly reduces the connectivity of pore networks, resulting in the heterogeneous migration of hydrocarbons. As shown in Figure 15E (red outline), inorganic pores are well developed within the red line and form local inorganic pore networks (Figure 15E,F). However, these inorganic pores are not filled with liquid hydrocarbons and MSB due to their three-dimensional disconnection from other pore networks near kerogens. In other words, hydrocarbons have not migrated to these pore networks. In contrast, the pores in Figure 15H,I appear to have better connectivity in three-dimensional space. Hydrocarbons generated from kerogens migrate into these pores and undergo subsequent thermal metamorphism to form MSBs (Figure 15G–I). The heterogeneous distribution of migrating solid bitumen in shale also indicates that the primary migration of hydrocarbons is selective and non-uniform (Figure 13 and Figure 15).
The Yanchang shale contains high-angle fractures, low-angle fractures, and fractures parallel to bedding (Figure 11). These fractures, characterized by different trends and dips, can interconnect and form fracture networks (Figure 11 and Figure 16). They penetrate and connect the inorganic pore networks, organic pore networks, organic matter networks, and sand-silt intervals within the source rock. This interconnection enhances the overall connectivity and forms important migration pathways for hydrocarbon migration within the Yanchang shale. The presence of liquid hydrocarbons and MSB within the fractures further confirms this (Figure 16).
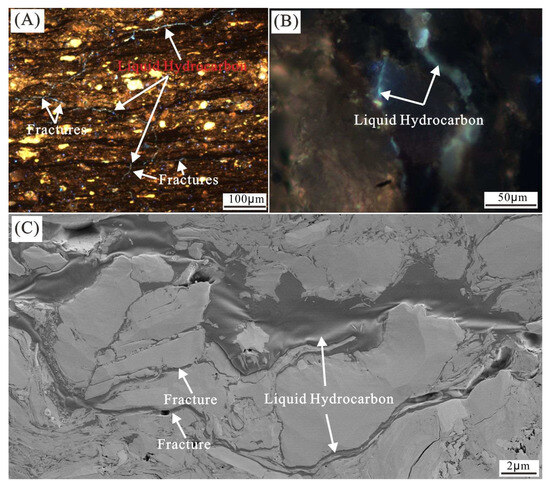
Figure 16.
Photographs of micro-fractures in Yanchang shale. (A) Thin-section image of micro-fracture network filled with liquid hydrocarbons under UV light, well W2. (B) Thin-section image of high-angle micro-fractures filled with liquid hydrocarbons under UV light, well H1. (C) SEM image of micro-fractures and inorganic pores filled with liquid hydrocarbons, well Y8.
It is important to note that observations of outcrops, cores, and thin sections can aid in the analysis of the distribution of organic-lean sand-silt intervals, organic-rich layers, and fractures, but they cannot reveal the characteristics of organic and inorganic pores within them. SEM observations provide detailed insights into the micro-scale characteristics of organic matter and pore networks. However, the samples used for 2D SEM analysis in this study are at the millimeter to centimeter scale. Considering the heterogeneity of organic matter and the pore network distribution in shales and the limitations of the SEM field of view, the distribution and characteristics of organic matter and pore networks may vary significantly across different regions of the shale. Two-dimensional SEM observations cannot fully reflect the distribution and connectivity of pore networks, sand-silt intervals, and fractures at larger scales. In the future, it will be necessary to combine techniques such as Micro-CT 3D scanning to analyze the distribution and connectivity characteristics of pore networks in three-dimensional space, thereby more accurately understanding the hydrocarbon migration pathways in shales.
5.3. Petroleum Primary Migration Model
According to the heterogeneous characteristics of sand-silt intervals in the Yanchang shales, and the differences between organic-lean sand-silt intervals and organic-rich mudstones in terms of detrital composition, grain size, organic geochemistry, pore systems and pore size, and porosity, a speculative model for the primary migration of hydrocarbons in the Yanchang shale is proposed (Figure 17).
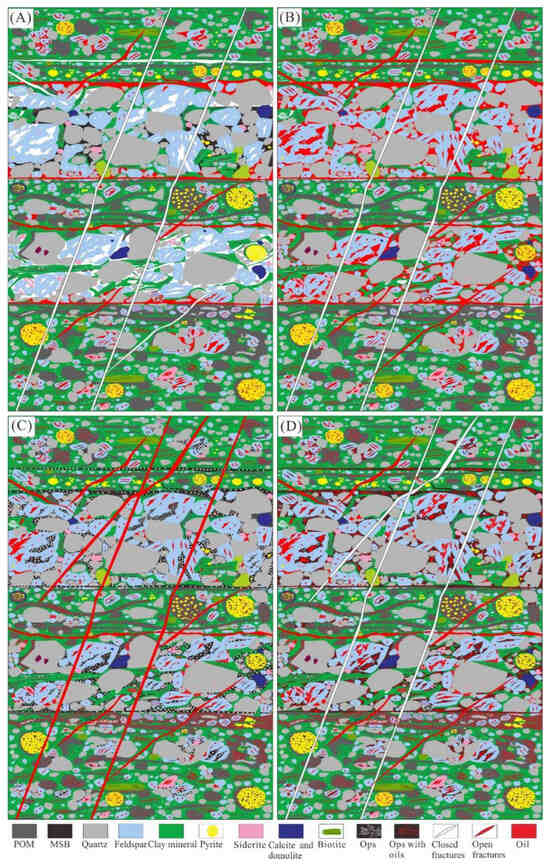
Figure 17.
Schematic illustration of hydrocarbon generation, expulsion, and migration model in the Yanchang shale of the Ordos Basin, China. (A) Hydrocarbons adsorbed onto kerogen are discharged from organic matter and then migrate into the adjacent inorganic pores and micro-fractures. (B) As more hydrocarbons are generated and released from the kerogen, they migrate into pores and micro-fractures farther away from the kerogen. Subsequently, the hydrocarbons migrate vertically and laterally into the inorganic pores of sand-silt intervals. (C) High-angle fractures are reactivated or newly formed due to overpressure. As a result, hydrocarbons in the pores of mudstones and sand-silt intervals migrate vertically through these fractures into thicker sand intervals, as well as into overlying and underlying reservoirs and carrier beds. (D) Episodic hydrocarbon generation and expulsion from kerogen occur, with the hydrocarbons migrating into the pores and micro-fractures of mudstones and sand-silt intervals until hydrocarbon generation and expulsion cease.
The Yanchang shale contains heterogeneously distributed organic-lean sand-silt intervals (Figure 2 and Figure 13). These intervals, which have relatively lower POM content, are characterized by well-developed interP, intraP, and dissolution pores. They typically exhibit larger pore diameters and higher porosity. In contrast, organic-rich shales have higher POM content, smaller pore diameters, and lower porosity. Low-angle and high-angle fractures penetrate both the organic-lean sand-silt intervals and the organic-rich mudstones, interconnecting the inorganic pore network, organic pore network, and organic matter network to form migration pathways (Figure 16 and Figure 17).
Before organic matter reaches the threshold for hydrocarbon generation, as burial depth increases and temperature rises, the POM forms some derivatives during its transformation into kerogen [81]. These derivatives migrate over ultra-short distances to inorganic pores adjacent to the kerogen and form pre-oil solid bitumen [21], albeit in limited quantities (Figure 17A).
Once organic matter reaches the threshold for hydrocarbon generation, the organic matter in organic-rich mudstone begins to generate oil and forms some organic pores. When the amount of oil and gas exceeds the adsorption capacity of kerogen, the excess hydrocarbons are released from the kerogen and migrate into adjacent inorganic pores (Figure 17A). Similarly, a small amount of hydrocarbons generated from kerogen in organic-lean sand-silt intervals also migrates into adjacent inorganic pores. Some liquid hydrocarbons are adsorbed onto POM, MSB, and clay minerals, while others fill the pore space and micro-fractures as free oil.
As maturity increases, more hydrocarbons are generated and released from kerogen, while the content of POM decreases due to hydrocarbon generation in the organic-rich mudstones. These hydrocarbons continuously migrate away from the kerogen into inorganic pores through a network composed of inorganic pores, organic matter, and fractures (Figure 17B). Eventually, they migrate through these pathways to the pores and micro-fractures of adjacent sand-silt intervals, which have larger pore diameters and greater porosity and permeability, forming micro-accumulations (Figure 17B). Consequently, the content of liquid hydrocarbons increases in the sand-silt intervals. The sand-silt intervals serve as “pipelines” and “micro reservoirs” during hydrocarbon primary migration.
As the maturity of organic matter further increases, kerogen generates an increasing amount of hydrocarbons. Compaction and hydrocarbon generation lead to increased overpressure within the source rock, causing some micro-fractures to form or react (Figure 17C). The hydrocarbons accumulated in sand-silt intervals migrate to thicker, more porous and permeable sandstone intervals or to the sandstone reservoirs and carriers at the top or bottom of the source rock. As hydrocarbons are continuously expelled from the source rock, the total amount of hydrocarbons and the pressure decrease, leading to the closure of some fractures. Consequently, the content of liquid hydrocarbon decreases in the sand-silt intervals and mudstones, while the liquid hydrocarbons remaining in the pores are transformed into MSB with bubble-like and spongy organic pores through subsequent thermal metamorphism (Figure 17C). The content of MSB rises in both the sand-silt intervals and mudstones.
Subsequently, as the maturity of organic matter continuously increases, the aforementioned processes of hydrocarbon generation and migration recur. Hydrocarbons generated in the late stages of the organic-rich mudstones migrate once more to the adjacent organic-lean sand-silt interval (Figure 17D). Except for the liquid hydrocarbons adsorbed onto POM, MSB, and clay minerals, the others fill the inorganic and organic pores as free oil. This process is repeated until hydrocarbon generation ceases.
Several conceptual models for hydrocarbon migration and expulsion have been pro-posed by comparing the difference of mineralogy, pore structure, and organic geo-chemical characteristics between meter-scale organic-lean intervals and organic-rich mud rock layers [6,7,82]. The organic-clean sand-silt intervals at the millimeter to decimeter scales are more common in shale systems. Compared to models proposed by previous studies [6,7,82], the primary hydrocarbon migration and expulsion model proposed in this study not only focuses on pore networks and fractures, but also emphasizes the role of these millimeter- to decimeter-scale organic-clean sand-silt intervals. The model presented in this paper is based on observations of cores from 34 wells and 20 outcrops, a large number of samples’ mineralogical, geochemical, and porosity data, as well as SEM observations. These sand-silt intervals show distinct differences in petrology, organic geochemistry, and pore structure compared to the organic-rich mudstone layers, which are similar to the findings of other studies [4,6,8,25,64]. Therefore, the model proposed in this study is representative of the Ordos Basin.
The model presented in this study is primarily based on the differences in pore systems, OSI, and MSB between organic-clean sand-silt intervals and organic-rich mudstone layers. However, the distribution and characteristics of OSI and MSB are not only influenced by hydrocarbon migration but are also affected by other factors such as source organic matter (OM) quality, maturity gradients, and adsorption dynamics. Therefore, the model proposed in this study should be regarded as a preliminary conceptual model. If two-dimension nuclear magnetic resonance analysis and gas chromatography-mass spectrometry analysis are used in future studies to compare the free hydrocarbon content, components, and biomarker characteristics of organic-clean sand-silt intervals and organic-rich mud rock layers, it may help to further understand the hydrocarbon migration and expulsion models in shale systems. The model established in this study can also serve as a reference for shales in other basins with sedimentary environments and characteristics similar to the Yanchang shale in the Ordos Basin.
5.4. Implications for Shale Oil Exploration
As discussed above, the sand-silt intervals have relatively higher contents of brittle minerals such as quartz and feldspar and relatively larger detrital grain sizes compared to the organic-rich mudstones (Figure 3, Figure 4 and Figure 5, Table 1) [7,25,29,53,54]. This makes the sand-silt intervals more brittle than the organic-rich layers. Moreover, the sand-silt intervals have relatively larger pore sizes and higher porosity (Figure 9 and Figure 10) [25,29,53,54], providing a larger capacity for hydrocarbon storage and migration. In the sand-silt intervals, inorganic pores are more common, with some being filled with porous MSB. In addition, there are more interconnected pores with lager size and microfractures adjacent to the sand-silt intervals [24,25,45,53,54]. Therefore, in addition to having larger pore sizes and higher porosity, the sand-silt intervals also have better connectivity of the pore networks. The content of clay minerals and TOC in the sand-silt intervals is lower than those in mudstones. Hydrocarbons generated from kerogen in organic-rich mudstones migrate to the sand-silt intervals. Due to physical and chemical compositional fractionation by adsorption or migration, the hydrocarbons in the sand-silt intervals have lower sorption affinities and are characterized by lighter oil with smaller size and mass, lower content of asphaltenes, higher content of saturates, weaker polarity, and lower viscosity [4,6,10,35,77,78,79,80,81]. As a result, the sand-silt intervals have higher OSI and better oil mobility. Therefore, sections with densely developed organic-lean sand-silt intervals are sweet spots for shale oil and gas, usually contributing to high oil production potential.
Consequently, the sand-silt intervals exhibit higher OSI values and enhanced oil mobility. Thus, within the Yanchang shale, zones or areas where organic-lean sand-silt intervals are densely developed are identified as sweet spots for shale oil and gas accumulation, consistently exhibiting higher oil production potential.
6. Conclusions
In this study, thin-section observation, X-ray diffraction, Rock-Eval pyrolysis, FE-SEM, and porosity analysis were employed to investigate the petrography, geochemistry, pore system and pore size, and porosity of organic-rich shale and organic-lean sand-silt intervals from samples of the Yanchang Formation in the Ordos Basin, China. The following conclusions can be drawn:
- (1)
- The Yanchang shale exhibits heterogeneity in petrology, mineral composition, geochemistry, OM type, and OM content. Compared to organic-rich mudstones, sand-silt intervals typically have coarser grain sizes, higher quartz and feldspar content, higher OSI and RMSB values, and lower clay mineral content, as well as TOC, S1, and S2 values.
- (2)
- There are differences in dominant pore type, pore morphology, pore size, and porosity between mudstones and sand-silt intervals. Compared with mudstones, sand-silt intervals develop more inorganic pores with larger pore sizes, which are often filled with hydrocarbons and MSB with organic pores. The median pore size of inorganic and organic pores in sand-silt intervals is approximately 110 nm and 87 nm, respectively, with porosity ranging from 0.83% to 8.37%, averaging 4.32%. In contrast, the median pore size of inorganic and organic pores in mudstones is 40 nm and 65 nm, respectively, with porosity varying between 0.54% and 7.7%, averaging 3.24%.
- (3)
- In the Yanchang Formation, high-angle fractures, low-angle fractures, and fractures parallel to bedding are well-developed. High-angle fractures mainly trend in the east–west direction, with the north–south direction being secondary, and their dip angles are generally greater than 75 degrees. These fractures are commonly filled with calcite, solid bitumen, and liquid hydrocarbons.
- (4)
- Sand-silt intervals in the Yanchang shale serve as both “pathways” and “micro reservoirs” within source rock and play an important role in hydrocarbon storage and migration. Fractures with different trends and dips penetrate and connect the inorganic and organic pore networks, organic matter networks, and sand-silt intervals within different parts of the source rock to form pathways for the hydrocarbon primary migration within Yanchang shale. A speculative model for the primary migration of hydrocarbons in the Yanchang shale is proposed.
- (5)
- The sand-silt intervals in the Yanchang shale, characterized by higher brittleness and porosity, enhanced pore connectivity, higher OSI values, and improved oil quality, serve as sweet spots for shale oil and gas exploration.
Author Contributions
Methodology, Y.L. and L.Z.; validation, L.Z. and M.C.; investigation, M.C. and J.Y.; data curation, N.L. and Z.C.; writing—original draft, Y.L. and L.Z.; writing—review and editing, X.W. and J.Y.; visualization, J.Y. and Z.C. All authors have read and agreed to the published version of the manuscript.
Funding
This research was funded by the National Natural Science Foundation of China, grant number 42030808.
Institutional Review Board Statement
Not applicable.
Informed Consent Statement
Not applicable.
Data Availability Statement
Data are contained within the article.
Acknowledgments
The study would not have been possible without the support from Shanxi Yanchang Petroleum (Group) Corp., Ltd., Xi’an, China. We thank Shaanxi Yanchang Petroleum (Group) Corp., Ltd., for permission to publish this work. We appreciate the anonymous reviewers very much for valuable comments and suggestions that greatly improved the manuscript.
Conflicts of Interest
Author Xiangzeng Wang and Jintao Yin were employed by the company Research Institute of Shaanxi Yanchang Petroleum (Group) Co., Ltd. Author Zhenjia Cai was employed by the company Geophysical Laboratory, SINOPEC Geophysical Research Institute Co., Ltd. The remaining authors declare that the research was conducted in the absence of any commercial or financial relationships that could be construed as a potential conflict of interest.
Abbreviations
The following abbreviations are used in this manuscript:
| FE-SEM | Field-emission scanning electron microscopy |
| MSB | Migrated solid bitumen |
| OSI | Oil saturation index |
| TOC | total organic carbon |
| S1 | free liquid hydrocarbons |
| S2 | total residual hydrocarbons |
| HI | Hydrogen index |
| Ro | Vitrinite reflectance |
| OM | Organic matter |
| UV | Ultraviolet |
| EDS | Energy-dispersive spectroscopy |
| POM | Primary solid organic matter |
| EOM | Extractable organic matter |
| OPs | Organic pores |
| interP | Inter-particle |
| intraP | Intra-particle |
| Q | Quartz |
| F | Feldspar |
| S | Siderite |
| Py | Pyrite |
References
- Tissot, B.P.; Welte, D.H. Petroleum Formation and Occurrence, 2nd ed.; Springer: Berlin, Germany, 1984; pp. 325–340. [Google Scholar]
- Inan, S.M.; Yalcin, M.N.; Mann, U. Expulsion of oil from petroleum source rocks: Inferences from pyrolysis of samples of unconventional grain size. Org. Geochem. 1998, 29, 45–61. [Google Scholar] [CrossRef]
- Kelemen, S.R.; Walters, C.C.; Ertas, D.; Freund, H.; Curry, D.J. Petroleum Expulsion Part 3. A Model of Chemically Driven Fractionation during Expulsion of Petroleum from Kerogen. Energy Fuel. 2006, 20, 309–319. [Google Scholar] [CrossRef]
- Zou, C.S.; Pan, B.Q.; Horsfield, B.; Yang, Z.; Hao, S.Y.; Liu, E.T.; Zhang, L.F. Oil retention and intrasource migration in the organic-rich lacustrine Chang 7 shale of the Upper Triassic Yanchang Formation, Ordos Basin, central China. AAPG Bull. 2019, 103, 2627–2663. [Google Scholar] [CrossRef]
- Hu, S.Z.; Li, S.F.; Xia, L.W.; Lv, Q.; Cao, J. On the internal oil migration in shale systems and implications for shale oil accumulation: A combined petrological and geochemical investigation in the Eocene Nanxiang Basin, China. J. Pet. Sci. Eng. 2020, 184, 106493. [Google Scholar] [CrossRef]
- Guo, Q.L.; Yao, Y.; Hou, L.H.; Tang, S.H.; Pan, S.Q.; Yang, F. Oil migration, retention, and differential accumulation in “sandwiched” lacustrine shale oil systems from the Chang 7 member of the Upper Triassic Yanchang Formation, Ordos Basin, China. Int. J. Coal Geol. 2022, 261, 104077. [Google Scholar] [CrossRef]
- Ji, W.M.; Hao, F.; Gong, F.; Gong, F.H.; Zhang, J.; Bai, Y.F.; Liang, C.; Tian, J.Q. Petroleum migration and accumulation in a shale oil system of the Upper Cretaceous Qingshankou Formation in the Songliao Basin, northeastern China. AAPG Bull. 2024, 108, 38. [Google Scholar] [CrossRef]
- Jin, Z.J.; Wang, G.P.; Liu, G.X.; Gao, B.; Liu, Q.Y.; Wang, H.L.; Liang, X.P.; Wang, R.Y. Research progress and key scientific issues of continental shale oil in China. Acta Petrol. Sin. 2021, 42, 821–835. [Google Scholar] [CrossRef]
- McAuliffe, C.D. Oil and gas migration—Physical and chemical constraints. AAPG Bull. 1979, 63, 61–781. [Google Scholar] [CrossRef]
- Leythaeuser, D.; Radke, M.; Schaefer, R.G. Efficiency of petroleum expulsion from shale source rocks. Nature 1984, 311, 745–748. [Google Scholar] [CrossRef]
- Stainforth, J.G.; Reinders, J.E.A. Primary migration of hydrocarbons by diffusion through organic matter networks, and its effect on oil and gas generation. Org. Geochem. 1990, 16, 61–74. [Google Scholar] [CrossRef]
- Leythaeuser, D.; Radke, M.; Willsch, H. Geochemical effects of primary migration of petroleum in Kimmeridge source rocks from Brae field area, North Sea. II: Molecular composition of alkylated naphthalenes, phenanthrenes, benzo and dibenzothiophenes. Geochim. Cosmochim. Acta 1988, 52, 2879–2891. [Google Scholar] [CrossRef]
- Pepper, A.S. Estimating the petroleum expulsion behaviour of source rocks: A novel quantitative approach. In Petroleum Migration; England, W.A., Fleet, A.J., Eds.; Special Publications; Geological Society: London, UK, 1991; Volume 59, pp. 9–31. [Google Scholar] [CrossRef]
- Luo, X.R.; Vasseur, G. Modelling of pore pressure evolution associated with sedimentation and uplift in sedimentary basins. Basin Res. 1995, 7, 35–52. [Google Scholar] [CrossRef]
- Kuo, L.C.; Hardy, H.H.; Owili-Eger, A.S.C. Quantitative modeling of organic matter connectivity in source rocks using fractal geostatistical analysis. Org. Geochem. 1995, 23, 29–42. [Google Scholar] [CrossRef]
- Mann, U.; Hantschel, T.; Schaeler, R.U.; Krooss, B.; Leythaeuser, D.; Littke, R.; Sachsenhofer, R.F. Petroleum mechanisms, pathways, efficiencies and numerical simulations. In Petroleum and Basin Evolution; Welte, D.H., Horslield, B., Baker, D.R., Eds.; Springer: Berlin, Germany, 1997; pp. 403–520. [Google Scholar] [CrossRef]
- Jin, Z.H.; Johnson, S.E. Primary oil migration through buoyancy-driven multiple fracture propagation: Oil velocity and flux. Geophys. Res. Lett. 2008, 35, 250–258. [Google Scholar] [CrossRef]
- Stainforth, J.G. Practical kinetic modeling of petroleum generation and expulsion. Mar. Pet. Geol. 2009, 26, 552–572. [Google Scholar] [CrossRef]
- Eseme, E.; Krooss, B.M.; Littke, R. Evolution of petrophysical properties of oil shales during high-temperature compaction tests: Implications for petroleum expulsion. Mar. Pet. Geol. 2012, 31, 110–124. [Google Scholar] [CrossRef]
- Curtis, M.E.; Sondergeld, C.H.; Ambrose, R.J.; Rai, C.S. Microstructural investigation of gas shales in two and three dimensions using nanometer-scale resolution imaging. AAPG Bull. 2012, 96, 665–677. [Google Scholar] [CrossRef]
- Loucks, R.G.; Reed, R.M. Scanning-electron-microscope petrographic evidence for distinguishing organic-matter pores associated with depositional organic matter versus migrated organic matter in mudrocks. GCAGS J. 2014, 3, 51–60. [Google Scholar]
- Löhr, S.C.; Baruch, E.T.; Hall, P.A.; Kennedy, M.J. Is organic pore development in gas shales influenced by the primary porosity and structure of thermally immature organic matter? Org. Geochem. 2015, 87, 119–132. [Google Scholar] [CrossRef]
- Cardott, B.J.; Landis, C.R.; Curtis, M.E. Post-oil solid bitumen network in the Woodford Shale, USA—A potential primary migration pathway. Int. J. Coal Geol. 2015, 139, 106–113. [Google Scholar] [CrossRef]
- Raji, M.; Gröcke, D.R.; Greenwell, H.C.; Gluyas, J.G.; Cornford, C. The effect of interbedding on shale reservoir properties. Mar. Pet. Geol. 2015, 67, 154–169. [Google Scholar] [CrossRef]
- Lei, Y.H.; Luo, X.R.; Wang, X.Z.; Zhang, L.K.; Jiang, C.F.; Yang, W.; Yu, Y.X.; Cheng, M. Characteristics of silty laminae in Zhangjiatan Shale of southeastern Ordos Basin, China: Implications for shale gas formation. AAPG Bull. 2015, 99, 661–687. [Google Scholar] [CrossRef]
- Liang, C.; Cao, Y.C.; Liu, K.Y.; Jiang, Z.X.; Wu, J.; Hao, F. Diagenetic variation at the lamina scale in lacustrine organic-rich shales: Implications for hydrocarbon migration and accumulation. Geochim. Cosmochim. Acta 2018, 229, 112–128. [Google Scholar] [CrossRef]
- Maria, M.; Agnieszka, D.; Stankiewicz, A.B. Origin, properties, and implications of solid bitumen in source-rock reservoirs: A review. Int. J. Coal Geol. 2018, 195, 14–36. [Google Scholar] [CrossRef]
- Milliken, K.L.; Zhang, T.W.; Chen, J.P.; Ni, Y.Y. Mineral diagenetic control of expulsion efficiency in organic-rich mudrocks, Bakken Formation (Devonian- Mississippian), Williston Basin, North Dakota, U.S.A. Mar. Pet. Geol. 2021, 127, 104869. [Google Scholar] [CrossRef]
- Lei, Y.Y.; Luo, X.R.; Wang, X.Z.; Cheng, M. Effects of extractable organic matter from mature lacustrine shale on the pore structure and their implications. AAPG Bull. 2022, 106, 1239–1264. [Google Scholar] [CrossRef]
- Zhang, T.; Krooss, B.M. Experimental investigation on the carbon isotope fractionation of methane during gas migration by diffusion through sedimentary rocks at elevated temperature and pressure. Geochim. Cosmochim. Acta 2001, 65, 2723–2742. [Google Scholar] [CrossRef]
- Eseme, E.; Littke, R.; Krooss, B.M.; Schwaubauer, J. Experimental investigation of the compositional variation of petroleum during primary migration. Org. Geochem. 2007, 38, 1373–1397. [Google Scholar] [CrossRef]
- Han, Y.J.; Horsfield, B.; Wirth, R.; Mahlstedt, N.; Bernard, S. Oil retention and porosity evolution in organic-rich shales. AAPG Bull. 2017, 101, 807–827. [Google Scholar] [CrossRef]
- Han, Y.J.; Mahlstedt, N.; Horsfield, B. The Barnett Shale: Compositional fractionation associated with intraformational petroleum migration, retention, and expulsion. AAPG Bull. 2015, 99, 2173–2202. [Google Scholar] [CrossRef]
- Hawthorne, S.B.; Miller, D.J.; Kukowsk, K.; Grabanski, C.B.; Abarghani, A.; Azzolina, N.; Pekot, L.J.; Kurz, B.A.; Sorensen, J.A. Turtles and snakes—Evidence for molecular shape-selective migration of crude oil hydrocarbons in the Bakken petroleum system. Energy Fuel 2021, 35, 10584–10596. [Google Scholar] [CrossRef]
- Abarghani, A.; Ardakani, O.H.; Hawthorne, S.B.; Smith, S.A.; Kurz, B.A.; Sorensen, J.A. Application of aromatic/aliphatic ratios analysis in revealing migration pathways in unconventional reservoirs: A case study of the Bakken Shale. Int. J. Coal Geol. 2022, 260, 104070. [Google Scholar] [CrossRef]
- Ko, L.T.; Loucks, R.G.; Milliken, K.L. Controls on pore types and pore-size distribution in the Upper Triassic Yanchang Formation, Ordos Basin, China: Implications for pore-evolution models of lacustrine mudrocks. Interpretation 2017, 5, SF127–SF147. [Google Scholar] [CrossRef]
- Zhao, W.Z.; Hu, S.Y.; Hou, L.H.; Yang, T.; Li, X.; Guo, B.C.; Yang, Z. Types and resource potential of continental shale oil in China and its boundary with tight oil. Pet. Explor. Dev. 2020, 47, 1–10. [Google Scholar] [CrossRef]
- Ma, Y.S.; Cai, X.Y.; Zhao, P.R.; Hu, Z.Q.; Liu, H.M.; Gao, B.; Wang, W.Q.; Li, Z.M.; Zhang, Z.L. Geological Characteristics and Exploration Practice of Continental Shale Oil in China. Acta Geol. Sin. 2022, 96, 155–171. [Google Scholar] [CrossRef]
- Zou, C.N.; Ma, F.; Pan, S.Q.; Zhang, S.X.; Wu, S.T.; Fu, G.Y.; Wang, H.J.; Yang, Z. Formation and distribution potential of global shale oil and the developments of continental shale oil theory and technology in China. Earth Sci. Front. 2023, 30, 128–142. [Google Scholar] [CrossRef]
- Parnell, J.; Chen, H.H.; Middleton, D.; Haggan, T.; Carey, P. Significance of fibrous mineral veins in hydrocarbon migration: Fluid inclusion studies. J. Geochem. Explor. 2000, 69–70, 623–627. [Google Scholar] [CrossRef]
- Lash, G.G.; Engelder, T. An analysis of horizontal microcracking during catagenesis: An example from the Catskill delta complex. AAPG Bull. 2005, 89, 1433–1449. [Google Scholar] [CrossRef]
- Zhang, J.; Pang, X.Q.; Jiang, Z.X.; Chen, D.X.; Du, C.G. Primary Hydrocarbon Migration Paths and Evidence in Lower Es3 Source Rock, Niuzhuang-Liuhu Sag, Dongying Depression, China. Acta Geol. Sin. 2007, 81, 210–218. [Google Scholar]
- Gale, J.F.; Stephen, E.L.; Laubach, S.E.; Olson, J.E.; Eichhubl, P.; Fall, A. Natural fractures in shale: A review and new observations. AAPG Bull. 2014, 98, 2165–2216. [Google Scholar] [CrossRef]
- Shi, H.; Luo, X.R.; Xu, H.; Wang, X.Z.; Zhang, L.X.; Wang, Q.C.; Lei, Y.H.; Jiang, C.F.; Cheng, M.; Ma, S. Identification and distribution of fractures in the Zhangjiatan shale of the Mesozoic Yanchang Formation in Ordos Basin. Interpretation 2017, 5, SF167–SF176. [Google Scholar] [CrossRef]
- Teixeira, M.G.; Donzé, F.; Renard, F. Microfracturing during primary migration in shales. Tectonophysics 2017, 694, 268–279. [Google Scholar] [CrossRef]
- Berg, R.R.; Gangi, A.F. Primary migration by oil-generation microfracturing in low-permeability source rocks: Application to the Austin Chalk, Texas. AAPG Bull. 1999, 83, 727–756. [Google Scholar] [CrossRef]
- Ma, X.X.; Li, M.W.; Pang, X.Q.; Wei, X.Y.; Qian, M.H.; Tao, G.L.; Liu, P.; Jiang, Q.G.; Li, Z.M.; Zhao, Y.; et al. Paradox in bulk and molecular geochemical data and implications for hydrocarbon migration in the inter-salt lacustrine shale oil reservoir, Qianjiang Formation, Jianghan Basin, Central China. Int. J. Coal Geol. 2019, 209, 72–88. [Google Scholar] [CrossRef]
- Liang, C.; Cao, Y.C.; Jiang, Z.X.; Wu, J.; Song, G.Q.; Wang, Y.S. Shale oil potential of lacustrine black shale in the Eocene Dongying depression: Implications for geochemistry and reservoir characteristics. AAPG Bull. 2017, 101, 1835–1858. [Google Scholar] [CrossRef]
- Ping, H.W.; Li, C.Q.; Chen, H.H.; George, S.C.; Gong, S. Overpressure release: Fluid inclusion evidence for a new mechanism for the formation of heavy oil. Geology 2020, 48, 803–807. [Google Scholar] [CrossRef]
- Fan, Z.Q.; Jin, Z.H.; Johnson, S.E. Modelling petroleum migration through microcrack propagation in transversely isotropic source rocks. Geophys. J. Int. 2012, 190, 179–187. [Google Scholar] [CrossRef]
- Panahi, H.; Kobchenko, M.; Renard, F.; Mazzini, A.; Scheibert, J.; Dysthe, D.; Jamtveit, B.; Malthe-Sorenssen, A.; Meakin, P. A 4D synchrotron X-ray tomography study of the formation of hydrocarbon migration pathways in heated organic-rich shale. SPE J. 2014, 18, 366–377. [Google Scholar] [CrossRef]
- Oen, P.M.; Engel-Jensen, M.; Barendregt, A.A. Skjold Field, Danish North Sea: Early evaluations of oil recovery through water imbibition in a fractured reservoir. SPE Reserv. Eng. 1988, 3, 17–22. [Google Scholar] [CrossRef]
- O’Brien, N.R.; Slatt, M.R.; Senftlet, J. The significance of oil shale fabric in primary hydrocarbon migration. Fuel 1994, 73, 1518–1522. [Google Scholar] [CrossRef]
- Rokosh, D.; Pawlowicz, S.; Anderson, S.; Berhane, M.; Beaton, A. Shale fabric, mineralogy and effective porosity of the Upper Colorado Group. In Proceedings of the CSPG CSEG CWLS Convention, Calgary, AB, Canada, 4–8 May 2009; pp. 572–576. [Google Scholar]
- Aplin, A.C.; Macquaker, J.H.S. Mudstone diversity: Origin and implications for source, seal, and reservoir properties in petroleum systems. AAPG Bull. 2011, 95, 2031–2059. [Google Scholar] [CrossRef]
- Cheng, M.; Lei, Y.H.; Zhang, L.K.; Wang, X.Z.; Zhang, L.X.; Jiang, C.F.; Yin, J.T. Pore Type, pore Structure, and controlling factors in the Late Triassic Lacustrine Yanchang Shale, Ordos Basin, China. Energies 2021, 14, 3053. [Google Scholar] [CrossRef]
- Tao, H.; Jiang, F.J.; Pang, X.Q.; Liu, Y.; Wu, G.Y.; Zhou, K.; Xiao, H.Y.; Jiang, Z.X.; Li, M.W.; Jiang, S.; et al. Identification and evaluation of shale oil micromigration and its petroleum geological significance. Pet. Explor. Dev. 2024, 51, 127–140. [Google Scholar] [CrossRef]
- Yang, H.; Zhang, W.Z. Leading effect of the Seventh Member high-quality source rock of Yanchang Formation in Ordos Basin during the enrichment of low-penetrating oil-gas accumulation. Geochimica 2005, 34, 147–154. [Google Scholar] [CrossRef]
- Yang, J.J. Structural Evolution and Oil and Gas Distribution of Ordos Basin; Petroleum Industry Press: Beijing, China, 2002; pp. 20–45. [Google Scholar]
- He, Z.X. Evolution and Petroleum of Ordos Basin; Petroleum Industry Press: Beijing, China, 2003; pp. 20–50. [Google Scholar]
- Kong, Q.F. The organic maceral characteristic of Yanchang source rock in Ordos Basin. Xinjiang Petrol. Geol. 2007, 28, 163–166. [Google Scholar]
- Guo, H.J.; He, R.; Jia, W.L.; Peng, P.A.; Lei, Y.H.; Luo, X.R.; Wang, X.Z.; Zhang, L.X.; Jiang, C.F. Pore characteristics of lacustrine shale within the oil window in the Upper Triassic Yanchang Formation, southeastern Ordos Basin, China. Mar. Pet. Geol. 2018, 91, 279–296. [Google Scholar] [CrossRef]
- Guo, H.J.; Jia, W.L.; Peng, P.A.; Lei, Y.H.; Luo, X.R.; Cheng, M. The composition and its impact on the methane sorption of lacustrine shales from the Upper Triassic Yanchang For-mation, Ordos Basin, China. Mar. Pet. Geol. 2014, 57, 509–520. [Google Scholar] [CrossRef]
- Jiang, F.J.; Chen, D.; Wang, Z.F.; Xu, Z.Y.; Chen, J.; Liu, L.; Huyan, Y.Y.; Liu, Y. Pore characteristic analysis of a lacustrine shale: A case study in the Ordos Basin, NW China. Mar. Pet. Geol. 2016, 73, 554–571. [Google Scholar] [CrossRef]
- Yu, Y.X.; Luo, X.R.; Cheng, M. Study on the distribution of extractable organic matter in pores of lacustrine shale: An example of Zhangjiatan Shale from the Upper Triassic Yanchang Formation, Ordos Basin, China. Interpretation 2017, 5, SF109–SF126. [Google Scholar] [CrossRef]
- Bennett, R.H.; Hulbert, M.H.; Curry, K.J.; Curry, A.; Douglas, J. Organic matter sequestered in potential energy fields predicted by 3-D clay microstructure model: Direct observations of organo-clay micro-and nanofabric. Mar. Geol. 2012, 315, 108–114. [Google Scholar] [CrossRef]
- Milliken, K.L.; Rudnicki, M.; Awwiller, D.N.; Zhang, T.W. Organic matter–hosted pore system, Marcellus formation (Devonian), Pennsylvania. AAPG Bull. 2013, 97, 177–200. [Google Scholar] [CrossRef]
- Jacob, H. Classification, structure, genesis and practical importance of natural solid oil bitumen (“migrabitumen”). Int. J. Coal Geol. 1989, 11, 65–79. [Google Scholar] [CrossRef]
- Vandenbroucke, M.; Largeau, C. Kerogen origin, evolution and structure. Org. Geochem. 2007, 38, 719–833. [Google Scholar] [CrossRef]
- Desbois, G.; Urai, J.L.; Kukla, P.A. Morphology of the pore space in claystones—Evidence from BIB/FIB ion beam sectioning and cryo-SEM observations. EEarth 2009, 4, 15–22. [Google Scholar] [CrossRef]
- Loucks, R.G.; Reed, R.M.; Ruppel, S.C.; Jarvie, D.M. Morphology, genesis, and distribution of nanometer-scale pores in siliceous mudstones of the Mississippian Barnett shale. J. Sed. Res. 2009, 79, 848–861. [Google Scholar] [CrossRef]
- Slatt, R.M.; O’Brien, N.R. Pore types in the Barnett and Woodford gas shales: Contribution to understanding gas storage and migration pathways in fine-grained rocks. AAPG Bull. 2011, 95, 2017–2030. [Google Scholar] [CrossRef]
- Chalmers, G.R.; Bustin, R.M.; Power, I.M. Characterization of gas shale pore systems by porosimetry, pycnometry, surface area, and field emission scanning electron microscopy/transmission electron microscopy image analyses: Examples from the Barnett, Woodford, Haynesville, Marcellus, and Doig units. AAPG Bull. 2012, 96, 1099–1119. [Google Scholar] [CrossRef]
- Loucks, R.G.; Reed, R.M.; Ruppel, S.C.; Hammes, U. Spectrum of pore types and networks in mudrocks and a descriptive classification for matrix-related mudrock pores. AAPG Bull. 2012, 96, 1071–1098. [Google Scholar] [CrossRef]
- Ko, L.T.; Loucks, R.G.; Zhang, T.W.; Ruppel, S.C.; Shao, D.Y. Pore and pore network evolution of Upper Cretaceous Boquillas (Eagle Ford-equivalent) mudstone: Results from gold tube pyrolysis experiments. AAPG Bull. 2016, 100, 1693–1722. [Google Scholar] [CrossRef]
- Lucy, T.; Ko, L.T.; Loucks, R.G.; Ruppel, S.C.; Zhang, T.W.; Peng, S. Origin and characterization of Eagle Ford pore networks in the south Texas Upper Cretaceous shelf. AAPG Bull. 2017, 101, 387–418. [Google Scholar] [CrossRef]
- Jarvie, D.M. Shale resource systems for oil and gas: Part 2—Shale-oil resource systems. In Shale Reservoirs—Giant Resources for 21st Century; Beyer, J.A., Ed.; AAPG Memoir; American Association of Petroleum Geologists: Tulsa, OK, USA, 2012; Volume 97, pp. 89–119. [Google Scholar] [CrossRef]
- Sajgo, C.; Maxwell, J.R.; Mackenzie, A.S. Evaluation of fractionation effects during the early stages of primary migration. Org. Geochem. 1983, 5, 65–73. [Google Scholar] [CrossRef]
- Wei, L.; Mastalerz, M.; Schimmelmann, A.; Chen, Y. Influence of Soxhlet extractable bitumen and oil on porosity in thermally maturing organic-rich shales. Int. J. Coal Geol. 2014, 132, 38–50. [Google Scholar] [CrossRef]
- Price, L.C.; Clayton, J.L. Extraction of whole versus ground source rocks: Fundamental petroleum geochemical implications including oil-source rock correlation. Geochim. Cosmochim. Acta 1992, 56, 1213–1222. [Google Scholar] [CrossRef]
- Curiale, J.A. Origin of solid bitumens, with emphasis on biological marker results. Org. Geochem. 1986, 10, 559–580. [Google Scholar] [CrossRef]
- Zhang, T.W.; Fu, Q.L.; Sun, X.; Hackley, P.C.; Ko, L.T.; Shao, D.Y. Meter-scale lithofacies cycle and controls on variations in oil saturation, Wolfcamp A, Delaware and Midland Basins. AAPG Bull. 2021, 105, 1821–1846. [Google Scholar] [CrossRef]
Disclaimer/Publisher’s Note: The statements, opinions and data contained in all publications are solely those of the individual author(s) and contributor(s) and not of MDPI and/or the editor(s). MDPI and/or the editor(s) disclaim responsibility for any injury to people or property resulting from any ideas, methods, instructions or products referred to in the content. |
© 2025 by the authors. Licensee MDPI, Basel, Switzerland. This article is an open access article distributed under the terms and conditions of the Creative Commons Attribution (CC BY) license (https://creativecommons.org/licenses/by/4.0/).