1. Introduction
Assessing the physical performance of youth athletes is crucial for talent identification, monitoring their development, and creating effective training programs [
1,
2,
3,
4]. These evaluations help coaches and sports scientists identify the strengths and weaknesses of athletes, which can guide training decisions and optimize athlete development [
5,
6,
7,
8,
9]. For athletes under 12 years of age (U12), a period characterized by rapid neuromuscular growth and motor skill development, reliable tests assessing their sprint speed, agility, and reactive agility are particularly valuable [
4,
10]. During this critical developmental window, U12 athletes exhibit significant changes in their motor coordination and strength, making accurate assessments even more important [
1]. These abilities, namely sprint speed, agility, and reactive agility, are essential in field-based sports, such as soccer, wherein athletes need to demonstrate quick linear speed, efficient directional changes, and the ability to react to dynamic game situations [
11].
Reliable performance tests are fundamental for ensuring that observed changes in performance accurately reflect true developmental progress rather than measurement errors [
12,
13,
14,
15]. High test–retest reliability ensures that repeated assessments yield consistent results, which is crucial for tracking an athlete’s progress over time [
16,
17]. Metrics like the intraclass correlation coefficient (ICC), coefficient of variation (CV), and standard error of measurement (SEM) are commonly used to determine the reliability of physical performance tests, with higher values indicating more reliable measurements [
2,
18]. High test–retest reliability provides confidence that improvements or declines in performance over time are meaningful and are not due to measurement inconsistencies [
17,
18]. Therefore, these tests can be used not only to monitor development, but also to guide individualized training programs, aimed at enhancing specific performance attributes [
2,
15,
17].
Physical and cognitive demands in youth soccer require an integrated approach to training and assessment. Sprint speed, change of direction (COD), and reactive agility are crucial components that reflect both the athlete’s neuromuscular qualities and their decision-making under pressure. Research has shown that performance in these domains is influenced not only by physical maturation [
19] and anthropometric development, but also by functional movement quality [
20], which can impact both the athlete’s performance and injury risk. While pre-planned COD tasks rely heavily on strength and motor control, reactive agility incorporates cognitive processing and visual stimulus recognition, making it more representative of game-like situations [
21]. Furthermore, involvement in structured training, such as soccer, has shown positive effects on motor function and postural control, even among special populations, such as children with intellectual disabilities [
22], highlighting the broader benefits of sport-specific engagement. However, in pre-adolescent populations (e.g., U12 players), there is a lack of research exploring how these physical and perceptual motor abilities interact. Understanding these interrelationships can support more effective talent identification and the development of individualized training strategies in regard to youth soccer development programs.
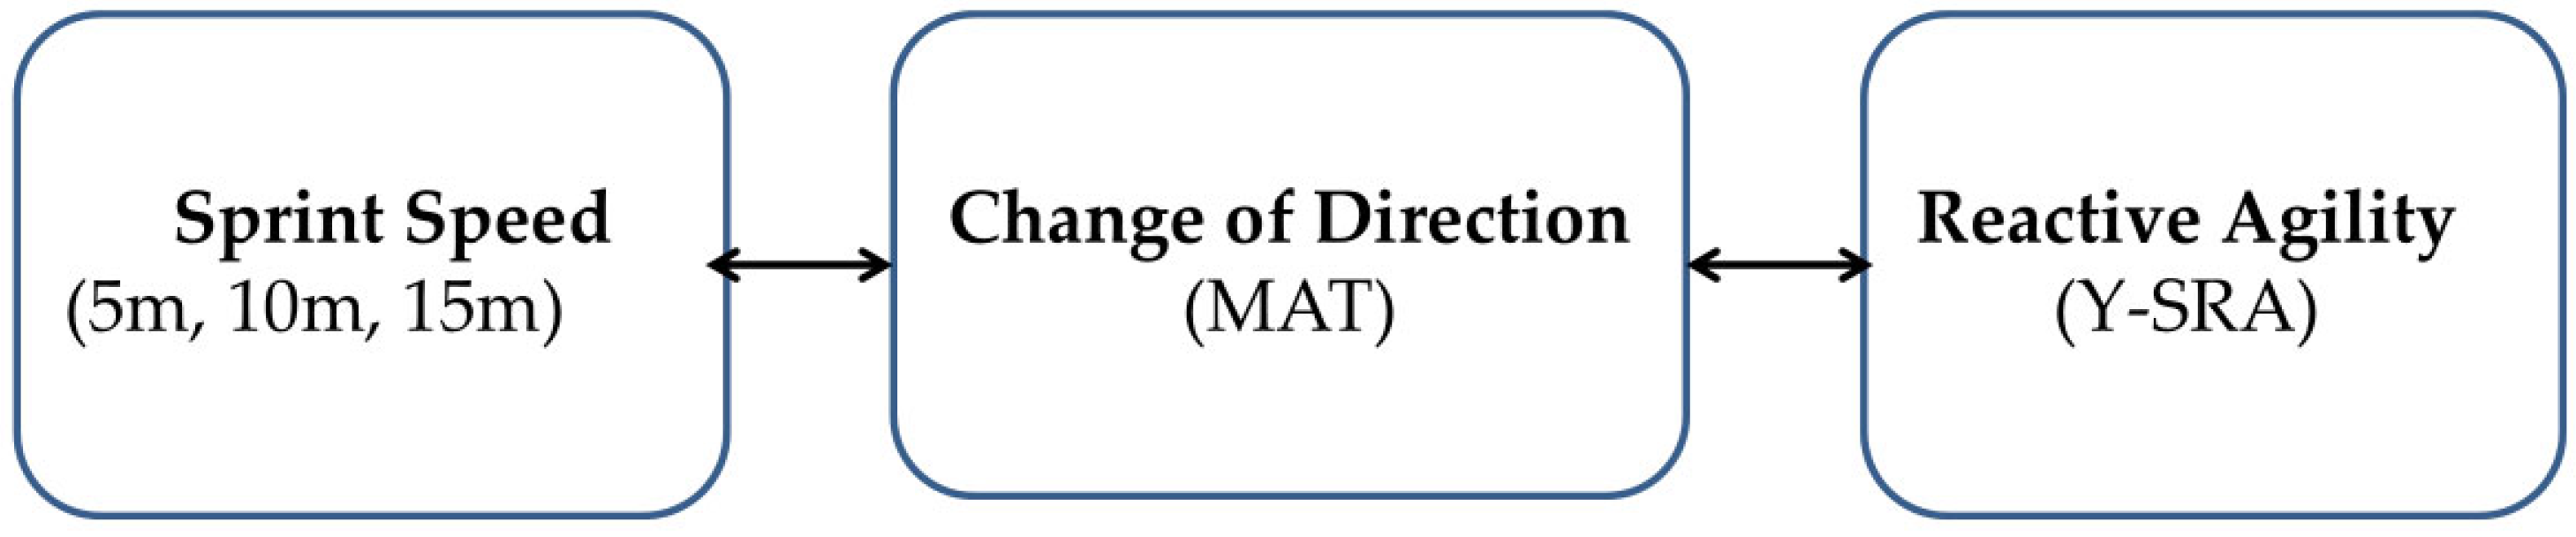
Based on the above-mentioned considerations, the primary objective of this study is to examine the relationships between sprint speed, COD, and reactive agility in U12 soccer players. Specifically, we aimed to investigate how linear sprinting performance (measured at 5 m, 10 m, and 15 m), the Modified Agility Test (MAT), and the Y-Shaped Reactive Agility (Y-SRA) test are correlated, in order to better understand the interaction between linear speed, COD ability, and perceptual cognitive agility in regard to soccer performance. It was hypothesized that there would be significant correlations between sprint speed and the agility tests, highlighting the interdependence of these components. Additionally, we evaluated the test–retest reliability of these assessments (ICC, SEM) to confirm their consistency and practical applicability for monitoring the performance of young soccer players.
2. Materials and Methods
2.1. Sample of Subjects
A total of 33 male soccer players volunteered to participate in the study. The study population consisted of young players under the age of 12, with an average experience of 3.2 years (standard deviation = 0.6). Their development was primarily shaped by their involvement in professional academies, whether private or affiliated with clubs. The age and anthropometric characteristics (body mass, stature, and body mass index) of the participants are presented in
Table 1. Height was measured using a wall-mounted stadiometer (Seca 206, Seca GmbH & Co., KG, Hamburg, Germany), with a precision of ±0.1 cm, and body mass was assessed using a calibrated digital scale (Tanita BC-545N, Tanita Corporation, Tokyo, Japan), with an accuracy of ±0.1 kg. All the measurements were taken when the participants were barefoot and wearing light clothing, following standard anthropometric procedures. The project was approved by the institutional ethics committee, and all the participants provided written informed consent.
2.2. Inclusion and Exclusion Criteria for Study Participants
The inclusion criteria for the study subjects were as follows: (1) being under the age of 12; (2) being affiliated with a football academy or club; (3) regularly participating in training sessions and competitions organized by the academy or club; and (4) having no injuries or disabilities that would limit their participation in football activities. Participants were excluded from the study if they: (1) had any current musculoskeletal injury or chronic medical condition that could affect their physical performance; (2) had experienced a significant injury within the three months preceding the testing period; (3) were taking medications that could influence their physical or cognitive performance; (4) had irregular training attendance (<80%) over the last three months; or (5) had a diagnosed neurological or developmental disorder.
2.3. Experimental Design
Initially, 45 volunteers were assessed for eligibility, with 6 excluded due to specific reasons: 3 did not meet the inclusion criteria, 1 declined participation. Of the remaining 39 participants, all were allocated to the intervention and received the intended protocol. During the follow-up phase, two participants were lost, and four missed the retest phase. Ultimately, data from 33 participants were included in the final analysis (
Figure 1).
A test–retest protocol was employed to assess the reliability. The test battery comprised speed/sprint tests (5 m, 10 m, and 15 m sprints), the MAT, and the Y-SRA test (described below). Testing was conducted on three separate occasions, with an interval of 72 h between sessions. Before the study, all the participants completed a standard warm-up routine, which included light aerobic activity and dynamic stretching exercises specifically designed to prepare the lower body for maximal sprinting and rapid changes in direction. Following the warm-up, the participants took part in a familiarization session, wherein the testing procedures were explained, and trial sets were conducted to ensure their understanding of the testing conditions. The participants completed assessments, namely speed (5 m, 10 m, and 15 m sprints) tests, the MAT, and the Y-SRA test.
The testing sessions were conducted over two days, with a 72 h interval between sessions, as previously mentioned. All the performance assessments were carried out on the same soccer field, following an identical testing sequence for consistency. The researchers thoroughly explained the details of the study to the participants. The study received approval from the Manouba University Institutional Review Board (Tunisia) and complied with the ethical guidelines set forth in the Declaration of Helsinki. The participants were informed of their right to withdraw from the study at any point without any penalties. Written consent was obtained from all the participants after they received comprehensive oral and written explanations regarding the experimental procedures, along with the potential risks and benefits. The study was conducted in March, during the official competitive season. To reduce the potential influence of circadian rhythms on their performance, all the testing sessions were scheduled at the same time as the participants’ regular evening training sessions. Additionally, the sessions took place under consistent environmental conditions, with temperature and humidity maintained within the ranges of 21–24 °C and 60–65%, respectively.
2.4. Testing Procedures
2.4.1. Modified Agility T-Test (MAT)
The MAT was utilized to assess the athlete’s speed during changes in direction, including forward sprints, lateral shuffles to the left and right, and backward movements (
Figure 2) [
23]. The timing was recorded using a photocell system (Microgate, Bolzano, Italy). Each participant completed two attempts, with a minimum rest period of 2 min between trials, and the fastest recorded time was considered for the analysis. The players were instructed to start the test with both feet positioned on a marked line, located 30 cm behind the starting gate [
24]. The test sequence involved: (1) sprinting forward for 5 m to cone 2 and touching its base with their right hand (
Figure 1), (2) sidestepping 2.5 m to the left to cone 3 without crossing their feet and touching its base with their left hand, (3) sidestepping 5 m to the right to cone 4 and touching its base with their right hand, (4) returning 2.5 m to cone 2 and touching its base, and, finally, (5) sprinting back to the finish line as quickly as possible (
Figure 2; [
23]).
2.4.2. Sprint Test
The 15 m sprint test was preceded by a standardized warm-up, which included two sub-maximal 15 m sprints. Four paired photocells (Microgate, Bolzano, Italy) were positioned in a straight line at 0, 5, 10, and 15 m intervals along the course. The paired photocells, separated by 1.5 m [
25], were placed 1 m above the ground at both the starting and finishing lines. The starting position was 30 cm behind the first photocell gate, and time measurement began when the participant passed through the first gate. The players performed two maximal 15 m sprints, with the best performance used for the statistical analysis. Split times for 5 m, 10 m, and 15 m were recorded. An 8–10 min rest interval was provided between trials, and the fastest time for each distance was retained for analysis.
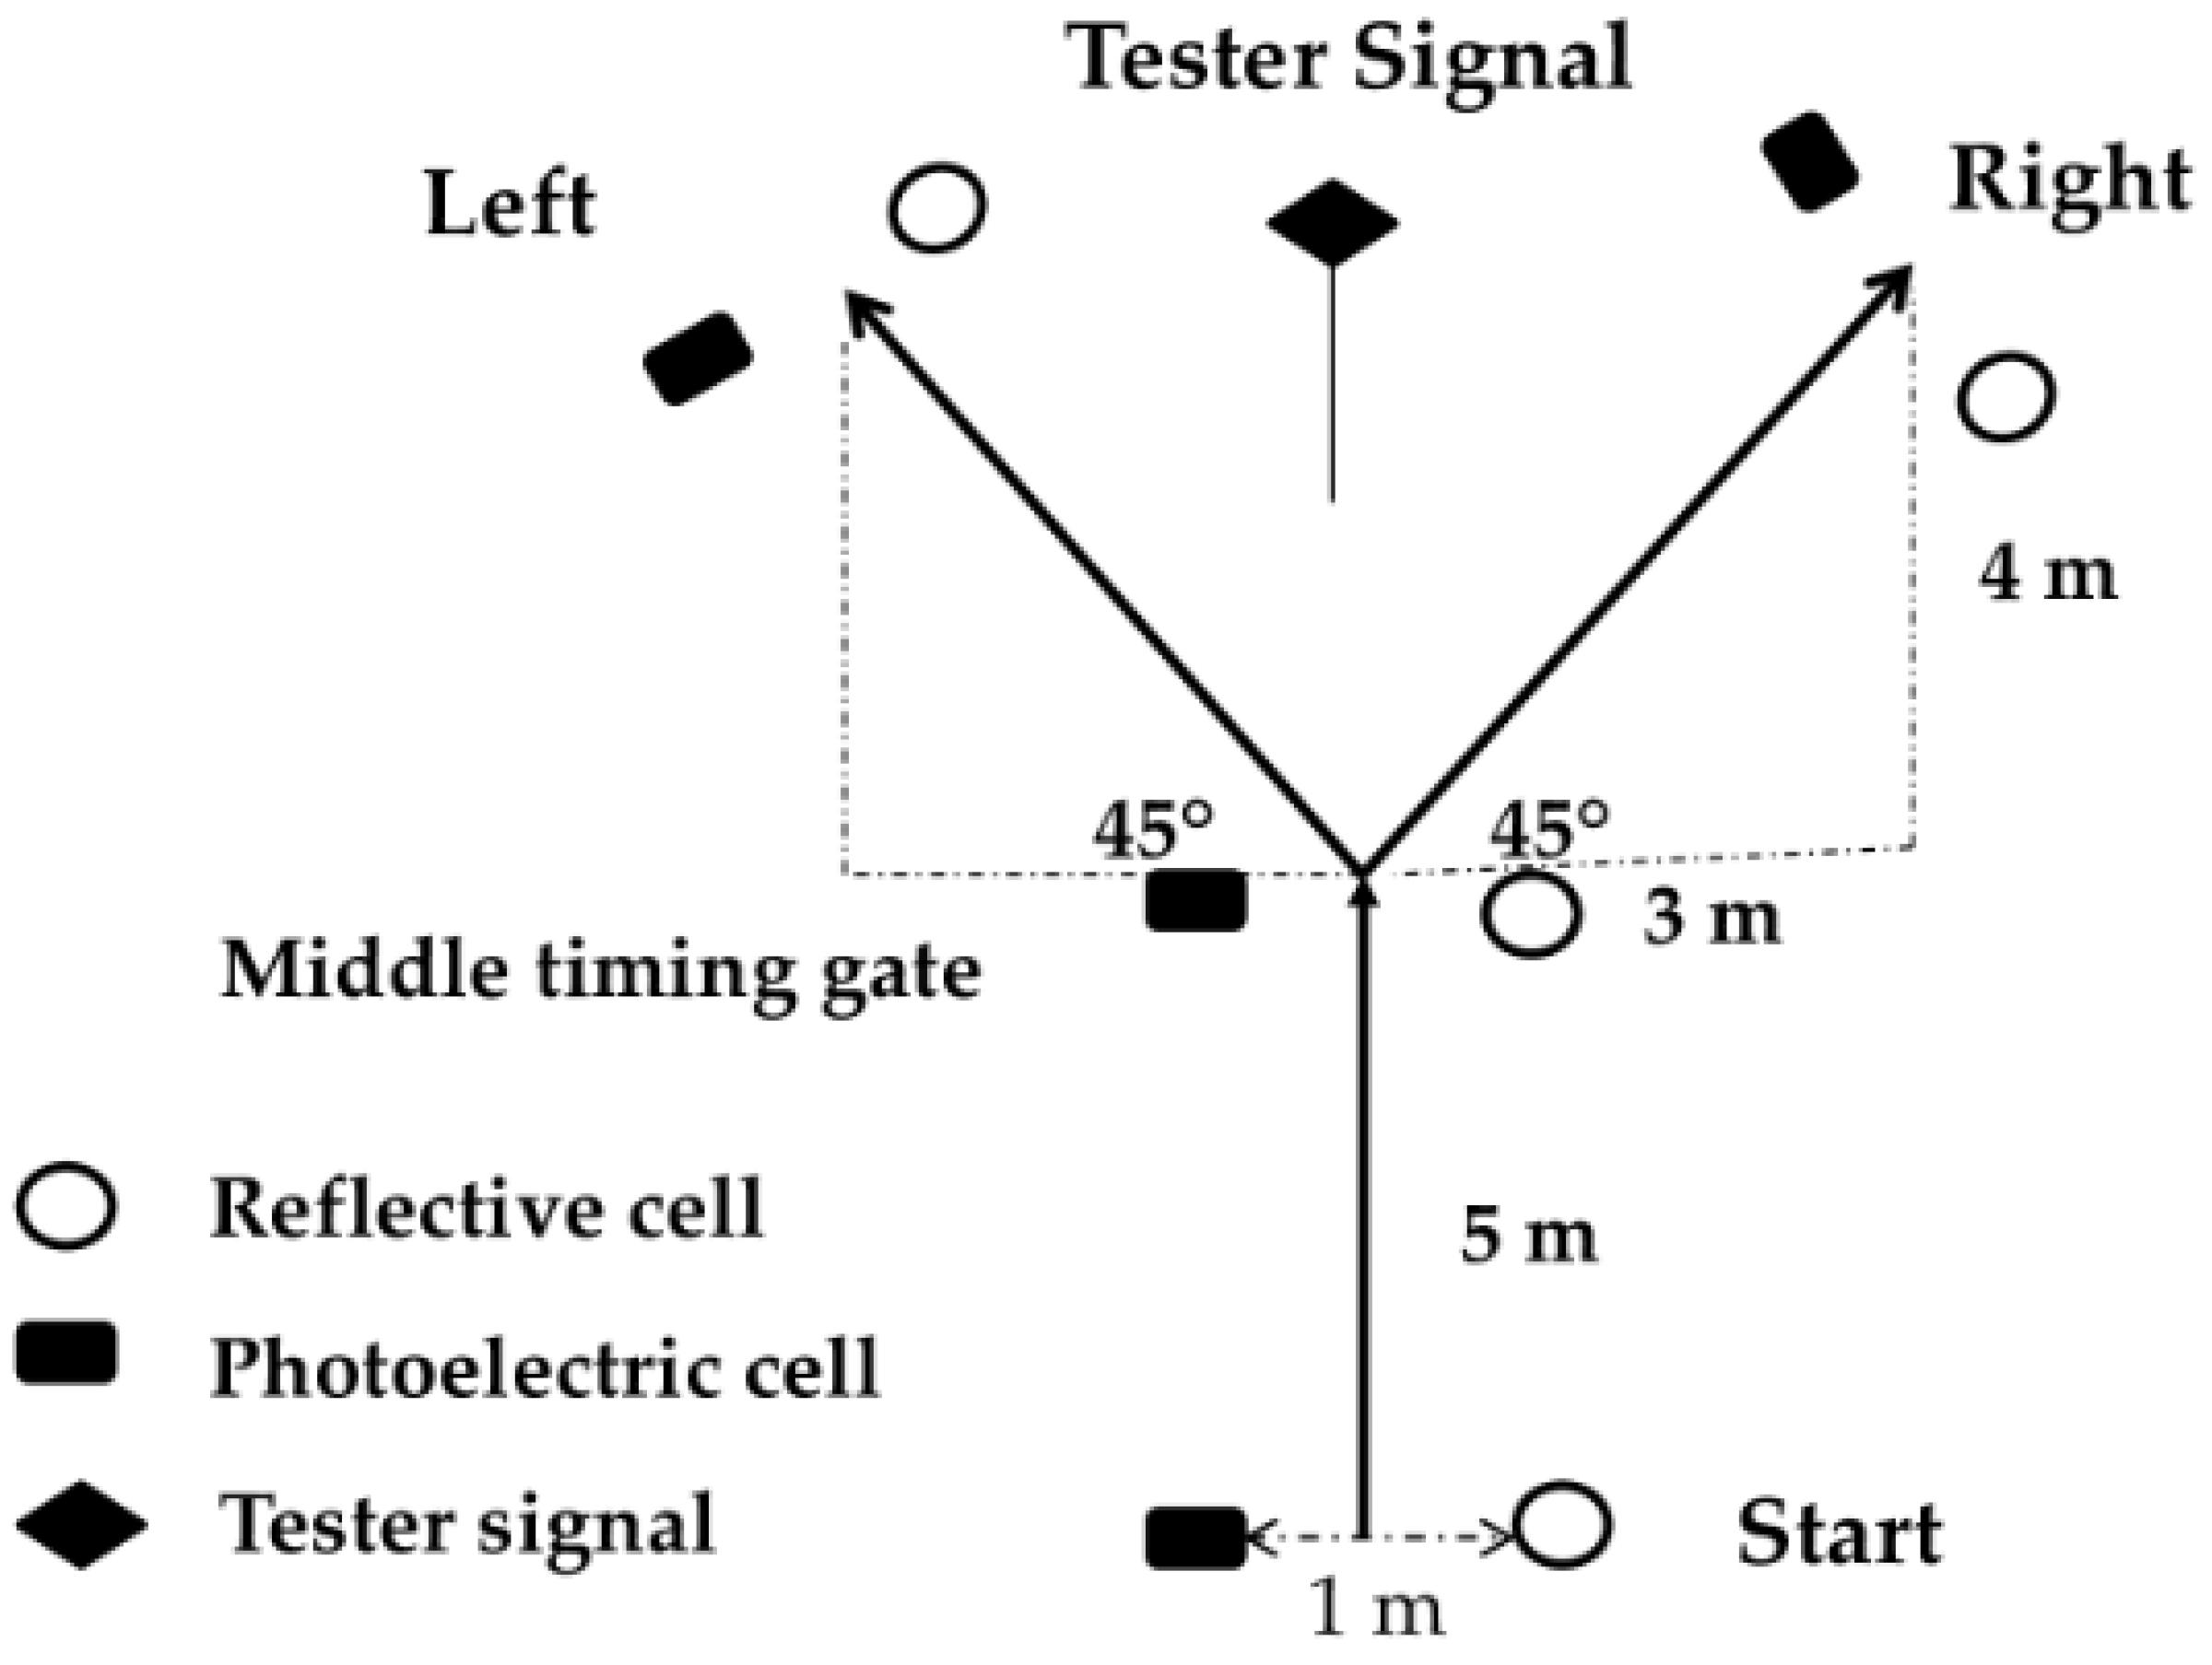
2.4.3. Y-Shaped Reactive Agility (Y-SRA) Test
A diagram illustrating the setup of the agility protocol is shown in
Figure 3. The participants initiated all the sprints from a starting position located 30 cm behind the first timing gate. Sprint times were measured using photoelectric timing gates (Microgate, Bolzano, Italy). The timing equipment in the middle of the course was positioned outside foam barriers, spaced 1 m apart (
Figure 1). Exit gates were placed at the left and right ends of the test course, with the center of each gate visually aligned, perpendicular to the intended running direction. Sprint times were recorded telemetrically, and all the data were transmitted to a personal digital assistant for analysis. The timing gate system determined the direction the participants would take after completing the initial 5 m sprint. Upon breaking the beam at the midpoint of the course, a light on either the left or right exit gate would flash, signaling the direction to proceed. The participants were required to react to this stimulus and sprint as quickly as possible through the illuminated gate (
Figure 3). The delay between breaking the beam at the midpoint and the light stimulus appearing was approximately 40 to 45 milliseconds. To prevent participants from anticipating the exit direction, they were explicitly instructed not to predict the gate. The investigator ensured compliance by visually monitoring their technique and comparing their reactive performance times to their planned sprint times [
23].
2.5. Statistical Analysis
The data were presented as the mean ± standard deviation (SD). The Shapiro–Wilk test was used to assess the normality of the data distribution. Systematic bias was examined using a dependent
t-test to determine whether a significant difference existed between the means of the test and retest samples. The relative reliability of the measured tests was assessed using the ICC for the between-day analysis, based on the best trial from each day for each test. The ICC values between 0.7 and 0.8 were considered questionable, while values greater than 0.9 indicated high reliability [
26].
Absolute reliability was assessed using the SEM, expressed as a CV. An SEM of ≤5% was set as the threshold for good absolute reliability. The SEM was calculated by dividing the SD of the score differences by √2 [
27,
28]. The 95% confidence intervals were calculated for all the mean CVs. The smallest worthwhile change (SWC) was determined in regard to its importance in the practical usefulness evaluation of the tests. The SWC was calculated as the product of the between-subject SD and factors of 0.2, 0.6, and 1.2, representing small, moderate, and large effects, respectively [
28]. The test’s ability to detect changes was classified based on a comparison between the SEM and the SWC: the test was rated as “good” if the SEM was smaller than the SWC, “ok” if the SEM equaled the SWC, and “marginal” if the SEM exceeded the SWC [
29].
The level of association between the test measures was assessed using Pearson’s correlation coefficient. According to Cohen (1998) [
15], correlation coefficients are interpreted as small (0.2–0.4), moderate (0.5–0.7), or large (>0.7). All the analyses were conducted using SPSS software (version 17.0, SPSS Inc., Chicago, IL, USA).
4. Discussion
The participants’ development was primarily shaped by their involvement in professional academies, whether private or affiliated with clubs. These academies significantly contributed to their technical, motor, physical, mental, and tactical development. The selection of the participants ensured a representative sample of young talent, benefiting from a rigorous training program that adhered to the essential stages of player development, as outlined by the standards of football training in Tunisia.
4.1. High Reliability of Sprint Speed, MAT, and Y-SRA Test
The reliability metrics from this study, including the ICC values (ranging from 0.90 to 0.97), low SEM percentages, and small CV values, confirm that the sprint, MAT, and Y-Shaped Reactive Agility tests are robust for use in regard to U12 soccer players. These findings align with the broader literature that supports the reliability of these tests in monitoring performance development in youth athletes [
2,
15]. For example, the ICC values for the MAT (0.97) and Y-SRA total time (0.97) mirror those reported in similar studies evaluating adolescent athletes, demonstrating their applicability across different age groups [
4,
30].
Reliability is a cornerstone for tracking the development of young athletes, especially during the critical growth phase of preadolescence. This stage is marked by rapid neuromuscular adaptations, making reliable tools essential for distinguishing true improvements from measurement errors [
31]. The MDCs and SWCs reported in this study further enhance the practical application of these tests, offering a framework for identifying meaningful performance progress [
31]. For instance, the SEM and MDC values for the Y-SRA (0.006 s and 0.017 s, respectively) indicate that even subtle performance changes can be confidently interpreted as true progress.
4.2. Correlations Between Linear Speed, MAT, and Y-SRA
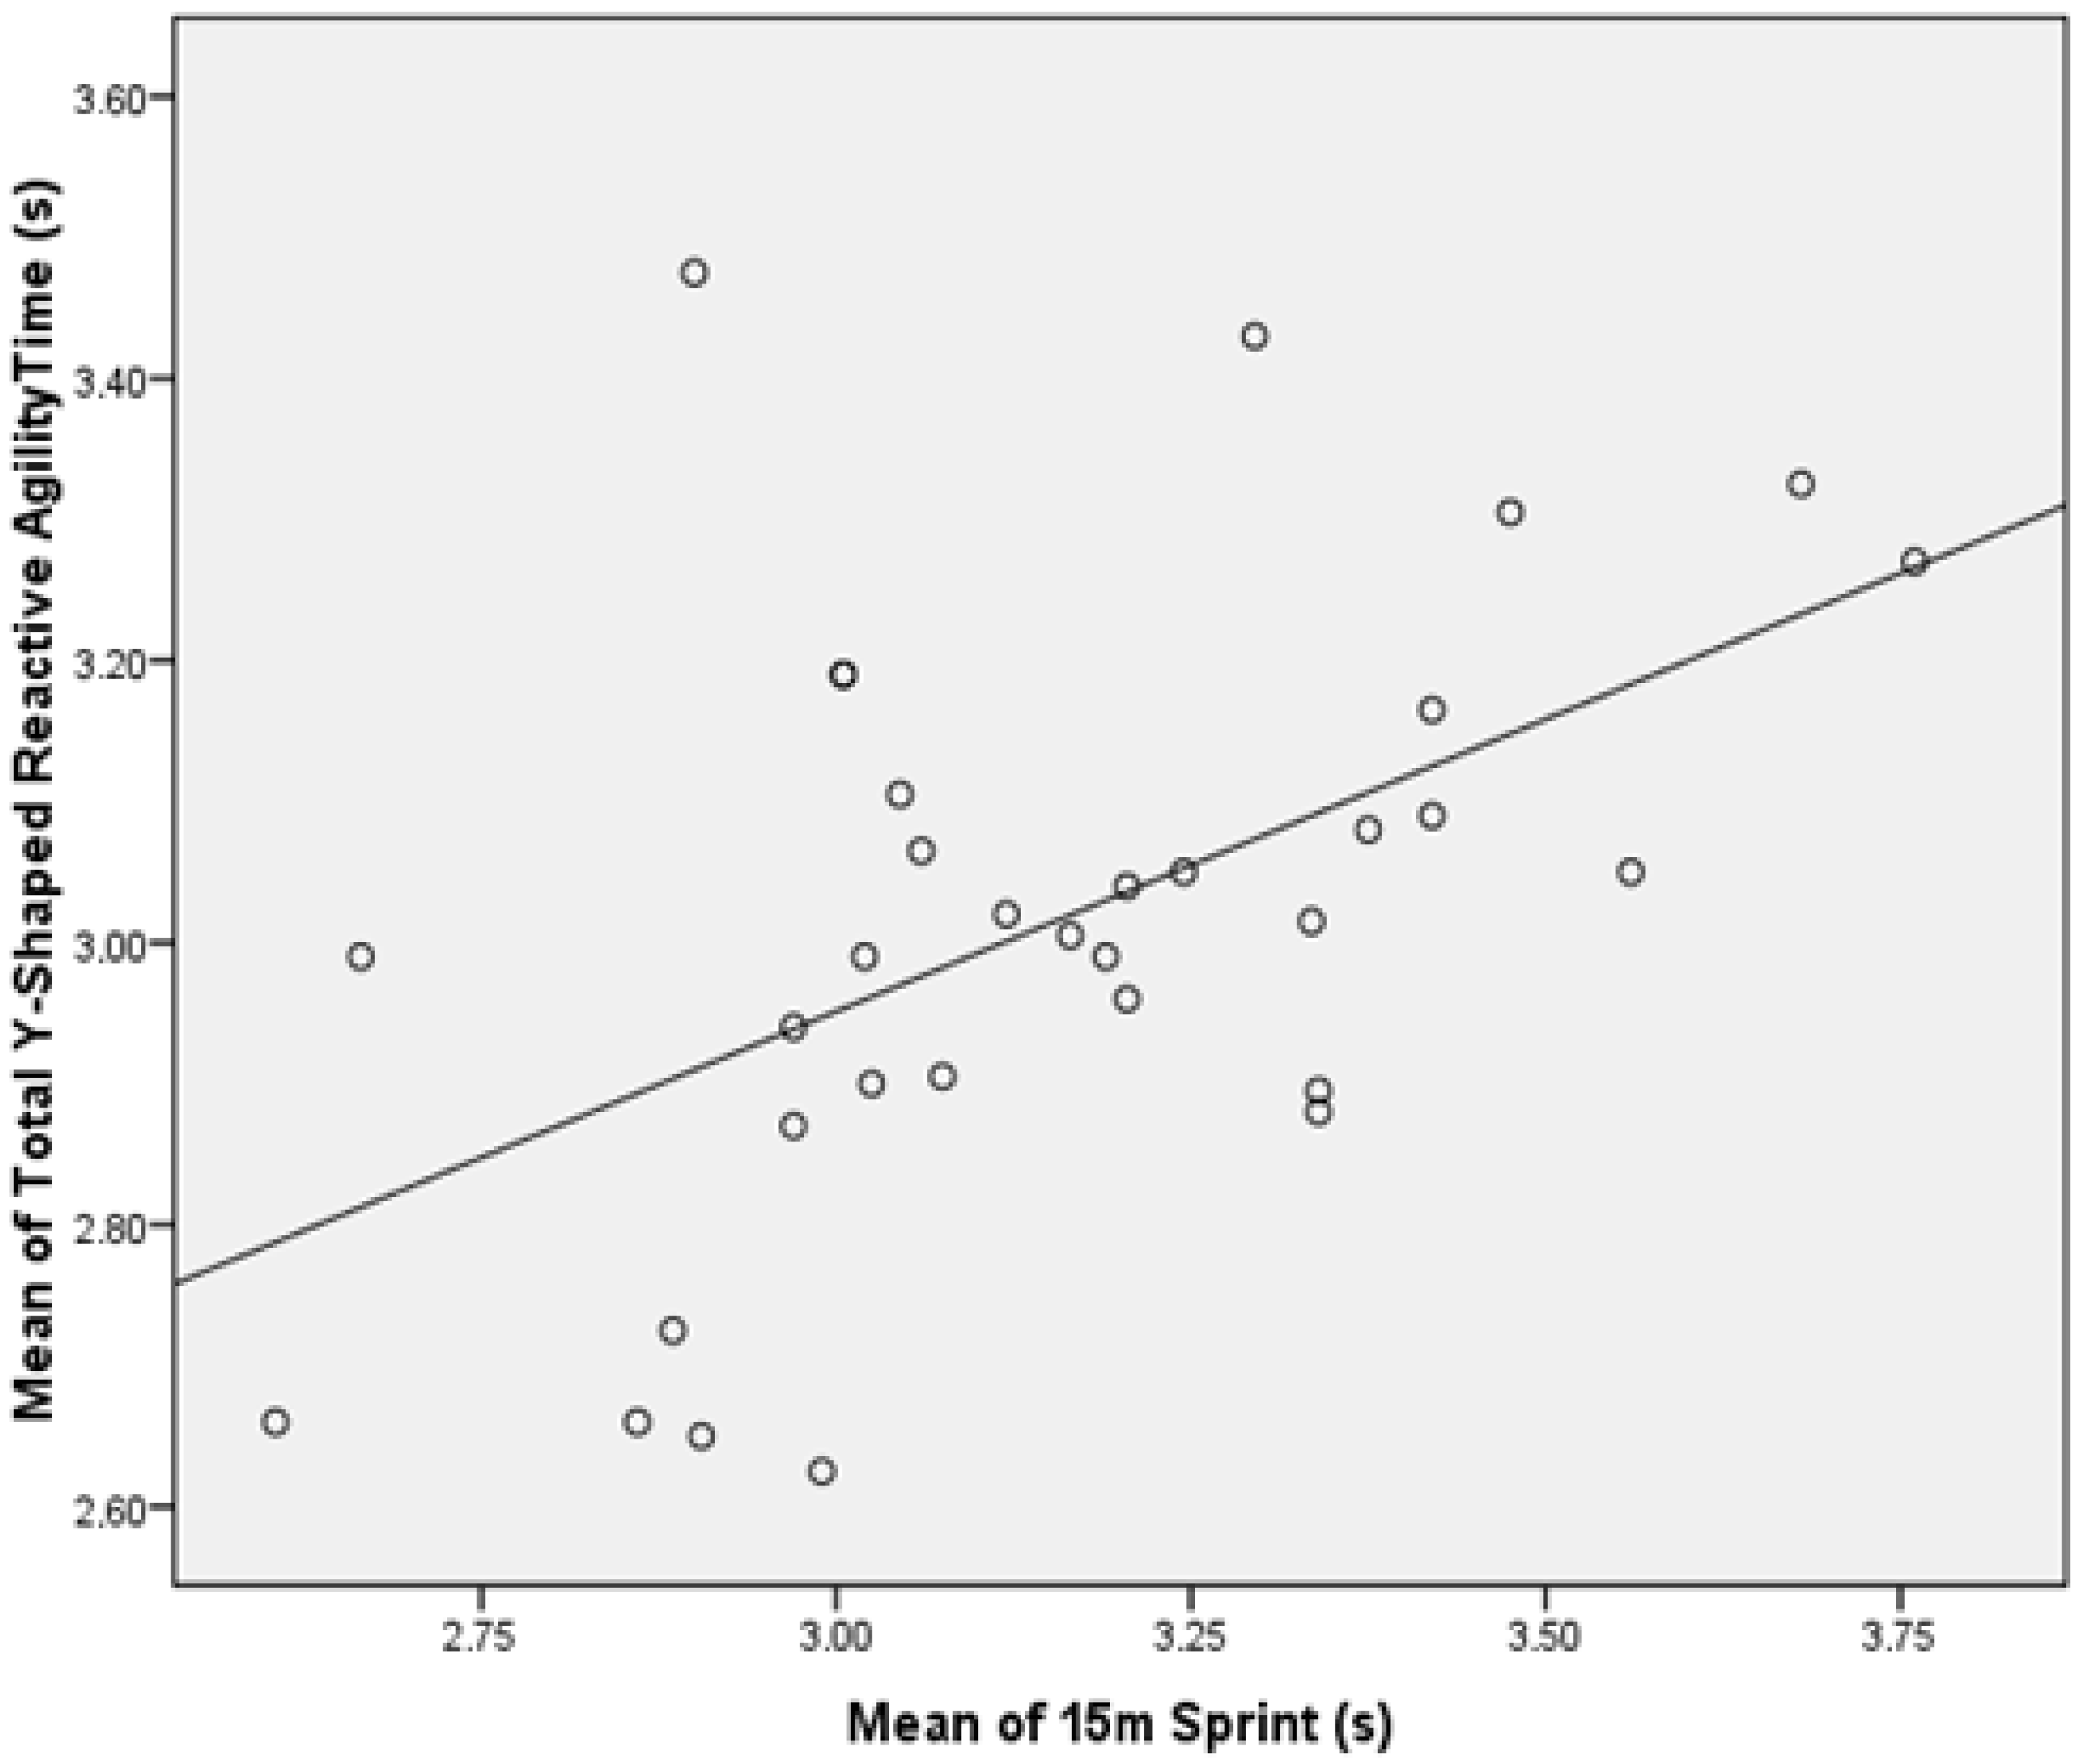
One of the key findings from this study is the strong correlation between the 15 m sprint performance and the total Y-SRA time (r = 0.74). This result highlights the interconnected nature of linear sprinting and reactive agility in U12 soccer players. Such findings are consistent with the previous literature showing that physical performance attributes often interact strongly at younger ages, due to the ongoing neuromuscular development and maturation of such athletes [
19,
20]. Similar correlations have been reported in previous research, indicating that both physical and perceptual cognitive attributes contribute significantly to performance in field-based sports, such as soccer [
3,
32].
This strong relationship can be attributed to shared physical determinants, such as lower-body strength, acceleration capacity, and efficient mechanics for braking and re-acceleration, all of which are crucial for both straight-line sprinting and directional changes [
1,
2]. In particular, U12 players benefit from their ongoing neuromuscular development, which enhances their ability to perform rapid and efficient movements [
3,
32].
At the age of 12, children are at a critical phase of motor development and neuromuscular maturation [
30,
33]. Motor skills, such as coordination and dynamic balance, improve rapidly at this stage, as confirmed by studies examining the effects of structured training in diverse youth populations [
22]. These enhanced motor abilities facilitate both linear sprint performance and the capacity to quickly change direction. Furthermore, elite-level research has shown that in older players, the ability to sustain high-intensity actions depends on their efficient mechanical and perceptual adaptations, which may originate from foundational developments at earlier stages [
20]. Additionally, this age group undergoes physiological adaptations, including increased muscular strength, improved postural control, and better dynamic balance [
1]. These factors contribute to superior performance in tasks demanding acceleration, deceleration, and rapid directional changes, which are fundamental to both sprinting and reactive agility [
30]. Taken together, these developmental and physiological characteristics likely underpin the observed correlation between sprint speed and Y-SRA performance, emphasizing the importance of neuromuscular development and shared physical capacities in young soccer players.
In addition to physical components, reactive agility integrates perceptual and cognitive demands, including the ability to process external stimuli and execute appropriate motor responses [
15]. The Y-Shaped Reactive Agility test replicates the decision-making and reaction-speed requirements of soccer, making it a valid tool for evaluating game-specific agility [
34]. The observed correlation suggests that the maximal speed over 15 m contributes significantly to the ability to execute reactive agility tasks, as the momentum generated in longer sprints facilitates smoother transitions during directional changes.
The correlations obtained between the Y-SRA test and the three sprint distances (5 m, 10 m, and 15 m) reveal a clear trend, with the 15 m sprint showing the highest correlation. This may be due to the fact that longer sprints integrate more complex motor and perceptual demands, including speed maintenance, coordination, and adaptive movement control. This finding suggests that longer sprints are more strongly related to reactive agility performance than shorter sprints. The higher correlation with the 15 m sprint can be explained by the combination of physical and neuromuscular demands it imposes, which are more aligned with the requirements of the Y-Shaped Reactive Agility test. Specifically, the 15 m sprint engages a greater range of motor skills, including acceleration, speed maintenance, and the ability to quickly change direction, which are critical components of both sprinting and reactive agility tasks [
2,
4].
In contrast, the shorter sprints (5 m and 10 m) primarily test acceleration and do not provide enough distance to fully engage the motor coordination and decision-making processes required for agile movements, such as those demanded by the Y-SRA test. The 5 m and 10 m sprints focus more on explosive starts, and, while they may still involve some direction changes, these are not as pronounced or complex as the changes required in the 15 m sprint. This is consistent with research that indicates longer sprints are better at testing the combination of straight-line speed and agility, as they require athletes to manage both acceleration and deceleration, along with the ability to adapt quickly to directional changes [
1,
2]. Therefore, the 15 m sprint provides a more comprehensive assessment of the physical and cognitive factors shared between sprinting and reactive agility, resulting in the highest correlation.
4.3. Implications for Soccer-Specific Training
These findings have practical implications for soccer training programs. The high reliability of the tests supports their use in longitudinal athlete monitoring and individualized training design. Beyond reliability, the combination of metrics offers coaches a multi-dimensional view of an athlete’s readiness, functional capacity, and adaptability to game-specific demands [
20]. Coaches can use the data to identify the athlete’s strengths and weaknesses in sprinting, agility, or reactive agility, and to tailor interventions to address specific performance gaps [
8,
17,
21,
34]. For instance, players with strong linear speed but lower reactive agility may benefit from drills that combine speed with perceptual and cognitive tasks, such as reaction-based sprints or small-sided games, emphasizing decision-making under pressure [
3,
32].
The significant correlation between sprint and agility metrics also suggests the potential for transfer effects during training [
2,
4]. This view aligns with performance periodization models used at elite levels, which stress the interconnectedness of mechanical, metabolic, and cognitive domains [
21].
In line with these principles, the Y-SRA test’s inclusion of perceptual and cognitive components makes it particularly relevant for soccer, wherein players must rapidly process and respond to dynamic game situations. Such integration of cognitive loads during testing has been supported by recent research showing its role in enhancing ecological validity and functional relevance [
2,
20]. In the context of U12 players, incorporating reactive agility assessments into training and evaluation programs can accelerate the development of decision-making and anticipation skills, which are crucial for soccer performance [
32]. Additionally, these tests provide insights into an athlete’s readiness for competition, offering coaches a valuable tool for optimizing training load and recovery schedules.
The moderate correlation between the MAT and the Y-SRA test (r = 0.387 *,
p < 0.05) can be explained by the overlap in the physical and perceptual/cognitive demands of both tasks. Both tests measure agility, but they differ in how they challenge an athlete’s motor and cognitive skills. The MAT primarily assesses an athlete’s ability to change direction quickly and efficiently in a pre-determined pattern, which relies heavily on acceleration, deceleration, and the ability to maneuver through a course with minimal errors [
34]. In contrast, the Y-SRA test incorporates a reactive component, wherein athletes must rapidly process external stimuli (such as light or auditory cues) and adjust their movements accordingly, adding a perceptual and cognitive layer to the assessment [
3,
17].
This distinction suggests that the correlation between the two tests reflects both shared and unique components of agility performance. The moderate correlation indicates that while both tests measure similar aspects of physical agility, such as speed, change of direction, and coordination, the added element of reaction time and decision-making in the Y-SRA test likely reduces the strength of the correlation compared to tests without a reactive component [
4]. Furthermore, the MAT, being a more traditional agility test, focuses on executing pre-planned movements, which might be less cognitively demanding than the Y-SRA test, wherein players must anticipate and react to unexpected stimuli in real time [
15]. Thus, while both tests evaluate agility, the cognitive load imposed by the Y-SRA test likely accounts for the moderate correlation observed between the two measures. The relationship between the MAT and Y-SRA test suggests that developing both physical agility (as measured by the MAT) and reactive agility (as assessed by the Y-SRA test) is important for athletes, particularly in dynamic sports like soccer [
1].
4.4. Limitations of the Study
While the present study offers valuable insights into the relationships between sprint speed, COD, and reactive agility in U12 soccer players, certain limitations should be acknowledged. The sample was composed exclusively of male athletes from a single training academy, which may limit the generalizability of the findings to broader populations, including female players or athletes from different developmental contexts. Furthermore, although the testing protocol was rigorously standardized, all the measurements were performed under controlled field conditions rather than in actual match environments, which may not fully capture the complexity of in-game demands. Finally, the study focused on physical performance indicators and did not include physiological or cognitive variables, such as heart rate or reaction time variability, which could offer additional insights in future investigations. Despite these limitations, the methodological rigor and reliability of the performance assessments strengthen the relevance and applicability of the findings within youth soccer development programs.
4.5. Featured Application
This study highlights strong performance interrelationships between sprint speed, COD, and reactive agility in young soccer players, offering practical insights for talent identification and training design in youth soccer academies. The findings support the use of these tests for talent identification, performance monitoring, and individualized training design in youth soccer academies. By integrating reactive agility assessments, which incorporate perceptual and cognitive components, coaches and sports scientists can obtain a more comprehensive evaluation of an athlete’s game-specific skills. This approach can help optimize training programs that are aimed at improving both physical and decision-making abilities in young athletes, ultimately enhancing their on-field performance.


 ,
, 


