Abstract
Recycling plastic waste has emerged as one of the most pressing environmental challenges of the 21st century. One of the biggest challenges in polyethylene terephthalate (PET) recycling is the requirement to return bottles in their original, undeformed state. This necessitates storing large volumes of waste and takes up substantial space. Therefore, this paper seeks to address this issue and introduces a novel AIoT-based infrastructure that integrates the PET Bottle Identification Algorithm (PBIA), which can accurately recognize bottles regardless of color or condition and distinguish them from other waste. A detailed study of Azure Custom Vision services for PET bottle identification is conducted, evaluating its object recognition capabilities and overall performance within an intelligent waste management framework. A key contribution of this work is the development of the Algorithm for Citizens’ Trust Level by Recycling (ACTLR), which assigns trust levels to individuals based on their recycling behavior. This paper also details the development of a cost-effective prototype of the AIoT system, demonstrating its low-cost feasibility for real-world implementation, using the Asus Tinker Board as the primary hardware. The software application is designed to monitor the collection process across multiple recycling points, offering Microsoft Azure cloud-hosted data and insights. The experimental results demonstrate the feasibility of integrating this prototype on a large scale at minimal cost. Moreover, the algorithm integrates the allocation points for proper recycling and penalizes fraudulent activities. This innovation has the potential to streamline the recycling process, reduce logistical burdens, and significantly improve public participation by making it more convenient to store and return used plastic bottles.
1. Introduction
The European Union (EU) has set ambitious recycling targets as part of its Circular Economy Action Plan, which requires member states to improve their recycling systems and reduce the use of single-use plastics. The primary key conditions that must be fulfilled include ensuring the proper sorting of materials, maintaining clean and contamination-free bottles, and providing convenient access to recycling facilities [1]. Additionally, users often face issues such as long waiting times at recycling stations, which can deter participation in recycling initiatives.
In many countries, plastic recycling practices vary, but there are some common trends aimed at improving recycling rates and reducing plastic waste, as follows:
- Extended Producer Responsibility (EPR). Countries like Germany, France, and Belgium have implemented EPR schemes, wherein manufacturers are responsible for the entire lifecycle of their products, including recycling [2];
- Deposit Return Schemes (DRSs). Countries such as Sweden, Finland, Spain, Italy, and Romania have a DRS strategy for beverage containers, wherein consumers receive a small refund for returning plastic bottles [3];
- Standardized Recycling Codes (SRCs). Some countries, including the United Kingdom and the Netherlands, use standardized recycling codes to inform consumers about recyclable materials [4]. This helps reduce confusion and increases participation in recycling programs;
- Comprehensive Collection Systems (CCSs). Austria and Switzerland have waste collection systems that include curbside pickup and recycling bins for plastics [5].
Most European countries employ a system in which consumers pay an additional fee for plastic bottles at the point of purchase. To recover this fee, they must return undamaged bottles with unaltered labels that include the appropriate recycling code to designated collection machines.
The frequent malfunctions of recycling machines further exacerbate the situation, leading to increased frustration among users. These obstacles highlight the need for a more robust and user-friendly recycling infrastructure to facilitate plastic bottle recycling and improve participation rates.
1.1. Problem Statement
One of the significant obstacles to polyethylene terephthalate (PET) recycling is the need to return bottles in their intact, undeformed state. This creates a considerable inconvenience, as it requires storing large amounts of waste, which occupies excessive space and can be a hassle for individuals. If PET bottles could be recycled in a crushed form, the storage space required would be significantly reduced, making the process more manageable and encouraging higher participation in recycling efforts.
This paper aims to address this issue by proposing a system capable of accepting and processing crushed PET bottles that have been emptied of air. Such an innovation could streamline the recycling workflow, alleviate storage challenges, and enhance public engagement by making the management and return of used bottles easier.
Figure 1 illustrates the initial state of PET bottles and their condition after being flattened. It is evident from Figure 1 that this transformation significantly reduces the volume of the bottle, facilitating easier storage before the preliminary introduction stage, which involves introducing the bottle into the recycling machine. One of the main reasons individuals are reluctant to recycle is that the existing machines require intact PET bottles for insertion, making it challenging to store them due to their bulkiness. The automated system proposed in this article will enable the recycling of PET bottles after they have been flattened, allowing for more convenient storage in households until the time of recycling.
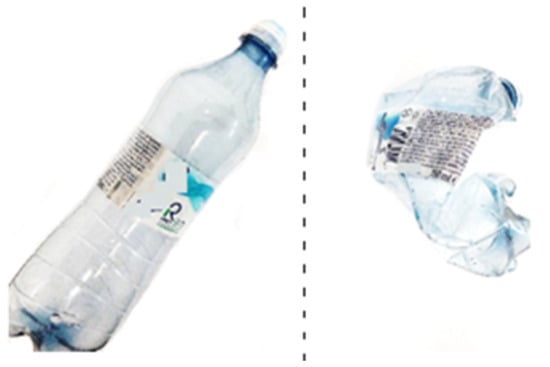
Figure 1.
Original PET bottle and volume reduction of PET bottle post-flattening.
This paper proposes a novel method focused on the collection stage of the PET bottle recycling process, specifically through the implementation of collection centers. This innovative approach will incorporate sensor technology, artificial intelligence (AI), and Internet of Things (IoT) integration to encourage recycling by offering rewards to participants. Each participant in the recycling program will be assigned a unique identification code, encoded as a QR code. Additionally, every citizen who engages in recycling will be given a trust level score, calculated using an algorithm proposed in this paper.
1.2. Research Contributions
The main contributions of this paper are as follows:
- The introduction of a novel Artificial Intelligence of Things (AIoT) Infrastructure. This paper proposes a novel hardware infrastructure that has not been previously documented in the literature. The prototype is designed to revolutionize the collection of PET bottles at the residential level. In contrast to conventional waste collection systems, the standard PET collection bin will be replaced by the PET Recycling System (PRS) introduced in this paper. This advanced system has significantly improved functionality and storage capacity, making it a highly efficient solution for domestic waste management.
- The development of a software application. The proposed system comprises an AIoT-based software application designed to monitor the entire collection process across multiple points, utilizing Microsoft Azure cloud hosting capabilities.
- The design of the PET Bottle Identification Algorithm (PBIA). An advanced algorithm for identifying plastic bottles has been developed, capable of recognizing bottles regardless of color or condition and distinguishing them from other types of waste. The PBIA ensures that only valid PET bottles are accepted by the system. It helps to improve the residential recycling process.
- The presentation of an Azure Custom Vision case study. A detailed analysis of Azure Custom Vision services for object recognition in the field of PET identification is conducted. This examination focuses on its capabilities, performance metrics, and potential use within intelligent PET waste management systems.
- The development of the Algorithm for Citizens’ Trust Level by Recycling (ACTLR). An algorithm is introduced to calculate a trust level associated with each citizen’s recycling activities, reflecting their engagement and reliability regarding the recycling process. To encourage proper recycling, the authors have proposed the ACTLR for municipalities, aiming to stimulate recycling by offering citizens points that can be redeemed for goods from the municipality’s partner stores. If citizens try to defraud the system, they will be penalized.
- The introduction of the Citizens’ Trust Level through Recycling Activities (CTLRA). This proposed indicator incorporates an exponential penalty as the number of non-PET items increases, discouraging citizens from engaging in fraudulent behavior.
- The conducting of prototype cost analysis. A cost analysis of the prototype’s production reveals that the system has low implementation costs, highlighting the economic feasibility of deploying the proposed intelligent waste management solution.
A key advantage of the PRS is its improved storage capacity. Unlike traditional bins that are used to collect PET bottles in their uncompressed form, this system is specifically designed to accept PET bottles that have been crushed or compressed. The volume is reduced by removing the air from the bottles, allowing more PET bottles to be stored in the same physical space. One of the major benefits of this system is its space-saving feature. PET bottles, when left uncompressed, tend to occupy a substantial amount of space in households, making it inconvenient for users to accumulate large quantities before disposal. The PRS represents a significant step in modernizing the handling of PET waste in residential areas. It offers an intelligent, space-efficient, and user-friendly solution that benefits households and waste management services.
The paper is structured in six sections. Section 2 presents the related works. Section 3 outlines the proposed AIoT hardware infrastructure for implementing the PET recycling system, detailing the PET bottle identification process that incorporates AI components and references the Azure Custom Vision case study. Section 4 describes the experimental results. Section 5 presents a discussion of the study′s findings and limitations. The conclusions and future developments are presented in Section 6.
2. Related Works
2.1. Type of Plastic and Recycling Methods
Plastic is a polymeric material that can be molded or shaped, typically through the application of heat and pressure. This property, known as plasticity, is often combined with low density, low electrical conductivity, transparency, and toughness, which enables plastics to be transformed into a wide range of products. Plastics can be classified into different categories based on their structure and usage, such as rigid and lightweight PET bottles, flexible polyvinyl chloride (PVC) garden hoses, foamed polystyrene food containers, and shatterproof polymethyl methacrylate windows [6]. Currently, there are over 200,000 types of plastic [7], but approximately 80% belong to the following seven categories [6,8]:
- Polyethylene terephthalate (PET or PETE) is commonly used for the creation of beverage bottles and food containers;
- High-density polyethylene (HDPE) is found in detergent bottles, milk jugs, and some plastic bags;
- PVC is used in pipes, vinyl siding, and flooring;
- Low-density polyethylene (LDPE) is employed in the production of grocery bags, bread bags, and some food wraps;
- Polypropylene (PP) is used in yogurt containers, straws, and food containers;
- Polystyrene (PS) is found in disposable cutlery, foam packaging, and insulation materials;
- Other (various plastics). This category encompasses a variety of other plastics, including acrylic, nylon, and polycarbonate.
These different types of plastic are important for recycling and waste management, as they have distinct properties and, therefore, require distinct recycling processes. Numerous methods exist for recycling plastic, and researchers have consistently dedicated their time to improving this process. Their ongoing efforts have centered on automating recycling and developing innovative techniques to promote the widespread adoption of sustainable practices. The recycling method categories are as follows [9,10,11,12]:
- Physical Recycling, including:
- o
- Mechanical Recycling, which involves processing plastics without dismantling the compounds, retaining the bond between polymers and additives, resulting in the production of flakes or granules for the development of new products;
- o
- Solvent-based Recycling uses chemicals (e.g., organic solvents) to dissolve compounded plastics, while preserving the polymer chain, enabling its reuse in new products;
- Chemical Recycling:
- o
- Depolymerization breaks down plastics into building blocks through thermal depolymerization, hemolysis, and solvolysis, producing oligomers and monomers;
- o
- Thermolysis decomposes polymers via thermal methods (e.g., pyrolysis, gasification), creating fragments (monomers, hydrocarbons, CO) that serve as feedstock for synthesizing new substances;
- Energy Recovery (Thermal Recycling). This process utilizes the energy content of plastics, typically through incineration (waste-to-energy) or in cement and power plants that burn solid-recovered fuels (SRFs).
Plastic-sorting plants specialize in separating different types of plastics, including PET, PP, and PVC. Several researchers [13,14] have evaluated several technologies in this context, including infrared spectroscopy, flotation, and fluorescent marking. Each method helps identify plastic types based on their density, color, or conductivity characteristics. Cleaning and granulating processes must meet environmental standards, and while the technologies are promising, their practical implementation in terms of current equipment available still requires further investigation.
One proposed method, fluorescent marking, requires plastic to be labeled uniformly for automated sorting. However, implementation challenges include the global standardization of plastic markings. The study by Lubongo et al. [15] focuses on sorting plastics for recycling, utilizing new technologies such as AI and robots.
Plastic-to-fuel recycling presents a promising solution to plastic pollution. Jha and Kannan [16] examine the economic, environmental, and technological aspects of this method. Financial considerations include the costs of plastic waste collection, processing, and the sale of recycled fuel. Technologically, the study evaluates innovations in pyrolysis and catalytic conversion to enhance environmental performance. Nain et al. [17] investigate how different polymers can improve the efficiency of plastic recycling. By selecting suitable polymers, recycling can reduce waste and lower energy consumption, paving the way for enhanced recycling methods and future innovations in the sector.
Plastic recycling is extensively researched, encompassing methods such as pyrolysis for converting plastic waste into fuels and valuable products, separation technologies for sorting plastic mixtures, and the transformation of plastic waste into high-quality carbon nanomaterials. These approaches aim to improve sustainability. Some researchers [18,19,20,21,22] emphasize the need for further research to improve existing technologies for transforming plastic waste into advanced materials, fuels, and chemicals.
2.2. Circular Economy Model
Potential hazards arising from contaminants in recycled materials are highlighted, with contaminants like phthalates and heavy metals identified as significant risks [23]. Shamsuyeva and Endres [24] evaluate existing recycling technologies and market conditions for plastics, finding that mechanical recycling is the most viable approach. However, the transfer of research into practice faces obstacles due to varying global plastic flows and a lack of international standards. Developing a Circular Economy Model (CEM) requires collaboration among scientists, standardization committees, and industry. The persistent crisis in terms of plastic pollution demands a transition to a circular economy that prioritizes the production of sustainable and recyclable materials [25]. The CEM is an economic framework designed to eliminate waste and promote the sustainable use of resources. It signifies a departure from the conventional linear economy, characterized by a ‘take, make, dispose’ approach, towards a more sustainable paradigm that highlights the recycling, reuse, and regeneration of materials. The fundamental principles of the circular economy encompass [26,27,28] the following:
- Designed for Longevity. Products are crafted to have an extended lifespan and are designed to be easily repairable or refurbishable;
- Resource Efficiency. Minimizing resource input and waste output in production processes;
- Closing the Loop. Ensuring that materials are reused and recycled at the end of their lifecycle, thus creating a closed-loop system;
- Innovation. Encouraging new business models and technologies that support sustainability, such as sharing platforms or product-as-a-service offerings.
The research emphasizes the importance of analytical methods in detecting and managing contaminants. The CEM aims to increase recycling rates through improved collection systems and better sorting technologies. For instance, one agenda for future research identified four critical areas for improvement, including the standardization of materials and infrastructure investment [4]. A balanced approach integrating chemical recycling can improve resource conservation and reduce the carbon footprint, contributing to the transition from a linear system to the CEM [29]. A systematic literature review [30], covering 92 papers from 2009 to 2019, indicates a gap in the research related to the recovery and preparation stages of recycling, despite advancements in subsequent stages. This suggests that local-level research could help to improve the circular economy. Howard et al. [31] emphasize the need for improved sorting technologies in the plastics industry. Their study proposes the use of luminescent lanthanide markers for the nuanced sorting of plastics. Three upconversion markers can be used to create 21 codes, enabling precise sorting. However, the large number of codes may lead to confusion, and instead of encouraging recycling, it could have the opposite effect, discouraging it.
2.3. Cutting-Edge Innovations in Plastic Recycling
Numerous studies [32,33] review various plastic identification methods and emphasize the integration of sensors and IoT technologies for multi-source perception, intelligent identification, and data processing. Cui et al. [34] highlight challenges, such as fraud detection and real-time updates, to optimize user satisfaction and the recovery rate of plastic bottles. The identification subsystem for plastic bottle waste processing can be designed based on the following components:
- Programmable Logic Controllers (PLCs) [35];
- Advanced RISC Machine (ARM) platforms, such as Raspberry Pi, Arduino Uno, or M5Stack with ESP32 [36,37];
- Charge-Coupled Devices (CCDs) and Complementary Metal Oxide Semiconductor (CMOS) image sensors [38];
- Visible and near-infrared technology [39];
- Spectroscopy systems [40];
- Ultrasonic sensors [41], etc.
However, ensuring traceability throughout the entire recycling chain is important. Blockchain technology offers a powerful solution to this challenge by tracking plastic waste across its lifecycle. By integrating blockchain with recycling systems, QR codes or digital markers can be attached to plastic products, enabling users to track the material composition, recycling status, and authenticity of these products.
Blockchain technology can be employed to track plastic waste throughout the recycling chain, enhancing transparency and promoting more responsible consumer behavior. Users can trace the lifecycle of the product, including its material composition and recycling status, by attaching QR codes or digital markers to plastic products. This information can guide purchasing decisions and help prevent tampering [42]. Gong et al. [43] explore the application of blockchain technology in managing marine plastic debris. Thus, the use of the blockchain can improve transparency in recycling value chains and improve public awareness and governance through the use of digital tokens and smart contracts. This innovative approach addresses existing challenges in waste management and has the potential to reshape traditional recycling models. A case study by Patricia and Muslim [44] on implementing innovative retail technology in companies shows how integrating filling machines can reduce plastic use in packaging. The study suggests that QR codes can track product information and automate processes like bottle filling and final weighing.
Tachwali et al. [45] outline an AI system for classifying plastic bottles based on their chemical composition and color, using near-infrared (NIR) reflectance measurements. The classification system achieved 94.14% accuracy for the chemical composition of bottles and 96% for opaque bottle colors. Many studies utilize sensors to identify plastic material types [46,47,48], but none mention how these sensors perform when a non-plastic material is introduced into the sorting process [49].
Yaddanapudi et al. [50] propose a reverse vending machine (RVM) system designed to facilitate the recycling of plastic bottles. It employs object detection techniques for accurate verification and allows users to receive rewards via digital payment methods, promoting user engagement in recycling initiatives. Otero et al. [51] analyze social media data to gauge public concern regarding marine plastic pollution, identifying key themes such as the impact on wildlife and the promotion of recycling initiatives to encourage sustainable behavior. Jakobs and Kroell [52] examine the sortability of lightweight packaging (LWP) waste in German sorting plants, using sensor-based sorting (SBS) for plastic type separation. It identifies labels, composites, dark colors, and rolling shapes that negatively impact sortability. Improving product design and sortability could lead to the recovery of up to 48,300 Mg/a of rigid plastics.
2.4. AI and Machine Learning in Plastic Recycling
Multiple studies focusing on waste management challenges due to pollution and inadequate solid waste classification underscore the growing significance of environmental protection. Various research efforts emphasize the application of advanced technologies, particularly AI and machine learning (ML), to improve recycling processes, such as:
- Automated Sorting Systems utilize computer vision and convolutional neural networks (CNNs) to identify and classify recyclable materials. For instance, one system achieved 95% accuracy in sorting plastics, 96% in sorting glass and metal, and 94% in sorting cardboard [53]. Another piece of research highlights a high level of performance in regard to identifying plastics, with 95.67% accuracy, based on a test set, using deep learning algorithms [54,55];
- The integration of sensors and robotics, designed to assist human workers and optimize sorting processes. For example, one proposal includes an innovative plastic waste separation system, utilizing six sensors for effective material sorting [56];
- Data-driven decision making outlines the need for a continuous lifecycle and cost analysis to evaluate the ecological and economic impacts of recycling [57]. An estimated 150,000 images are also required to improve detection accuracy in robotic sorting systems [53].
Although numerous solutions focus on using deep learning (DL) for plastic identification [58], none have been implemented at an industrial scale. Most approaches are still in the research or experimental phase, with challenges such as cost, scalability, and integration into existing recycling systems preventing their widespread adoption.
Konstantinidis et al. [59] present a novel DL approach for waste sorting that utilizes multiple auto-encoders to extract spatio-spectral information from Red–Green–Blue (RGB) and multispectral sensors. The proposed system achieves a 99.5% mean average precision for waste localization and 96% classification accuracy across various waste types, including plastics. Ji et al. [60] focus on low-value recyclable waste, utilizing a combination of RGB and limited NIR data for cost-effective sorting. The fusion model achieved a comprehensive F1-score of 0.961 for material and color recognition, addressing the challenges associated with sorting small-sized and diverse waste streams.
Ge et al. [61] introduce an IoT-based strategy for generating automatic deep learning models, addressing challenges in dataset collection and optimization. By employing an Android application for image capture and cloud processing, the system ensures the creation of an accurate dataset with 99.86% accuracy. The approach reduces training time by 9–28%, demonstrating its effectiveness in recycling applications.
Yan et al. [62] introduce the concept of AIoT, which integrates AI with IoT to enhance learning environments. AIoT refers to the integration of AI capabilities into IoT devices, enabling these interconnected systems to make intelligent decisions based on data analysis and real-time inputs from their environment.
Analyzing the literature reveals that the majority of works focus on industrial recycling. This is a major drawback of the proposed approaches, as recycling initiatives must start from the direct consumer. The fact that automatic sorting systems rely on sophisticated equipment translates into high costs, which limit their applicability in areas with limited budgets, particularly at the residential consumer level. This aspect makes progress in the field of recycling moderate. Therefore, this paper aims to streamline the recycling process by proposing a solution implemented at the community level, with low costs.
3. Materials and Methods
3.1. AIoT Hardware Infrastructure for Implementing the Residential PET Recycling Prototype
The authors have analyzed several ARM platforms, including Arduino Uno, M5Stack with ESP32, Raspberry Pi, and Asus Tinker Board. A comparative analysis conducted by the authors of this article, detailing the hardware and software advantages and limitations of these platforms, has been presented by Rosca [63]. Thus, Rosca et al. [63] have demonstrated the clear superiority of the Raspberry Pi and Tinker Board platforms in regard to IoT applications. Among these two platforms, Rosca et al. [63] highlighted the advantages of using the Asus Tinker Board, particularly in regard to scripting scenarios that do not require graphical user interfaces, thanks to its Linux-based operating system. For the current project, the Asus Tinker Board uses the TinkerOS, to support the execution of Bash scripts. This compatibility with Azure cloud services improves the system’s capabilities and facilitates its seamless integration with IoT frameworks. Using the Asus Tinker Board, with its Linux-based operating system, ensures that the proposed PET recycling system can process data and respond to real-time events, which are necessary for recycling operations.
The hardware system is centered around the Asus Tinker Board, which is well-suited for use in the AIoT infrastructure for PET recycling due to several key features. Its quad-core ARM-based processor ensures the handling of data processing tasks, including image recognition and real-time monitoring. The board supports high-resolution video input, and its GPIO interface enables integration with various sensors and peripherals, making it ideal for IoT applications. Figure 2 presents an overview of the AIoT components in the proposed PET recycling prototype.
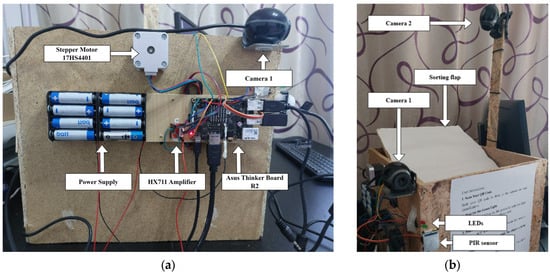
Figure 2.
PRS: (a) lateral cross-section; and (b) frontal cross-section.
The IoT-based system, using the Asus Tinker Board to automatically sort PET bottles from non-PET objects, referred to as the PRS, employs Microsoft’s Azure Custom Vision service for object recognition and integrates weight detection for PET bottles. The PRS components, presented in Figure 2, are as follows:
- 1.
- Presence detection via a passive infrared (PIR) sensor, utilized to detect the presence of a person approaching the PRS. When movement is detected within a predefined range of 3 m, the system is activated and prepared for interaction;
- 2.
- Two light-emitting diodes (LEDs) that signal the status of object submission:
- A green light indicates that the system is ready to receive the object, and the user can place the item into the bin;
- A red light is triggered if the system is not ready to accept the object, alerting the user that they must wait before depositing the item;
- 3.
- A dedicated camera is implemented to scan a QR code presented by the user. This allows the system to identify the user and associate the recycling actions with their profile, potentially for reward or tracking purposes;
- 4.
- A second camera captures an image of the object in the input bin. This image is then sent to the Azure Custom Vision service, which performs object recognition to determine whether the item is a PET bottle or a non-PET object. The object classification results are sent back to the PRS to make sorting decisions;
- 5.
- A load cell sensor (scale) is installed to measure the object’s weight once placed in the bin. The weighing scale is represented by a 20 kg load cell, with a HX711 amplifier. The scale measures the weight of the recycled materials to ensure compliance with recycling standards. This ensures that the PET bottles are properly sorted only after they have been emptied of liquid, as full or partially filled bottles will exceed the predetermined weight threshold of ±2 g;
- 6.
- The sorting mechanism is driven by a stepper motor (Plusivo 17HS4401) with a driver (A4988), which controls a flap that redirects the object into one of two compartments:
- The PET compartment. If the object is recognized as a PET bottle and its weight is within the acceptable range, the motor redirects it to the designated PET recycling compartment;
- The non-PET compartment. If the object is classified as non-PET, the motor directs it to a separate compartment for general waste or non-recyclable items.
The sorting flap directs the identified object to the appropriate compartment, ensuring the proper segregation of PET and non-PET materials. When a user deposits an item into the collection system, the integrated camera and recognition algorithm assess whether the object is a valid PET bottle. Upon verification, the motor activates, enabling the sorting flap to move precisely to the designated compartment for PET bottles. This swift and accurate redirection ensures that recyclable materials are processed correctly. Conversely, if the item is identified as non-PET, the servo motor is programmed to redirect the item to a separate compartment, designed for non-recyclable materials. This sorting mechanism prevents contamination of the recycling stream, thus maintaining the quality of the collected PET bottles.
Figure 2a presents the lateral cross-section of the PRS, providing a detailed view of the system’s components from the side. This perspective highlights the arrangement of the 17HS4401 stepper motor with the HX711 amplifier and the external power supply required, as well as camera 1 for QR code scanning, and the Asus Tinker Board R2. Figure 2b shows the front cross-section of the PRS, offering a direct view of the interface that users interact with. The front view highlights the system’s compact design, featuring the PIR sensor for detecting human presence, the QR code scanner (camera 1), LED indicators, camera 2 for object detection, and the input area for depositing objects.
The operational procedure of the PRS contains the following steps:
- 1.
- User Detection and Activation of QR Code Camera. When a user approaches the PRS system, the PIR sensor detects their presence. This triggers the activation of camera 1, which is dedicated to scanning the user’s QR code;
- 2.
- QR Code Reading and User Identification. The system utilizes camera 1 to capture the QR code presented by the user. The unique code is decoded to identify the user based on a pre-existing database of registered codes, linking the specific user to the recycling session. The QR code used within the system does not provide traceability in itself; its functionality is limited to user identification. The QR code contains a unique identifier associated with an existing account in the database. All recycling activities are stored in the database, ensuring traceability by recording each interaction by the user with the system. Thus, traceability is provided at the level of a centralized IT system, rather than within the QR code itself. Future versions could consider integrating distributed technologies, such as blockchain, to increase the transparency of the records;
- 3.
- System Ready Notification via LED Indicators. A green LED is activated when the user is successfully identified, signaling the system’s readiness for object input. Simultaneously, the red LED is deactivated, indicating that the system is no longer in a restricted state and the user can proceed with the next step;
- 4.
- Object Placement in the PRS. The user places an object on the flap of the PRS bin for analysis and sorting;
- 5.
- Weight Measurement. Once the object is placed on the flap, a load cell sensor measures the object’s weight. This step determines whether the object conforms to the expected weight limits for PET bottles, ensuring the bottle has been emptied of liquid;
- 6.
- Object Image Capture and Custom Vision Processing. The system employs camera 2 to capture an image of the object. This image is sent to Microsoft’s Azure Custom Vision service to detect the object as either a PET or non-PET item;
- 7.
- Object Sorting and Fraud Detection. If the object is identified as PET, the sorting mechanism is activated, and the stepper motor directs the object into the designated PET compartment. If the object is classified as non-PET, the system carries out additional actions:
- ▪
- Camera 1 takes a picture of the user and stores the image in the system’s database, associating it with the user’s unique QR code. The images are associated with the QR code, and although security elements have not been considered at this stage, automatic anonymization methods can be included in commercial iterations. It is important to note that the images are not transmitted to third parties, are not used for commercial purposes, and their main purpose is to identify individuals attempting to defraud the system. The use of the system requires the explicit consent of the user regarding the capturing of authentication images;
- ▪
- The user’s profile is updated in the database, recording either their point score (if the attempt is legitimate) or increasing the number of alerts, indicating potential system abuse or fraudulent attempts to recycle non-PET items;
- 8.
- Waiting Period for the Next Object. After the object is processed, the system enters a waiting state, allowing the user to insert a new object within 30 s. If no new object is introduced within this timeframe, the red LED is activated, the green LED is deactivated, the system resets, and the procedure restarts from step 1.
The board operates using the TinkerOS. The GPIO pins the interface with external components, such as sensors, cameras, and motors, enabling communication and control through the TinkerOS. The GPIO pins can be controlled via Bash and Python 3.7 scripts, as described in the PBIA and CTLRA in Figure 3.
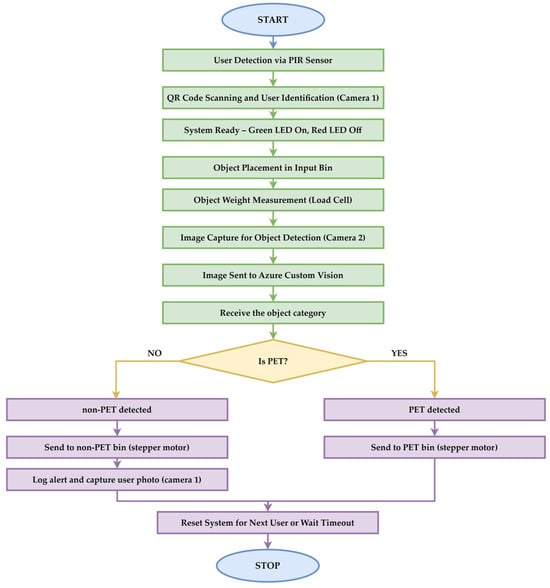
Figure 3.
Wiring diagram of the connection between Tinker Board GPIO pins and external components (sensors and motor).
Figure 3 presents the logical diagram of the PBIA in relation to the hardware components used, which enable the physical implementation of the functionality marked in the diagram. The sorting process begins with the detection of the user’s presence by the PIR sensor. This activates the system and the user’s QR code is scanned using camera 1. After authentication, the green LED lights up, indicating that the system is available for the object to be placed on the flap. After the object is placed on the flap, the weight sensor measures its mass. In parallel, camera 2 captures the image of the object and sends it to the Azure Custom Vision service. It returns a confidence level indicating the likelihood of the object being identified as a PET bottle. If the object is a PET bottle, then it is sent to the appropriate compartment through a movement performed with the help of a stepper motor. Otherwise, the object is redirected to the appropriate compartment, also with the help of the stepper motor. Additionally, the system captures an image of the user and updates their profile in the database with a penalty if they attempt to introduce an object that is not a PET bottle.
The algorithm does not use libraries for image processing because camera 2 has a fixed position relative to the lid of the object on which the waste is placed. Thus, the distance to the object does not vary, which means that image resizing is not necessary, especially since the training was conducted on images acquired under the same conditions.
3.2. PET Identification Confidence Index and PBIA
The objective of the PET Identification Confidence (PIC) index is to provide an accurate key metric for determining whether an object is a PET bottle, regardless of whether they are crushed or deformed. By integrating sensor data, AI recognition, and weight correlation, the PBIA ensures high confidence in the identification process, thereby reducing false positive scenarios and enhancing the overall functionality of the recycling system.
3.2.1. PIC Index Computing as Part of the PBIA
The PBIA is based on the PIC index, which is computed using two key factors that collectively determine whether an object is classified as a PET bottle, as follows:
- ▪
- The first factor (RecFactor) corresponds to the AI-based object recognition service, assessing the system’s ability to identify the object as a PET accurately;
- ▪
- The second factor (CorFactor) involves the actual weight of the object measured by the system.
Each of these factors is assigned a specific percentage in the overall calculation of the PIC index.
The RecFactor, representing the accuracy of AI-based object recognition, is assigned the highest weight at 60%, due to its effectiveness in identifying PET bottles. The CorFactor, representing the correlation between the recognized object’s weight and actual weight, is weighted at 40%. This factor helps to detect inconsistencies between the object’s expected and actual physical characteristics. The two percentages were determined after conducting many tests, which are presented in the Results Section. Equation (1) presents the method for calculating the PIC index.
where
- RecFactor is the recognition percentage provided by the Microsoft Azure Custom Vision service;
- and are the exponential weighting coefficients that adjust the impact of each factor;
- is a coefficient that adjusts the impact of weight variations;
- Var(W) is the variance of the measured weights;
- is the average weight from the dataset;
- K is a scaling coefficient for the adjustment factor;
- CorFactor is a binary function, computed using Equation (2).
The parameters γ and δ were introduced to calibrate the system according to the flexible operating environment conditions. The parameter γ controls the level of recognition of the AI service in relation to the final trust level. The parameter δ adjusts the contribution of weight variations in the final evaluation. This parameter is responsible for penalizing major deviations from the standard weight, even if AI recognition indicates a high probability that the object is a PET bottle. The use of an exponential function has the advantage of enabling a fine level of discrimination between objects that deviate slightly from the standard weight.
The RecFactor is expressed as a percentage because the Azure Custom Vision service provides a degree of identification, indicating how confidently an object is labeled.
To further ensure the accuracy of PET identification, the system measures the object’s weight and compares it against the standard weights of common PET bottle sizes. The CorFactor is determined as follows:
- The system measures the object’s weight after it has been inserted into the bin;
- The measured weight is then compared to a predefined list of standard PET bottle weights, including 20 and 30 g (corresponding to empty 250 mL, 500 mL, and 750 mL PET bottles). For this component, the initial tests are conducted using standard values of 20 g and 30 g. However, this approach can be extended to accommodate additional weight categories in future system iterations. If the measured weight falls within the range of ±2 g of these standard values, the CorFactor is set to 1. Otherwise, it is set to 0.
The tolerance of ±2 g is introduced to account for the possibility that the PET bottle might still contain a few residual drops of liquid. The values were determined after measurements were taken for specific cases, wherein a bottle contained a small amount of liquid. This slight variation in weight is not significant enough to interfere with the sorting process and, thus, is considered acceptable for classification purposes.
The CorFactor is a function computed with Equation (2). A contribution of 40% has been assigned to this factor, as the weight serves as a verification method to confirm that the product, even if damaged, matches the identification provided by the Azure Custom Vision service.
where
- is the measured weight of the object;
- is the standard deviation that reflects the weight tolerance.
Using an exponential function based on normal distribution, it provides a continuous value between 0 and 1, depending on how close the measured weight is to the standard values (20 g and 30 g). This makes the evaluation more precise and more challenging to contest. Introducing exponential coefficients enables the impact of each factor on the final result to be adjusted, providing flexibility in calibrating the system. Adjustment factors based on weight variation introduce another factor that considers the consistency of the measured weights. A minor variation in weight indicates a more reliable process.
The PIC value is integrated into the PBIA. The block diagram of the process involving the PBIA is presented in Figure 4. This logical flowchart outlines the complete process of the PRS. The system first detects the user’s presence via the PIR sensor, identifies them through QR code scanning, and measures the object’s weight. If the object’s weight falls within a specific range, it calculates the CorFactor. After sending the object’s image to the Azure Custom Vision service for detection, the system calculates the PIC index and determines whether the object is a PET or non-PET object. Based on the result, the stepper motor directs the object into the appropriate compartment, and the system updates the user’s score or alert count, accordingly, using the ACTLR.
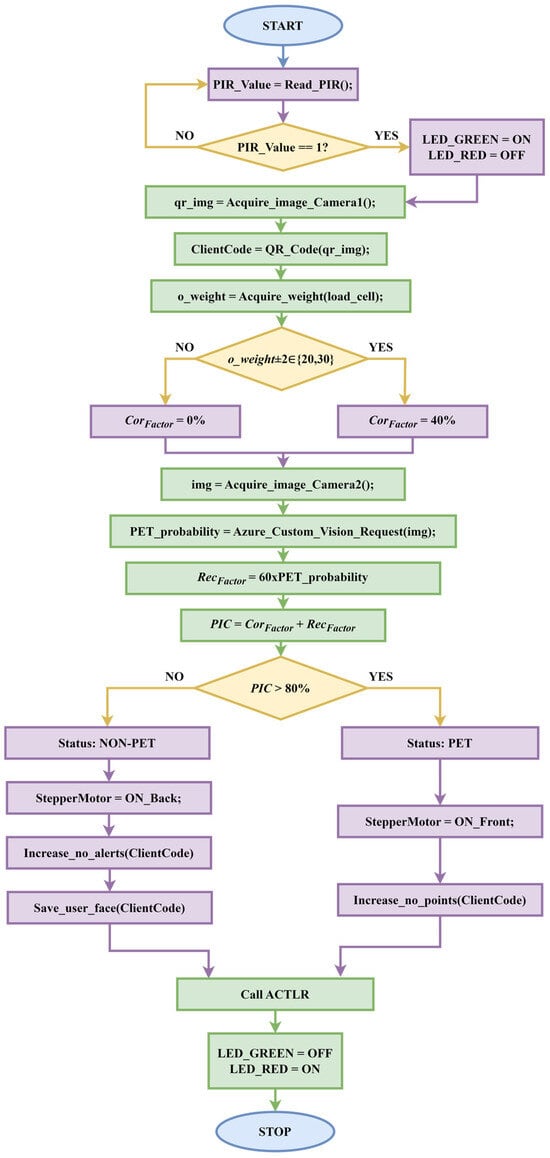
Figure 4.
PBIA block diagram.
Objects placed on the basket flap are photographed using camera 2, which transmits the image to the Microsoft Azure Custom Vision service. It returns the classification label, the probability representing the confidence of its labeling, and the localization coordinates, in the form of a rectangle that frames the detected object in the image. These coordinates visually frame the identified object to validate the results. The integration of these functionalities is conducted automatically at the Custom Vision service level. The PBIA system parses this information in order to use it in the graphical display of the detected object on the software interface. The object’s location does not influence the sorting decision in any way, as it is used only for experimental validations. The Custom Vision service returns the bounding box because the project was set to the object detection type, and not classification.
The PET identification process starts with the change in the PIR sensor state. The system reads the input from the PIR sensor, which detects the presence of a user. If the PIR sensor detects a person, it proceeds to the next step. If not, it waits until the sensor value is 1 (indicating a person is present).
When a person is detected, the system turns on the green and red LEDs, signaling that it is ready for use. Next, camera 1 captures an image containing the user’s QR code. The system decodes the QR code to identify users and retrieve their unique ID (ClientCode).
The system uses a load cell (weight sensor) to measure the object’s weight in the bin. A decision block checks if the object’s weight is close (±2 g) to 20 or 30 g, typical weights for empty PET bottles of specific sizes (e.g., 250 mL, 500 mL, and 750 mL). If the weight does not match the expected range, the CorFactor is set to 0%. If the weight matches the expected range, the CorFactor is set to 40%. This accounts for the confidence in identifying the object as a PET bottle, based solely on its weight.
Camera 2 captures an image of the object for further analysis. The image is sent to Microsoft Azure’s Custom Vision service, which returns a probability that the object is a PET bottle. The recognition factor (RecFactor) is calculated as 60% of the probability returned by the Azure Custom Vision service.
The PIC index is computed based on the CorFactor and RecFactor. If the PIC index is less than 80%, the object is classified as a non-PET object, as follows:
- The stepper motor activates in order to move the sorting flap, directing the object into the non-PET compartment;
- The system increases the user’s “alert” count, tracking the number of incorrect sorting attempts;
- The system captures an image of the user (via camera 1) and stores it in the database entry associated with the user’s code.
If the PIC index is greater than 80%, the object is classified as a PET bottle, as follows:
- The stepper motor activates in order to move the sorting flap, directing the object into the PET compartment;
- The system increases the user’s recycling score via the ACTLR, tracking the number of successful PET recycling attempts.
After sorting, the ACTLR is used to update the citizen’s recycling trust, the green LED turns off, and the red LED turns on. The system completes the sorting cycle and waits for the next activation.
3.2.2. The PBIA in the AIoT Context
The PBIA is implemented using Bash scripts, with each functionality managed by a separate script. All tasks related to sensor operations have been implemented in Python and subsequently integrated into the main Bash script. Directly reading from a sensor using only Bash is challenging because Bash lacks direct support for GPIO pin manipulation and precise timing, which is necessary to communicate with the sensor. This hybrid approach takes advantage of the strengths of both languages: Bash for its powerful automation capabilities and Python for its precise control over hardware interactions, particularly those involving sensors.
This modular design approach divides the application into distinct modules, each with its own task, as follows:
- The module for the PIR sensor (named pir.py) uses the Asus.GPIO library dedicated to all GPIO interactions;
- The module for the LED (LED.py) uses the Asus.GPIO library as well, to manage the LED signaling functionality;
- The module for authentication (auth.sh) relies on cURL and OpenSSL libraries for handling secure HyperText Transfer Protocol (HTTP) requests and encryption. We use cURL to send Azure SQL Server requests in Bash, programmatically;
- The module for the scale (scale.py) utilizes the HX711py library for reading the data from the load cell, which measures the weight;
- The module for handling Azure requests (azure.sh) uses cURL to send HTTP requests directly to the Azure Custom Vision service;
- The module for the motor (motor.py) also employs the Asus.GPIO library for managing motor control operations;
- The module for the Azure SQL Server database interaction (database.sh) requires an SQLcmd tool to interact with and manage database queries and data retrieval from the Azure SQL Server;
- The main module integrates the PBIA and engages the previous modules as needed.
By organizing the application into modules, maintenance becomes more straightforward. Each module can be individually updated, debugged, or improved without affecting others, simplifying troubleshooting and supporting continuous development. This separation of concerns makes pinpointing issues in specific system areas easier, leading to quicker debugging and updates.
The PBIA was integrated using Bash scripting in order to benefit from the following advantages:
- Direct access to system resources, because Bash scripts can directly interact with the operating system and hardware, enabling low-level control over the sensors and actuators;
- It is well-suited for automating tasks, such as scheduling Azure requests or handling database updates, ensuring the system operates smoothly;
- Efficiency in resource management, because Bash scripts are lightweight and do not consume extensive system resources. This is advantageous in an IoT environment where resources are limited;
- Bash scripts are highly portable and compatible across various Linux-based systems, providing flexibility should the PRS be deployed on different hardware or in other AIoT environments.
Figure 5 presents a screenshot of the detection process for a non-PET object, illustrating the steps involved in capturing a frame from the camera and sending it to the Azure Custom Vision service for analysis. This visual representation highlights the system’s ability to differentiate between various object categories during the identification process.
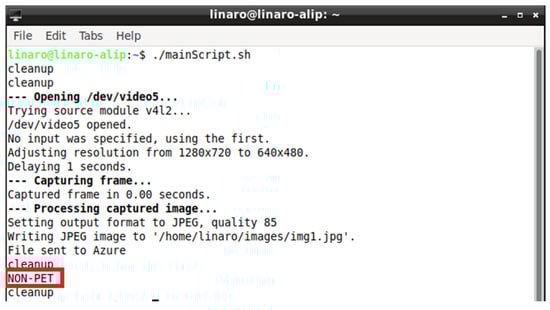
Figure 5.
MainScript.sh execution for a non-PET object.
After recycling PET bottles, users will receive a reward through an application developed in C# that is compatible with any device. The application employs the ACTLR and is responsible for implementing the user management protocol to encourage PET recycling. This application features a user-friendly graphical interface that includes elements such as the client’s QR code, the accumulated points, and the number of recycled PET items, with each bottle recycled being attributed to one point. Additionally, the application tracks alerts, which represent penalties incurred from attempts to introduce non-PET items into the PRS. These points can be redeemed at various participating stores, contingent upon agreements with local authorities.
Figure 6 illustrates the application’s graphical interface, underlining its intuitive design and functionality. This example illustrates the points earned, representing a user’s total points accumulated through recycling PET bottles (based on the total number of PET bottles recycled). The penalties label represents the penalties incurred from attempts to introduce non-PET items into the PRS.

Figure 6.
Graphical user interface of the reward application, showing points earned and penalties.
The ACTLR has been developed to determine a trust level corresponding to each citizen’s recycling activities, reflecting their commitment to recycling. The ACTLR assigns points according to the number of recycled elements and incorporates a penalty system for any attempts at fraudulent recycling. The Citizens’ Trust Level through Recycling Activities (CTLRA), proposed by the authors and implemented in the ACTLR, includes an exponential penalty as the number of non-PET items increases, discouraging fraudulent behavior. The CTLRA is computed using Equation (3):
where
- CTLRA represents the overall confidence level in a citizen’s recycling activities, and the integrated application quantifies the confidence level in points;
- R is the number of recycled items;
- P is the number of penalties;
- 1.5 is the base scaling factor (a constant that defines the penalty sensitivity);
- 0.5 is the sensitivity coefficient that controls how quickly the scaling factor increases with penalties;
- 2 is an exponent that controls the growth rate of adjusting the CTLRA in the report with the increase in penalties (typically set between 1 and 2, where 1 is a linear growth and 2 results in exponential growth). The authors chose to integrate the highest value to discourage fraud.
Examples and a detailed discussion of these aspects are presented in Section 4. Furthermore, each collection point within the recycling network is monitored through an IoT framework, which reports when a certain threshold of recycled PET bottles has been reached, depending on the PRS storage capacity. This indicates that the device needs to be emptied, prompting an alert for the collection vehicle to retrieve the accumulated recycled PET materials.
The system generates automatic alerts when collection is required, minimizing human error and ensuring that no collection opportunities are missed. Users can feel assured that their recycling efforts are being efficiently managed. Knowing that the PRS is regularly emptied encourages people to participate in recycling programs.
The IoT framework enables the continuous surveillance of each PRS, ensuring that the status of the recycled materials is always up to date. Streamlined collection schedules reduce unnecessary trips by collection vehicles, resulting in lower fuel costs and reduced wear and tear on transportation resources. Employing an alert system enables the timely collection and processing of a great number of PET bottles. This contributes to higher recycling rates and promotes sustainable waste management practices.
At the software level, the key component of the PRS is the Azure Custom Vision service, because it is responsible for labeling objects with a specific probability of being categorized as either PET or non-PET objects. This ML service enables accurate object recognition by training custom models that differentiate between various materials. Section 4 presents a detailed case study regarding the challenges of integrating this service into PET identification as part of the PBIA.
4. Results
The hardware system of the proposed recycling system is named the PRS. The PRS software components include the PBIA, which is responsible for the algorithm used in PET detection, and the ACTLR, a component used for assessing user engagement in recycling activities. This section presents various calculation examples for the CTLRA. Following this, the Microsoft Azure Custom Vision service is discussed by detailing a series of tests to evaluate its accuracy in identifying PET and non-PET materials. Finally, we illustrate the comprehensive recognition process, shedding light on the steps regarding utilizing the Azure Custom Vision service for recycling classification and integrating PIC index computing into the PBIA.
4.1. CTLRA Examples and Tests
This subsection presents two examples of computing the CTLRA. The first example considers the case where R = 100 bottle units, representing the number of PET bottles recycled, and P = 2 (the penalty score for undesirable behaviors).
The calculated CTLRA in this scenario is 36 points. It reflects a situation in which an individual exhibits high engagement in recycling while maintaining a low penalty score.
In the second example, we analyze the case where R = 110 units and P = 10 units. In this case, the CTLRA results in a value of 17.8 points. This reflects a considerable decline in trust, illustrating the adverse effects of low engagement in recycling and higher penalties based on an individual’s trustworthiness.
By comparing these two scenarios, it is evident that variations in engagement and penalty scores have a significant impact on the overall trust level. The first case illustrates the benefits of active participation in recycling programs, while the second highlights the repercussions of inadequate involvement and increased penalties.
Next, we conduct two test simulations for the CTLRA using Equation (3) in the following contexts:
- Varying the value of R from 1 to 100 units, while keeping P constant at 2 (Figure 7). Thus, a linear increase in the CTLRA values, from 0.36 to 36.36 points, is observed. This is a straightforward interpretation that higher recycling engagement leads to greater trust;
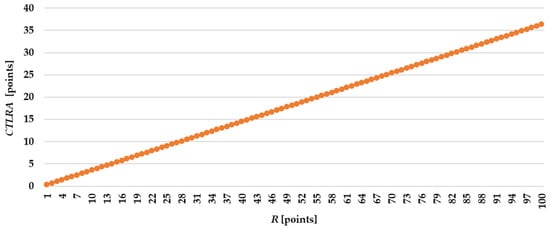 Figure 7. Linear increase in CTLRA with varying engagement (R) and a constant penalty (P = 2).
 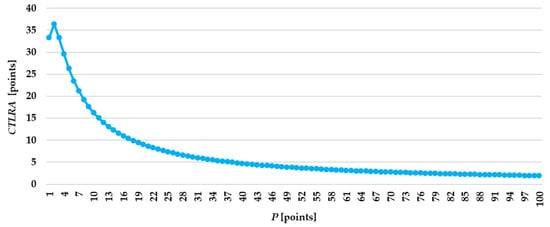 Figure 8. CTLRA decreases with constant engagement (R = 100) and increasing penalties (P from 1 to 100).
The CTLRA starts at 33.33 points in this second scenario and decreases to 1.96 points. The initial value of 33.33 points indicates a significant level of trust, when penalties are low. At this stage, the penalty for non-compliance or negative behavior (as reflected by P) is not substantial enough to significantly affect the trust assessment. As P increases, the formula indicates a more significant impact of the penalties on the trust level, leading to a noticeable decrease in the CTLRA. This indicates that while engagement remains high, the increasing penalties for undesirable behavior begin to overshadow the benefits of engagement, resulting in a decline in trust.
4.2. Azure Custom Vision in PBIA Context
Azure Custom Vision is a cloud-based service offered by Microsoft Azure that enables developers to build, deploy, and improve custom image classifiers and object detection models using ML. This study examines the factors that influence the number of images required for training a practical object detection model using the Microsoft Azure Custom Vision tool.
Object detection involves identifying and pinpointing objects within an image. Microsoft Azure Custom Vision offers an intuitive interface that enables users to train models for detecting specific objects. Users upload images, label them accordingly, and assess the model’s performance. The platform facilitates classification (categorizing images) and object detection (locating objects within the images). This article focuses on object detection, as the primary objective is the identification of PET bottles.
The model trained using Azure Custom Vision is influenced by several factors, including the complexity of the analyzed object (e.g., different shapes, colors, and sizes), image quality, and environmental conditions (lighting, background, angles, and occlusions).
A significant challenge faced by object detection models is the number of images utilized during the training process. An inadequate number of training data can result in underfitting, a scenario in which the model fails to capture the underlying patterns present in the data. This often leads to suboptimal performance when evaluating unseen images, as the model lacks the necessary exposure to learn from diverse examples. Conversely, excessive photos can lead to overfitting, where the model becomes too tailored to the training dataset and loses its ability to generalize to new, unseen data.
The primary challenge, therefore, lies in determining the optimal number of images necessary for training, which is contingent upon the project’s specific requirements. Achieving a balance between having sufficient data to capture the diversity of the target objects and avoiding the pitfalls of underfitting and overfitting is paramount for developing a production-ready model for real-time object detection.
The model performance indicators are the following:
- Precision quantifies the ratio of true positive (TP) predictions to the overall number of positive predictions made by the model, which includes both TP and false positive (FP) predictions. In this context, TP refers to the characteristics and details that enable the model to accurately identify the positive class and successfully predict a positive outcome. This metric evaluates the model’s ability to distinguish relevant information from irrelevant data. For example, in the PET recycling model, if the model predicts that a bottle is a PET and the object is a PET, that is considered a TP. Precision is computed using Equation (4).
- Recall measures the ratio of TP predictions to the total number of actual positive characteristics in the dataset. It indicates how effectively the model identifies positive outcomes among all the relevant factors. A high recall value indicates that the model accurately captures most of the actual positives, which is crucial in scenarios where a missing positive characteristic could have significant consequences. A recall of 100% means that the model successfully identified all instances of the label “PET” present in the training images. This ideal outcome indicates that there were no false negatives (FNs), ensuring that the model did not overlook any relevant objects. An FN arises when a model inaccurately predicts a negative outcome for an instance that is positive. In other words, it is a type of error according to which the model fails to identify a positive case and instead classifies it as negative. In a recycling context designed to detect PET objects, an FN occurs when the system predicts that an object is non-PET (negative), but in reality, the object is PET (positive). This is particularly concerning because it means the condition goes undetected. Recall is calculated using Equation (5).
- Mean average precision (mAP) is a metric that evaluates a model’s performance by calculating the average precision (AP) values across different confidence thresholds and Intersection over Union (IoU) levels. An mAP of 100% signifies that the model accurately identifies objects and has a high confidence level across varying detection scenarios. The AP and mAP are computed using Equations (6) and (7), respectively.
- APi is the average precision for class i;
- mAP is the mean average precision;
- n is the number of classes.
- Accuracy represents the proportion of correct predictions made in terms of TPs and true negatives (TNs) in regard to the total number of predictions. This value represents the weight of correct predictions that identified the label “PET” and “non-PET” in regard to all the predictions. Accuracy is calculated using Equation (8).
Multiple tests were performed with the label “PET” to identify the optimal number. At this stage, the main objective was to develop a model that determines whether an object in an image is a PET object. After training, the model was tested with 50 images containing PET objects and 50 with non-PET objects. The test images for the model are unseen, meaning they differ from the training images. Table 1 presents a sample of the results from the training tests.

Table 1.
Sample of the training test results.
The precision, recall, and mAP reflect the model’s performance based on the training set and were measured at 100% for most tests. This indicates that the model performed flawlessly in classifying the PET objects, based on the data on which it was trained. The 99% probabilities during testing refer to the model’s confidence in its predictions for the 100 unseen test data. The Azure Custom Vision service generated the precision, recall, and mAP values, which the authors modified only by changing the number of test images. The unseen test images were kept the same for all five tests. The images are analyzed using the pseudocode for the tests.
In Test 1, 30 PET-labeled images were used for training for 15 min. The precision, recall, and mAP were all measured at 100%. These metrics indicate the model perfectly identified PET objects in the training set. However, when tested on 50 unseen PET images and 50 unseen non-PET images, the model classified all the images as PET images, assigning probabilities exceeding 99%. This misclassification points to overfitting, where the model fails to generalize to new data.
Test 2 included training using 60 PET-labeled images for 15 min. The precision, recall, and mAP remained at 100%. The model continued to misclassify non-PET objects as PET objects with probabilities over 99%, indicating no improvement in generalization.
In Test 3, 100 PET-labeled images were used for training for 30 min. The precision dropped to 90.9%, although the recall and mAP stayed at 100%. The slight drop in precision indicates some errors in identifying PET objects within the training set. Despite improved training performance, non-PET images were still misclassified as PET images, with over 99% probability, indicating the model’s inability to correctly distinguish between the two categories in unseen data. The use of a balanced dataset with an increased number of images used for training resulted in a decrease in accuracy in some tests (e.g., Test 3). The emergence of common features in both PET and non-PET images explains this decrease. These characteristics are shape and transparency. These common characteristics introduce ambiguity into the classification process. Although the theoretical increase in data volume should improve the model’s performance, in this case, the introduction of additional examples led to a partial “saturation” of the model with similar features, causing it to be less discriminative in certain complex scenarios. The phenomenon requires a detailed analysis of the distinct characteristics of the objects, possibly through the introduction of additional filters in the training process or through the manual refinement of the dataset.
Test 4 involved training based on 150 PET-labeled images for 30 min. The precision, recall, and mAP returned to 100%. However, the model still misclassified all the test images (both PET and non-PET) as PET images with over 99% probability, indicating that it had not learned to generalize beyond the training data.
In Test 5, 150 PET-labeled images were used for training, with an extended training time of 2 h (120 min). The precision, recall, and mAP remained at 100%. Even with the additional training time, the model continued to misclassify non-PET objects as PET objects, with probabilities exceeding 99%, indicating that the misclassification issue persisted.
In Test 6, 345 PET labels and 625 non-PET labels (including cardboard, metal, and glass objects) were used for training. As Table 1 shows, the results for this test show lower performance metrics compared to Tests 1 and 2.
Test 6 confirms that increasing the dataset will not solve the issue of confusion between PET and glass bottles. Increasing the number of objects in the training stage will increase the model’s confusion. Conversely, maintaining a moderate number of objects in the dataset will decrease the model’s classification ability. To solve this issue, this paper introduces a new algorithm, combined with hardware facilities.
The loop runs 100 iterations and constructs the file path for each unseen test image. Next, each image is asynchronously sent to the Azure Custom Vision API for prediction. The response (resPET) is compared with the expected label, as follows:
- If the prediction is not “PET” but the image is one of the first 50 images (assumed to be PET), then wrongPET is incremented;
- If the prediction is “PET” but the image index is above the first 50 images (assumed to be non-PET), then wrongPET is incremented.
A delay is added between requests to avoid API overload. The primary issue observed throughout these experiments is that the model consistently misclassifies non-PET objects as PET objects, even after adjustments in the dataset size and training conditions. An important finding from the tests was that training exclusively with PET items can lead to overfitting, where the model memorizes training examples rather than learning to generalize. Using a balanced dataset that includes various examples from both categories minimizes the risk of overfitting. This encourages the model to learn consistent features across PET and non-PET categories.
Consequently, the model was trained using a balanced dataset that included both PET and non-PET items. This will help improve its ability to distinguish between the two categories. We expect the model to learn to identify distinguishing features that differentiate these categories by including PET and non-PET items in the training set. For example, training with various PET bottles alongside objects allows the model to recognize the unique attributes of PET items compared to the characteristics of non-PET items.
The model, based on two labels, was trained using 60 images for PET objects and 60 images for non-PET objects, as shown in Figure 9. It achieved a precision of 96%, a recall of 100%, and an mAP of 100%.
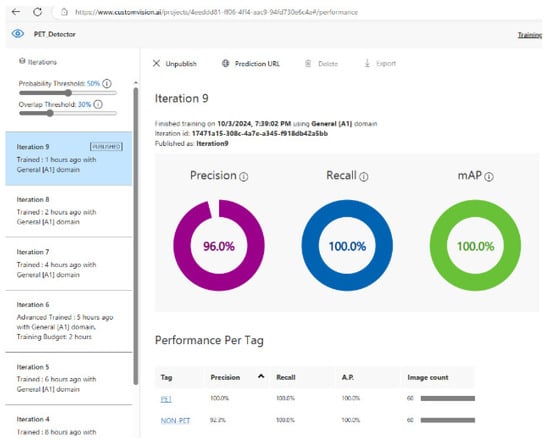
Figure 9.
Training performance of the model, with PET and non-PET labels.
After conducting 100 tests, Azure Custom Vision labeled the objects as follows:
- Eleven FNs (PET classified as non-PET). These errors indicate that the model struggled to correctly identify 11 PET items, instead misclassifying them as non-PET items;
- Two FPs (non-PET classified as PET). This means that two objects not made of PET were incorrectly identified as PET. This error could arise from visual similarities in the object’s features, such as texture or shape, which may have confused the model.
In this case, the overall accuracy was 87%, but the PET identification accuracy was 96%, as only 2 out of 50 items were identified as non-PET objects. The system improved its accuracy after applying the PIC index Equation (1), which integrates the RecFactor from Azure Custom Vision, and the CorFactor using Equation (2), based on the object’s weight. Only two items out of 100 were ultimately misclassified, labeled explicitly as PET objects when they were non-PET objects, after applying Equation (1).
Reducing the misclassifications from 13 (2 non-PET and 11 PET) to just 2 demonstrates the utility of the proposed mathematical formalism introduced by the PIC index. The initial error rate from Azure Custom Vision was 13%, but after applying the PIC index, it dropped significantly to just 2%, equating to an overall accuracy rate of 98%.
This improvement highlights the importance of incorporating additional parameters, such as weight, into the decision-making process. The PBIA incorporates the PIC index to help filter misclassifications by adding an extra validation layer beyond visual object recognition. The model’s visual accuracy and object weight, used as a secondary criterion, led to a much more reliable classification system.
Subsequently, we conducted tests in Azure Custom Vision to improve the precision parameter, utilizing 100 training images for non-PET items and 60 for PET items. The values were chosen to be unequal, accounting for the complexity of the non-PET class compared to the PET class. The results yielded a precision of 69.6%, a recall of 100%, and an mAP of 95.0%, as presented in Figure 10. In a different scenario, when we employed 100 images for both PET and non-PET items, the outcomes were a precision of 62.5%, a recall of 100%, and an mAP of 97.5% (Figure 11).
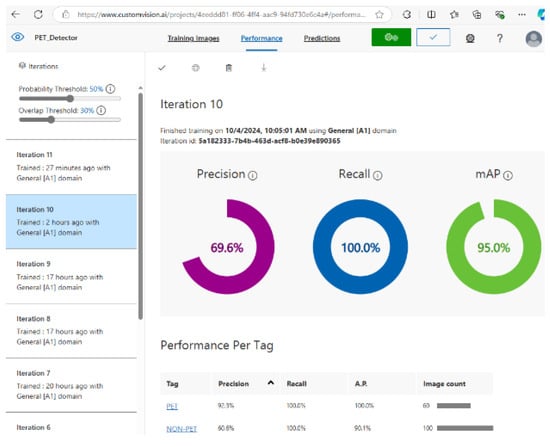
Figure 10.
Performance metrics of Azure Custom Vision model trained on 60 images of PET items and 60 images of non-PET items.
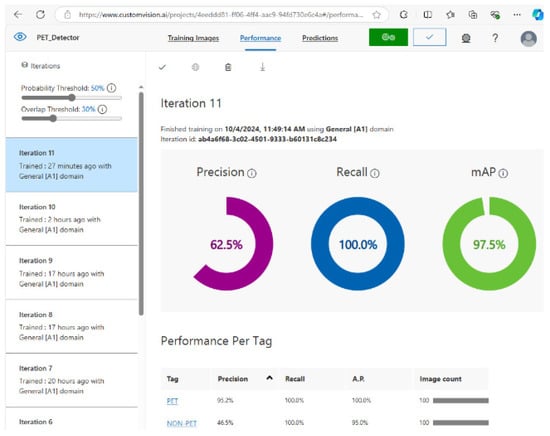
Figure 11.
Performance metrics of the Azure Custom Vision model trained on 100 images of PET items and 100 images of non-PET items.
Interestingly, the combination of 60 images for each category produced the most favorable results, achieving a precision of 96%, a recall of 100%, and an mAP of 100%. The superior performance of the 60-image scenario can be attributed to several factors. First, a balanced dataset of 60 images for each class likely allowed the model to better learn the distinguishing features of PET and non-PET items without being overwhelmed by the noise from excess photos. When using 100 images of non-PET items, the model focused too much on the distinguishing features, thereby diluting the training signal of the PET items. Additionally, a smaller training set can sometimes lead to a more effective training process by forcing the model to generalize better from fewer examples, which can result in higher precision without sacrificing recall. This indicates that while the model could accurately identify all instances of the PET class (resulting in a recall of 100%), it was also able to significantly improve its precision when trained using 60 images per category, thus striking an optimal balance between the two metrics.
Based on the analysis of the 11 training iterations tested, the optimal results were achieved with the dataset comprising 60 PET and 60 images of non-PET items. This combination strongly aligns with the application’s specific requirements, improving the model’s ability to distinguish between the two categories accurately. The performance metrics attained from this configuration indicate a well-balanced approach, thereby validating its suitability for the intended recycling identification tasks with an accuracy of 98%.
4.3. Bottle Identification and PIC Index Calculation Example
This subsection details two calculation scenarios. The first illustrates the identification of a PET bottle, and the other represents a non-PET object. Figure 12 illustrates how the Azure Custom Vision service scans and identifies objects as either PET or non-PET, with a weight of 20 g (Figure 13).
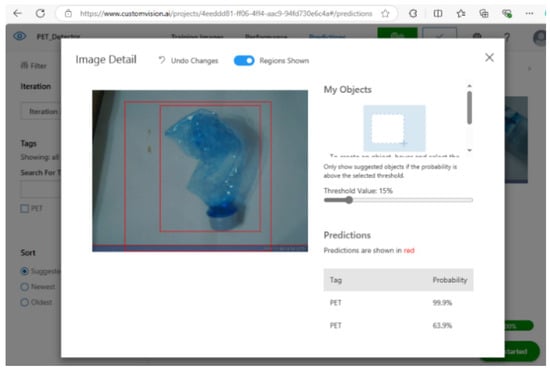
Figure 12.
Azure Custom Vision’s object identification as a PET bottle.
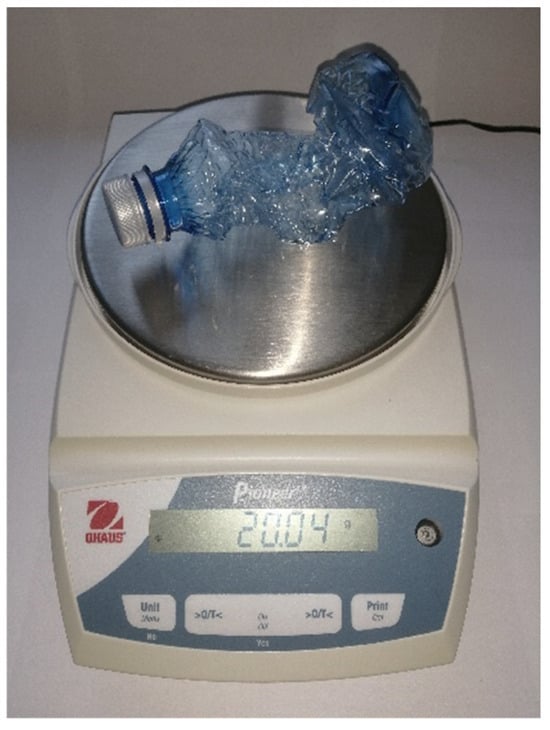
Figure 13.
Weight measurement of a PET bottle.
The Azure Custom Vision service returns two PET identification tags with the following confidence levels, as depicted in Figure 12:
- Tag 1: 99.9% confidence;
- Tag 2: 63.9% confidence.
The system uses the highest confidence value, 99.9%, as the RecFactor. The RecFactor is the confidence percentage that the Azure Custom Vision service returned for the PET tag with the highest confidence. In this case:
RecFactor = 0.999 = 99.9%
Next, the CorFactor is computed based on the object’s weight. The bottle weighs 20 g, within the acceptable tolerance range of ±2 g from the standard weight of 20 g for an empty 500 mL PET bottle. Since the weight meets the criteria, the CorFactor is set to 1. With = 20 g, grams, and 2 g.
CorFactor = 1 + 3.7266 × 10⁻⁶ ≈ 1
Assuming and , the PIC index is calculated using Equation (1):
PIC = (0.6 × 0.9992 + 0.4 × 1) × 100 = 99.88%
The resulting PIC index of 99.88% indicates high confidence that the object is a PET bottle. This is a direct result of the very high RecFactor (99.9%) provided by the Azure Custom Vision service, as well as the validation of the object’s weight as a PET bottle within the expected range.
This example demonstrates the use of the PIC index calculation to accurately identify PET bottles. The combination of Azure confidence and weight validation creates a highly reliable system, with the 99.94% PIC index confirming that the object is undoubtedly a PET bottle and indicating that it has been identified as made from PET.
In the second scenario, a non-PET object is analyzed. The example involves a glass bottle that presents significant complexities for the Azure Custom Vision model due to several factors. First and foremost, glass and PET bottles often share similar shapes, transparency, and sizes, which can lead to ambiguity in visual recognition. The resemblance in form can lead to the model misclassifying objects, especially when relying solely on visual characteristics.
Figure 14 presents the object positioned on the scale for weight measurement, indicating 74 g. Figure 15 presents a screenshot from the Azure Custom Vision interface, displaying the identification results for the object, as follows:
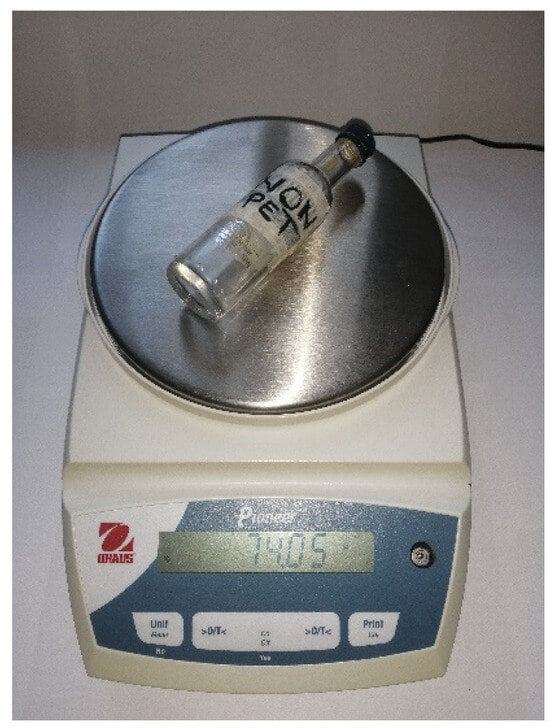
Figure 14.
Weight measurement of a non-PET bottle.
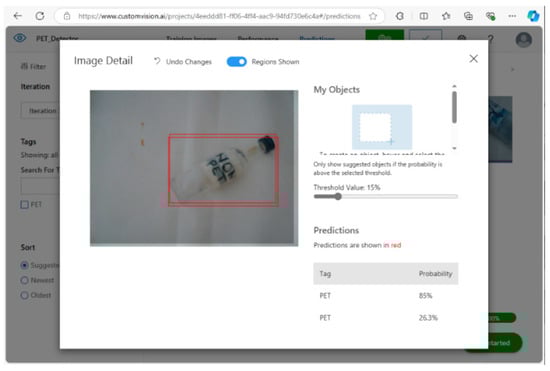
Figure 15.
Azure Custom Vision’s object identification as a non-PET bottle.
- Tag 1: 85% confidence;
- Tag 2: 26.3% confidence.
The 85% confidence value from the Azure Custom Vision service arises because the glass object exhibits a similar shape and color to PET bottles.
The RecFactor is determined according to the highest confidence value returned by the Azure Custom Vision service:
RecFactor = 0.85
Next, the CorFactor is calculated based on the object’s weight. The 74 g weight must be validated against the predefined standard weights for PET bottles. The acceptable standard weights for common PET bottle sizes (250 mL, 500 mL, and 750 mL) are 20 and 30 g. Since the weight of 74 g does not match either of these standard weights and exceeds the acceptable tolerance range of ±2 g, the CorFactor is set to 0.
CorFactor = 0
The PIC index using Equation (1) is:
PIC = (0.6 × 0.852 + 0.4 × 0) × 100% = 43.35%
The resulting PIC index of 43.35% indicates low confidence in identifying the object as a PET bottle. However, this is significantly lower than the previously calculated PIC index for the PET example. The 60% weighting assigned to the RecFactor emphasizes the role of visual recognition in object classification, yet the 40% weighting for the CorFactor serves as a critical check. In this instance, failing to meet the weight criteria and identifying the object as non-PET due to its characteristics results in a significantly reduced confidence score.
There are instances when an object may weigh 20 or 30 g, but it is not a PET bottle. In such cases, we rely on the Azure Custom Vision service. For this reason, we will impose a minimum confidence threshold of 80% for the PBIA. When the PIC index exceeds 80%, the object is classified as a PET item. Conversely, if the probability is 80% or lower, it is categorized as a non-PET object.
The PBIA employs an ML model developed using 60 PET and 60 non-PET training images, which achieves a precision of 96% (Figure 9). Finally, 200 tests were conducted to validate this model, utilizing images distinct from those used during the training phase. Among the test images, 100 represented PET items, while the remaining 100 comprised non-PET objects. Notably, the non-PET category included scanned items that differed from those used in the training dataset.
These tests were conducted automatically, and, for this purpose, a specialized C# script was developed to evaluate the PBIA’s performance. Figure 16 displays a screenshot of the script’s execution. The results were recorded in a file and subsequently analyzed to recalculate the accuracy, yielding a final value of 98% for the entire system (PET and non-PET images).

Figure 16.
Execution of C# script for performance evaluation of PBIA.
The test results revealed that 22 out of 100 objects were incorrectly classified as non-PET items. In comparison, 4 out of 100 objects were mistakenly identified as PET items, despite being non-PET objects. A confusion matrix is presented in Figure 17. The model’s 87% accuracy means its performance remains commendable, particularly given the challenging task of distinguishing between similar objects. The model’s ability to accurately identify most of the PET items illustrates its effectiveness in the specific context of this application.
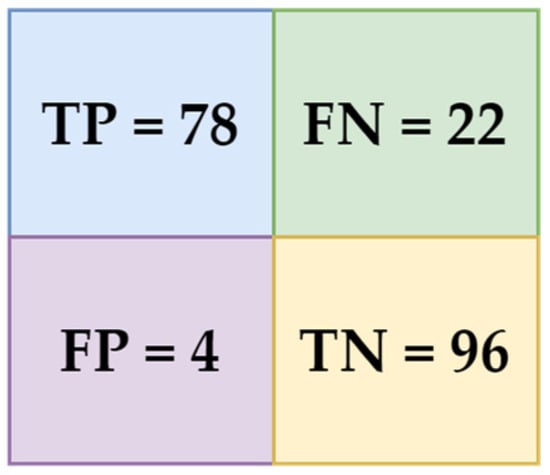
Figure 17.
Confusion matrix.
Factual accuracy indicates how accurately the model identifies PET materials during testing, reflecting real-world performance. Specifically, it refers to the proportion of PET objects correctly classified as PET items. In this case, the model achieved 96% factual accuracy, meaning that only 4 out of 100 PET items were incorrectly classified as non-PET items, while the rest were correctly identified. This measurement demonstrates the model′s effectiveness in distinguishing PET items, particularly when applied to the recycling identification task.
The factual accuracy for identifying PET items stands at an impressive 96%, as only four elements were incorrectly classified as non-PET items. This high level of accuracy highlights the model’s effectiveness in recognizing PET materials, reflecting its strong performance in distinguishing between recyclable and non-recyclable items.
Factual accuracy in identifying PET materials is a reflection of how well the model performs in regard to recycling tasks. While a few PET items were mistakenly classified as non-PET items, the model’s overall performance remains commendable. Specifically, with an actual accuracy rate of 96%, it is evident that the system is mainly effective in distinguishing between recyclable PET bottles and non-recyclable materials. The few misclassifications, in which four PET items were incorrectly categorized as non-PET items, illustrate the complexities inherent in object detection tasks.
5. Discussion
5.1. Research Implications
The development and implementation of the PRS prototype, utilizing the PBIA and ACTLR, have demonstrated significant achievements in advancing the identification and sorting of PET materials. This project proposes a new residential recycling process, laying a strong foundation for future innovations in waste management.
The prototype achieved remarkable performance metrics, with the most effective results stemming from the use of balanced datasets (60 images for PET and 60 for non-PET objects), which yielded a precision of 96%, a recall of 100%, and a mAP of 100%.
The dataset was built using the Trust Exis model 17003 webcam, which has a resolution of 640 × 480 pixels. This was connected to the Asus Tinker Board computing system. For training and validation, image acquisition was performed under natural ambient lighting conditions in indoor environments, without the use of directional light sources. The objects were photographed individually against the white background of the basket lid. The authors deliberately varied the objects’ positions on the lid of the basket to create various recognition scenarios. Therefore, for each image, the object was manually rotated and positioned differently. Therefore, the data collection process for building the dataset did not use automated methods or detection systems for image preprocessing during the collection stage. The dataset was built manually.
The employment of the Azure Custom Vision service has highlighted the power of cloud-based AI in real-time image classification. By leveraging Microsoft’s advanced ML capabilities, the system processed and analyzed images through the Azure Custom Vision service. This integration of cutting-edge technology into the recycling workflow represents a significant step forward in optimizing waste management processes.
The introduction of the CTLRA is a noteworthy achievement that quantifies citizens’ engagement and reliability in regard to recycling activities. By incorporating a point allocation system based on the number of recycled PET items and penalties for fraudulent recycling attempts, the CTLRA fosters responsible recycling behaviors. To encourage recycling behavior, the proposed system offers users a simulation mechanism that awards points for each recycled PET item. These points are accumulated in the user’s account and can be converted into discount vouchers, which can be used in partnerships established with major retail chains.
Implementing an AIoT framework for monitoring PRS points has enabled real-time reporting when specific thresholds in terms of the amount of recycled PET bottles are reached. This proactive approach ensures that collection devices are emptied promptly, optimizing the operational CEM. The ability to monitor and manage the PRS dynamically represents a significant innovation in recycling logistics.
5.2. Cost of PRS Prototype
The cost of each component used in developing the PRS prototype is depicted in Table 2, providing insights into the financial implications of implementing this innovative recycling solution. The amount of EUR 186.1 encompasses elements such as the Asus Tinker Board, sensors, a stepper motor, two cameras, the load cell with amplifier, battery holder, materials for building the prototype, cables, wires, and additional materials that ensure the prototype’s functionality. Although the initial financial outlay may seem significant, it is essential to consider the long-term benefits of improved waste management and improved environmental sustainability.
Table 2.
PRS prototype component costs.
As technology matures and production scales, costs may decrease, further improving the cost-effectiveness of implementing innovative solutions in regard to recycling efforts.
5.3. Research Limitations
One notable limitation encountered during prototype development is related to the load cell used for weighing the recycled items. The scale could not be placed on the sorting flap because it could not return to a perfectly horizontal position. As the load cell operates at gram-level precision, any misalignment could lead to measurement inaccuracies. This potential measurement error may affect the trust level calculations and the overall effectiveness of the recycling process. Currently, the load cell measures the entire system, with a limitation of 20 kg.
The second limitation concerns the Internet connection, as the system must be connected to the network to send requests to Azure for image analysis and data retrieval. This dependency on Internet access poses a limitation, especially in environments where connectivity may be intermittent or unreliable. In such cases, the performance of the Azure Custom Vision service could be compromised, leading to delays in processing and the potential misclassification of PET bottles. Therefore, implementing a local processing solution could improve the prototype’s resilience against connectivity issues.
Another limitation is that users must create an account to recycle PET bottles. This requirement may deter potential users who prefer a more straightforward, hassle-free recycling process. To improve accessibility, future iterations of the system could consider implementing a solution that allows users to print a voucher or receipt, enabling those without an account to participate in recycling activities.
The tests conducted in this experiment were carried out under natural daylight conditions, simulating a scenario in which a waste bin system is installed in the yard of a residential complex. The choice is justified by considering the real usage context. On the other hand, expanding the number of test cases requires an increase in the volume of images needed for each scenario. Therefore, the tests were not conducted in low light conditions or in the presence of strong direct light, such as backlighting from the sun. For use in such conditions, future iterations will propose the addition of a white-light LED, automatically activated by the PIR sensor, or the use of cameras with increased infrared sensitivity. Adapting the system to various lighting conditions represents a future development direction.
Additionally, the current system does not permit manual entry of the client code, which can limit usability for individuals who may not have immediate access to their QR code or face difficulties with scanning. Allowing for manual input could improve the user experience and enable more individuals to participate in the recycling process.
The following studies [64,65,66] demonstrate the possibility of integrating Self-Sovereign Identity (SSI) architectures into public services without compromising user security measures. In practice, these architectures anonymize access to the system without compromising the reward or penalty function. For this reason, a future research direction will be the use of the SSI system in the management of recyclable waste. In a subsequent iteration, the expansion of the PRS will include an SSI-based ecosystem to build a transparent circular economy.
While there are areas for improvement and challenges to address, the PRS prototype represents a step forward in utilizing technology for sustainable waste management. Future iterations of the system can benefit from addressing these limitations to optimize its performance, improve the user experience, and ensure that the project continues to make a positive contribution to recycling efforts and environmental sustainability.
6. Conclusions
This paper has made significant contributions to the field of intelligent waste management, particularly in the context of PET recycling. Analysis of the European PET recycling statistics has highlighted the pressing need for improved recycling practices, reinforcing the relevance of our proposed solutions. Developing a novel AIoT infrastructure, specifically the PRS, marks an advancement in residential waste management, replacing conventional collection bins with a more efficient system designed to provide increased functionality and storage capacity.
In this paper, we introduced the PRS prototype in a configuration never used before in the literature, which functions as a recycling bin for PET bottles, implemented with a cost of EUR 186.1. This bin is part of an AIoT network, wherein recycling units report on various events, such as the need to be emptied when they reach full capacity. The algorithm used by the PRS is called the PBIA, which includes a trust index known as the PIC, calculated based on two components: RecFactor and CorFactor. A threshold of 80% has been set for the PIC index, and the sorting compartment is commanded to act accordingly. Subsequently, the algorithm assigns a trust level to the user, reflecting their engagement in the recycling process through the CTLRA component.
A key feature of this study is the detailed examination of the Azure Custom Vision services for object recognition in regard to PET identification. The insights from this analysis demonstrate the platform’s capabilities and performance metrics, outlining its potential for integration into intelligent waste management systems, with a 98% accuracy in PET detection and a 96% accuracy achieved by the model.
Ultimately, our cost analysis demonstrates the economic feasibility of implementing the proposed low-cost prototype, rendering it a compelling solution for municipalities and communities seeking to improve their recycling initiatives.
This work opens up several avenues for future research and development. First, further refinement of the weight measurement component is necessary to improve the accuracy of the load cell system. Exploring alternative solutions that can maintain precise measurements in dynamic environments will improve the overall functionality of the PRS. Optimizing the user experience by allowing the manual input of client codes and eliminating user account requirements will broaden the accessibility and participation in the recycling program.
In addition to its original elements, this work also has significant municipal implications for the development of sustainable public policies in the context of the circular economy. The PRS solution supports local authorities in achieving European objectives regarding plastic material recycling. The IoT solution proposed in this paper can be integrated at a low cost into smart cities at the residential level. Thus, the system monitors collection points in real time, encouraging waste recycling through a system that allows citizens to redeem various goods at the municipality’s partner stores. On the other hand, the ACTLR is a tool to enhance civic education strategies by stimulating ecological behavior. The introduction of the fraud penalty system and the reward for recycling creates a framework that positively influences recycling culture at the community level.
Expanding the PRS’s deployment beyond residential areas into commercial and public spaces could amplify its impact on community-wide recycling efforts. Implementing pilot projects in diverse environments would provide valuable insights into user engagement, system performance, and potential areas for improvement.
Author Contributions
Conceptualization, C.-M.R.; methodology, C.-M.R. and A.S.; software, C.-M.R. and A.S.; validation, C.-M.R. and A.S.; formal analysis, C.-M.R. and A.S.; investigation, C.-M.R. and A.S.; resources, C.-M.R. and A.S.; data curation, C.-M.R. and A.S.; writing—original draft preparation, C.-M.R. and A.S.; writing—review and editing, C.-M.R. and A.S.; visualization, C.-M.R. and A.S.; supervision, C.-M.R. All authors have read and agreed to the published version of the manuscript.
Funding
This research was funded by the Petroleum-Gas University of Ploiesti, Romania.
Institutional Review Board Statement
Not applicable.
Informed Consent Statement
Not applicable.
Data Availability Statement
The raw data supporting the conclusions in this article will be made available by the authors on request.
Conflicts of Interest
The authors declare that there are no conflicts of interest.
Abbreviations
The following abbreviations are used in this manuscript:
| ACTLR | Algorithm for Citizens’ Trust Level by Recycling |
| AI | Artificial intelligence |
| AIoT | Artificial Intelligence of Things |
| AP | Average precision |
| ARM | Advanced RISC Machine |
| CCD | Charge-Coupled Device |
| CCSs | Comprehensive Collection Systems |
| CEM | Circular Economy Model |
| CMOS | Complementary Metal Oxide Semiconductor |
| CNN | Convolutional neural network |
| CTLRA | Citizens’ Trust Level through Recycling Activities |
| DL | Deep learning |
| DRS | Deposit Return Schemes |
| EPR | Extended Producer Responsibility |
| EU | European Union |
| FN | False negative |
| FP | False positive |
| HDPE | High-density polyethylene |
| HTTP | HyperText Transfer Protocol |
| IoT | Internet of Things |
| IoU | Intersection over Union |
| LDPE | Low-density polyethylene |
| LED | Light-emitting diode |
| LWP | Lightweight packaging |
| mAP | Mean average precision |
| ML | Machine learning |
| NIR | Near infrared |
| P | Number of penalties |
| PBIA | PET Bottle Identification Algorithm |
| PET | Polyethylene terephthalate |
| PETE | Polyethylene terephthalate |
| PIC | PET Identification Confidence |
| PIR | Passive infrared |
| PLCs | Programmable Logic Controllers |
| PP | Polypropylene |
| PRS | PET Recycling System |
| PS | Polystyrene |
| PVC | Polyvinyl chloride |
| R | Number of recycled items |
| RGB | Red–Green–Blue |
| RVM | Reverse vending machine |
| SBS | Sensor-based sorting |
| SRC | Standardized Recycling Codes |
| SRF | Solid-recovered fuels |
| SSI | Self-Sovereign Identity |
| TN | True negative |
| TP | True positive |
References
- European Commission. Communication from the Commission to the European Parliament, the Council, the European Economic and Social Committee and the Committee of the Regions. A new Circular Economy Action Plan. For a Cleaner and More Competitive Europe. Available online: https://eur-lex.europa.eu/legal-content/EN/TXT/?uri=COM:2020:98:FIN (accessed on 15 April 2025).
- Mallick, P.K.; Salling, K.B.; Pigosso, D.C.A.; McAloone, T.C. Designing and operationalising extended producer responsibility under the EU Green Deal. Environ. Chall. 2024, 16, 100977. [Google Scholar] [CrossRef]
- Lu, Z.; Hasselström, L.; Finnveden, G.; Johansson, N. Cost-benefit analysis of two possible deposit-refund systems for reuse and recycling of plastic packaging in Sweden. Clean. Waste Syst. 2022, 3, 100048. [Google Scholar] [CrossRef]
- Burgess, M.; Holmes, H.; Sharmina, M.; Shaver, M.P. The future of UK plastics recycling: One Bin to Rule Them All. Resour. Conserv. Recycl. 2021, 164, 105191. [Google Scholar] [CrossRef]
- Gritsch, L.; Breslmayer, G.; Rainer, R.; Stipanovic, H.; Tischberger-Aldrian, A.; Lederer, J. Critical properties of plastic packaging waste for recycling: A case study on non-beverage plastic bottles in an urban MSW system in Austria. Waste Manag. 2024, 185, 10–24. [Google Scholar] [CrossRef] [PubMed]
- Sivasanthosh, C.; Raj, I.M.; Porulselvi, K. Recycling of Microplastic and Its Industrial Applications. Int. J. Innov. Res. Eng. 2022, 3, 146–157. Available online: https://www.theijire.com/archiver/archives/recycling_of_micro_plastic_and_its_industrial_applications.pdf?v=1748003592 (accessed on 10 March 2025).
- European Commission: Directorate-General for Environment; Bougas, K.; Corden, C.; Crookes, M.; Federici, G.; Fisk, P. Scientific and Technical Support for the Development of Criteria to Identify and Group Polymers for Registration/Evaluation Under REACH and Their Impact Assessment: Final Report; Publications Office of the European Union: Brussels, Belgium, 2020; pp. 1–352. [Google Scholar] [CrossRef]
- Rosca, C.M.; Popescu, M.; Patrascioiu, C.; Stancu, A. Comparative Analysis of pH Level Between Pasteurized and UTH Milk Using Dedicated Developed Application. Rev. Chim. 2019, 70, 3917–3920. [Google Scholar] [CrossRef]
- Lahl, U.; Zeschmar-Lahl, B. Material Recycling of Plastics—A Challenge for Sustainability. Sustainability 2024, 16, 6630. [Google Scholar] [CrossRef]
- Muringayil Joseph, T.; Azat, S.; Ahmadi, Z.; Moini Jazani, O.; Esmaeili, A.; Kianfar, E.; Haponiuk, J.; Thomas, S. Polyethylene terephthalate (PET) recycling: A review. Case Stud. Chem. Environ. Eng. 2024, 9, 100673. [Google Scholar] [CrossRef]
- Brivio, L.; Tollini, F. PET recycling: Review of the current available technologies and industrial perspectives. In Advances in Chemical Engineering; Moscatelli, D., Pelucchi, M., Eds.; Academic Press: Cambridge, MA, USA, 2022; Volume 60, pp. 215–267. [Google Scholar] [CrossRef]
- Popescu, C.; Gabor, M.R.; Stancu, A. Predictors for Green Energy vs. Fossil Fuels: The Case of Industrial Waste and Biogases in European Union Context. Agronomy 2024, 14, 1459. [Google Scholar] [CrossRef]
- Lu, Y.; Pei, W.; Peng, K. State of the art of automatic disassembly of WEEE and perspective towards intelligent recycling in the era of Industry 4.0. Int. J. Adv. Manuf. Technol. 2023, 128, 2825–2843. [Google Scholar] [CrossRef]
- Lubongo, C.; Bin Daej, M.A.A.; Alexandridis, P. Automated sorting technology for plastic waste. In Reuse of Plastic Waste in Eco-Efficient Concrete; Pacheco-Torgal, F., Khatib, J., Colangelo, F., Tuladhar, R., Eds.; Woodhead Publishing: Cambridge, UK, 2024; pp. 13–35. [Google Scholar] [CrossRef]
- Lubongo, C.; Bin Daej, M.A.A.; Alexandridis, P. Recent Developments in Technology for Sorting Plastic for Recycling: The Emergence of Artificial Intelligence and the Rise of the Robots. Recycling 2024, 9, 59. [Google Scholar] [CrossRef]
- Jha, K.K.; Kannan, T.T.M. Recycling of plastic waste into fuel by pyrolysis—A review. Mater. Today Proc. 2021, 37, 3718–3720. [Google Scholar] [CrossRef]
- Nain, V.; Shyam, H.S.; Gupta, D.; Singh, S. Efficient Plastic Waste Recycling Using Polymer. Macromol. Symp. 2024, 413, 2300091. [Google Scholar] [CrossRef]
- Dai, L.; Karakas, O.; Cheng, Y.; Cobb, K.; Chen, P.; Ruan, R. A review on carbon materials production from plastic wastes. Chem. Eng. J. 2023, 453, 139725. [Google Scholar] [CrossRef]
- Mong, G.R.; Tan, H.; Chin Vui Sheng, D.D.; Kek, H.Y.; Nyakuma, B.B.; Woon, K.S.; Othman, M.H.D.; Kang, H.S.; Goh, P.S.; Wong, K.Y. A review on plastic waste valorisation to advanced materials: Solutions and technologies to curb plastic waste pollution. J. Clean. Prod. 2024, 434, 140180. [Google Scholar] [CrossRef]
- Kartik, S.; Balsora, H.K.; Sharma, M.; Saptoro, A.; Jain, R.K.; Joshi, J.B.; Sharma, A. Valorization of plastic wastes for production of fuels and value-added chemicals through pyrolysis—A review. Therm. Sci. Eng. Prog. 2022, 32, 101316. [Google Scholar] [CrossRef]
- Popescu, C.; Dissanayake, H.; Mansi, E.; Stancu, A. Eco Breakthroughs: Sustainable Materials Transforming the Future of Our Planet. Sustainability 2024, 16, 10790. [Google Scholar] [CrossRef]
- Rosca, C.-M.; Stancu, A.; Tănase, M.R. A Comparative Study of Azure Custom Vision Versus Google Vision API Integrated into AI Custom Models Using Object Classification for Residential Waste. Appl. Sci. 2025, 15, 3869. [Google Scholar] [CrossRef]
- Undas, A.K.; Groenen, M.; Peters, R.J.B.; van Leeuwen, S.P.J. Safety of recycled plastics and textiles: Review on the detection, identification and safety assessment of contaminants. Chemosphere 2023, 312, 137175. [Google Scholar] [CrossRef]
- Shamsuyeva, M.; Endres, H.J. Plastics in the context of the circular economy and sustainable plastics recycling: Comprehensive review on research development, standardization and market. Compos. Part C Open Access 2021, 6, 100168. [Google Scholar] [CrossRef]
- Pomeroy, R.S. Rethinking plastics. In Rethinking Polyester Polyurethanes: Algae Based Renewable, Sustainable, Biodegradable and Recyclable Materials, 1st ed.; Pomeroy, R.S., Ed.; Elsevier: Oxford, UK, 2023; pp. 3–26. [Google Scholar] [CrossRef]
- Kubiczek, J.; Derej, W.; Hadasik, B.; Matuszewska, A. Chemical recycling of plastic waste as a mean to implement the circular economy model in the European Union. J. Clean. Prod. 2023, 406, 136951. [Google Scholar] [CrossRef]
- Nazemi, F.; Fath, B.D.; Bakshi, B.R. Ecologically inspired metrics for transitioning to a sustainable and resilient circular economy with application to multilayer plastic films. Sustain. Prod. Consum. 2024, 49, 606–624. [Google Scholar] [CrossRef]
- Arijeniwa, V.F.; Akinsemolu, A.A.; Chukwugozie, D.C.; Onawo, U.G.; Ochulor, C.E.; Nwauzoma, U.M.; Kawino, D.A.; Onyeaka, H. Closing the loop: A framework for tackling single-use plastic waste in the food and beverage industry through circular economy- a review. J. Environ. Manag. 2024, 359, 120816. [Google Scholar] [CrossRef]
- Majzoub, W.N.; Al-Mohannadi, D.M. Evaluating Circularity and Sustainability in Plastic Waste Recycling: Open and Closed-Loop Technologies. Syst. Control Trans. 2024, 3, 792–798. [Google Scholar] [CrossRef]
- Cruz Sanchez, F.A.; Boudaoud, H.; Camargo, M.; Pearce, J.M. Plastic recycling in additive manufacturing: A systematic literature review and opportunities for the circular economy. J. Clean. Prod. 2020, 264, 121602. [Google Scholar] [CrossRef]
- Howard, I.A.; Busko, D.; Gao, G.; Wendler, P.; Madirov, E.; Turshatov, A.; Moesslein, J.; Richards, B.S. Sorting plastics waste for a circular economy: Perspectives for lanthanide luminescent markers. Resour. Conserv. Recycl. 2024, 205, 107557. [Google Scholar] [CrossRef]
- Rosca, C.-M.; Stancu, A. Earthquake Prediction and Alert System Using IoT Infrastructure and Cloud-Based Environmental Data Analysis. Appl. Sci. 2024, 14, 10169. [Google Scholar] [CrossRef]
- Rosca, C.-M.; Stancu, A.; Popescu, M. The Impact of Cloud Versus Local Infrastructure on Automatic IoT-Driven Hydroponic Systems. Appl. Sci. 2025, 15, 4016. [Google Scholar] [CrossRef]
- Cui, C.; Tang, J.; Qiao, J.; Wang, Z.; Sun, Z. Review of Waste Plastic Bottle Recycling Equipment Research Status. In Proceedings of the 39th Chinese Control Conference, Shenyang, China, 27–29 July 2020; pp. 1190–1195. [Google Scholar] [CrossRef]
- Rianmora, S.; Punsawat, P.; Yutisayanuwat, C.; Tongtan, Y. Design for an Intelligent Waste Classifying System: A Case Study of Plastic Bottles. IEEE Access 2023, 11, 47619. [Google Scholar] [CrossRef]
- Fan, H.; Dong, Q.; Guo, N.; Xue, J.; Zhang, R.; Wang, H.; Shi, M. Raspberry Pi-based design of intelligent household classified garbage bin. Internet Things 2023, 24, 100987. [Google Scholar] [CrossRef]
- Raja Suleiman, R.F.; Zulkarnain, A.S.N.; Bahurdin, M.M. Color-Based Plastic Bottle Cap Sorter Using ESP8266. In Advances in Technology Transfer Through IoT and IT Solutions. SpringerBriefs in Applied Sciences and Technology; Ismail, A., Zulkipli, F.N., Awang Long, Z., Öchsner, A., Eds.; Springer: Cham, Switzerland, 2023; pp. 19–29. [Google Scholar] [CrossRef]
- Liu, Y.; Sun, S. Development of a Robot System for Sorting Polymer-Based Recycling. In Proceedings of the IEEE International Conference on Industrial Technology, Bristol, UK, 25–27 March 2024; pp. 1–10. [Google Scholar] [CrossRef]
- Pimenov, A.; Nesteruk, S.; Mazanov, G.; Ilyushina, A.; Stepanov, A.; Mikhailova, N.; Somov, A. Machine Vision for Solid Waste Detection. In Scanning Technologies for Autonomous Systems; Rodríguez-Quiñonez, J.C., Flores-Fuentes, W., Castro-Toscano, M.J., Sergiyenko, O., Eds.; Springer: Cham, Switzerland, 2024; pp. 343–403. [Google Scholar] [CrossRef]
- Adarsh, U.K.; Unnikrishnan, V.K. A multiparameter sensing spectroscopic system for remote plastic sorting with a single laser shot: A first information report. Opt. Laser Technol. 2024, 177, 111194. [Google Scholar] [CrossRef]
- Juansah; Ramdhani, M.; Rahmawati, D. Integration of a Reverse Vending Machine Sensing System in Sorting and Detecting Plastic Bottle Waste. In Proceedings of the 4th International Conference on Electronics, Biomedical Engineering, and Health Informatics, Surabaya, Indonesia, 4–5 October 2023; Lecture Notes in Electrical Engineering. Volume 1182, pp. 409–426. [Google Scholar] [CrossRef]
- Khadke, S.; Gupta, P.; Rachakunta, S.; Mahata, C.; Dawn, S.; Sharma, M.; Verma, D.; Pradhan, A.; Krishna, A.M.S.; Ramakrishna, S.; et al. Efficient Plastic Recycling and Remolding Circular Economy Using the Technology of Trust–Blockchain. Sustainability 2021, 13, 9142. [Google Scholar] [CrossRef]
- Gong, Y.; Wang, Y.; Frei, R.; Wang, B.; Zhao, C. Blockchain application in circular marine plastic debris management. Ind. Mark. Manag. 2022, 102, 164–176. [Google Scholar] [CrossRef]
- Patricia, G.; Muslim, E. Plastic Packaging Waste Management through Filling Machine with Agile Reengineering Project Management Approach. J. Eng. Manag. Ind. Syst. 2023, 11, 84–96. [Google Scholar] [CrossRef]
- Tachwali, Y.; Al-Assaf, Y.; Al-Ali, A.R. Automatic multistage classification system for plastic bottles recycling. Resour. Conserv. Recycl. 2007, 52, 266–285. [Google Scholar] [CrossRef]
- Kroell, N.; Chen, X.; Küppers, B.; Schlögl, S.; Feil, A.; Greiff, K. Near-infrared-based quality control of plastic pre-concentrates in lightweight-packaging waste sorting plants. Resour. Conserv. Recycl. 2024, 201, 107256. [Google Scholar] [CrossRef]
- Zou, H.H.; He, P.J.; Peng, W.; Lan, D.Y.; Xian, H.Y.; Lü, F.; Zhang, H. Rapid detection of colored and colorless macro- and micro-plastics in complex environment via near-infrared spectroscopy and machine learning. J. Environ. Sci. 2025, 147, 512–522. [Google Scholar] [CrossRef] [PubMed]
- Bhuvanesh, N.; Kumaresan, G.; Rajasekaran, S.; Adish, N.K.; Saravanan, K.; Subramaniyan, C. Experimental modelling and analysis of semi-automated waste black plastic materials sorter. Mater. Today Proc. 2021, 45, 2029–2033. [Google Scholar] [CrossRef]
- Rosca, C.-M.; Stancu, A.; Neculaiu, C.-F.; Gortoescu, I.-A. Designing and Implementing a Public Urban Transport Scheduling System Based on Artificial Intelligence for Smart Cities. Appl. Sci. 2024, 14, 8861. [Google Scholar] [CrossRef]
- Yaddanapudi, S.D.; Makala, B.P.; Yarlagadda, A.; Sapram, C.T.; Parsa, S.T.; Nallamadugu, S. Collection of plastic bottles by reverse vending machine using object detection technique. Mater. Today Proc. 2023, 80, 1995–1999. [Google Scholar] [CrossRef]
- Otero, P.; Gago, J.; Quintas, P. Twitter data analysis to assess the interest of citizens on the impact of marine plastic pollution. Mar. Pollut. Bull. 2021, 170, 112620. [Google Scholar] [CrossRef]
- Jakobs, M.; Kroell, N. Influence of plastic packaging design on the sensor-based sortability in lightweight packaging waste sorting plants. Resour. Conserv. Recycl. 2024, 207, 107599. [Google Scholar] [CrossRef]
- Echeverry, A.P.; López, C.F. AUTORECYCLER: Prototype based on artificial vision to automate the material classification process (Plastic, Glass, Cardboard and Metal). HardwareX 2024, 19, e00575. [Google Scholar] [CrossRef] [PubMed]
- Shukhratov, I.; Pimenov, A.; Stepanov, A.; Mikhailova, N.; Baldycheva, A.; Somov, A. Optical detection of plastic waste through computer vision. Intell. Syst. Appl. 2024, 22, 200341. [Google Scholar] [CrossRef]
- Rosca, C.-M. New Algorithm to Prevent Online Test Fraud Based on Cognitive Services and Input Devices Events. In Proceedings of Third Emerging Trends and Technologies on Intelligent Systems. ETTIS 2023. Lecture Notes in Networks and Systems; Noor, A., Saroha, K., Pricop, E., Sen, A., Trivedi, G., Eds.; Springer Nature: Singapore, 2023; Volume 730, pp. 207–219. [Google Scholar] [CrossRef]
- Pučnik, R.; Dokl, M.; Fan, Y.V.; Vujanović, A.; Novak Pintarič, Z.; Aviso, K.B.; Tan, R.R.; Pahor, B.; Kravanja, Z.; Čuček, L. A waste separation system based on sensor technology and deep learning: A simple approach applied to a case study of plastic packaging waste. J. Clean. Prod. 2024, 450, 141762. [Google Scholar] [CrossRef]
- Aschenbrenner, D.; Gros, J.; Fangerow, N.; Werner, T.; Colloseus, C.; Taha, I. Recyclebot–Using robots for sustainable plastic recycling. Procedia CIRP 2023, 116, 275–280. [Google Scholar] [CrossRef]
- Liang, Q.; Zhu, W.; Sun, W.; Yu, Z.; Wang, Y.; Zhang, D. In-line inspection solution for codes on complex backgrounds for the plastic container industry. Measurement 2019, 148, 106965. [Google Scholar] [CrossRef]
- Konstantinidis, F.K.; Sifnaios, S.; Arvanitakis, G.; Tsimiklis, G.; Mouroutsos, S.G.; Amditis, A.; Gasteratos, A. Multi-modal sorting in plastic and wood waste streams. Resour. Conserv. Recycl. 2023, 199, 107244. [Google Scholar] [CrossRef]
- Ji, T.; Fang, H.; Zhang, R.; Yang, J.; Fan, L.; Hu, Y.; Cai, Z. Low-value recyclable waste identification based on NIR feature analysis and RGB-NIR fusion. Infrared Phys. Technol. 2023, 131, 104693. [Google Scholar] [CrossRef]
- Ge, Y.; Li, Z.; Yue, X.; Li, H.; Li, Q.; Meng, L. IoT-based automatic deep learning model generation and the application on Empty-dish Recycling Robots. Internet Things 2024, 25, 101047. [Google Scholar] [CrossRef]
- Yan, Y.; Ni, L.; Sun, L.; Wang, Y.; Zhou, J. Digital Twin Enabling Technologies for Advancing Road Engineering and Lifecycle Applications. Engineering 2025, 44, 184–206. [Google Scholar] [CrossRef]
- Rosca, C.-M.; Rădulescu, G.; Stancu, A. Artificial Intelligence of Things Infrastructure for Quality Control in Cast Manufacturing Environments Shedding Light on Industry Changes. Appl. Sci. 2025, 15, 2068. [Google Scholar] [CrossRef]
- Papatheodorou, N.; Hatzivasilis, G.; Papadakis, N. The YouGovern Secure Blockchain-Based Self-Sovereign Identity (SSI) Management and Access Control. Appl. Sci. 2025, 15, 6437. [Google Scholar] [CrossRef]
- Hasan, A.S.M.T.; Haque, R.U.; Wigger, L.; Vatterott, A. Trusted Traceability Service: A Novel Approach to Securing Supply Chains. Electronics 2025, 14, 1985. [Google Scholar] [CrossRef]
- Regueiro, C.; De Diego, S.; Urkizu, B. Leveraging Blockchain Technology for Secure 5G Offloading Processes. Future Internet 2025, 17, 197. [Google Scholar] [CrossRef]
Disclaimer/Publisher’s Note: The statements, opinions and data contained in all publications are solely those of the individual author(s) and contributor(s) and not of MDPI and/or the editor(s). MDPI and/or the editor(s) disclaim responsibility for any injury to people or property resulting from any ideas, methods, instructions or products referred to in the content. |
© 2025 by the authors. Licensee MDPI, Basel, Switzerland. This article is an open access article distributed under the terms and conditions of the Creative Commons Attribution (CC BY) license (https://creativecommons.org/licenses/by/4.0/).