Article

Analysis of Cascading Failures and Recovery in Freeway Network Under the Impact of Incidents

School of Traffic and Transportation Engineering, Central South University, Changsha 410075, China
*
Author to whom correspondence should be addressed.
Appl. Sci. 2025, 15(13), 7276; https://doi.org/10.3390/app15137276
Submission received: 12 May 2025 / Revised: 12 June 2025 / Accepted: 24 June 2025 / Published: 27 June 2025

Abstract

In the past few decades, extensive research has been conducted on the modeling of cascading failures and their recovery processes in freeway networks. In practice, the restoration of functionality and structure in complex networks that suffer large-scale cascading failures may involve a series of repair operations. In this paper, we first propose a cascading failure model for freeway networks, which considers load redistribution by taking travelers’ choice behavior into account. Specifically, we use the Stochastic User Equilibrium (SUE) as a method for redistribution in the model. Next, we propose a recovery strategy focused on critical edges, with their importance ranked through the integration of the network’s topological features and traffic characteristics. This ranking then serves as the foundation for the edge-recovery process. This model considers the operational mechanisms of complex freeway networks. In the experiment, we used the freeway network in Hunan Province as a case study to validate the effectiveness of our model. Traffic volume data were collected from toll stations on the freeway network, and the topological structure of the network was combined with these data to construct a complex weighted freeway network. The evolution of network cascading failures was analyzed under various scenarios of attacks caused by traffic incidents. Subsequently, the failed network was recovered, and the results indicate that the proposed recovery strategy demonstrates better performance compared to other traditional methods. This research provides theoretical and methodological support for the management of freeway networks.

1. Introduction

Over the past few decades, transportation systems have become some of the most essential components of modern infrastructure, evolving into highly complex and interconnected networks. Owing to the intricate interdependence among their various components, the failure of even a small subset of elements can initiate a cascading process that propagates throughout the system. This phenomenon, referred to as cascading failures [1], can severely compromise the stability and reliability of the entire traffic network. Over recent decades, research on cascading failures and their implications for transportation networks has increased significantly, highlighting the importance and complexity of this field [2,3,4,5,6,7].
The development of an accurate cascading failure model is essential for exploring cascading failure phenomena in traffic networks and proposing effective protective strategies. Common cascading failure models include the Branching Process Model [8], the Percolation Model [9], and the Load Redistribution Model [10]. The Load Redistribution Model can effectively capture the load variations and capacity constraints of nodes and edges within a transportation network [11]. However, previous research on load distribution methods has emphasized the characteristics of nodes, often overlooking the attributes of edges, such as capacity and length [12]. Moreover, travelers make decisions based on the game behavior of independent path choices, determining user equilibrium and system optimum [10]. Therefore, when redistributing loads, it is essential to account for route choice variations stemming from travelers’ random perceptions and risk preferences. Based on the above research, this paper aims to improve the cascading failure model applied to traffic networks to accurately characterize the role of edges in load distribution and to consider travelers’ route choice behavior.
Although significant efforts have been devoted to the prevention and mitigation of cascading failures in traffic networks, it is not possible to completely eliminate this catastrophic process [13]. To address this issue, various models have been developed to simulate the recovery process following cascading failures. After a cascading failure, the remaining network typically contains multiple failed components. Given the extensive coverage of real-world transportation networks and resource limitations, it may be necessary to repair and reintegrate network components individually [14]. The recovery of a single node or edge may cause disturbances to other components, potentially leading to new cascading failures. In this situation, modeling the recovery process as a series of interdependent processes can better illustrate the dynamic nature of system recovery [13].
Recent advancements in transport resilience research have been significantly driven by the integration of intelligent infrastructure, machine learning methodologies, and adaptive systems [15,16,17]. Intelligent infrastructure enables real-time monitoring and dynamic responses to network disruptions, while machine learning approaches provide powerful tools for analyzing large-scale transportation data, predicting network vulnerabilities, and optimizing recovery strategies [15,16]. Furthermore, adaptive systems have been developed to dynamically adjust recovery processes in response to changing network conditions and traveler behaviors [17]. However, despite these advances, a gap remains in the literature regarding the comprehensive integration of edge attributes, route choice behavior, and intelligent recovery mechanisms in cascading failure analysis and restoration. Therefore, this paper aims to develop a sequential recovery model that considers the characteristics of network edges and traveler behavior, thereby improving the recovery process after cascading failures.
Motivated by the above studies, the objective of this paper is to improve the cascading failure model to explore how edge characteristics and route choice behavior may affect the traffic network. Additionally, it aims to propose a sequential recovery model to restore the network after a cascading failure. The research framework encompasses the development of the methodology, the experimental design, and the evaluation of network performance. The primary contributions of this work are summarized as follows:
(1)
Cascading Failure Model: An edge-based cascading failure model is developed to simulate failure propagation in transportation networks, explicitly incorporating realistic route choice behavior in freeway systems. We conduct simulations for a specific freeway network to observe the changes in network performance during the cascade process.
(2)
Identification and Ranking of Critical Edges: We propose a method to identify and rank important edges within the network. The proposed method aims to identify critical edge combinations and prioritize their recovery sequence to enhance overall network performance during restoration.
(3)
Recovery Strategy: Based on the identified critical edges, a targeted recovery strategy is developed. Simulations conducted on a real-world freeway network dataset show that the proposed strategy significantly outperforms existing benchmark methods in terms of recovery efficiency.
The main innovations of this research are as follows: (1) the development of a cascading failure model that integrates travelers’ route choice behavior using SUE; (2) the proposal of an effective edge-recovery strategy by ranking and prioritizing critical edges based on combined topological and traffic features; and (3) the validation of the methodology using empirical data from a real-world freeway network under multiple failure scenarios.
The remainder of this paper is organized as follows. Section 2 reviews related work from existing studies. Section 3 details the proposed cascading failure model, defines critical edges, and presents the recovery strategy. Section 4 provides a case study based on the freeway network of Hunan Province to validate the model. Section 5 concludes the paper and discusses potential applications.

2. Literature Review

2.1. Cascading Failure

A cascading failure refers to a phenomenon in which the failure of one or more components initiates a sequence of subsequent failures in other interconnected components, ultimately leading to widespread disruption of the entire system [1,18]. Compared to other network phenomena that occur following an attack, cascading failures emphasize the continuous and dynamic propagation of disruptions, thereby providing a more accurate reflection of the network’s actual performance. This phenomenon was initially investigated in transmission systems responsible for handling different types of flows, such as power grids [19,20] and communication networks [21].
Various models have been proposed to study the mechanisms of cascading failures in networks, including the Sandpile model [22] and the OPA model [23]. The Motter–Lai model [10], one of the most commonly adopted frameworks, posits a linear dependence between a node’s capacity and its initial load within the network. When a node in the network is attacked and fails, it must be removed, and its load redistributed. The Motter–Lai model must address three fundamental issues: defining the initial load on components, defining the capacity of components, and determining the strategy for load redistribution after component failure. Based on whether the components considered are nodes or edges, the models can be classified into three categories: (1) Node Dynamics Models [24]; (2) Edge Dynamics Models [25]; and (3) Hybrid Dynamics Models of Nodes and Edges [26].
Many scholars have explored the phenomenon of cascading failures in real-world networks, revealing numerous valuable insights. Previous studies indicate that the cascading overload process is inherently complex [27]. First, the topology of the network determines the connectivity between nodes and the paths of information propagation. Secondly, the physical attributes of nodes and edges, such as node capacity and edge constraints, determine the network’s ability to withstand high loads. Additionally, in man-made networks, load-distribution characteristics like time-varying traffic and abnormal traffic models can impact network stability and the conditions that trigger cascading failures. Therefore, developing a cascading failure model for real networks requires a comprehensive consideration of these characteristics to accurately reflect the cascading phenomena within the network.
To accurately capture cascading failures in real-world traffic networks, models must integrate network topology, component attributes, and realistic behavioral dynamics. However, most existing approaches do not fully consider these aspects. Addressing this gap is essential for advancing cascading failure modeling in transportation systems.

2.2. Recovery Strategy

The network recovery mechanism focuses on strategies to repair failed components following a network failure and restore normal network functions as quickly as possible [14]. This is essential for ensuring the continuous operation of critical network infrastructure. The network recovery mechanism can be classified into two types: spontaneous recovery and targeted recovery [14]. Spontaneous recovery is characterized by each node or link in the network having the ability to return to normal working conditions after a failure through local decision-making and independent repair. However, spontaneous recovery lacks specificity, leading to lower network-recovery efficiency. Targeted recovery aims to efficiently restore the overall structure and functionality of the network. This approach involves prioritizing failed network components based on a specific strategy and then restoring them in sequence. By taking a global view of the network and allocating resources for prioritized restoration, directed recovery achieves higher efficiency.
In their investigation of recovery strategies based on the Motter–Lai model, G. Cwilich and S. V. Buldyrev simulated traffic networks constructed from two-dimensional Random Geometric Graphs (RGGs) to examine how localized disruptions—such as the closure of specific road segments—can trigger cascading congestion throughout the network [28]. Building on this foundation, A. Perez et al. extended the Motter–Lai model to encompass various spatial network structures, including isotropic and anisotropic topologies, and systematically explored the critical conditions under which localized overloads escalate into large-scale cascading failures, as well as the spatiotemporal characteristics of their propagation [29]. However, real-time monitoring and adjustment of load distribution require substantial computational power, leading to high costs in practical applications. It is essential to explore repair mechanisms based on network characteristics and evaluate the impact of various factors on recovery propagation.
Although previous studies have examined various recovery strategies, most approaches overlook the operational complexity and heterogeneity of real transportation networks. They rarely incorporate real-time traffic data or behavioral aspects such as route choice, limiting their ability to design effective and adaptive recovery plans. Therefore, there is a pressing need for recovery strategies that better reflect actual network dynamics, resource constraints, and the practical challenges of post-failure restoration.

2.3. Cascading Failure of Transportation Networks

Due to the complexity of their internal topological structure, traffic networks have been proven to exhibit complex network characteristics [30,31]. These structural properties make the system inherently vulnerable to localized disruptions. Road traffic incidents, which have increased significantly with the rapid expansion of freeway infrastructure [32,33,34], are not randomly distributed, but tend to cluster in specific spatial areas, exhibiting significant spatial dependence [35]. When components of the traffic network are damaged, the failure of nodes and edges can redistribute and amplify the traffic load to neighboring components. This process often triggers cascading failures that further propagate through the network, ultimately disrupting transportation functionality on a larger scale [36].
Gao and Shen et al. improved the cascading failure model to closely match real traffic conditions, illustrating the fault propagation process in traffic networks [2,3]. Yin et al. proposed a trust value model to assess road congestion, which was then used as a basis for reallocating the load of congested intersections [4]. Zhang et al. investigated cascading failures in dynamic urban rail transit networks under various passenger-flow fluctuation fault modes. Several studies have identified critical nodes or links and quantified influencing factors through the analysis of these cascading failures [5]. In addition, extreme weather significantly increases the probability of traffic incidents. Ma et al. [37] and Wu et al. [38] conducted separate studies under extreme weather conditions, both revealing the spatiotemporal evolution patterns of cascading failures in transportation networks. Jin et al. [39] further considered fluctuations in passenger demand and response delays, investigating the dynamic evolution of cascading failures in urban rail transit systems. However, existing research does not sufficiently address route choice behavior in traffic networks within the cascading failure framework, potentially leading to inaccurate assessments of traffic network performance.
In the study of traffic network recovery strategies, some research focuses on reducing the extent of failure diffusion and mitigating the adverse effects of cascading failures once they occur. Wang et al. proposed four mitigation strategies to promptly protect critical nodes during the propagation of cascading failures [40]. Smolyak et al. used the method of protecting critical nodes to prevent the propagation of cascading failures [41]. The above strategies help to control and mitigate cascading failures, but do not restore the damaged network. With regard to the study of restoring damaged components and functions, Hu et al. proposed a prioritized recovery method that focuses on restoring the functions of components with the most connections to isolated nodes [42]. Lyu et al. established a cascading failure model for multilayer networks and proposed a recovery strategy that considers the recovery probability of failure clusters [43]. In reality, during the process of cascading recovery, failures and recoveries may occur within the same time step. Components that have been restored may fail again at each time step until the network reaches a stable state. Additionally, the priority of component restoration also affects the efficiency of the recovery process. Currently, there is still a lack of research on the combination of dynamic load fluctuations and restoration sequences.
While recent research has advanced the modeling of cascading failures in transportation networks, important gaps persist in understanding and evaluation. Most existing models do not adequately address the effects of dynamic load fluctuations and realistic traveler route choice on the propagation of failures. In addition, current evaluation methods often ignore how restoration sequences interact with changing network conditions. More comprehensive models are required that can simulate cascading failures under dynamic traffic patterns and route choice to enable a more accurate assessment of network vulnerability and resilience.
Motivated by the aforementioned studies, this research constructs a network based on a real freeway system, improves the Motter–Lai model to simulate cascading failures in traffic networks, and proposes a recovery model based on critical edges.

3. Methodology

The overall research framework of this paper is shown in Figure 1. Three steps are involved: First, a freeway network is built and OD data on traffic flow are collected. Second, we propose a method to identify and rank important edges within the network. This method focuses on identifying and ranking critical edge combinations, thereby enhancing performance during the recovery process. Third, we design a recovery strategy based on the method of identifying critical edges. Simulation results based on a specific freeway network dataset demonstrate that the proposed recovery strategy outperforms other base strategies.

3.1. Network Representation

The structure of the freeway network constitutes the fundamental basis of this study. From the perspective of graph theory, applying suitable principles for topological modeling is vital for examining the characteristics of real freeway systems. A freeway network is made up of toll stations or interchanges and the connecting links, where toll stations act as the exclusive access and exit points for vehicles. In general, the physical layout of bidirectional freeway lanes tends to lack symmetry and is not always clearly defined. As a result, the primal representation approach is adopted in this research as an appropriate method for modeling the topological structure of freeway networks [20].
Thus, the freeway network can be generalized and abstracted as a directed graph G = V , E , W . Here, V = v i | i = 1,2 , 3 , , n represents the set of nodes, corresponding to toll stations or interchanges. E = v i , v j | v i , v j V ,   i j denotes the set of edges, which can be represented by two directly connected stations. W = w i j | w i j = c i j , v i , v j V ,   i j ,   v i , v j E   represents the set of edge costs, where c i j is calculated using the Bureau of Public Road (BPR) function, based on the traffic flow and capacity of the link between node i and j . This framework serves as the foundation for the implementation of traffic assignment, and will be introduced in detail in Section 3.2.

3.2. Modeling the Cascading Failures of the Freeway Network

Cascading failure refers to the process whereby the failure of a particular road segment or node, triggered by a traffic incident, leads to the redistribution of traffic flows across the network [11]. From the perspective of road capacity and operational management, this study defines freeway traffic incidents as events such as traffic crashes and temporary road maintenance that result in the temporary closure of specific road segments and a sudden reduction in their capacity. In the study of cascading failures in transportation networks, real-world traffic incidents are often modeled from a network science perspective and are regarded as “attacks” within the network. Specifically, these incidents manifest as the failure of edges or a reduction in their capacities.
When the network is attacked (as indicated by the black dashed line in Figure 2), it repeatedly suffers from the following: (1) the spread of failures triggered by overload conditions, as represented by the red links in Figure 2; (2) dynamic changes in the travel cost function, which impact both red and gray links; and (3) adjustments in route selection based on origin–destination (OD) travel demand. This process continues until the network reaches a new stable state. In the cascading failure model that we have developed for a freeway network, we used SUE as the model to describe travelers’ route choices. The details will be outlined for the following four aspects: the initial load, the edge capacity, the principle of load redistribution, and the process of cascading failures.

3.2.1. Preliminaries

In this section, we first define the fundamental concepts necessary to understand the simulation of cascading failures in a network. Cascading failures occur when an initial disruption in a network propagates, leading to a sequence of failures that can compromise the network’s overall functionality. To model and analyze such events, we first define three fundamental concepts: initial edge load definition, edge capacity, and edge state.
Initial Edge Load Definition: Before the cascading process, a traffic assignment method is employed to distribute travel demand across the road network, establishing the initial load on the roads [12]. We calculate the flow of each path based on the stochastic user equilibrium rule. The initial flow on a road segment is determined by summing the path flows that pass through it. The initial load on the network L a 0 is expressed as
  L a 0 = i , j N f i j · δ a i j
where f i j represents the path flow from i to j , expressed as the sum of flows distributed across multiple possible paths. δ a i j indicates whether the path from i to j passes through segment a . If the path passes through segment k , then δ a i j = 1 ; otherwise, δ a i j = 0 .
Edge Capacity: The road capacity refers to the maximum number of vehicles that can reasonably pass through a lane or road within a given unit of time. The actual capacity of a road is dynamic and varies based on the specific characteristics of time and space. The base capacity, on the other hand, denotes the capacity of a road under ideal road and traffic conditions. Given the challenges in observing the actual road capacity during real-world operations, the base capacity is used as the maximum capacity of the road.
The capacity drop phenomenon is caused by various factors, including road infrastructure, traffic flow, weather conditions, and management measures. To simulate the cascading failure process under different capacities, we can introduce a capacity reduction factor γ that adjusts the effective capacity of each road section based on a specific parameter. Specifically, γ is a coefficient ranging from 0 to 1 that comprehensively accounts for the impacts of traffic accidents, adverse weather conditions, and abnormal traffic flow on road capacity. This approach enables us to examine how different levels of reduced capacity affect the network’s performance and the propagation of failures. The effective capacity C a of a road section can be defined as a function of the base capacity C m a x and the capacity reduction factor γ .
The capacity reduction factor γ can be defined as a function of the base capacity C m a x and the reduction factor γ . The formula for the effective capacity C a of a road section a is given by
C a = γ × C m a x a
where C m a x a is the maximum capacity of the road section a . When γ = 0 , it means the road has completely lost its capacity, for example, due to severe accidents or complete closure. When γ = 1 , the road operates at full capacity. When 0 < γ < 1 , it indicates that the road capacity is partially restricted, lying between completely unobstructed and fully blocked, reflecting the degree of capacity reduction caused by real-world factors. By adjusting the value of γ , the model can flexibly simulate the impact of different levels of capacity reduction on network performance and the cascading failure propagation process.
Edge State: During the cascading process, the state of the edges in the network is a critical factor in determining the overall resilience and stability of the network. We need to clearly define the state of the edges to accurately model and analyze the network. In this section, edge states are defined as either normal or failed. A “normal” edge refers to one that functions properly, with the traffic volume D a t ^ below its maximum capacity C a . A “failed” edge occurs when the load on the edge exceeds its capacity C a . This section assumes that edges that fail in subsequent time steps are unrecoverable. Therefore, the state of a road a at time step t can be expressed as follows:
s a t = 1 ,         i f   D a t ^ C a 0 ,         i f   D a t ^ > C a
where t ^ refers to a previous time step before the current time step t . It is used to assess whether the traffic volume D a t ^ on road I has exceeded its capacity C a in the last step, which then determines the current state s a t of the road.
In the simulation of cascading failures, when a road segment fails, its impedance is adjusted to infinity. The segment is not deleted, but travelers will avoid this segment when choosing their travel paths.

3.2.2. Load Redistribution

To better integrate complex network theory with transportation systems, this section introduces the traffic flow assignment method under cascading failures.
The route choice behavior of travelers can be described using a probabilistic model. The Logit stochastic path choice model is a widely adopted assignment approach that reflects drivers’ preferences for routes they subjectively perceive to have the lowest impedance, denoted as C k i j . Assuming that the minimum impedance of the path between the origin and destination is represented by k , the value of C k i j can be calculated using Equation (4), and C k i j represents the actual impedance of the path, while λ k r s denotes the difference between subjective perception and actual path impedance ( λ k i j represents the random error component, E λ k i j = 0 ).
C k i j = c k i j + λ k i j   k , i , j
The traditional Logit model calculates path choice probabilities under the assumption that each path is independent, primarily based on the total cost of each path. This assumption ignores the overlapping portions of the paths, which may lead to excessive allocation of traffic to these overlapping paths. This means that although certain paths share many of the same segments, the model does not adjust the choice probabilities of these paths to reflect their actual similarity, which does not align with real-world traveler behavior. Consequently, this allocation algorithm may excessively assign traffic flow to overlapping paths, indicating that it is insensitive to the network structure and potentially resulting in more severe consequences. Therefore, during the cascading failure process, we use the C-Logit model: by introducing a path overlap correction factor, we adjust the path choice probabilities to reflect the actual similarity between paths.
The C-Logit model introduces a path overlap correction factor (C-factor) to reduce the choice probabilities of overlapping paths. This correction factor reflects the degree of overlap between paths, making the choice probabilities of paths with more overlapping segments relatively lower. The path choice probability in the model is as follows:
p i j k = e x p [ θ c i j k + λ l n S k l P i j e x p [ θ c i j l + λ l n S l
where S k is the path size factor for path k , reflecting the relative length and overlap of the path, and λ is an adjustment parameter used to control the influence of the correction factor.
S k = a k l a L k 1 j C δ a j
where l a denotes the length of edge a , and L k denotes the length of path k . The term j C δ a j represents the number of paths containing the edge a .
During cascading failures, the travel time on unaffected road segments is influenced by both their capacity C a and the corresponding flow demand D a ( t ) . The Bureau of Public Roads (BPR) function is commonly applied to represent this dependency, where the travel time on a given link i increases as the demand-to-capacity ratio rises.
t a = t 0 [ 1 + α · ( D a C a ) β ]
Here, t a denotes the average travel time per unit distance on link a under normal traffic conditions, while t 0 represents the corresponding free-flow travel time. D a and C a refer to the traffic demand and the capacity of the link, respectively. The parameter α controls the proportion between free-flow travel time and travel time at full capacity, whereas β governs the sensitivity of travel time to increases in demand. Empirical studies commonly adopt α = 0.15 and β = 4 , which are the standard values recommended in official guidelines.
At each cascading step   t , the flow demand D a ( t ) is computed by solving a Stochastic User Equilibrium (SUE) model through the Method of Successive Averages (MSA). The MSA algorithm is an iterative method that gradually improves the estimation of traffic assignment to approach an equilibrium state. Assuming that at any point x , the negative gradient of the objective function f ( x )   is the direction of iteration, the optimal feasible descent direction from point x can be obtained by solving the following programming problem:
f x s . t .   A x = b x 0
By solving this problem, the auxiliary variable y for the original problem is obtained. The iterative relationship between the decision variable x and the auxiliary variable y is
x i k + 1 = x i k + 1 k y i k x i k
In this formula, 1 k is a gradually decreasing coefficient, indicating that the adjustment magnitude of the target flow decreases with each iteration. As the number of iterations increases, the adjustments become smaller, leading the flow to become stable. Additionally, by using a weighted average, the new flow not only considers the current target flow y k , but also retains the flow x k from the previous iteration. This smooth transition effectively prevents oscillations caused by large adjustments during the iteration process. The iteration ends when the difference between the values of the decision variable x   in successive iterations is smaller than the pre-setting error threshold.

3.2.3. Cascading Failure Process

We present a comprehensive approach for addressing route choice problems and evaluating network performance during cascading failures. To solve the Stochastic User Equilibrium (SUE) problem, we employ the Method of Successive Averages (MSA) algorithm. The step-by-step cascading process is outlined in Table 1, with the detailed procedures described subsequently.

3.3. Recovery Strategies

Cascading failure and recovery both fall within the research scope of complex network dynamics. Since cascading failures are unavoidable, studying response strategies after failures occur has practical significance. To better illustrate the research scope of this section, reference [14] presents the network failure and recovery evolution curves shown in Figure 3.
When selecting failed components for recovery, limited resources prevent the restoration of all components at once, so only a portion of system can be chosen for recovery [44]. However, restoring some isolated nodes and edges does not effectively improve network performance, leading to a waste of recovery resources. Therefore, it is necessary to first define and identify the critical edges in the network, and then formulate a reasonable strategy for their recovery.

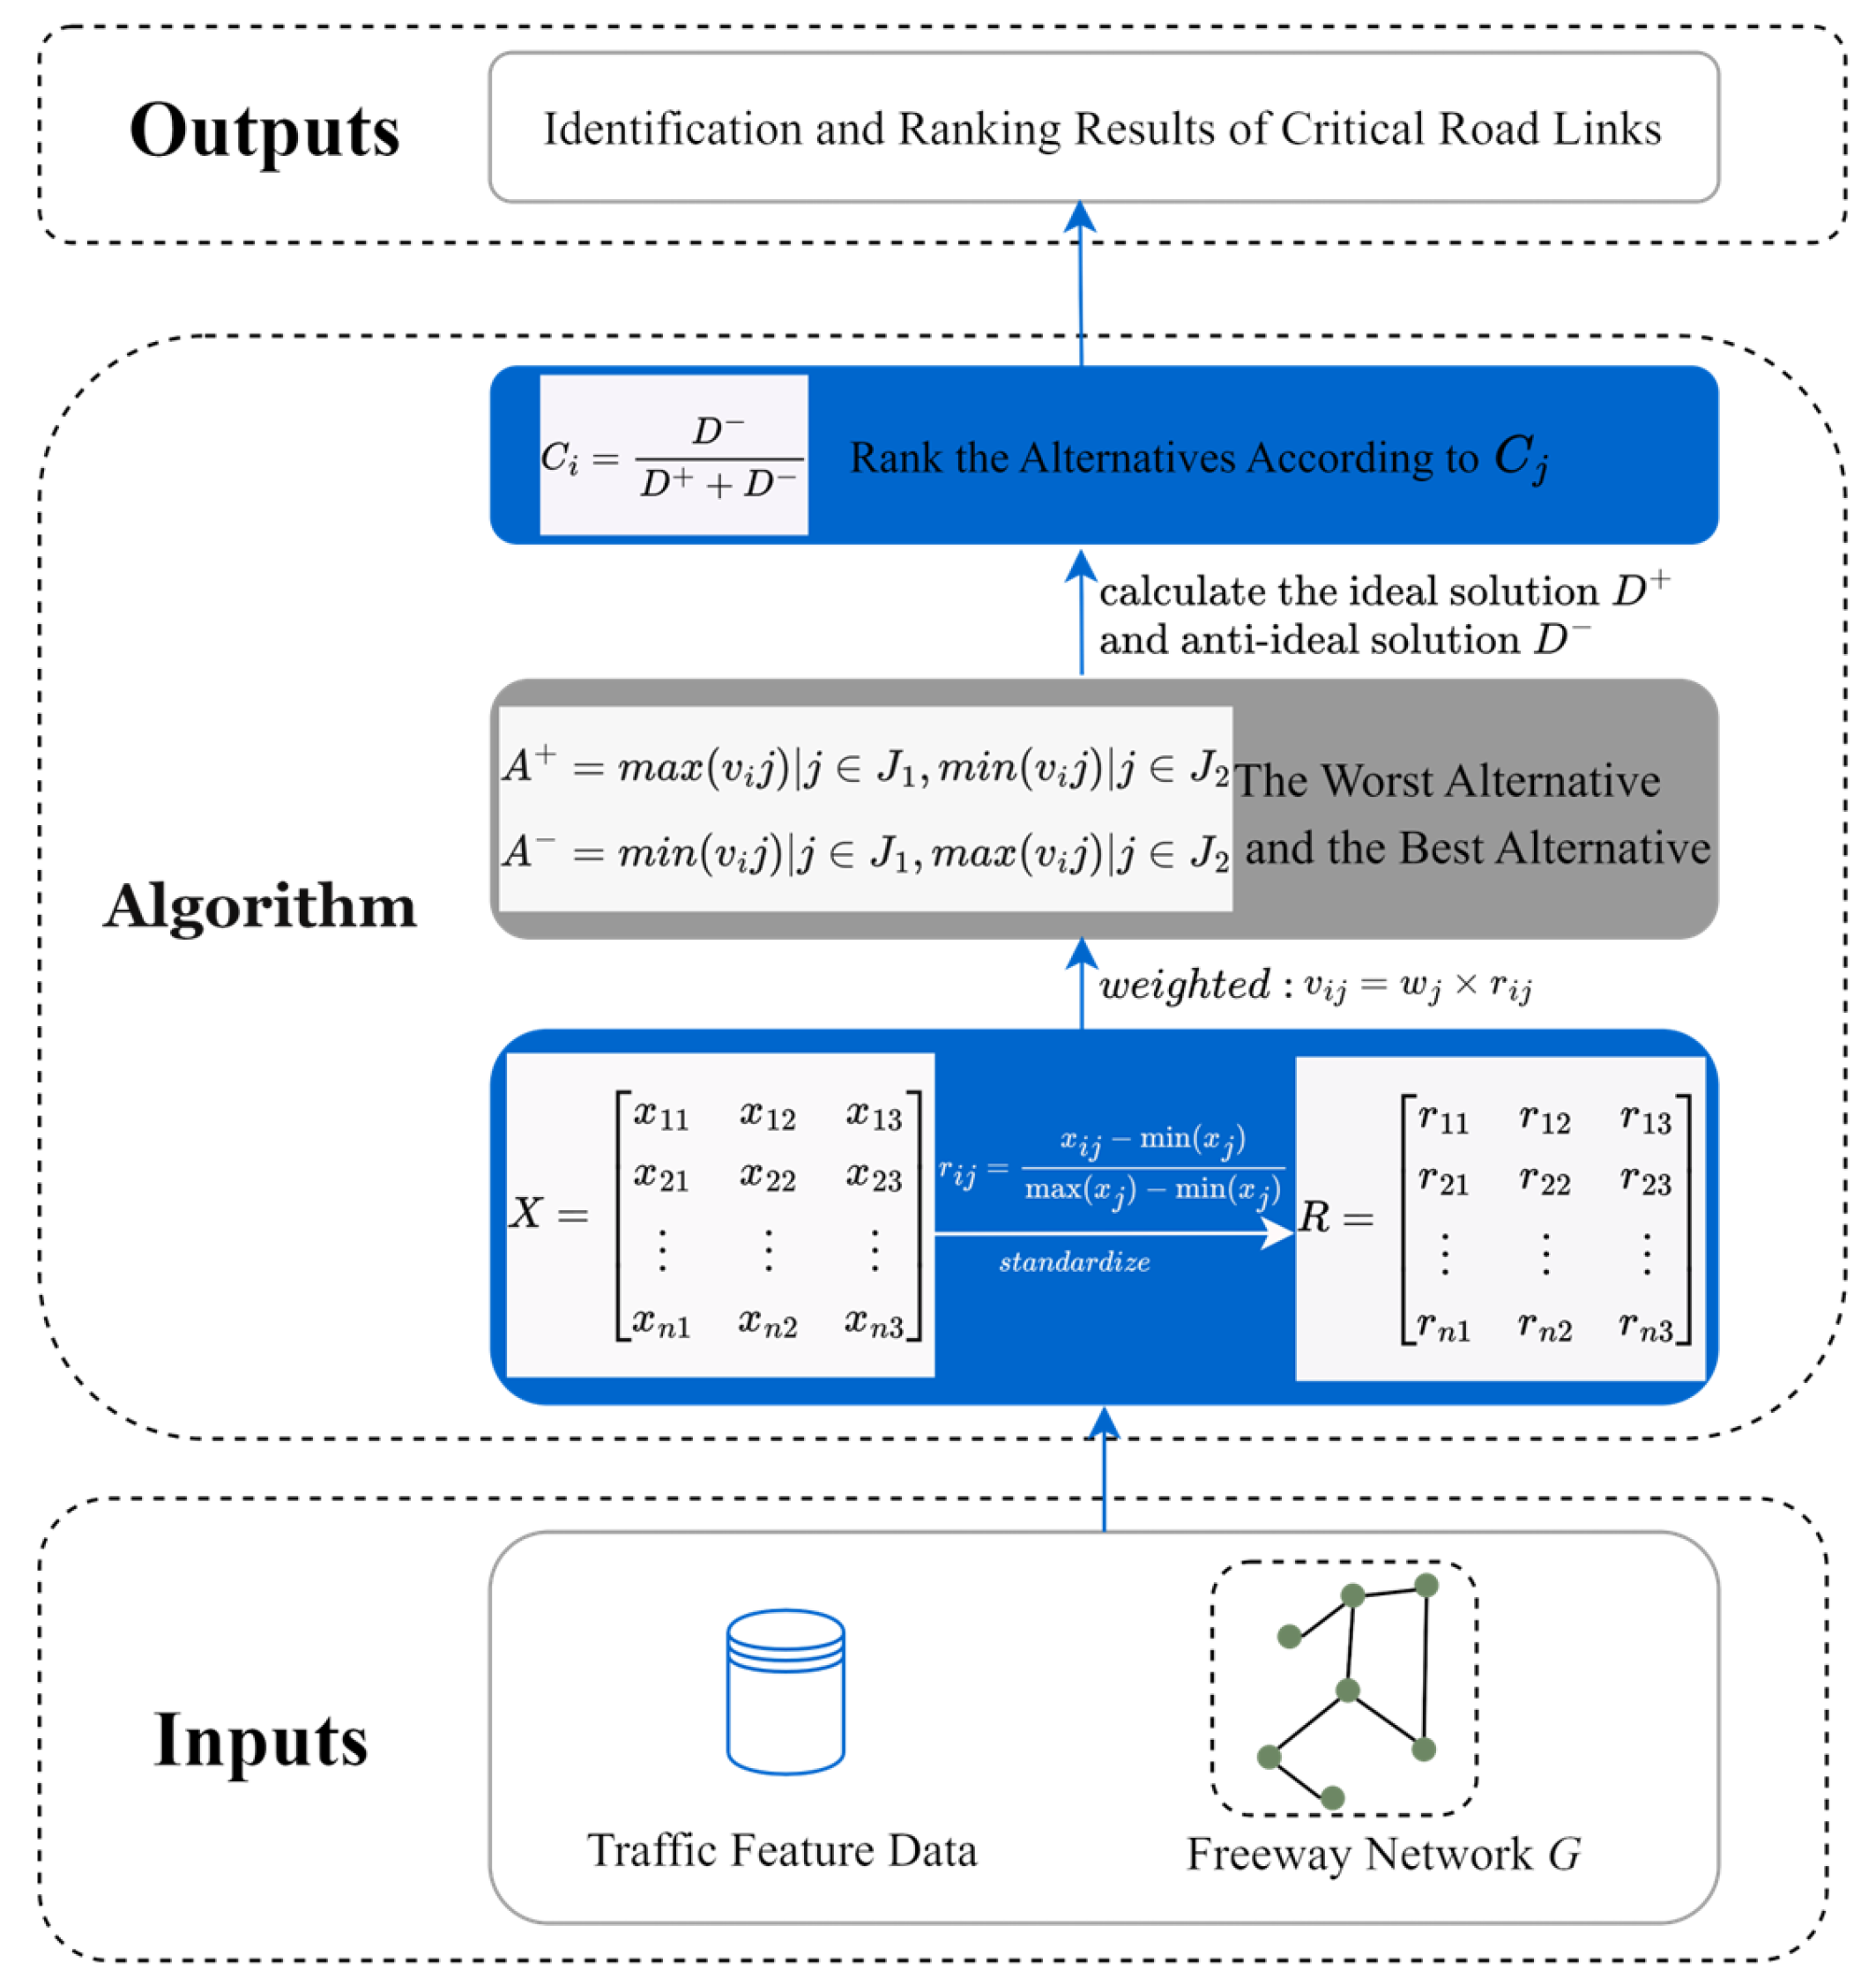
3.3.1. Identifying and Ranking Critical Road Segments

Identifying critical links in traffic networks is a classical problem. Current research focuses on identifying critical road segments by analyzing and comparing the impact on network performance before and after segment failures, where the degree of impact equates to criticality. However, existing studies often do not effectively explore cascading failure recovery scenarios.
This paper combines structural and functional indicators of road segments, determines the weight of each evaluation criterion using entropy values, and then ranks the road segments using the technique for order preference by similarity to the ideal solution (TOPSIS). Specifically, this paper considers the traffic demand and topology of road segments to construct a decision matrix X for evaluating the importance of road segments based on their volume, edge betweenness, and volume-to-capacity ratio (VCR). The matrix X is then converted into a standardized matrix R by using the normalization formula r i j = x i j m i n x j m a x x j m i n x j to eliminate the dimensional effects of different indicators, as shown in Equation (10).
X = x 11 x 12 x 13 x 21 x 22 x 23 x n 1 x n 2 x n 3     R = r 11 r 12 r 13 r 21 r 22 r 23 r n 1 r n 2 r n 3
The entropy weight method is used to determine the weight of each indicator. According to the weight formula p i j = r i j i = 1 n r i j , the weight matrix P = ( p i j ) n × 3 is obtained. Subsequently, information entropy is calculated according to Equation (11), where k = 1 ln m . The weight is calculated according to Equation (12), where w j is the weight of the   j t h indicator, and n is the total number of indicators. Then the weighted standardized decision matrix V = ( v i j ) n × 3 is obtained according to v i j = w j × r i j .
e j = k i = 1 m p i j ln p i j
w j = 1 e j j = 1 n 1 e j
For each indicator, determine the maximum and minimum values, which respectively form positive ideal solution A + = m a x v i j | j J 1 , m i n v i j | j J 2 and the negative ideal solution A = m i n v i j | j J 1 , m a x v i j | j J 2 , where J 1 is the set of benefit-type criteria, and J 2 is the set of cost-type criteria. The Euclidean distance is used to measure the distance of each decision option from the positive ideal solution D i + = j = 1 m v i j v j + 2 , and to form the negative ideal solution D i = j = 1 m v i j v j 2 .
The similarity score C i = D / ( D + + D ) is calculated; the higher the proximity score, the higher the priority during the recovery process. Figure 4 illustrates the overall structure of the proposed method. Once the road network G is obtained, it is utilized along with the traffic feature data as inputs to the evaluation matrix. The weight of each evaluation criterion is calculated based on the entropy weight method, followed by the use of the TOPSIS algorithm to obtain the importance ranking of road segments. Finally, the ranking results of the critical road segments are output.

3.3.2. Recovery Process Based on Critical Links

We assume that recovery is performed after the cascading failure ends, as shown by the green line in Figure 3. The edges in the network are classified into three states: normal, failed, and preparing for recovery. The higher-ranked edges are prioritized in the recovery sequence. The number of normal edges at each recovery time step is recorded, with the iteration concluding when the network state stabilizes. The changes in the network state at each time step during the recovery process are then outputted.
The proposed recovery strategy is defined as a step-by-step recovery approach. In this strategy, failed edges are restored sequentially based on their importance. Each set of critical edges is fully restored and verified to be functioning normally before proceeding to the next set of edges. This process is repeated until the entire system is fully recovered. This feature makes the recovery process computationally efficient and straightforward to implement.

3.4. Evaluation Metrics

In the evolution of network cascading failures and recovery, this paper introduces four metrics to capture the changes in network performance following external attacks and recovery, illustrating the extent of damage caused by cascading failures and the subsequent changes post-recovery. These metrics are employed to numerically simulate the cascading failure process in the freeway network and quantify the resulting impact.
Network Connectivity: The largest connected subgraph can be used to describe the connectivity of freeway networks. The larger the largest connected subgraph, the more stable the freeway network is, and the stronger its ability to resist attacks or interference; conversely, the weaker the freeway network is. When the nodes or edges of the network are disrupted, the network splits into several sub-networks, and the sub-network with the most nodes is the largest connected subgraph G, which can be expressed as
G = N N
where N represents the total number of nodes in the largest connected subgraph.
Network Robustness: The proportion of failed edges quantifies the ratio of failed edges to the total number of edges during cascading failures in the freeway network. The calculation formula is as follows:
P f = E f E t
where P f denotes the proportion of failed edges, E f represents the number of failed edges, and E t is the total number of edges in the network.
This formula calculates the proportion of edges that have failed at a given moment relative to the total number of edges in the entire network. It is commonly used to analyze the extent of damage to the network during cascading failures and to evaluate the network’s robustness.
Network Efficiency: Network efficiency E is an indicator used to measure the overall efficiency of a network, particularly in the context of potential disruptions to nodes or edges. This metric reflects the ease of volume transmission between any two nodes within the network. The formula for calculating network efficiency is as follows:
E = 1 N N 1 i j 1 d i j
where N represents the total number of nodes in the network, and d i j represents the shortest path between nodes. i j indicates that each pair of nodes (i.e., two different nodes) is considered once in the summation.
In a freeway network, the essence of this formula is the averaging of the reciprocals of the shortest paths between all pairs of nodes. This implies that when the shortest path between two nodes is shorter, the efficiency between them is higher, which, in turn, increases the overall efficiency of the network. Conversely, if the shortest paths between most node pairs are longer, the network’s efficiency will decrease.
Network Connective Reliability: Connectivity reliability in a freeway network is measured as the total probability that at least one valid route exists between each origin–destination pair [45]. This indicator is influenced by factors such as the shortest path distances, the number of available paths, and the overall scale of the network. It can be mathematically represented as
C R = 2 N 1 i , j N i j c r i j
in which
c r i j = N i j d i j N i j d i j
Here, c r i j denotes the connectivity reliability between nodes i and j .   N refers to the total number of nodes in the network. N i j indicates the number of viable paths between i and j   after a set of deletion-based attacks, while N i j corresponds to the number of such paths under normal, unperturbed conditions. The summation is performed over all unique node pairs within the network, totaling N ( N 1 ) combinations.

4. Case Study

A freeway network located in Hunan Province, China, was selected as a case study to illustrate the practical applicability of the proposed approach.

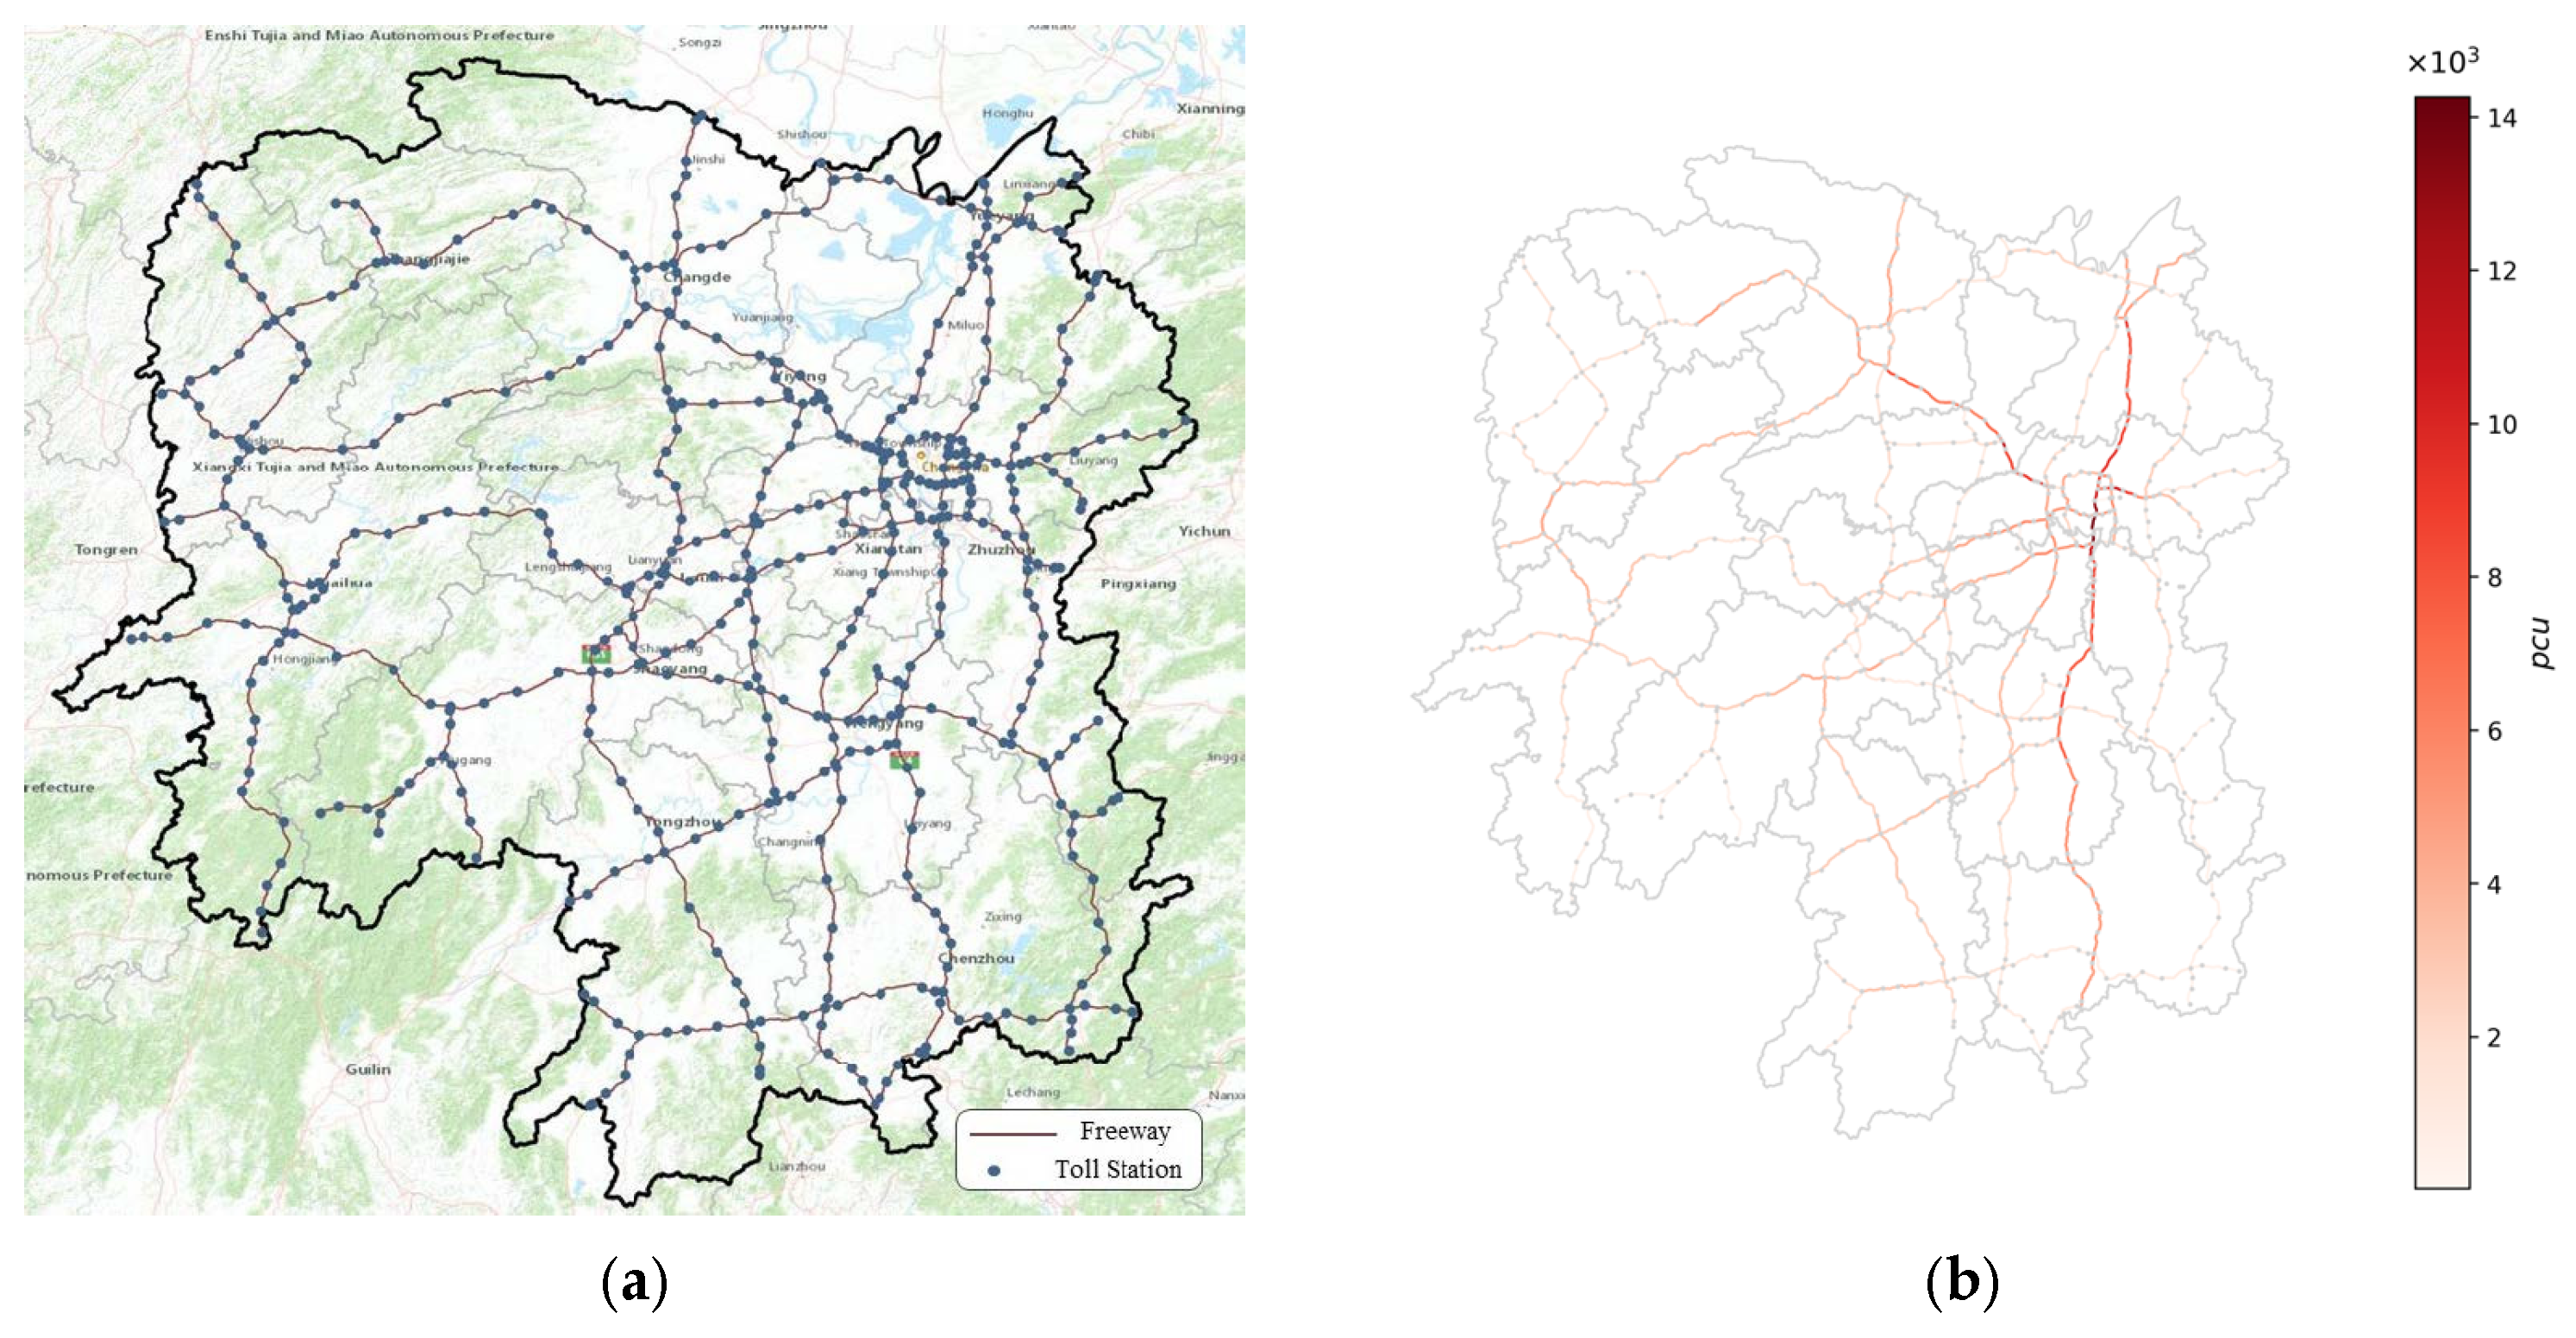
4.1. Data Preparation

The freeway network of Hunan Province was structured based on ArcGIS. The network was modeled with 430 toll stations and 65 interchange hubs as nodes, including a total of 1070 segments. Attributes of each segment, including length and direction, along with the geographic information of Hunan Province’s freeway network are illustrated in Figure 5a. The network also contains related attribute information such as the number of lanes, design speed, and lane capacity.
We collected toll data from 1 May to 31 May 2018, obtained by the Hunan Expressway Development and Construction Company. The toll data record the driving process and characteristics of vehicles. Due to equipment and storage system issues, the original freeway OD data contain errors. Therefore, we preprocessed the original freeway OD data. First, abnormal driving behavior and data inconsistent with the toll system time checks were excluded. Secondly, due to the year of data collection being 2018, there might be differences to the current situation. Thus, the OD data demand [46] was adjusted using the expansion coefficient method referring to the official statistical reports. Specifically, the corrected OD demand quantity was N m o d i f y = N o r i g i n a l α , where N m o d i f y is the corrected OD demand quantity, N o r i g i n a l is the original OD demand quantity, and the scaling factor α is the ratio of the daily total OD quantity in the original data to the daily total OD quantity in the Hunan Expressway Transport Statistical Monitoring Report in 2023. The results of distributing the modified toll data among the road network are shown in Figure 5b.

4.2. Cascading Failure Simulation and Analysis

We conducted simulations on freeway networks to more thoroughly investigate how different attack strategies influence the cascading failure process and to validate the accuracy of the proposed model. While traffic incidents often exhibit spatial clustering, the timing and duration of these events remain highly random. Accordingly, random attacks (RAs), implemented by unbiasedly selecting road segments for removal, serve to effectively replicate the unpredictability associated with large-scale disturbances such as natural disasters. By measuring the decline in network connectivity and traffic capacity under these random disruptions, this method provides a fundamental baseline for assessing network resilience.
In addition to random attacks, we introduced deliberate attack strategies to examine the heterogeneous vulnerability mechanisms present in real-world networks. High-betweenness attacks (HBAs) target road segments with the highest betweenness centrality, such as major transportation hubs, thereby simulating global topological collapse resulting from the failure of critical links. High-load attacks (HLAs) focus on segments experiencing the greatest traffic flow, which mimics the cascading congestion that arises from local overload and propagates through the network.

4.2.1. Different Initial Attack Strategies

To evaluate the impact of attacking different numbers of edges on network performance, we conducted multiple experiments with varying numbers of edge attacks. The relationship between the number of attacked edges and the resulting failures is complex, depending on the specific network structure and the failure propagation mechanism. In general, the greater the number of initially attacked edges, the more extensive and severe the resulting failures are. If a large number of edges are initially attacked or removed, this directly reduces the network’s connectivity. In this study, we adjusted the value of the number of attacked edges, k , from 25 to 500 to explore the impact of edge attacks on the freeway network.
As the results in Figure 6 suggest, the number of attacked edges significantly impacts network performance. As the number of attacked edges increases, the network performance declines more rapidly. The results for the network connectivity indicator are shown in Figure 6a. The value of the SCC decreases from 1, and when the number of attacked edges exceeds 275, the network is already destroyed after the initial attack, with no subsequent cascading failure process. Network robustness is less affected by the number of attacked edges. As shown in Figure 6b, this is because the indicator is calculated as the proportion of ultimately failed edges. The initial values for network efficiency and connectivity reliability are about 0.4 and 0.25, respectively, indicating that the freeway network’s efficiency and connectivity reliability are relatively poor, as shown in Figure 6c,d. During the cascading failure process, these values continue to decrease, and when k = 275 , both the network efficiency and connectivity reliability approach 0, indicating network collapse.

4.2.2. Attack with Reduced Road Capacity

In the previous section, we observed the impact of different initial attack quantities on the cascading failure outcomes. In traffic networks, large-scale rainfall, fog, and snow can lead to a decrease in the traffic capacity of road segments. The Highway Capacity Manual (HCM) provides reduction factors for road capacity under different weather conditions. To study the cascading failure phenomenon under different capacities, the research was conducted by adjusting the capacity reduction factor γ (ranging from 0.4 to 1).
The parameter γ represents the capacity of edges within the network. A reduction in edge capacity inevitably increases the load on individual links, which in turn degrades the overall performance of the network. Comparing the results in Figure 7, it can be observed that when γ is set to 1, the scale of cascading failures is minimal, and the network can support its designed maximum traffic volume. When γ is between 0.7 and 0.9, the additional load on other roads during the failure process leads to more failure propagation. When γ is between 0.4 and 0.6, it indicates a high-risk failure, making the initial attack more likely to trigger large-scale failures in the freeway network.
The results for the network connectivity indicator are presented in Figure 7a. In the HLA strategy, when k = 25, changes in γ have a more significant impact on cascading failures. The results for network efficiency and connectivity reliability are similar, as shown in Figure 7c,d.

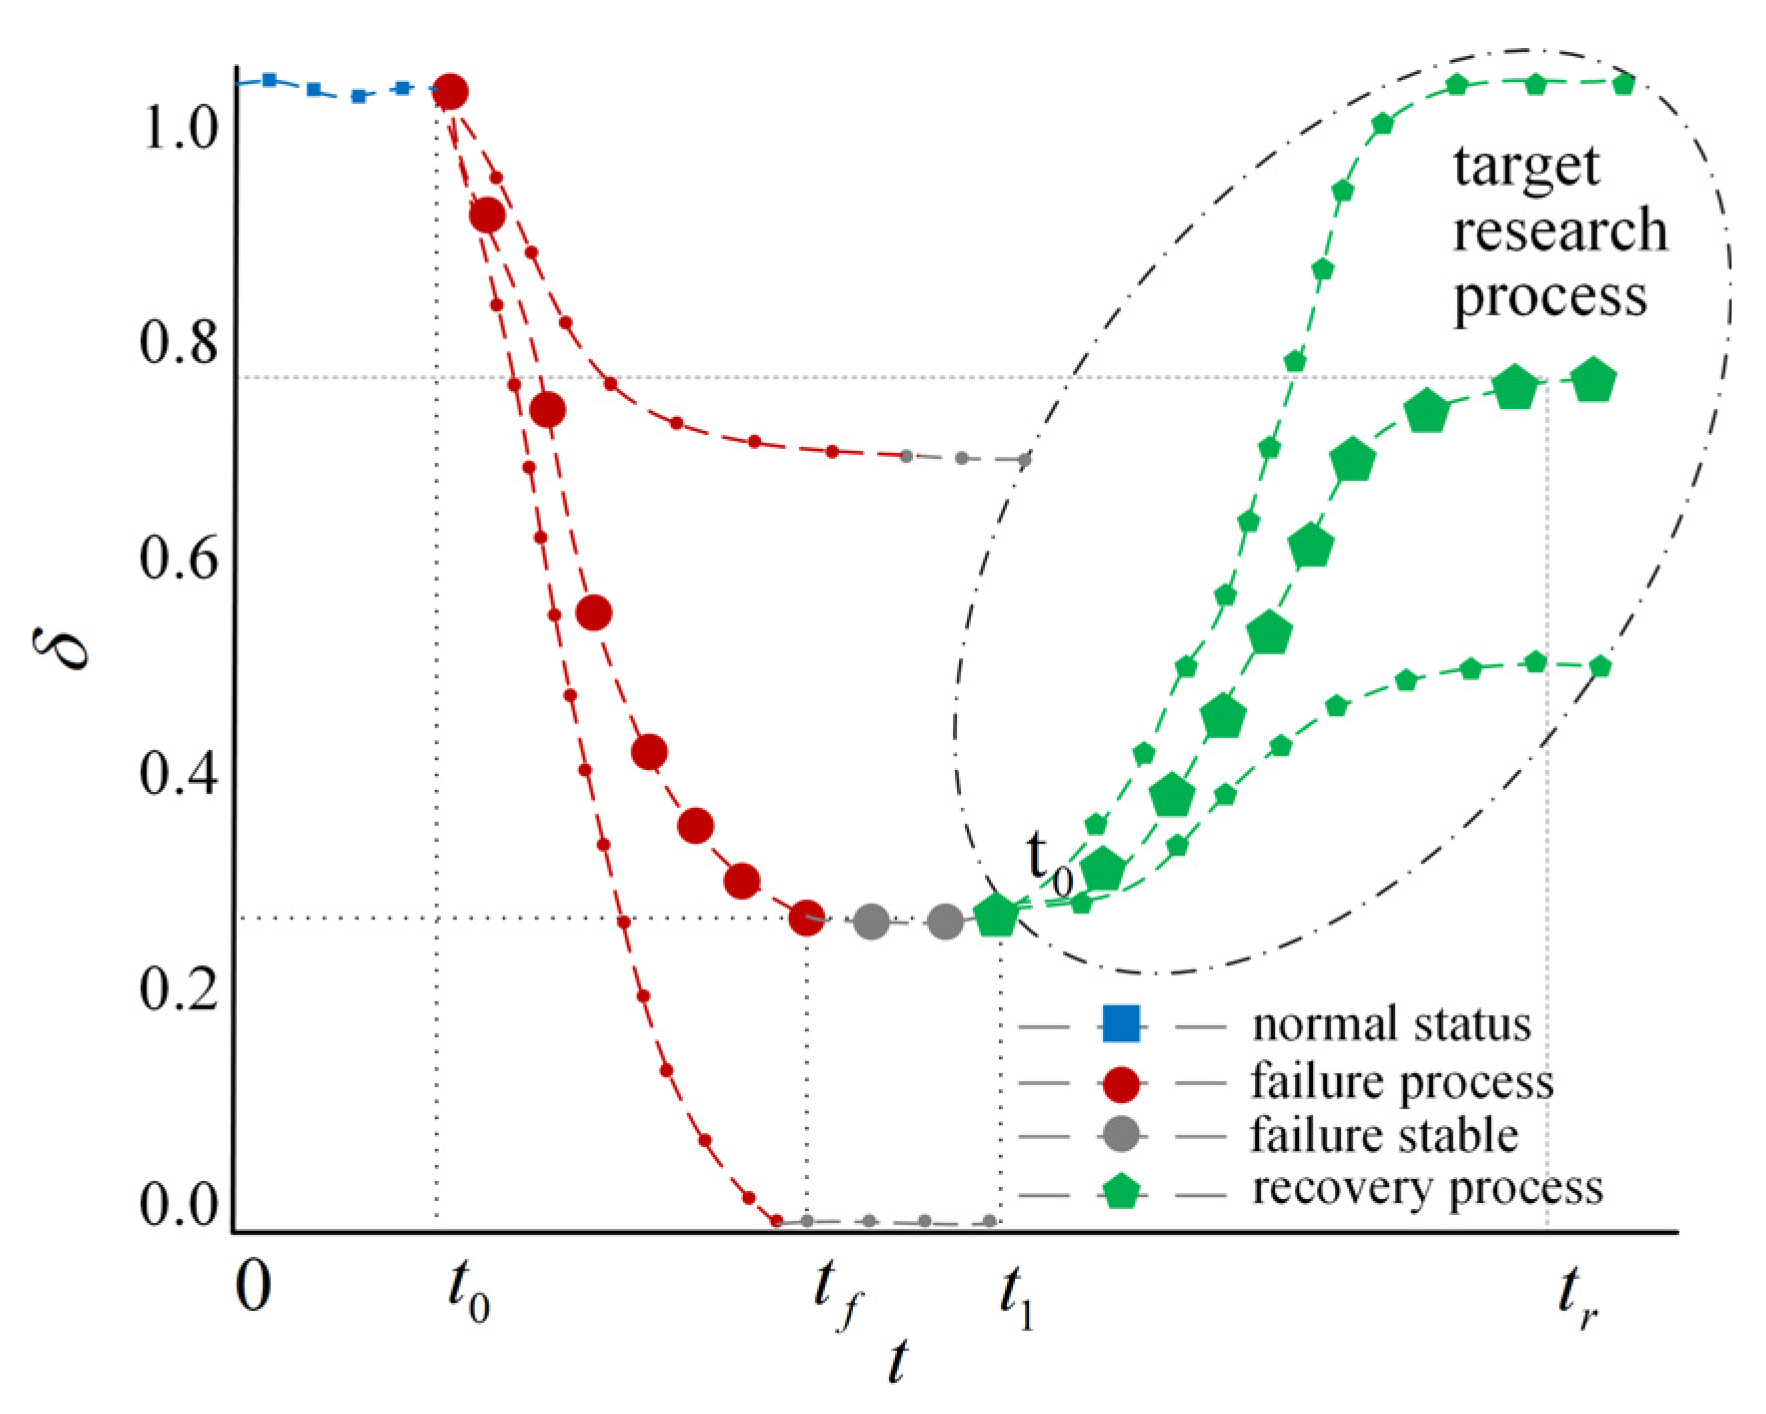
4.2.3. Evolution in the Failure Process

After analyzing the effects of varying k and r values on cascading failures, the dynamic evolution of the failure process was further investigated by examining changes at each time step within the freeway network.
To further understand the differences in performance among each step, previous studies suggest that the instantaneous speed of cascading failures tends to follow a normal distribution over time steps. This implies that, during the initial phase, the failure speed may increase rapidly before gradually stabilizing. The results in Figure 8 are consistent with this study, showing a downward trend in the values of all four indicators as the cascading failure progresses. In particular, the NR indicator for the RA k = 25 experiment group shows the fastest decline during the initial phase of the cascading failure, as shown in Figure 8b. The calculation results for the CR indicator show that the connectivity reliability of the network rapidly declines shortly after the attack begins, followed by some degree of recovery, as illustrated in Figure 8d.

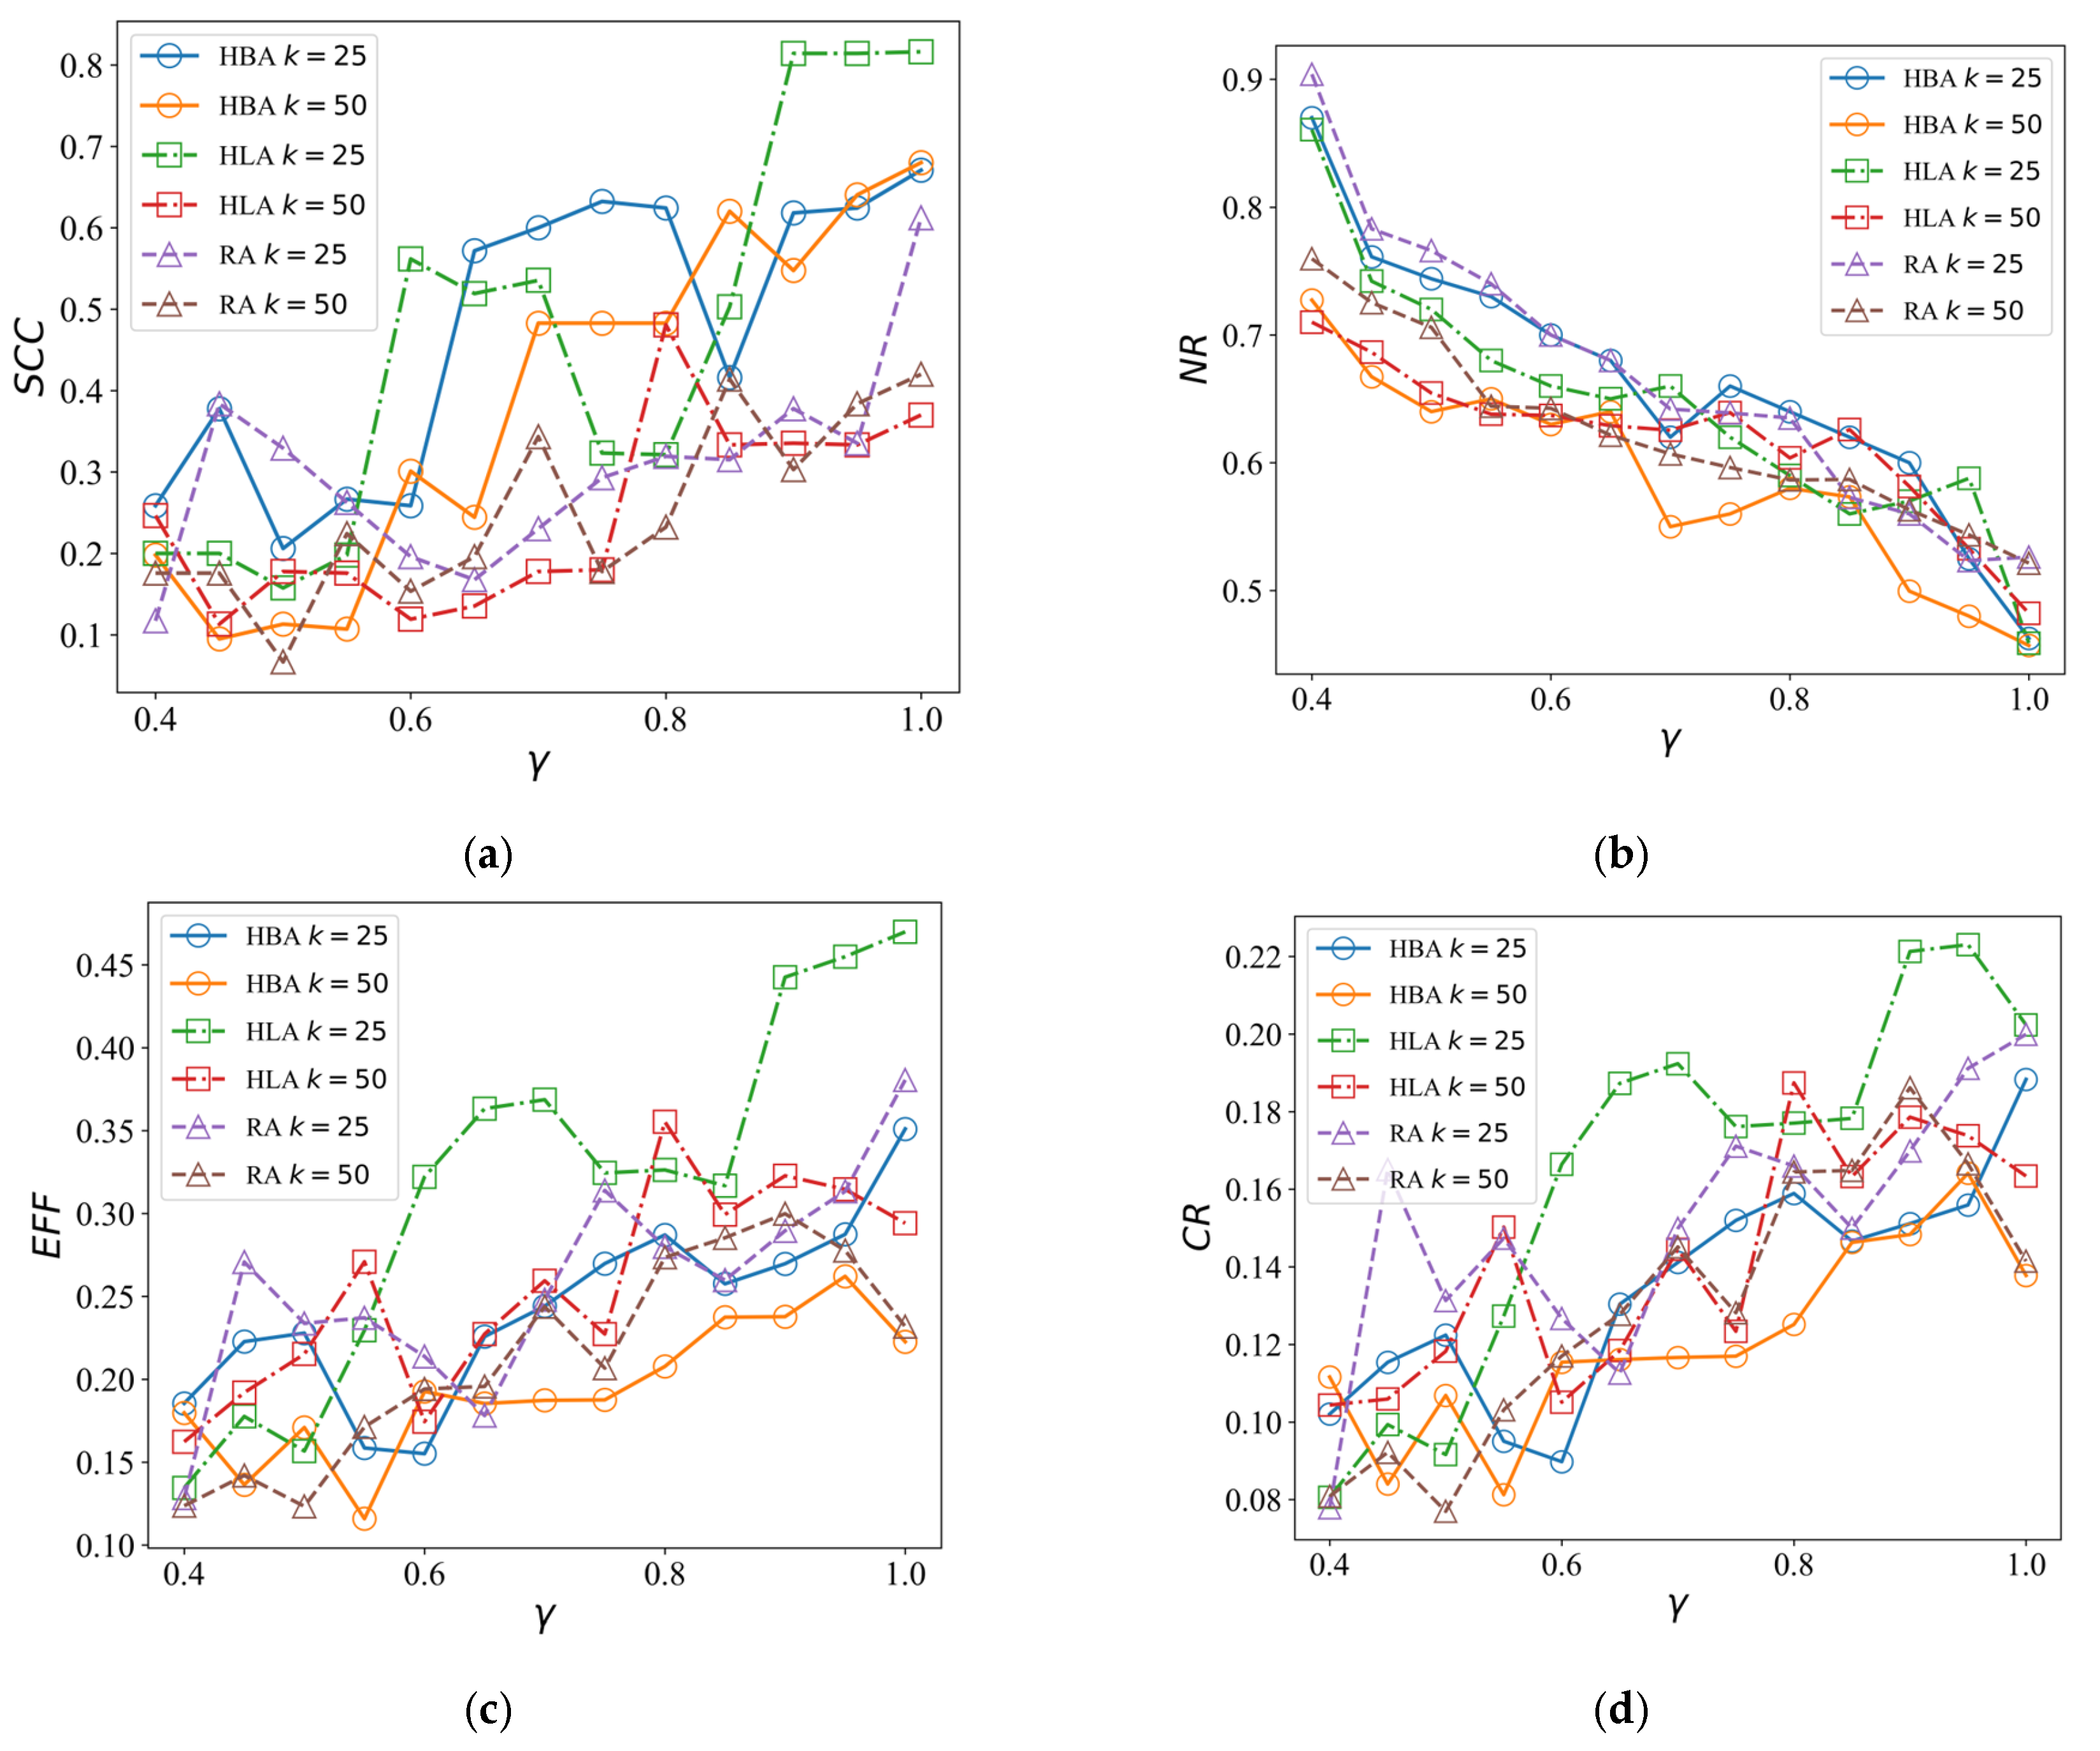
4.3. Recovery of Cascading Failure

During the network recovery process, determining an effective restoration sequence is essential, and should be guided by the relative significance of individual edges. Metrics such as edge betweenness and link load have been extensively applied in prior research to evaluate the impact of nodes within network structures. For comparative analysis, several sequential recovery strategies were evaluated, each based on a distinct metric among four selected indicators. (1) High-Edge Betweenness-Based Strategy (HBS): In the residual freeway network following cascading failures, this recovery strategy selects the top m edges with the highest betweenness centrality from the candidate set, ordered in descending magnitude. (2) High-Load-Based Strategy (HLS): This recovery sequence consists of the top m edges with the highest traffic demand, selected from the candidate set and ordered in descending demand. (3) Random Strategy (RS): Edges are randomly selected to form the recovery sequence. (4) Critical-Edges Strategy (CES): This recovery strategy is based on critical-edge prioritization.
The recovery outcomes using the importance-based strategy demonstrate notable effectiveness compared to the other methods, as shown in Figure 9. In the assessment, the importance-based recovery strategy consistently outperforms the alternatives—the random, betweenness centrality, and degree centrality strategies. This approach strategically prioritizes the restoration of network components based on their criticality, thereby ensuring a more targeted and efficient recovery process. By focusing on vital nodes and edges first, the importance-based strategy minimizes the overall downtime and enhances the network’s resilience. The empirical results indicate that this method not only accelerates recovery times, but also significantly reduces the impact of cascading failures, making it a superior choice for managing complex network disruptions. When using the HLS and CES, the results for network connectivity recovery are improved, as demonstrated in Figure 9a. The recovery of network efficiency and connectivity reliability is better under the CES, as shown in Figure 9c,d.
In examining the results of cascading failures, we observe the impact of different attack strategies, initial loads, and capacity models on network stability. Under different attack strategies, targeted attacks on critical road segments often lead to more severe failures, highlighting the network’s vulnerability, whereas random attacks demonstrate the network’s resilience to random incidents. Variations in initial loads also significantly affect the results of cascading failures; higher initial loads lead to more frequent cascading failures, indicating the network’s fragility under high-load conditions. Regarding different capacity models, increasing the capacity of road segments can alleviate cascading failures to some extent, but excessive capacity settings may result in resource wastage and other potential issues. Therefore, reasonable capacity allocation is crucial for enhancing network stability. These results indicate that in traffic network design and management, it is essential to comprehensively consider attack strategies, initial loads, and capacity models to improve overall risk resistance.

5. Conclusions

This study addressed the vulnerability and low recovery efficiency of freeway networks under the scenario of cascading failures by proposing and validating a systematic solution. Specifically, an improved edge-based CML model was developed to realistically simulate cascading failure phenomena in transportation networks, thereby overcoming the limitations of traditional models that insufficiently capture real-world operational characteristics. The primary contributions of this study are summarized as follows: (1) To simulate cascading failure phenomena in transportation networks, we developed an edge-based model that incorporates the operational characteristics of real-world traffic systems, and conducted simulations on a specific freeway network to capture the cascading failure process. (2) We propose a method to identify and rank important edges within the network. By evaluating the relative importance of edges, this method identifies critical edge combinations and determines an optimal recovery sequence to enhance network performance during the restoration process. (3) A recovery strategy was developed based on the identification of critical edges, taking into account the possibility of cascading failures occurring during the restoration process. The simulation results verify the effectiveness of the proposed scheme in enhancing the performance of the network against disruptions and accelerating system recovery. These findings provide a theoretical foundation and technical support for risk prevention, control, and emergency management in real-world transportation networks.
Directions for further research on cascading failure and recovery models include improving existing models and expanding their application scope. Future research can also investigate cascading failure phenomena under more complex traffic operating conditions and gradually incorporate more realistic mechanisms, such as edge recovery and probabilistic failures. Additionally, we will consider conducting further tests using datasets from different regions and time periods to more comprehensively validate the robustness and applicability of the proposed method. Finally, we aim to consider the trade-off between network efficiency and functionality by establishing a comprehensive network quantification index system to evaluate various traffic recovery strategies, thereby enhancing the overall resilience and operational efficiency of the network following incidents.

Author Contributions

Conceptualization, X.Z.; methodology, X.Z. and S.Z.; software, X.Z.; validation, S.Z. and W.L.; resources, J.T.; writing—original draft, X.Z.; writing—review and editing, S.Z., W.L., and J.T.; project administration, J.T. All authors have read and agreed to the published version of the manuscript.

Funding

This research was funded in part by the Key R&D Program of Hunan Province (No. 2023GK2014), the National Natural Science Foundation of China (No. 52172310), the Science Research Foundation of Hunan Provincial Department of Education (No. 22B0010), the Natural Science Foundation of Hunan Province (No. 2022JJ30763), and the Central South University Graduate Student Independent Exploration and Innovation Project (No. 2023ZZTS0340).

Institutional Review Board Statement

Not applicable.

Informed Consent Statement

Not applicable.

Data Availability Statement

The data presented in this study are available on request from the corresponding author.

Conflicts of Interest

The authors declare no conflict of interest.

References

  1. Bai, L.; Han, X.; Zhang, Y.; Xie, X. Optimal project portfolio selection considering cascading failure among projects. IEEE Trans. Eng. Manag. 2023, 71, 4750–4760. [Google Scholar] [CrossRef]
  2. Gao, C.; Fan, Y.; Jiang, S.; Deng, Y.; Liu, J.; Li, X. Dynamic robustness analysis of a two-layer rail transit network model. IEEE Trans. Intell. Transp. Syst. 2022, 23, 6509–6524. [Google Scholar] [CrossRef]
  3. Shen, Y.; Ren, G.; Ran, B. Cascading failure analysis and robustness optimization of metro networks based on coupled map lattices: A case study of Nanjing, China. Transportation 2019, 48, 537–553. [Google Scholar] [CrossRef]
  4. Yin, R.; Yuan, H.; Wang, J.; Zhao, N.; Liu, L. Modeling and analyzing cascading dynamics of the urban road traffic network. Phys. A Stat. Mech. Its Appl. 2021, 566, 125600. [Google Scholar] [CrossRef]
  5. Zhang, Y.; Ng, S.T. Robustness of urban railway networks against the cascading failures induced by the fluctuation of passenger flow. Reliab. Eng. Syst. Saf. 2022, 219, 108227. [Google Scholar] [CrossRef]
  6. Lu, Q.; Zhang, L.; Xu, P.; Cui, X.; Li, J. Modeling network vulnerability of urban rail transit under cascading failures: A Coupled Map Lattices approach. Reliab. Eng. Syst. Saf. 2022, 221, 108320. [Google Scholar] [CrossRef]
  7. Sun, L.; Huang, Y.; Chen, Y.; Yao, L. Vulnerability assessment of urban rail transit based on multi-static weighted method in Beijing, China. Transp. Res. Part A Policy Pract. 2018, 108, 12–24. [Google Scholar] [CrossRef]
  8. Dobson, I. Estimating the Propagation and Extent of Cascading Line Outages From Utility Data With a Branching Process. IEEE Trans. Power Syst. 2012, 27, 2146–2155. [Google Scholar] [CrossRef]
  9. Zhou, D.; Elmokashfi, A. Network recovery based on system crash early warning in a cascading failure model. Sci. Rep. 2018, 8, 7443–7452. [Google Scholar] [CrossRef]
  10. Motter, A.E.; Lai, Y.-C. Cascade-based attacks on complex networks. Phys. Rev. E 2002, 66, 065102. [Google Scholar] [CrossRef]
  11. Duan, J.; Li, D.; Huang, H.-J. Reliability of the traffic network against cascading failures with individuals acting independently or collectively. Transp. Res. Part C Emerg. Technol. 2023, 147, 104017. [Google Scholar] [CrossRef]
  12. Wang, J.; Zhao, N.; Xiang, L.; Wang, C. Abnormal cascading dynamics based on the perspective of road impedance. Phys. A Stat. Mech. Its Appl. 2023, 627, 129128. [Google Scholar] [CrossRef]
  13. Wu, J.; Chen, Z.; Zhang, Y.; Xia, Y.; Chen, X. Sequential Recovery of Complex Networks Suffering from Cascading Failure Blackouts. IEEE Trans. Netw. Sci. Eng. 2020, 7, 2997–3007. [Google Scholar] [CrossRef]
  14. Liu, Q.; Wang, B. Network resilience and recovery mechanism: A review. J. Cyber Secur. 2021, 6, 44–59. [Google Scholar] [CrossRef]
  15. Hassan, M.; Al Nafees, A.; Sraban, S.S.; Paul, A.; Mahin, H.D. Application of machine learning in intelligent transport systems: A comprehensive review and bibliometric analysis. Discov. Civ. Eng. 2025, 2, 98. [Google Scholar] [CrossRef]
  16. Gheorghe, C.; Soica, A. Revolutionizing Urban Mobility: A Systematic Review of AI, IoT, and Predictive Analytics in Adaptive Traffic Control Systems for Road Networks. Electronics 2025, 14, 719. [Google Scholar] [CrossRef]
  17. Huang, J.; Wang, J. Travel behavior resilience: Theory, method, and empirical studies. J. Geogr. Sci. 2024, 34, 1657–1674. [Google Scholar] [CrossRef]
  18. Brummitt, C.D.; D’Souza, R.M.; Leicht, E.A. Suppressing cascades of load in interdependent networks. Proc. Natl. Acad. Sci. USA 2012, 109, E680–E689. [Google Scholar] [CrossRef]
  19. Kinney, R.; Crucitti, P.; Albert, R.; Latora, V. Modeling cascading failures in the North American power grid. Eur. Phys. J. B—Condens. Matter Complex Syst. 2005, 46, 101–107. [Google Scholar] [CrossRef]
  20. Schäfer, B.; Witthaut, D.; Timme, M.; Latora, V. Dynamically induced cascading failures in power grids. Nat. Commun. 2018, 9, 1975. [Google Scholar] [CrossRef]
  21. Doyle, J.C.; Alderson, D.L.; Li, L.; Low, S.; Roughan, M.; Shalunov, S.; Tanaka, R.; Willinger, W. The “robust yet fragile” nature of the Internet. Proc. Natl. Acad. Sci. USA 2005, 102, 14497–14502. Available online: https://www.pnas.org/doi/10.1073/pnas.0501426102 (accessed on 23 April 2025). [CrossRef]
  22. Bak, P.; Tang, C.; Wiesenfeld, K. Self-organized criticality: An explanation of the 1/f noise. Phys. Rev. Lett. 1987, 59, 381–384. Available online: https://journals.aps.org/prl/abstract/10.1103/PhysRevLett.59.381 (accessed on 2 May 2025). [CrossRef] [PubMed]
  23. Dobson, I.; Carreras, B.A.; Lynch, V.E.; Newman, D.E. An initial model for complex dynamics in electric power system blackouts. In Proceedings of the 34th Annual Hawaii International Conference on System Sciences, Maui, HI, USA, 6 January 2001. [Google Scholar]
  24. Wang, J.-W.; Rong, L.-L. A model for cascading failures in scale-free networks with a breakdown probability. Phys. A Stat. Mech. Its Appl. 2009, 388, 1289–1298. [Google Scholar] [CrossRef]
  25. Wang, W.-X.; Chen, G. Universal robustness characteristic of weighted networks against cascading failure. Phys. Rev. E 2008, 77, 026101. [Google Scholar] [CrossRef]
  26. Crucitti, P.; Latora, V.; Marchiori, M. Model for cascading failures in complex networks. Phys. Rev. E 2004, 69, 045104. [Google Scholar] [CrossRef] [PubMed]
  27. Guo, X.; Du, Q.; Li, Y.; Zhou, Y.; Wang, Y.; Huang, Y.; Martinez-Pastor, B. Cascading failure and recovery of metro–bus double-layer network considering recovery propagation. Transp. Res. Part D Transp. Environ. 2023, 122, 103861. [Google Scholar] [CrossRef]
  28. Cwilich, G.; Buldyrev, S.V. Cascading traffic jams in two-dimensional networks with Motter-Lai dynamics. Phys. Rev. E 2022, 106, 024303. [Google Scholar] [CrossRef] [PubMed]
  29. Perez, I.A.; Vaknin Ben Porath, D.; La Rocca, C.E. Cascading failures from localized overloads in isotropic and anisotropic spatial networks. arXiv 2021, arXiv:2112.11308. Available online: https://arxiv.org/abs/2112.11308 (accessed on 2 May 2025).
  30. Jiang, B.; Claramunt, C. Topological analysis of urban street networks. Environ. Plan. B Plan. Des. 2004, 31, 151–162. [Google Scholar] [CrossRef]
  31. Sienkiewicz, J.; Hołyst, J.A. Statistical analysis of 22 public transport networks in Poland. Phys. Rev. E—Stat. Nonlinear Soft Matter Phys. 2005, 72, 046127. [Google Scholar] [CrossRef]
  32. Liu, X.; Huang, S.; Chen, Q. Cause analysis of expressway traffic accidents based on accident statistics of Hunan provincial expressway in 2012–2018. Transp. Saf. Environ. 2024, 6, tdad010. [Google Scholar] [CrossRef]
  33. Li, Y.; Zhu, J.; Haque, M.M.; Lee, J. Hazard-based duration modelling of merging time interval on freeway on-ramps. Transp. Saf. Environ. 2023, 5, tdac040. [Google Scholar] [CrossRef]
  34. Li, J.; Guo, F.; Zhou, Y.; Yang, W.; Ni, D. Predicting the severity of traffic accidents on mountain freeways with dynamic traffic and weather data. Transp. Saf. Environ. 2023, 5, tdad001. [Google Scholar] [CrossRef]
  35. Zhai, X.; Sze, N.N.; Lee, J.J.; Xu, P.; Huang, H. Multi-scale approaches to cope with scale effect issues in macroscopic crash analysis. Accid. Anal. Prev. 2025, 214, 107971. [Google Scholar] [CrossRef] [PubMed]
  36. Qian, Y.; Wang, B.; Xue, Y.; Zeng, J.; Wang, N. A simulation of the cascading failure of a complex network model by considering the characteristics of road traffic conditions. Nonlinear Dyn. 2015, 80, 413–420. [Google Scholar] [CrossRef]
  37. Ma, F.; Liu, F.; Yuen, K.F.; Lai, P.; Sun, Q.; Li, X. Cascading failures and vulnerability evolution in bus–metro complex bilayer networks under rainstorm weather conditions. Int. J. Environ. Res. Public Health 2019, 16, 329. [Google Scholar] [CrossRef]
  38. Wu, Q.; Han, Z.; Cui, C.; Liu, F.; Zhao, Y.; Xie, Z. Vulnerability identification and cascading failure spatiotemporal patterns on road network under the rainstorm disaster. ISPRS Int. J. Geo-Inf. 2022, 11, 564. [Google Scholar] [CrossRef]
  39. Jin, K.; Wang, W.; Li, X.; Chen, S.; Qin, S.; Hua, X. Cascading failure in urban rail transit network considering demand variation and time delay. Phys. A Stat. Mech. Its Appl. 2023, 630, 129290. [Google Scholar] [CrossRef]
  40. Wang, J. Mitigation strategies on scale-free networks against cascading failures. Phys. A Stat. Mech. Its Appl. 2013, 392, 2257–2264. [Google Scholar] [CrossRef]
  41. Smolyak, A.; Levy, O.; Vodenska, I.; Buldyrev, S.; Havlin, S. Mitigation of cascading failures in complex networks. Sci. Rep. 2020, 10, 16124. [Google Scholar] [CrossRef]
  42. Hu, F.; Yeung, C.H.; Yang, S.; Wang, W.; Zeng, A. Recovery of infrastructure networks after localised attacks. Sci. Rep. 2016, 6, 24522. [Google Scholar] [CrossRef] [PubMed]
  43. Lyu, R.; Zhang, M.; Wang, X.-J.; Wang, T.-J. Recovery strategy of multilayer network against cascading failure. Int. J. Mod. Phys. C 2022, 33, 2250039. [Google Scholar] [CrossRef]
  44. Hu, S.; Zhou, Q.; Li, J.; Wang, Y.; Roncoli, C.; Zhang, L.; Lehe, L. High Time-Resolution Queue Profile Estimation at Signalized Intersections Based on Extended Kalman Filtering. IEEE Trans. Intell. Transp. Syst. 2022, 23, 21274–21290. [Google Scholar] [CrossRef]
  45. Dai, H.; Yao, E.; Lu, N.; Bian, K.; Zhang, B. Freeway network connective reliability analysis based on a complex network approach. Procedia Eng. 2016, 137, 372–381. [Google Scholar] [CrossRef]
  46. Wang, P.; Liao, Y.; Li, S.; Ke, R.; Wang, T. Route guidance model of regional highway multi-layer transportation network for balancing individual and social benefits. J. Southwest Jiaotong Univ. 2024, 1–12, online first. [Google Scholar]
Figure 1. The overall architecture of our proposed method.
Applsci 15 07276 g001
Figure 2. Cascading progress in a simplified network.
Applsci 15 07276 g002
Figure 3. Cascading failure and recovery process.
Applsci 15 07276 g003
Figure 4. The overall architecture of the process for identifying critical links.
Applsci 15 07276 g004
Figure 5. Study area. (a) Map of Hunan Province; (b) volume of freeway network.
Applsci 15 07276 g005
Figure 6. Results of cascading failure under different k values. (a) SCC; (b) NR; (c) EFF; (d) CR.
Applsci 15 07276 g006
Figure 7. Results of cascading failure with different γ . (a) SCC; (b) NR; (c) EFF; (d) CR.
Applsci 15 07276 g007
Figure 8. Results of cascading failure evolution. (a) SCC; (b) NR; (c) EFF; (d) CR.
Applsci 15 07276 g008
Figure 9. Results of cascading failure recovery. (a) SCC; (b) NR; (c) EFF; (d) CR.
Applsci 15 07276 g009
Table 1. Cascading failure procedure.
StepInitialization of network parameters
0.1 Initialize the cascade process by setting t = 0 .
0.2 Generate the structural representation of the freeway network.
0.3 Import the origin–destination (OD) traffic demand and implement the Method of Successive Averages (MSA) to estimate baseline link loads.
1Set the initial attack
Remove the targeted links from the freeway network structure.
2Move cascade   s t e p t = t + 1 .
3Load the OD demand q ( t ) at cascade s t e p   t .
4Update the link travel time function t a , if certain roads experience overload failures.
5Solve for D a ( t ) using an SUE model at each cascade step t , applying the MSA algorithm for stochastic loading.
5.0 Initialize the traffic assignment variable D a 1 t = 0 , and set the iteration counter   n = 1 .
5.1 Update the travel time function for each network link.
5.2 Compute the auxiliary variable by solving an optimization problem. The result, denoted as y , represents a feasible direction for descent in the solution space.
5.3 Update. Update the decision variable x using the following relationship: x i k + 1 = x i k + 1 k y i k x i k . The coefficient 1 k decreases with each iteration, reducing the magnitude of adjustments and stabilizing the flow over time.
5.4 Convergence criterion. The iteration continues until the difference between successive values of x falls below a defined gap threshold, ensuring that the flow stabilizes and fluctuations are minimized; otherwise, n = n + 1 and go to step 5.1.
6Overload conditions cause subsequent failures in previously unaffected links.
7Quantify the additional failure occurrences and analyze the associated performance measures of the network.
8Terminate the cascading failure process if no new failure links are generated; otherwise, return to step 2.
Disclaimer/Publisher’s Note: The statements, opinions and data contained in all publications are solely those of the individual author(s) and contributor(s) and not of MDPI and/or the editor(s). MDPI and/or the editor(s) disclaim responsibility for any injury to people or property resulting from any ideas, methods, instructions or products referred to in the content.

