Abstract
Background/Objectives: Prolonged sitting is linked to musculoskeletal discomfort, yet optimal sitting posture remains poorly defined, and the consistency with which individuals reproduce specific sitting strategies is unclear. This study examined postural variability across three sitting strategies—comfortable, habitual, and correct—using three common chair types: a stool, computer chair, and ergonomic chair. Methods: Thirty healthy young adults (fifteen men, fifteen women) participated. Global sagittal joint angles—head inclination (HI), trunk angle (TA), and knee angle (KA)—were measured using a motion analysis system across five repetitions per condition. Results: The chair type significantly influenced HI and TA (p < 0.001), with ergonomic chairs encouraging more upright trunk postures. The sitting strategy significantly affected TA and KA (p < 0.01), with comfortable sitting associated with more extended angles. Women exhibited greater TA (114.8° vs. 109.0°, p < 0.001) and lower within-subject variability. Substantial postural variability was observed across all conditions, with mean ranges exceeding minimum detectable change thresholds for HI (10.3°), TA (6.9°), and KA (11.3°). Notably, correct sitting reduced KA variability compared to other strategies (p < 0.01). Conclusions: These findings highlight the individualized and variable nature of sitting posture, even under controlled instructions. The results question the reliability of memory-based seat adjustments and emphasize the need for dynamic, user-centered ergonomic design and personalized clinical guidance to support musculoskeletal health.
1. Introduction
Sedentary behavior has become a dominant feature of modern life, encompassing occupational, educational, and recreational activities. With increased screen time and desk-based work, individuals now spend much of their day seated, contributing to a range of musculoskeletal issues. Office workers, in particular, often sit for over seven hours daily, a behavior strongly associated with neck, shoulder, and lower back discomfort [1,2,3]. Epidemiological evidence links prolonged sitting—especially when exceeding half the workday—to a heightened risk of chronic low back pain [4]. Biomechanically, extended sitting can reduce spine-stabilizing muscle activity, leading to spinal fatigue and postural deconditioning [5]. Recent studies have reinforced these risks, particularly among individuals engaged in remote or screen-based work. For instance, Meng et al. [6] reported strong associations between sedentary behavior and neck pain in frequent users of mobile devices, while Lin et al. [7] identified extended sitting during work-from-home settings as a predictor of neck and back symptoms.
Despite decades of ergonomic research, consensus on optimal sitting posture remains elusive. Recommendations like “sit up straight” often reflect cultural norms rather than biomechanical evidence [8]. While slouched or flexed postures are commonly linked to spinal discomfort [9], they are frequently observed in everyday settings [10,11]. Habitual postures typically involve mid-range trunk flexion and are more flexed than postures perceived as “correct” or “ideal” [12,13]. In contrast, upright postures often promoted by clinicians require increased muscle activity, which may reduce postural sustainability due to fatigue [14,15]. Importantly, there is limited empirical evidence linking any one posture to reduced spinal load or improved musculoskeletal outcomes [16,17]. Furthermore, the shift from paper-based to digital work is seen as a key contributor to musculoskeletal disorders, highlighting the need for ergonomic adaptations in workplace design [18].
Beyond debates over ideal posture, prolonged maintenance of any static posture—whether upright, slouched, kyphotic, or lordotic—can cause discomfort or injury [19]. This has led to growing interest in postural variability as a protective factor. People naturally adjust their posture over time to redistribute load and maintain comfort, yet it remains unclear how consistently they can reproduce specific postures under identical conditions. Interventions that promote movement, such as sit–stand desks or posture change reminders, have been shown to reduce discomfort without negatively affecting productivity [20].
Chair design plays a critical role in influencing sitting behavior. Features such as adjustability, contouring, and back support can either facilitate or restrict postural movement. However, individual responses to different chair designs vary widely, and the underlying mechanisms that drive posture selection remain incompletely understood [21]. To evaluate seating comfort, researchers have employed multiple methodological approaches. Subjective questionnaires are commonly used to assess perceived comfort, discomfort intensity, and user preferences under varying tasks or seating conditions [22,23,24,25]. Anthropometric studies have examined how body dimensions affect seat fit, contact pressure, and support adequacy across diverse populations [26,27,28]. Pressure mapping has been applied to quantify interface pressure distribution, identify high-pressure zones, and explore their associations with perceived comfort and load-related risks [29,30,31]. More recently, direct measurement of joint angles has emerged as a reliable method for objectively quantifying seated posture and musculoskeletal loading [32]. In line with these developments, modern ergonomic design increasingly emphasizes dynamic sitting—promoting movement and postural variation—over static postures traditionally regarded as ideal [33].
A foundational study by Chen et al. [34] examined postural variability during self-perceived comfortable sitting on three chair types: a stool, computer chair, and gaming chair. Despite standardized instructions, participants showed high intra-individual variability in global sagittal angles: 9.4° (head), 10.2° (trunk), and 11.1° (knee). These findings suggest that even comfortable postures are not consistently reproducible. Gender and the chair type significantly influenced trunk flexion but had no effect on head or knee angles. In a related study, Korakakis et al. [11] found that participants shifted to more upright postures when asked to sit “optimally,” with women demonstrating greater extension in cervical, thoracic, lumbar, and pelvic segments—possibly due to anatomical or perceptual differences.
While these studies offer insights into comfortable and habitual postures, few have compared multiple sitting strategies—comfortable, habitual, and correct—across various chair types. Moreover, little is known about the reproducibility of these postures under repeated conditions. This is particularly relevant given the increasing use of memory-based seat adjustment systems in office chairs and vehicles, which assume fixed, preferred postures can be accurately reinstated over time.
To address these gaps, the current study investigates postural variability in global joint angles—head inclination (HI), trunk angle (TA), and knee angle (KA)—across three chair types (stool, computer chair, ergonomic chair), across three sitting strategies (comfortable, habitual, correct), and between genders. Building on Chen et al.’s work [34], this study systematically examines whether individuals adopt consistent postures across repetitions, how chair design and gender influence posture, and whether certain strategies (e.g., correct sitting) yield lower variability.
We hypothesize that (1) correct sitting will show significantly lower postural variability than comfortable and habitual postures due to greater intentional control; (2) gender will affect TAs, with females exhibiting more extended postures; (3) the chair type will influence variability, with adjustable chairs increasing variability in comfortable sitting but reducing it in correct sitting; and (4) postural variability will exceed minimal detectable change thresholds across conditions, challenging assumptions of posture reproducibility. These findings aim to inform ergonomic chair design, postural training, and individualized seating recommendations in sedentary environments.
2. Materials and Methods
2.1. Participants
A priori power analysis was conducted using G*Power (Version 3.1.9.7) to determine the required sample size for a mixed-design analysis of variance (ANOVA) involving both between-subject (gender: male, female) and within-subject factors (sitting strategy and chair type). Assuming a medium-to-large effect size (f = 0.45), an α level of 0.05, power (1 − β) of 0.80, two gender groups, and nine repeated measurements (3 strategies × 3 chairs), the analysis indicated that a minimum of 30 participants (15 per group) was required to detect statistically significant effects [35]. Our final sample met this criterion, consisting of 30 healthy young adults (15 men and 15 women), thereby ensuring adequate statistical power for detecting differences in postural variability—specifically in HI, TA, and KA—across different sitting strategies and chair types.
Participants were recruited from Ming Chi University of Technology and were screened to ensure they had no musculoskeletal disorders or injuries within the past year, particularly low back pain [2]. Exclusion criteria included any history of spinal surgery, current spinal discomfort or pain, recent lower limb or trunk trauma, and any neurological conditions affecting posture or balance. Prior to participation, all individuals received a comprehensive explanation of the study’s aims and procedures. The experiment complied with the ethical standards set forth in the 2013 Declaration of Helsinki and was approved by the Ethics Committee of National Taiwan University. Written informed consent was obtained from all participants, who were also compensated for their time. To minimize confounding effects on postural performance, participants were asked to refrain from strenuous physical activity, alcohol consumption, and sleep deprivation for at least 24 h before testing [36]. The male participants (n = 15) had a mean (±SD) age of 24.0 ± 4.6 years, height of 174.5 ± 6.8 cm, and weight of 74.8 ± 13.8 kg. Female participants (n = 15) had a mean age of 21.0 ± 2.4 years, height of 158.7 ± 5.1 cm, and weight of 52.3 ± 10.2 kg. These values were compared to normative Taiwanese anthropometric data [25] to confirm sample representativeness.
2.2. Sitting Environments
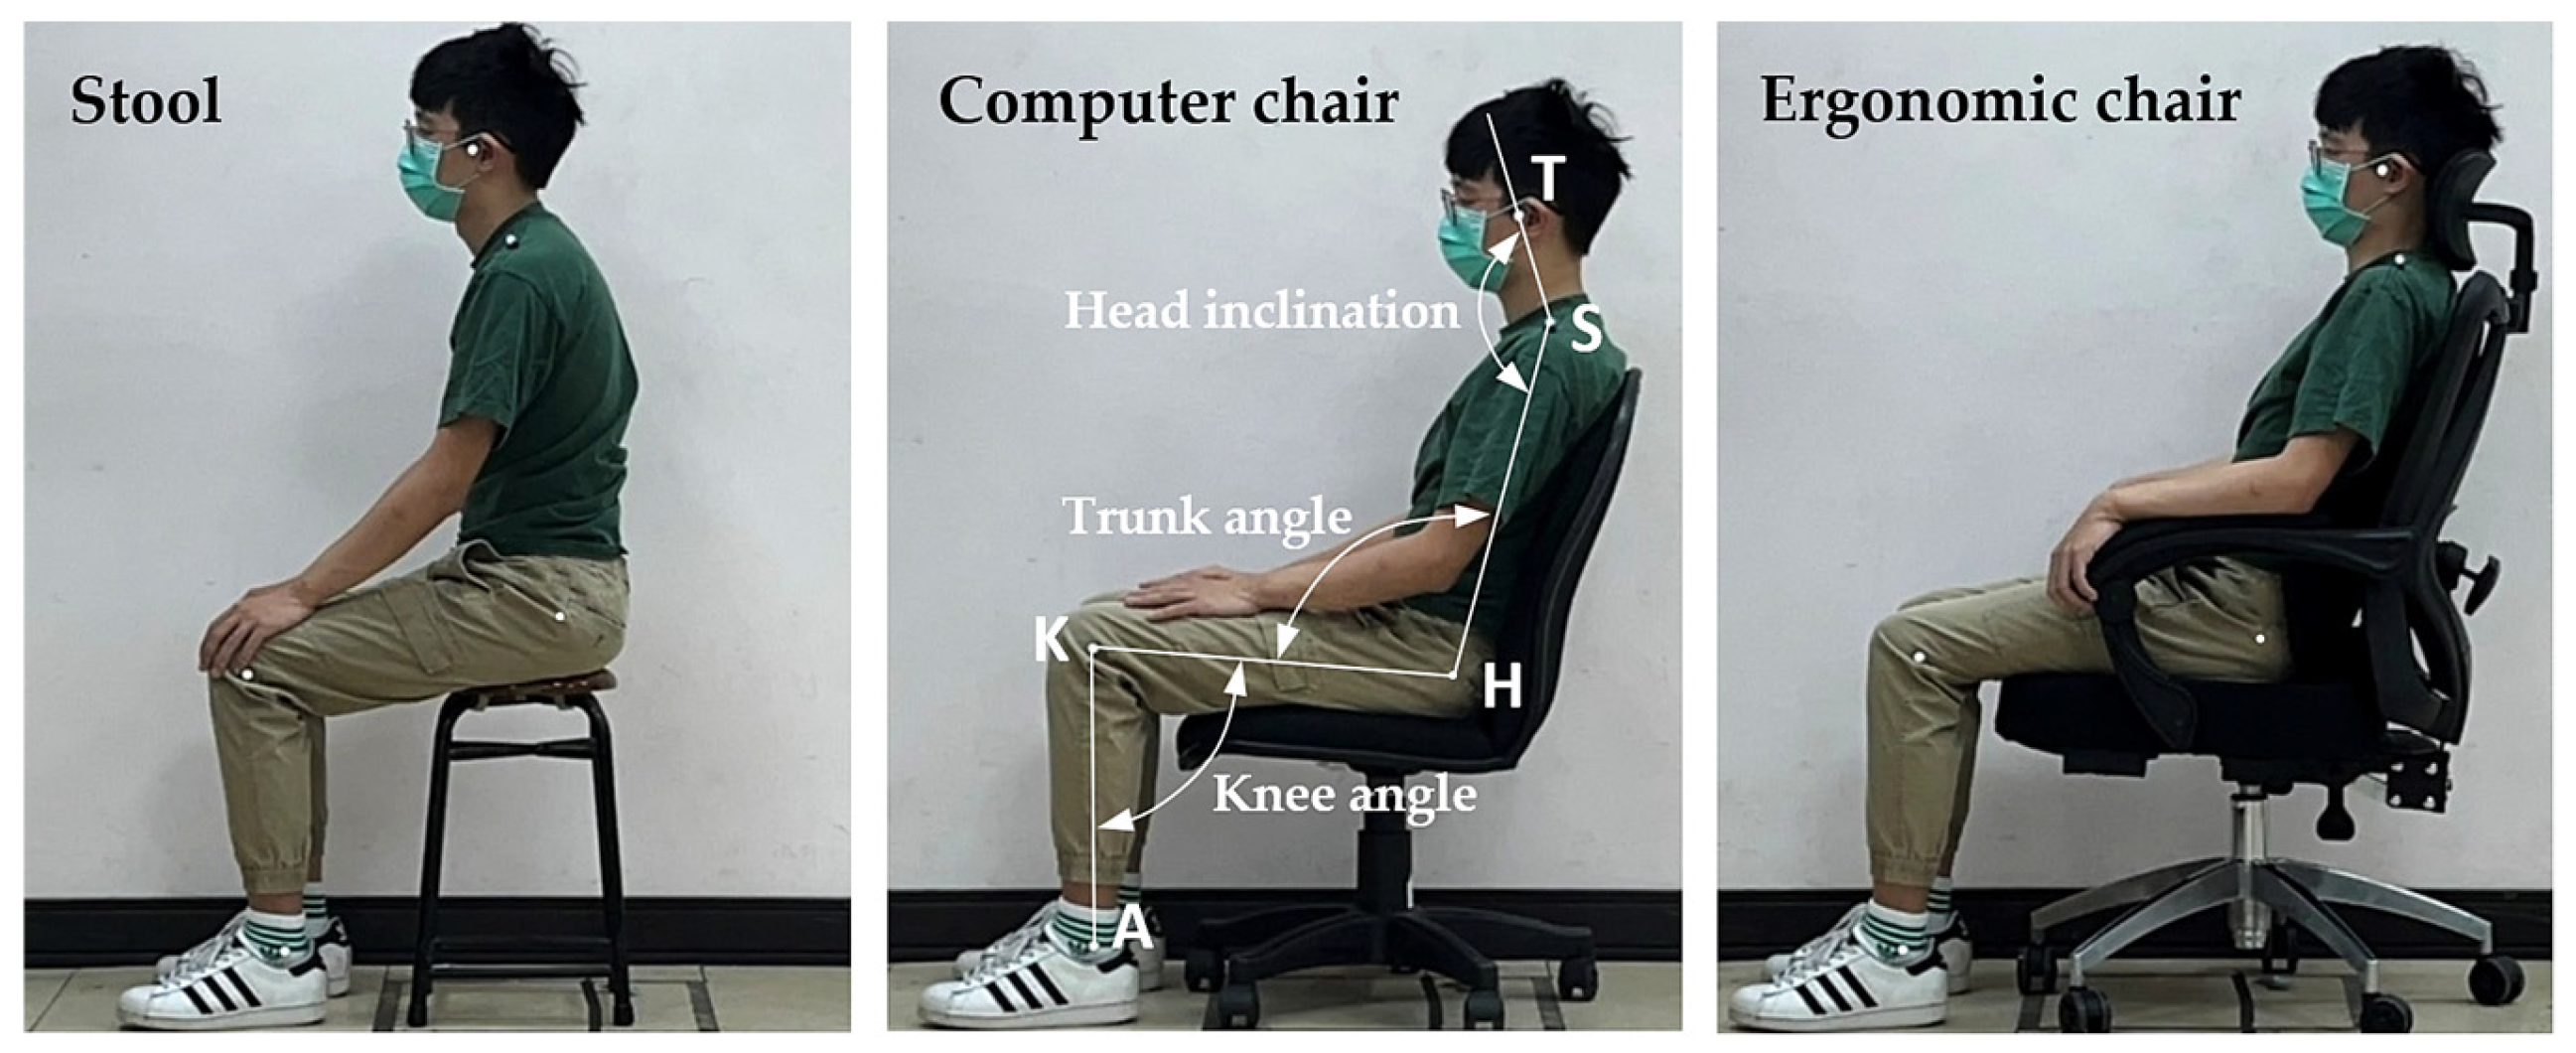
Three chair types were selected to represent a range of commonly used seating options in Taiwanese educational, occupational, and home environments [37]: a stool (X + Y Fashion Boutique Furniture, Tainan, Taiwan), a computer chair (Model SA03G, Cosmos, Taipei, Taiwan), and an ergonomic chair (FG14630, Future Lab, Taipei, Taiwan), as illustrated in Figure 1. These chairs were chosen based on their differing levels of adjustability, consistent with previous ergonomic research [34,38].
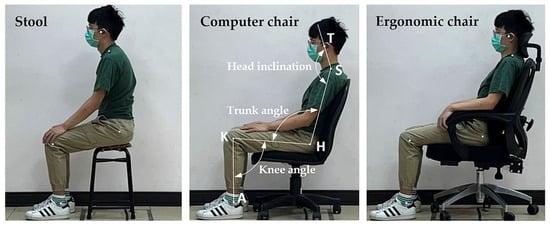
Figure 1.
Three types of chairs and global body joint angles examined in this study (T: tragus, S: shoulder, H: hip, K: knee, A: ankle).
The stool, serving as a baseline seating condition, lacked any adjustable features. It measured 29 cm in length and 47 cm in height and weighed 2 kg. The computer chair provided moderate adjustability, including an adjustable seat height and a fixed backrest angle of 90°. It measured 48.5 cm in length and 85 cm in height and weighed 8 kg. The ergonomic chair was the most adjustable, offering adjustable seat height, a reclining backrest (90–160°), and a movable headrest. It measured 66 cm in length and 115 cm in height and weighed 18.5 kg.
Before testing, all adjustable mechanisms were inspected for functionality. During the experimental sessions, participants were introduced to each chair’s features and allowed to make any necessary adjustments to achieve the assigned sitting strategy—comfortable, habitual, or correct—according to the task instructions. This familiarization ensured that participants could adopt their preferred or instructed strategies within the constraints of each chair type.
2.3. Global Body-Joint Angle Measurements
Prior to testing, five reflective markers (2 cm in diameter) were affixed to the participants’ left-side anatomical landmarks: the tragus (T), shoulder (S; acromial shelf), hip (H; greater trochanter), knee (K; lateral epicondyle), and ankle (A; lateral malleolus). These landmarks were identified through palpation by trained experimenters to ensure consistent marker placement. A second examiner verified the placements to enhance accuracy and reliability.
After participants assumed the assigned sitting strategy—comfortable, habitual, or correct—the sagittal plane joint angles were recorded using a motion analysis system (BTS Smart-D140, Milan, Italy), positioned approximately 5 m laterally and perpendicular to the participant’s sagittal plane (see Figure 1). The system was calibrated prior to each session according to manufacturer specifications, captured data at a sampling rate of 100 Hz, and recorded each posture for 5 s. The following three global joint angles were computed:
- Head inclination (HI): the angle between the vertical line and the line connecting the tragus and shoulder markers.
- Trunk angle (TA): the angle formed by the intersection of the line connecting the shoulder and hip markers with the line connecting the hip and knee markers.
- Knee angle (KA): the angle formed by the intersection of the line connecting the hip and knee markers with the line connecting the knee and ankle markers.
For each combination of sitting strategy and chair type, five repeated measurements were collected per participant to assess postural variability. From these repetitions, the mean and range (i.e., maximum–minimum) of each joint angle were calculated and used as dependent variables in subsequent analyses, following established protocols [34,39].
2.4. Measurement Procedures
A mixed factorial design was employed with gender (male, female) as the between-subject factor and chair type (stool, computer chair, ergonomic chair) and sitting strategy (comfortable, habitual, correct) as within-subject factors. The dependent variables were the mean and range values of three sagittal joint angles: HI, TA, and KA. To mitigate order and carryover effects, the sequence of chair types and sitting strategies was randomized for each participant. A total of 1350 trials were recorded (30 participants × 3 chair types × 3 strategies × 5 repeated measurements).
Participants were instructed to wear light, form-fitting clothing to facilitate the accurate placement of reflective markers over anatomical landmarks. Upon arrival, they were briefed on the experimental procedures and provided written informed consent. Anthropometric measurements were then taken, and markers were placed at standardized anatomical locations. Participants were familiarized with each chair and its adjustment features prior to testing. For each trial, the chair was preset by the experimenter to a randomized configuration (excluding the non-adjustable stool). Participants were subsequently instructed to adopt one of the three designated sitting strategies based on standardized guidelines.
The operational definitions of the three strategies—comfortable, habitual, and correct—were developed based on previous ergonomic and postural studies that investigated self-selected and instructed seated behaviors in laboratory and occupational settings [14,15,34]. Although these strategies are not formally standardized, they have been widely used to reflect posture variability under different task demands and environmental contexts. To minimize subjective interpretation, a pilot test was conducted with five individuals not included in the final sample. Feedback from the pilot was used to refine and clarify the verbal instructions. All instructions were delivered using a standardized script by the same experimenter to ensure consistency across participants.
- Comfortable sitting strategy: In this test, we would like to capture your most comfortable sitting posture. Please adjust the seat and your body until you feel maximally relaxed, with minimal stress on any part of your body. Once you feel that the posture is most comfortable, please say ‘YES’.
- Habitual sitting strategy: In this test, we aim to record your habitual sitting posture. Adjust the seat and your body until you feel you’ve adopted your most natural and familiar sitting position. When this posture feels like your usual way of sitting, please say ‘YES’.
- Correct sitting strategy: In this test, we aim to capture what you perceive to be the correct sitting posture. Adjust the seat and your body to what you believe is the most appropriate and supportive posture, minimizing any bodily resistance or discomfort. Once you believe the posture is correct, please say ‘YES’.
Once the participant confirmed the target postural strategy, they were instructed to maintain it for 5 s while the motion analysis system recorded the data. This process was repeated five times per condition. For adjustable chairs, the settings were randomized between trials; the stool remained unchanged.
To minimize fatigue and maintain data quality, a rest period of no less than 2 min and no more than 5 min was provided between trials. This interval was intentionally kept within the 2–5-min range to capture postural variation over a short period while limiting the influence of external or confounding factors that may arise with longer delays. During breaks, participants were encouraged to stand, walk, or sit on a non-experimental chair. The total duration of the experiment, including setup, testing, and rest intervals, was approximately 2 h per participant. All instructions and interactions were delivered by the same experimenter using standardized scripts to ensure consistency. Participants were not informed of the study’s hypotheses to reduce the risk of bias in posture selection [40].
2.5. Statistical Analysis
All statistical analyses were conducted using SPSS version 23.0 (IBM Corp., Armonk, NY, USA), with the significance level set at α = 0.05. Prior to inferential analyses, the data were screened for normality using the Shapiro–Wilk test and for homogeneity of variances using Levene’s test. Descriptive statistics (means, standard deviations, and ranges) were computed for each dependent variable across all experimental conditions.
To examine the effects of gender (between-subject factor), chair type, and sitting strategy (within-subject factors) on the three joint angles—HI, TA, and KA—a series of mixed-design three-way ANOVAs were conducted. Separate ANOVAs were performed for both the mean and the range (i.e., the difference between maximum and minimum values across five repeated trials) of each joint angle.
When significant main effects were identified, Duncan’s Multiple Range Test (MRT) was used for post hoc comparisons to determine specific differences among factor levels. For significant interaction effects, simple main effect analyses were carried out, followed by appropriate post hoc tests. Effect sizes were interpreted in terms of statistical power following Cohen’s criteria: ≥0.2 (small), ≥0.5 (medium), and ≥0.8 (large).
To assess the minimum change that can be confidently interpreted as real, the minimum detectable change at the 95% confidence level (MDC95) was calculated using the following formula: MDC95 = 1.96 × √2 × SEM, as recommended by Weir [41]. Joint angle variations exceeding the MDC95 threshold were interpreted as true changes beyond measurement error, with 95% confidence.
3. Results
The results are organized to reflect the factorial design of the study, which examined the effects of the sitting strategy (comfortable, habitual, correct), the chair type (stool, computer chair, ergonomic chair), and participant sex on seated posture. Key outcome measures included global joint angles of the neck, trunk, and lower limbs, as well as inter-trial variability and MDC values. The following subsections present the statistical findings in sequence: first, the main and interaction effects from the ANOVA analyses; second, post hoc comparisons where significant effects were observed; and third, analyses of postural variability and MDC across conditions.
3.1. Three-Way ANOVA for Joint Angle Means
The analysis of the mean joint angles (HI, TA, and KA) revealed several significant effects across the experimental factors, as shown in Table 1.

Table 1.
Three-way ANOVA results of the mean angle.
3.1.1. Head Inclination
The results showed that the chair type had a significant effect on head inclination (p < 0.001). However, no significant effects were found for gender, the sitting strategy, or their interactions (all p > 0.05). Post hoc comparisons indicated that HI was highest when participants sat on the stool, with an average value of 165.3° (Table 2). The computer chair resulted in a slightly lower mean of 158.2°, while the ergonomic chair, which provides greater adjustability and support, resulted in the lowest mean of 153.0°. These findings suggest that more adjustable chairs, such as the ergonomic chair with an adjustable backrest and headrest, led to a reduction in HI compared to less adjustable seating options.
Table 2.
Duncan test results of the mean angles under different chair types and sitting strategies.
3.1.2. Trunk Angle
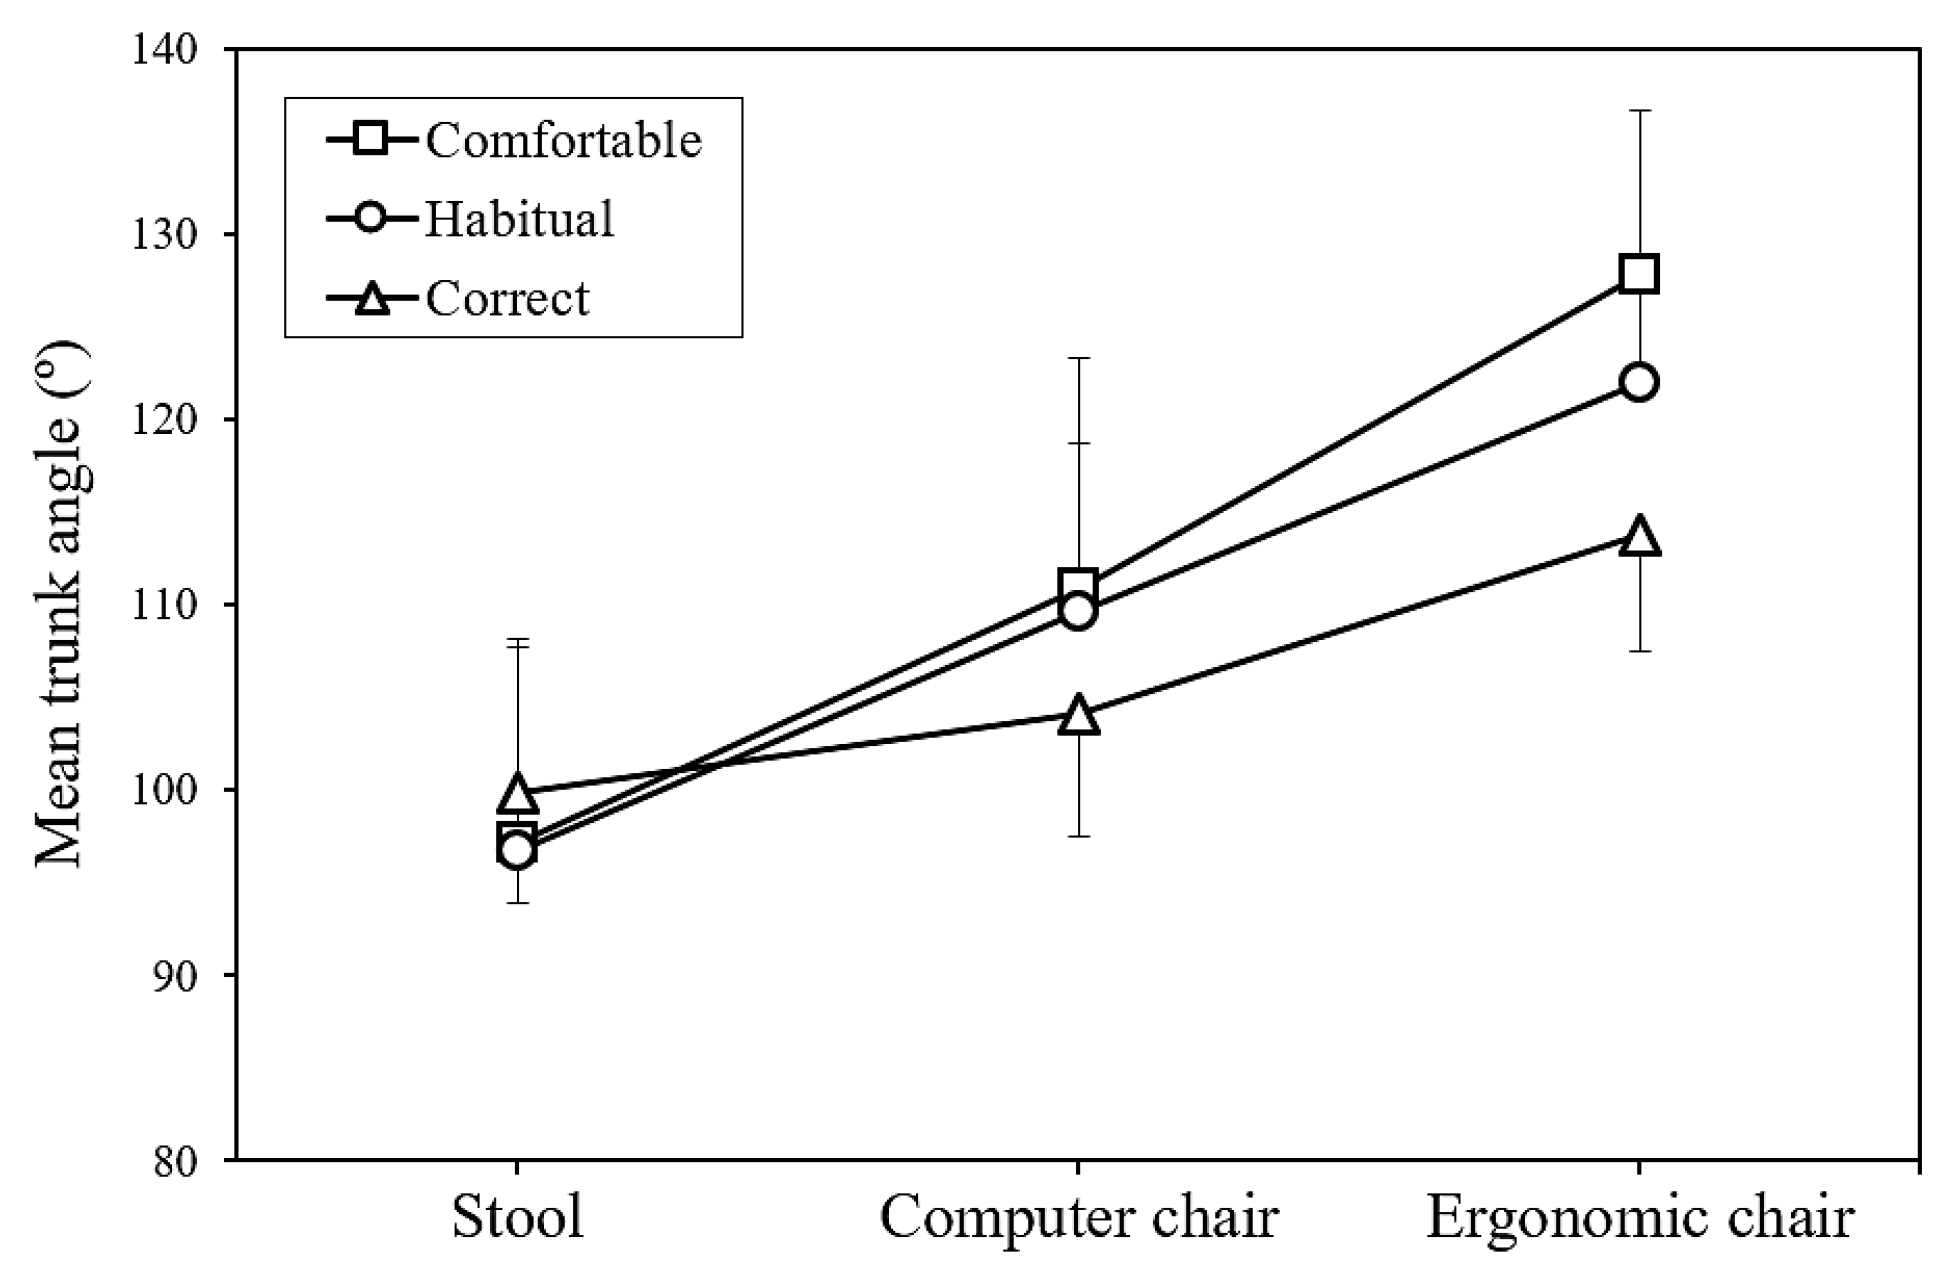
The TA was significantly affected by the sitting strategy, the chair type, and gender, with all factors showing a p-value of less than 0.001. Post hoc comparisons revealed that the TA was largest in the comfortable sitting strategy (111.9°), followed by the habitual sitting strategy (109.5°), and smallest in the correct sitting strategy (105.9°), as shown in Table 2. In terms of the chair type, the ergonomic chair yielded the highest TA (121.2°), followed by the computer chair (108.2°), and the stool produced the lowest TA (97.9°). The analysis also identified significant interaction effects between the sitting strategy and chair type (p < 0.001, Figure 2) as well as between the chair type and gender (p < 0.01, Figure 3). This suggests that the impact of the sitting strategy and chair type on TA is more complex and warrants further examination. In particular, the interaction between the sitting strategy and chair type showed that regardless of the sitting strategy adopted, the ergonomic chair consistently produced the largest TA, the computer chair produced an intermediate value, and the stool produced the smallest TA.

Figure 2.
Interaction of sitting strategy and chair type on mean trunk angle.
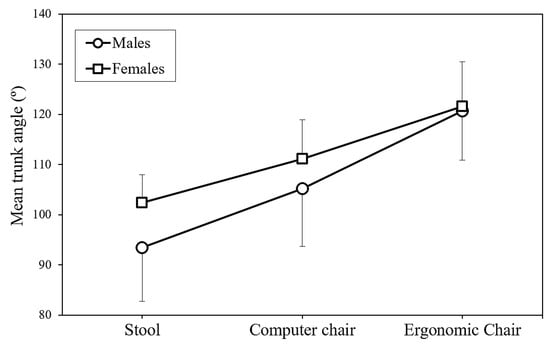
Figure 3.
Interaction of chair type and gender on mean trunk angle.
Gender differences were most apparent when sitting on the stool. Women had a larger TA (102.4°) compared to men (93.4°), with a difference of 9.0°. The difference was smaller when sitting on the computer chair (women: 111.2°, men: 105.2°, difference: 6.0°) and virtually negligible when sitting on the ergonomic chair (women: 121.6°, men: 120.7°, difference: 0.9°).
3.1.3. Knee Angle
The KA was significantly influenced by the sitting strategy (p < 0.01) and gender (p < 0.001). No significant effects were found for the chair type or any interaction effects (all p > 0.05). Post hoc comparisons revealed that the KA was greatest in the comfortable sitting strategy (99.4°), followed by the habitual sitting strategy (97.1°), and lowest in the correct sitting strategy (93.8°) (Table 2). Gender differences were also observed, with women demonstrating a greater KA (99.5°) compared to men (94.1°).
3.2. Three-Way ANOVA for Joint Angle Ranges
The analysis of the joint angle ranges, calculated as the difference between the maximum and minimum values across the five repeated trials, provided further insights into postural variability. As shown in Table 3, gender was found to significantly affect the ranges of both HI (p < 0.05) and TA (p < 0.01). The sitting strategy had a significant effect on the range of KA (p < 0.01).
Table 3.
Three-way ANOVA results of the range of the angle.
In terms of KA variability, participants showed the greatest range in the comfortable sitting strategy (12.8°) and the habitual sitting strategy (12.4°), with both of these significantly higher than the range observed in the correct sitting strategy (8.7°). These findings suggest that individuals were less consistent in their KAs when adopting more relaxed strategies (comfortable and habitual) compared to the correct strategy.
When examining gender differences, male participants exhibited greater variability in HI (11.4°) compared to females (9.2°) (Table 4). This suggests that men adopted less consistent head positions across repeated trials of the same sitting strategy. Similarly, men demonstrated greater variability in TA (8.0°) than women (5.7°), indicating that women maintained more consistent trunk positions across strategy repetitions.
Table 4.
Differences in angle range for HI, TA, and KA between genders.
3.3. Postural Variability Across All Test Combinations
Although the chair type did not significantly affect the ranges of any joint angles, an examination of all test combinations revealed substantial postural variability across all conditions. The average range values for the three joint angles across all chair types, sitting strategies, and participants were approximately 10.3° for HI, 6.9° for TA, and 11.3° for KA (Table 5). This high variability suggests that participants did not consistently adopt identical strategies when attempting to maintain the same sitting position multiple times, regardless of the chair type, sitting strategy, or gender.
Table 5.
Comparison between observed postural variability ranges and minimum detectable change (MDC95) values.
A comparison between observed postural variability ranges and the minimum detectable change (MDC95) values showed that the observed ranges were substantially higher than the MDC95 values (all ratios greater than 3.0, Table 5). This indicates that the postural variability observed in this study represents true biological variation rather than being attributed to measurement error.
4. Discussion
This study aimed to investigate postural variability in sagittal joint angles across three sitting strategies—comfortable, habitual, and correct—across three chair types—stool, computer chair, and ergonomic chair—and between genders. Our findings provide both support for and challenges to our initial hypotheses, offering new insights into the complex relationship between posture control, chair design, and user intention.
4.1. Postural Variability and Sitting Strategy
Our first hypothesis, that postural variability would be lowest during correct sitting compared to comfortable and habitual sitting, was only partially supported. Specifically, KA variability was significantly lower during correct sitting (8.7°) compared to comfortable (12.8°) and habitual (12.4°) sitting. This suggests that participants exercised more conscious control over their lower limb positioning when aiming for a ‘correct’ strategy. However, variability in HI and TA did not differ significantly across sitting strategies, implying that individuals may focus their efforts on maintaining certain body segments—such as the knees—while allowing for more natural movement in the upper body. This interpretation aligns with previous research that has found that lower-limb symmetry can be modulated through instruction [42] and that clinicians often target specific body regions when promoting postural correction [15].
4.2. Gender Differences in Trunk Angle and Variability
The second hypothesis, which predicted gender differences in TA, was supported. Female participants consistently exhibited more extended trunk postures than males (114.8° vs. 109.0°), with the largest difference observed when sitting on the stool. This gender-specific postural tendency is consistent with findings from prior studies, which suggest that women tend to sit more upright due to anatomical and biomechanical factors, such as greater lumbar lordosis, anterior pelvic tilt, and spinal flexibility [43,44,45]. Sociocultural influences may also shape posture preferences, as women are more often socialized to maintain upright postures in seated settings [8].
In addition to differences in TA, males exhibited greater postural variability than females in both HI (11.4° vs. 9.2°) and TA (8.0° vs. 5.7°), suggesting gender-specific differences in proprioceptive control or neuromuscular strategies. Previous research has shown that males and females activate trunk muscles differently during postural tasks [46,47], which could influence the consistency with which they maintain joint angles. Hormonal and neurophysiological differences may also play a role in modulating postural stability [48].
4.3. Chair Type and Postural Outcomes
Contrary to our third hypothesis, the chair type did not significantly influence postural variability for any of the joint angles measured. This finding challenges the expectation that more supportive or adjustable chairs, such as ergonomic chairs, would lead to more consistent posture adoption during ‘correct’ sitting and greater variability during ‘comfortable’ sitting. Instead, postural variability remained high across all chair types, suggesting that intrinsic factors such as individual differences in proprioception, comfort thresholds, and motor control may play a larger role in postural variability than chair design alone [21,31]. The market for ergonomic chairs has grown significantly, valued at USD 10.4 billion in 2024 and projected to reach USD 19.12 billion by 2033, as awareness of health and wellness in workplace environments continues to rise, reflecting growing recognition of the impact of seating design on health outcomes [49].
However, the chair type did significantly affect mean joint angles. Specifically, HI decreased progressively from the stool (165.3°) to the computer chair (158.2°) to the ergonomic chair (153.0°), indicating that back and head support may encourage a more forward head posture. This effect could be a result of users adjusting their head position to maintain gaze orientation while reclining or leaning back, which may increase cervical spine loading [50,51]. Additionally, we observed a significant interaction between the chair type and sitting strategy for TA. While ‘correct’ sitting promoted a more upright trunk in the computer and ergonomic chairs, the opposite was observed with the stool, where ‘correct’ sitting resulted in the most extended trunk posture. This interaction suggests that individuals’ perceptions of ‘correct’ posture are influenced by the biomechanical affordances and constraints of the seating surface [52].
4.4. Magnitude and Meaning of Postural Variability
Our fourth hypothesis, that postural variability would exceed the minimum detectable change (MDC95) threshold, was strongly supported. Across all conditions, the joint angle ranges for HI (10.3°), TA (6.9°), and KA (11.3°) consistently surpassed the MDC95 values, confirming that the observed fluctuations represent true biological variability rather than measurement noise [53,54]. These findings challenge the common assumption in ergonomics and clinical practice that individuals can reliably reproduce a given posture. Even under standardized instructions, participants exhibited substantial within-subject variation, suggesting that posture is inherently variable and context dependent.
Contemporary research has established a relationship between variability in postural control and the development of perceived discomfort. Both excessive and insufficient movement patterns have been implicated in contributing to musculoskeletal issues [55]. This bidirectional relationship between movement variability and discomfort reinforces the need for seating solutions that support natural movement while providing adequate stability and support.
4.5. Ergonomic and Clinical Implications
From an ergonomic standpoint, our results raise questions about the validity of memory-based seat adjustment systems in vehicles and offices, which assume stable posture preferences. Given the observed natural variability in posture, even within the same strategy and chair type, these systems may fail to account for dynamic postural needs. Future ergonomic designs should incorporate adjustable features that allow for natural movement and variability rather than enforcing a fixed “optimal” posture.
Clinically, our findings suggest a potential disconnect between comfortable sitting and postures recommended for spinal health. Specifically, we observed that comfortable sitting was associated with more extended trunk and knee angles, which contrasts with clinical recommendations promoting upright sitting to reduce spinal strain [56]. Recognizing that comfortable sitting may involve more extension, particularly in the lower body, could help inform more personalized and adaptable ergonomic or rehabilitation interventions.
4.6. Limitations and Future Directions
Several limitations should be acknowledged. First, the study included only young, healthy adults, which limits the generalizability of the findings to older individuals or populations with musculoskeletal disorders. Second, although the use of global sagittal joint angles provides a standardized and objective measure of posture, it does not capture underlying muscle activation or pressure distribution, which are essential for understanding the physiological basis of postural control. Third, potential confounding factors such as time of day, participant fatigue, and diurnal variation were not controlled or recorded, even though these variables may influence postural behavior. Additionally, the experimental protocol did not incorporate functional tasks typically performed while seated—such as computer work, reading, or interpersonal interactions—which would likely influence postural adjustments and biomechanical demands in real-world contexts. Although the controlled laboratory setting allowed for precise measurement of joint angles, it reduced ecological validity by overlooking how individuals naturally adjust their posture in response to environmental and task demands. For instance, postural strategies used during active computer work or customer-facing roles would likely differ from the static postures measured in this study.
To improve ecological validity and better reflect real-world scenarios, future research should incorporate task-based seated activities and extended observation periods to capture natural postural adaptations over time. In addition, integrating complementary tools such as surface electromyography or infrared thermography could provide deeper insights into the neuromuscular and thermal correlates of postural variability. These modalities have been successfully applied in posture-related contexts, including the evaluation of idiopathic scoliosis [57] and combined posture-thermography assessments in healthy individuals [58]. Furthermore, sensor-based motion tracking systems have shown promise for ergonomic risk evaluation during task engagement [59]. Incorporating these technologies could help elucidate the dynamic and individualized nature of seated posture in occupational and clinical applications.
Future research should examine postural variability across diverse age groups, occupational settings, and clinical populations. Longitudinal studies are needed to determine whether postural patterns change with prolonged exposure to specific chair types or posture training. Experimental designs should also incorporate longer observation periods with continuous monitoring to track postural evolution during realistic seated tasks. Moreover, integrating surface electromyography, pressure mapping, or infrared thermography with kinematic analysis may yield deeper insights into the neuromuscular and biomechanical mechanisms underlying posture regulation. Task-based evaluations—such as typing, reading, or interacting with clients—would further enhance ecological validity and support the development of targeted ergonomic interventions.
5. Conclusions
This study provides ergonomic insights into how postural variability manifests across different sitting strategies—comfortable, habitual, and correct—and chair types in healthy young adults. Significant within-subject variations were observed in head, trunk, and knee joint angles, often exceeding minimum detectable change thresholds. These findings indicate that seated posture is inherently variable, even under standardized conditions. While the chair type influenced mean joint positions, particularly in the head and trunk, it did not substantially reduce variability. Gender also played a role, with women generally adopting more extended trunk postures and showing lower variability in head and trunk angles compared to men.
These results have important implications for musculoskeletal health. They challenge the prevailing emphasis on replicable, “ideal” sitting postures in ergonomic design and clinical practice, suggesting instead that variability is a natural and potentially beneficial characteristic of human posture. Rigid seating solutions and static ergonomic guidelines may fall short in supporting long-term musculoskeletal function. Adaptive and flexible seating systems—designed to accommodate individual differences and dynamic postural shifts—may offer more effective support for maintaining musculoskeletal health in increasingly sedentary lifestyles. Future research should explore these dynamics in prolonged sitting contexts and across diverse populations to further inform ergonomic interventions and preventive strategies.
Author Contributions
Conceptualization, Y.-L.C.; methodology, Y.-L.C. and L.-P.Z.; software, L.-P.Z.; validation, Y.-L.C.; formal analysis, L.-P.Z.; investigation, Y.-L.C. and L.-P.Z.; resources, Y.-L.C.; data curation, L.-P.Z.; writing—original draft preparation, L.-P.Z.; writing—review and editing, Y.-L.C.; visualization, Y.-L.C.; supervision, Y.-L.C.; project administration, Y.-L.C.; funding acquisition, Y.-L.C. All authors have read and agreed to the published version of the manuscript.
Funding
This study was funded by the National Science and Technology Council (NSTC), Taiwan, grant number 113-2221-E-131-029-MY3, and the APC was also funded by NSTC.
Institutional Review Board Statement
The study was conducted in accordance with the Declaration of Helsinki and approved by the Research Ethics Committee of National Taiwan University in Taiwan (protocol code: NTU-REC 202312EM051 and date of approval: 29 January 2024).
Informed Consent Statement
Informed consent was obtained from all participants involved in the study.
Data Availability Statement
The data are available upon reasonable request to the corresponding author.
Acknowledgments
The authors would like to thank all participants for their contributions to the study.
Conflicts of Interest
Author Li-Peng Zhang was employed by the company Cheong Tat Technology. The remaining authors declare that the research was conducted in the absence of any commercial or financial relationships that could be construed as a potential conflict of interest.
References
- Underwood, D.; Sims, R. Do office workers adjust their chairs? End-user knowledge, use and barriers to chair adjustment. Appl. Ergon. 2019, 77, 100–106. [Google Scholar] [CrossRef] [PubMed]
- Waongenngarm, P.; van der Beek, A.J.; Akkarakittichoke, N.; Janwantanakul, P. Perceived musculoskeletal discomfort and its association with postural shifts during 4-h prolonged sitting in office workers. Appl. Ergon. 2020, 89, 103225. [Google Scholar] [CrossRef] [PubMed]
- Channak, S.; Klinsophon, T.; Janwantanakul, P. The effects of chair intervention on low back pain, discomfort, and trunk muscle activation in office workers: A systematic review. Int. J. Occup. Safe. Ergon. 2021, 28, 1722–1731. [Google Scholar] [CrossRef] [PubMed]
- Park, S.M.; Kim, H.J.; Jeong, H.; Kim, H.; Chang, B.S.; Lee, C.K.; Yeom, J.S. Longer sitting time and low physical activity are closely associated with chronic low back pain in population over 50 years of age: A cross-sectional study using the sixth Korea National Health and Nutrition Examination Survey. Spine J. 2018, 18, 2051–2058. [Google Scholar] [CrossRef]
- O’Sullivan, P.B.; Mitchell, T.; Bulich, P.; Waller, R.; Holte, J. The relationship between posture and back muscle endurance in industrial workers with flexion-related low back pain. Man. Ther. 2006, 11, 264–271. [Google Scholar] [CrossRef]
- Meng, Y.; Xue, Y.; Yang, S.; Wu, F.; Dong, Y. The associations between sedentary behavior and neck pain: A systematic review and meta-analysis. BMC Public Health 2025, 25, 453. [Google Scholar] [CrossRef]
- Lin, J.H.; Kaufman, B.; Lin, R.T.; Bao, S. Sedentary behavior and musculoskeletal symptoms among work from home employees. Int. J. Ind. Ergon. 2024, 104, 103653. [Google Scholar] [CrossRef]
- Gilman, S.L. Stand Up Straight!: A History of Posture; Reaktion Books Ltd.: London, UK, 2018. [Google Scholar]
- O’Sullivan, K.; O’Keeffe, M.; O’Sullivan, L.; O’Sullivan, P.; Dankaerts, W. Perceptions of sitting posture among members of the community, both with and without non-specific chronic low back pain. Man. Ther. 2013, 18, 551–556. [Google Scholar] [CrossRef]
- Dolan, P.; Adams, M.A.; Hutton, W.C. Commonly adopted postures and their effect on the lumbar spine. Spine 1988, 13, 197–201. [Google Scholar] [CrossRef]
- Korakakis, V.; O’Sullivan, K.; Whiteley, R.; O’Sullivan, P.B.; Korakaki, A.; Kotsifaki, A.; Tsaklis, P.V.; Tsiokanos, A.; Giakas, G. Notions of “optimal” posture are loaded with meaning. Perceptions of sitting posture among asymptomatic members of the community. Musculoskel. Sci. Pract. 2021, 51, 102310. [Google Scholar] [CrossRef]
- Mabb, S.; Bettany-Saltikov, J.; Hodgson, D. Habitual, perceived ideal and neutral sitting postures within an asymptomatic young adult population: Muscle activity and sagittal spinal curvature. Scoliosis 2013, 8, O37. [Google Scholar] [CrossRef]
- Barczyk-Pawelec, K.; Sipko, T. Active self-correction of spinal posture in pain-free women in response to the command “straighten your back”. Women Health 2017, 57, 1098–1114. [Google Scholar] [CrossRef] [PubMed]
- O’Sullivan, K.; O’Sullivan, P.; O’Sullivan, L.; Dankaerts, W. What do physiotherapists consider to be the best sitting spinal posture? Man. Ther. 2012, 17, 432–437. [Google Scholar] [CrossRef] [PubMed]
- Korakakis, V.; O’Sullivan, K.; O’Sullivan, P.B.; Evagelinou, V.; Sotiralis, Y.; Sideris, A.; Sakellariou, K.; Karanasios, S.; Giakas, G. Physiotherapist perceptions of optimal sitting and standing posture. Muscoskel. Sci. Pract. 2019, 39, 24–31. [Google Scholar] [CrossRef]
- Laird, R.A.; Gilbert, J.; Kent, P.; Keating, J.L. Comparing lumbo-pelvic kinematics in people with and without back pain: A systematic review and meta-analysis. BMC Muscoskel. Disord. 2014, 15, 229. [Google Scholar] [CrossRef]
- Slater, D.; Korakakis, V.; O’Sullivan, P.; Nolan, D.; O’Sullivan, K. “Sit up straight”: Time to Re-evaluate. J. Orthop. Sports Phys. Ther. 2019, 49, 562–564. [Google Scholar] [CrossRef]
- Nadeem, M.; Elbasi, E.; Zreikat, A.I.; Sharsheer, M. Sitting posture recognition systems: Comprehensive literature review and analysis. Appl. Sci. 2024, 14, 8557. [Google Scholar] [CrossRef]
- Adams, M.A.; Bogduk, N.; Burton, K.; Dolan, P. The Biomechanics of Back Pain, 3rd ed.; Elsevier Health Sciences: Edinburgh, UK, 2012. [Google Scholar]
- Davis, K.G.; Kotowski, S.E. Postural variability: An effective way to reduce musculoskeletal discomfort in office work. Hum. Factors 2014, 56, 1249–1261. [Google Scholar] [CrossRef]
- Dunk, N.M.; Callaghan, J.P. Gender-based differences in postural responses to seated exposures. Clin. Biomech. 2005, 20, 1101–1110. [Google Scholar] [CrossRef]
- Genaidy, A.M.; Karwowski, W. The effects of neutral posture on perceived joint discomfort ratings in sitting and standing postures. Ergonomics 1993, 36, 785–792. [Google Scholar] [CrossRef]
- Zhang, L.; Helander, M.G.; Drury, C.G. Identifying factors of comfort and discomfort in sitting. Human Factors 1996, 38, 377–389. [Google Scholar] [CrossRef]
- Kee, D.; Karwowski, W. The boundaries for joint angles of isocomfort for sitting and standing males based on perceived comfort of static joint postures. Ergonomics 2001, 44, 614–648. [Google Scholar] [CrossRef] [PubMed]
- Wang, E.M.Y.; Wang, M.J.; Yeh, W.Y.; Shih, Y.C.; Lin, Y.C. Development of anthropometric work environment for Taiwanese workers. Int. J. Ind. Ergon. 1999, 23, 3–8. [Google Scholar] [CrossRef]
- Alaca, N.; Acar, A.Ö.; Öztürk, S. Low back pain and sitting time, posture and behavior in office workers: A scoping review. J. Back Musculoskelet. Rehabil. 2025, 10538127251320320. [Google Scholar] [CrossRef]
- Daruis, D.D.I.; Mansor, M.R.; Abdullah, A.H. Anthropometric data of Malaysian primary school children. Int. J. Ind. Ergon. 2011, 41, 28–35. [Google Scholar] [CrossRef]
- Depreli, Ö.; Topcu, Z.G.; Tomaç, H. Mismatch between fixed classroom furniture and anthropometric measurements among university students: Relationships to ergonomic risk. Work 2024, 79, 831–840. [Google Scholar] [CrossRef]
- Wilder, D.; Magnusson, M.L.; Fenwick, J.; Pope, M. The effect of posture and seat suspension design on discomfort and back muscle fatigue during simulated truck driving. Appl. Ergon. 1994, 25, 66–76. [Google Scholar] [CrossRef]
- De Looze, M.P.; Kuijt-Evers, L.F.M.; Van Dieën, J. Sitting comfort and discomfort and the relationships with objective measures. Ergonomics 2003, 46, 985–997. [Google Scholar] [CrossRef]
- Wang, Y.; Lei, X.; Ma, Y. The Effect of swivel chairs on lumbar health in individuals with TFCLs sitting Habits: An analysis of lumbar disc Mechanical characteristics during Postural changes. J. Biomech. 2025, 178, 112435. [Google Scholar] [CrossRef]
- Hiemstra-van Mastrigt, S.; Groenesteijn, L.; Vink, P.; Kuijt-Evers, L.F. Predicting passenger seat comfort and discomfort on the basis of human, context and seat characteristics: A literature review. Ergonomics 2017, 60, 889–911. [Google Scholar] [CrossRef]
- Secretlab. The Science Behind A Good Ergonomic Chair. Available online: https://secretlab.co/pages/ergonomics (accessed on 2 May 2025).
- Chen, Y.L.; Chan, Y.C.; Zhang, L.P. Postural variabilities associated with the most comfortable sitting postures: A preliminary study. Healthcare 2021, 9, 1685. [Google Scholar] [CrossRef] [PubMed]
- Faul, F.; Erdfelder, E.; Lang, A.G.; Buchner, A. G*Power 3: A flexible statistical power analysis program for the social, behavioral, and biomedical sciences. Behav. Res. Methods 2007, 39, 175–191. [Google Scholar] [CrossRef] [PubMed]
- Gyi, D.E.; Porter, J.M. Interface pressure and the prediction of car seat discomfort. Appl. Ergon. 1999, 30, 99–107. [Google Scholar] [CrossRef]
- Chen, K.M.; Shen, S.T.; Prior, S.D. The provision of digital information in the seat comfort of the seat design. In International Conference on Human-Computer Interaction; Springer: Berlin/Heidelberg, Germany, 2011; pp. 325–329. [Google Scholar] [CrossRef]
- O’Keeffe, M.; Dankaerts, W.; O’Sullivan, P.; O’Sullivan, L.; O’Sullivan, K. Specific flexion-related low back pain and sitting: Comparison of seated discomfort on two different chairs. Ergonomics 2013, 56, 650–658. [Google Scholar] [CrossRef]
- Korakakis, V.; Sideris, V.; Giakas, G. Sitting bodily configuration: A study investigating the intra-tester reliability of positioning subjects into a predetermined sitting posture. Man. Ther. 2014, 19, 197–202. [Google Scholar] [CrossRef]
- Helander, M.G. Forget about ergonomics in chair design? Focus on aesthetics and comfort! Ergonomics 2003, 46, 1306–1319. [Google Scholar] [CrossRef]
- Weir, J.P. Quantifying test-retest reliability using the intraclass correlation coefficient and the SEM. J. Strength Cond. Res. 2005, 19, 231–240. [Google Scholar] [CrossRef]
- Lee, J.H.; Min, D.K.; Choe, H.S.; Lee, J.H.; Shin, S.H. The effects of upper and lower limb position on symmetry of vertical ground reaction force during sit-to-stand in chronic stroke subjects. J. Phys. Ther. Sci. 2018, 30, 242–247. [Google Scholar] [CrossRef]
- Levine, D.; Whittle, M.W. The effects of pelvic movement on lumbar lordosis in the standing position. J. Orthop. Sports Phys. Ther. 1996, 24, 130–135. [Google Scholar] [CrossRef]
- Potter, J.J.; Sauer, J.L.; Weisshaar, C.L.; Thelen, D.G.; Ploeg, H.L. Gender differences in bicycle saddle pressure distribution during seated cycling. Med. Sci. Sports Exerc. 2008, 40, 1126–1134. [Google Scholar] [CrossRef]
- Dunk, N.M.; Kedgley, A.E.; Jenkyn, T.R.; Callaghan, J.P. Evidence of a pelvis-driven flexion pattern: Are the joints of the lower lumbar spine fully flexed in seated postures? Clin. Biomech. 2009, 24, 164–168. [Google Scholar] [CrossRef]
- Anders, C.; Brose, G.; Hofmann, G.O.; Scholle, H.C. Gender specific activation patterns of trunk muscles during whole body tilt. Eur. J. Appl. Physiol. 2007, 101, 195–205. [Google Scholar] [CrossRef] [PubMed]
- Gribble, P.A.; Robinson, R.H.; Hertel, J.; Denegar, C.R. The effects of gender and fatigue on dynamic postural control. J. Sport Rehabil. 2009, 18, 240–257. [Google Scholar] [CrossRef] [PubMed]
- Berkley, K.J. Sex differences in pain. Behav. Brain Sci. 1997, 20, 371–380. [Google Scholar] [CrossRef]
- Straits Research. Ergonomic Chair Market Size, Share & Growth Graph by 2033. Available online: https://straitsresearch.com/report/ergonomic-chair-market (accessed on 2 May 2025).
- Vasavada, A.N.; Li, S.; Delp, S.L. Three-dimensional isometric strength of neck muscles in humans. Spine 2001, 26, 1904–1909. [Google Scholar] [CrossRef] [PubMed]
- Szeto, G.P.; Straker, L.M.; O’Sullivan, P.B. A comparison of symptomatic and asymptomatic office workers performing monotonous keyboard work—2: Neck and shoulder kinematics. Man. Ther. 2005, 10, 281–291. [Google Scholar] [CrossRef]
- Straker, L.; Mekhora, K. An evaluation of visual display unit placement by electromyography, posture, discomfort and preference. Int. J. Ind. Ergon. 2000, 26, 389–398. [Google Scholar] [CrossRef]
- Niggli, L.A.; Eichelberger, P.; Bangerter, C.; Baur, H.; Schmid, S. Between-session reliability of skin marker-derived spinal kinematics during functional activities. Gait Posture 2021, 85, 280–284. [Google Scholar] [CrossRef]
- Wilken, J.M.; Rodriguez, K.M.; Brawner, M.; Darter, B.J. Reliability and minimal detectible change values for gait kinematics and kinetics in healthy adults. Gait Posture 2012, 35, 301–307. [Google Scholar] [CrossRef]
- Søndergaard, K.H.; Olesen, C.G.; Søndergaard, E.K.; De Zee, M.; Madeleine, P. The variability and complexity of sitting postural control are associated with discomfort. J. Biomech. 2010, 43, 1997–2001. [Google Scholar] [CrossRef]
- O’Sullivan, P.; Caneiro, J.P.; O’Keeffe, M.; O’Sullivan, K. Unraveling the complexity of low back pain. J. Orthop. Sports Phys. Ther. 2016, 46, 932–937. [Google Scholar] [CrossRef] [PubMed]
- Roggio, F.; Petrigna, L.; Filetti, V.; Vitale, E.; Rapisarda, V.; Musumeci, G. Infrared thermography for the evaluation of adolescent and juvenile idiopathic scoliosis: A systematic review. J. Therm. Biol. 2023, 113, 103524. [Google Scholar] [CrossRef] [PubMed]
- Roggio, F.; Petrigna, L.; Trovato, B.; Zanghì, M.; Sortino, M.; Vitale, E.; Rapisarda, L.; Testa, G.; Pavone, V.; Pavone, P.; et al. Thermography and rasterstereography as a combined infrared method to assess the posture of healthy individuals. Sci. Rep. 2023, 13, 4263. [Google Scholar] [CrossRef] [PubMed]
- Senjaya, W.F.; Yahya, B.N.; Lee, S.L. Sensor-based motion tracking system evaluation for RULA in assembly task. Sensors 2022, 22, 8898. [Google Scholar] [CrossRef]

Disclaimer/Publisher’s Note: The statements, opinions and data contained in all publications are solely those of the individual author(s) and contributor(s) and not of MDPI and/or the editor(s). MDPI and/or the editor(s) disclaim responsibility for any injury to people or property resulting from any ideas, methods, instructions or products referred to in the content. |
© 2025 by the authors. Licensee MDPI, Basel, Switzerland. This article is an open access article distributed under the terms and conditions of the Creative Commons Attribution (CC BY) license (https://creativecommons.org/licenses/by/4.0/).