Article

Multiple-Diffraction Subtractive Double Monochromator with High Resolution and Low Stray Light

1
Laboratory of Opto-Electronics Information Technology, Tianjin University, Ministry of Education, Tianjin 300072, China
2
Tianjin Deviser Photoelectric Technology Co., Tianjin 300380, China
3
State Key Laboratory of Precision Measurement Technology and Instruments, Tsinghua University, Beijing 100084, China
*
Author to whom correspondence should be addressed.
Appl. Sci. 2025, 15(13), 7232; https://doi.org/10.3390/app15137232
Submission received: 11 June 2025 / Accepted: 20 June 2025 / Published: 27 June 2025
(This article belongs to the Special Issue Advanced Spectroscopy Technologies)

Abstract

Spectrometers play a crucial role in photonic applications, but their design involves trade-offs related to miniaturization, spectral fidelity, and their measurement dynamic range. We demonstrated a high-resolution, low-stray-light spectrometer with a compact size comprising two symmetric multiple-diffraction monochromators. We analyzed the spectral resolution and stray light and built a platform with two double-diffraction monochromators. Multiple diffractions on one grating increased the spectral resolution without volumetric expansion, and the subtractive double-monochromator configuration suppressed stray light effectively. The simulation and experimental results show that compared with single diffraction, repeated diffractions improved the resolution by 5–7 times. The spectral resolution of the home-built setup was 18.8 pm at 1480 nm. The subtractive double monochromator significantly weakened the stray light. The optical signal-to-noise ratio was increased from 34.76 dB for the single monochromator to 69.17 dB for the subtractive double monochromator. This spectrometer design is promising for broadband high-resolution spectral analyses.

1. Introduction

Grating spectrometers disperse polychromatic light, enabling spectroscopic analyses to determine the chemical composition and other properties of various materials. These instruments are widely used in communication networks, astronomical observations, metallurgical industries, pollution control, and food safety [1,2,3]. In addition, spectrometers are also used to evaluate lighting quality, such as measuring the spectral power distribution of a light source [4,5,6]. Some applications require these devices to be highly accurate and portable. Hence, the design of grating spectrometers has been trending toward achieving high resolution and miniaturization [7].
The spectral resolution of a spectrometer can be effectively enhanced using higher diffraction orders, increasing the incidence and diffraction angles, or increasing the number of illuminated grooves in the grating. For instance, Echelle gratings with relatively high groove spacing provide higher resolving power because they are used at large angles and with high diffraction orders [8,9]. Echelle gratings with higher groove densities and larger ruled widths are more effective in terms of resolution. However, Echelle gratings require cross-dispersion because of order overlap, and the acquisition of a spectrum in two dimensions requires area array detectors, which can be expensive for broadband spectral detections that do not require completing the analysis in one shot [10,11,12,13,14]. Moreover, it is difficult to fabricate Echelle gratings with a high groove density and large ruled width, and the resolution power of a dispersion system inevitably depends on the volume of the optics [15,16,17].
Numerous new technologies have been developed for compact, high-resolution dispersion mounts [7,18]. Some approaches focus on new dispersion elements, such as virtual imaging phased arrays (VIPAs) [19,20], crossed gratings [21], and arrayed waveguide gratings (AWGs) [22,23], which have shown promise for future high-resolution spectrometers; notably, these methods have enabled spectrometer miniaturization to chip-scale dimensions. However, they are expensive for current commercial uses. Other methods are concerned with the innovation of optical structures using conventional optical elements, enhancing resolution and compressing volume. Multiple diffractions can be achieved, for example, through a grating multiplexing structure [24,25] or the double-grating approach [26,27]. These improved mounts can successfully increase the resolution while ensuring a compact size. However, in plane-grating diffraction spectrometers, the stray-light level fundamentally constrains the instrument’s spectral performance [28,29,30]. In recent years, comprehensive mathematical treatments and comparative analyses of stray-light and noise issues in grating spectrometers have emerged alongside well-established measurement systems and robust suppression strategies [31,32,33]. While multiple diffraction processes enhance spectral resolution, they inevitably elevate stray-light intensity and degrade the optical signal-to-noise ratio (OSNR), which are important for grating spectrometers to ensure accurate and sensitive spectral analysis. Hence, increasing the spectral resolution while suppressing stray light within a compact volume is a challenge in the design of high-precision grating spectrometers.
To address the aforementioned issues related to spectral resolution and OSNR, we developed a multiple-diffraction subtractive double monochromator (MSDM) comprising two symmetrical multiple-diffraction monochromators in series. In the first monochromator (FM), the incident light is diffracted repeatedly on the same grating and then exits from a resolution slit, thereby achieving a high spectral resolution. The second monochromator (SM) is a duplicate of the FM; however, its optical layout is completely inverted. The SM produces the opposite dispersion effect to merge the stray light. We derived a unified formula for multiple diffractions in grating-based spectrometers and established the quantitative stray-light suppression principle of the subtractive double monochromator. Based on this theoretical foundation, we designed, constructed, and experimentally validated a prototype MSDM system operating in the 1250–1650 nm near-infrared band. Compared with the conventional single-diffraction dispersion method, the angular resolution of a double-diffraction method could be enhanced by a factor of 5–7, and the subtractive double monochromator weakened the stray light by a hundredfold. The experimental results show that the resolution is 18.8 pm within the 1250–1650 nm band, and the OSNR reaches approximately 70 dB.
The MSDM serves as the core spectroscopic module for both emission and absorption spectrometers. While the current prototype has been experimentally validated for the near-infrared band (1250–1650 nm), the underlying design principle can be readily extended to other spectral ranges, including visible and UV bands, through optical component adaptation. In the telecommunications wavelength band, it can detect optical communication channels, while in the UV-visible range, it enables elemental analysis. This study holds great promise for high-precision and high-sensitivity spectral detection.

2. Principle

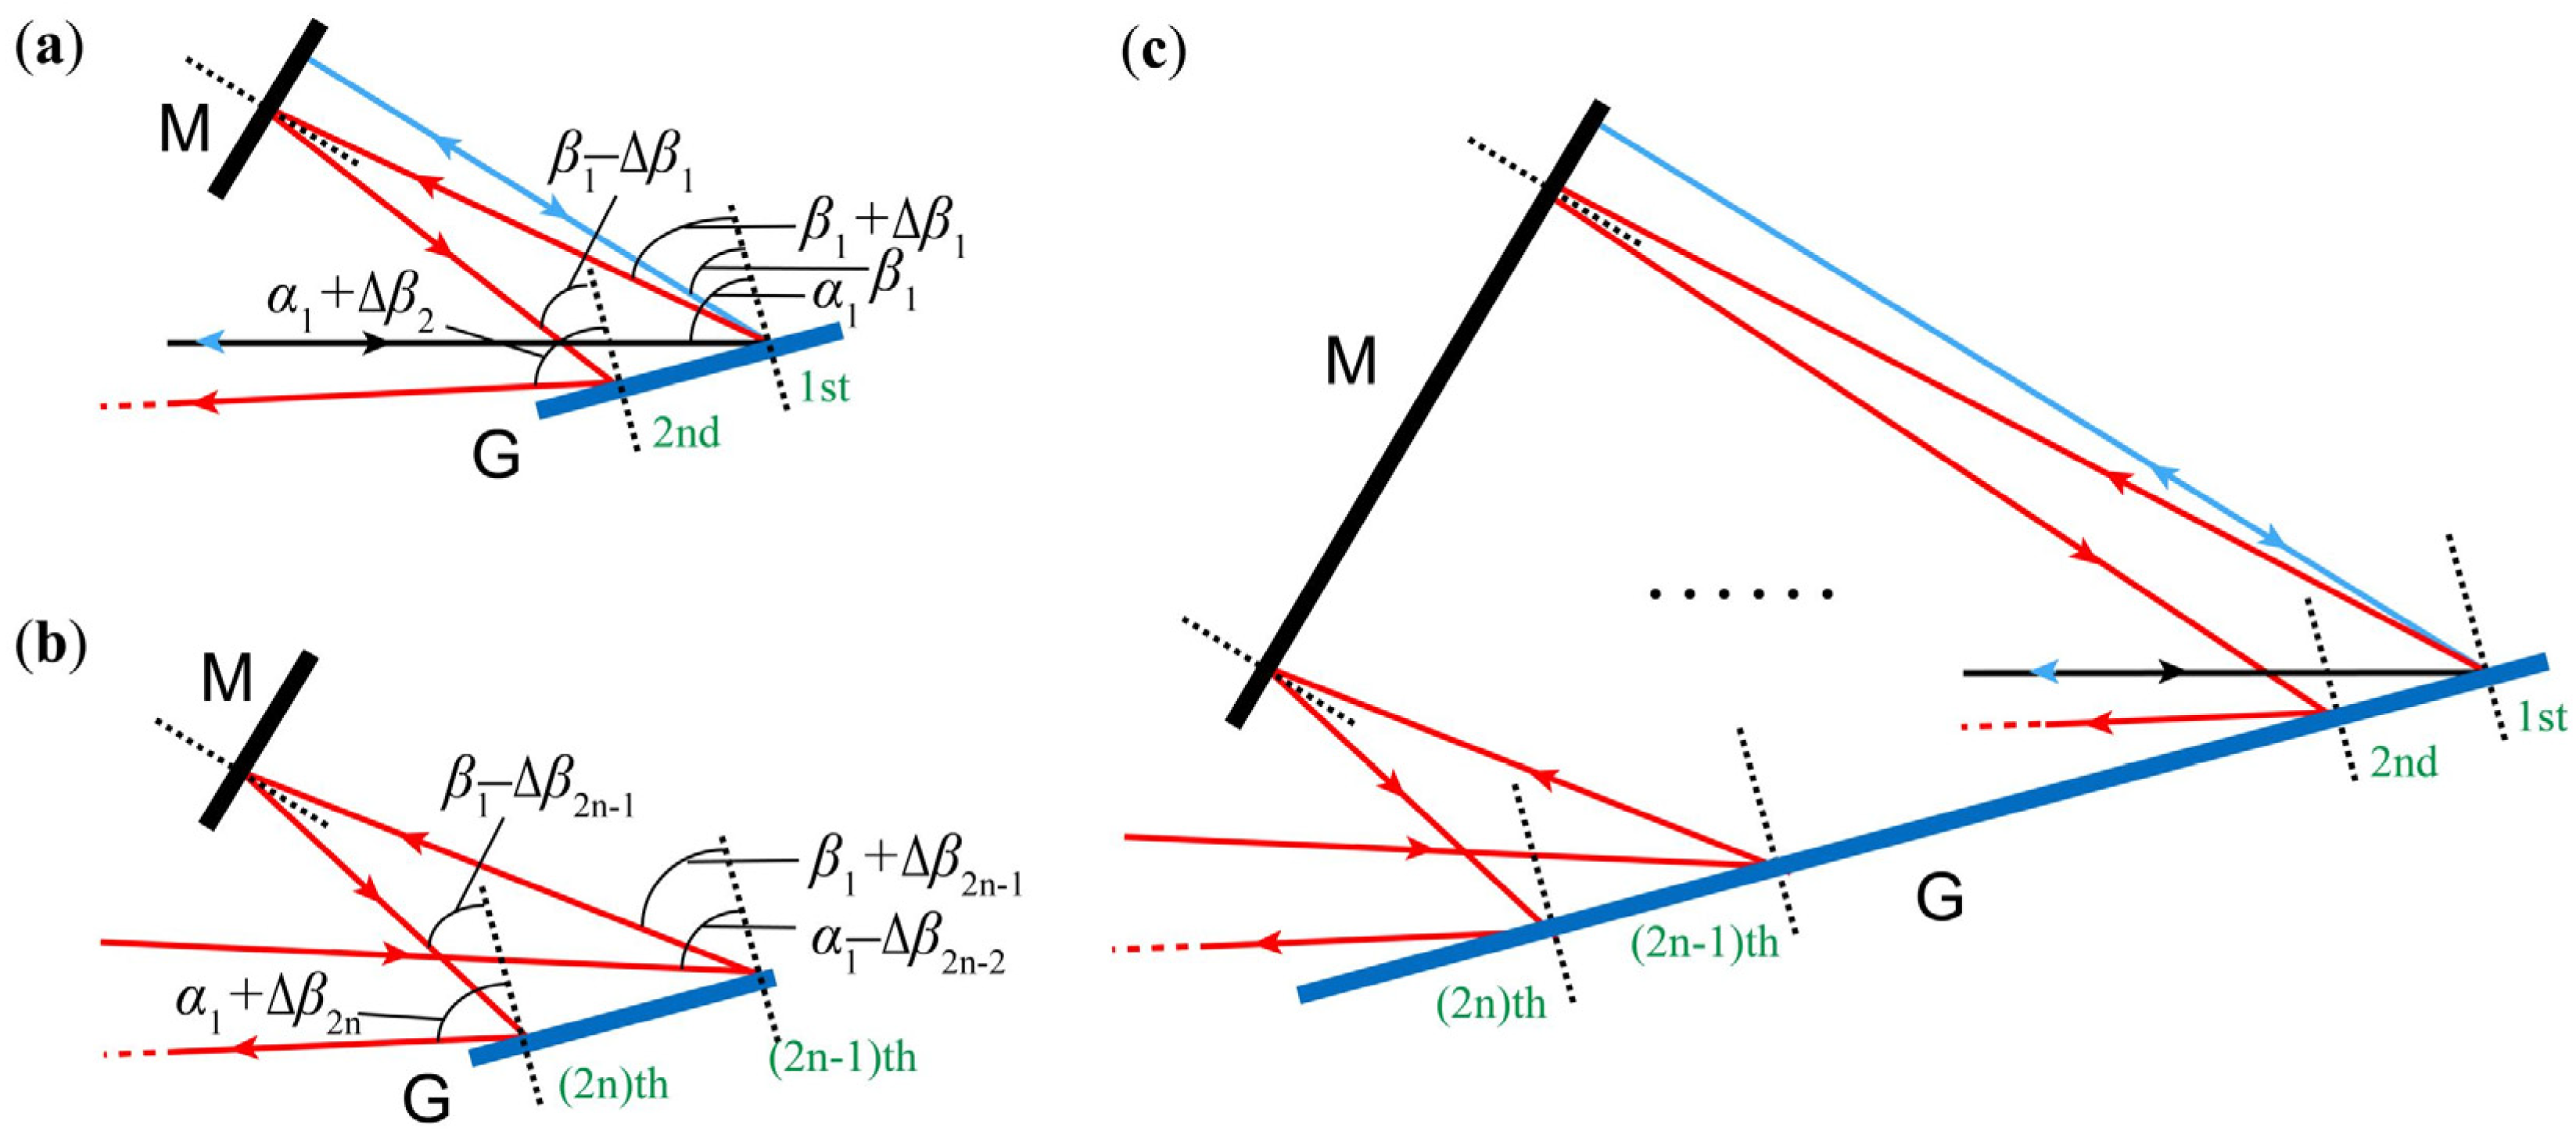
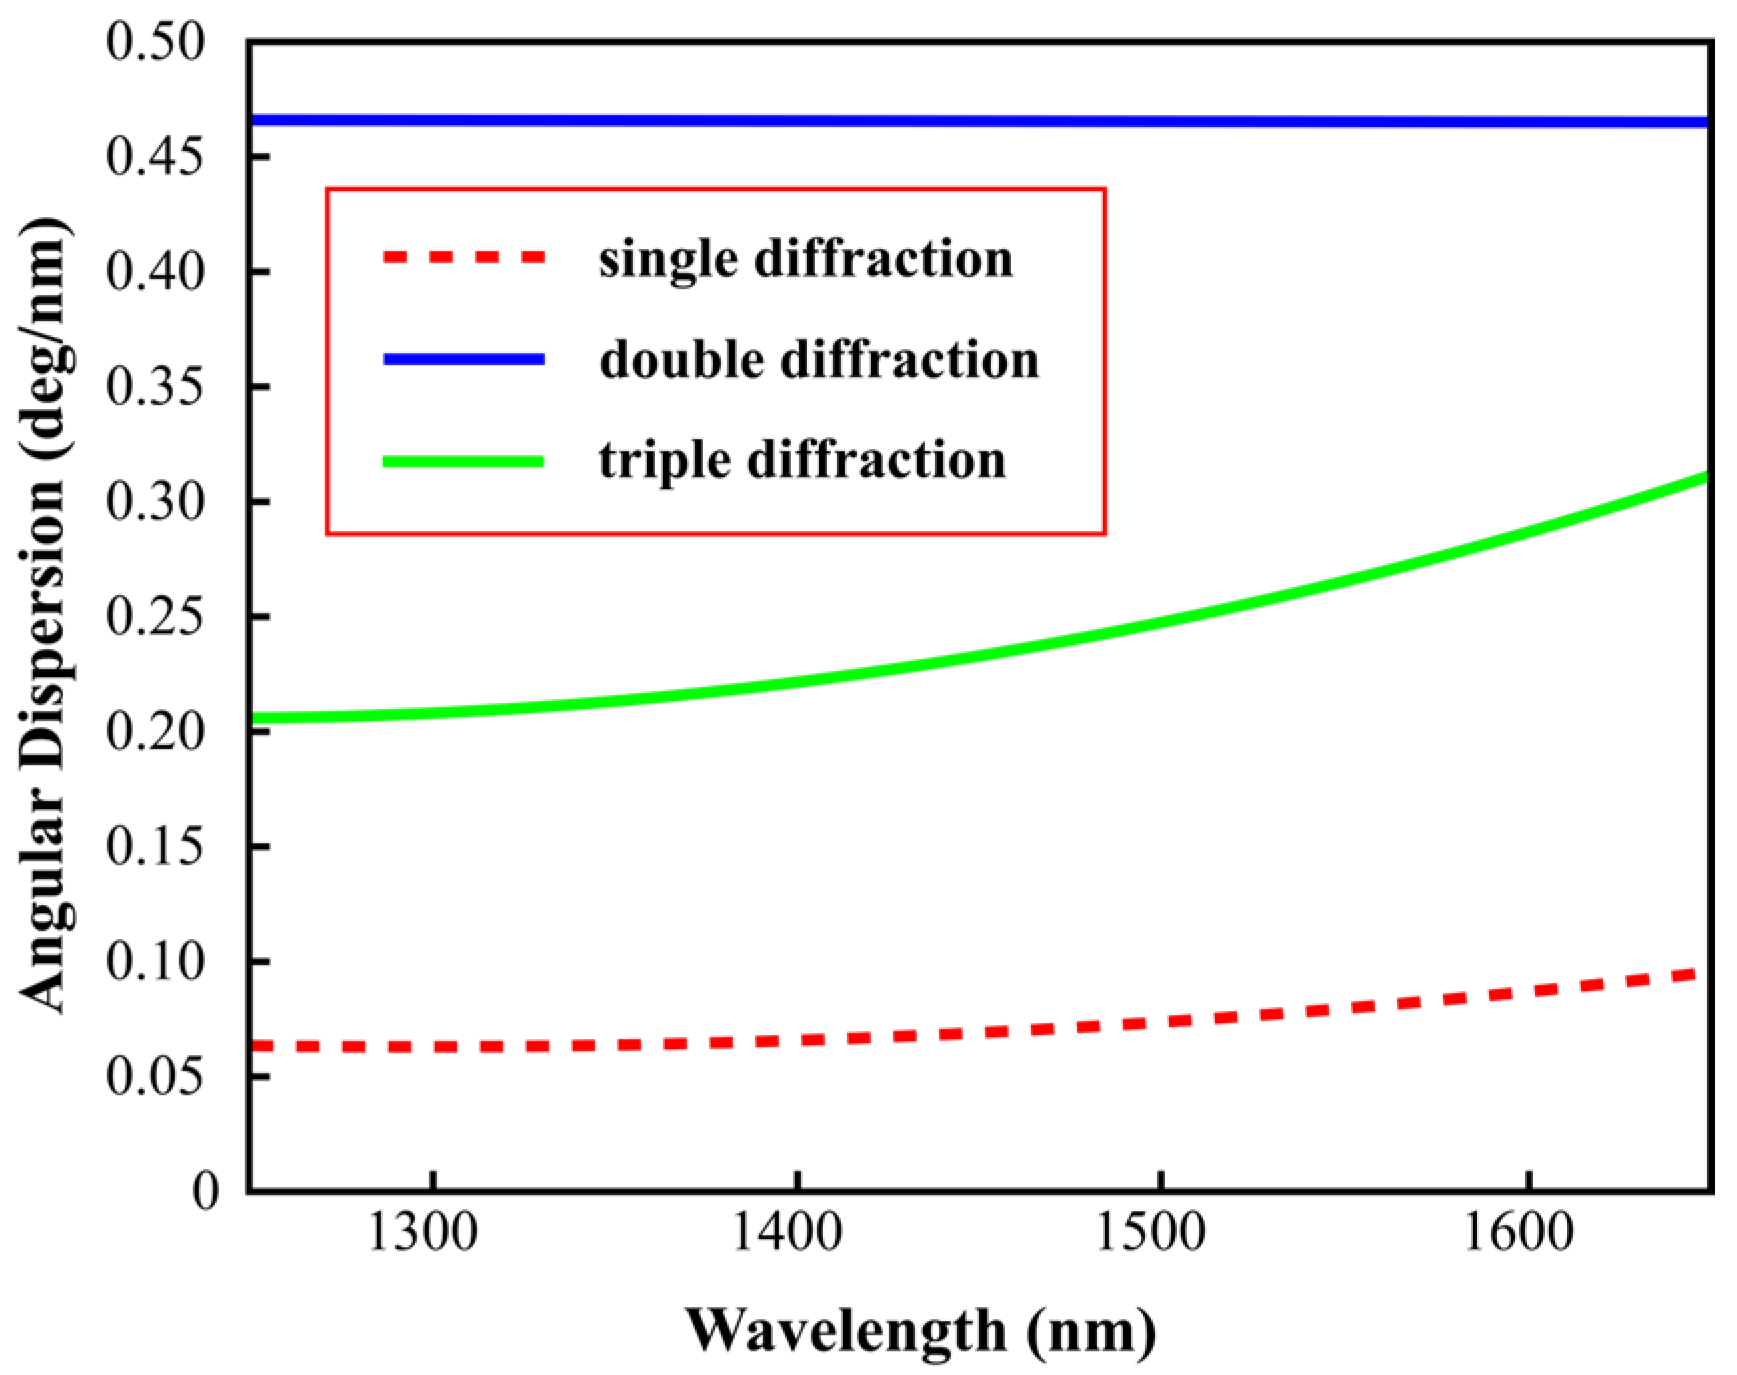
2.1. Multiple Diffractions

A multiple-diffraction scheme is an effective way to enhance spectral resolution. The schematic is shown in Figure 1. The incident light is diffracted on the grating for the first time and then reflected by the mirror to the grating for multiple diffractions. Disregarding the area constraints of the mirror and reflective grating, this multiple diffraction process can be extended iteratively up to the (2n − 1) th and (2n) th diffractions.
Assuming the wavelength λ 0 , λ 0 , as indicated by the blue ray in Figure 1, the angle of incidence for the first diffraction is α 1 , and the diffraction angle is β 1 . The diffraction complies with Equation (1):
d sin α 1 + sin β 1 = m λ 0
When the mirror is perpendicular to the diffraction ray of λ 0 , λ 0 returns to the grating and diffracts again along the original path. For the wavelength λ 0 + Δ λ , as indicated by the red light, after the first diffraction, the diffraction angle is β 1 + Δ β 1 , complying with Equation (2):
d sin α 1 + sin β 1 + Δ β 1 = m λ 0 + Δ λ
After being reflected by mirror M, the light with a wavelength of λ 0 + Δ λ is diffracted onto the grating again, satisfying Equation (3):
d sin β 1 Δ β 1 + sin α 1 + Δ β 2 = m λ 0 + Δ λ
As Δ β 1 and Δ β 2 are extremely small, we can expand the trigonometric functions and obtain the angular dispersion of the double diffraction as follows:
Δ β 2 Δ λ = 2 m d cos α 1
Compared with the angular dispersion of single diffraction, we have:
Δ β 2 Δ λ = 2 cos β 1 cos α 1 Δ β 1 Δ λ
According to Equation (5), when α 1 > β 1 , the angular dispersion of double diffraction is at least twice as great as that of single diffraction.
Furthermore, the angular dispersion for N-time diffraction can be derived via mathematical induction. For the 2n-th diffraction order, we have:
Δ β 2 n cos α 1 Δ β 2 n 1 cos β 1 = m Δ λ d
Similarly, for the (2n − 1)-th diffraction order:
Δ β 2 n cos α 1 + Δ β 2 n + 1 cos β 1 = m Δ λ d
which can also be expressed as:
Δ β 2 n 2 cos α 1 + Δ β 2 n 1 cos β 1 = m Δ λ d
By combining the above Equations (4) and (6)–(8), we derive:
Δ β 2 n Δ λ = 2 n m d cos α 1 Δ β 2 n 1 Δ λ = 2 n 1 m d cos β 1
Equation (9) presents the general formula for calculating the angular dispersion of multiple diffractions. For an even number of diffractions, the angular dispersion is inversely proportional to the cosine of the incident angle α 1 . However, for an odd number of diffractions, the angular dispersion varies inversely with the cosine of the diffraction angle β 1 for the first time. So, the spectral resolution of multiple diffractions depends not only on the diffraction numbers but also on the angle parameters.
As an example, considering a 1050 grooves/mm grating operating in the first diffraction order at a 75° incidence angle, we compared dispersion between the single, double, and triple diffractions, as shown in Figure 2. In the band of 1250–1650 nm, the angular dispersion of the double diffractions is 4.96–7.25 times higher than that of the single diffraction, while triple diffractions achieve a threefold enhancement over single diffraction. Compared to double diffractions, the reduced resolution in triple diffractions originates from the diffraction angle of the first diffraction being smaller than the incident angle. Multiple diffractions can achieve higher resolution than single diffractions. However, the resolution does not monotonically increase with diffraction times. Maximizing spectral performance necessitates a trade-off between the diffraction numbers and angular configuration.

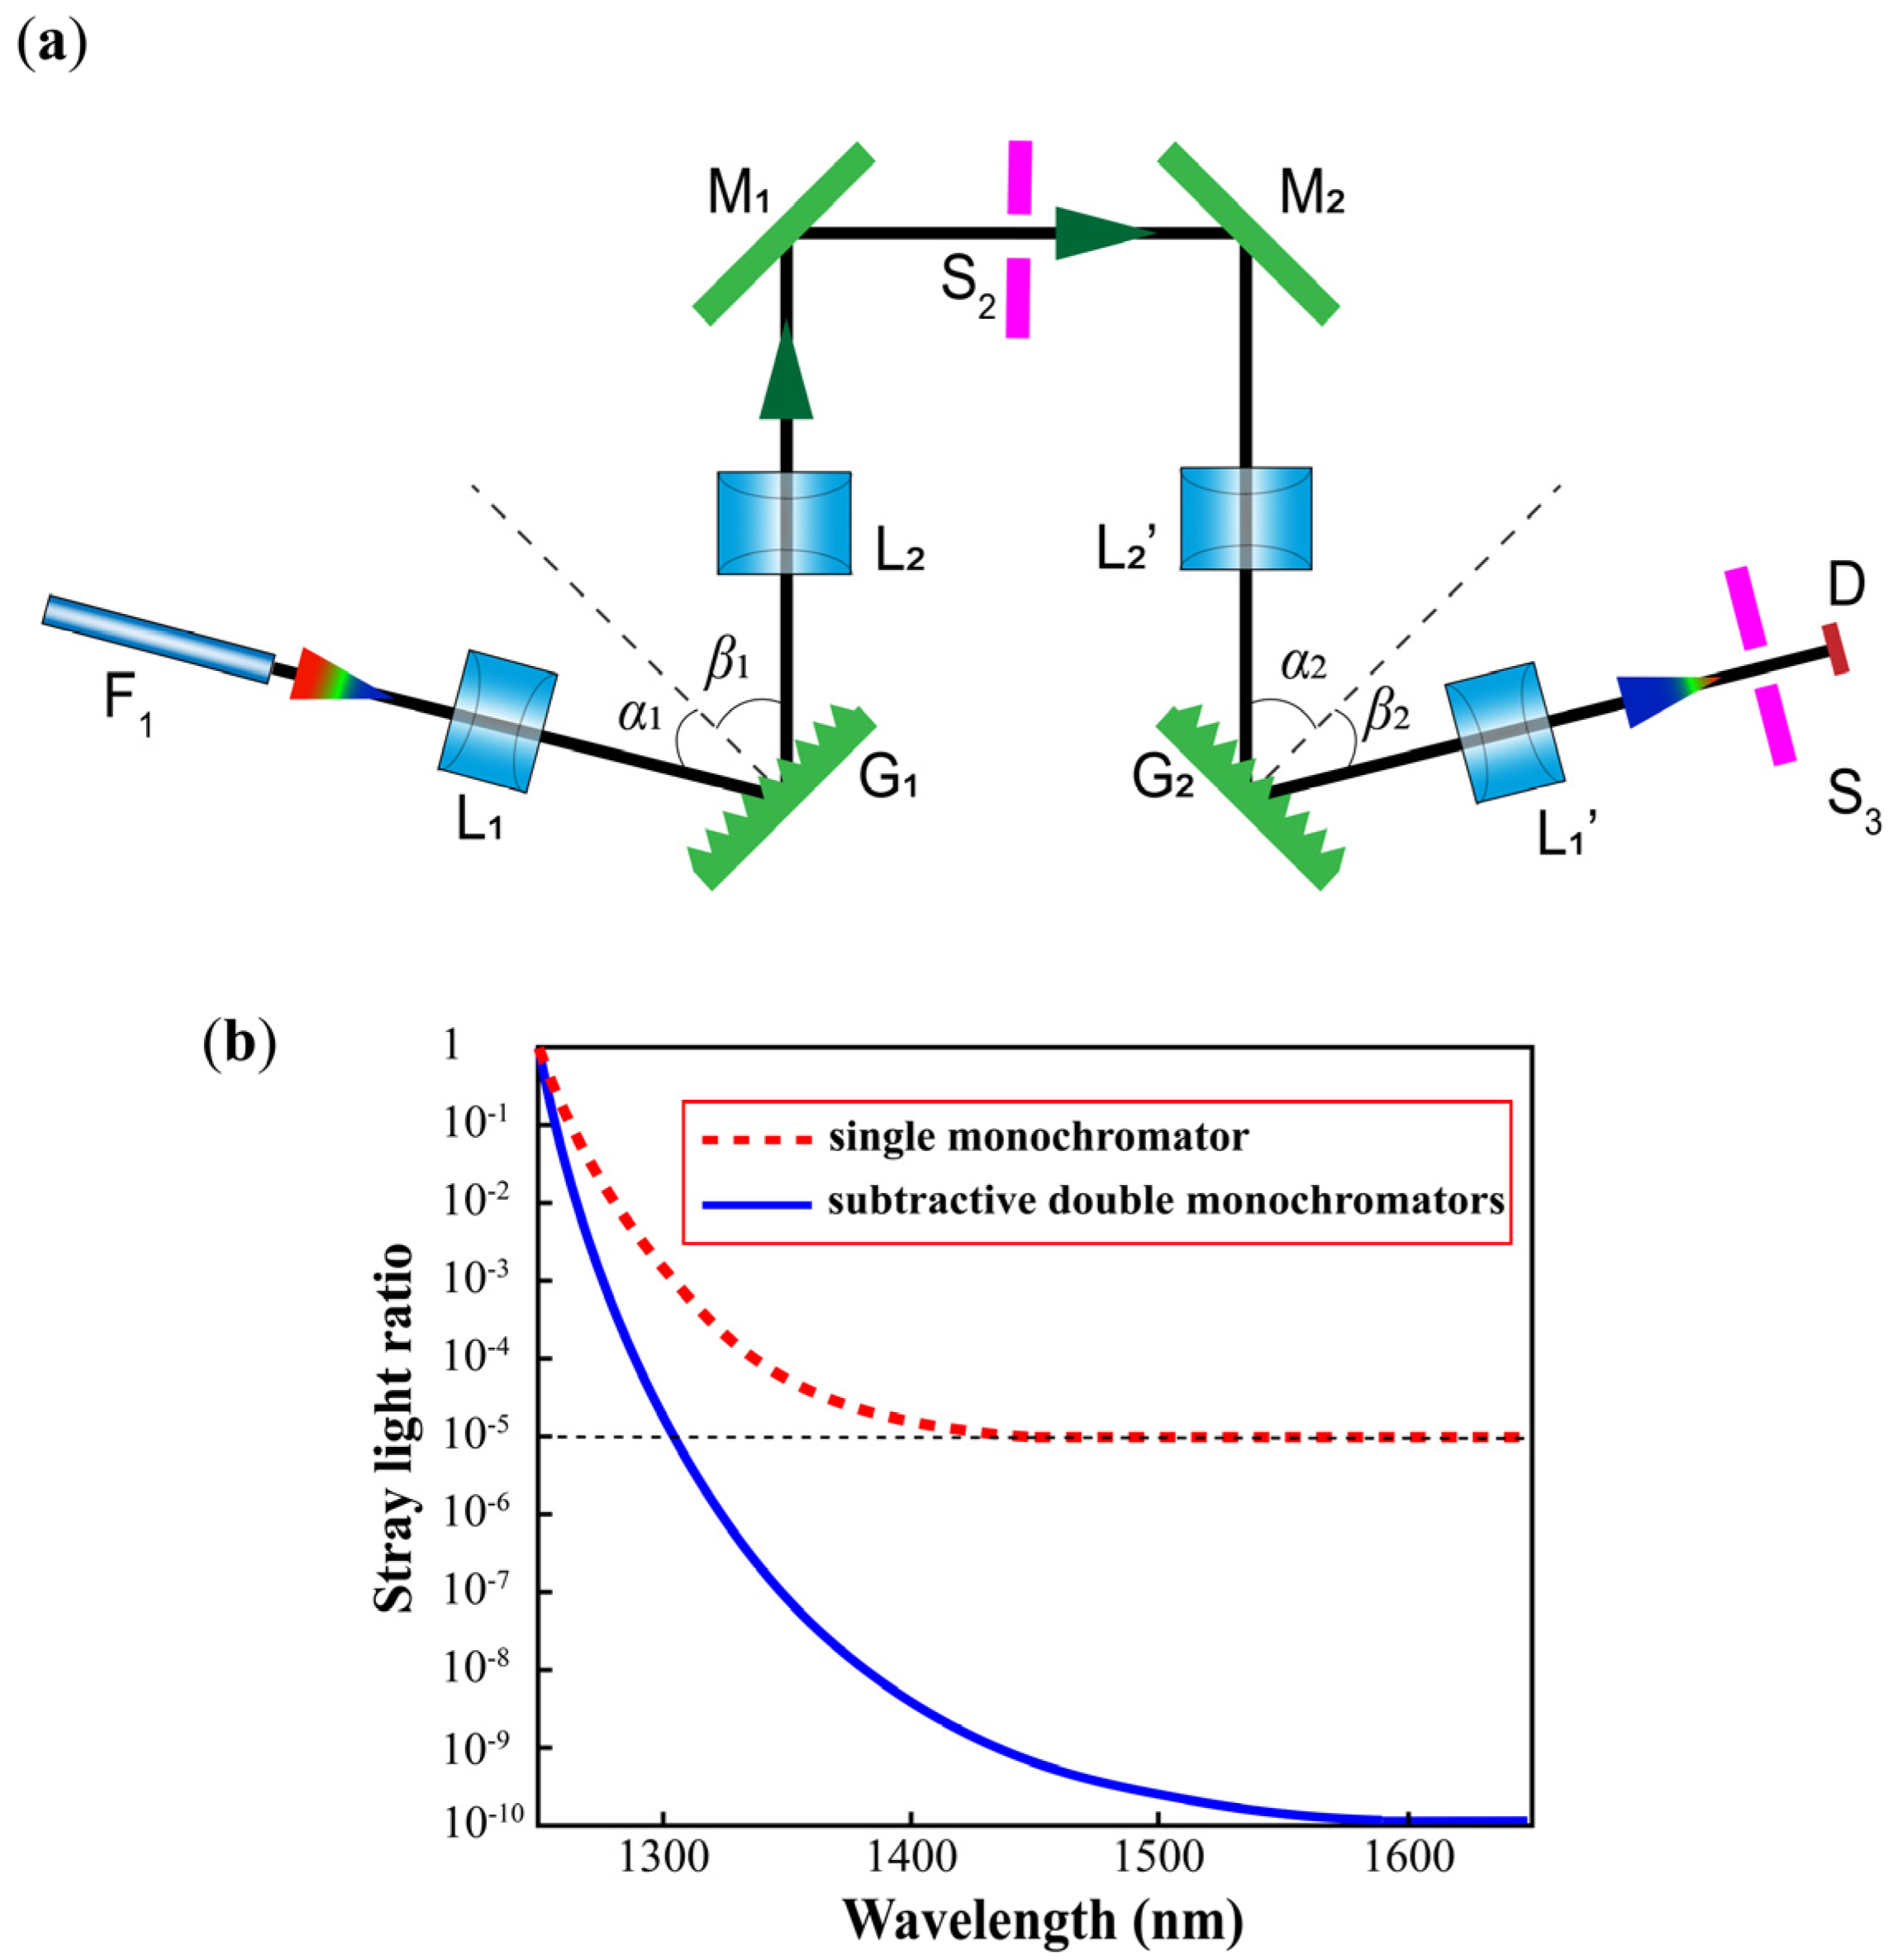
2.2. Subtractive Double Monochromator

A monochromator decomposes polychromatic light by dispersion elements and utilizes a slit to select monochromatic light output within a specific narrow wavelength range. Two monochromators can be connected in series by two arrangements: additive dispersion for enhanced resolution and subtractive dispersion for superior stray-light rejection [34]. Here, we focus on the subtractive dispersion configuration and study stray-light suppression.
In a single monochromator configuration, stray light inevitably reaches the exit slit through scattering from various surfaces. Let B ( λ ) represent the spectral energy distribution when the monochromatic light of wavelength λ passes through a monochromator configured for wavelength λ . The response of the monochromator to incident polychromatic light corresponds to the convolution of this energy distribution with the instrument function. The instrument function W arises from the finite slit width, grating characteristics, and geometric aberrations introduced by instrument components:
B λ = 0 B λ W λ λ d λ
A subtractive double monochromator is shown in Figure 3a, and it can suppress stray light effectively [35]. When the incidence angle of the rear monochromator matches the diffraction angle of the front monochromator, the rear unit produces an opposite dispersion effect to the front unit. Such serially connected monochromators are referred to as a subtractive double-monochromator configuration [36].
For the front monochromator, the angular dispersion is expressed as
d β 1 = m d cos β 1 d λ
where m denotes the diffraction order, and d represents the grating constant. The rear monochromator exhibits angular dispersion expressed as
d β 2 = cos β 1 cos β 2 d β 1 m d cos β 2 d λ = 0
If stray-light components at wavelength λ exit the front monochromator and enter the rear monochromator, they become coupled into the optical path of the signal light at wavelength λ , where the stray light undergoes further suppression. When the optical components of the front and rear monochromator are identical, the stray-light response of the double-monochromator mount becomes the square of that of a single monochromator, as demonstrated in Figure 3b. This methodology proves to be highly efficacious in spectrometers demanding a stringent optical signal-to-noise ratio (OSNR) [37,38].

3. Methods

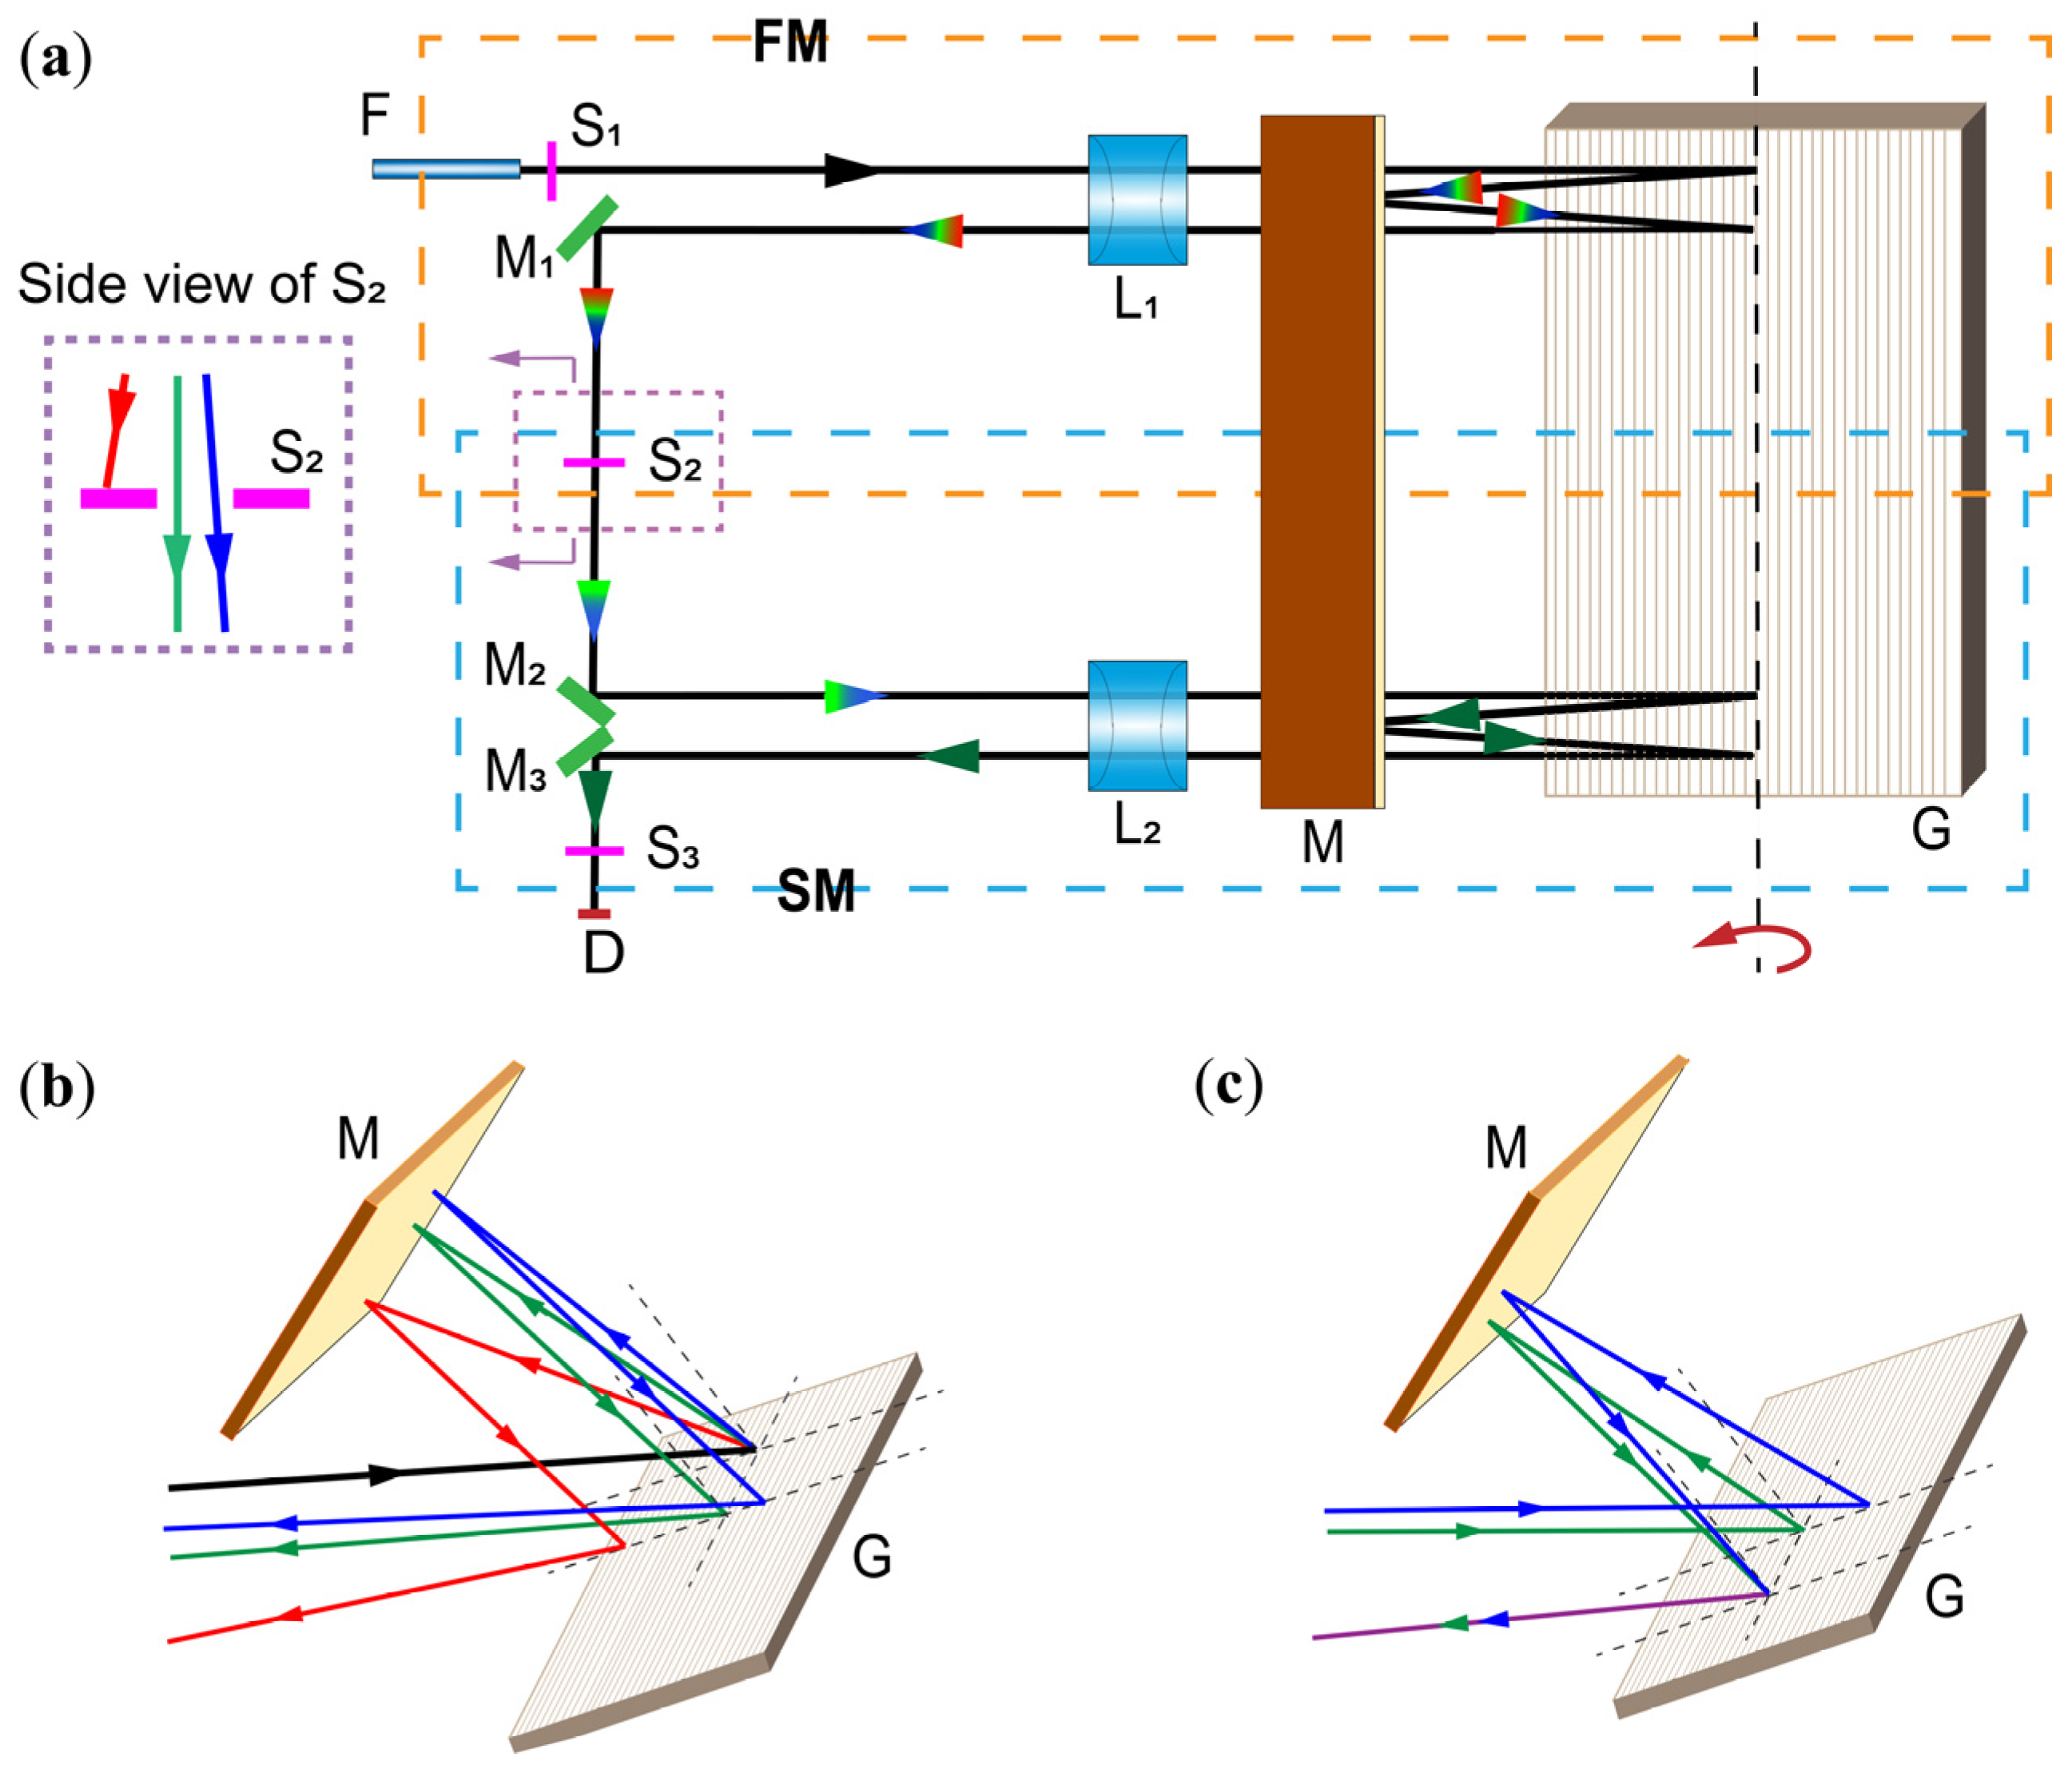
3.1. System Construction

A multiple-diffraction subtractive double-monochromator (MSDM) mount composed of two multiple-diffraction monochromators can significantly enhance spectral resolution while effectively suppressing stray light. Figure 4a shows the MSDM mount. We considered double diffractions as an example to demonstrate the principle and analysis of the proposed mount. This approach involves two double-diffraction monochromators, FM and SM, connected by slit S2 in series. S2 is the exit slit of the FM and the incidence slit of the SM. The light to be tested from Fiber F enters the FM through the entrance slit S1. After collimation by Lens L1, it is dispersed by the reflective grating G for the first time. Subsequently, the diffracted light is reflected off Mirror M and returned to the reflective grating G for the second diffraction. The repeatedly diffracted light passes through Lens L1 again; however, this time, it is focused to form monochromatic images on the plane of S2. Only narrow-bandwidth light can pass through S2, which determines the spectral resolution and prevents most of the stray light from entering the SM. In the SM, the light is diffracted twice again, then passes through the exit slit S3, and is finally detected by Detector D. FM and SM have the same optical elements, only that the light path is reversed. They share M and G and have identical lenses, L1 and L2. The incidence angle of the SM is equal to the diffraction angle of the FM. Thus, the optical paths in the FM and the SM are symmetric about S2. Due to the reversibility of light, the rays on G in the FM are divergent; however, in the SM, they are confluent, as shown in Figure 4b,c. The wavelength neighboring the sharp spectral line that passes through S2 merges again in the SM, which effectively reduces the optical noise. Briefly, the multiple-diffraction mount increased the spectral resolution, and the symmetric FM and SM suppressed the stray light.

3.2. Wavelength Scanning

When using a fixed diffraction grating for broadband spectral detection, diffraction grating spectrometers exhibit response roll-off and diffraction order overlap issues in spectral edge regions [10,39,40]. Through wavelength scanning, the mount produces spectra over a wide wavelength range while maintaining uniform wavelength resolution. The mirror not only reflects light but also selects the wavelength. It reflects the diffracted light of different wavelengths at various reflection angles; however, only rays perpendicular to the mirror plane return along the same path. When the grating rotates about its central groove, the wavelength perpendicular to the mirror varies with the grating angle. Let the initial working wavelength be denoted as λ 0 , with the corresponding incidence angle α 0 and diffraction angle β 0 . After rotating the grating by an angle δ , the new working wavelength λ and its associated angles are shown in Figure 5a. The diffraction equations before and after grating rotation are given by:
d sin α 0 + sin β 0 = m λ 0 d sin α 0 δ + sin β 0 δ = m λ
The wavelength selection formula for the double monochromator is derived by solving these equations simultaneously:
λ = λ 0 + d sin α 0 δ sin α 0 + d sin β 0 δ sin β 0
Thus, the mirror could select light with a wavelength moving in the expected direction. The grating rotation process completes the wavelength scanning of the monochromator.
By selecting 1450 nm as the initial wavelength λ 0 and substituting it into Equation (14), the wavelength scanning process can be graphically represented as a λ δ plot, as shown in Figure 5b. Through this rotational scanning protocol, the spectral detection range of the double monochromator is extended to 1250–1650 nm.

3.3. Stray-Light Analysis

Stray-light suppression is an important characteristic of the type of diffraction mount discussed herein. Multiple diffractions provide a higher spectral resolution but produce more stray light than a single diffraction. Two multiple-diffraction monochromators with symmetrical layouts were found to be effective in reducing the amount of stray light.
Next, we analyzed the stray light from the mount. To demonstrate, we provided an example of an MSDM, in which the focal length of the lens was 173 mm, and the groove density of the grating was 1050 grooves/mm. The central wavelength was set to 1550 nm, and the incidence angle α 1 was 75°. The entrance slit S1 and the resolution slit S2 had the same width of 25 μm, while the exit slit S3 had a width of 200 μm. We assumed that λ 0 was 1550 nm and that one neighboring wavelength was λ 0 + δ λ . The unit of δ λ was pm. The slit image of S1 at λ 0 was located at the centers of S2 and S3. For λ 0 + δ λ , the displacement of the slit image due to δ λ is denoted by x (μm). The x δ λ graph at S2 and S3 was plotted accordingly, as shown in Figure 6. According to Equation (6), the linear dispersion rate was calculated to be 1.375 μm/pm. Therefore, a point on S1 corresponds to an image at S2 as a straight line with a slope of 1/1.375 pm/μm. Considering that the width of S1 is 25 μm, the overall image of S1 at S2 forms a parallelogram with a base width of 25 μm and a side slope of 1/1.375 pm/μm. Similarly, since the dispersion direction of the SM is opposite to that of the FM, the image of S2 at S3 also forms a parallelogram with a base width of 25 μm and a side slope of 1/1.375 pm/μm.
Figure 6a shows the x δ λ graph for S2. The shadows in the A   B   C   D region represent the signal light that can pass through S2 in the FM, whereas the gray shadows represent the stray light that can pass through S2 in the FM. In typical monochromators, the stray-light intensity is approximately 10−5 times the signal light intensity. For instance, if the signal light has a power of 0 dBm, the stray-light power would be −50 dBm. The upper graph in Figure 6b shows the ideal optical power distribution at S2, and the lower graph shows the optical power distribution after convolution of the normalized Gaussian function, which is closer to the actual situation. Gaussian convolution was adopted to simulate the instrument broadening effect caused by the inherent limitations of the system, including optical diffraction, detector resolution, and mechanical instability. The Gaussian kernel mathematically represents the composite point-spread function of the measurement system, the characteristic width of which is calibrated to match the actual instrument response. This physical-model-based convolution process effectively bridges the gap between theoretical predictions and experimental observations. The optical power distribution obtained by Gaussian convolution shows that the stray light results in a relatively low OSNR (approximately 20 dB), which significantly influences the sensitivity of the instrument.
Figure 6c shows the x δ λ graph for S3. The ABCD region represents the signal light passing through the subtractive double-monochromator mount. The regions DCGH and EFBA represent the first-order stray light, which is generated by the scattering effects in the FM and anomalously passes through S2. Denoting the optical efficiency of the signal light by P0 (0 dBm, as described above), the optical efficiency of the first-order stray light by PS1, and the stray-light coefficient of the FM by ε 1 (10−5, as described above), we obtain:
P S 1 = P 0 + 10 log 10 ε 1 = 50 dBm
The JKMN region represents all the rays that can pass through S3. The difference in the areas between JKMN and EFGH indicates the second-order stray light in the SM. The optical efficiency of the second-order stray light is denoted by PS2, and the stray-light coefficient of the SM is denoted by ε 2 , which is based on the optical symmetry between the FM and the SM:
ε 2 = ε 1 = 10 5 P S 2 = P S 1 + 10 log 10 ε 2 = 100 dBm
Figure 6d shows the ideal and actual optical power distributions at S3. Compared with that shown in Figure 6b, the MSDM mount significantly suppressed the stray light, and the OSNR consequently improved to 70 dB.

4. Results

4.1. Simulations

Based on the above theoretical analysis, we performed some simulations. Figure 7 shows the ZEMAX model (ZEMAX OpticStudio 19.4; Ansys, Canonsburg, PA, USA) of the MSDM, where Figure 7a shows the system layout, and Figure 7b shows the dispersed spot diagram at S2. From the scatter plot, the spectral line dispersion of the MSDM is 1375 μm/nm. For a focal length of the collimating and focusing lens of 173 mm, the angular resolution is 0.4554°/nm, which is very close to the theoretical value of 0.464885 deg/nm, calculated using Equation (4). The simulation results closely matched the theoretical predictions. The width of S2 used in the simulation is 25 μm, which means that the resolution of the mount reaches 18 pm.
LightTools software (LightTools 2022.03; Synopsys, Sunnyvale, CA, USA)was used to explore the stray light in the system. Figure 8a,b show the irradiance distributions at S2 and S3, respectively, as well as the intensity distribution at x = 0, which represents the light intensity distribution along the dispersion direction of the slit. The simulation results demonstrate that at S2, the signal irradiance reaches approximately 100 W/mm2, while the stray-light irradiance measures about 10−4 W/mm2, yielding a total stray-light ratio of ~10−6. Following stray-light suppression by the MSDM system, the signal irradiance at S3 remains unchanged at 100 W/mm2, with stray-light irradiance reduced below 10−7 W/mm2 and the total stray-light ratio suppressed to <10−9. These numerical results conclusively validate the stray-light suppression efficacy of the subtractive double-monochromator architecture, and the intensity curves obtained using LightTools matched well with those shown in Figure 6b,d.

4.2. Experiments

Based on our simulation results, we constructed a physical prototype of an MSDM on an optical bench. The optical components used in this experimental prototype had parameters identical to those defined in the simulation. This allowed us to experimentally validate the design, including its spectral resolution and optical power distribution. The overall dimensions of the constructed MSDM system are 176 mm × 168 mm × 87 mm. The light source used was an Agilent 81640A tunable laser module. It operates at wavelengths ranging from 1510 nm to 1640 nm. The maximum output power is 4 dBm. The wavelength accuracy (absolute) is ±0.015 nm, and the wavelength repeatability (typical) is ±0.5 pm.
Figure 9 shows the experimental results, where Figure 9a,b show the optical power distributions at S2 and S3, respectively. At S2 and S3, the spectral resolutions were similar, which was 18.8 pm. However, at S3, as shown in Figure 9b, the OSNR was 69.17 dB, which was approximately twice that at S2, as shown in Figure 9a. These results help verify that the MSDM is a powerful system for increasing spectral resolution and suppressing stray light for spectroscopic analysis.

5. Discussion

Compared to previous studies of multi-diffraction dispersion [9,10], the MSDM demonstrates a higher OSNR combined with superior spectral resolution capabilities. A comprehensive comparison is presented in Table 1.
Both multiplexed grating spectrometers and triple dispersion spectrometers are single-monochromator schemes, which cannot suppress stray light by optical layouts and have lower OSNRs. Based on the conclusion from Equation (9), increased number of diffraction times lead to higher angular dispersion. Higher focal lengths and narrower intermediate slit widths yield superior spectral resolution for fixed angular dispersion. Through optimized system parameter design, the MSDM achieves enhanced resolution performance. The double-diffraction monochromator used in this study serves as just one example of the MSDM. By increasing the number of diffraction events in a similar configuration, spectral resolution can be further enhanced.
The proposed MSDM exhibits superior performance compared to two leading commercial dual monochromators. To maintain objectivity and avoid potential commercial sensitivities, these instruments are anonymized as Commercial Instrument 1 and Commercial Instrument 2 in the comparative analysis presented in Table 2. Both are widely adopted in applications like dense wavelength division multiplexing (DWDM) due to their exceptional specifications.
Notably, the proposed system reaches an internationally advanced spectral resolution (18.8 pm, surpassing Commercial Instrument 2 by 68.7%) and maintains an OSNR within <6% of top-tier commercial devices. However, its current wavelength coverage (400 nm) remains a primary technical limitation compared to the 1100 nm operational range typical of advanced commercial systems.

6. Conclusions

In summary, this study developed a subtractive dispersion mount comprising two symmetrical multiple-diffraction monochromators (FM and SM) connected by a resolution slit for spectroscopic analysis. The FM increases the resolution through multiple diffractions, while the SM eliminates stray light owing to dispersion subtraction. Taking these two diffractions as examples, we designed a double-diffraction subtractive double monochromator with a volume of 176 mm × 168 mm × 87 mm. It was experimentally verified that the multiple diffractions in the FM increased the spectral resolution and that the symmetric FM and SM significantly suppressed the stray light. The spectral resolution was 18.8 pm, and the OSNR attained was approximately 70 dB.
Despite these achievements, the current work has limitations. The achieved resolution, while high, is constrained by the practical limit on diffraction times implemented in this initial prototype. Furthermore, the spectral operating range is currently limited by the achievable grating scan angle within the compact design.
Next, we will address these limitations by further enhancing the resolution through increasing diffraction times and expanding the grating scan angle to broaden the spectral operating range. The proposed spectrometer mount demonstrates significant potential and can serve as a valuable tool for accurate optical spectral analyses in many domains.

Author Contributions

Conceptualization, Y.Z. and K.C.; methodology, Z.W.; software, Z.W. and K.C.; validation, Z.W., K.C. and D.C.; formal analysis, Y.Z.; investigation, Z.W.; resources, T.C.; data curation, D.C.; writing—original draft preparation, Z.W.; writing—review and editing, Y.Z.; visualization, Z.W.; supervision, H.Y.; project administration, T.C.; funding acquisition, Y.Z. All authors have read and agreed to the published version of the manuscript.

Funding

This research was funded by the National Key Scientific Instrument and Equipment Development Project of China, grant number 2014YQ510403.

Institutional Review Board Statement

Not applicable.

Informed Consent Statement

Not applicable.

Data Availability Statement

The original contributions presented in this study are included in this article; further inquiries can be directed to the corresponding author.

Acknowledgments

We hereby extend our sincere gratitude to the Optical Society of America for their Premium Language Editing service, which conducted a thorough review of linguistic and grammatical accuracy, significantly enhancing the readability and logical coherence of the manuscript.

Conflicts of Interest

Author Kai Chen and Tao Chen were employed by the company Tianjin Deviser Photoelectric Technology. The remaining authors declare that the re-search was con-ducted in the absence of any commercial or financial relationships that could be construed as a potential conflict of interest.

Abbreviations

The following abbreviations are used in this manuscript:
VIPAsVirtual imaging phased arrays
AWGsArrayed waveguide gratings
OSNROptical signal-to-noise ratio
FWHMFull width at half maximum
MSDMMultiple-diffraction subtractive double monochromator
FMThe first monochromator
SMThe second monochromator
DWDMDense wavelength division multiplexing

References

  1. Yan, C.S.; Chen, Y.W.; Yang, H.M.; Ahokas, E. Optical Spectrum Analyzers and Typical Applications in Astronomy and Remote Sensing. Rev. Sci. Instrum. 2023, 94, 081501. [Google Scholar] [CrossRef] [PubMed]
  2. Das, R.S.; Agrawal, Y.K. Raman Spectroscopy: Recent Advancements, Techniques and Applications. Vib. Spectrosc. 2011, 57, 163–176. [Google Scholar] [CrossRef]
  3. Thuillier, G.; Zhu, P.; Snow, M.; Zhang, P.; Ye, X. Characteristics of Solar-Irradiance Spectra from Measurements, Modeling, and Theoretical Approach. Light Sci. Appl. 2022, 11, 79. [Google Scholar] [CrossRef] [PubMed]
  4. Zuev, S.M.; Varlamov, D.O.; Kuksa, V.V. Analysis of the Characteristics of a Laser Lighting Device. Instrum. Exp. Tech. 2021, 64, 834–839. [Google Scholar] [CrossRef]
  5. Stolyarevskaya, R.I. Review of the Features of Using Mini-Spectroradiometers with Ccd-Arrays in Applied Photometry. Light Eng. 2021, 29, 21–29. [Google Scholar] [CrossRef]
  6. Amirazar, A.; Azarbayjani, M.; Molavi, M.; Karami, M. A Low-Cost and Portable Device for Measuring Spectrum of Light Source as a Stimulus for the Human’s Circadian System. Energy Build. 2021, 252, 111386. [Google Scholar] [CrossRef]
  7. Yang, Z.; Albrow-Owen, T.; Cai, W.; Hasan, T. Miniaturization of Optical Spectrometers. Science 2021, 371, eabe0722. [Google Scholar] [CrossRef]
  8. Zhang, S.; Mi, X.; Zhang, Q.; Jirigalantu; Feng, S.; Yu, H.; Qi, X. Groove Shape Characteristics of Echelle Gratings with High Diffraction Efficiency. Opt. Commun. 2017, 387, 401–404. [Google Scholar] [CrossRef]
  9. Kukushkin, D.E.; Sazonenko, D.A.; Valyavin, G.G.; Bakholdin, A.V. High-Resolution Astronomical Spectrograph Design Method with a Single Echelle Grating. Appl. Opt. 2023, 62, 3004. [Google Scholar] [CrossRef]
  10. Zhang, Y.; Li, W.; Duan, W.; Huang, Z.; Yang, H. Echelle Grating Spectroscopic Technology for High-Resolution and Broadband Spectral Measurement. Appl. Sci. 2022, 12, 11042. [Google Scholar] [CrossRef]
  11. Zhang, L.; Li, B.; Gu, G.; Wang, X.; Li, H. Miniaturized Hyperspectral Resolution Imaging Spectrometer of AOTF and Echelle Grating Combination. Acta Opt. Sin. 2023, 43, 1922001. [Google Scholar] [CrossRef]
  12. Chen, S.; Tang, Y.; Bayanheshig, X.; Qi, X.; Zhu, W. A New Type of Wide Spectral Coverage Echelle Spectrometer Design for ICP-AES. In Proceedings of the SPIE/COS Photonics Asia, Beijing, China, 5–7 November 2012. [Google Scholar]
  13. Muhammed Shameem, K.M.; Dhanada, V.S.; George, S.D.; Kartha, V.B.; Santhosh, C.; Unnikrishnan, V.K. Assessing the Feasibility of a Low-Throughput Gated Echelle Spectrograph for Laser-Induced Breakdown Spectroscopy (LIBS)-Raman Measurements at Standoff Distances. Opt. Laser Technol. 2022, 153, 108264. [Google Scholar] [CrossRef]
  14. Han, T.; Wu, Y.-H.; Chen, J.-K.; Kong, Y.-F.; Chen, Y.-R.; Sun, B.; Xu, C.-H.; Zhou, P.; Qiu, J.-H.; Zheng, Y.-X.; et al. Study of a High-Resolution Infrared Spectrometer by Using an Integrated Multigrating Structure. Rev. Sci. Instrum. 2005, 76, 083118. [Google Scholar] [CrossRef]
  15. Xia, G.; Wu, S.; Wang, G.; Hu, M.; Xing, J. Astigmatism-Free Czerny–Turner Compact Spectrometer with Cylindrical Mirrors. Appl. Opt. 2017, 56, 9069. [Google Scholar] [CrossRef]
  16. Yang, Q. First Order Design of Compact, Broadband, High Spectral Resolution Ultraviolet-Visible Imaging Spectrometer. Opt. Express 2020, 28, 5587. [Google Scholar] [CrossRef]
  17. Shi, J.; Sheng, B.; Huang, Y.-S.; Peng, L.-N.; Wang, L.-Y.; Ni, Z.-J.; Zhang, D.-W.; Zhao, Y.-F.; He, M. Multifacet Echelle Grating for Intensity Broadening on Spectral Plane Fabricated by Rotating Ion-Beam Etching. Appl. Opt. 2019, 58, 5040. [Google Scholar] [CrossRef]
  18. Lee, E.S. Spectral Resolution Enhancement without Increasing the Number of Grooves in Grating-Based Spectrometers. Opt. Lett. 2011, 36, 4803. [Google Scholar] [CrossRef]
  19. Zhou, H.; Zhao, W.; Fang, B.; Lv, B.; Cui, W.; Zhang, W.; Chen, W. A Broadband Picometer Resolution Visible CCD Spectrometer Based on Virtually Imaged Phased Array Technology. Analyst 2023, 148, 4421–4428. [Google Scholar] [CrossRef]
  20. Shirasaki, M. Large Angular Dispersion by a Virtually Imaged Phased Array and Its Application to a Wavelength Demultiplexer. Opt. Lett. 1996, 21, 366. [Google Scholar] [CrossRef]
  21. Kraus, M.; Förster, E.; Bagusat, V.; Hönle, T.; Uwurukundo, X.; Bohnert, P.; Brüning, R.; Hillmer, H.; Brunner, R. Compact, Astigmatism Corrected Cross-Grating Spectrometer. EPJ Web Conf. 2020, 238, 03005. [Google Scholar] [CrossRef]
  22. Yi, D.; Tsang, H.K. High-Resolution and Broadband Two-Stage Speckle Spectrometer. J. Lightware Technol. 2022, 40, 7969–7976. [Google Scholar] [CrossRef]
  23. Zhang, Z.; Wang, Y.; Tsang, H.K. Tandem Configuration of Microrings and Arrayed Waveguide Gratings for a High-Resolution and Broadband Stationary Optical Spectrometer at 860 Nm. ACS Photonics 2021, 8, 1251–1257. [Google Scholar] [CrossRef]
  24. Pang, Y.; Zhang, Y.; Yang, H.; Liu, Z.; Huang, Z.; Jin, G. Compact High-Resolution Spectrometer Using Two Plane Gratings with Triple Dispersion. Opt. Express 2018, 26, 6382. [Google Scholar] [CrossRef]
  25. Pang, Y.; Zhang, Y.; Yang, H.; Huang, Z.; Jin, G. Compact Broadband High-Resolution Infrared Spectrometer with a Dihedral Reflector. Opt. Express 2017, 25, 14960. [Google Scholar] [CrossRef]
  26. Wang, J.; Liu, C.; Qin, S.; Zhu, G.; Shao, Y.; Fu, S.; Liu, D. Double-Grating with Multiple Diffractions Enabled Small Angle Measurement. Opt. Express 2019, 27, 5289. [Google Scholar] [CrossRef]
  27. Chen, J.; Li, X.; Chu, Q.; Galantu, J.; Sun, Y.; Zhang, B.; Yanheshig, B. An Ultrahigh-Resolution Spectrometer Using Parallel Double Gratings. Results Phys. 2023, 45, 106258. [Google Scholar] [CrossRef]
  28. Li, Y.; Yang, C.; Xue, C.; Li, X.; Ma, Z. Stray Light Analysis and Control of Grating Multistage Diffraction in HRS. Acta Opt. Sin. 2019, 39, 0630001. [Google Scholar] [CrossRef]
  29. Li, X.; Cen, Z. Stray Light Simulation and Control in Imaging Systems Including Diffraction Elements. In Proceedings of the Optical Design and Engineering VII, Frankfurt, Germany, 14–17 May 2018; Mazuray, L., Wartmann, R., Wood, A.P., Eds.; SPIE: Frankfurt, Germany, 2018; p. 5. [Google Scholar]
  30. Yang, J.; Zhang, R.; Yin, L.; Sun, C.; Li, T. Study on a Wideband, Variable Aperture, High Resolution Scatterometer for Planar Diffraction Grating Stray Light Measurement. Appl. Opt. 2017, 56, 247. [Google Scholar] [CrossRef]
  31. Shen, C.Y.; Cui, J.C.; Sun, C.; Wang, W.; Chen, J.J.; Li, X.T. A Detection System Design of Echelle Diffraction Efficiency and Stray Coefficient. Spectrosc. Spectr. Anal. 2017, 37, 2603–2609. [Google Scholar]
  32. Ciaffoni, L.; Matousek, P.; Parker, W.; McCormack, E.A.; Mortimer, H. Grating Spectrometry and Spatial Heterodyne Fourier Transform Spectrometry: Comparative Noise Analysis for Raman Measurements. Appl. Spectrosc. 2021, 75, 241–249. [Google Scholar] [CrossRef]
  33. Ji, K.; Xing, Y.; Niu, X.; He, C.; Dun, X.; Cheng, X. Stray Light Analysis and Suppression of Broad-Band Spectral Imaging System. Infrared Laser Eng. 2023, 52, 20220645. [Google Scholar] [CrossRef]
  34. Julien, C. A Triple Monochromator Used as a Spectrometer for Raman Scattering. J. Opt. 1980, 11, 257. [Google Scholar] [CrossRef]
  35. Mukhin, E.E.; Razdobarin, G.T.; Semenov, V.V.; Shilnikov, A.N.; Sukhanov, V.L.; Tolstjakov, S.Y.; Kochergin, M.M.; Mihailovskij, Y.K.; Bakh, L.I. Double-Grating Polychromator for Laser-Aided Plasma Diagnostics. Rev. Sci. Instrum. 2004, 75, 1261–1263. [Google Scholar] [CrossRef]
  36. Allemand, C. Monochromatic Imaging from UV to IR Using a Subtractive Double Monochromator. Appl. Opt. 1983, 22, 16. [Google Scholar] [CrossRef]
  37. Mukhin, E.E.; Semenov, V.V.; Razdobarin, A.G.; Tolstyakov, S.Y.; Kochergin, M.M.; Kurskiev, G.S.; Berezutsky, A.A.; Podushnikova, K.A.; Masyukevich, S.V.; Chernakov, P.V.; et al. The ITER Divertor Thomson Scattering System: Engineering and Advanced Hardware Solutions. J. Instrum. 2012, 7, C02063. [Google Scholar] [CrossRef]
  38. Okamoto, A.; Higuchi, S.; Sato, K.; Yamada, Y.; Koike, M.; Sugimoto, M.; Fujita, T. Laser Thomson Scattering System for Anisotropic Electron Temperature Measurement in NUMBER. J. Instrum. 2023, 18, C10013. [Google Scholar] [CrossRef]
  39. Gatto, A.; Pesch, A.; Kalies, A.; Diehl, T.; Erdmann, L.H.; Burkhardt, M.; Triebel, P.; Moeller, T. Space Applications: Monolithic Diffraction Grating Elements from EUV to NIR Spectral Range. In Proceedings of the International Conference on Space Optics—ICSO 2014, Tenerife, Canary Islands, Spain, 6–10 October 2014; Cugny, B., Sodnik, Z., Karafolas, N., Eds.; p. 93. [Google Scholar]
  40. Zarubin, I.A.; Labusov, V.A.; Babin, S.A. Characteristics of Compact Spectrometers with Diffraction Gratings of Different Types. Inorg. Mater. 2020, 56, 1436–1440. [Google Scholar] [CrossRef]
Figure 1. Angular schematic of multiple diffractions. Mirror M and reflective grating G enable multiple diffractions. Polychromatic light is represented by black; light of wavelength λ 0 is blue, and light of wavelength λ 0 + Δ λ is red. (a) Schematic diagram of first and second diffractions. (b) Schematic diagram of (2n − 1)th and (2n)th diffractions. (c) Overall optical path sequence of multiple diffractions.
Applsci 15 07232 g001
Figure 2. Angular dispersion comparison between single, double, and triple diffractions.
Applsci 15 07232 g002
Figure 3. Subtractive double monochromator. (a) Schematic of subtractive double-monochromator configuration. F1, fiber; S2, S3, slits; L1, L2, L1′, L2′, lenses; M1, M2, mirrors; G1, G2 gratings; D, detector. S2 measures single-monochromator stray light; S3 measures subtractive double-monochromator stray light. (b) Stray-light level in subtractive double-monochromator mount, which is square of that of single monochromator.
Applsci 15 07232 g003
Figure 4. Schematic of MSDM mount: (a) Top view of approach. FM, first monochromator; SM, second monochromator; F, fiber; S1, S2, S3, slits; L1, L2, lenses; M, M1, M2, M3, mirrors; G, grating; D, detector. (b) Rays of FM on grating. (c) Rays of SM on grating.
Applsci 15 07232 g004
Figure 5. Analysis of wavelength scanning process: (a) wavelength scanning implemented via grating rotation. M, mirror; G, grating. Red arrow indicates rotation of G. (b) Functional relationship of wavelength selection.
Applsci 15 07232 g005
Figure 6. Stray light at different slits: (a) x δ λ graph at S2; (b) optical power distribution at S2; (c) x δ λ graph at S3; (d) optical power distribution at S3. 2a, 2b, and 2c are widths of S1, S2, and S3, respectively.
Applsci 15 07232 g006
Figure 7. System simulations of mount: (a) system layout obtained by ZEMAX; (b) dispersed spot diagrams at S2.
Applsci 15 07232 g007
Figure 8. Simulation results of stray light using LightTools: (a) irradiance distribution at S2; (b) irradiance distribution at S3.
Applsci 15 07232 g008
Figure 9. Experimental results: (a) optical power distribution at S2; (b) optical power distribution at S3.
Applsci 15 07232 g009
Table 1. A comparison between present and previous multi-diffraction dispersions.
Multiplexed Grating
Spectrometer
Triple Dispersion
Spectrometer
Multiple-Diffraction Subtractive
Double Monochromator
Times of diffraction232 × 2
Spectral resolution57 pm36 pm18.8 pm
Wavelength range1250 to 1650 nm1250 to 1650 nm1250 to 1650 nm
OSNR55 dB30 dB69.17 dB
Table 2. Key performance of proposed vs. leading commercial spectral analysis instruments.
Commercial Instrument 1Commercial Instrument 2Multiple-Diffraction Subtractive
Double Monochromator
Spectral resolution20 pm60 pm18.8 pm
Wavelength range600 to 1700 nm600 to 1700 nm1250 to 1650 nm
OSNR73 dBNaN69.17 dB
Disclaimer/Publisher’s Note: The statements, opinions and data contained in all publications are solely those of the individual author(s) and contributor(s) and not of MDPI and/or the editor(s). MDPI and/or the editor(s) disclaim responsibility for any injury to people or property resulting from any ideas, methods, instructions or products referred to in the content.

