Article

A Continuous Music Recommendation Method Considering Emotional Change

1
Knowledge Science Research Center, Dongguk University, Seoul 04620, Republic of Korea
2
Department of Computer Science and Artificial Intelligence, Dongguk University, Seoul 04620, Republic of Korea
*
Author to whom correspondence should be addressed.
Appl. Sci. 2025, 15(13), 7222; https://doi.org/10.3390/app15137222
Submission received: 17 March 2025 / Revised: 18 April 2025 / Accepted: 20 June 2025 / Published: 26 June 2025

Abstract

Music, movies, books, pictures, and other media can change a user’s emotions, which are important factors in recommending appropriate items. As users’ emotions change over time, the content they select may vary accordingly. Existing emotion-based content recommendation methods primarily recommend content based on the user’s current emotional state. In this study, we propose a continuous music recommendation method that adapts to a user’s changing emotions. Based on Thayer’s emotion model, emotions were classified into four areas, and music and user emotion vectors were created by analyzing the relationships between valence, arousal, and each emotion using a multiple regression model. Based on the user’s emotional history data, a personalized mental model (PMM) was created using a Markov chain. The PMM was used to predict future emotions and generate user emotion vectors for each period. A recommendation list was created by calculating the similarity between music emotion vectors and user emotion vectors. To prove the effectiveness of the proposed method, the accuracy of the music emotion analysis, user emotion prediction, and music recommendation results were evaluated. To evaluate the experiments, the PMM and the modified mental model (MMM) were used to predict user emotions and generate recommendation lists. The accuracy of the content emotion analysis was 87.26%, and the accuracy of user emotion prediction was 86.72%, an improvement of 13.68% compared with the MMM. Additionally, the balanced accuracy of the content recommendation was 79.31%, an improvement of 26.88% compared with the MMM. The proposed method can recommend content that is suitable for users.

1. Introduction

Human emotions appear in various ways, even in response to identical external stimuli, influenced by individual standards, life patterns, personality, and way of thinking [1]. Emotionally intelligent computing refers to computers equipped with emotion recognition capabilities that learn and adapt to process human emotions, facilitating more effective interactions between humans and computers [2]. Recent advancements in information technology have stimulated active research on the interaction between emotions and technology. Numerous studies have explored human emotions, and much effort has been made to find a link between technology and emotional states. However, emotion analysis outcomes are influenced by various factors, and it is difficult to confirm whether the emotion at a specific moment has been accurately determined. Moreover, individual variations in emotional trends can reduce satisfaction with emotion recognition capabilities.
To increase satisfaction with emotion recognition, it is necessary to consider individual-specific factors rather than general emotion recognition. Various studies have explored emotion-based recommendation methods [3,4], aiming to recommend diverse content types, such as music, movies, books, and art, while considering emotions. In the development of services and products, these recommendation technologies emphasize that user emotions play a pivotal role in service usage and item purchase decisions. Therefore, emotions significantly influence the recommendation of suitable items to users, and the users’ choice of items may vary depending on their emotional state. As user’s emotions evolve over time, the intensity and duration of emotions can vary even when experiencing the same emotion.
Studies on content recommendations that consider existing emotions [5,6,7,8,9,10] typically base their recommendations on users’ present emotional state. Human emotions change regularly over time for each individual [11,12], and individuals often experience complex emotions rather than singular ones [13,14]. Therefore, recommendation results based solely on current emotions have limitations in terms of accuracy and diversity. To address these challenges, it is necessary to consider the complexity of emotions and their evolution over time.
Among emotional stimuli, images and music, which are visual and auditory, can evoke emotions quickly and persist as long-term memories [1]. Music, also called the language of emotions, is considered one of the greatest stimuli affecting user emotions [15,16], and it has the capacity to evoke positive or negative emotions [17]. Differences in emotions expressed through music have been attributed to factors such as gender, language ability, and socioeconomic background [18,19,20]; however, there is no method to express general human emotions toward music. Recent studies have indicated that it is consistent across cultures [21,22]. Therefore, this study focuses on leveraging music data as a representative medium for influencing emotional changes among various forms of content.
Many studies are being conducted to analyze content and user emotions. Emotion refers to the degree or intensity with which the five senses are stimulated from the outside and react to that stimulation [23]. Emotional models have been studied to express these emotions using the concept of dimensions [24]. This two-dimensional approach has polarities representing valence and arousal [25]. The valence axis represents the degree of positivity and negativity of emotions, and the arousal axis represents the intensity of arousal. Valence and arousal are correlated with emotions, and emotions can be expressed based on them [22,26,27]. Representative emotion models include those proposed by Russell [28] and Thayer [29]. Studies on emotion classification primarily use Thayer’s model [30,31,32]. In this study, Thayer’s emotion model was used to express emotions by dividing them into four emotion areas.
Among content types, lyrics and audio information, which are elements of music, are used to analyze the emotions of music [30,32,33,34,35,36]. There are also studies analyzing the emotions evoked by paintings [37] or movies [38]. To analyze a user’s emotions, research has been conducted to infer emotions using social factors, facial expressions, voices, and brainwave data [39,40,41] and to predict emotions based on other people’s emotions or actions [26,42,43]. Existing research on predicting emotions [26] predicted other people’s emotions through a mental model integrated with a questionnaire on emotional transitions. This model is limited because it cannot account for personalized emotional changes, applying instead the average value of the emotional transition probability for the entire user group. To address this, this study proposes a personalized mental model. We attempted to classify music emotions using a multiple regression model based on music emotion data. Additionally, we aimed to predict changes in the user’s emotions using Markov chain and interpolation methods based on the user’s emotional history data.
In this study, we propose a continuous music recommendation method that considers emotional changes. This is as follows:
  • First, we created an emotion vector for the music using valence and arousal values, elements of Thayer’s emotion model. Using a multiple regression model, we analyzed the relationships between valence, arousal, and the four emotions to generate emotion vectors for the music.
  • Second, we generated the user’s emotion vector based on their emotional changes. The rate of emotional change for each user perspective was used to create these vectors. Each time, we generated an individual’s emotional state transition matrix using a Markov chain, defining the user’s individual mental model. The user’s emotion vector was then generated by predicting the emotional state at time t0 + n, where t0 is the current time.
  • Third, we calculated the similarity between the music emotion vector and the user emotion vector to generate a recommendation list according to the emotional state at time t0 + n. For continuous recommendation, interpolation was used to estimate the user’s emotional state between times t0 and t0 + n, creating a continuous recommendation list based on user emotions. We expect the proposed method to recommend content that is more suitable for users.
The structure of this paper is as follows. Section 2 describes existing emotion-based recommendation methods, emotion models, and emotion analysis methods as research related to this paper. Section 3 details the generation of music emotion vectors proposed in this paper, Section 4 describes the creation of user emotion vectors according to emotional changes, and Section 5 presents the continuous music recommendation method. Section 6 discusses the experiment and evaluation results of the proposed method. Finally, Section 7 provides the conclusion.

2. Related Research

2.1. Emotion-Based Recommendations

Recently, with the growth of the OTT market and the production of various types of content, technologies that recommend customized content to users have been advancing. As user participation in service and product development increases alongside recommendation technology, the emotions experienced by users become crucial factors in their service utilization and purchasing decisions [4]. Consequently, research in emotional engineering, which analyzes and evaluates the relationship between human emotions and products, is actively progressing. Emotional engineering embodies engineering technologies aimed at faithfully reflecting human characteristics and emotions, with emotional design, emotional content, and emotional computing serving as integral research fields within this discipline [4]. Moreover, with the proliferation of mobile devices and the increased use of social networking services, individuals can share their thoughts and opinions anytime and anywhere. Consequently, user emotions are analyzed through social media platforms, and numerous studies are underway on recommendations based on user emotions.
Content such as music, movies, and books has a significant influence on changing users’ emotions. Therefore, emotions are an important factor in content recommendation. Existing emotion-based recommendation studies analyze content and user emotions to suggest content that aligns with the user’s emotional state.
The music recommendation method that considers emotions [5,44,45,46] recognizes facial expressions to derive the user’s emotions and recommends music suitable for the user. As a recommendation method, content-based filtering (CSF), collaborative filling (CF), and similarity techniques were used to recommend music suitable for the user. In addition, studies have been performed for recommending music by estimating emotions through brainwave data, which is a user’s biosignal [47], recommending music by analyzing the user’s music listening history data [48], recommending music by analyzing the user’s music listening history data [48], and even studying the user’s keyboard input and mouse click patterns to analyze and recommend music [49]. Research on music recommendations that consider existing emotions mainly recommends music based on the user’s current emotional state.
The emotion-based movie recommendation method [6] defines colors as singular emotions and recommends movies based on the color selected by the user. This approach combines content-based filtering, collaborative filtering, and emotion detection algorithms to enhance the movie recommendation system by incorporating the user’s emotional state. However, because colors are defined as representing singular emotions and consider only the user’s emotion corresponding to the selected color, the accuracy of the recommendation results is expected to be low. To provide recommendations that better suit the user, it is essential to express the diverse characteristics and intensity of the user’s emotions.
The emotion-based tourist destination recommendation method [7] combines content-based and collaborative filtering techniques to recommend tourist destinations based on the user’s emotions. This approach involves collecting data on tourist attractions and quantifying emotions by calculating term frequencies based on words from eight emotion groups. Furthermore, research has been conducted on recommending artwork by considering emotions [8], recommending fonts by analyzing emotions through text entered by users [9], and recommending emoticons [10].
A common limitation of these emotion-based content recommendation studies is that they make recommendations that consider only the user’s current emotions. An individual’s emotions change over time, and even the same emotion can be felt differently depending on how it changes. An individual’s current emotional state may transition to a different emotional state over time or depending on the situation. Additionally, the speed at which emotions change may vary depending on an individual’s emotional highs and lows. Research has shown that individuals experience regular changes in their emotions over time [11,12], suggesting that certain emotions can change into other emotions with some regularity, making it possible to predict emotional changes in individual users. Additionally, individuals experience a variety of positive, negative, or mixed emotions in their daily lives [13,14]; therefore, there is a need to express their emotions as complex emotions. Thus, the user’s emotional state can be predicted from the current point in time based on the user’s emotional history. Predicting the user’s emotional state allows us to anticipate their satisfaction with recommended items, thereby enabling the development of a recommendation system that aligns closely with the user’s preferences and needs.
Therefore, in this study, we focus on music, which can significantly affect the user’s emotions among the various types of content. We propose a continuous music recommendation method that considers emotional changes over time.

2.2. Emotion Model

Psychological research related to emotions has been widely applied by computer scientists and artificial intelligence researchers aiming to develop computational systems capable of expressing human emotions similarly [23]. Emotional models are primarily categorized into individual emotion, dimensional, and evaluation models. The dimensional theory of emotion uses the concept of dimensions rather than individual categories to represent the structure of emotions [24]. It argues that emotions are not composed of independent categories but exist along an axis with two-dimensional polarities: valence and arousal [25]. The valence axis represents the degree to which emotions are positive or negative, and the arousal axis represents the degree of emotional intensity. Valence and arousal are correlated elements that can effectively express emotions [22,26,27]. Two representative figures in the research on emotion models are Russell [28] and Thayer [29].
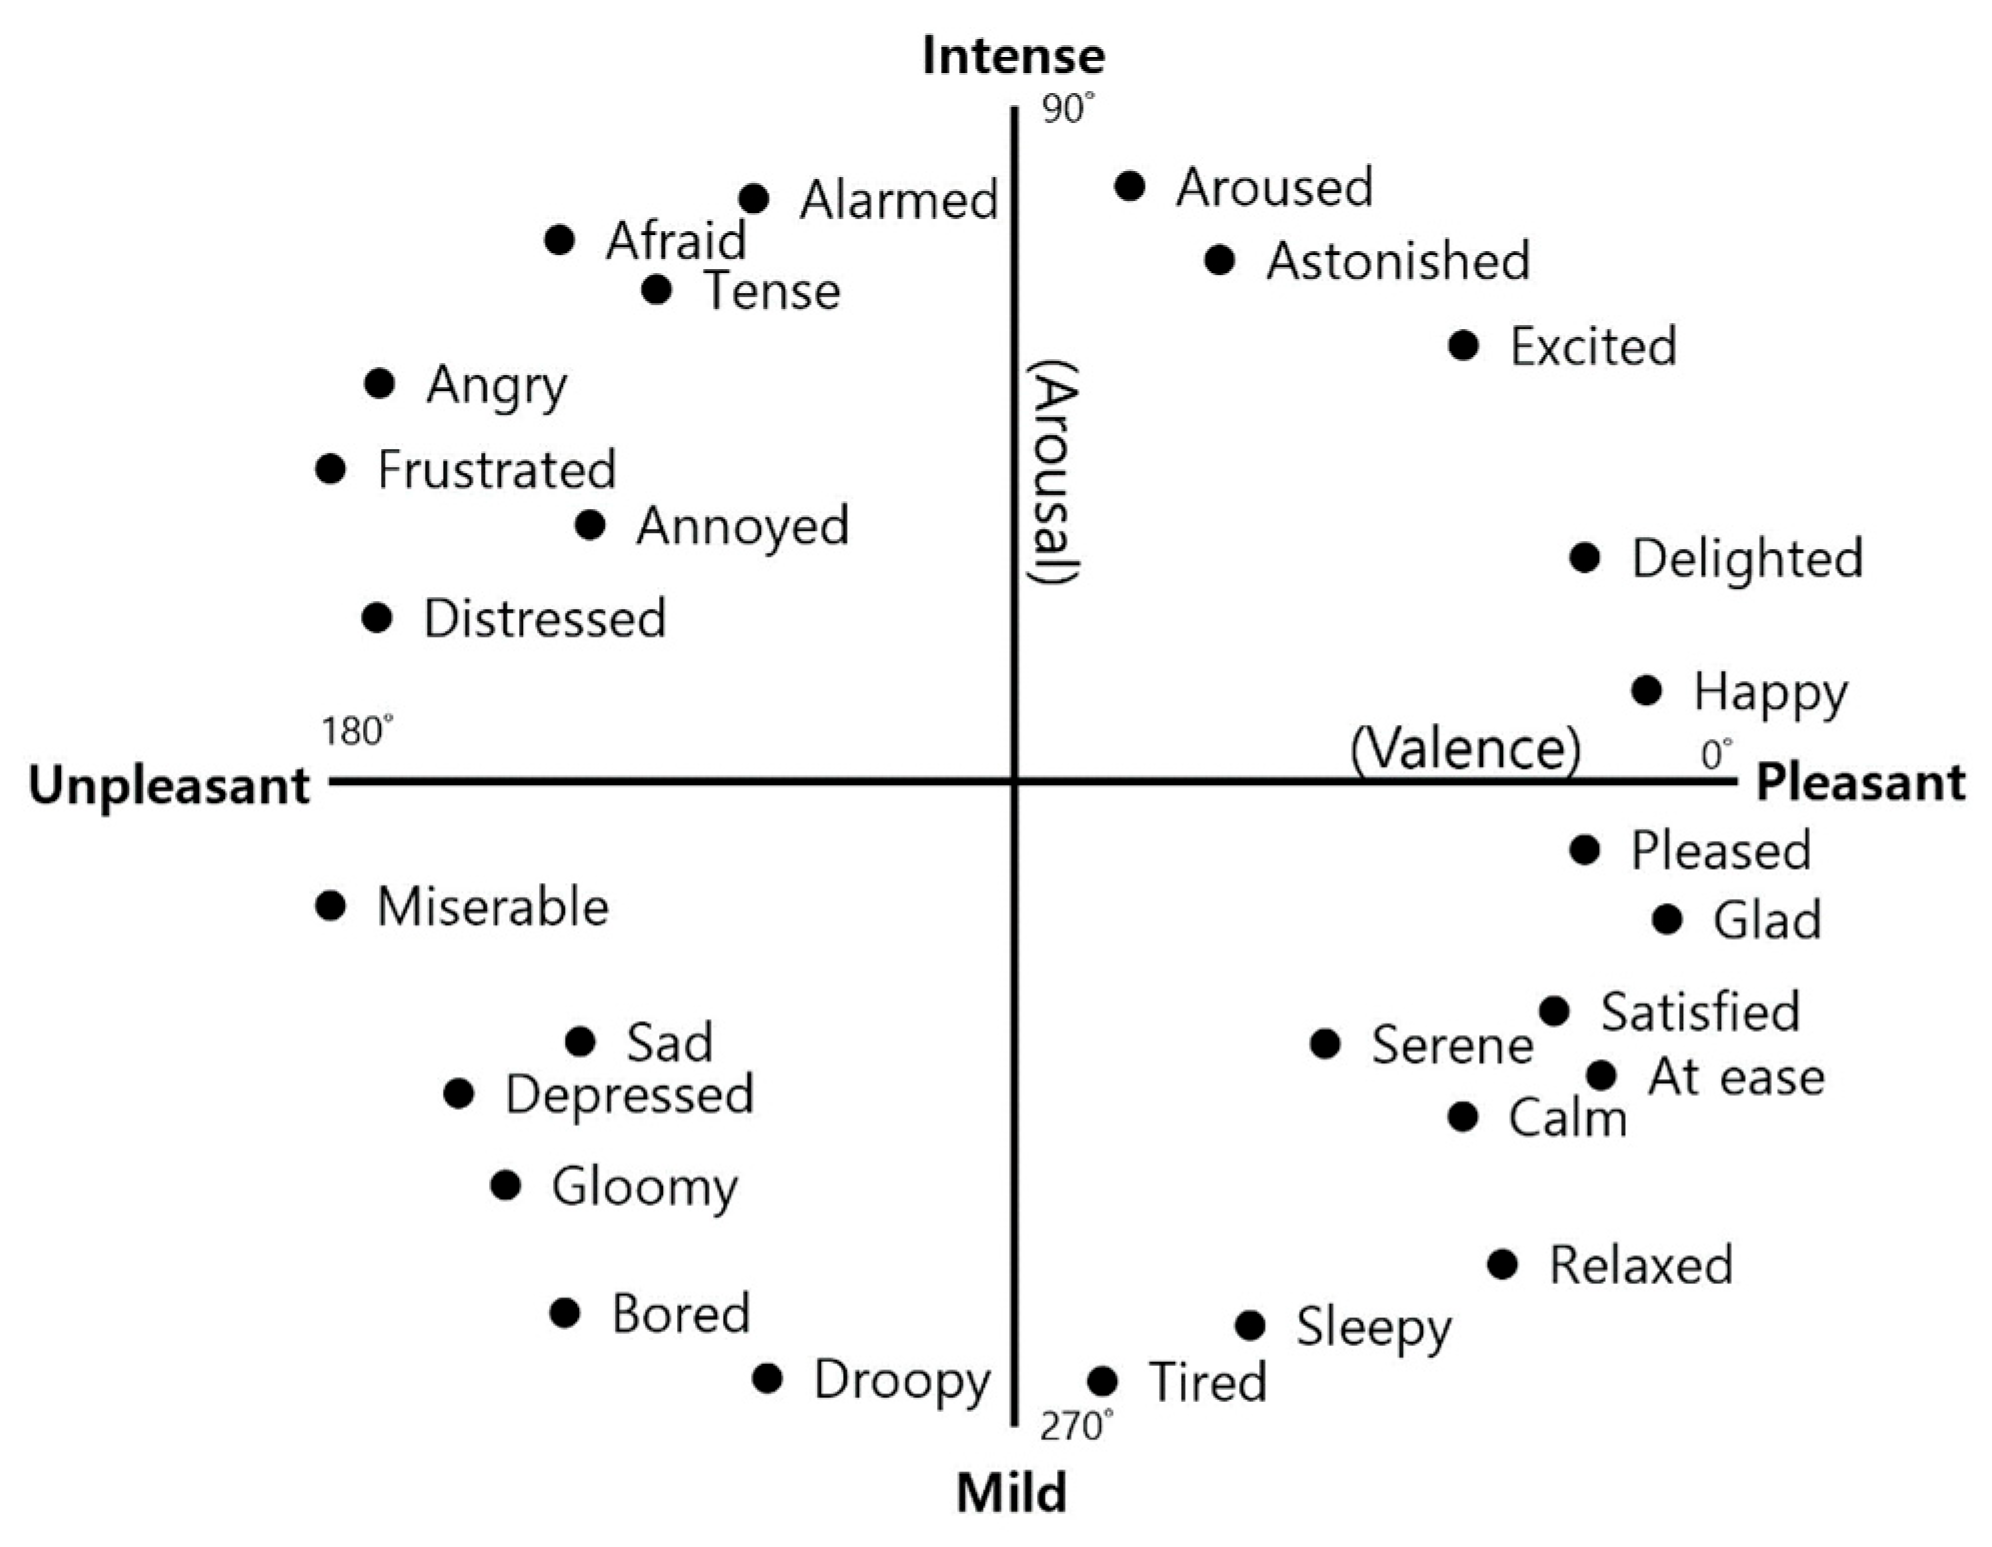
Russell [28] argued that emotion is a linguistic interpretation of a comprehensive expression involving various cognitive processes, suggesting that specific theories can explain what appears to be emotion. Figure 1 illustrates Russell’s emotional model. The horizontal axis represents valence, ranging from pleasant to unpleasant intensities, with increasing pleasantness toward the right. The vertical axis represents arousal, ranging from mild to intense, with increasing intensity upwards. According to Russell, internal sensibility suggests that individuals can experience specific sensibility through internal actions alone, independent of external factors. He argued that these experiences can be understood at a simpler level than commonly recognized emotions like happiness, fear, and anger. However, Russell’s emotion model has been criticized for its lack of compatibility with modern emotions due to the overlapping meanings and ambiguous adjective expressions inherent in its adjective-based approach [1]. Thayer’s model has been proposed to address these limitations and compensate for these shortcomings.
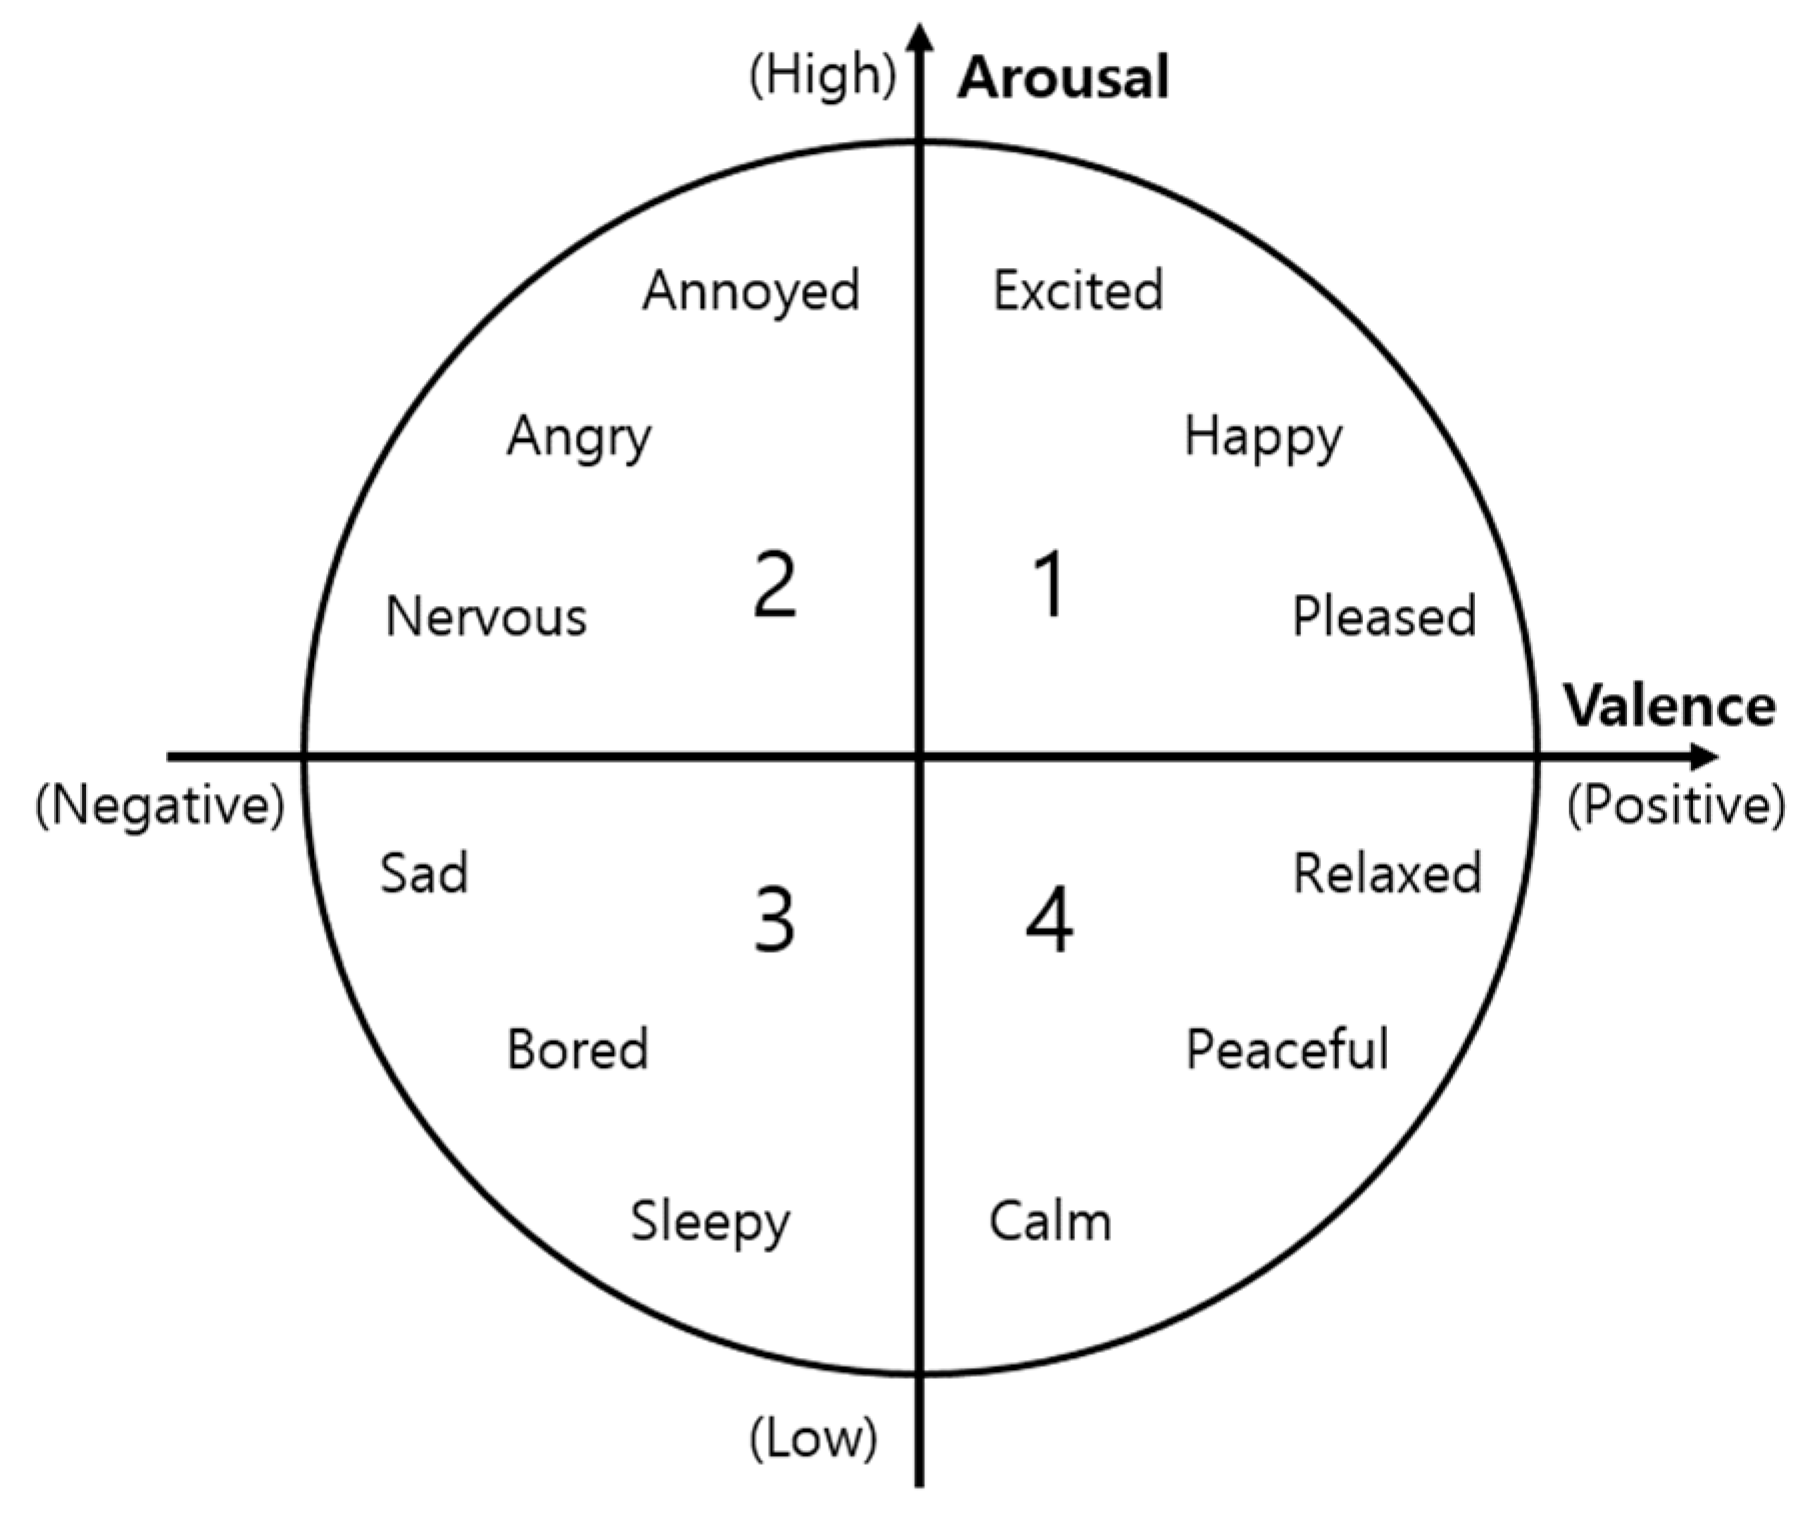
The emotion model presented by Thayer [29] is illustrated in Figure 2. This model compensates for the shortcomings of Russell’s emotion model by providing a simplified and structured emotion distribution. It organizes the boundaries between emotions, making it easy to quantify and clearly express the location of emotions [30]. Thayer’s emotion model employs 12 emotion words. In this model, the horizontal axis represents valence, indicating the intensity of positive and negative emotions at the extremes. The vertical axis represents arousal, reflecting the intensity of emotional response from low to high. Positivity increases toward the right on the horizontal axis, while emotional intensity increases upwards on the vertical axis. Each axis value is expressed as a real number between −1 and 1. Thayer’s model is primarily used to express emotions in emotion-based studies.
Based on Thayer’s emotion model, emotions are classified into quadrants based on ranges of valence and arousal values [23]. Additionally, a model has been proposed that classifies emotions into eight types, considering the characteristics of the content [30]. These studies interpret valence on the horizontal axis and arousal on the vertical axis similarly to Thayer’s stablished emotion model.
Moon et al. [32] conducted an experiment where users evaluated their emotions toward music using Thayer’s emotion model. To express emotions as a single point, a five-point scale was used for each emotional term, and users could select a maximum of three emotional terms. If multiple terms were selected, the total score could not exceed five points. Additionally, extreme emotional terms could not be evaluated simultaneously. Emotions can be felt in complex ways, and their intensity can vary among individuals; therefore, this evaluation method has limitations and is difficult to judge accurately.
In this study, we sought to generate music and user emotion vectors by dividing a quadrant into four emotion areas based on Thayer’s emotion model. Music emotion vectors were created using valence and arousal values, and user emotion vectors were generated from user input on the level of emotional terms in each quadrant.

2.3. Emotion Analysis

Various studies have analyzed emotions in content. Laurier et al. [33] classified the music emotions using audio information and lyrics, selecting four levels of emotions: angry, happy, sad, and relaxed. Better performance in emotion analysis was shown when both audio and lyrics were used compared with lyrics alone. Hu et al. [34] also classified music emotions using audio and lyrics. They created emotional categories using tag information and conducted experiments comparing three methods: audio, lyrics, and audio plus lyrics. Performance varied by category. In categories such as happy and calm, the best performance was achieved when audio was used. On the other hand, in the romantic and angry categories, the best performance was achieved when lyrics were used.
In a previous study [20] focusing on visualizing music based on the emotional analysis of lyric text, the lyric text was linked to video visualization rules using Google’s natural language processing API. The emotional analysis extracted score and magnitude values, which were mapped to valence and arousal to determine the location of each emotion. The score represents the emotion and is interpreted as positive or negative, and the magnitude represents its intensity. Based on this, six emotions (happy, calm, sad, angry, anticipated, and surprised) were classified into ten emotions according to their intensity levels. Consequently, we propose a rule for setting ranges based on values obtained from Google’s natural language processing Emotion Analysis API.
In a previous study by Moon et al. [32] analyzing the relationship between mood and color according to music preference, multiple users were asked to select colors associated with mood and mood words for music. Emotional coordinates were calculated using Thayer’s model based on the input values of the emotional intensity experienced by several users while listening to music. The sum of the intensity of each emotion for a specific piece of music among multiple users was calculated using Equation (1).
e d i s = u = 1 n d a t a u , i s                     i = 1 ,   2 ,   3 ,   ,   12 n   : n u m b e r   o f   v o l u n t e e r s
Here, e d i s represents the sum of emotions related to music, and d a t a u ,   i s denotes the level of emotions input by the user regarding the music. Using the results from Equation (1), the coordinate values for each emotion in the arousal and valence (AV) space were computed, as shown in Equation (2).
x i = e d i s × cos f θ i , y i = e d i s × sin f θ i
Here, xi represents the valence value of emotion i in the AV space, yi represents the arousal value of emotion in the AV space, and i represents the angle of emotion in the AV space. f θ i is defined recursively as f θ i 1 + 30 ( 2 i 12 ) , and f θ 1 is 15°. The average of the computed coordinate values for each emotion was then determined using Equation (3) to identify the representative emotion of the music.
x ¯ = 1 12 i = 1 12 x i , y ¯ = 1 12 i = 1 12 y i
In a previous study by Kim et al. [30], they designed a method to predict emotions by analyzing various elements of music. This method involved deriving an emotion formula that incorporates weights for five music elements: tempo, dynamics, amplitude change, brightness, and noise. These elements were mapped onto a two-dimensional emotion coordinate system represented by X and Y coordinates. Next, the study involved plotting these X and Y values onto on a two-dimensional plane and drawing a circle to determine the minimum and maximum radii that could encompass all eight emotions. The probability of each emotion was then calculated based on the proportion of the emotion’s area within the circle. These probabilities were compared with emotions experienced by actual users through a survey. However, owing to conceptual differences in individual emotions, there are limitations in accurately quantifying emotions with this method.
When emotions are analyzed using music lyrics or audio information, there are limitations to evaluating the accuracy. Lyrics sometimes express emotions, but because they are generally lyrical and contain deep meanings, it is difficult to accurately predict emotions, and modern music, depending on the genre, has limitations in expressing emotions through audio information alone. Because emotions experienced when listening to music may vary based on individual emotional fluctuations and contexts, it is crucial to analyze how users experience emotions while listening to music.
Moon et al. [36] aimed to enhance music search performance by employing folksonomy-based mood tags and music AV tags. A folksonomy is a classification system that uses tags. Initially, they developed an AV prediction model for music based on Thayer’s emotion model to predict the AV values and assign internal tags to the music. They established a mapping relationship between the constructed music folksonomy tags and the AV values of the music. This approach enables music search using tags, AV values, and their corresponding mapping information.
Cowen et al. [22] classified the emotional categories evoked by music into 13 emotions: joy (fun), irritation (displeasure), anxiety (worry), beauty, peace (relaxation), dreaminess, vitality, sensuality, rebellion (anger), joy, sadness (depression), fear, and victory (excitement). American and Chinese participants were recruited and asked to listen to various music genres, select the emotions they felt, and score their intensity. After analyzing the answers, the emotions experienced while listening to music were summarized into 13 categories. The study revealed a correlation between emotions and the elements of valence and arousal.
In a past study [37] on the emotions evoked by paintings, users were asked to indicate the ratio of positive and negative emotions they felt toward the artworks, which are artistic content in addition to music. Additionally, in a study [38] on emotions in movies, emotions were derived from the analysis of movie review data.
Various methods have been employed across various fields to analyze individual emotions. Psychology, dedicated to the study of emotions, actively conducts research on human emotions. Emotions are inferred through social factors, facial expressions, and voices recognized by humans [39,40,41]. Research has advanced from inferring emotions to predicting behavior based on other people’s emotions and behavior [42,43]. This confirms that humans can predict the emotions of others and that emotions can also predict future emotional states [26].
Thornton et al. [26] investigated the accuracy of mental models predicting emotional transitions. Participants rated the probability of transitioning between emotions based on 18 emotion words used in the study by Trampe et al. [13], assigning probabilities ranging from 0 to 100. They developed a mental model using average transition probabilities.
To assess the accuracy of the mental model, they employed a Markov chain to measure how well the participants could predict real emotional transitions. The experiment utilized actual emotional history data, revealing significant prediction capability for emotions up to two levels deep.
However, a limitation of the mental model presented in this study is its potential for errors due to the generalization of participants’ individual emotions. Furthermore, because specific emotional transitions were evaluated using fragmented probabilities through one-to-one matching, it lacks consideration of the user’s complete emotional history or temporal aspects. More accurate predictions could be achieved by predicting emotions based on an individual’s personalized emotional transition probabilities. Additionally, brainwave data, facial expressions, and psychological tests were used to analyze user emotions.
In this study, we aimed to select music that is commonly employed in emotion analysis research and is known to affect emotions. To analyze music emotions, we used music emotion data sourced from Cowen et al. [22]. Using a multiple regression model, we analyzed the relationship between valence and arousal within each emotional domain. To analyze user emotions, we utilized data as detailed by Trampe et al. [13], with considerations for the limitations identified in the mental model proposed by Thornton et al. [26].

3. Generation of Music Emotion Vectors

This section presents a method for generating emotion vectors through music data analysis for music recommendations. To recommend music that aligns with the user’s emotions, we created an emotion vector based on the characteristics of the music. In this study, Thayer’s emotion model was used to generate music emotion vectors.
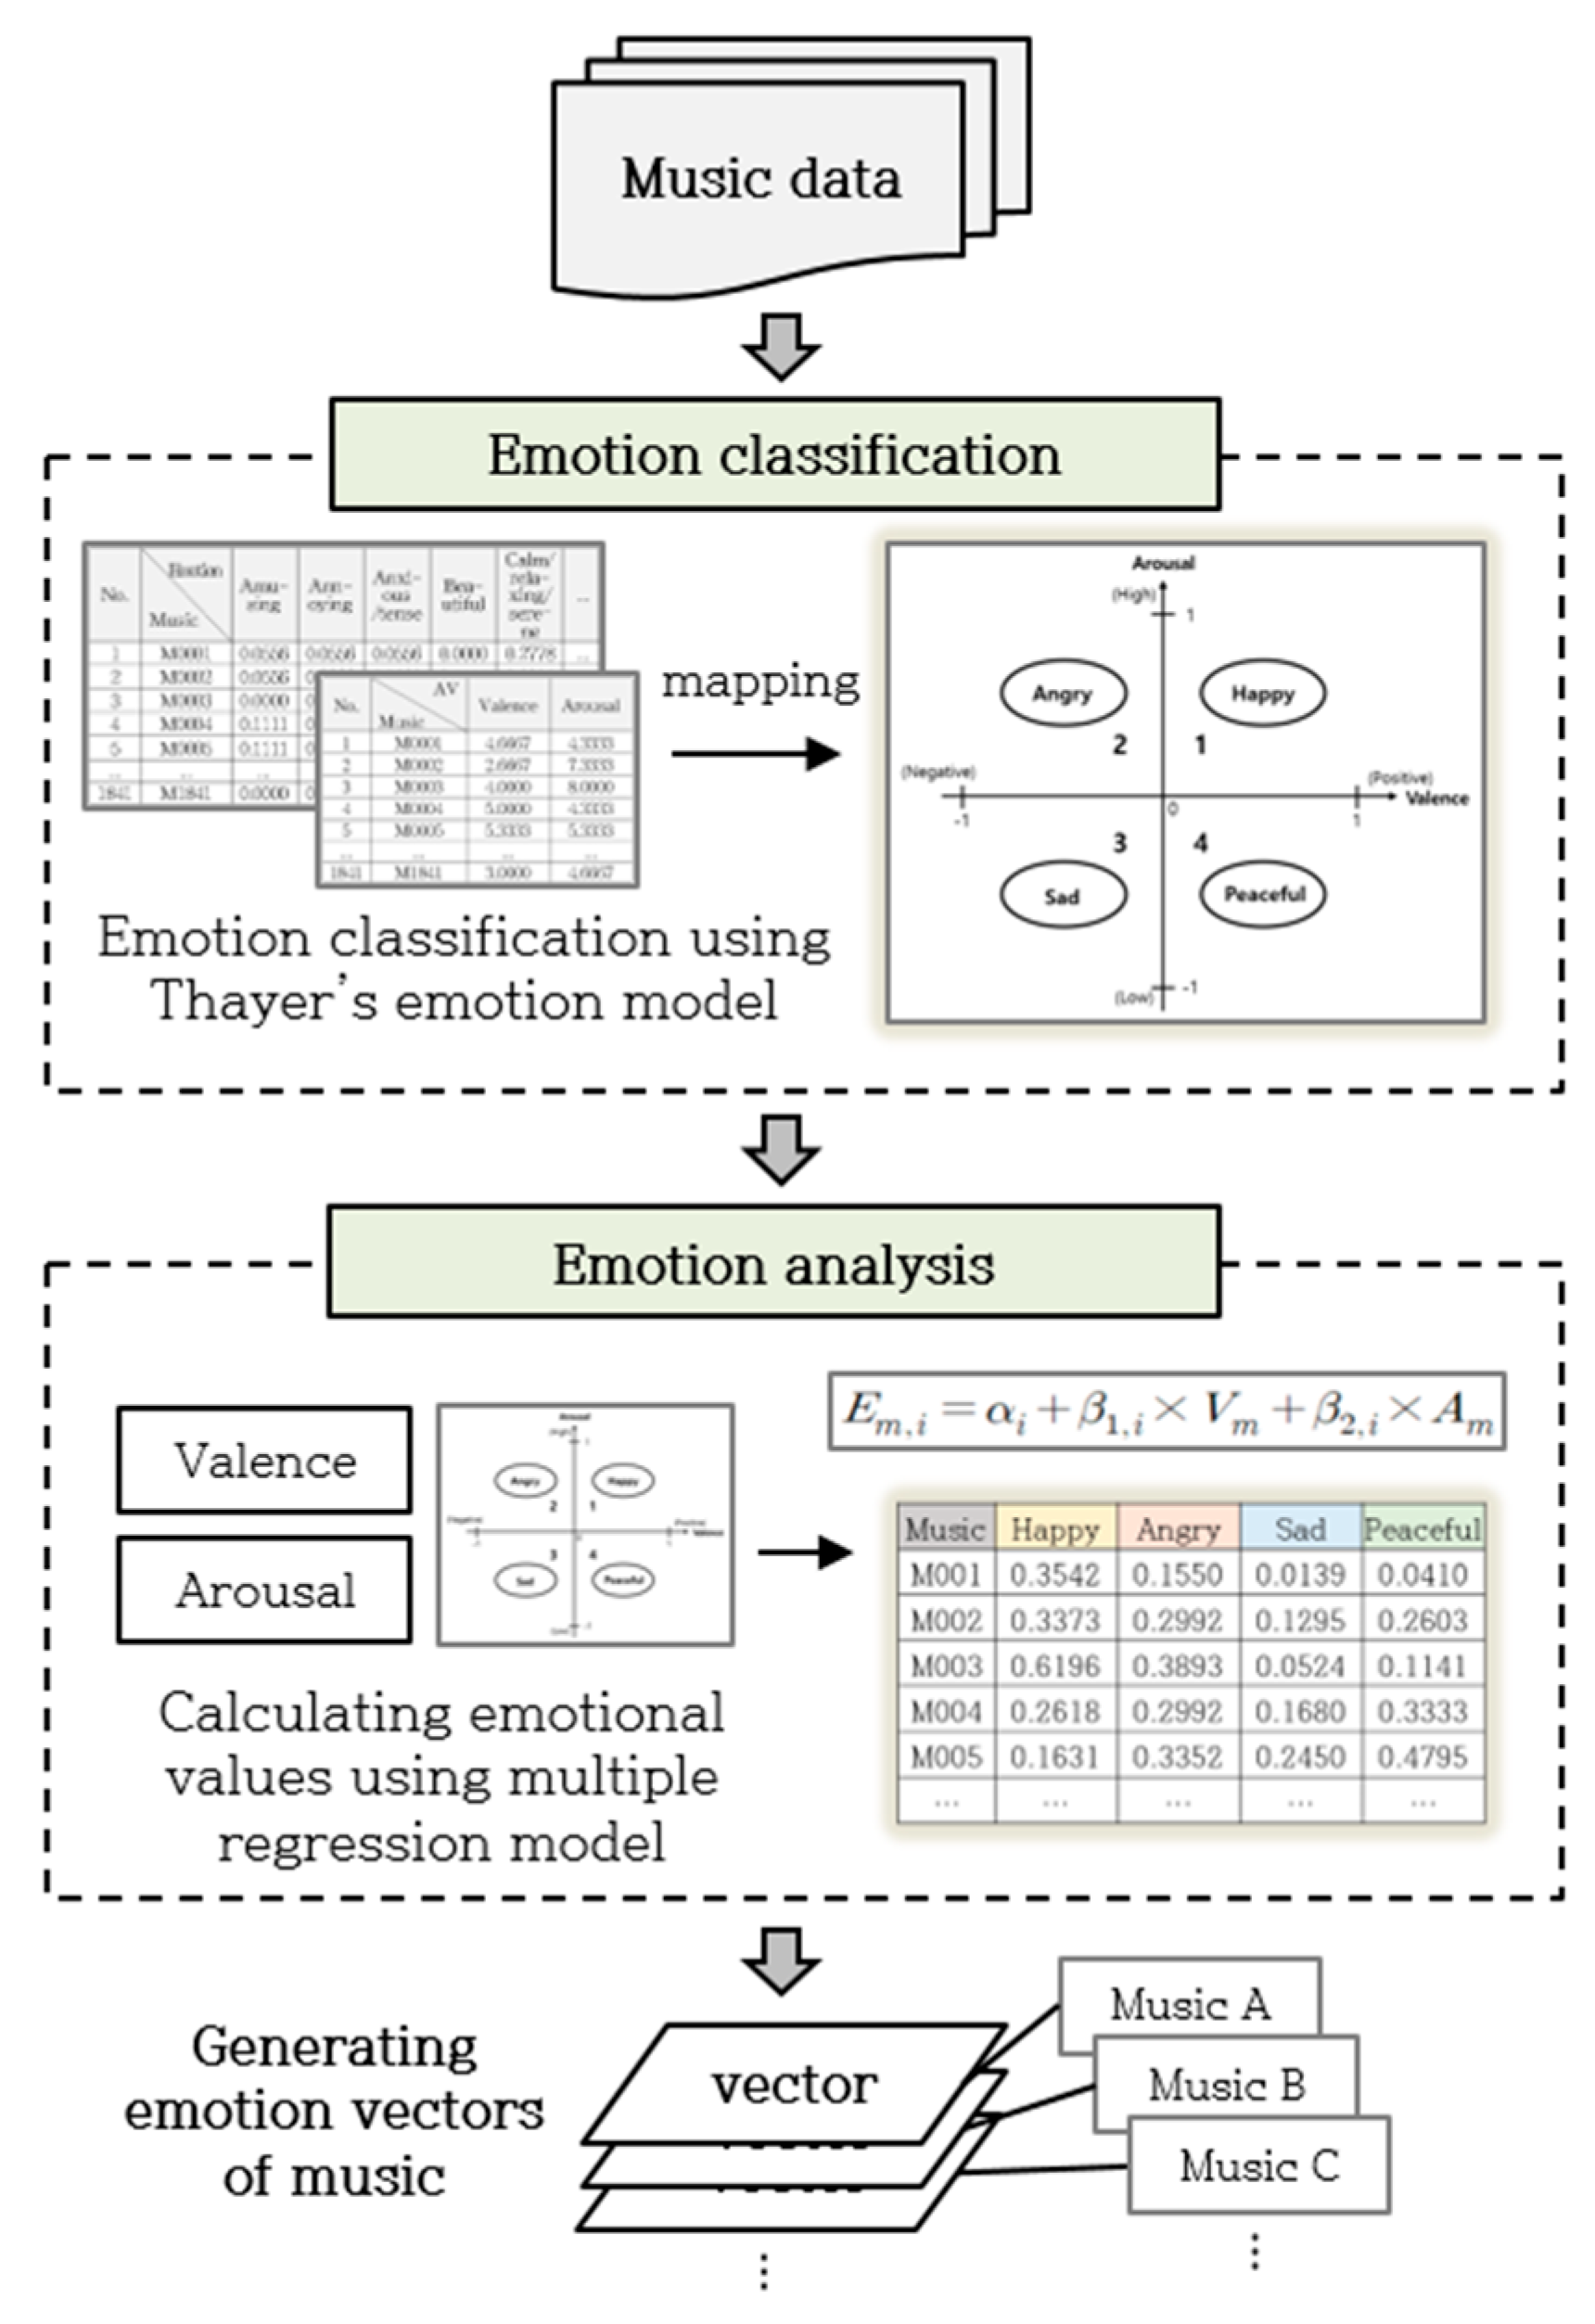
Figure 3 illustrates the process of generating music emotion vectors.
Emotions evoked by the music were analyzed using numerical values, valence, and arousal ratings provided by users. Following Thayer’s emotion model, these emotions were mapped to represent each quadrant and classified based on the music’s valence and arousal values. The relationships between valence, arousal, and emotions across the four emotional domains were examined using a multiple regression model. Multiple regression equations were used to calculate each emotional state. Emotion vectors for the music were then computed by applying multiple regression equations to calculate emotional values corresponding to the valence and arousal levels within each emotional area.

3.1. Music Data

This section describes the data analyzed in this study to generate music emotion vectors. Data provided by Cowen et al. [22] were utilized, including emotional, valence, and arousal values of the music. These numerical data integrate results from a survey on emotions experienced while listening to music by a large number of users. The emotional values for the music were classified into 13 emotions, and these values were normalized to range between 0 and 1. The valence and arousal values of the music ranged from 1 to 9.
For the emotional classification of the music, the valence and arousal values were normalized according to Thayer’s emotion model. Valence and arousal values were normalized to range between −1 and 1 using Equation (4).
V m = V a l a n c e m min V a l a n c e max V a l a n c e min V a l a n c e × 2 1 , A m = A r o u s a l m min A r o u s a l max A r o u s a l min A r o u s a l × 2 1
Here, Vm represents the normalized valence value of music m, Am denotes the normalized arousal value of m, Valencem signifies the valence value of m, and Arousalm indicates the arousal value of m. We classified the emotional areas based on the normalized valence and arousal values of the music. Additionally, other forms of content, such as movies, art, and books, can also express emotions, valence, and arousal. Therefore, the values of emotion, valence, and arousal can be utilized depending on the type of collected content.

3.2. Emotion Classification of Music

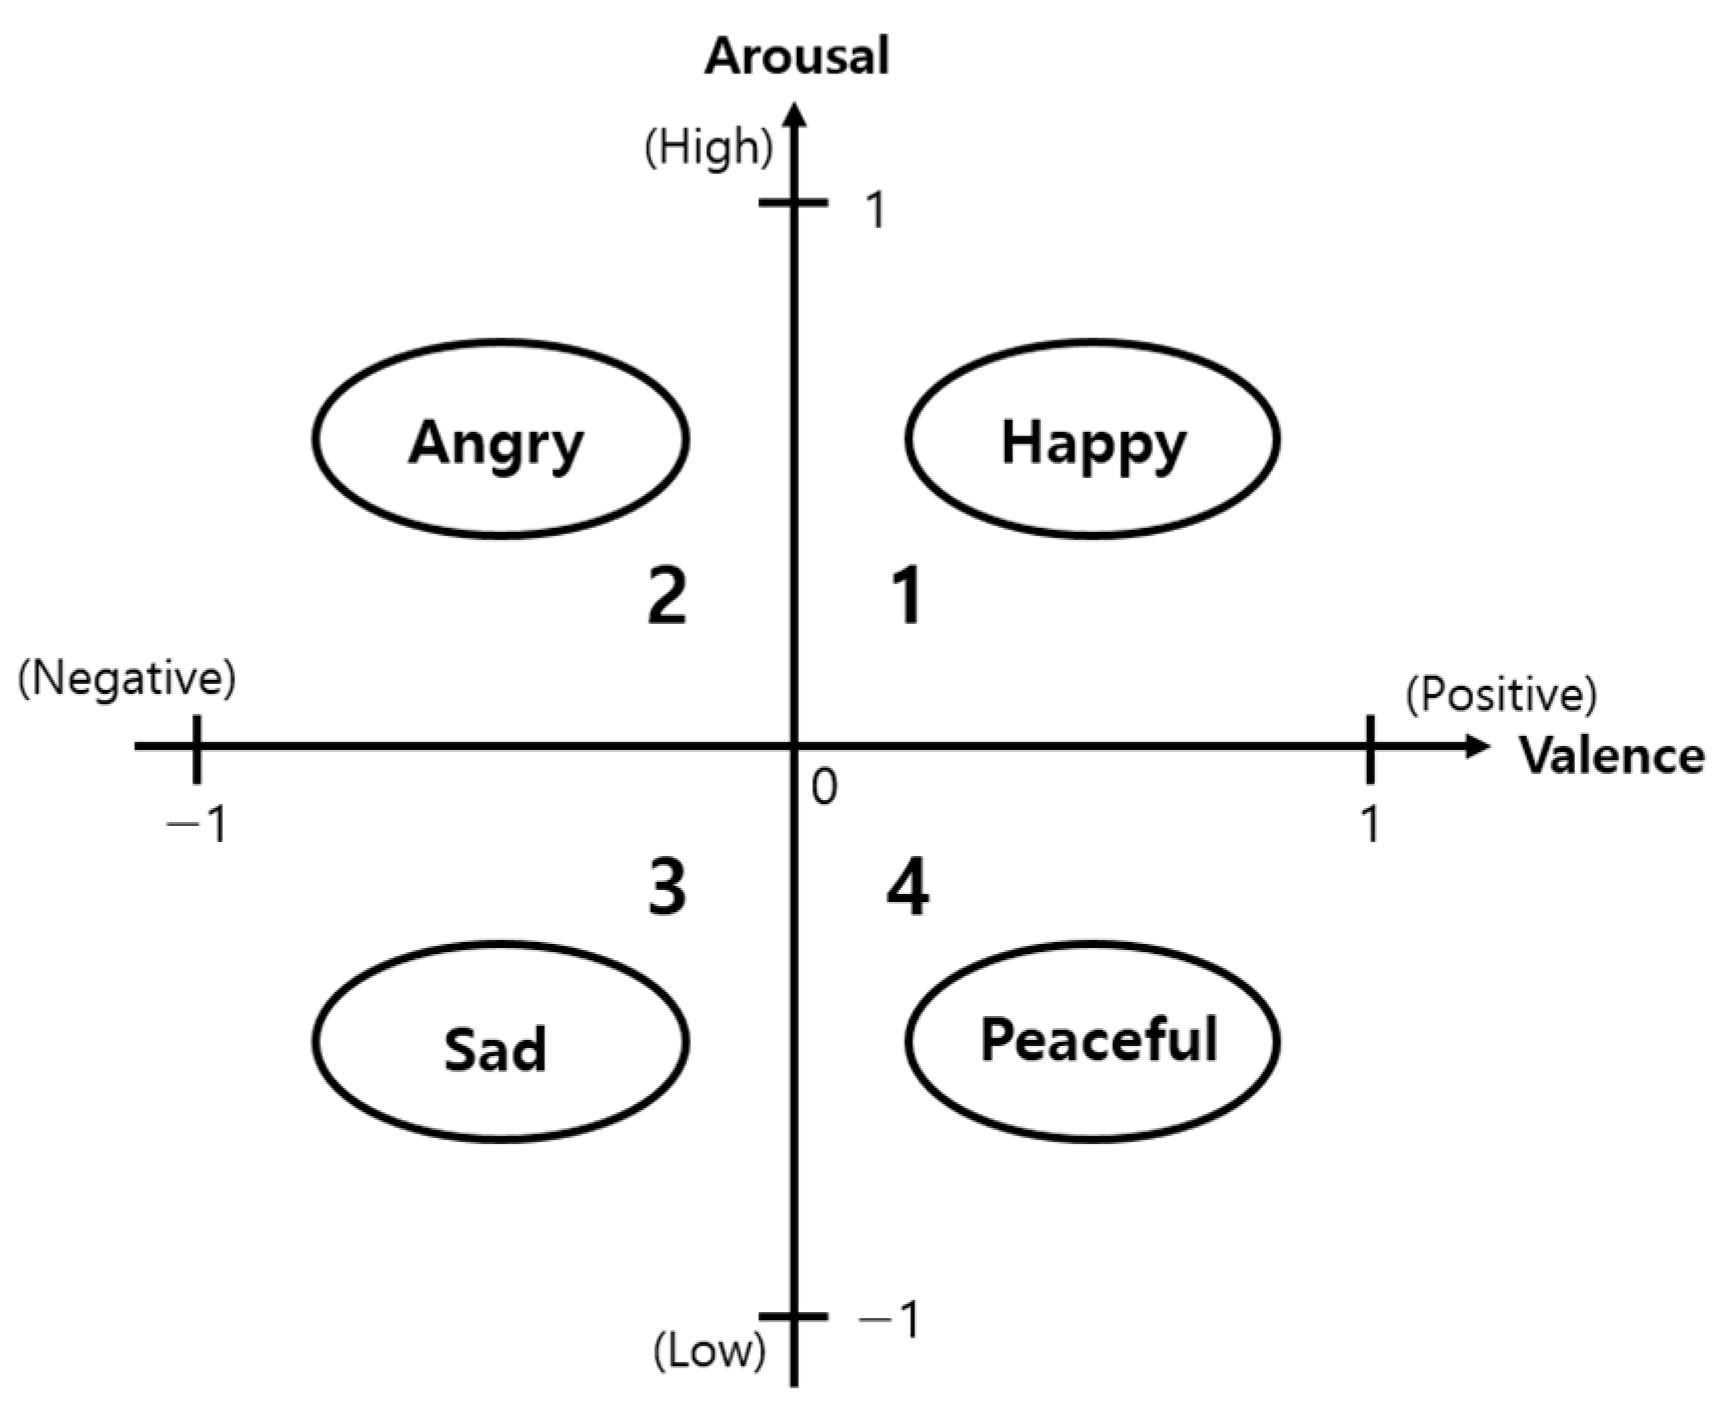
In this section, we classify music emotions using Thayer’s emotion model. According to Thayer’s model, emotions in each quadrant were classified into happy, angry, sad, and peaceful, as illustrated in Figure 4. The representative emotions for each quadrant can be adjusted and defined based on the situation.
Based on the emotion model and the standard classification of emotion words [50], the 13 emotions (collected emotions) of music from the study by Cowen et al. [22] were categorized into 4 emotions. Table 1 presents the results of this emotion mapping.
Based on Table 1, music emotions were categorized into four primary emotions. Equation (5) illustrates how emotional value Em,i for each emotion i of music m is determined. Based on the calculated emotional value of music, the emotion with the highest value was classified as the representative emotion.
E m , i = k = 1 N i d e g r e e i , k N i ( i = 1 , 2 , , n )
Here, Em,i represents the emotional value of music m for emotion i, degreei,k denotes the degree of the collected emotion k that belongs to emotion i, and Ni is the total number of collected emotions categorized under emotion i.
Based on Thayer’s emotion model, music emotions are classified according to the range of valence and arousal values. Equation (6) was used for emotion classification based on the ranges of valence and arousal values. To analyze the relationships between valence, arousal, and each emotion, cases in which the valence or arousal value was zero were excluded.
E m o t i o n m H a p p y         ( V m > 0   a n d   A m > 0 ) A n g r y         V m < 0   a n d   A m > 0 S a d             ( V m < 0   a n d   A m < 0 ) P e a c e f u l   ( V m > 0   a n d   A m < 0 ) N / A           ( V m = 0   a n d   A m = 0 )
Emotionm is the emotion according to the valence and arousal values of the music m, Vm is the valence value of the music m, and Am is the arousal value of the music m.

3.3. Emotion Analysis of Music and Vector Generation

In this section, we explore the relationship between the valence and arousal of music and each emotion, detailing the process of generating emotion vectors for music. We employed a multiple regression model to analyze the relationship between valence and arousal within the four emotional domains. Initially, we refined the data by comparing the representative emotions of the music, as classified in Section 3.2, with emotions categorized based on their valence and arousal values. Subsequently, for the multiple regression analysis, we further refined the data to include only those instances where emotions matched the valence, arousal, and representative categories within each emotional area.
Based on the refined data, we analyzed the relationship between valence, arousal, and each emotion using the Pearson correlation equation shown in Equation (7). The correlation coefficient r measures the strength and direction of the liner relationship between two variables:
r = ( x i x ¯ ) ( y i y ¯ ) ( x i x ¯ ) 2 ( y i y ¯ ) 2  
Here, r represents the correlation coefficient, and x and y denote the variables under analysis. As a result of the correlation analysis between valence, arousal, and each emotion, significant correlations were observed. Subsequently, we computed the emotional value of the music based on its valence and arousal values across the four emotional areas.
Multiple regression analysis was used to calculate the emotional value of music. During the regression analysis, valence and arousal were used as independent variables. Equation (8) creates a multiple regression model using valence and arousal.
E m , i = α i + β 1 , i × V m + β 2 , i × A m
In this equation, Em,i represents the emotion value i of music m, Vm denotes the valence value of music m, Am denotes the arousal value of music m, αi signifies the regression coefficient of emotion i, β1,i represents the regression coefficient of valence for emotion i, and β2,i represents the regression coefficient of arousal for emotion i.
Each emotional value of the music, calculated through multiple regression analysis, was represented as an emotion vector. Equation (9) defines the emotion vector for content.
V m = ( E m , h a p p y , E m , a n g r y , E m , s a d , E m , p e a c e f u l )
In this equation, V m denotes the emotion vector for music m, where E m , h a p p y ,   E m , a n g r y , E m , s a d and E m , p e a c e f u l represent the calculated emotional values for happiness, anger, sadness, and peacefulness, respectively.

4. Generating User Emotion Vectors Based on Emotional Changes

This section describes the process of generating emotion vectors based on changes in a user’s emotions. User characteristics can be defined in various ways to meet specific needs, and similarities can be identified only when they align with previously defined music characteristics. Therefore, to continually recommend content that considers a user’s emotional changes, an emotion vector was generated for each user’s perspective based on the user’s emotional information. The user emotion vector is expressed by four emotion values derived from Thayer’s emotion model, similar to how the music emotion vector is generated. Additionally, the user’s emotion vector is generated by predicting future emotions based on changes in the user’s emotions.
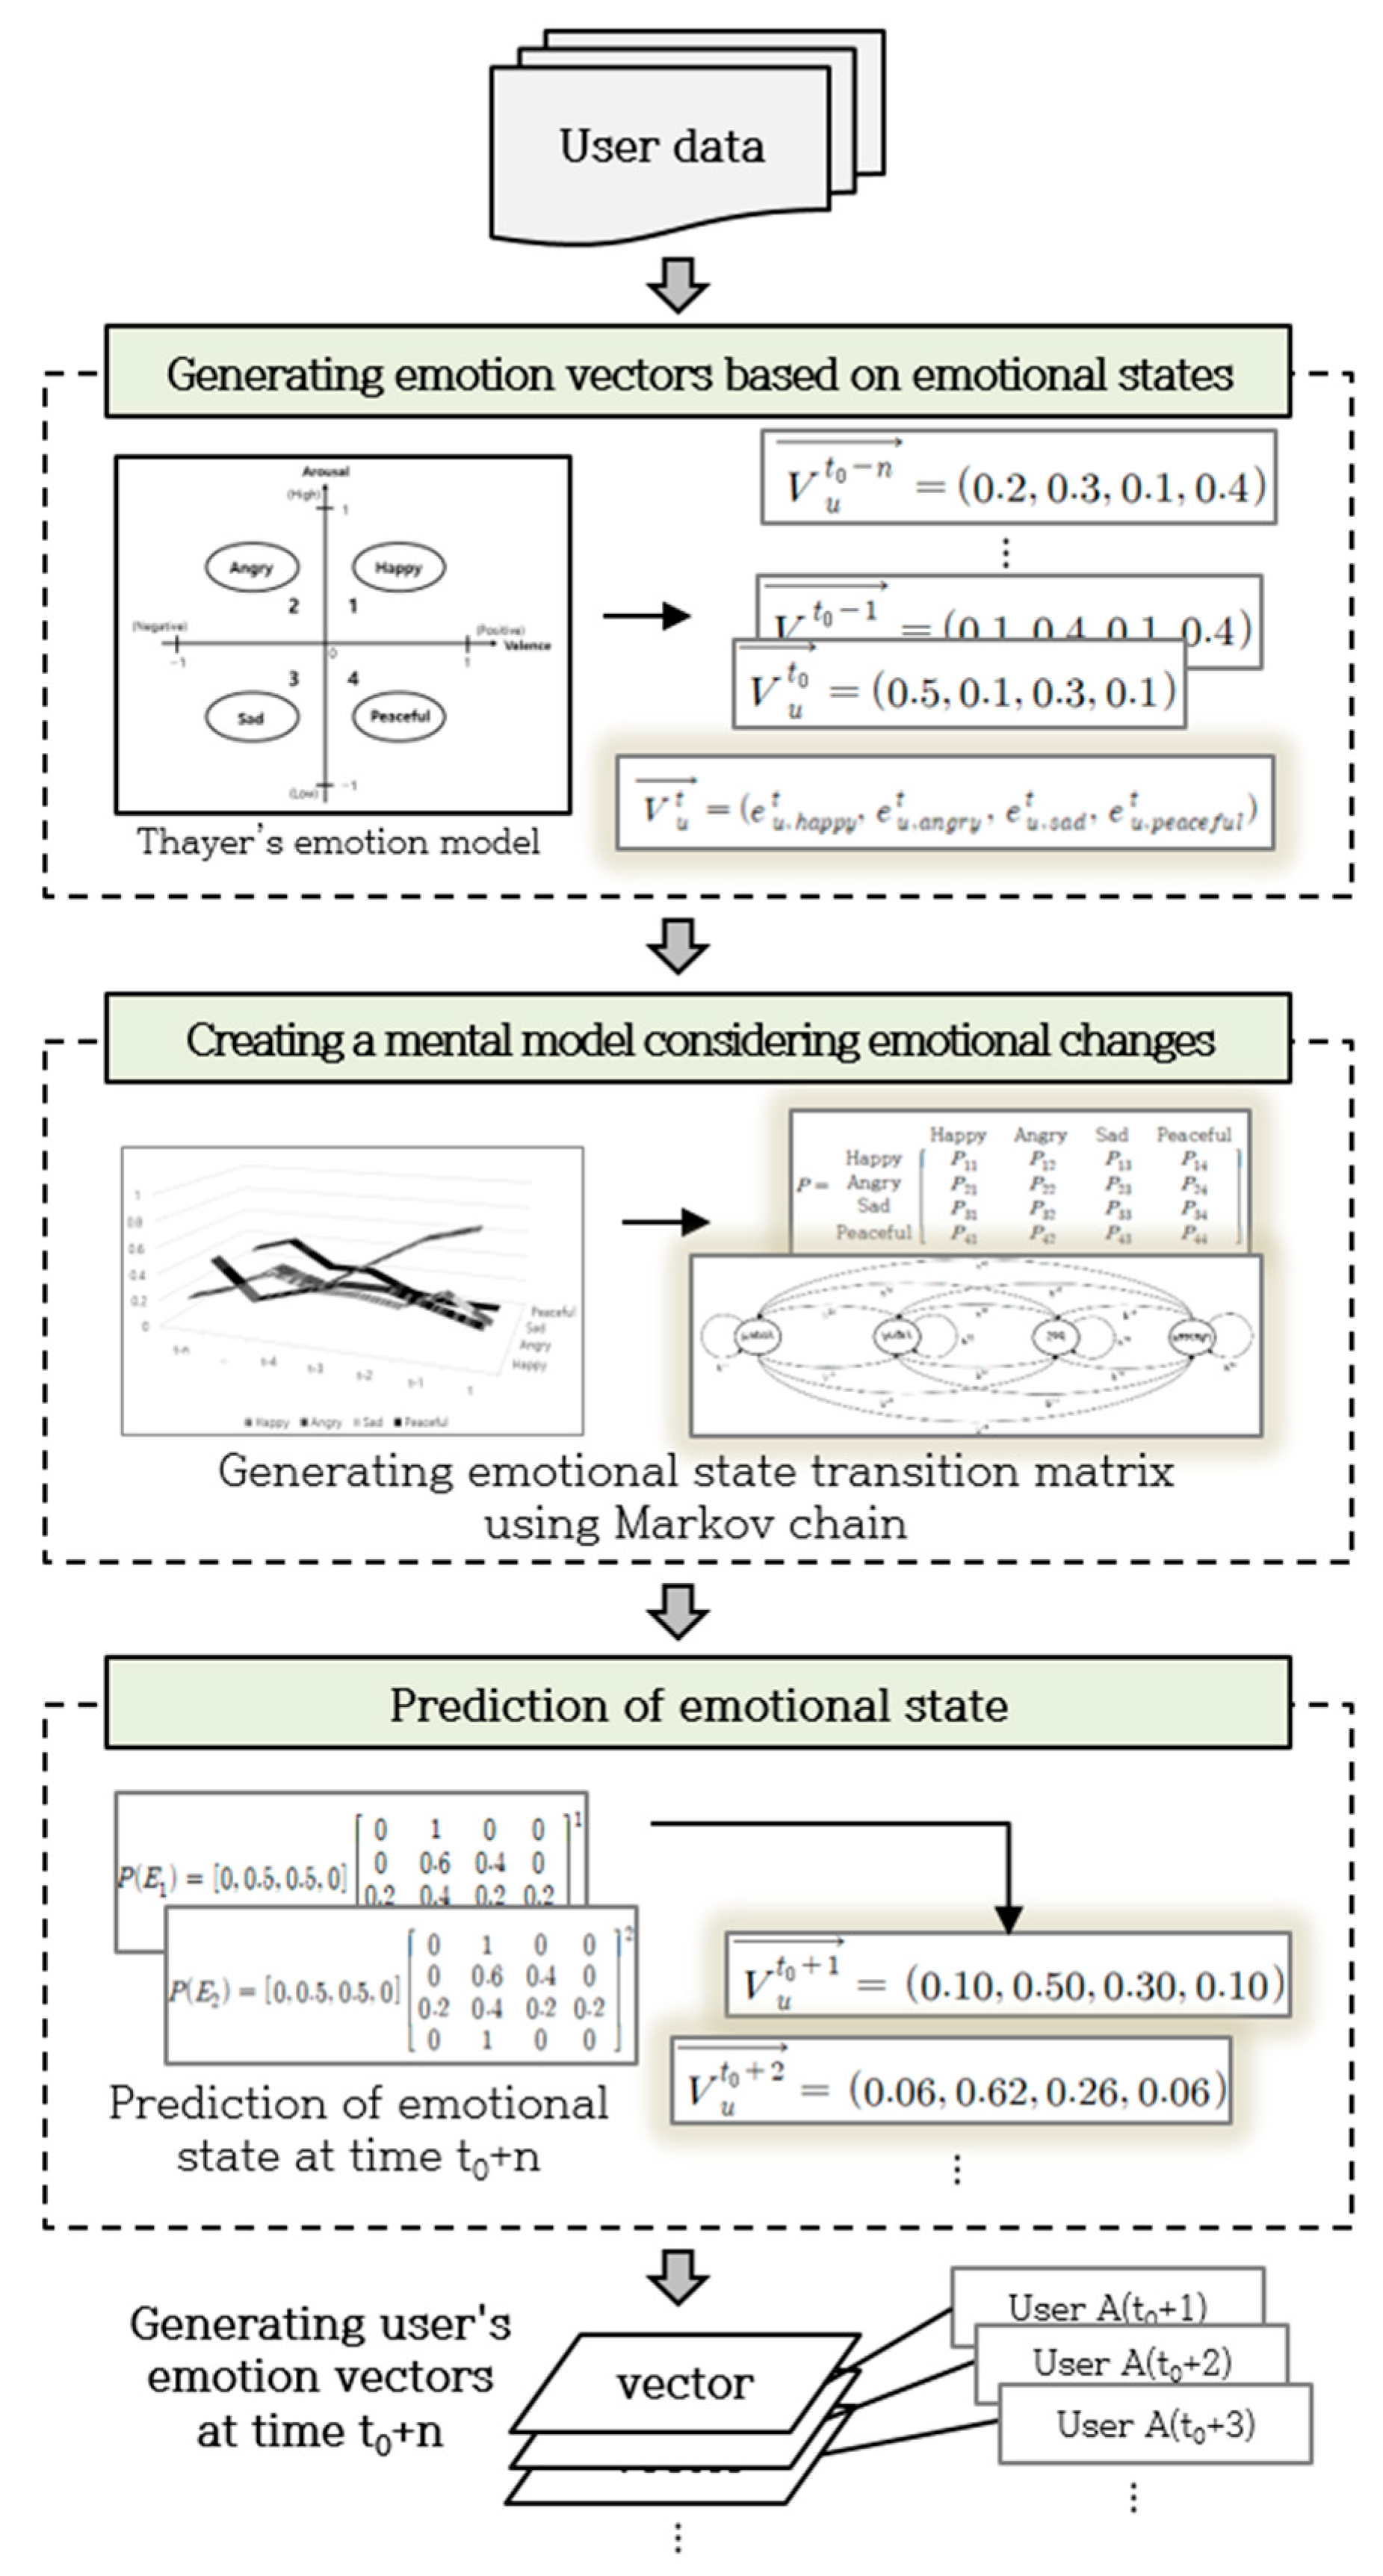
To predict user emotions continuously over time, we propose a probabilistic model based on a Markov chain. The Markov chain is a probability model where transitions between states depend on k previous states. Here, k refers to the number of states that can influence the determination of the next state, and “transition” denotes a change in state. Considering the characteristics of emotional changes, transitions between states depend on previous states. Therefore, the Markov chain process was utilized. Figure 5 shows a flowchart of generating user emotion vectors based on changes in user emotion.
In this study, emotions were analyzed based on the user’s emotional history. In the absence of user history, the initial emotional state and transition probabilities are input by the user. Using historical data, the emotional state was identified at regular intervals, and an emotion vector from the past to the present was generated. If there was no emotional data at a given interval, an interpolation method was used to estimate the intermediate emotional state. If there were no user history data, the current emotion vector was generated by considering the input emotional state. Each time, emotional changes were identified through the generated emotion vectors, and a personalized mental model was created with an emotional state transition matrix using a Markov chain. If there were no emotional history data, an emotional state transition matrix was created using the input emotional transition probability, defining it as a mental model. The user’s emotional state at time t0 + n was predicted using the generated current-state emotion vector and emotional state transition matrix, thereby generating emotion vectors for each user’s time according to their emotional state.

4.1. User Data

This section describes the data analyzed to generate user emotion vectors. To analyze a user’s emotions, various types of media can be utilized to record daily life, such as the emotional state value input by the user, the user’s content viewing history, and social network services (SNSs). Additionally, all data that can extract the user’s emotions can be used, including wearable sensor data that records the user’s voice, blood pressure, electrocardiogram, and brainwave data. Psychological testing methods, such as profile of mood states and the positive and negative affect schedule, can also be used to calculate emotion vectors. Emotional history data are required to identify changes in user emotions. These data represent the emotional state values at regular intervals over time.
In this study, based on Thayer’s emotion model, user emotions were expressed as four emotion vectors. Table 2 shows an example of the user emotional history data over time. Based on this, changes in the user’s emotions can be identified, and emotion vectors are generated at each time point; t0 represents the current time.
In the initial state, where there is no emotional history for the user, the emotional state is input by the user, and an initial value is assigned. In this study, the user’s emotional state was used as input to calculate the user’s emotion vector. The method for receiving the emotional state input involves obtaining the degree value for each emotion at each point in time based on Thayer’s emotional model. To input the emotional state, information on each of the 12 emotions in each quadrant was presented, and each emotion was scored on a scale of 0 to 5. The scale of emotions varied depending on the situation. As users can experience multiple emotions simultaneously, they were asked to enter the degree of each emotion. Thus, the user’s score for each emotion was determined, and the values of the four emotions were calculated based on the user’s emotional state.
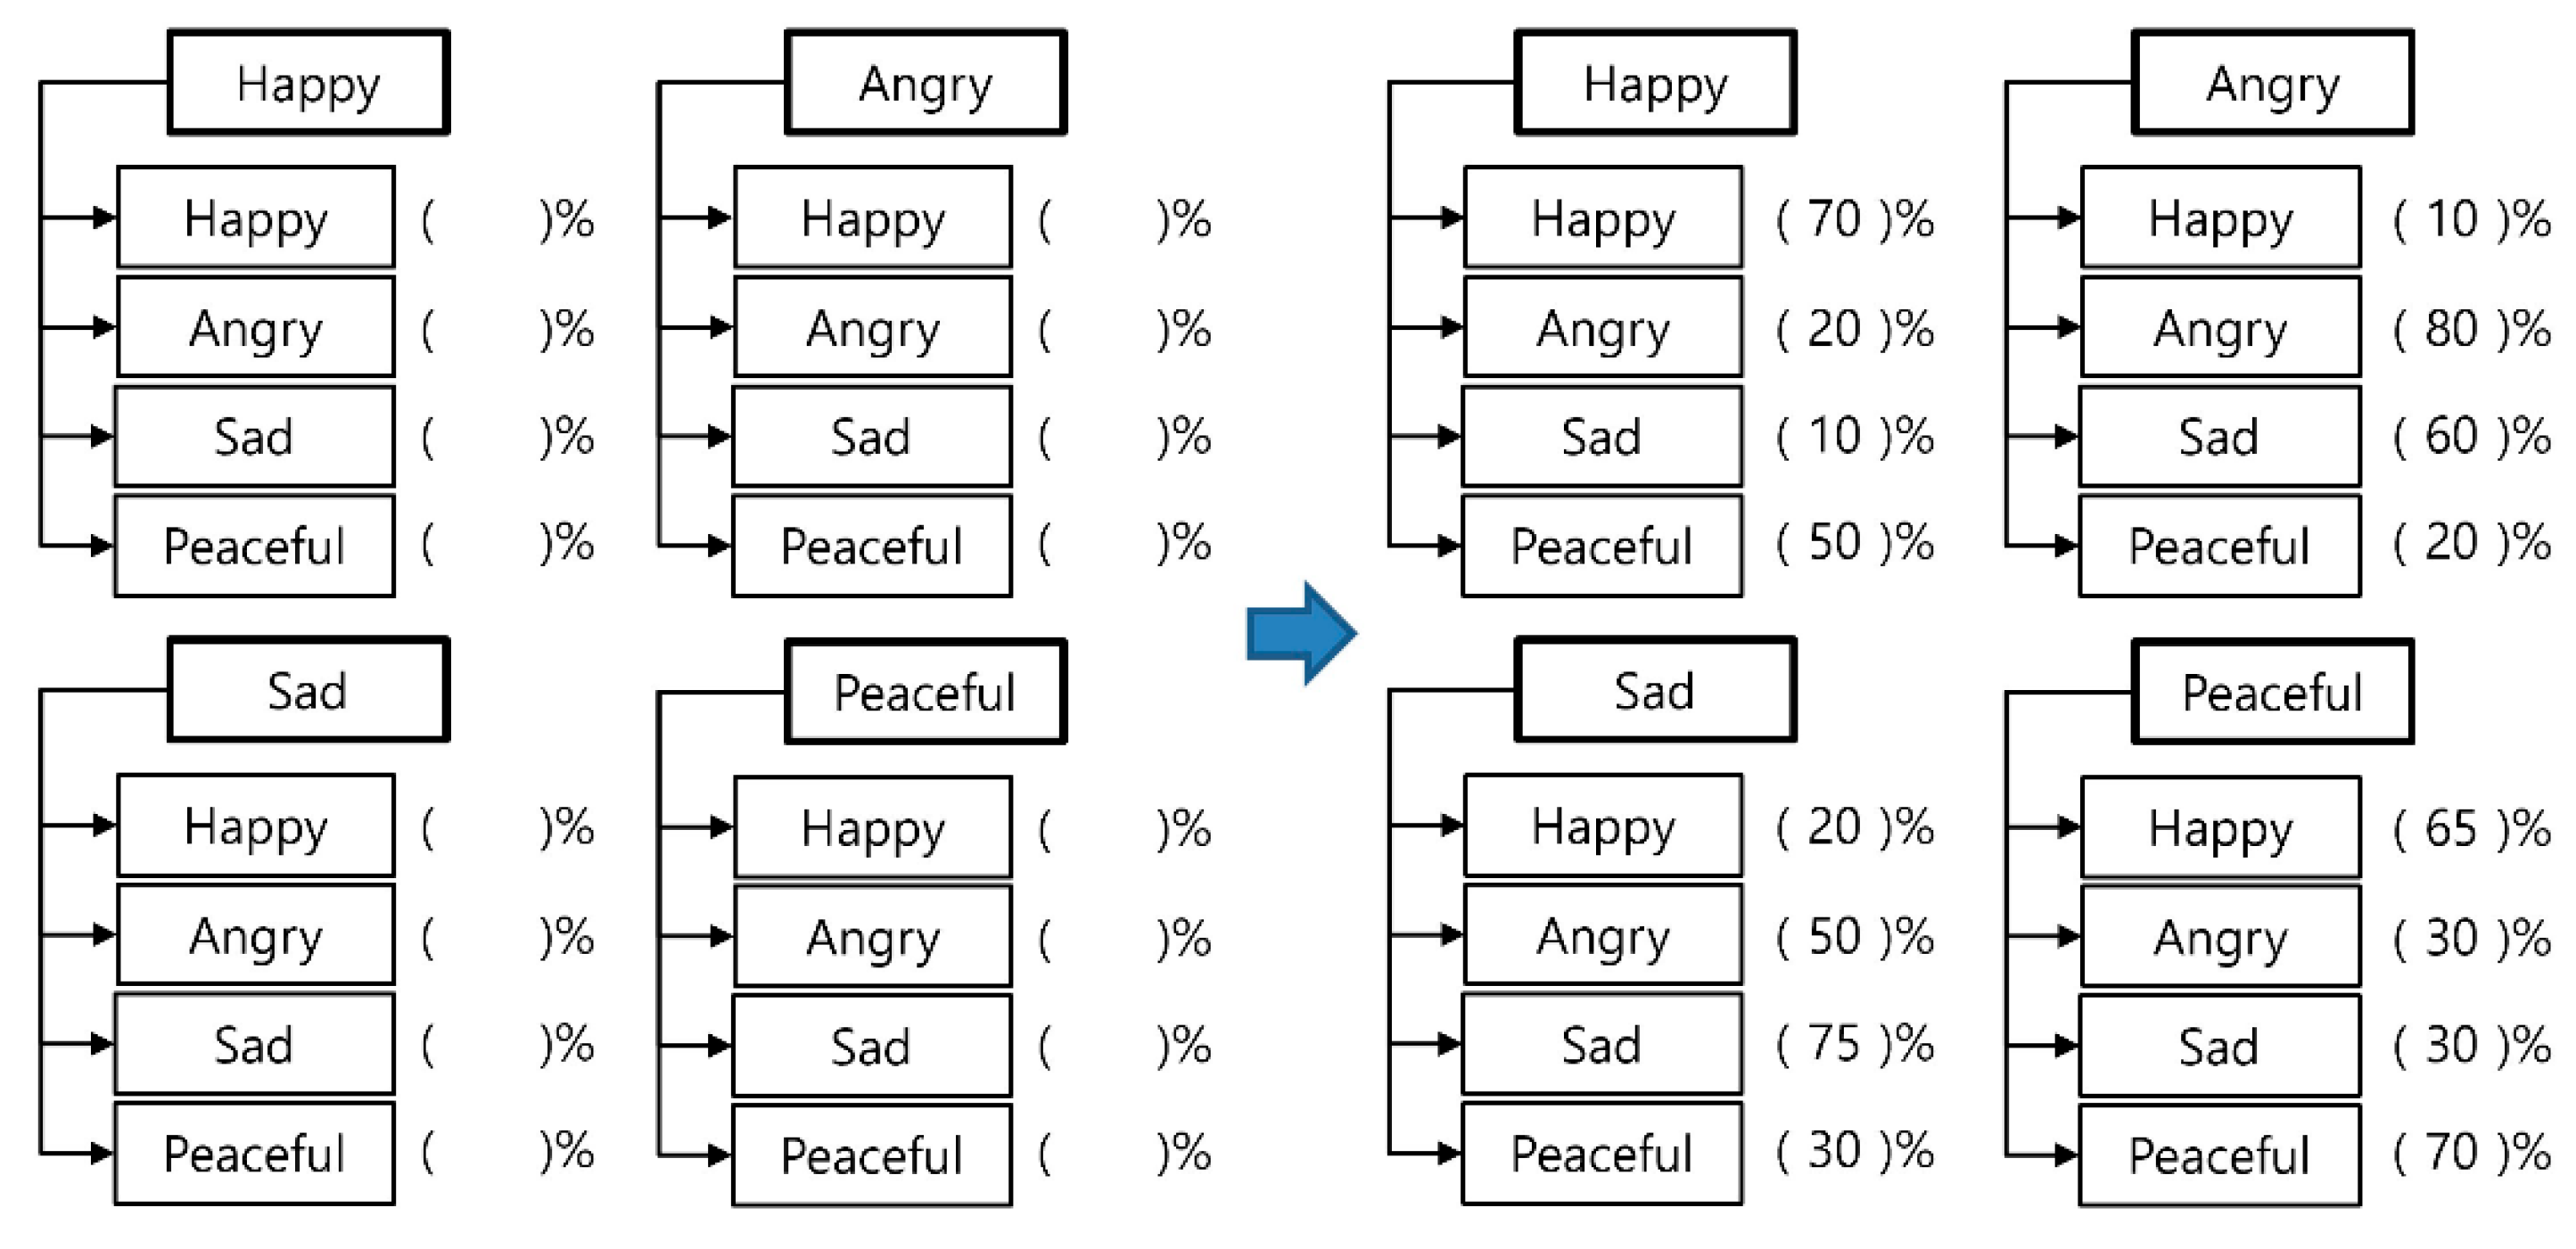
In this study, we identify emotional changes based on a user’s emotional history and create a personalized mental model. The personalized mental model is expressed as an emotional state transition matrix using a Markov chain. Thus, we aim to predict user emotions. If a user has an emotional history, an emotional state transition matrix can be generated by calculating the emotional transition probability based on the emotional history data for each time at certain intervals. In the initial state, in which the user has no emotional history, the emotional transition probability is input by the user, and an emotional state transition matrix is generated. In this study, the probability of an emotional transition after a certain time was input to predict a user’s emotion. To input the probability of emotion conversion, four emotions were used according to the emotion classification of the content based on Thayer’s emotion model. Figure 6 shows an example of the emotion conversion probability input. The probability of switching between emotions was set to a value between 0 and 100.

4.2. Generation of Emotion Vectors for Each Time Point Considering Emotional State

In this section, the emotion vectors for each time were generated using the user’s emotional history data or emotional state input. Based on Thayer’s emotion model, four representative emotion values for each quadrant were calculated using the input user emotion level values. The emotions in each quadrant were classified based on Thayer’s emotion model (Figure 4), as shown in Table 3.
The value of each emotion was calculated using Equation (10). The ratio of the emotional degree values corresponding to each emotional quadrant was calculated. Values were calculated at regular intervals and stored as historical data.
E u , i = k = 1 N i d e g r e e i , k k = 1 N d e g r e e k ( i = 1 , 2 , , n )
where Eu,i is the emotion i value of the user u, degreei,k is the degree of Thayer’s emotion axis k included in emotion i, degreek is the degree of Thayer’s emotion axis k, and i is the degree of Thayer’s emotion axis k. The index i, k refers to Thayer emotions included in emotion i, where Ni represents the number of Thayer emotions included in emotion i, and N represents the total number of Thayer emotions.
If there is no emotional history at a certain interval, the emotional state at an intermediate point in time without a history is estimated using polynomial interpolation to generate an emotion vector. The emotional state value at an intermediate point in time was calculated using polynomial interpolation based on existing emotional history data. Polynomial interpolation involves fitting a polynomial that passes through n points and can be expressed as a polynomial of order n − 1. Common methods for finding such polynomials include the method of indeterminate coefficients and Newton’s interpolation method, which mitigates the disadvantage of lengthy computation. Equation (11) represents Newton’s interpolation formula used to calculate the emotional state value E i x of emotion i at a specific time x based on emotional state values at n time points when there is no history.
E i x = a 1 + a 2 x x 1 + a 3 x x 1 x x 2 + +   a n x x 1 x x 2 x x n 1
The coefficients are determined using an nth-order finite-difference approximation method. Consequently, each user’s emotional value was represented as an emotion vector. Equation (12) represents the emotion vector from each user perspective.
V u t = ( E u , h a p p y t , E u , a n g r y t , E u , s a d t , E u , p e a c e f u l t )

4.3. Generating a Personalized Mental Model Considering Emotional Changes

This section describes the method used to develop a personalized mental model that considers changes in user emotions. The personalized mental model was derived by constructing an emotional state transition matrix using a Markov chain process, which is a probabilistic model. A Markov chain process is a mathematical technique for modeling systems that identifies their dynamic characteristics based on past changes and predicts future changes. In this study, we aim to predict the emotional state at time t0 + n by employing a Markov chain process to analyze a user’s emotional changes. The emotional state transition matrix is generated using either the user’s visual emotion vector or input values for emotional transition probabilities.
If emotional history is available, matrix elements can be calculated by analyzing patterns of emotional change. The probability of emotional transitions is determined using emotion vectors collected at regular intervals over time. However, if the emotion value is zero, the sum of the Pij values is zero. Equation (13) calculates the transition probability based on emotion vectors. Thus, an emotional state transition matrix was generated for each time point.
t p i j = n = k t 0 ( E u , i t 0 n × E u , i t 0 n + 1 )
where tpij represents the probability of switching between emotions, t0 denotes the current time, k signifies the time difference between the current time t0 and the start of historical data, Eu,i is the value of emotion i of user u, and i and j are the emotion indices.
An emotional state transition matrix was generated by calculating the probability of emotional change. Equation (14) calculates the element Pij of the emotional state transition matrix using the emotional transition probabilities. If no emotional history was available, the value entered in Figure 5 was used.
p i j = t p i j j = 1 n t p i j   ( i , j = 1 ,   2 ,   ,   n )
where Pij represents the element value of the emotional state transition matrix, tpij represents the transition probability between emotions, and i and j are indices representing different emotions. The user’s emotional state transition matrix for the four emotions classified in this study is expressed by Equation (15).
P i j = H a p p y A n g r y S a d P e a c e f u l H a p p y A n g r y S a d P e a c e f u l     P 11     P 12     P 13     P 14         P 21     P 22     P 23     P 24         P 31     P 32     P 33     P 34         P 41     P 42     P 43     P 44    
Figure 7 shows a state diagram created using Equation (15). The result is expressed as the user’s personalized mental model.

4.4. Emotion State Prediction and Vector Generation

In this section, the emotional state at time t0 + n is predicted using the user’s current emotional state and emotional state transition matrix, and an emotion vector is generated. Equation (16) predicts the emotional state of user u at time t0 + n.
P u E n = V u t 0 × ( P u ) n
Here, Pu(En) is the emotional state of user u at time t0 + n, V u t 0 is the emotional state of user u at the current time t0, and Pu is the emotional state transition matrix of user u. Based on the user’s emotional history data, if the regular interval time was 1 h, the emotional state at time t0 + n was predicted at 1 h intervals. Additionally, in the initial state, if the time standard for the emotional transition probability was 30 min, the emotional state at time t0 + n was predicted at 30 min intervals. By predicting the emotional state of the user, emotion vectors were generated at each time point. Equation (17) generates an emotion vector for each user perspective.
V u t = ( E u , h a p p y t , E u , a n g r y t , E u , s a d t , E u , p e a c e f u l t )

5. Continuous Recommendation of Music Reflecting Emotional Changes

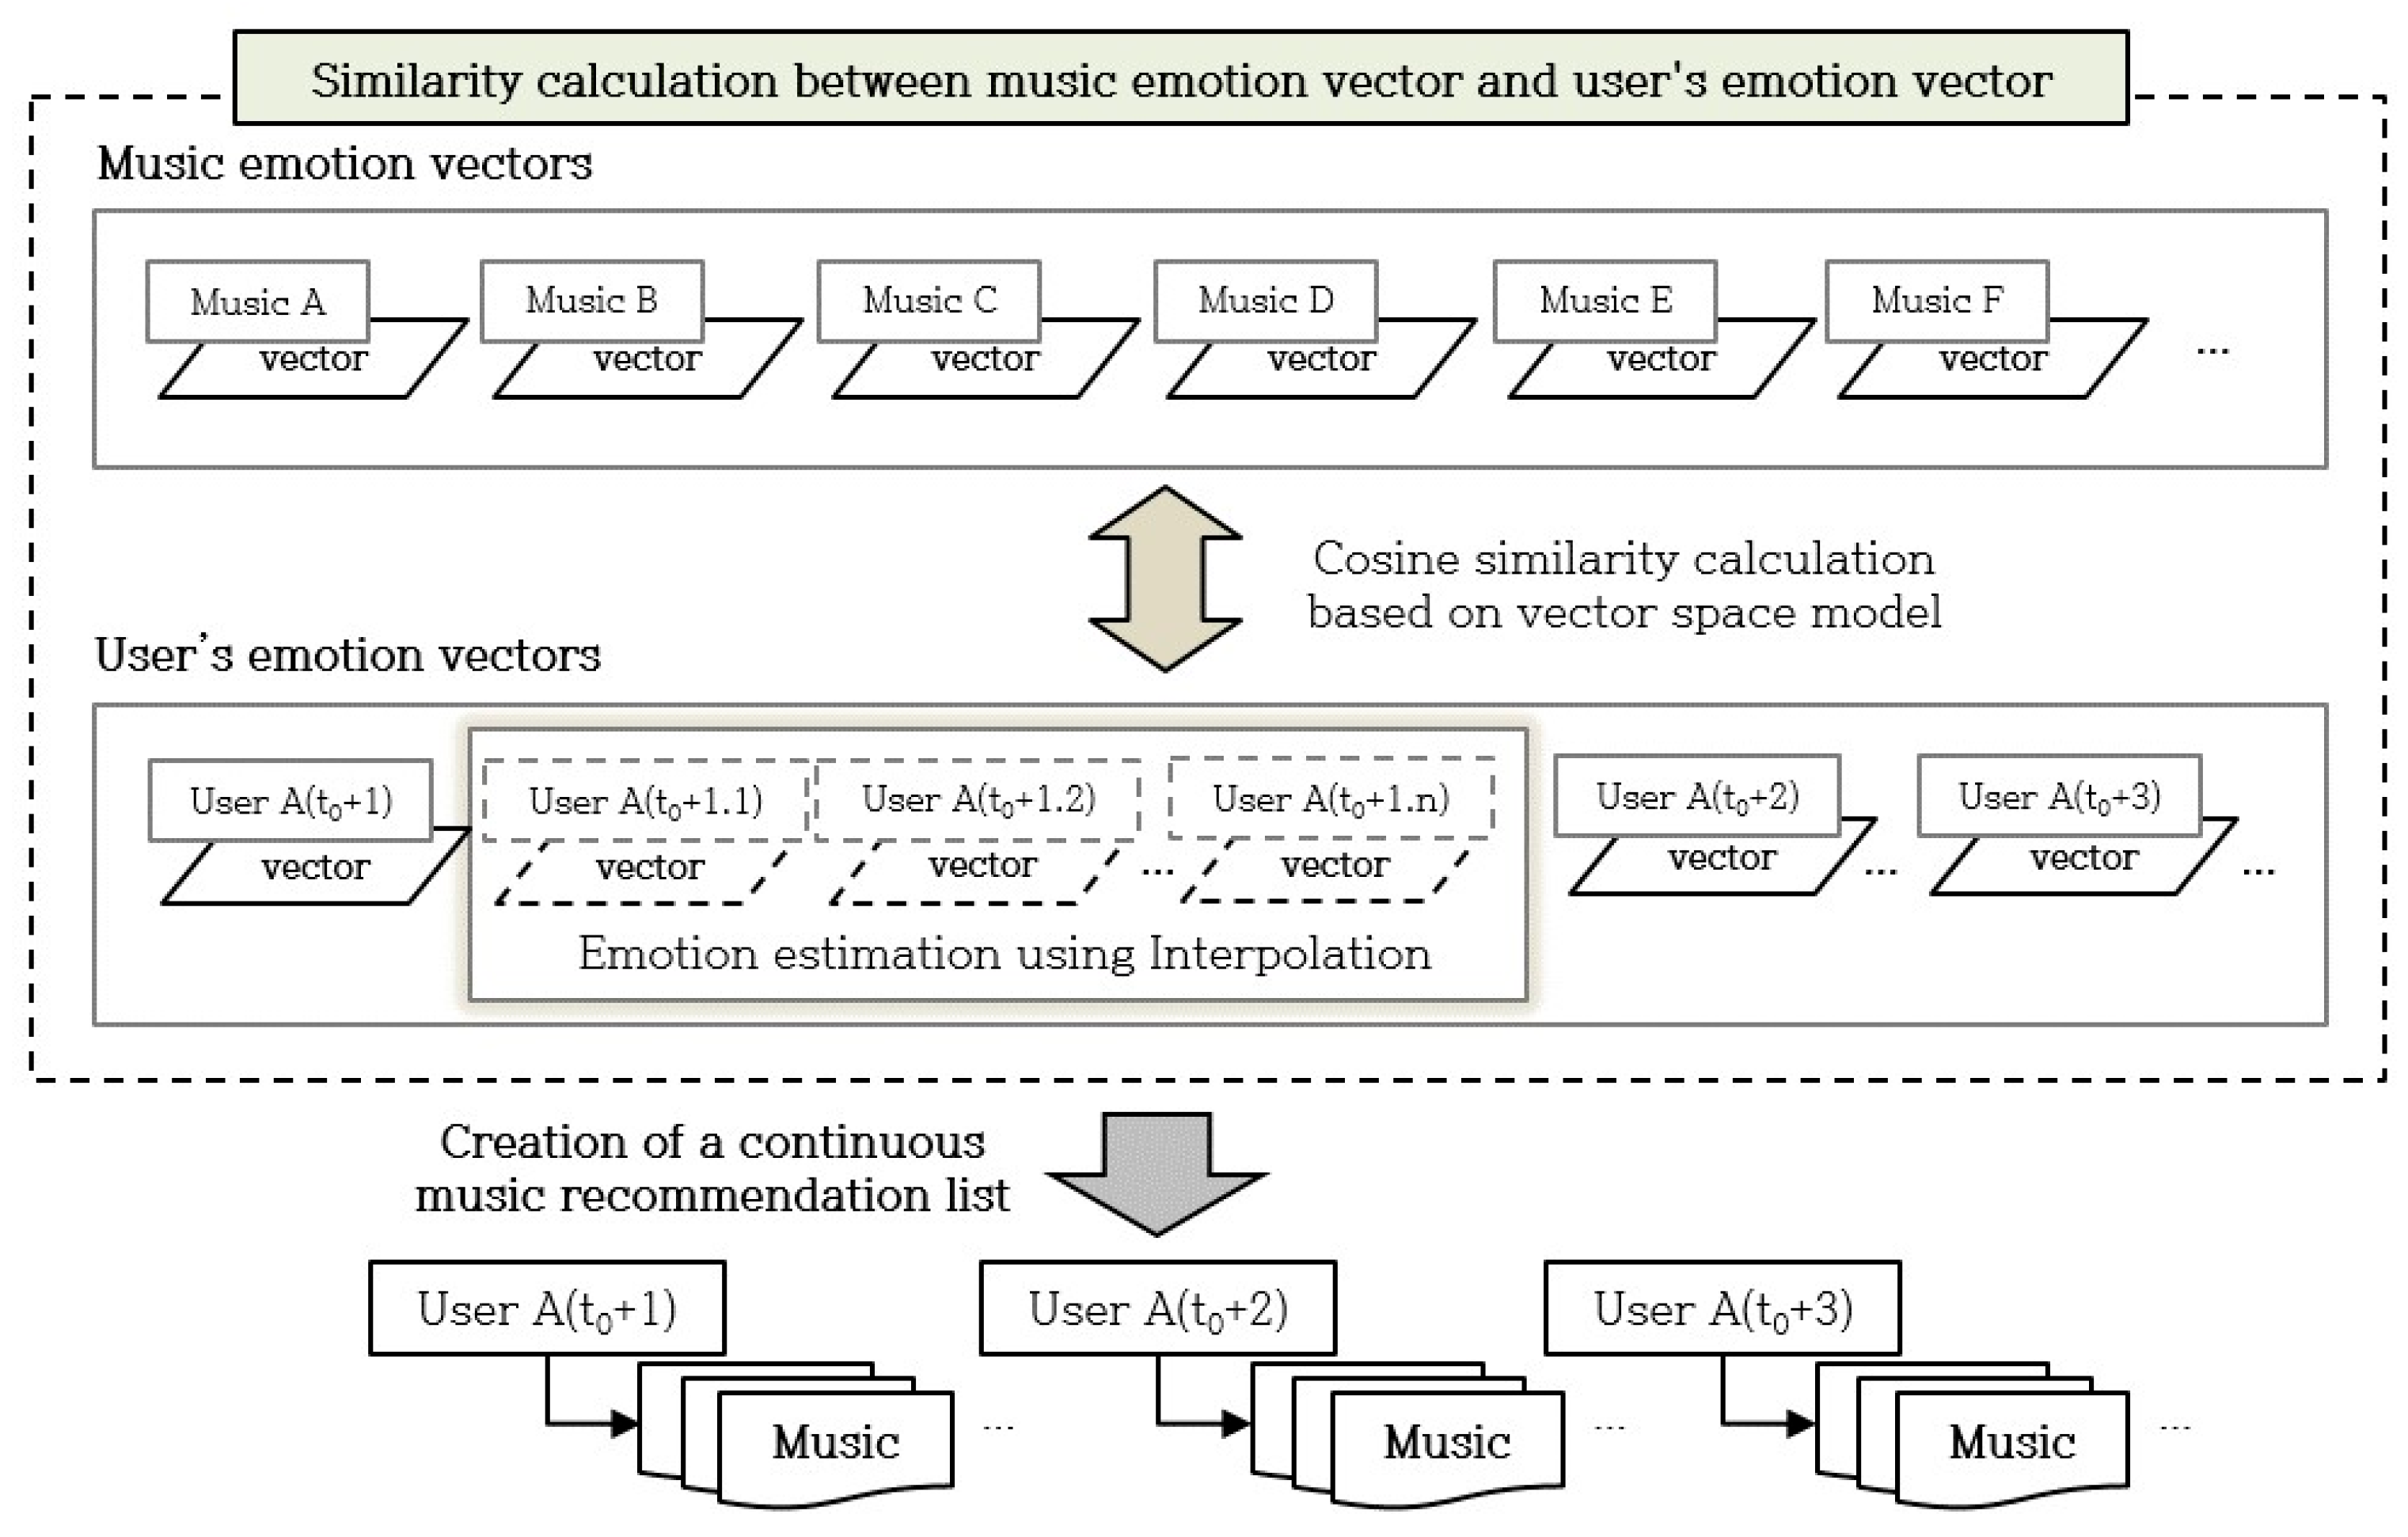
This section describes a continuous music recommendation method that reflects changes in user emotions. Figure 8 shows a flowchart of continuous music recommendations. A recommendation list was created by calculating the similarity between the emotion vector of the music and the emotion vector from each user’s perspective. The similarity between the two vectors was calculated using a cosine similarity calculation formula based on the vector space model. In addition, to continuously recommend music, an interpolation method was used to estimate the emotional value between emotion vectors each time and generate a vector. A recommendation list was continuously generated according to the emotion vector created by the user.

5.1. Calculate the Similarity Between Music Emotion Vector and User Emotion Vector

This section describes the method for calculating the similarity between music and user emotion vectors. By calculating the similarity between the user emotion vector and the music emotion vector each time, a content recommendation list was created. Various similarity calculation methods can be used to calculate the similarity between two vectors. In this study, we used the cosine similarity calculation formula based on the vector space model, which calculates the similarity between two vectors. The similarity value is between 0 and 1; the closer the similarity value is to 1, the more similar it is judged to be between the user’s emotional state and the music’s emotions. To calculate the similarity between the music emotion vector and the user emotion vector each time, Equation (18) was used.
c o s ( V m , V u t ) = i = 1 N ( V m , i × V u , i t ) i = 1 N ( V m , i ) 2 × i = 1 N ( V u , i t ) 2
V m is the emotion vector of music m, V u t is the emotion vector of the user u at each time, Vm,i is the value of the emotion vector of music m, V u , i t represents the value of the emotion vector of the user u at each time, and N represents the number of emotion vector elements.

5.2. Emotion Estimation Between Visual Emotion Vectors

To continuously recommend music, the emotion between the emotion vectors for each user’s perspective was estimated, and an emotion vector was created. If emotion vectors are generated at 1 h intervals and music is recommended, the emotional state between time t0 + 1 and time t0 + 2 is estimated, and a recommendation list is continuously generated. For this purpose, a linear interpolation formula, which is generally used to estimate the value between two points, was employed. Equation (19) is a linear interpolation formula that calculates the state value of each emotion at a specific interval between two times.
E i x = d 2 × E i x 1 + d 1 × E i x 2
where Ei(x) is the state value of emotion i at a specific time x, Ei(x1) and Ei(x2) are the state values of emotion i at two times (x1, x2), and d1 and d2 are the time ratios from time x to times x1 and x2, respectively. The sum of d1 and d2 is 1. Thus, each user’s emotional value was created as an emotion vector. Equation (20) represents the emotion vector for each specific time of the day for the user.
V u t = ( E u , h a p p y t , E u , a n g r y t , E u , s a d t , E u , p e a c e f u l t )
Based on the emotion vector generated each time, the similarity with the music vector was calculated using Equation (18).

5.3. Generating a Continuous Music Recommendation List

This section describes a method for continuously generating a music recommendation list based on changes in user emotions. The similarity between the user emotion vector and the music emotion vector at each time point was calculated, and a music list was created in the order of highest similarity. A recommendation list was created according to the emotional state at time t0 + n, and a recommendation list was created for a limited time. Equation (21) generates a continuous recommendation list based on the emotional state at each time point.
R e c o m m e n d a t i o n   l i s t m = m 1 ,   m 2 ,   m 3 ,   ,   m N r = m k k N r   ( k = 1 N r t i m e k T )
Recommendation listm is a music recommendation list according to the emotional state at each time, m is music, k is the music index, Nr is the number of music recommendations, time is music playback time, and T is the time limit. Nr is the number of recommended music lists according to the emotional state at each time and is the number of pieces of music that can be played during a limited time. If the time limit is set to T, a recommendation list is created at each interval of T based on the user’s emotional state.

6. Experiments and Evaluation

6.1. Experimental Method

To prove the effectiveness of the proposed continuous music recommendation method that reflects emotional changes, we conducted emotional analysis of music, user emotion prediction considering emotional changes, and evaluation of music recommendation results according to user emotions. The data analysis programming language R was used to evaluate the experiments.
The results of the emotional analysis of the music were evaluated based on the accuracy of the calculation of the emotional value of the music. The user’s emotion prediction results considering emotional changes were evaluated based on the accuracy of the predicted emotions by analyzing the emotional history of the user. The recommendation results based on the user’s emotions were assessed based on the accuracy of recommending music that matched the user’s emotional state.
Evaluation metrics used to determine the accuracy of data analysis and prediction results include the mean squared error (MSE), root-mean-squared error (RMSE), mean absolute error (MAE), and normalized root-mean-squared error (NRMSE). These metrics measure the difference between actual and predicted values, with lower values indicating better model performance.
Precision, recall, F1-score, balanced accuracy, and similarity were measured to evaluate the recommendation results based on user emotions. A value closer to 1 signifies higher performance, and the results are often expressed as percentages, with values closer to 100 indicating better performance. To evaluate the recommendation results, we selected the top n items from the list and conducted an experiment. Accuracy measures the proportion of correct predictions where the actual and predicted values align across all data. Balanced accuracy is a method used to mitigate exaggerated performance estimates in imbalanced datasets. In this study, balanced accuracy was calculated to account for the experimental data characteristics. Similarity assesses how closely recommended music matches the user’s actual emotions. It quantifies the resemblance between the user’s actual emotion vector and that of the recommended music.

6.2. Experimental Data

In this section, we describe the data used to demonstrate the effectiveness of the proposed method. The music data used in this study included emotional values, valence, and arousal data sourced from Cowen et al. [22]. The emotional numerical data of the music were classified into 13 types of emotions and stored as values ranging between 0 and 1. The valence and arousal data for the music ranged from one to nine.
Based on the collected data, the procedures outlined in Section 3.1 and Section 3.2 were conducted. Table 4 displays a subset of the refined data used in the experiments. The data were categorized by emotional area in the following order: happy, peaceful, angry, and sad.
The user data used in this study were emotional history data sourced from Trampe et al. [13]. These data represent a survey of the emotions experienced by 12,212 users on specific days and times of the week. The user’s emotional history data were classified into 18 emotions and stored as values of 1 or 0 by checking the emotions felt by the user. ID is the number of users; Day is a value between 1 and 7, where 1 starts from Monday and 7 represents Sunday; and Hours is a value based on 24 h.
For experimental data, the 18 collected emotions were mapped onto the 4 emotions used in this study. Table 5 presents the results of mapping these 18 emotions to 4 emotions based on the standard word classification for emotion [50].
Equation (22) was used to calculate the user’s emotional level based on the classification results into the four primary emotions.
E u , i = k = 1 N i s e l e c t i , k k = 1 N s e l e c t k   ( i = 1 , 2 , , n )
where Eu,i is the emotion i value of the user u, selecti,k indicates whether the collected emotion axis k included in emotion i is selected, selectk indicates whether the collected emotion axis k is selected, i is the index of emotion i, k is the index of collected emotions included in emotion i, Ni represents the number of collected emotions included in emotion i, and N represents the total number of emotions.
Table 6 shows an example of the numerical data for each user emotion, classified into four categories. To analyze the user’s emotions by time of day, data points without selected emotions at the given time were excluded. Additionally, user data with a history of regular intervals of days and times were selected for the experiment. Although there were limitations in selecting data from users who had emotional histories recorded at equal intervals, the experiment was conducted by setting the selection criteria according to the data distribution.

6.3. Experimental Results and Evaluation

6.3.1. Evaluation of Music Emotion Analysis Results

To classify emotions in music, we first analyzed the correlation between valence and arousal in each emotional area and emotion and confirmed that the absolute value of the correlation coefficient |r| (Equation (7)) was higher than 0.3, indicating a moderate correlation between the variables. A total of 570 songs were used, and the emotional value of the music was calculated based on the valence and arousal values for each emotional area using a multiple regression model. Table 7 presents the regression coefficients for each emotional area used as a factor in the multiple regression equations.
Table 8 presents selected results from the calculation of the emotional values of music. These results were obtained using Equation (8), employing the regression coefficients specific to each emotional area detailed in Table 7, and based on the experimental data.
In this study, the emotional values of music were determined using multiple regression analysis. The accuracy of these results was evaluated using the MSE, RMSE, MAE, and NRMSE. Table 9 presents the average errors and error rate in the calculation results for each emotion.
Experimental evaluation indicated that the MSE, RMSE, and MAE values were small. The average values across all emotions were 0.0146, 0.1190, and 0.0785, respectively. Additionally, NRMSE was computed to further assess the accuracy of the results. On average, the error rate across all emotions was 12.74%, indicating an accuracy of 87.26%. The error rate represents the difference between the emotional value of the music as evaluated by users and the calculated value. Increasing the number of user evaluations or comparing them with exact values can improve the accuracy of these results.

6.3.2. Evaluation of User Emotion Prediction Results Considering Emotional Changes

To demonstrate the effectiveness of the proposed method, a comparative experiment was conducted between the emotion prediction results using the mental model proposed in a previously reported study [26] and the emotion prediction results by applying the PMM proposed in this paper. In this comparison, the mental model from the previous study was adapted by mapping its emotions to four categories. This modified mental model is referred to as the MMM. Equation (23) is the emotional state transition matrix of the MMM based on four emotions.
P = H a p p y A n g r y   S a d   P e a c e f u l H a p p y A n g r y S a d P e a c e f u l     0.34     0.16     0.14       0.36           0.17     0.35   0.34   0.14         0.15     0.29   0.41   0.15         0.35     0.13   0.13   0.39    
In order to predict user emotions considering emotional changes, we first extracted user data to be used in the experiment. Table 10 shows an example of a user’s emotional vector by time, and t0 means the current time.
For example, for a prediction experiment, we want to predict the emotions of the user at time t0 + 1 and t0 + 2 based on the history data up to time t0 based on the current time. Equation (24) is the emotion vector of the user at the current time, and Equation (25) is the emotion state transition matrix generated based on the history data up to the current time.
V u t 0 = ( 1.0 , 0.0 , 0.0 , 0.0 )
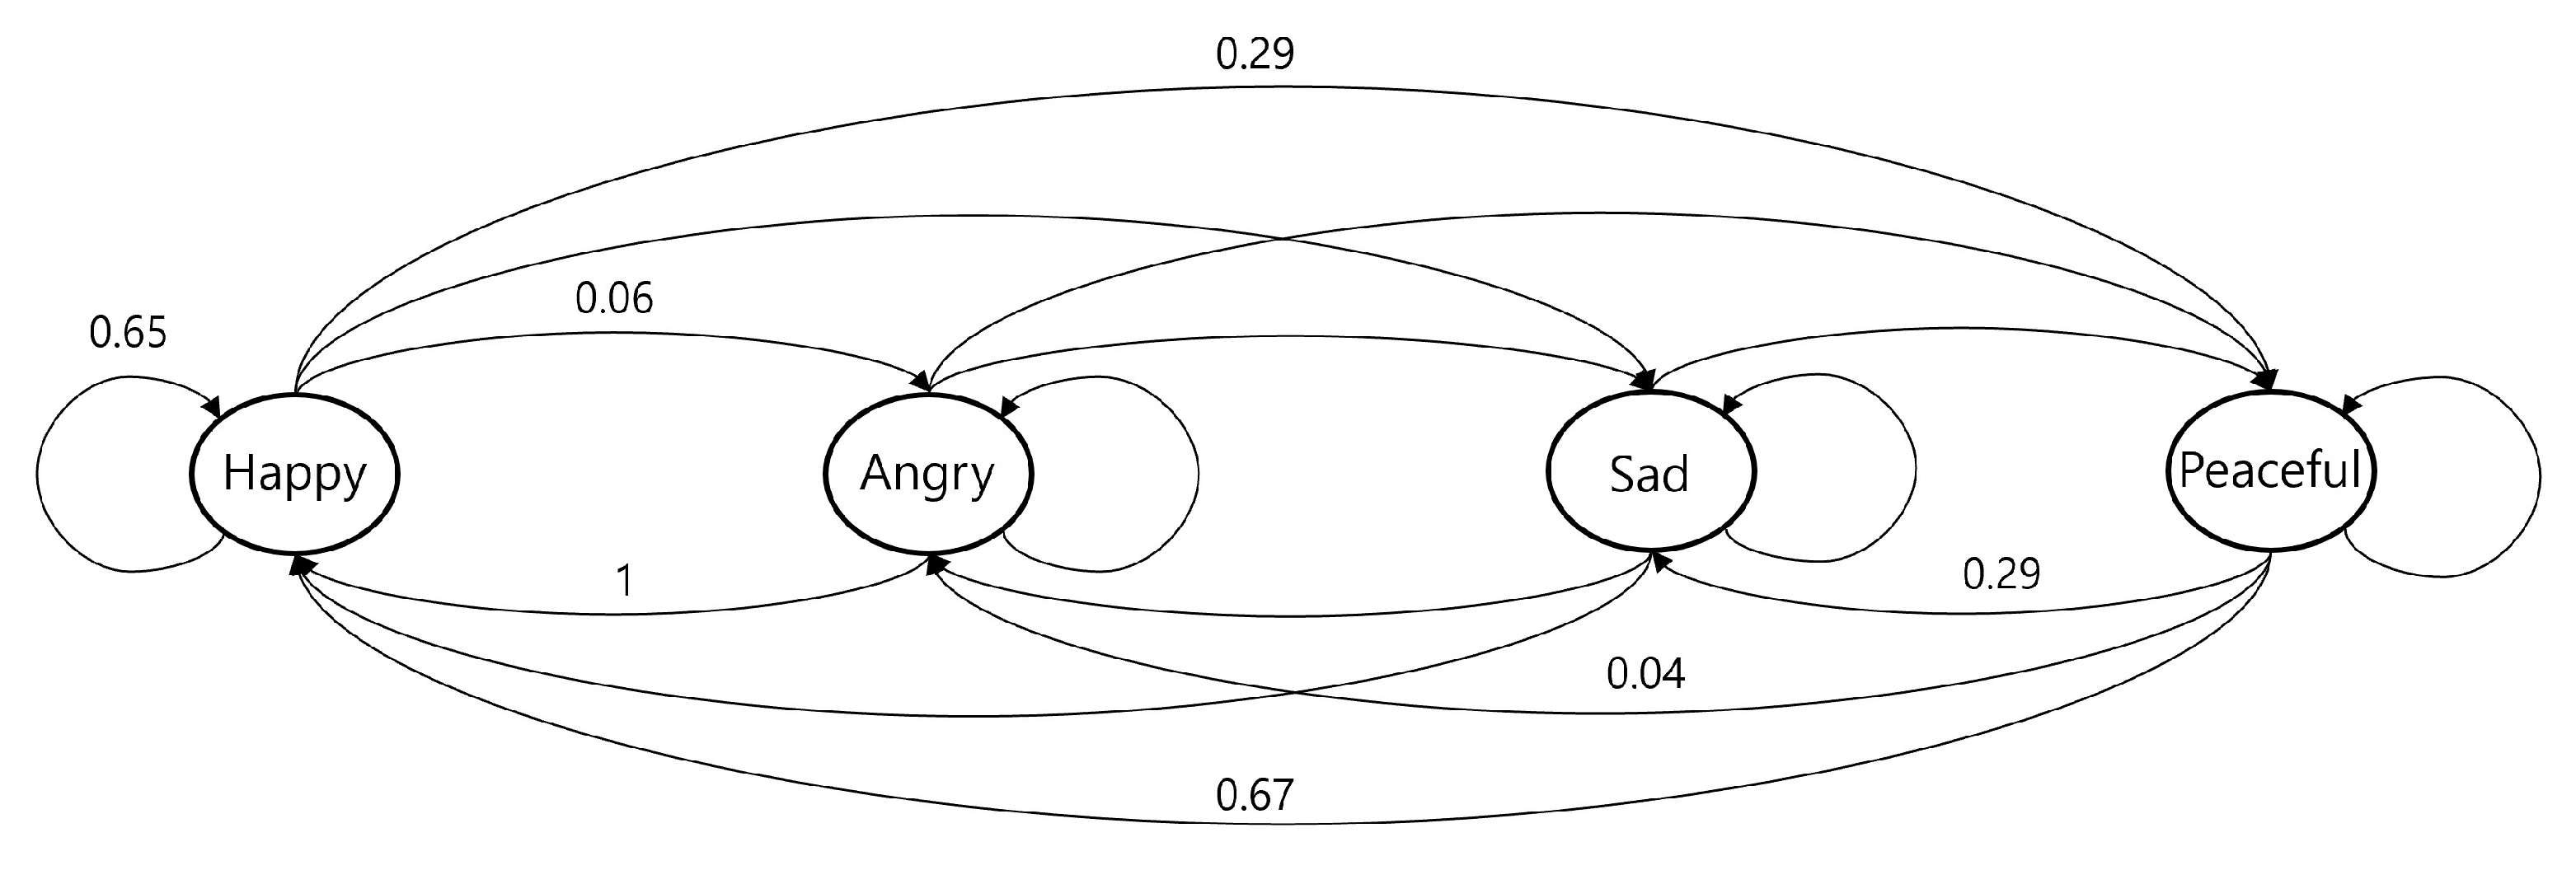
P = H a p p y A n g r y S a d P e a c e f u l H a p p y A n g r y S a d P e a c e f u l 0.65 0.05 0.00 0.29 1.00 0.00 0.00 0.00 0.00 0.00 0.00 0.00 0.67 0.04 0.00 0.29
Figure 9 shows the mental model through the emotional state transition matrix of the user.
To predict the emotional state at times t0 + 1 and t0 + 2, the emotional state transition matrix using the emotional vector at the current time and PMM is calculated as in Equation (26).
P ( E 1 ) = 1.0 ,   0.0 ,   0.0 ,   0.0 0.65 1.00 0.00 0.67   0.06   0.00   0.00   0.04   0.00   0.00   0.00   0.00   0.29   0.00   0.00   0.29 1 P ( E 2 ) = 1.0 ,   0.0 ,   0.0 ,   0.0 0.65 1.00 0.00 0.67   0.06   0.00   0.00   0.04   0.00   0.00   0.00   0.00   0.29   0.00   0.00   0.29 2
As a result of the calculation, the result of predicting the emotional state of the user at times t0 + 1 and t0 + 2 is as shown in Equation (27).
V u t 0 + 1 = 0.65 , 0.06 , 0.00 , 0.29 V u t 0 + 2 = ( 0.68 , 0.05 , 0.00 , 0.27 )
In addition, to predict the emotional state at times t0 + 1 and t0 + 2, the emotional state transition matrix using the emotional vector of the current time and MMM is calculated as in Equation (28).
P ( E 1 ) = 1.0 ,   0.0 ,   0.0 ,   0.0 0.34 0.17 0.15 0.35   0.16   0.35   0.29   0.13   0.14   0.34   0.41   0.13   0.36   0.14   0.15   0.39 1 P ( E 2 ) = 1.0 ,   0.0 ,   0.0 ,   0.0 0.34 0.17 0.15 0.35   0.16   0.35   0.29   0.13   0.14   0.34   0.41   0.13   0.36   0.14   0.15   0.39 2
As a result of the calculation, the result of predicting the emotional state of the user at times t0 + 1 and t0 + 2 is as shown in Equation (29).
V u t 0 + 1 = 0.34 , 0.16 , 0.15 , 0.36 V u t 0 + 2 = ( 0.29 , 0.00 , 0.21 , 0.31 )
In order to evaluate the results of predicting emotional states, we compared them with actual values. In addition, we sorted the emotional values to compare the numerical comparison of emotions and compared the order in which emotions occurred. Table 11 shows the results of comparing the emotional state values and the predicted order of emotions at times t0 + 1 and t0 + 2 for the user. As a result of the comparison, we confirmed that the error between the actual and predicted values was smaller, and the order of emotional occurrence was similar, when PMM was used than when MMM was used.
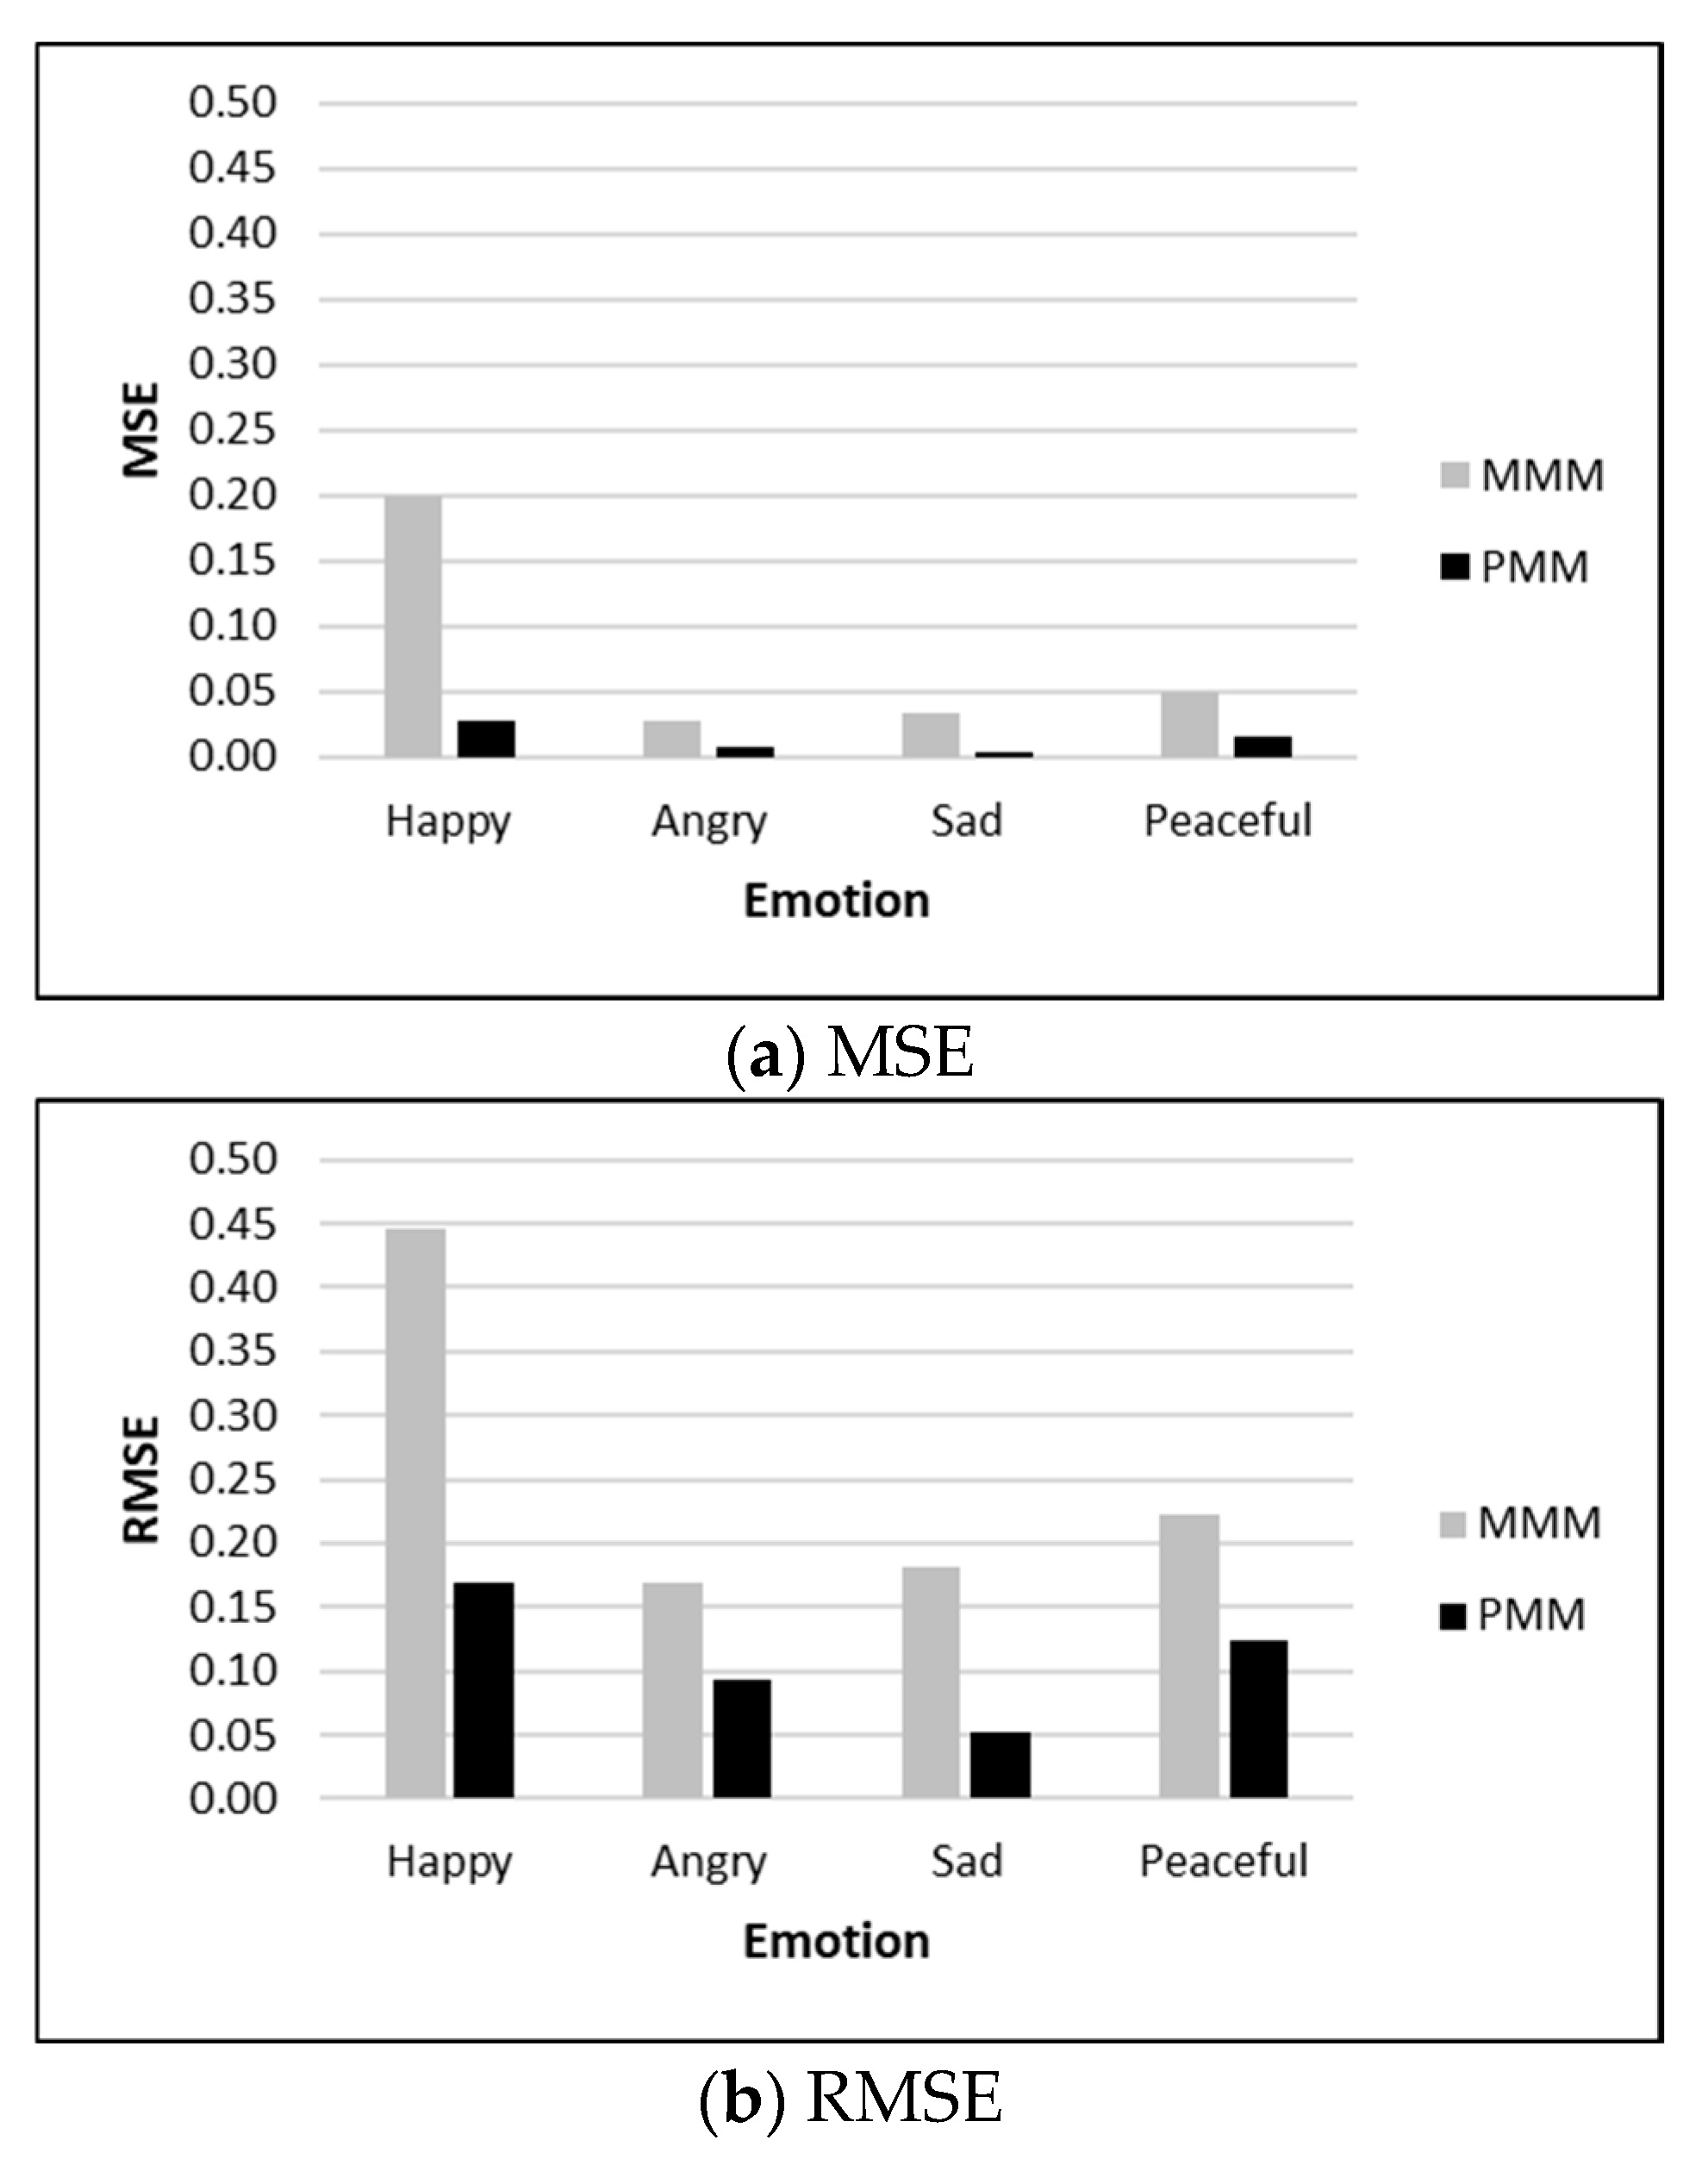
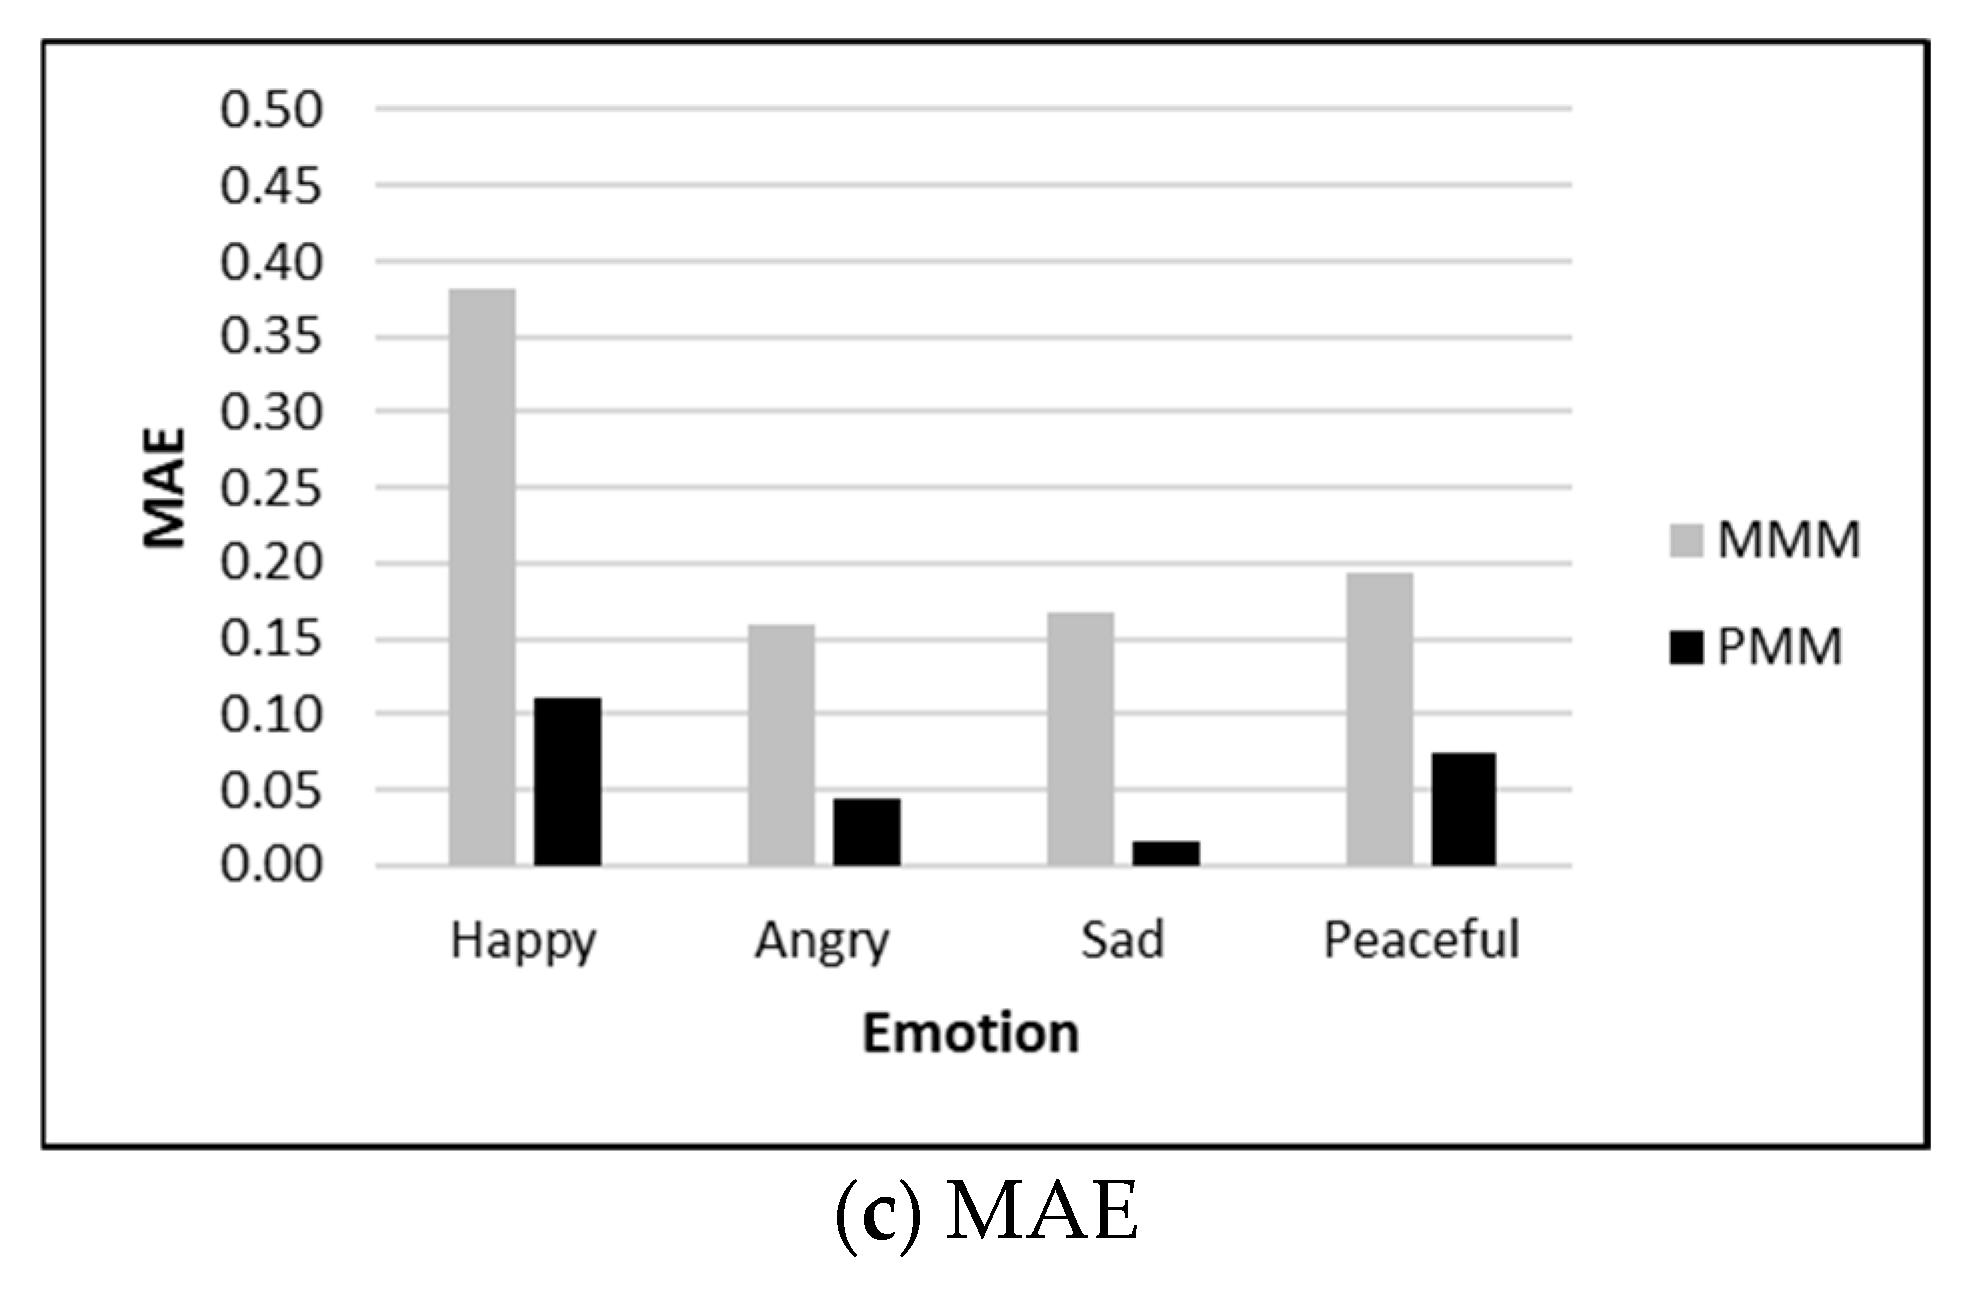
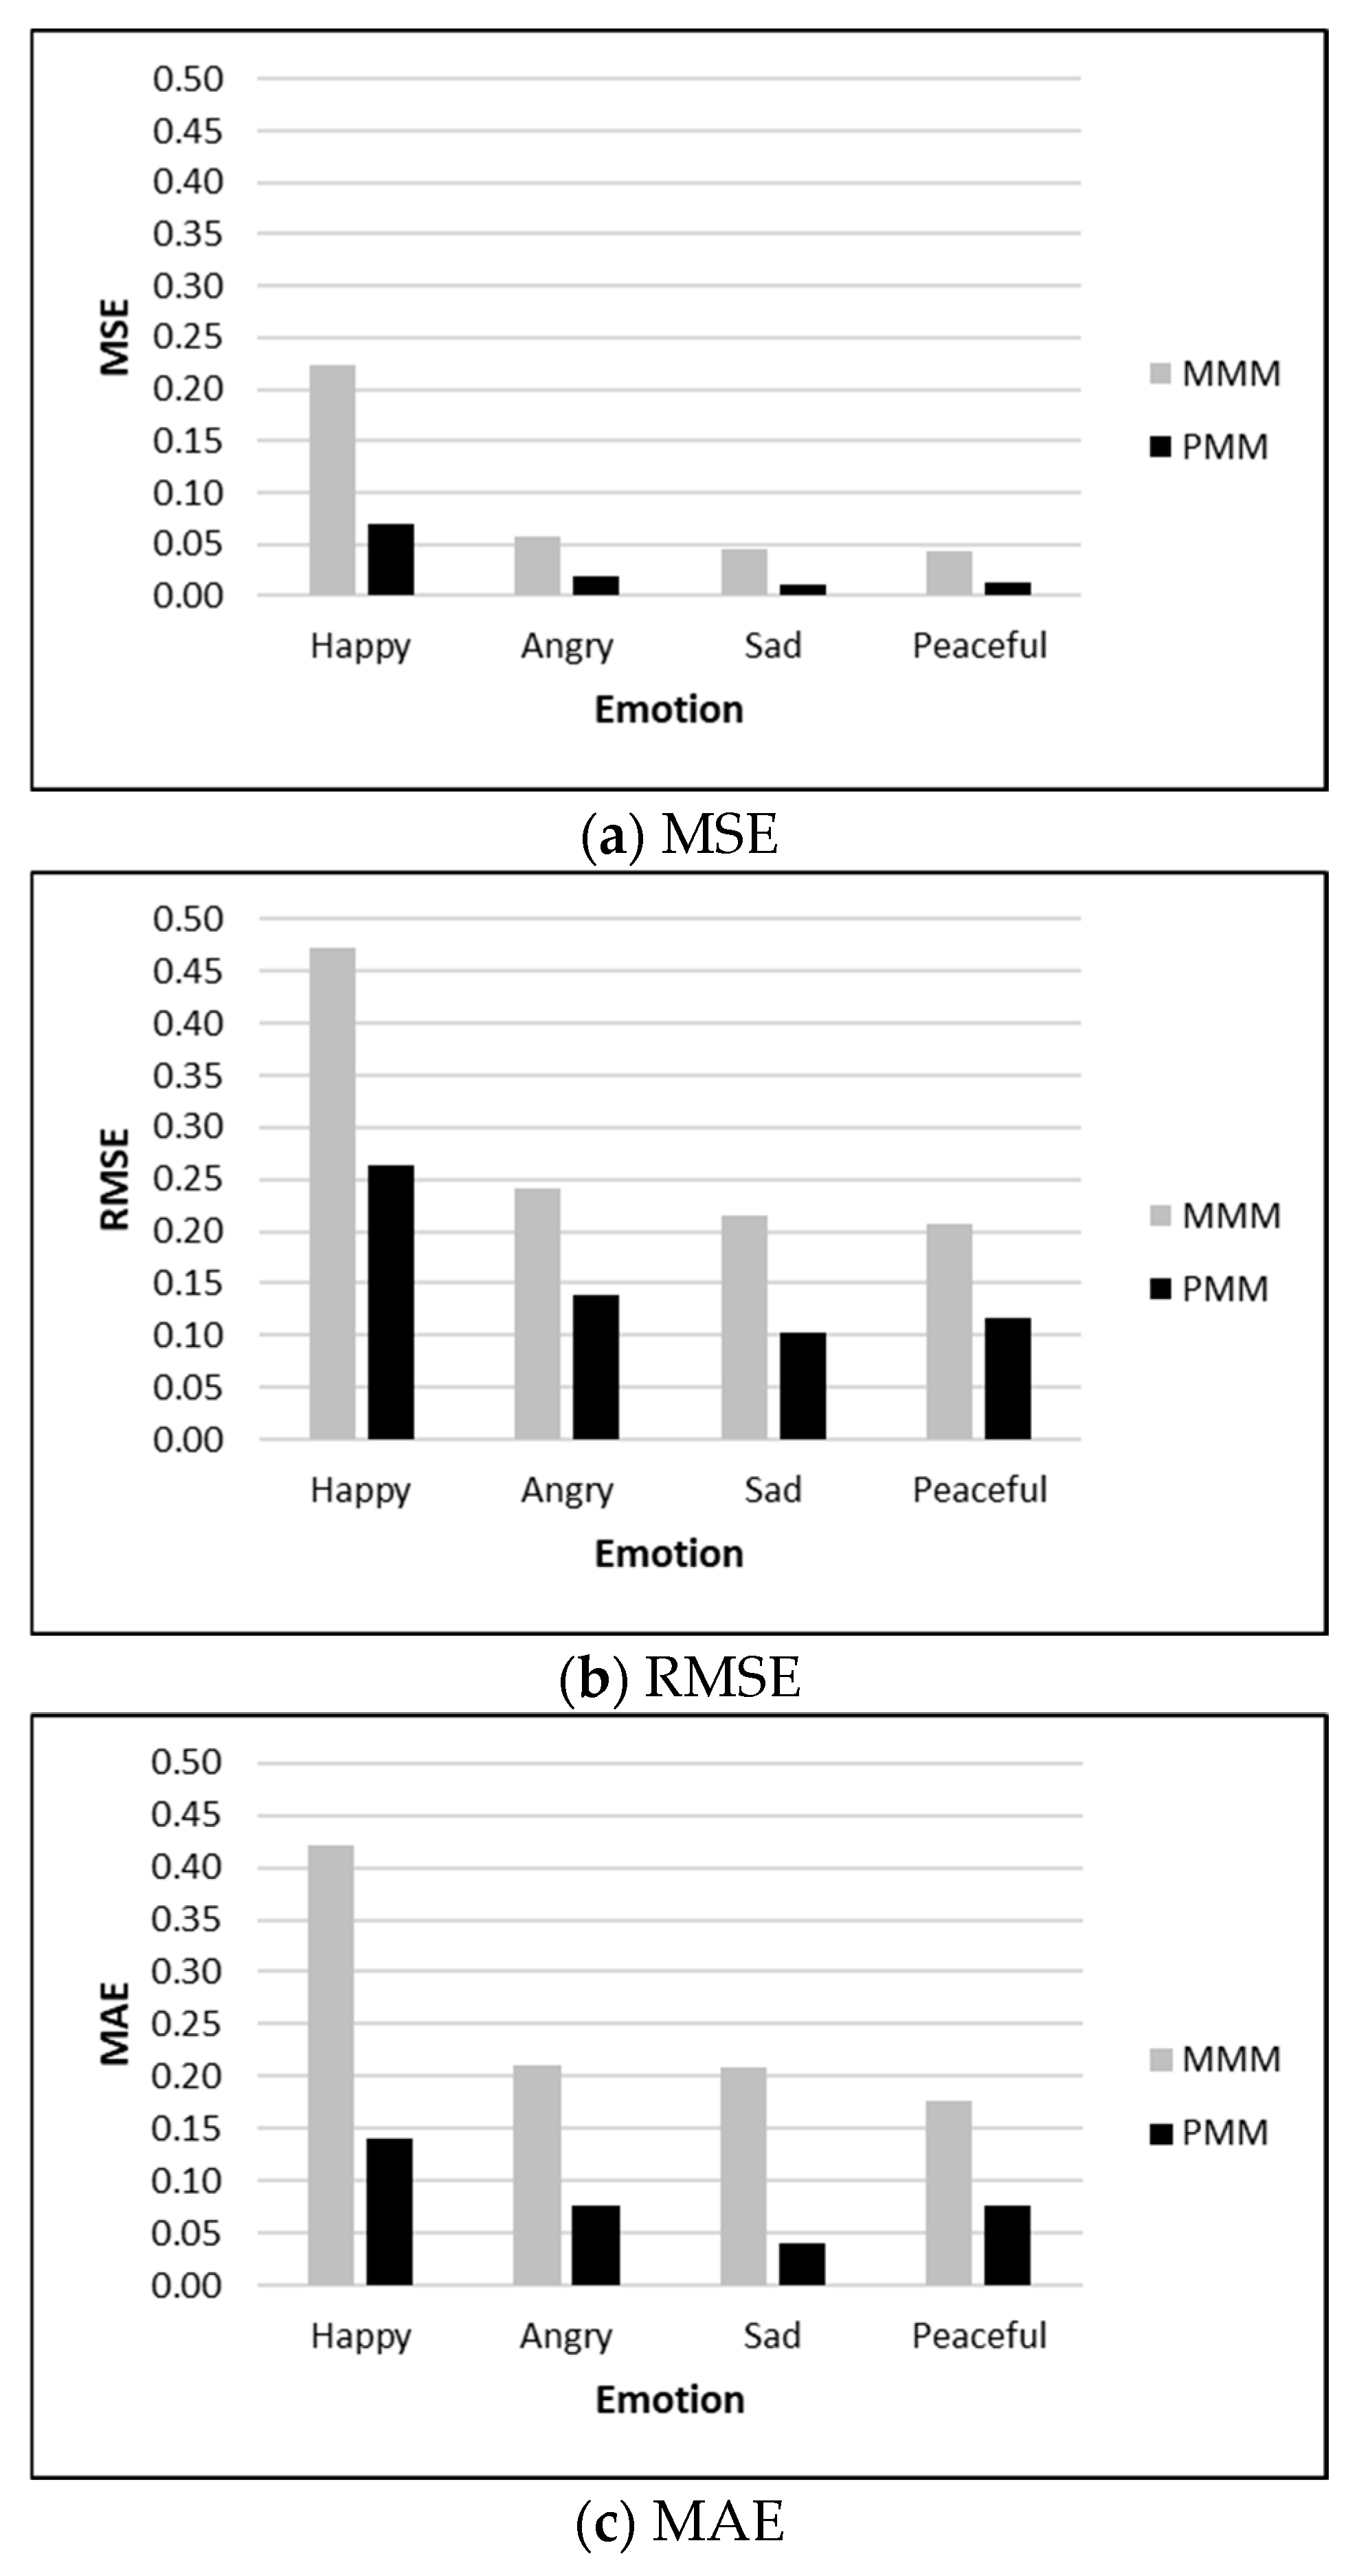
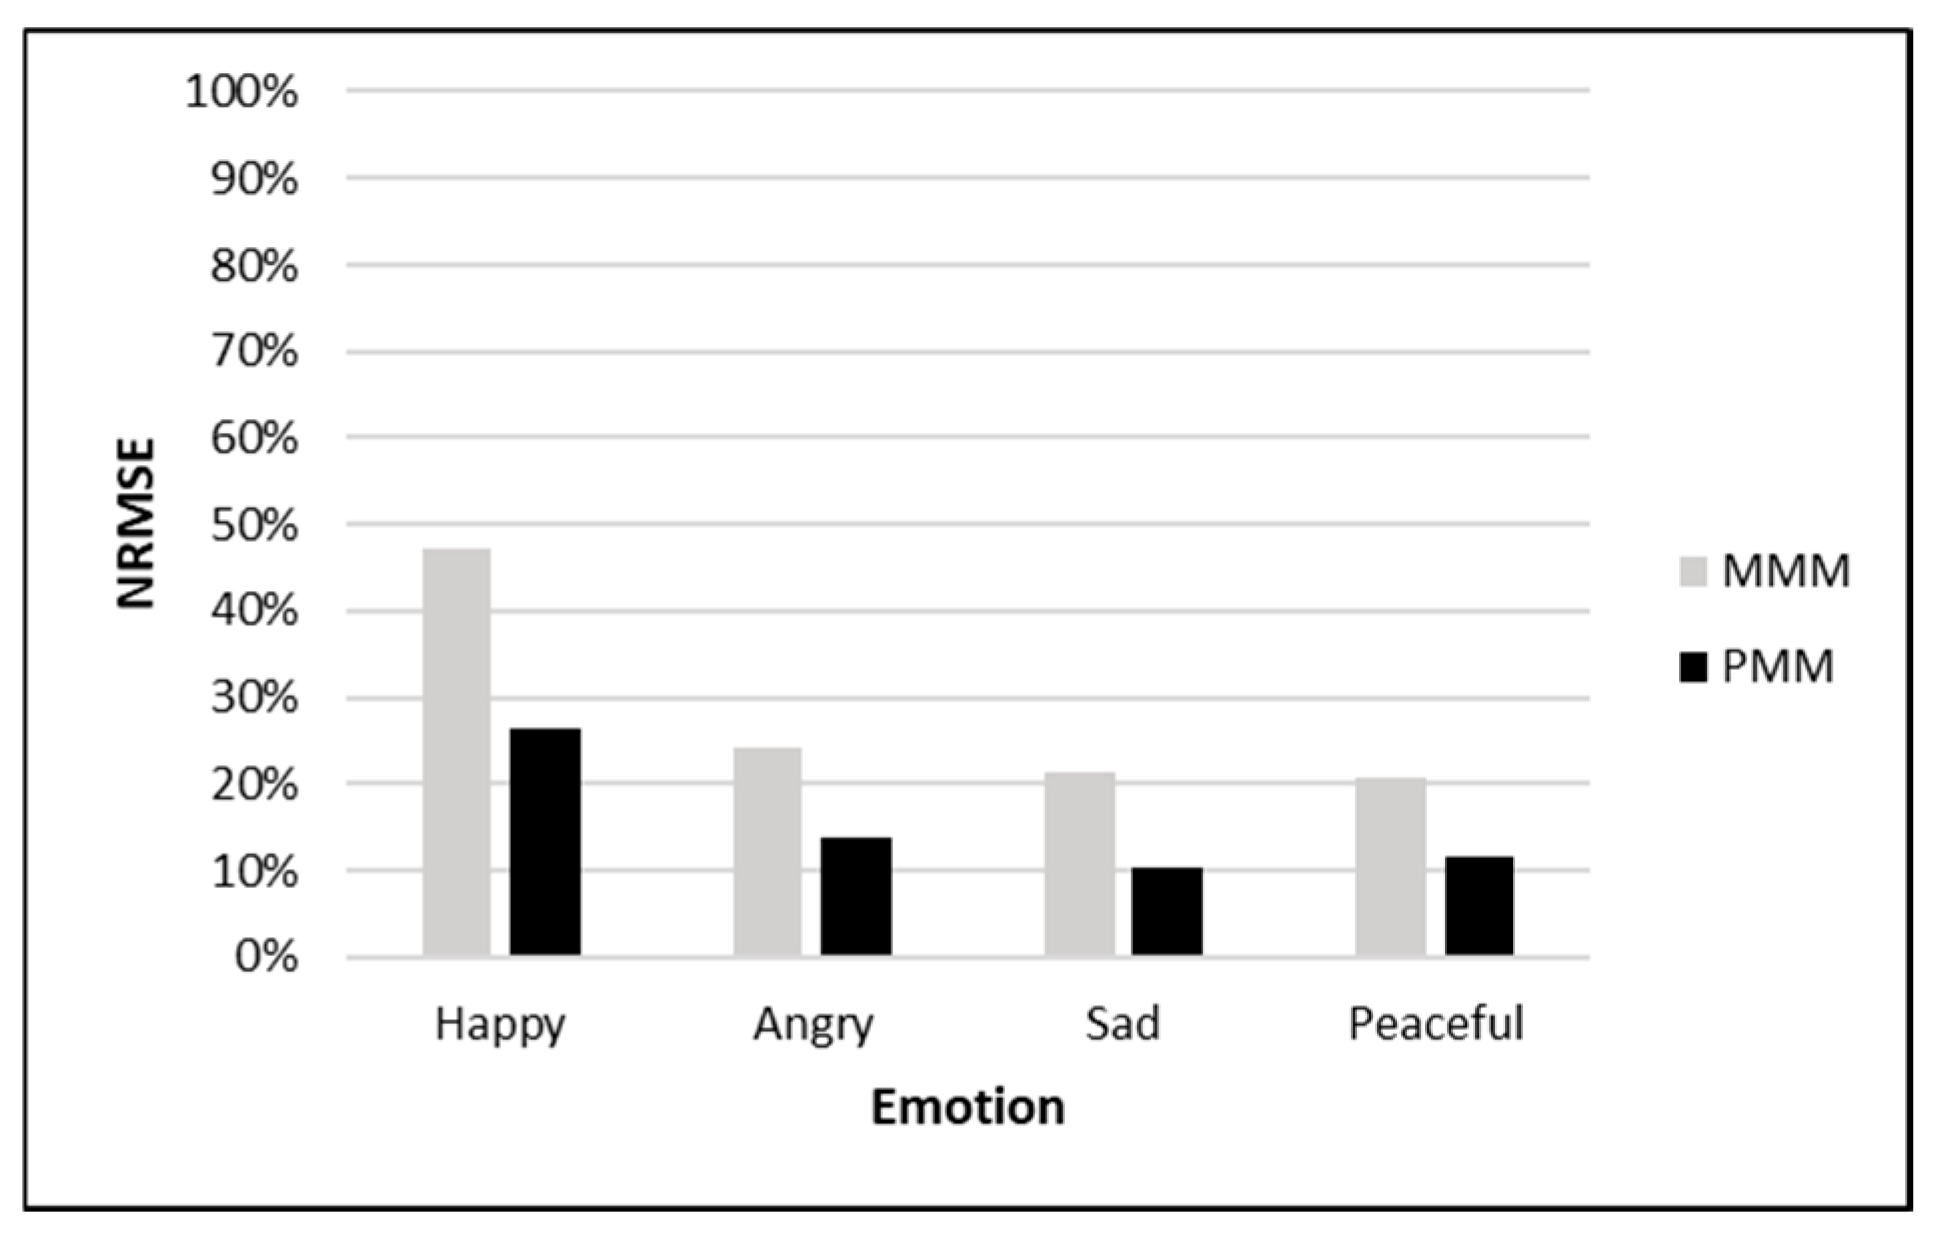
An experiment was conducted using the emotional history data from 50 users. Users were selected based on having at least six emotional experiences, each separated by at least one hour. A mental model was developed using historical data to predict emotions at times t0 + 1 and t0 + 2. For comparison with actual emotional data, predictions were made based on emotional history data. To evaluate the accuracy of the predicted results, MSE, RMSE, and MAE were calculated, as shown in Table 12 and Table 13. Figure 10 and Figure 11 display graphs comparing the average prediction errors for each emotion at times t0 + 1 and t0 + 2 using PMM and MMM.
Comparing the results with the actual emotional data confirmed that the prediction error using the PMM was smaller than that using the MMM. Additionally, the average MSE, RMSE, and MAE of the total error values were calculated.
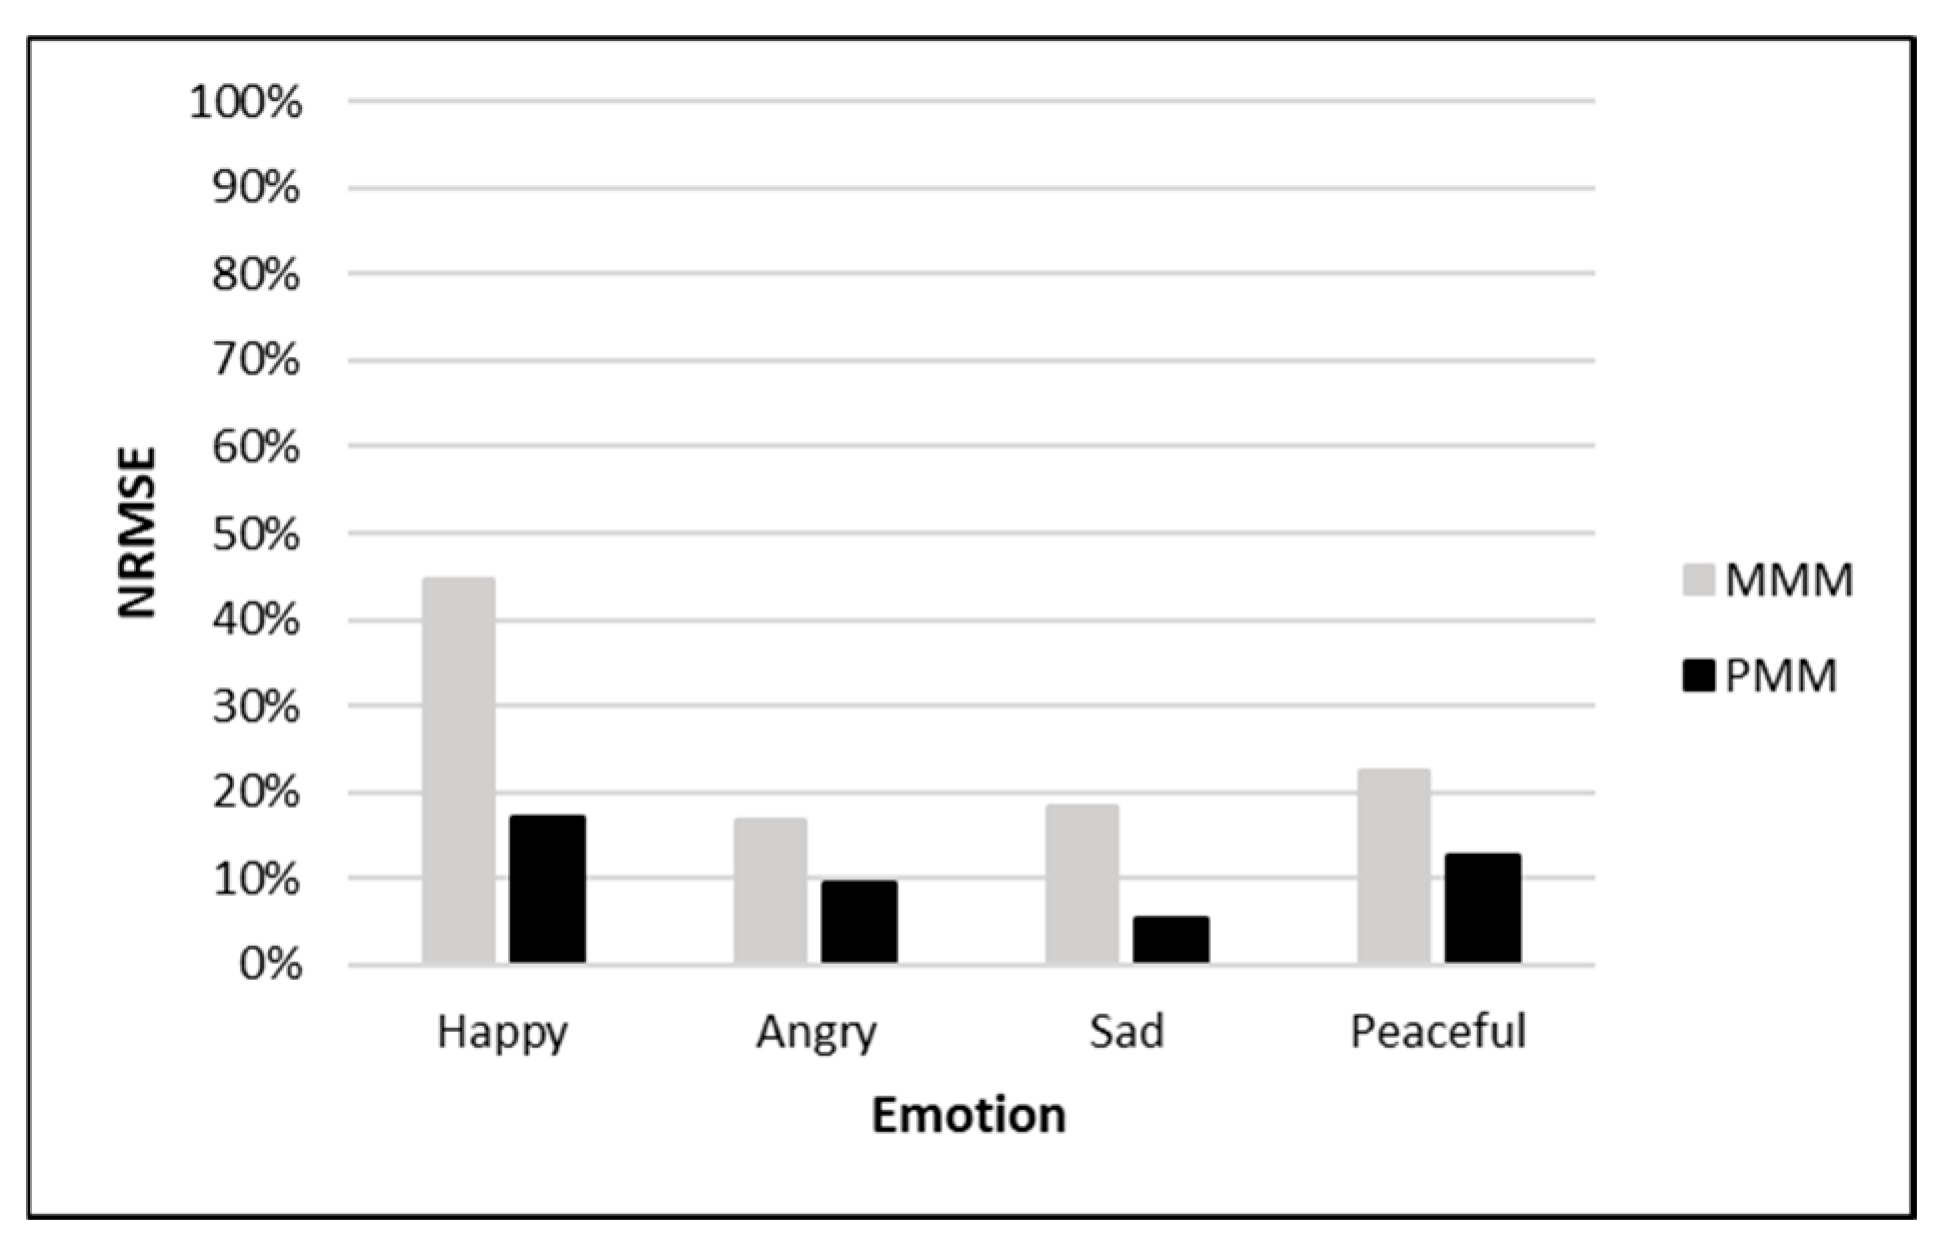
Overall, it was confirmed that the error using the PMM was smaller than that using the MMM, indicating higher accuracy in the predicted values. Additionally, to further evaluate the accuracy of the predicted results, NRMSE was calculated, as shown in Table 14. Figure 12 and Figure 13 compare the average error rates of predicted values for each emotion at times t0 + 1 and t0 + 2.
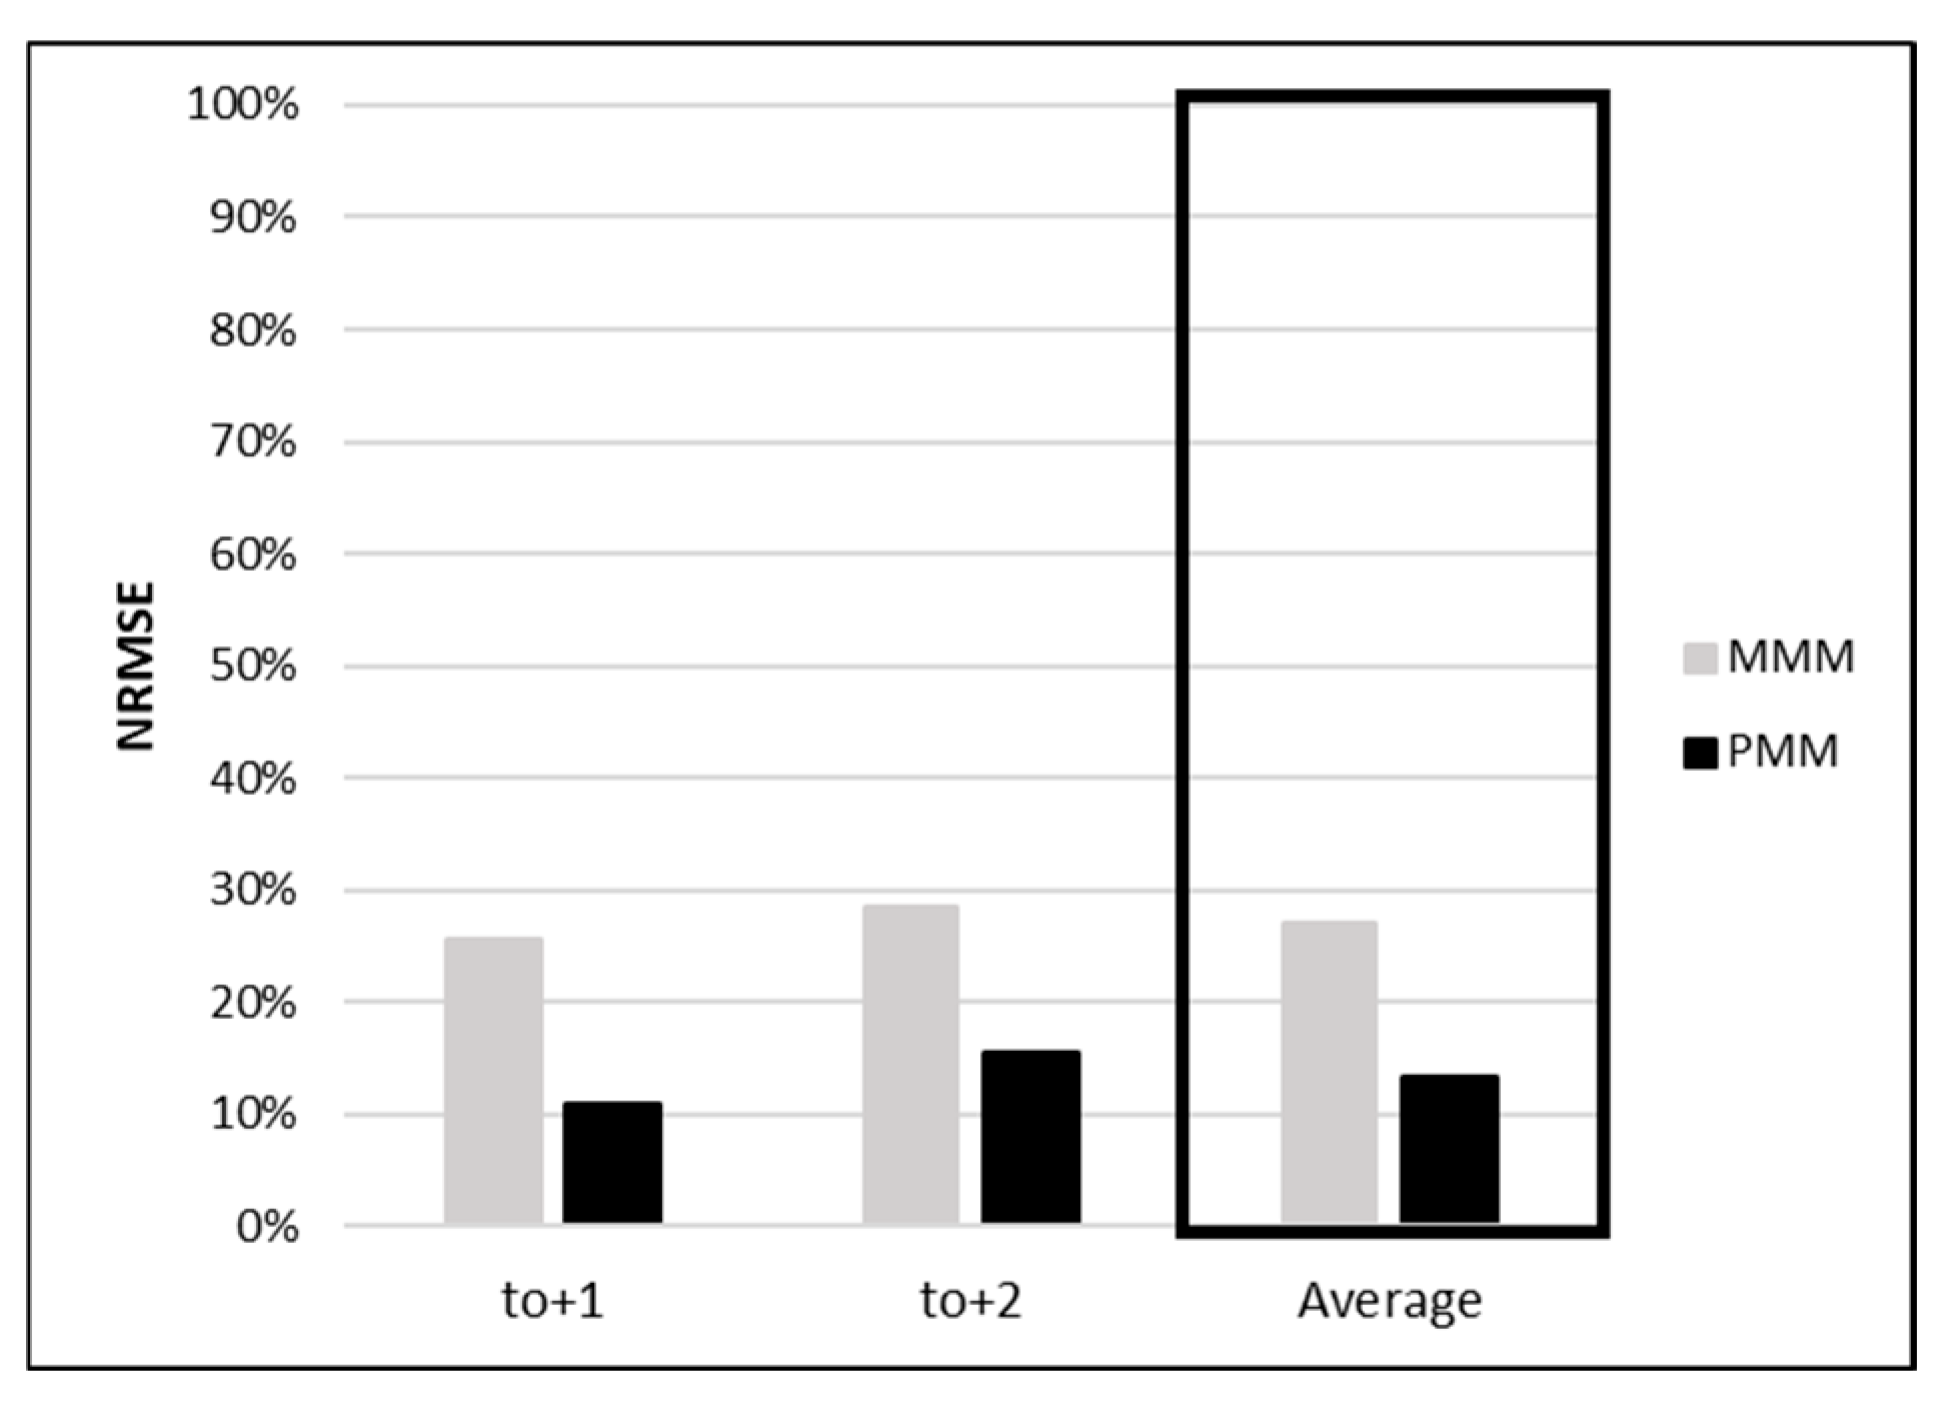
Figure 14 presents the comparison of overall average error rates. For predicting emotions at time t0 + 1, the error rates were 25.53% for MMM and 10.99% for PMM. For time t0 + 2, the error rates were 28.40% for MMM and 15.58% for PMM, indicating higher error rates for MMM compared with PMM. These results show a 13.68% improvement in error rate for PMM over MMM when compared with actual data, demonstrating increased accuracy.

6.3.3. Evaluation of Recommendation Results Based on User Emotions

To assess the recommendation results based on user emotions, a recommendation list was created following the procedures outlined in Section 6.3.2. The similarity between the music emotion vector and user emotion vector was calculated for each time of the day. Considering that the emotional history data were collected at 1 h intervals, a set of 10 songs was recommended by sorting them in descending order of similarity. For experimental evaluation, the similarities between the actual emotion vector, emotion vector using MMM, emotion vector using PMM, and music vector were computed.
Table 15 and Table 16 show the comparison of content recommendation results. These represent the recommendation results for the corresponding user at times t0 + 1 and t0 + 2. As a result of comparing each recommendation result, it can be confirmed that PMM includes more music in the recommendation results based on actual values than MMM.
Precision, recall, F1-score, and balanced accuracy were measured to evaluate the recommendation results based on user emotions. The recommendation list based on the actual emotion vector was compared with that based on the predicted emotion vector to calculate these metrics. Table 17 presents the precision, recall, and F1-score as evaluation results for the recommendation outcomes.
As observed from the comparison with actual emotional data, PMM demonstrates higher precision, recall, and F1-score values compared with MMM, indicating its effectiveness in recommending music suitable for users.
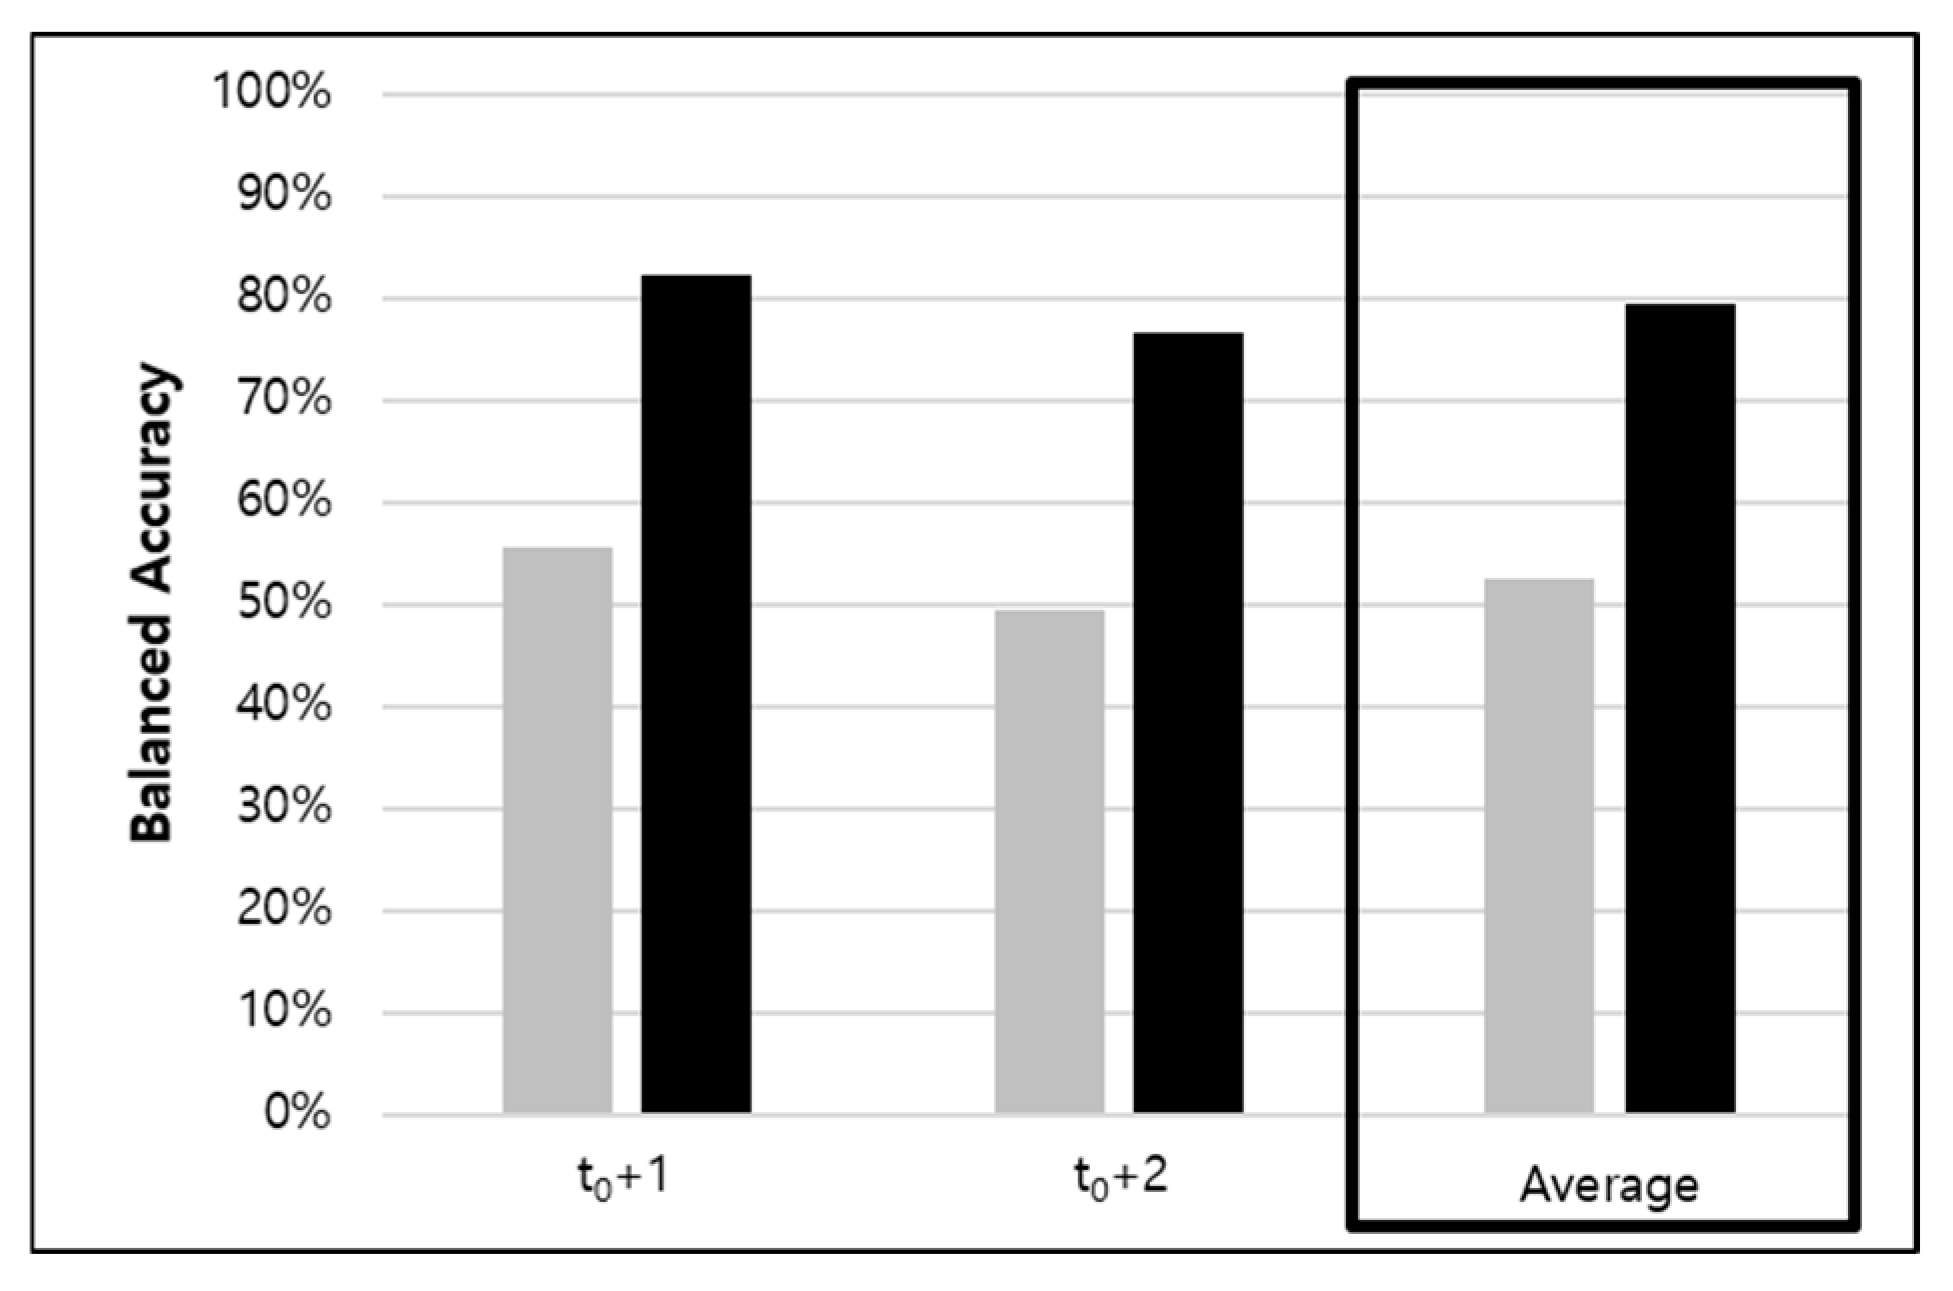
Table 18 and Figure 15 illustrate the overall average balanced accuracy of the recommendation results using MMM and PMM. The top ten recommendation lists were extracted and compared based on the actual emotion vector, emotion vector using MMM, and emotion vector using PMM. The comparison shows that PMM achieves a higher balance accuracy of 26.88% compared with MMM.
Additionally, to assess the accuracy of the recommendation list, the similarity between the recommended music vector and the actual value was calculated. Table 19 and Figure 16 depicts a comparison of the average similarity of the recommendation results obtained using PMM and MMM. The comparison confirms that PMM can recommend music better suited to the user’s actual emotions compared with MMM.

7. Conclusions and Future Research

With ongoing advancements in emotion-based recommendation research, services that recommend various types of content to users are being developed. In such emotion-based recommendation systems, predicting the user’s emotional state can enhance satisfaction with the recommended content. However, current research on content recommendation often focuses solely on the user’s current emotions without considering changes in individual emotion states.
In this study, we propose a method for continuous music recommendation that reflects emotional changes. First, we construct emotion vectors for music using valence and arousal values, which are elements of Thayer’s emotional model, which were categorized in four emotional areas. Using a multiple regression model, we explored the relationships between valence, arousal, and these four emotions to generate music emotion vectors. Second, we developed a user emotion vector based on emotional changes using the user’s historical emotional data. These vectors were updated over time, and an individual’s emotional state transition matrix was created using a Markov chain process. A PMM was defined, and the user’s emotion vector was generated by predicting the emotional state at time t0 + n. Third, we implemented a method to continuously recommend content reflecting emotional changes. To create a recommendation list, the similarity between the content emotion vector and the user emotion vector was calculated using cosine similarity. In addition, we used an interpolation method to estimate the emotional state between times t0 + n, generating a recommendation list according to the estimated emotional state.
To validate the effectiveness of the proposed method, we assessed the results of music emotion analysis, user emotion prediction considering emotional changes, and music recommendation based on user emotions. The music emotion analysis indicated an average error rate across all emotions of 12.74%, achieving an accuracy of 87.26%. To enhance the accuracy of our evaluations, it would be beneficial to utilize more precise and reliable evaluation metrics. In a comparative experiment, we evaluated user emotion prediction using an MMM and our PMM, which adapts the mental model from existing research. Predicting emotions at times t0 + 1 and t0 + 2 using the MMM and PMM revealed that the PMM improved the error rate by 13.68% over the MMM, increasing accuracy. Additionally, in the evaluation of music recommendation experiments, PMM demonstrated a higher balanced accuracy of 26.88% compared with MMM. The similarity between the recommended music vector and the actual emotion vector was higher with PMM. These findings confirm our ability to predict user emotions accurately and recommend music that aligns closely with user preferences.
It is anticipated that satisfaction with the music provided can be enhanced by continuously recommending music according to the user’s emotions and situations. Beyond music, this approach is expected to extend its utility to aiding in product recommendations and psychological treatments by reflecting users’ emotional changes.
The limitations and future research of this study are as follows. First, this study lacks longitudinal validation over extended periods, making it limited in assessing the model’s performance in real-world scenarios where user emotions evolve more dynamically. To enhance the accuracy of emotion prediction in the future, it is crucial to research continuous recommendation methods that detect changes in users’ emotions based on recommendation outcomes and incorporate feedback derived from these recommendations. Second, this study relies on self-reported emotional data, which may introduce subjectivity and bias. More objective physiological data could enhance the robustness of emotion predictions. In the future, we need to study ways to express complex emotions using physiological data available in experiments. Third, the integration of multiple regression models and Markov chains increases computational complexity, potentially limiting real-time applications and scalability. There is a need to improve the proposed method by considering computational complexity in the future. Finally, the emotion classification and prediction model may not adequately account for cultural or individual differences in emotional expression and perception, which could affect generalizability. Furthermore, research is needed to address the limitations of experimental data and extend recommendations beyond music to include other content types, such as movies and books.

Author Contributions

Conceptualization, S.I.B. and Y.K.L.; methodology, S.I.B. and Y.K.L.; software, S.I.B.; validation, S.I.B. and Y.K.L.; formal analysis, S.I.B.; investigation, S.I.B. and Y.K.L.; resources, S.I.B.; data curation, S.I.B.; writing—original draft preparation, S.I.B.; writing—review and editing, S.I.B. and Y.K.L.; visualization, S.I.B.; supervision, Y.K.L.; project administration, Y.K.L.; funding acquisition, S.I.B. All authors have read and agreed to the published version of the manuscript.

Funding

This work was supported by Institute of Information & Communications Technology Planning & Evaluation (IITP) under the Artificial Intelligence Convergence Innovation Human Resources Development (IITP-2025-RS-2023-00254592) grant funded by the Korean Government (MSIT).

Institutional Review Board Statement

Not applicable.

Informed Consent Statement

Not applicable.

Data Availability Statement

The original contributions presented in the paper are included in the article, whilst further inquiries can be directed to the co-author.

Conflicts of Interest

The authors declare no conflicts of interest.

References

  1. Kim, T.Y.; Song, B.H.; Bae, S.H. A design and implementation of Music & image retrieval recommendation system based on emotion. J. Inst. Electron. Inf. Eng. 2010, 47, 73–79. [Google Scholar]
  2. Wang, Y.; Song, W.; Tao, W.; Liotta, A.; Yang, D.; Li, X.; Gao, S.; Sun, Y.; Ge, W.; Zhang, W.; et al. A systematic review on affective computing: Emotion models, databases, and recent advances. Inf. Fusion 2022, 83–84, 19–52. [Google Scholar] [CrossRef]
  3. Liu, Z.; Xu, W.; Zhang, W.; Jiang, Q. An emotion-based personalized music recommendation framework for emotion improvement. Inf. Process. Manag. 2023, 60, 103256. [Google Scholar] [CrossRef]
  4. Baek, S.I. A Method for Continuously Recommending Contents Reflecting Emotional Changes. Ph.D. Thesis, Department of Computer Science Engineering, Dongguk University, Seoul, Republic of Korea, 2024. [Google Scholar]
  5. Shirwadkar, A.; Shinde, P.; Desai, S.; Jacob, S. Emotion based music recommendation system. Int. J. Res. Appl. Sci. Eng. Technol. 2022, 10, 690–694. [Google Scholar] [CrossRef]
  6. Wakil, K.; Bakhtyar, R.; Ali, K.; Alaadin, K. Improving web movie recommender system based on emotions. Int. J. Adv. Comput. Sci. Appl. 2015, 6, 218–226. [Google Scholar] [CrossRef]
  7. Piumi Ishanka, U.A.; Yukawa, T. The Prefiltering techniques in emotion based place recommendation derived by user reviews. Appl. Comput. Intell. Soft Comput. 2017, 2017, 5680398. [Google Scholar] [CrossRef]
  8. Messina, P.; Dominguez, V.; Parra, D.; Trattner, C.; Soto, A. Content-based artwork recommendation: Integrating painting metadata with neural and manually engineered visual features. User Model. User-Adapt. Interact. 2019, 29, 251–290. [Google Scholar] [CrossRef]
  9. Kim, H.-Y.; Lim, S.B. Emotion-based hangul font recommendation system using crowdsourcing. Cogn. Syst. Res. 2018, 47, 214–225. [Google Scholar] [CrossRef]
  10. Kim, J.H.; Kim, Y.-R.; Byun, H.W. SNS context-based emoji recommendation using hierarchical KoBERT. J. Digit. Contents Soc. 2023, 24, 1361–1371. [Google Scholar] [CrossRef]
  11. Heller, A.S.; Casey, B.J. The neurodynamics of emotion: Delineating typical and atypical emotional processes during adolescence. Dev. Sci. 2016, 19, 3–18. [Google Scholar] [CrossRef]
  12. Cunningham, W.A.; Dunfield, K.A.; Stillman, P.E. Emotional states from affective dynamics. Emot. Rev. 2013, 5, 344–355. [Google Scholar] [CrossRef]
  13. Trampe, D.; Quoidbach, J.; Taquet, M. Emotions in everyday life. PLoS ONE 2015, 10, e0145450. [Google Scholar] [CrossRef] [PubMed]
  14. Larsen, J.T.; McGraw, A.P.; Cacioppo, J.T. Can people feel happy and sad at the same time? J. Personal. Soc. Psychol. 2001, 81, 684–696. [Google Scholar] [CrossRef]
  15. Jeong, Y.E.; Kim, J.H.; Son, J. Differences in consumers’ emotional response to the same Music: Focusing on the possibility of emotions that advertising music can induce. Product. Res. 2021, 39, 141–149. [Google Scholar]
  16. Sammler, D.; Grigutsch, M.; Fritz, T.; Koelsch, S. Music and emotion: Electrophysiological correlates of the processing of pleasant and unpleasant Music. Psychophysiology 2007, 44, 293–304. [Google Scholar] [CrossRef]
  17. Balasubramanian, G.; Kanagasabai, A.; Mohan, J.; Seshadri, N.P. Music induced emotion using wavelet packet decomposition—An EEG study. Biomed. Signal Process. Control 2018, 42, 115–128. [Google Scholar] [CrossRef]
  18. North, A.C.; Hargreaves, D.J. Lifestyle correlates of musical preference: 1. Relationships, living arrangements, beliefs, and crime. Psychol. Music 2007, 35, 58–87. [Google Scholar] [CrossRef]
  19. North, A.C.; Hargreaves, D.J. Lifestyle correlates of musical preference: 2. Media, leisure time and music. Psychol. Music 2007, 35, 179–200. [Google Scholar] [CrossRef]
  20. North, A.C.; Hargreaves, D.J. Lifestyle correlates of musical preference: 3. Travel, money, education, employment and health. Psychol. Music 2007, 35, 473–497. [Google Scholar] [CrossRef]
  21. Sievers, B.; Polansky, L.; Casey, M.; Wheatley, T. Music and movement share a dynamic structure that supports universal expressions of emotion. Proc. Natl. Acad. Sci. USA 2013, 110, 70–75. [Google Scholar] [CrossRef]
  22. Cowen, A.S.; Fang, X.; Sauter, D.; Keltner, D. What music makes us feel: At least 13 dimensions organize subjective experiences associated with music across different cultures. Proc. Natl. Acad. Sci. USA 2020, 117, 1924–1934. [Google Scholar] [CrossRef] [PubMed]
  23. Kim, H.-R. Development of the Artwork using Music Visualization based on Sentiment Analysis of Lyrics. J. Korea Contents Assoc. 2020, 20, 89–99. [Google Scholar]
  24. Sohn, J.H. Review on discrete, appraisal, and dimensional models of emotion. J. Ergon. Soc. Korea 2011, 30, 179–186. [Google Scholar] [CrossRef]
  25. Hwang, M.-C.; Kim, J.-H.; Moon, S.-C.; Sang-in, P. Emotion modeling and recognition technology. J. Robot. 2011, 8, 34–44. [Google Scholar]
  26. Thornton, M.A.; Tamir, D.I. Mental models accurately predict emotion transitions. Proc. Natl. Acad. Sci. USA 2017, 114, 5982–5987. [Google Scholar] [CrossRef]
  27. Tamir, D.I.; Thornton, M.A.; Contreras, J.M.; Mitchell, J.P. Neural evidence that three dimensions organize mental state representation: Rationality, social impact, and valence. Proc. Natl. Acad. Sci. USA 2016, 113, 194–199. [Google Scholar] [CrossRef]
  28. Russell, J.A. A Circumplex model of affect. J. Personal. Soc. Psychol. 1980, 39, 1161–1178. [Google Scholar] [CrossRef]
  29. Thayer, R.E. The Biopsychology of Mood and Arousal; Oxford University Press: Oxford, UK, 1989. [Google Scholar]
  30. Kim, D.; Lim, B.; Lim, Y. Music Emotion Control Algorithm based on Sound Emotion Tree. J. Korea Contents Assoc. 2015, 15, 21–31. [Google Scholar] [CrossRef]
  31. Lee, H.; Shin, D.; Shin, D. A research on the emotion classification and precision improvement of EEG(electroencephalogram) data using machine learning algorithm. J. Internet Comput. Serv. 2019, 20, 27–36. [Google Scholar]
  32. Moon, C.B.; Kim, H.S.; Lee, H.A.; Kim, B.M. Analysis of relationships between Mood and color for different musical preferences. Color Res. Appl. 2014, 39, 413–423. [Google Scholar] [CrossRef]
  33. Laurier, C.; Grivolla, J.; Herrera, P. Multimodal music mood classification using audio and lyrics. In Proceedings of the IEEE Seventh International Conference on Machine Learning and Applications, San Diego, CA, USA, 11–13 December 2008; pp. 688–693. [Google Scholar] [CrossRef]
  34. Hu, X.; Downie, J.S.; Ehmann, A.F. Lyric text mining in music mood classification. Int. Soc. Music Inf. Retr. Conf. 2009, 183, 411–416. [Google Scholar]
  35. Lee, J.; Lim, H.; Kim, H.-J. Similarity evaluation of popular music based on emotion and structure of lyrics. KIISE Trans. Comput. Pract. 2016, 22, 479–487. [Google Scholar] [CrossRef]
  36. Moon, C.B.; Kim, H.S.; Kim, B.M. Music Retrieval Method using Mood Tag and Music AV Tag based on Folksonomy. J. Korean Inst. Inf. Sci. Eng. 2013, 40, 526–543. [Google Scholar]
  37. Lee, H.; Lee, T. A study on the classification of emotions and the generation of custom paintings based on EEG. J. Digit. Contents Soc. 2021, 22, 1577–1586. [Google Scholar] [CrossRef]
  38. Kim, Y.; Song, M. A study on analyzing sentiments on movie reviews by multi-level sentiment classifier. J. Intell. Inf. Syst. 2016, 22, 71–89. [Google Scholar] [CrossRef]
  39. Atkinson, A.P.; Dittrich, W.H.; Gemmell, A.J.; Young, A.W. Emotion perception from dynamic and static body expressions in point-light and full-light displays. Perception 2004, 33, 717–746. [Google Scholar] [CrossRef]
  40. Barrett, L.F.; Mesquita, B.; Gendron, M. Context in emotion perception. Curr. Dir. Psychol. Sci. 2011, 20, 286–290. [Google Scholar] [CrossRef]
  41. Zaki, J.; Bolger, N.; Ochsner, K. Unpacking the informational bases of empathic accuracy. Emotion 2009, 9, 478–487. [Google Scholar] [CrossRef]
  42. Frijda, N.H. ‘Emotions and Action,’ Feelings and Emotions: The Amsterdam Symposium; Cambridge University Press: Cambridge, UK, 2004; pp. 158–173. [Google Scholar]
  43. Tomkins, S.S. Affect Imagery Consciousness, I. The Positive Affects; Springer Publishing Company: New York, NY, USA, 1962. [Google Scholar]
  44. Sharma, V.P.; Gaded, A.S.; Chaudhary, D.; Kumar, S.; Sharma, S. Emotion-based music recommendation system. In Proceedings of the IEEE 9th International Conference on Reliability, Infocom Technologies and Optimization, Noida, India, 3–4 September 2021. [Google Scholar] [CrossRef]
  45. Joseph, M.M.; Treessa Varghese, D.T.; Sadath, L.; Mishra, V.P. Emotion based music recommendation system. In Proceedings of the 2023 International Conference on Computational Intelligence and Knowledge Economy, Dubai, United Arab Emirates, 9–10 March 2023; pp. 505–510. [Google Scholar] [CrossRef]
  46. Mahadik, A.; Milgir, S.; Patel, J.; Jagan, V.B.; Kavathekar, V. Mood based music recommendation system. Int. J. Eng. Res. Technol. 2021, 10, 553–559. [Google Scholar]
  47. Abdul, A.; Chen, J.; Liao, H.Y.; Chang, S.H. An emotion-aware personalized music recommendation system using a convolutional neural networks approach. Appl. Sci. 2018, 8, 1103. [Google Scholar] [CrossRef]
  48. Lee, S.J.; Seo, B.-G.; Park, D.-H. Development of Music Recommendation System Based on Customer Sentiment Analysis. J. Intell. Inf. Syst. 2018, 24, 197–217. [Google Scholar] [CrossRef]
  49. Jazi, S.Y.; Kaedi, M.; Fatemi, A. An emotion-aware music recommender system: Bridging the User’s interaction and music recommendation. Multimed. Tools Appl. 2021, 80, 13559–13574. [Google Scholar] [CrossRef]
  50. David, S. 3 Ways to Better Understand Your Emotions, emotional intelligence. Harv. Bus. Rev. 2016. Available online: https://hbr.org/2016/11/3-ways-to-better-understand-your-emotions (accessed on 30 May 2025).
Figure 1. Russell’s emotion model [28].
Applsci 15 07222 g001
Figure 2. Thayer’s emotion model [29].
Applsci 15 07222 g002
Figure 3. Process of generating music emotion vectors.
Applsci 15 07222 g003
Figure 4. Classification of emotions into four types based on Thayer’s emotion model.
Applsci 15 07222 g004
Figure 5. Flowchart for generating user emotion vectors based on changes in user emotion.
Applsci 15 07222 g005
Figure 6. Examples of user emotional transition probability input.
Applsci 15 07222 g006
Figure 7. User’s personalized mental model.
Applsci 15 07222 g007
Figure 8. Flow of continuous music recommendations.
Applsci 15 07222 g008
Figure 9. Example of a user’s mental model.
Applsci 15 07222 g009
Figure 10. Comparison of average prediction errors for each emotion at time t0 + 1.
Applsci 15 07222 g010aApplsci 15 07222 g010b
Figure 11. Comparison of average prediction errors for each emotion at time t0 + 2.
Applsci 15 07222 g011
Figure 12. Comparison of average error rates of predicted values for each emotion at time t0 + 1.
Applsci 15 07222 g012
Figure 13. Comparison of average error rates of predicted values for each emotion at time t0 + 2.
Applsci 15 07222 g013
Figure 14. Comparison of overall average error rates of emotion prediction.
Applsci 15 07222 g014
Figure 15. Comparison of overall average balanced accuracy for recommendation results.
Applsci 15 07222 g015
Figure 16. Comparison of average similarity of recommendation results.
Applsci 15 07222 g016
Table 1. Results of emotion mapping.
EmotionCollected Emotions
HappyAmusing, beautiful, energizing/pump-up, joyful/cheerful, triumphant/heroic
AngryAnnoying, anxious/tense, indignant/defiant, scary/fearful
SadSad/depressing
PeacefulCalm/relaxing/serene, dreamy, erotic/desirous
Table 2. Example of user emotional history data over time.
TimeHappyAngrySadPeaceful
t00100
t0 − 100.50.50
t0 − 200.50.50
t0 − 30.250.250.250.25
t0n0010
Table 3. Results of emotion mapping.
QuadrantEmotionThayer’s Emotions
1HappyPleased, happy, excited
2AngryAnnoyed, angry, nervous
3SadSad, bored, sleepy
4PeacefulCalm, peaceful, relaxed
Table 4. Part of the preprocessed data for emotion analysis of music.
No.EmotionValanceArousalHappyAngrySadPeaceful
1Angry−0.58330.58330.33960.66040.00000.0000
2Happy0.08330.08330.45040.12060.00000.4290
3Happy0.50000.41670.50380.11450.00000.3817
4Peaceful0.0833−0.08330.06780.02820.45200.4520
5Peaceful0.2500−0.41670.12120.03030.24240.6061
570Peaceful0.7500−0.25000.11090.10390.27710.5081
Table 5. Results of emotion mapping.
EmotionCollected Emotions
HappyPride, love, gratitude, joy, awe, amusement, alertness
AngryAnxiety, disdain, offense, guilt, disgust, fear, embarrassment, anger
SadSadness
PeacefulHope, satisfaction
Table 6. Example of the data for each user’s emotional value.
IDDayTimeHappyAngrySadPeaceful
11190.00000.50000.50000.0000
12140.00001.00000.00000.0000
13150.00001.00000.00000.0000
646120.66670.00000.00000.3333
646160.50000.00000.00000.5000
646200.50000.00000.00000.5000
1925190.66670.00000.00000.3333
19252130.60000.00000.00000.4000
19253150.33330.33330.00000.3333
12,2121100.75000.00000.00000.2500
12,2121190.50000.00000.00000.5000
12,2121221.00000.00000.00000.0000
Table 7. Regression coefficient by emotion.
EmotionQuadrant α i β 1 , i β 2 , i
Happy10.223680.100010.05696
20.534790.109410.00000
30.128530.00000−0.10995
40.113000.00000−0.05642
Angry10.62323−0.015130.13190
20.222350.058990.00000
30.044410.00000−0.06108
40.110020.00000−0.12981
Sad10.099730.01176−0.00089
20.090310.125250.00000
30.637010.00000−0.09162
40.172950.00000−0.03274
Peaceful10.17360−0.05470−0.02478
20.071920.019190.00000
30.150740.00000−0.00715
40.603740.000000.01274
Table 8. Example of the results from the calculation of the emotional values of music.
No.MusicHappyAngrySadPeaceful
1M0010.19860.47100.06440.0801
2M0020.63300.22730.03930.0992
3M0030.67060.25180.01900.0559
4M0040.17110.07350.15130.6027
5M0050.17020.07670.15370.5984
6M0060.20100.48920.09190.0942
7M0070.65490.22730.02910.0776
8M0080.20100.48920.09190.0942
9M0090.71080.26660.00140.0127
10M0100.17270.07510.15310.5995
570M5700.13880.08630.15250.6006
Table 9. Average error and error rate of the calculation results for each emotion.
EmotionMSERMSEMAENRMSE
Happy0.01320.11490.080911.49%
Angry0.02310.15200.102915.20%
Sad0.00850.09240.055911.09%
Peaceful0.01360.11680.074413.18%
Table 10. Example of a user’s emotional vector for each time.
TimeHappyAngrySadPeaceful
t0 − 50.800.000.000.20
t0 − 40.670.000.000.33
t0 − 30.500.000.000.50
t0 − 20.710.000.000.29
t0 − 10.500.250.000.25
t01.000.000.000.00
t0 + 10.670.000.000.33
t0 + 20.600.000.000.40
Table 11. Comparison of actual and predicted values of emotional states.
TimeRankActualPredicted (MMM)Predicted (PMM)
ValuesEmotionValuesEmotionValuesEmotion
t0 + 110.67Happy0.36Peaceful0.65Happy
20.33Peaceful0.34Happy0.29Peaceful
30.00Angry0.16Angry0.06Angry
40.00Sad0.15Sad0.00Sad
t0 + 210.60Happy0.31Peaceful0.68Happy
20.40Peaceful0.29Happy0.27Peaceful
30.00Angry0.21Sad0.05Angry
40.00Sad0.00Angry0.00Sad
Table 12. Comparison of average prediction errors for each emotion at time t0 + 1.
EmotionMSERMSEMAE
MMMPMMMMMPMMMMMPMM
Happy0.19990.02860.44710.16910.38260.1112
Angry0.02850.00870.16880.09310.15870.0442
Sad0.03310.00280.18200.05260.16690.0167
Peaceful0.04980.01560.22330.12480.19360.0739
Avg.0.07780.01390.25530.10990.22540.0614
Table 13. Comparison of average prediction errors for each emotion at time t0 + 2.
EmotionMSERMSEMAE
MMMPMMMMMPMMMMMPMM
Happy0.22390.06980.47320.26420.42190.1411
Angry0.05810.01920.24100.13860.21060.0760
Sad0.04630.01070.21510.10330.20780.0404
Peaceful0.04270.01370.20660.11690.17660.0756
Avg.0.09270.02830.28400.15580.25420.0833
Table 14. Comparison of average prediction errors for each emotion at time t0 + 1 and t0 + 2.
EmotionNRMSE (t0 + 1)NRMSE (t0 + 2)
MMMPMMMMMPMM
Happy44.71%16.91%47.32%26.42%
Angry16.88%9.31%24.10%13.86%
Sad18.20%5.26%21.51%10.33%
Peaceful22.33%12.48%20.66%11.69%
Avg.25.53%10.99%28.40%15.58%
Table 15. Comparison of recommendation results at time t0 + 1.
Actual ValuesMMMPMM
RankMusicSimilarityRankMusicSimilarityRankMusicSimilarity
1M5500.99911M4970.94481M4960.9996
2M5300.99762M4640.94212M5300.9967
3M4550.99493M5550.93223M4550.9959
4M5130.99484M5200.93104M5130.9954
5M5100.99355M4300.92615M4730.9935
6M4960.99316M4620.91776M5500.9929
7M5410.99207M5240.91757M5030.9925
8M5180.98788M5380.91418M5410.9917
9M4730.98449M5010.91289M5180.9910
10M5030.977810M4800.912110M5100.9876
Table 16. Comparison of recommendation results at time t0 + 2.
Actual ValuesMMMPMM
RankMusicSimilarityRankMusicSimilarityRankMusicSimilarity
1M5100.9991M5380.93181M4960.9995
2M5500.99672M4970.90012M5300.9976
3M5410.99443M4360.89983M5130.9975
4M4550.99264M5200.89684M4730.9969
5M5300.98145M4640.89605M5180.9949
6M4960.97696M5550.89136M5030.9943
7M5130.97467M4500.89127M4550.9919
8M4620.97378M5010.8898M5450.9907
9M5180.96099M4300.88739M4420.9907
10M4730.957010M5070.884910M5500.9898
Table 17. Comparison of average precision, recall, and F1-score for the recommendation results.
TimePrecisionRecallF1-score
MMMPMMMMMPMMMMMPMM
t0 + 10.27770.67220.27770.67660.27770.6744
t0 + 20.27330.62550.27330.63110.27330.6288
Table 18. Comparison of overall average balanced accuracy for recommendation results.
TimeBalanced Accuracy
MMMPMM
t0 + 155.46%82.06%
t0 + 249.41%76.57%
Avg.52.43%79.31%
Table 19. Comparison of average similarity of recommendation results.
TimeSimilarity
MMMPMM
t0 + 10.79370.9482
t0 + 20.73980.9097
Avg.0.76680.9290
Disclaimer/Publisher’s Note: The statements, opinions and data contained in all publications are solely those of the individual author(s) and contributor(s) and not of MDPI and/or the editor(s). MDPI and/or the editor(s) disclaim responsibility for any injury to people or property resulting from any ideas, methods, instructions or products referred to in the content.