Abstract
Urban mobility structure detection and functional distribution learning are significant for urban planning and management. However, existing methods have limitations in handling complex urban data and capturing global spatial structure features. To deal with these challenges, we proposed a multi-scale feature-aware urban mobility structure embedding method based on contrastive learning. First, we designed a multi-scale contrastive learning strategy to effectively learn local human activity features and global spatial structure features, determine the community affiliation of regions, and generate regional embedding vectors. Next, we introduced a correlation matrix to encode the functional synergy and competition of Point of Interests (POIs) and construct the complex correlation between urban mobility structure and urban functional distribution to evaluate the quality of regional embedding vectors. Experiments in Haikou City show that the proposed method can accurately detect the urban mobility structure and functional distribution. The analysis reveals that the central urban area of Haikou exhibits concentrated functions and significant traffic tidal effects, while the suburban areas have relatively weaker functions, with residents displaying a high level of dependence on the central area. Therefore, urban planning needs to optimize the functional layout, improve the functions of the suburbs, and promote the balance of urban space.
1. Introduction
Urban spatial structure represents the relative spatial relationships and distribution patterns of geographical elements within a certain geographic area [1]. On the one hand, the spatial structure of a city, as the core representation of its functional layout, plays a significant role in guiding and shaping human activities [2]. For instance, commercial districts often attract residents during leisure time, encouraging them to engage in consumption activities such as shopping and dining. However, areas with high levels of noise pollution may deter pedestrian movement and outdoor activities, thereby affecting the functionality and attractiveness of certain urban zones [3,4]. On the other hand, the dynamic changes in human mobility also feed back into the urban spatial structure, prompting continuous optimization and adjustment of the city’s functional layout [5]. As urban residents’ lifestyles and consumption needs evolve, the hotspots of human activity may shift or expand, driving the urban spatial layout to adapt to better meet demands. Therefore, through the study of urban spatial structure, researchers can grasp the current distribution and interrelations of various functional zones, optimize the functional layout, enhance the efficiency of the transportation system, and ensure the equitable distribution of public service resources. This has significant implications for urban planning [6], traffic management [7], and public transportation route selection [8].
With the rapid development of mobile positioning technology, transportation devices such as taxis, buses, and subways can record detailed movement trajectories of individuals in different areas, generating a large amount of human mobility data [9,10]. The rise of micromobility infrastructure has further diversified the sources and scale of human mobility data [11]. These data establish a connection between urban spatial structures and human activities, leading to a key shift in the perspective of urban spatial structure research from static to dynamic. For example, with the help of daily travel data such as subway transit data and check-in information, we can accurately assess the functional attributes and living environment quality of different urban areas, allowing for a more comprehensive and in-depth understanding of urban spatial structures [12]. Human mobility plays a significant role in driving the optimization and adjustment of urban functional layouts, thereby having a broad and profound impact on urban spatial structures. Given the important driving force of human behavior in shaping changes in urban functional layouts, numerous scholars have initiated related research and introduced the concept of “urban mobility structure,” which aims to analyze the spatial and temporal distribution, combination, and interrelationships of various activities within the city [13].
The urban mobility structure reflects the mobility patterns of urban residents in different regions and time periods, including areas for work, residence, leisure, and entertainment [14]. To capture the changes in urban layout and network attributes induced by human activities, researchers have explored various network structure partitioning methods. Among these, modularity-based network substructure partitioning methods, such as Louvain [15], FastNewman [16], and InfoMap [17], are widely used for effectively identifying community structures in urban activities. However, with the increasing scale and complexity of data, these traditional methods face challenges in terms of computational efficiency and accuracy. In recent years, with the rapid development of deep learning technologies, data-driven approaches have provided new perspectives and solutions for urban mobility structure partitioning. These methods process massive data, enabling models to automatically learn the intrinsic patterns, features, and regularities within the data, thereby allowing for the precise segmentation of urban activity structures. For example, deep clustering [18] and graph embedding [19], with their powerful feature extraction capabilities, have shown unique advantages in handling large-scale and complex urban data. Compared to traditional methods, data-driven approaches not only effectively handle large-scale data but also uncover more detailed and comprehensive urban mobility structure information. As a result, these methods have garnered widespread attention from researchers in recent years.
The urban mobility structure is complex, encompassing both crowd activity features and spatial structural features. However, current data-driven methods for detecting urban community structures mainly focus on learning local crowd activity features through node proximity, while learning global spatial structural features presents significant challenges. At the same time, urban networks are scale-free networks, and traditional community division metrics such as modularity make it difficult to measure the quality of urban mobility structures, neglecting the key factor that crowd movement is a direct representation of urban functional demands [20]. To address these limitations, we proposed a city activity structure embedding method that considers multi-scale features. The proposed method uses road network data and crowd travel data to construct an urban spatial activity structure map and designs a multi-scale comparison method to learn both local crowd activity features and global spatial structure features, generating region embedding vectors for urban mobility structure detection. Based on this, the region embedding vectors are further used to introduce a correlation matrix to explicitly encode the functional synergy and competitive relationships of POIs, enabling the learning of urban functional distribution and establishing a nonlinear mapping relationship between crowd activities and urban functional distribution. Finally, by quantifying the balance between crowd activity and service coverage under different urban spatial functional distributions, the method provides multi-objective optimization decision support for planners to address the complex challenges in urban spatial planning. The main contributions are summarized as follows:
1. A city activity structure embedding method considering multi-scale features is designed. Building upon the urban spatial mobility network, we designed a learning framework that incorporates both local node contrast and global activity structure contrast. Additionally, we introduced a batch decay factor to integrate the local node contrast loss with the global activity structure contrast loss, thereby significantly enhancing the performance of urban mobility structure detection;
2. Functional distribution learning based on urban mobility structures is conducted. We introduced a correlation matrix to explicitly encode the functional synergy and competitive relationships of POIs, enabling urban functional distribution learning, constructing a nonlinear mapping relationship between crowd activity structures and urban functions, and thereby evaluating the quality of regional embedding vectors and the balance between crowd activities and functional coverage;
3. Experiments in Haikou City have shown that our method can accurately detect the urban mobility structure and functional distribution. The analysis reveals that the functions of Haikou’s central urban area are highly concentrated, with a clear tidal movement effect, while the suburban functions are relatively weak, and residents have a high level of dependence on the central urban area. In the process of urban development, it is important to optimize the functional layout of the central urban area, improve suburban functions, and promote the balanced development of urban space.
The paper is organized as follows: Section 2 introduces the related work. Section 3 introduces the proposed method. Section 4 implements the method on the Haikou City dataset and compares it with baseline methods. Section 5 discusses the travel patterns of residents under different community structures. Section 6 provides the conclusion.
2. Related Work
The urban mobility structure reflects the mobility patterns of urban residents in different regions and time periods, including activity areas with different functions such as work, residence, leisure, entertainment, and their interrelationships. Currently, the methods for analyzing urban mobility structures can be categorized into substructure partitioning methods and data-driven deep learning methods.
2.1. Network Substructure Partitioning Methods
Traditional network substructure partitioning methods, represented by Louvain and FastNewman, provide a foundation for detecting urban mobility structures. These methods are based on the concept of modularity optimization [16], assessing the quality of structural division by comparing the internal and external differences between communities. For example, studies using mobile signaling data reveal that the mobility structure across different traffic analysis zones in Beijing exhibits significant spatial differentiation, with dense travel in the central urban area contrasting sharply with radial commuting flows in the suburbs [21]. Liu et al. [22] employed the Leuven community detection method to analyze urban spatial substructures and their temporal evolution patterns. Liu et al. [23] used the FastNewman to identify Tokyo’s four-level ring-shaped functional urban structure. Zhang et al. [24] characterized the network features of Chinese cities using Baidu migration data. Gu et al. [25] combined POI data and taxi trajectory data to quantitatively analyze the traffic attraction patterns of typical urban functional areas and the strength and direction of their interactions. Chin et al. [26] studied urban mobility structures during different pandemic periods to understand the spatial interaction structure and its dynamics in disease control. However, despite the success of these traditional methods in uncovering urban community structures, their inherent limitations prevent them from effectively handling the highly dynamic and complex nature of urban data.
2.2. Data-Driven Deep Learning Methods
With the continuous development of deep learning technologies, some scholars have begun to explore urban mobility structures from a data-driven perspective. For example, Zhang et al. [27] integrated public transportation travel patterns with urban functional information to construct a public transport flow network, using a graph autoencoder for joint embedding to generate low-dimensional dense vector representations and applying unsupervised clustering techniques to accurately extract the traffic mobility structure. Duan et al. [28] proposed a spatiotemporal representation learning method based on reinforcement learning, which effectively captures the spatiotemporal heterogeneity of individual travel while incorporating a knowledge graph of interactions between individuals and stations, revealing the urban transportation structure. Duan et al. [29] also introduced a method for representing urban mobility structures that considers the heterogeneity of residents’ travel, combining POI data and residents’ public transport data to deeply explore urban mobility structures and travel patterns. Additionally, Wei et al. [30] fused mobile location data and point-of-interest data, using Node2Vec to extract inter-regional spatial interaction features for classifying urban functional zones. Compared to traditional algorithms, data-driven approaches can integrate multi-source data, can accurately mine key information from massive datasets, and are increasingly important in the field of urban mobility structure detection. However, current data-driven methods struggle to capture global spatial features and assess mobility quality due to the scale-free nature of urban networks and the neglect of crowd mobility as a reflection of urban demand.
3. Method
Urban mobility structure detection categorizes regions into distinct communities based on the travel patterns observed in the data. These communities are composed of regions with similar mobility characteristics, revealing the spatial structure and functional distribution of the city. It ought to be assumed that the study area can be divided into N regions, represented as nodes , with the mobility OD flows serving as the edges. The urban mobility network is represented as , where and are the starting and destination regions of OD flow, respectively, and and are the start and end times of travel. Through contrastive learning, the mobility network G maps to a low-dimensional vector space, generating the region vector , while urban regions are grouped into communities , with communities exhibiting similar internal characteristics. Next, the region embedded vector fits the region functional distribution , building a complex relationship between urban mobility structures and urban functional distribution. Finally, we analyze the flow pattern, spatio-temporal pattern of travel, and functional distributions among different communities, providing multi-objective optimization decision support for planners, as shown in Figure 1.
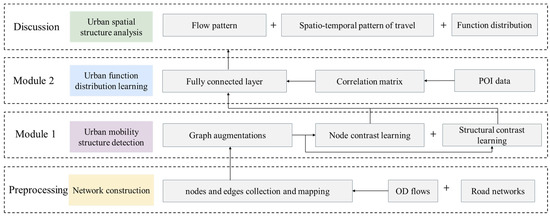
Figure 1.
Framework of the proposed method.
3.1. Model 1: Urban Mobility Structure Embedding with Multi-Scale Features
The objective of embedding urban mobility structures is to map a mobility network into a low-dimensional vector space, thereby generating vector representations for each region. However, existing self-supervised learning methods primarily rely on contrastive strategies to learn the proximity features of nodes, which have limitations in capturing the global mobility structure features [31]. To address this issue, we proposed a city activity structure embedding model that incorporates multi-scale features. We simultaneously performed local node contrast and global mobility structure learning by the enhanced mobility network. Furthermore, an epoch decay coefficient is introduced to integrate the local node contrast loss with the global contrast loss. The model architecture, as depicted in Figure 2, consists of two key components: graph enhancement and multi-scale contrastive learning.
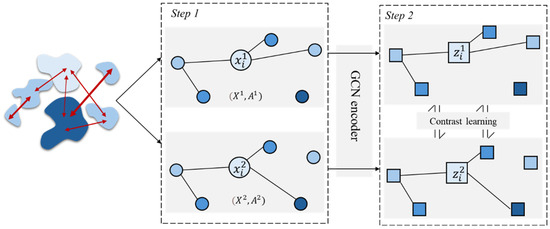
Figure 2.
Multi-scale contrastive learning.
Step1. Graph enhancement
We enhanced the mobility network by randomly masking the node features and randomly discarding the edges. The node feature masking is obtained by multiplying the random mask vectors , as follows:
where is the Hadamard product, is the original node feature matrix, and is the random noise vector, following the Bernoulli distribution: , is the random discard rate of node features. Edge randomly discard is obtained by multiplying the random mask matrix , as follows:
where is the original adjacency matrix, follows a Bernoulli distribution .
Through the graph enhancement operations of feature masking and edge discarding, we obtained two enhanced views, respectively: and , Then, we obtained the node embedding vectors of the two enhanced views, respectively, through the GCN of parameter sharing, as follows:
where is a graph convolution, and its calculation principle is as follows:
where is the normalized adjacency matrix, , is the adjacency matrix, is the identity matrix, and is the degree matrix, is the node feature matrix of the l-th layer, is the initial node feature, is the weight matrix of the l-th layer, and is the activation function.
Step2. Multi-scale contrastive learning
- ①
- Local contrastive learningUpon generating the vector embeddings for the two enhanced views, we employed the node contrast loss function, InfoNCE, to learn the node embeddings, effectively capturing the mobility patterns of the crowd at the nodes. Specifically, the goal is to minimize the contrast loss, ensuring the embedding distances of the same nodes in the two enhanced views is closer, while increasing the distances between different nodes, as follows:where is the Gaussian RBF distance, and and are the node embedding vectors of two enhanced views, respectively.
- ②
- Global contrastive learningTo learn the global structure features, we determined the community ownership of each node by calculating the distance between each node and the community centroid, as follows:where indicates that node i belongs to the community k, and is a trainable community centroid matrix. Then, we adopted the cross-comparison objective to compare the node representation of one view with the community centroid of the other view, to maximize the community consistency between the two views, as follows:where represents the embedded representation of the -th node, represents the centroid of the community to which the -th node belongs, and is the RBF weight function.
To train the node contrast loss and community contrast loss in a single loss function, we proposed the epoch decay coefficient such that the loss weight of decreases as the number of training epochs increases, and the overall training loss is as follows:
where decreases as the epoch increases.
3.2. Model 2: Urban Functional Distribution Learning with the Correlation Matrix
The urban mobility structure embeddings learned through contrastive learning effectively capture the mobility patterns of urban residents across different regions and periods. However, objectively evaluating these embeddings remains a challenge. Given the complex relationship between urban mobility structures and the urban functional distribution, we argued that the structure of urban activities can reflect the functional distribution of a region [32]. Therefore, by using the embedding vector of urban activity structures as input, we transformed the task of learning urban functional distribution into a problem of predicting the region’s POI distribution.
We believed that different types of POIs exhibit a synergistic relationship. For instance, regions with a high number of “shopping” POIs tend to also have a larger number of “food and beverages” POIs. Based on this insight, we proposed an enhanced urban functional distribution learning model that incorporates these collaborative relationships. The synergy between POIs is quantified by analyzing the correlation in the distribution of different POI types.
The POI distribution prediction for regions can be defined as follows: let be the urban mobility structure embedding matrix for each region, where (with being the embedding dimension of each region) and denote the set of POI types. The label distribution matrix is , where represents the true proportion of each POI type in a region, with and . Given the training set , the goal is to model the relationship between X and Y.
Figure 3 illustrates the three key steps involved in the urban functional distribution learning model. First, the embedding matrix is fed into a multilayer perceptron (MLP) to obtain the initially predicted distribution . Second, an affinity matrix is constructed to explicitly encode POI functional synergies, which adjusts the initial predictions through matrix multiplication. Finally, the output is passed through a SoftMax function to generate the normalized POI type distribution prediction, ensuring the sum of all probabilities equals 1. The core of this method lies in defining POI functional synergies, where cosine similarity is used to quantify the functional relationship between region and region , as follows:
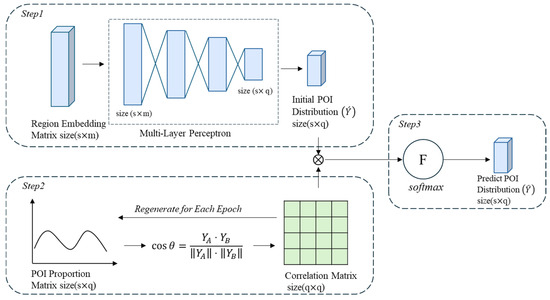
Figure 3.
Regional functional distribution learning.
The KL divergence can be used to measure the difference between two probability distributions. Therefore, we adopted the KL divergence as the loss function of the urban functional distribution learning model, as follows:
where is the number of regions, is the predicted regional label distribution, and is the actual regional label distribution.
4. Case Study
4.1. Data and Experimental Settings
4.1.1. Data
The proposed method is validated in Haikou City. Haikou is in the northern part of Hainan Island, at the northern edge of the low-latitude tropical zone. As of 2017, the city had a permanent population of approximately 2.27 million. The proposed method uses multi-source urban data, including Didi OD data, road network data, and POI data from May 2017. The Didi data include a total of 1,987,642 records, containing information such as the starting and ending points, departure time, arrival time, and travel distance, as shown in Table 1. The spatial distribution of the start and destination of Didi orders is shown in Figure 4. The road network data come from OSM and are used for dividing Haikou into districts. The POI data are sourced from Amap and include 14 types such as shopping, food and beverages, and daily life services, with a total of 128,505 POI points, as shown in Table 2.

Table 1.
Example of Didi OD flows.
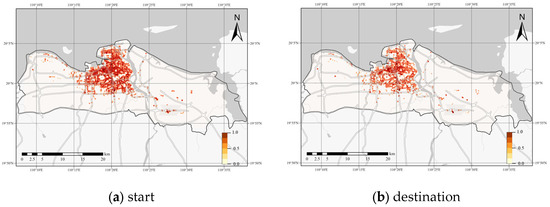
Figure 4.
Heat map.
Table 2.
Details of POI data.
Haikou City is divided into four districts, including Xiuying District, Longhua District, Qiongshan District, and Meilan District. Among these, Longhua District houses core commercial areas such as the Guomao Business District, Jiefangxi Business District, and Mingzhu Plaza. It exhibits the highest consumption level in the city, with daily foot traffic surpassing the combined total of the other three districts, thereby positioning it as the central urban area of Haikou. Since most of the city’s population activities are concentrated north of the Haikou Ring Expressway, we selected the area north of the Haikou Ring Expressway as the study area. Based on road network data, the study area is divided into 503 regions, as shown in Figure 5. The Didi data are spatially mapped to obtain the origin and destination regions. The 503 regions are treated as the nodes of the network, the OD flow is treated as the edges , and the inflow and outflow volumes during different periods for each region are used as node attributes , constructing the mobility network .
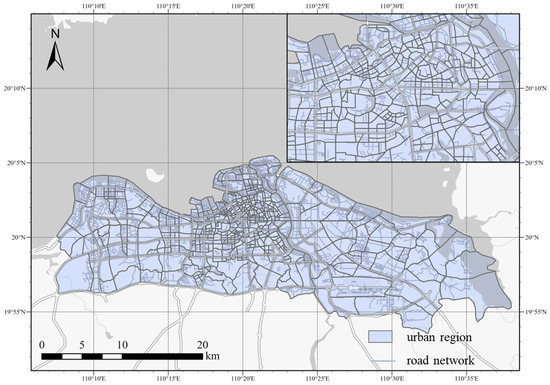
Figure 5.
Study area.
4.1.2. Experimental Settings
The method consists of two models: the embedding of urban mobility structures considering multi-scale features and the functional distribution learning based on urban mobility structures. Therefore, a two-stage training strategy is adopted in the experiment. In the first stage, multi-scale contrastive learning is adopted for regional embedding training, with a learning rate of 0.01. A two-layer GCN is selected as the basic model. The random discard rates of edge and node attributes are 0.1 and 0.2, respectively. The weight attenuation rate of the Adam optimizer is 1 × 10⁻⁵, and the Epoch is set to 1000. A 384-dimensional regional embedding vector is obtained through training. In the second stage, the embedding vectors of the region are learned for functional distribution. This model consists of three layers of artificial neural networks. The hidden layers are set with 128 and 64 neurons, respectively, the learning rate is 5 × 10⁻⁴, the weight attenuation rate of the Adam optimizer is 5 × 10⁻⁴, and the Epoch is set to 300. The ratio between the training and test datasets was set at 4:1. The experiment was conducted under the Windows 11/64-bit /i7 operating system. The proposed method was implemented using Python 3.8 in PyTorch 1.12.1, Numpy 1.22.3, and Pandas 2.0.3.
4.2. Urban Mobility Structure Detection
Based on the embedding of urban mobility structures, we divided the urban regions of weekdays and weekends into five communities. The number of each community is shown in Table 3, and the spatial distribution is depicted in Figure 6. Although there are different travel demands on weekdays and weekends, it can be observed that the spatial distribution of different community types is generally similar for both weekdays and weekends. This is because Haikou City has a single-center structure. The central urban area, as the core of the city, integrates multiple functions such as commerce, culture, and administration and has a large flow of activities. Type I communities are primarily located in areas such as Hainan University, Hainan Normal University, Sunshine City, and Haikou East Station, mainly serving higher education, shopping centers, and transportation hubs, representing the core area of Haikou City. The distribution of Type II communities is mainly adjacent to Type I, primarily located around Haikou Station, residential areas, and wellness and vacation parks, representing the sub-central areas of Haikou City. Type III, Type IV, and Type V communities are primarily distributed in suburban areas and regions with lower population density. However, on weekends, the community classification of certain industrial and residential areas located farther from the city center shifts from Type I and Type II, observed on weekdays, to Type III or Type IV. This shift occurs as residents’ travel patterns transition from work-related commuting to leisure and recreational activities, leading to diminished connectivity between these areas and the central regions.
Table 3.
The number of regions in each community.
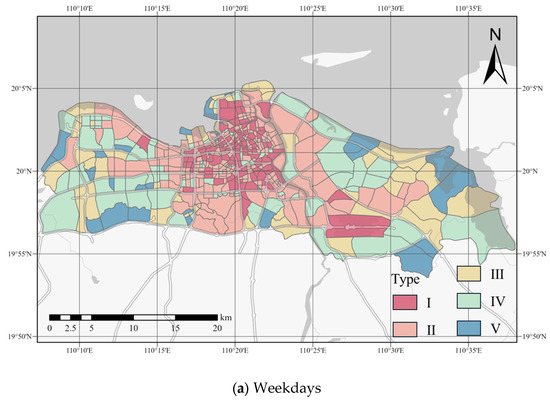
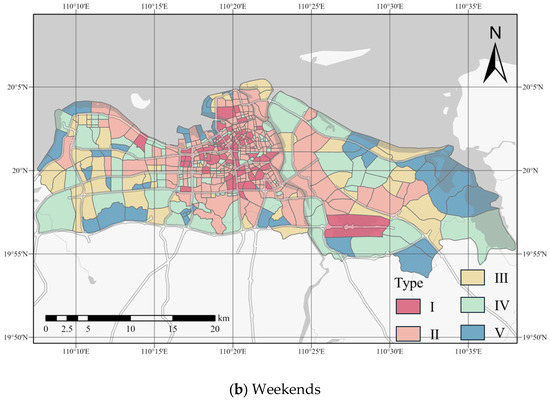
Figure 6.
Division of community structure.
We selected Louvain and GCL as baseline models and quantitatively compared the results of urban mobility structure partitioning. The Louvain algorithm treats different areas or nodes of the city as vertices in a graph, with edges between the vertices representing the flow between regions. By aggregating vertices, the Louvain algorithm can effectively identify areas in the city with similar activity patterns. However, it cannot account for edge weights and the direction of flow. GCL, on the other hand, first generates sample pairs through a graph augmentation strategy, then uses a graph neural network encoder for contrastive learning of node embedding representations. It applies clustering algorithms to group the node embeddings and identify different communities within the city. However, GCL cannot learn global activity structure features.
The results of urban mobility structure partitioning are measured by edge density, which is the ratio of the actual number of edges present in each community to the maximum number of edges that can be accommodated, as follows:
where is the number of edges in community , and is the maximum number of edges.
The edge density results are shown in Table 4. A higher edge density indicates that the regions are more closely connected, suggesting better urban mobility structure partitioning. The edge density indicator of the proposed method is the highest on both weekdays and weekends, indicating that the method can effectively leverage multi-scale features to improve the validity of community partitioning. However, among the three methods, the edge density on weekends is lower than on weekdays. This is because, on weekends, people have more diverse travel demands, leading to increased connections between different communities, which makes urban mobility structure partitioning more challenging.
Table 4.
Edge density.
4.3. Urban Functional Distribution Learning
Based on the urban area embedding vectors obtained from the urban mobility structure, we conducted urban functional distribution learning and constructed a nonlinear mapping relationship between crowd activities and urban functions. We used three metrics, namely KL divergence (), cosine similarity (), and L1 distance (), to comprehensively evaluate the quality of the upstream urban region embedding vectors and the performance of the downstream functional distribution learning. The calculation principles of KL divergence, cosine similarity, and L1 distance are as follows:
where is the actual regional label distribution and is the predicted regional label distribution.
GCN and GCL are the selected baseline models: GCN takes the mobility network as input, aggregates information from neighboring nodes using graph convolution, and combines it with downstream models for regional functional distribution learning. GCL uses embedding vectors derived from the urban mobility structure partitioning, and then combines them with downstream models for functional distribution learning.
Table 5 shows the performance of the baseline methods, the proposed method for functional distribution learning. The KL divergence of the proposed method is 0.021, the cosine similarity is 0.858, and the L1 distance is 55.8, achieving the best results across all metrics. This indicates that the learned distribution is very close to the real situation of the regions. GCL only considers the local information of nodes during urban mobility structure partitioning, ignoring global activity structure features, leading to lower accuracy compared to the proposed method. In the case of GCN, the parameters of the upstream embedding model are also involved in training during functional distribution learning, resulting in better performance than GCL. However, since it does not learn global activity structure features, its accuracy is still lower than that of the proposed method. This suggests that the global activity structure features, which reflect the overall crowd activity situation, are strongly correlated with urban functions and play an important role in functional distribution learning.
Table 5.
Results of the functional distribution.
Further comparison of the combinations of all embedding models and downstream models reveals that, regardless of the embedding model used, the method proposed in this paper significantly improves accuracy compared to MLP. MLP consists of three fully connected layers, while the proposed method innovatively introduces a correlation matrix based on MLP. This matrix can accurately encode the correlations between different urban functions, enabling the model to achieve stronger accuracy performance. This further highlights the advantages of the proposed method in urban functional distribution learning tasks.
5. Discussion
5.1. Flow Pattern Between Communities
As depicted in Figure 7, the flow patterns between communities reveal distinct characteristics on weekdays (a) and weekends (b). On weekdays, there is a pronounced unidirectional convergence of flows from suburbs to the central regions (Type I). This stems from the necessity for residents to travel to central hubs for work, business meetings, or commuting to office buildings, commercial zones, or transportation hubs. Such a pattern underscores the central area’s dominant role and the significant reliance of suburban residents on its employment and commercial resources.
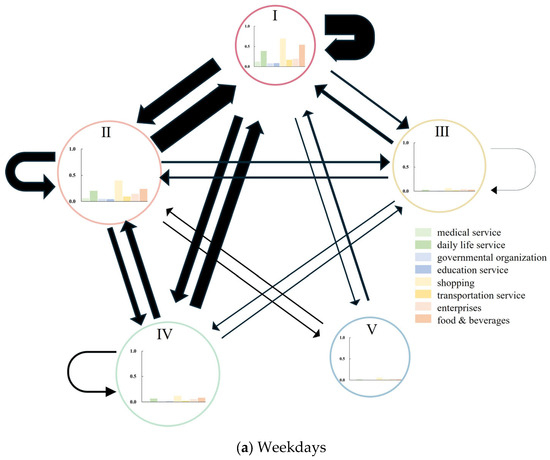
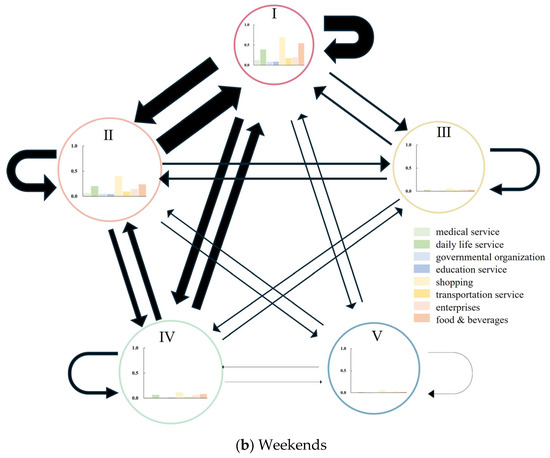
Figure 7.
Flow patterns between communities, with the size of the circle representing the relative scale of challenging communities.
On weekends, the flow between suburbs significantly increases, and more bidirectional arrows appear. This indicates that during weekends, people have more leisure time for diverse activities, no longer limited to traveling to the central area. There may be more recreational, entertainment, commercial, or social activities between peripheral nodes. For example, on weekends, people may choose to engage in consumption and leisure activities in surrounding commercial streets, parks, or cultural venues, which enhances the interaction between peripheral nodes. It shows the potential for functional transformation in suburban spatial structures on non-working days.
The change from (a) to (b) shows that the flow pattern on weekdays is more concentrated and singular, while the flow pattern on weekends is more dispersed and diversified. This reflects the different living rhythms and activity demands of urban residents on weekdays and weekends, which is consistent with the trend of functional diversification in suburban and fringe areas within urban spatial forms. With urban development, suburban areas are gradually transitioning from a single residential function to a multifunctional one, increasing the supply of leisure, entertainment, and commercial facilities. The transformation not only relieves pressure on the central area but also promotes the balanced development of the urban spatial structure. However, this balanced development is still in its early stages, and there is still a significant gap in the degree of functional improvement in suburban areas compared to the central urban areas. This is particularly evident in the travel patterns of Type IV and Type V communities.
5.2. The Spatio-Temporal Pattern of Travel
To analyze the travel time patterns of Haikou City, we counted orders from different communities by the hour, separately for weekdays and weekends, as shown in Figure 8. On weekdays, the travel volumes of Type I and Type II communities display similar time-distribution patterns with slight numerical differences. From 00:00–03:00, volumes stay low; 04:00–06:00 sees a gradual rise; and a small peak emerges at 6:00–9:00. Volumes remain high and stable between 9:00 and 15:00, climb again to another daily peak at 15:00 and 18:00, and then decrease from 18:00 to 21:00.
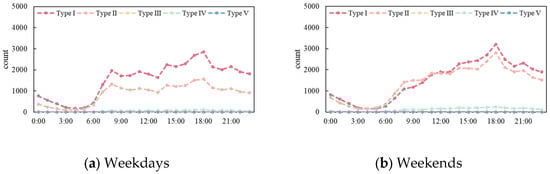
Figure 8.
Travel time of communities.
Over the weekend, the difference in travel volumes between Type I and Type II communities narrowed compared to weekdays. The travel demand in Type II communities rises, and both types see a peak at 18:00. This might be due to Haikou’s tropical monsoon climate, where high daytime temperatures prompt residents to schedule leisure activities for the cooler evenings.
Daytime temperatures are relatively high, leading residents to schedule their leisure activities during cooler evening hours. The order quantities for Type I, Type III, Type IV, and Type V in the community remain at a lower level, both on weekdays and weekends, consistently ranging between 0 and 200 orders. The volatility is also low, with no significant fluctuations at either the upper or lower extremes, indicating that travel demand in this area is relatively low and stable.
To explore the characteristics of each community, we calculated the average travel distance, average travel time, and average travel speed for different communities, as shown in Figure 9. On weekdays, the travel distance in most communities is greater than that on weekends, with Type III, Type IV, and Type V communities exhibiting longer travel distances compared to Type I and Type II communities. It can be attributed to the centralizing urban structure of Haikou, where Type I and Type II areas encompass various functions such as commerce, culture, administration, and residential purposes. Residents in these areas do not need to travel long distances for daily activities. In contrast, residents of Type III, Type IV, and Type V communities need to commute long distances to reach their workplaces. However, on weekends, residents tend to choose leisure, entertainment, and other nearby destinations, resulting in shorter travel distances.

Figure 9.
Statistics of residents’ activities in different communities.
In terms of travel time, communities of Type I, Type II, and Type IV on weekdays have shorter travel times compared to their corresponding communities on weekends, while Type III and Type V communities show the opposite trend. This is because, on weekdays, residents have a clear travel purpose due to work, leading to shorter travel times in Type I, Type II, and Type IV communities. Conversely, residents in Type III and Type V communities need to commute longer distances on weekdays, thus resulting in longer travel times compared to weekends. On weekends, people’s travel purposes are more diverse, and the travel time is relatively more flexible. As a result, travel speeds on weekdays are higher than on weekends across all areas.
5.3. Urban Functional Distribution
In Figure 10, we conducted a visual analysis of the functional distribution prediction of different regions in the city. The results show that the urban functional distribution prediction model demonstrates good performance in most regions and can reflect the actual distribution of urban functions relatively accurately, indicating that residents’ travel activities and the distribution of urban functions are in a relatively balanced state. We selected four regions especially and conducted an in-depth visualization study on the predicted values of their functional distribution. Among them, the cosine similarity between the model outputs of regions (a) and (b) and the real situation exceeds 0.9, indicating that the model can effectively fit the POI type distribution of these regions with the help of the active structure vectors. However, the cosine similarity of regions (c) and (d) is less than 0.5, and the model shows significant overprediction biases in the predictions of the three types of POIs, namely daily life service, shopping, and food and beverages, in these regions.
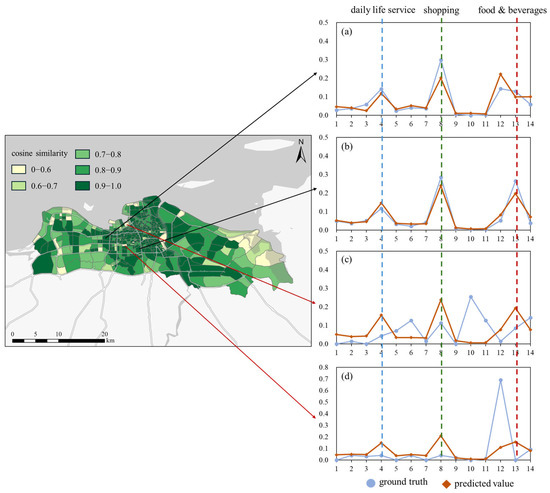
Figure 10.
Visualization of the ground truth and predicted value. The left panel is the visualization of cosine similarity, and the right panel is the ground truth and predicted value. Among them, the cosine similarity of (a,b) is greater than 0.9, and the cosine similarity of (c,d) is less than 0.5.
To explore the reasons behind it, we conducted further statistics and analyses of the four regions of travel flow conditions, and the results are shown in Figure 11. Both region (a) and region (b) are commercial areas with diverse functions. The flow of residents’ activities is not only regular but also large in scale, which provides rich characteristic information for the model and enables it to effectively conduct functional distribution learning. In contrast, region (c) is a tourist attraction. Although the flow of residents’ activities in the region is also considerable, due to the lack of other regions (tourist attractions) with similar functional distribution as a reference and comparison, this undoubtedly increases the difficulty of accurate prediction by the model. Region (d), on the other hand, is an industrial area mainly composed of factories, whose activity flow is inherently at a relatively low level, making it difficult to extract sufficient effective features from the urban mobility structure vector. From the perspective of urban planning, there are indeed unreasonable aspects in the functional services distribution of region (d), lacking basic living supporting facilities such as daily life.
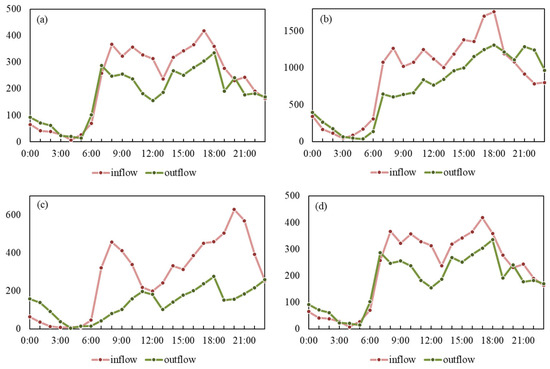
Figure 11.
Regional flows statistics, (a–d) represent the four regions in Figure 10.
6. Conclusions
We proposed a method for embedding urban mobility structures that incorporate multi-scale features, which is used to detect urban mobility structures and learn the distribution of urban functions. To begin with, we gathered road network data and population travel data to construct the urban mobility network. By designing a multi-scale contractive learning model, it generates the embedding vectors of the regions by learning both local population activity features and global spatial structure features. In addition, a correlation matrix is employed to explicitly encode the coordination and competition relationship of POI functions. By integrating the urban mobility structure embedding vectors with the learning of urban functional distribution, we established a nonlinear mapping relationship between population activities and urban functions. It helps evaluate the balance of functional distribution and population activities in urban regions. The experimental results in Haikou City demonstrate that the proposed method has achieved excellent performance in both the detection of urban mobility structure and the learning of functional distribution.
Through the analysis of urban mobility structure, it was found that the urban structure of Haikou City has a central clustering characteristic. The central area attracts a large amount of surrounding mobility due to high-intensity development and multi-functional agglomeration, reflecting a clear functional zoning in urban space and the dominant role of the central area. However, this also leads to traffic congestion and excessive population concentration. The mobility structure on weekends shows a decentralized and diversified pattern, indicating that the suburbs are transitioning from a single residential function to a multi-functional one, with the addition of leisure, entertainment, and commercial facilities. It has eased the pressure on the central area and fostered a more balanced spatial structure. However, the functional development of the suburbs remains less advanced than that of the central area, and balanced development is still in its early stages. In urban planning, it is essential to optimize the functional layout of the central urban area, enhance suburban functions, and promote their diversified development. It will help reduce residents’ dependence on the central area and support the balanced growth of urban space. Owing to the limitations of the available data sources, this study exclusively utilizes DiDi data. For future work, we plan to expand our data scope to include micromobility data, such as shared scooters and bikes, as well as sensor-based urban quality metrics like noise and vibration levels. We also intend to adopt multimodal mobility data fusion techniques to more accurately capture and reflect the complex dynamics of modern urban environments.
Author Contributions
Conceptualization, J.L. (Jia Li), C.L., and H.L.; Data curation, Q.L.; Formal analysis, C.L. and Q.L.; Methodology, J.L. (Jia Li), H.L., and Q.L.; Project administration, H.L.; Validation, J.L. (Jia Li), C.L., J.L. (Jing Li), and D.Z.; Visualization, J.L. (Jing Li) and D.Z.; Writing—original draft, J.L. (Jia Li); Writing—review and editing, J.L. (Jia Li) and J.L. (Jing Li). All authors have read and agreed to the published version of the manuscript.
Funding
This research was supported by the Natural Science Foundation of Henan Province [Grant No. 41974213] and Science and Technology Research Project of Henan Province [Grant No. 252102321003].
Data Availability Statement
The data are sourced from Didi Chuxing’s Gaia data openness program; you can contact the corresponding author to obtain them.
Acknowledgments
We appreciate the editors and reviewers for their constructive comments and suggestions.
Conflicts of Interest
No potential conflicts of interest were reported by the authors.
References
- Horton, F.E.; Reynolds, D.R. Effects of Urban Spatial Structure on Individual Behavior. Econ. Geogr. 1971, 47, 36–48. [Google Scholar] [CrossRef]
- Krehl, A.; Siedentop, S.; Taubenböck, H.; Wurm, M. A Comprehensive View on Urban Spatial Structure: Urban Density Patterns of German City Regions. ISPRS Int. J. Geo-Inf. 2016, 5, 76. [Google Scholar] [CrossRef]
- Danilevičius, A.; Danilevičienė, I.; Karpenko, M.; Stosiak, M.; Skačkauskas, P. Determination of the Instantaneous Noise Level Using a Discrete Road Traffic Flow Method. Traffic Transp. 2025, 37, 71–85. [Google Scholar] [CrossRef]
- Danilevičius, A.; Karpenko, M.; Křivánek, V. Research on the Noise Pollution from Different Vehicle Categories in the Urban Area. Transport 2023, 38, 1–11. [Google Scholar] [CrossRef]
- Wei, Y.D.; Wu, Y.; Liao, F.H.; Zhang, L. Regional Inequality, Spatial Polarization and Place Mobility in Provincial China: A Case Study of Jiangsu Province. Appl. Geogr. 2020, 124, 102296. [Google Scholar] [CrossRef]
- Maeda, T.N.; Mori, J.; Hayashi, I.; Sakimoto, T.; Sakata, I. Comparative Examination of Network Clustering Methods for Extracting Community Structures of a City From Public Transportation Smart Card Data. IEEE Access 2019, 7, 53377–53391. [Google Scholar] [CrossRef]
- Camarero, L.A.; Oliva, J. Exploring the social face of urban mobility: Daily mobility as part of the social structure in Spain. Int. J. Urban Reg. Res. 2008, 32, 344–362. [Google Scholar] [CrossRef]
- Correa, F.; Bartorila, M.; Ribeiro-Palacios, M.; Pérez-Soto, G.I.; Rodríguez-Reséndiz, J. Toward the Human Scale in Smart Cities: Exploring the Role of Active Mobility in Ecosystemic Urbanism. Smart Cities 2024, 7, 4002–4024. [Google Scholar] [CrossRef]
- Yousefi, Z.; Dadashpoor, H. How Do ICTs Affect Urban Spatial Structure? A Systematic Literature Review. J. Urban Technol. 2020, 27, 47–65. [Google Scholar] [CrossRef]
- Dadashpoor, H.; Yousefi, Z. Centralization or decentralization? A review on the effects of information and communication technology on urban spatial structure. Cities 2018, 78, 194–205. [Google Scholar] [CrossRef]
- Karpenko, M.; Prentkovskis, O.; Skačkauskas, P. Analysing the impact of electric kick-scooters on drivers: Vibration and frequency transmission during the ride on different types of urban pavements. Eksploat. I Niezawodn.-Maint. Reliab. 2018, 27, 1–14. [Google Scholar] [CrossRef]
- Bassolas, A.; Barbosa-Filho, H.; Dickinson, B.; Dotiwalla, X.; Eastham, P.; Gallotti, R.; Ghoshal, G.; Gipson, B.; Hazarie, S.A.; Kautz, H.; et al. Hierarchical organization of urban mobility and its connection with city livability. Nat. Commun. 2019, 10, 4817. [Google Scholar] [CrossRef] [PubMed]
- Cao, J. Big data-driven research on the interaction of human mobility pattern and urban spatial structure. Acta Geod. Et Cartogr. Sin. 2021, 50, 849. [Google Scholar]
- Allam, Z.; Sharifi, A. Research Structure and Trends of Smart Urban Mobility. Smart Cities 2022, 5, 539–561. [Google Scholar] [CrossRef]
- Blondel, V.D.; Guillaume, J.L.; Lambiotte, R.; Lefebvre, E. Fast unfolding of communities in large networks. J. Stat. Mech. Theory Exp. 2008, 2008, P10008. [Google Scholar] [CrossRef]
- Newman, M.E.J. Fast Algorithm for Detecting Community Structure in Networks. Phys. Rev. E 2004, 69, 066133. [Google Scholar] [CrossRef]
- Rosvall, M.; Bergstrom, C.T. Maps of Random Walks on Complex Networks Reveal Community Structure. Proc. Natl. Acad. Sci. USA 2008, 105, 1118–1123. [Google Scholar] [CrossRef]
- Murakami, D.; Yamagata, Y. Micro Grids Clustering for Electricity Sharing: An Approach Considering Micro Urban Structure. Energy Procedia 2017, 142, 2748–2753. [Google Scholar] [CrossRef]
- Yuan, N.J.; Zheng, Y.; Xie, X.; Wang, Y.; Zheng, K.; Xiong, H. Discovering Urban Functional Zones Using Latent Activity Trajectories. IEEE Trans. Knowl. Data Eng. 2014, 27, 712–725. [Google Scholar] [CrossRef]
- Butron-Revilla, C.; Suarez-Lopez, E.; Laura-Ochoa, L. Discovering urban mobility patterns and demand for uses of urban spaces from mobile phone data. In Proceedings of the 2021 2nd Sustainable Cities Latin America Conference (SCLA), Virtual, 25–27 August 2021; IEEE: Piscataway, NJ, USA, 2021. [Google Scholar]
- Wang, Z.-J.; Chen, Z.-X.; Wu, J.-Y.; Yu, H.-W.; Yao, X.-M. Detecting latent urban mobility structure using mobile phone data. Mod. Phys. Lett. B 2020, 34, 2050342. [Google Scholar] [CrossRef]
- Liu, C.; Chen, L.; Yuan, Q.; Wu, H.; Huang, W. Revealing Dynamic Spatial Structures of Urban Mobility Networks and the Underlying Evolutionary Patterns. ISPRS Int. J. Geo-Inf. 2022, 11, 237. [Google Scholar] [CrossRef]
- Liu, K.; Murayama, Y.; Ichinose, T. Using a new approach for revealing the spatiotemporal patterns of functional urban polycentricity: A case study in the Tokyo metropolitan area. Sustain. Cities Soc. 2020, 59, 102176. [Google Scholar] [CrossRef]
- Zhang, X.; Han, H.; Tang, Y.; Luo, G. Research on the characteristics of urban network structure in China based on Baidu migration data. J. Geo-Inf. Sci. 2021, 23, 1798–1808. [Google Scholar] [CrossRef]
- Gu, Y.; Jiao, L.; Dong, T.; Wang, Y.; Xu, G. Spatial distribution and interaction analysis of urban functional areas based on multi-source data. Geomat. Inf. Sci. Wuhan Univ. 2018, 43, 1113–1121. [Google Scholar] [CrossRef]
- Chin, W.C.B.; Feng, C.C.; Leong, C.H.; Clapham, H.E.; Pang, J.; Wang, Y.C. The networked community of urban mobility during the pandemic. Ann. Am. Assoc. Geogr. 2024, 114, 1704–1717. [Google Scholar] [CrossRef]
- Zhang, T.; Duan, X.; Li, Y. Unveiling transit mobility structure towards sustainable cities: An integrated graph embedding approach. Sustain. Cities Soc. 2021, 72, 103027. [Google Scholar] [CrossRef]
- Duan, X.; Zhang, T.; Xu, Z.; Wan, Q.; Yan, J.; Wang, W.; Tian, Y. Discovering urban mobility structure: A spatio-temporal representational learning approach. Int. J. Digit. Earth. 2023, 16, 4044–4072. [Google Scholar] [CrossRef]
- Duan, X.; Zhang, T.; Tian, Y.; Liu, P.; Wan, Q.; Qin, Y. Residents’ travel heterogeneity and urban mobility structure. Acta Geod. Cartogr. Sin. 2023, 52, 155–166. [Google Scholar]
- Wei, Y.; Wu, S. A method for identifying urban functional regions by integrating regional embedding representations. J. Geo-Inf. Sci. 2025, 27, 424–440. [Google Scholar] [CrossRef]
- Li, B.; Jing, B.; Tong, H. Graph communal contrastive learning. In Proceedings of the ACM Web Conference 2022, Lyon, France, 25–29 April 2022. [Google Scholar]
- Li, J.; Liu, H.; Li, J.; Chen, X.; Tao, Z. A knowledge-based approach for estimating the distribution of urban mixed land use. Int. J. Digit. Earth 2023, 16, 965–987. [Google Scholar] [CrossRef]
Disclaimer/Publisher’s Note: The statements, opinions and data contained in all publications are solely those of the individual author(s) and contributor(s) and not of MDPI and/or the editor(s). MDPI and/or the editor(s) disclaim responsibility for any injury to people or property resulting from any ideas, methods, instructions or products referred to in the content. |
© 2025 by the authors. Licensee MDPI, Basel, Switzerland. This article is an open access article distributed under the terms and conditions of the Creative Commons Attribution (CC BY) license (https://creativecommons.org/licenses/by/4.0/).