
Importance of Using Modern Regression Analysis for Response Surface Models in Science and Technology


Abstract
1. Introduction
2. Materials and Methods
2.1. Data Sources for the Equations of the Response Surface Methodology
2.2. Model Building of the Response Surface Methodology
2.2.1. The Assumptions Involved in Regression Analysis
- The overfitting or underfitting of the models;
- The non-normal condition of the datasets;
- Heterogeneous variance;
- Some outliers in the data;
- Multicollinearity.
2.2.2. Establishment of the Model
- Fit the complete model, which includes all variables.
- Perform a thorough analysis of this model.
- Transform the response (yi) or some variables (xi) if necessary.
- Use the t-test or F-test on these individual variables.
- Check the adequacy of the RSM model.
2.3. The Three Methods of Sequential Variable Selection
- 1.
- Forward selection
- 2.
- Stepwise regression
- 3.
- Backward elimination
- The procedures for backward elimination are as follows:
- a.
- Fit all variables for the regression equation. Determine the t-value and p-value for each variable in this model [58].
- b.
- Focus on the variable with the lowest observed t-values and its p-value.
- c.
- Compare the p-value with a preselected significance level, usually p < 0.05.
- d.
- Remove the variable if its p-value exceeds the preselected value [58].
- e.
- Recompute the regression equation for the remaining variables and find the variable with the lowest t-value and highest p-value.
- f.
- Repeat the backward elimination procedures of c, d, and e.
- g.
- If no variable is dropped, the procedure ends. The regression model’s selection consists of all remaining variables.
- h.
- Perform the influential data point test, and the normality and constant variance tests.
2.4. The Criteria for the Evaluation of RSM Equations
- R-squared
- 2.
- Adjustable R2
- 3.
- Standard error of the estimated value, s
- 4.
- t-value
- 5.
- p-value
- 6.
- PRESS, the Predicted Residual Error Sum of Squares
- 7.
- Normality test
- 8.
- Constant variance test
- 9.
- Influential data point
- a.
- Externally studentized residuals, ti
- b.
- DFFITSi
- c.
- Cook’s distance,
2.5. The Meaning of the F-Test of the ANOVA Table
2.6. The Effect of the Sampling Number
- Snee [68]
- 2.
- Green [69]
- 3.
- Khamis and Kepler [70]
- 4.
- Tabachnick and Fidell [71]
- 5.
- Zaarour [72]where p is the number of parameters.n ≥ 10p + 20
3. Results
3.1. Two Variables
3.1.1. Extrusion Process for Producing High-Antioxidant Instant Amaranth Flour
- The yorac response
- 2.
- The ywsi response
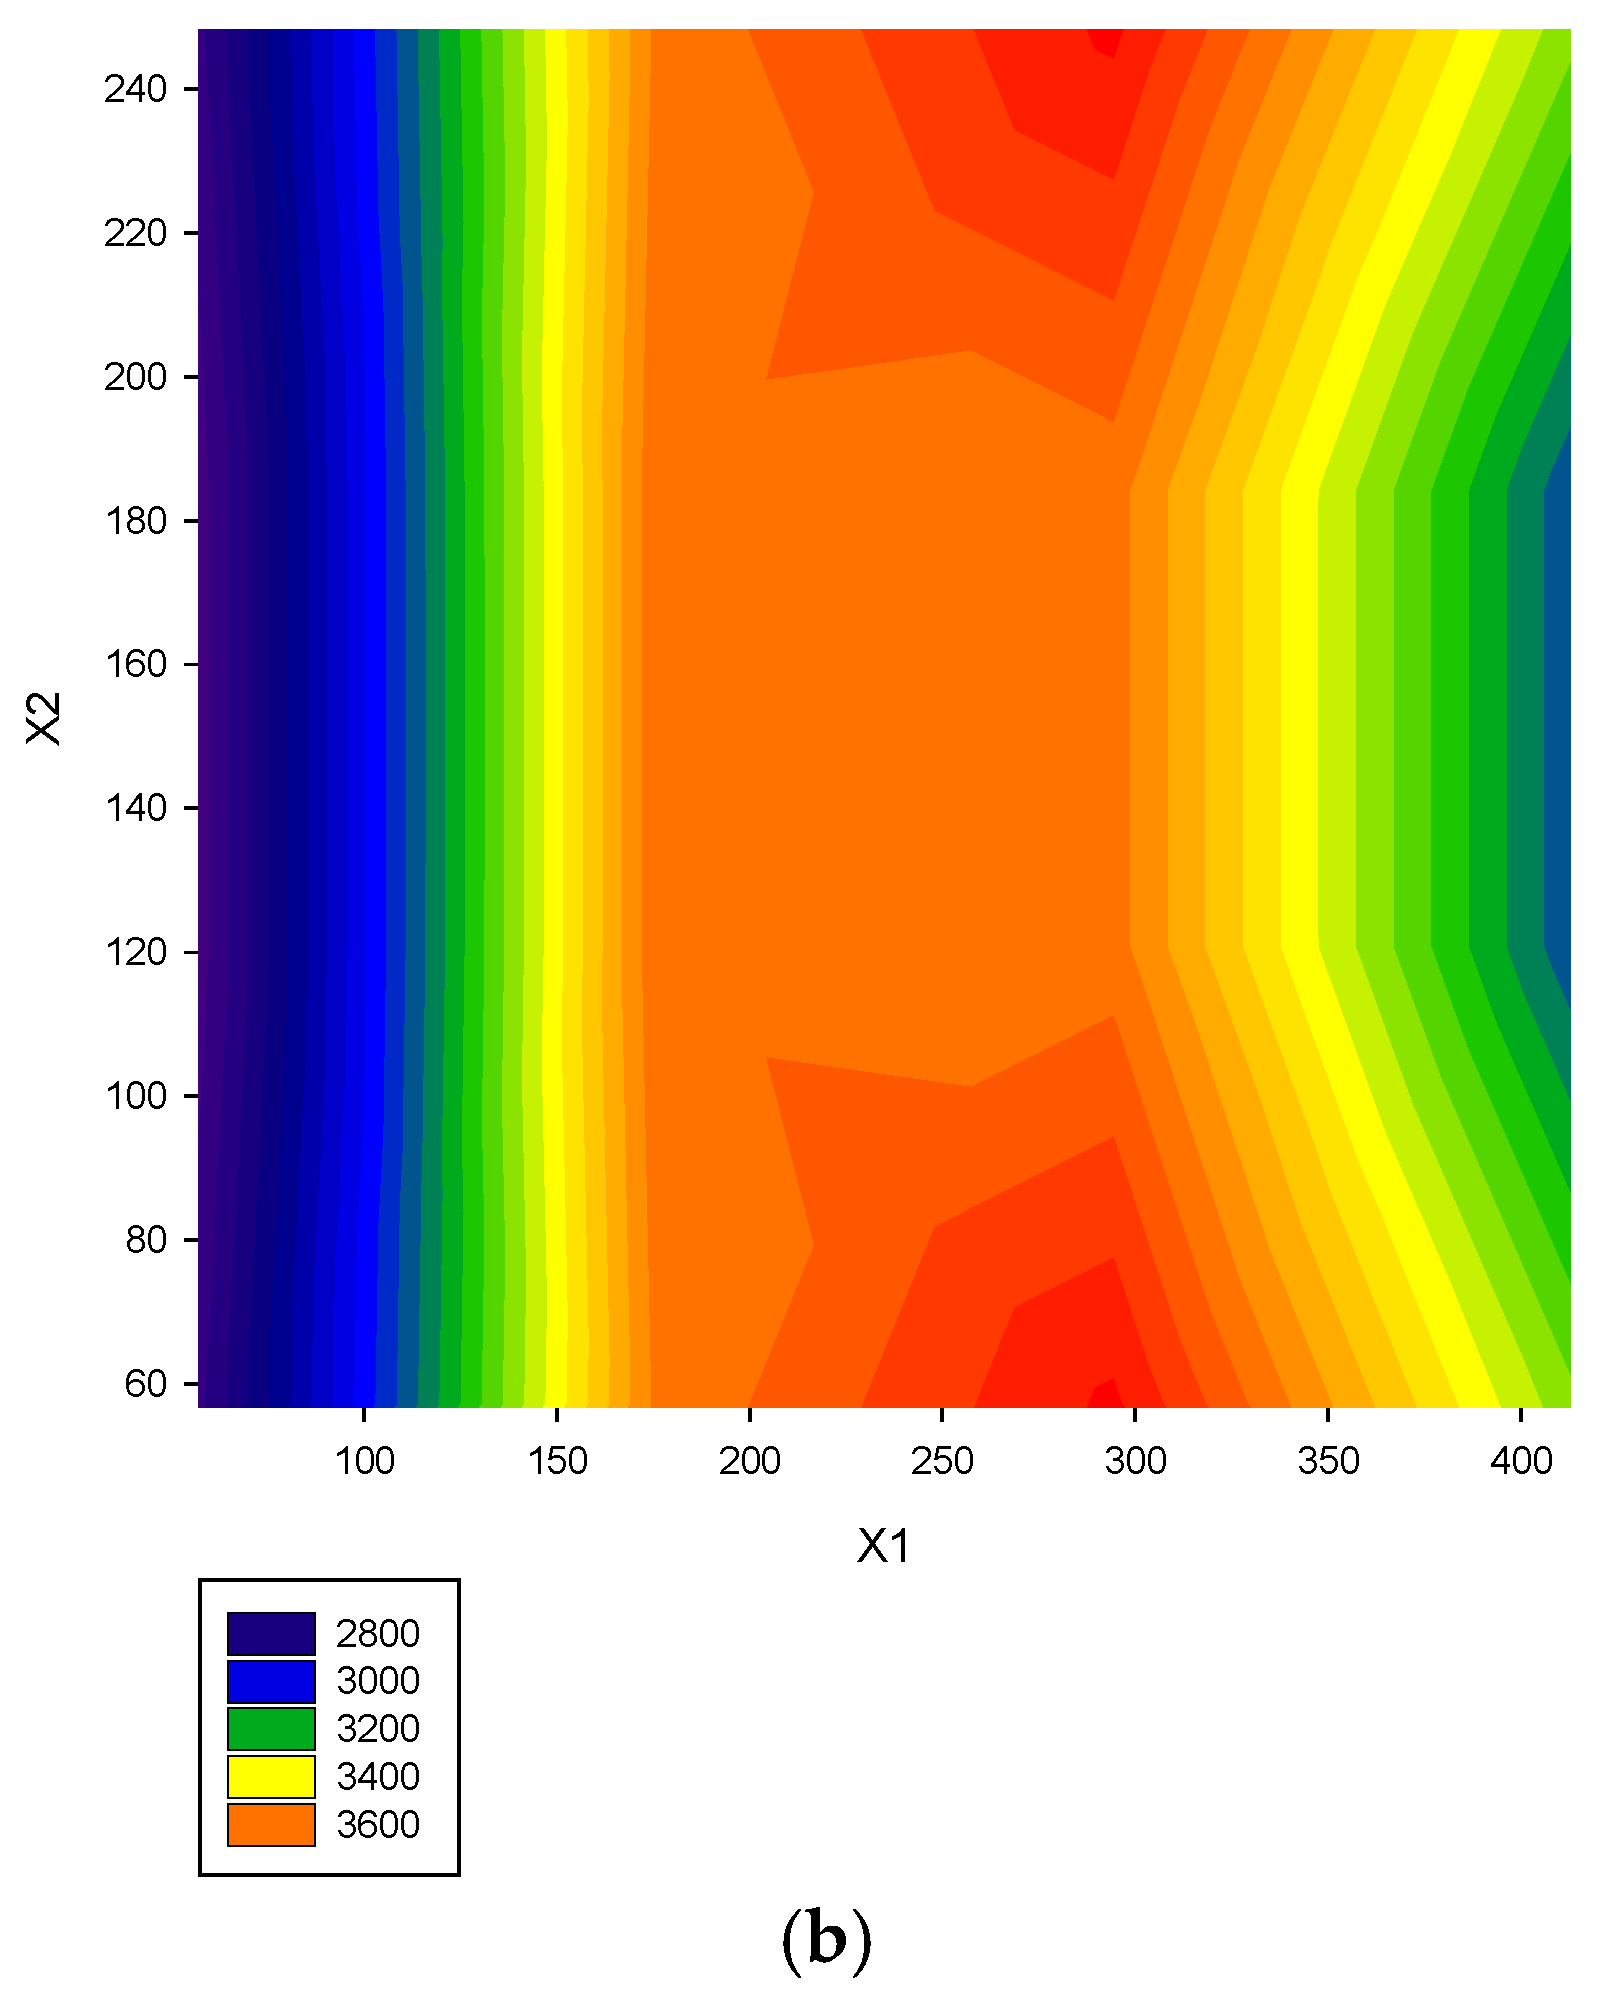
3.1.2. Compressive Strength of Rubberized Concrete
3.1.3. Poly-Cornstarch-Blended Biodegradable
3.1.4. The Evaluation Results of the Other Literature with Two Variables
3.2. Three Variables
3.2.1. Extruded African Breadfruit–Corn–Soy
3.2.2. Extraction of Bioactive Components from Defatted Marigold Residue
3.2.3. Corn Extrudate Fortified with Yam
- yBD, bulk density
- 2.
- yRER radial expansion ratio
- 3.
- yWAI, water adsorption index
- 4.
- yHD, hardness
3.2.4. The Adequate Equations of the RSM in the Other Literature
3.3. Four Variables
3.3.1. Haskap Extract and Tannic Acid
3.3.2. Microencapsulation of Seed Oil
3.3.3. Extraction of Total Phenolic and Flavonoid Content
3.3.4. The Regression Results of the Other Literature
3.4. Five Variables
4. Discussion
- 1.
- Training in the modern regression techniqueReceiving regression analysis training could enhance researchers’ ability to propose adequate RSM equations
- 2.
- The backward elimination technique has been proven helpful for sequential variable selection. This method could be incorporated into commercial software to help researchers establish an adequate RSM equation.
- 3.
- Increasing the sample numbers to correspond to the minimum sample requirement is very important. This could enhance the power of the statistical test. Three replicates for one experiment run are recommended. All the data points with these replicates could be used to check the influential data point and decide whether it is an outlier or an influential point.
5. Conclusions
Supplementary Materials
Author Contributions
Funding
Data Availability Statement
Acknowledgments
Conflicts of Interest
Appendix A
Appendix A.1. The Procedure to Evaluate the Adequate Equation of the y28D Response (28-Day Compression) [30]
Appendix A.2. The Selection of Adequate Variables for yTIA [33]
References
- Myers, R.H.; Montgomery, D.C.; Anderson-Cook, C.M. Response Surface Methodology: Process and Product Optimization Using Designed Experiments; John Wiley & Sons: Hoboken, NJ, USA, 2016. [Google Scholar]
- Baş, D.; Boyacı, İ.H. Modeling and optimization I: Usability of response surface methodology. J. Food Eng. 2007, 78, 836–845. [Google Scholar] [CrossRef]
- Asoo, H.R.; Alakali, J.S.; Ikya, J.K.; Yusufu, M.I. Historical background of RSM. In Response Surface Methods-Theory, Applications and Optimization Techniques; IntechOpen: London, UK, 2024. [Google Scholar]
- Bruns, R.E.; Scarminio, I.S.; de Barros Neto, B. Statistical Design-Chemometrics; Elsevier: Amsterdam, The Netherlands, 2006. [Google Scholar]
- Bezerra, M.A.; Ferreira, S.L.C.; Novaes, C.G.; Dos Santos, A.M.P.; Valasques, G.S.; da Mata Cerqueira, U.M.F.; dos Santos Alves, J.P. Simultaneous optimization of multiple responses and its application in Analytical Chemistry—A review. Talanta 2019, 194, 941–959. [Google Scholar] [CrossRef] [PubMed]
- Dejaegher, B.; Vander Heyden, Y. Experimental designs and their recent advances in set-up, data interpretation, and analytical applications. J. Pharm. Biomed. Anal. 2011, 56, 141–158. [Google Scholar] [CrossRef] [PubMed]
- Yolmeh, M.; Jafari, S.M. Applications of response surface methodology in the food industry processes. Food Bioprocess Technol. 2017, 10, 413–433. [Google Scholar] [CrossRef]
- De Oliveira, L.G.; de Paiva, A.P.; Balestrassi, P.P.; Ferreira, J.R.; da Costa, S.C.; da Silva Campos, P.H. Response surface methodology for advanced manufacturing technology optimization: Theoretical fundamentals, practical guidelines, and survey literature review. Int. J. Adv. Manuf. Technol. 2019, 104, 1785–1837. [Google Scholar] [CrossRef]
- Szpisják-Gulyás, N.; Al-Tayawi, A.N.; Horváth, Z.H.; László, Z.; Kertész, S.; Hodúr, C. Methods for experimental design, central composite design and the Box–Behnken design, to optimise operational parameters: A review. Acta Aliment. 2023, 52, 521–537. [Google Scholar] [CrossRef]
- Olabinjo, O.O. Response surface techniques as an inevitable tool in optimization process. In Response Surface Methods-Theory, Applications and Optimization Techniques; IntechOpen: London, UK, 2024. [Google Scholar]
- Meloun, M.; Militký, J. Detection of single influential points in OLS regression model building. Anal. Chim. Acta 2001, 439, 169–191. [Google Scholar] [CrossRef]
- Bhattacharya, S. Central composite design for response surface methodology and its application in pharmacy. In Response Surface Methodology in Engineering Science; IntechOpen: London, UK, 2021. [Google Scholar]
- Anderson, M.J.; Whitcomb, P.J. RSM Simplified: Optimizing Processes Using Response Surface Methods for Design of Experiments; Productivity Press: New York, NY, USA, 2016. [Google Scholar]
- Rodrigues, A.C. Response surface analysis: A tutorial for examining linear and curvilinear effects. Rev. Adm. Contemp. 2021, 25, e200293. [Google Scholar] [CrossRef]
- Reza, A.; Chen, L.; Mao, X. Response surface methodology for process optimization in livestock wastewater treatment: A review. Heliyon 2024, 10, e30326. [Google Scholar] [CrossRef]
- Bezerra, M.A.; Santelli, R.E.; Oliveira, E.P.; Villar, L.S.; Escaleira, L.A. Response surface methodology (RSM) as a tool for optimization in analytical chemistry. Talanta 2008, 76, 965–977. [Google Scholar] [CrossRef]
- Nwabueze, T.U. Basic steps in adapting response surface methodology as mathematical modelling for bioprocess optimisation in the food systems. Int. J. Food Sci. Technol. 2010, 45, 1768–1776. [Google Scholar] [CrossRef]
- Nwabueze, T.U.; Iwe, M.O. Residence time distribution (RTD) in a single screw extrusion of African breadfruit mixtures. Food Bioprocess Technol. 2010, 3, 135–145. [Google Scholar] [CrossRef]
- Khuri, A.I. Response surface methodology and its applications in agricultural and food sciences. Biom. Biostat. Int. J. 2017, 5, 155–163. [Google Scholar] [CrossRef]
- Weremfo, A.; Abassah-Oppong, S.; Adulley, F.; Dabie, K.; Seidu-Larry, S. Response surface methodology as a tool to optimize the extraction of bioactive compounds from plant sources. J. Sci. Food Agric. 2023, 103, 26–36. [Google Scholar] [CrossRef]
- Madamba, P.S. The response surface methodology: An application to optimize dehydration operations of selected agricultural crops. LWT—Food Sci. Technol. 2002, 35, 584–592. [Google Scholar] [CrossRef]
- Koç, B.; Kaymak-Ertekin, F. Response surface methodology and food processing applications. Gida J. Food 2010, 35, 63–70. [Google Scholar]
- Said, K.A.M.; Amin, M.A.M. Overview on the response surface methodology (RSM) in extraction processes. J. Appl. Sci. Process Eng. 2015, 2, 8–17. [Google Scholar]
- Malekjani, N.; Jafari, S.M. Food process modeling and optimization by response surface methodology (RSM). In Mathematical and Statistical Applications in Food Engineering; CRC Press: Boca Raton, FL, USA, 2020; pp. 181–203. [Google Scholar]
- Kidane, S.W. Application of response surface methodology in food process modeling and optimization. In Response Surface Methodology in Engineering Science; IntechOpen: London, UK, 2021. [Google Scholar]
- Tirado-Kulieva, V.A.; Sánchez-Chero, M.; Yarlequé, M.; Aguilar, G.F.V.; Carrión-Barco, G.; Santa Cruz, A.G.Y. An overview on the use of response surface methodology to model and optimize extraction processes in the food industry. Curr. Res. Nutr. Food Sci. 2021, 9, 745–754. [Google Scholar] [CrossRef]
- Istiqomah, A.; Saputra, O.A.; Firdaus, M.; Kusumaningsih, T. Response Surface Methodology as an Excellent Tool for Optimizing Sustainable Food Packaging: A Review. J. Biosyst. Eng. 2024, 49, 434–452. [Google Scholar] [CrossRef]
- Chen, Y.D.; Peng, J.; Lui, W.B. Composition optimization of poly (vinyl alcohol)-/cornstarch-blended biodegradable composite using response surface methodology. J. Appl. Polym. Sci. 2009, 113, 258–264. [Google Scholar] [CrossRef]
- Milán-Carrillo, J.; Montoya-Rodríguez, A.; Gutiérrez-Dorado, R.; Perales-Sánchez, X.; Reyes-Moreno, C. Optimization of extrusion process for producing high antioxidant instant amaranth (Amaranthus hypochondriacus L.) flour using response surface methodology. Appl. Math. 2012, 3, 1516–1525. [Google Scholar] [CrossRef]
- Sinkhonde, D.; Onchiri, R.O.; Oyawa, W.O.; Mwero, J.N. Response surface methodology-based optimisation of cost and compressive strength of rubberised concrete incorporating burnt clay brick powder. Heliyon 2021, 7, e08565. [Google Scholar] [CrossRef] [PubMed]
- Diemer, E.; Chadni, M.; Grimi, N.; Ioannou, I. Optimization of the accelerated solvent extraction of caffeoylquinic acids from forced chicory roots and antioxidant activity of the resulting extracts. Foods 2022, 11, 3214. [Google Scholar] [CrossRef] [PubMed]
- Adeyanju, J.A.; Abioye, A.O.; Adekunle, A.A.; Ibrahim, T.H.; Oloyede, A.A.; Akinwusi, D.E. Process optimization of deep-fat frying variables and effects on some quality characteristics of akara Ogbomoso snacks produced from cowpea. Food Res. 2024, 8, 502–507. [Google Scholar] [CrossRef]
- Nwabueze, T.U. Effect of process variables on trypsin inhibitor activity (TIA), phytic acid and tannin content of extruded African breadfruit-corn-soy mixtures: A response surface analysis. LWT—Food Sci. Technol. 2007, 40, 21–29. [Google Scholar] [CrossRef]
- Bimakr, M.; Rahman, R.A.; Ganjloo, A.; Taip, F.S.; Salleh, L.M.; Sarker, M.Z.I. Optimization of supercritical carbon dioxide extraction of bioactive flavonoid compounds from spearmint (Mentha spicata L.) leaves by using response surface methodology. Food Bioprocess Technol. 2012, 5, 912–920. [Google Scholar] [CrossRef]
- Chen, X.; Xu, F.; Qin, W.; Ma, L.; Zheng, Y. Optimization of enzymatic clarification of green asparagus juice using response surface methodology. J. Food Sci. 2012, 77, C665–C670. [Google Scholar] [CrossRef]
- Gong, Y.; Hou, Z.; Gao, Y.; Xue, Y.; Liu, X.; Liu, G. Optimization of extraction parameters of bioactive components from defatted marigold (Tagetes erecta L.) residue using response surface methodology. Food Bioprod. Process. 2012, 90, 9–16. [Google Scholar] [CrossRef]
- Chiu, H.W.; Peng, J.C.; Tsai, S.J.; Tsay, J.R.; Lui, W.B. Process optimization by response surface methodology and characteristics investigation of corn extrudate fortified with yam (Dioscorea alata L.). Food Bioprocess Technol. 2013, 6, 1494–1504. [Google Scholar] [CrossRef]
- Idrus, N.F.M.; Febrianto, N.A.; Zzaman, W.; Cuang, T.E.; Yang, T.A. Optimization of the aqueous extraction of virgin coconut oil by response surface methodology. Food Sci. Technol. Res. 2013, 19, 729–737. [Google Scholar] [CrossRef]
- Hong, F.L.; Peng, J.; Lui, W.B.; Chiu, H.W. Investigation on the physicochemical properties of pumpkin flour (Cucurbita moschata) blend with corn by single- screw extruder. J. Food Process. Preserv. 2015, 39, 1342–1354. [Google Scholar] [CrossRef]
- Wu, C.Y.; Lui, W.B.; Peng, J. Optimization of extrusion variables and maleic anhydride content on biopolymer blends based on poly (hydroxybutyrate-co-hydroxyvalerate)/poly (vinyl acetate) with tapioca starch. Polymers 2018, 10, 827. [Google Scholar] [CrossRef] [PubMed]
- Yu, Y.; Wei, R.; Jia, X.; Zhang, X.; Liu, H.; Xu, B.; Xu, B. Preparation of piper nigrum microcapsules by spray drying and optimization with response surface methodology. J. Oleo Sci. 2022, 71, 1789–1797. [Google Scholar] [CrossRef]
- Tshizanga, N.; Aransiola, E.F.; Oyekola, O. Optimisation of biodiesel production from waste vegetable oil and eggshell ash. S. Afr. J. Chem. Eng. 2017, 23, 145–156. [Google Scholar] [CrossRef]
- Wu, L.; Yang, Z.; Zhang, Y.; Li, L.; Tan, C.; Pan, L.; Gao, H. Optimization of the cryoprotectants for direct vat set starters in Sichuan paocai using response surface methodology. Foods 2025, 14, 157. [Google Scholar] [CrossRef]
- Savić, I.M.; Savić Gajić, I.M. Extraction and characterization of antioxidants and cellulose from green walnut husks. Foods 2025, 14, 409. [Google Scholar] [CrossRef]
- Ahn, J.H.; Kim, Y.P.; Lee, Y.M.; Seo, E.M.; Lee, K.W.; Kim, H.S. Optimization of microencapsulation of seed oil by response surface methodology. Food Chem. 2008, 107, 98–105. [Google Scholar] [CrossRef]
- Lee, Y.K.; Ahn, S.I.; Kwak, H.S. Optimizing microencapsulation of peanut sprout extract by response surface methodology. Food Hydrocoll. 2013, 30, 307–314. [Google Scholar] [CrossRef]
- Yu, M.; Liu, H.; Yang, Y.; Shi, A.; Liu, L.; Hu, H.; Wang, Q.; Yu, H.; Wang, X. Optimising germinated conditions to enhance yield of resveratrol content in peanut sprout using response surface methodology. Int. J. Food Sci. Technol. 2016, 51, 1754–1761. [Google Scholar]
- Javanbakht, V.; Ghoreishi, S.M. Application of response surface methodology for optimization of lead removal from an aqueous solution by a novel superparamagnetic nanocomposite. Adsorpt. Sci. Technol. 2017, 35, 241–260. [Google Scholar] [CrossRef]
- Yemiş, P.G.; Yemiş, O.; Öztürk, A. Optimization of haskap extract and tannic acid combined with mild heat treatment: A predictive study on the inhibition of cronobacter sakazakii. Foods 2025, 14, 562. [Google Scholar] [CrossRef] [PubMed]
- Vega, E.N.; González-Zamorano, L.; Cebadera, E.; Barros, L.; da Silveira, T.F.; Vidal-Diez de Ulzurrun, G.; Tardio, J.; Lazaro, A.; Camara, M.; Fernansez-Ruiz, V.; et al. Wild Myrtus communis L. Fruit by-product as a promising source of a new natural food colourant: Optimization of the extraction process and chemical characterization. Foods 2025, 14, 520. [Google Scholar] [CrossRef] [PubMed]
- Hiranpradith, V.; Therdthai, N.; Soontrunnarudrungsri, A.; Rungsuriyawiboon, O. Optimisation of ultrasound-assisted extraction of total phenolics and flavonoids content from centella asiatica. Foods 2025, 14, 291. [Google Scholar] [CrossRef] [PubMed]
- Açıkel, Ü.; Erşan, M.; Açıkel, Y.S. Optimization of critical medium components using response surface methodology for lipase production by Rhizopus delemar. Food Bioprod. Process. 2010, 88, 31–39. [Google Scholar] [CrossRef]
- Myers, R.H. Classical and Modern Regression with Applications, 2nd ed.; Duxbury Press: Monterey, CA, USA, 1990. [Google Scholar]
- Ryan, T.P. Modern Regression Methods; John Wiley & Sons: Hoboken, NJ, USA, 2008. [Google Scholar]
- Wilcox, R.R.; Keselman, H.J. Modern regression methods that can substantially increase power and provide a more accurate understanding of associations. Eur. J. Personal. 2012, 26, 165–174. [Google Scholar] [CrossRef]
- Marinoiu, C. Classic and modern in regression modelling. Econ. Insights—Trends Chall. 2017, 69, 41–50. [Google Scholar]
- Montgomery, D.C.; Peck, E.A.; Vining, G.G. Introduction to Linear Regression Analysis; John Wiley & Sons: Hoboken, NJ, USA, 2021. [Google Scholar]
- Allen, M.P. Understanding Regression Analysis; Springer Science & Business Media: Berlin/Heidelberg, Germany, 2004. [Google Scholar]
- Berger, D.E. Introduction to Multiple Regression; Claremont Graduate University: Claremont, CA, USA, 2008. [Google Scholar]
- Rawlings, J.O.; Pantula, S.G.; Dickey, D. Applied Regression Analysis; Springer: New York, NY, USA, 1998. [Google Scholar]
- Dielman, T.E. Applied Regression Analysis for Business and Economics, 4th ed.; Duxbury/Thomson Learning: Pacific Grove, CA, USA, 2005. [Google Scholar]
- Mendenhall, W.; Sincich, T. Regression Analysis. A Second Course in Statistics, 12th ed.; Prentice Hall: Hoboken, NJ, USA, 2012. [Google Scholar]
- Chowdhury, M.Z.I.; Turin, T.C. Variable selection strategies and its importance in clinical prediction modelling. Fam. Med. Community Health 2020, 8, e000262. [Google Scholar] [CrossRef]
- Rowley, E.K. Comparison of Variable Selection Methods. Ph.D. Thesis, The University of North Carolina at Chapel Hill, Chapel Hill, NC, USA, 2019. [Google Scholar]
- Kelley, K.; Maxwell, S.E. Sample size for multiple regression: Obtaining regression coefficients that are accurate, not simply significant. Psychol. Methods 2003, 8, 305–321. [Google Scholar] [CrossRef]
- Bonett, D.G.; Wright, T.A. Sample size requirements for multiple regression interval estimation. J. Organ. Behav. 2011, 32, 822–830. [Google Scholar] [CrossRef]
- Hanley, J.A. Simple and multiple linear regression: Sample size considerations. J. Clin. Epidemiol. 2016, 79, 112–119. [Google Scholar] [CrossRef] [PubMed]
- Snee, R.D. Validation of regression models: Methods and examples. Technometrics 1977, 19, 415–428. [Google Scholar] [CrossRef]
- Green, S.B. How many subjects does it take to do a regression analysis? Multivar. Behav. Res. 1991, 26, 499–510. [Google Scholar] [CrossRef] [PubMed]
- Khamis, H.J.; Kepler, M. Sample size in multiple regression: 20+ 5k. J. Appl. Stat. Sci. 2010, 17, 505–517. [Google Scholar]
- Tabachnick, B.G.; Fidell, L.S. Using Multivariate Statistics; Allyn & Bacon/Pearson Education: Boston, MA, USA, 2012. [Google Scholar]
- Zaarour, N. A simple relationship between the sample size and the number of independent variables. J. Bus. Econ. Stat. 2024, 2, 1–22. [Google Scholar]
- Yang, K.; Tu, J.; Chen, T. Homoscedasticity: An overlooked critical assumption for linear regression. Gen. Psychiatry 2019, 32, e100148. [Google Scholar] [CrossRef]


| Study | Objects | No. of Data | Software | Model Evaluation | Criteria of Parameter Selection | Report Model | Plots |
|---|---|---|---|---|---|---|---|
| I. Two variables | |||||||
| 1. Chen et al. [28] | Poly-cornstarch-blended composite | 13 | Minitab Ver. 14.2 | R2, R2adj s | t-value, p-value | yWSI = f (x1, x2, x12) yWAI = f(x1, x2, x12) yML = f(x1, x2, x12, x1x2) | Contour plots, Response surface plot |
| 2. Milan-carrillo et al. [29] | Amaranth flour | 13 | Design Expert Ver. 7.0 | R2 | p-value, Stepwise regression | Complete model | Contour plots, Response surface plot |
| 3. Sinkhonde et al. [30] | Rubberized concrete with burnt clay brick powder | 13 | Not reported | Lack of fit | F-value, p-value | Complete model | Contour plots, Response surface plot |
| 4. Diemer et al. [31] | Forced chicory roots | 13 | MOODE Ver. 12.0 | R2, R2adj | t-value, p-value | y5-CQA = f (x1, x2, x12) | Contour plots |
| 5. Adeyanju et al. [32] | Akara Ogbomoso Snacks | 13 | Design Expert Ver. 6.0.1 | R2 | p-value | yMC = Complete model yOC = f(x1, x2) yΔE = f(x1, x2) yBF = Complete model yS = f(x1, x2) | Contour plots, Response surface plot |
| II. Three variables | |||||||
| 6. Nwabueze [33] | African breadfruit–corn–soy mixtures | 15 | Statistica | R2 | p-value | YTIA= f(x3, x12) Yphytic acid = f(x12) Ytan = f(x32) | Response surface plot |
| 7. Bimark et al. [34] | Bioactive flavonoid compounds | 20 | Minitab Ver.14 | Lack of fit, R2, R2adj | p-value | Complete model | Response surface plot |
| 8. Chen et al. [35] | Green asparagus juice | 20 | Design Expert, version not reported | R2, R2adj Lack of fit | p-value | Complete model | Contour plots, Response surface plot |
| 9. Gong et al. [36] | Defatted marigold residue | 20 | Microsoft Excel | R2, R2adj Lack of fit | p-value, Stepwise regression | Complete model | Response surface plot |
| 10. Chiu et al. [37] | Corn extruded with yam | 15 | Minitab 16 | R2, R2adj Lack of fit | p-value | Not reported | Response surface plot |
| 11. Idrus et al. [38] | Virgin coconut oil | 17 | Design Expert Ver. 8.0 | R2, R2adj Lack of fit | p-value | Yyield = f (x1, x2, x12, x22, x32) YFFA = f(x1, x12) YAV = f (x2, x22) YPOV = f(x1, x2, x3, x1x3, x2x3, x12, x22, x32) | Contour plots, Response surface plot |
| 12. Hong et al. [39] | Pumpkin floor blends with corn | 15 | Design Expert Ver. 7.0 | R2, R2adj Lack of fit | p-value | Not reported, contour plot and response surface plots produced by complete model | Contour plots, Response surface plot |
| 13. Wu et al. [40] | Biopolymer blend with Tapioca starch | 15 | Design Expert Ver.7.0 | R2, R2adj, Lack of fit | p-value | Complete model | Contour plots, Response surface plot |
| 14. Yu et al. [41] | Piper nigrum microcapsules | 17 | Design Expert, version not reported | R2, R2adj, Lack of fit | p-value | Complete model | Not reported |
| 15. Tshizanga et al. [42] | Waste vegetable oil and eggshells | 20 | Design Expect Ver. 9. | R2, R2adj, PRESS | F-value | Complete model | Contour plots, Response surface plot |
| 16. Wu et al. [43] | Sichuan paocai | 17 | SPSS Ver.22.0 | Lack of fit | p-value, Confidence interval (CI) | Complete model | Response surface plot |
| 17. Savik and Gajic [44] | Green walnut husks | 17 | Design Expert 13.0.1.0 | R2, R2adj | F-value, p-value | Complete model | Contour plots, Response surface plot |
| III. Four variables | |||||||
| 18. Ahn et al. [45] | Seed oil | 31 | MINITAB Release 14 | R2 | t-value, p-value | YEFF = f(x1, x2, x3, x12, x22) | Response surface plot |
| 19. Lee et al. [46] | Peanut sprout | 31 | SAS Ver. 9.0 | Not reported | t-value, p-value | Complete model | Contour plots, Response surface plot |
| 20. Yu et al. [47] | Peanut sprout | 29 | Design Expert Ver. 8.05b | R2, Lack of fit | F-value, p-value | Complete model | Contour plots, Response surface plot |
| 21. Javanbakht and Ghoreishi [48] | Lead removal from an aqueous solution | 30 | Design Expert Ver. 7.0.0 | R2, R2adj, R2pred | F-value, p-value | Complete model | Contour plots, Response surface plot |
| 22. Yemis et al. [49] | Haskap extract and tannic acid | 28 | Design Expert | R2, R2adj, PRESS, Lack of fit | F-value, p-value, Backward elimination | ySI = f(x1, x2, x3, x4, x1x2, x1x3, x12, x32, x42) | Contour plots, Response surface plot |
| 23. Vega et al. [50] | Fruit by-product | 60 | Mathematica Ver.11.1.1.0 | R2, R2adj | Not reported | Complete model | Contour plots, Response surface plot |
| 24. Hiranpradith et al. [51] | Centella asiatica | 30 | Design Expert Ver. 13.0 | R2, R2adj, R2pred | t-value | yTPC = f(x1, x2, x4, x22, x42), yTFC = f(x1, x2, x3, x4, x1x4, x12) | Contour plots, Response surface plot |
| IV. Five variables | |||||||
| 25. Acikel et al. [52] | Rhizopus delemar | 46 | Design Expert Ver. 7.0 | R2, R2adj | Not reported | Complete model | Contour plots, Response surface plot |
| Source | df | SeqSS | MS | F-Value | p-Value |
|---|---|---|---|---|---|
| Regression (Mean) | dfm | SSm | SSm/dfm | ||
| Linear | dfl | SSl | SSi/dfl | Lf | Lp |
| Square | dfs | SSs | SSs/dfs | Sf | Sp |
| Interaction | dfi | SSi | SSi/dfi | If | IP |
| Residual Error | dfe | SSe | SSe/dfe | ||
| Total | SSt |
| Coefficient | Estimated | Standard | Standard | |||
|---|---|---|---|---|---|---|
| Value | Error | t-Value | p-Value | Coefficient | VIF | |
| Constant | 1481.845 | 571.865 | 2.591 | 0.036 | ||
| x1 | 24.670 | 5.362 | 4.601 | 0.002 | 8.922 | 186.628 |
| x2 | −0.490 | 4.456 | −0.110 | 0.916 | −0.108 | 48.234 |
| x12 | −0.0262 | 0.00555 | −4.730 | 0.002 | −4.705 | 49.088 |
| x22 | 0.0217 | 0.0105 | 2.065 | 0.078 | 1.498 | 26.095 |
| x1x2 | −0.0725 | 0.0302 | −2.396 | 0.048 | −4.320 | 161.328 |
| Source | Purpose | Reported Equations | Contour and Response Surface Plots | Adequate Equations | Normality Test | Constant Variance Test | Influential Data |
|---|---|---|---|---|---|---|---|
| Diemer et al. [31] | Extraction of caffeoylquinic acid x1: temperature x2: ethanol (%) | y5-CQA = f (x1, x2, x22) | Curved surface | y5-CQA = f (x1, x2, x22) | Passed | Passed | 1st |
| Adeyanju et al. [32] | Akara ogbonoso snacks | YMC (moisture) = f (x1, x2, x12, x22, x1x2) | Curved surface | YMC = f (x1, x2, x22) | Passed | Passed | No |
| x1: temperature x2: time | YOC (oil content) = f (x1, x2) | Plane | YOC = f (x1, x2) | Passed | Passed | No | |
| yΔE = f (x1, x2) | Plane | yΔE = f (x2) | Passed | Passed | No | ||
| yBF = f (x1, x2, x12, x22) | Curved surface | yBF = f (x2, x22) | Passed | Passed | No | ||
| yS = f (x1, x2) | Plane | YS = f (x1, x2) | passed | passed | No |
| Estimated Values | Standard Error | p-Value | |
|---|---|---|---|
| −2.980433 | 5.183862 | ||
| 0.107709 | 0.069684 | 0.1445 | |
| −0.174901 | 0.309534 | 0.5810 | |
| 0.071086 | 0.037511 | 0.0789 * | |
| −0.000427 | 0.000157 | 0.0168 ** | |
| −0.001111 | 0.002924 | 0.7098 | |
| −0.000500 | 0.000483 | 0.2347 | |
| 0.004168 | 0.009179 | 0.6567 | |
| −0.00608 | 0.001728 | 0.7302 | |
| −0.000135 | 0.000115 | 0.5745 |
| Source | Purpose | Reported Equations | Contour and Response Surface Plots | Adequate Equations | Normality Test | Constant Variance Test | Influential Data |
|---|---|---|---|---|---|---|---|
| Bimakv et al. [34] | CO2 extraction of bioactive flavonoid compounds x1: temperature x2: pressure x3: flow rate | yER extract ratio = complete equation | Curved surface | Complete equation | Passed | Passed | 1st, 13th |
| Chen et al. [35] | Enzymatic clarification of asparagus juice | yclarity = f(x1, x2, x3, x2x3, x12, x22, x32) | Curved surface | yclarity = f(x1, x2, x3, x2x3, x12, x22, x32) | Passed | Passed | 8th, 9th |
| x1: temperature x2: pH x3: enzyme concentrations | yDPPH = f(x1, x3, x1x2, x1x3, x12, x22, x32) | Curved surface | yDPPH = f(x1, x2, x3, x1x2, x1x3, x12, x22, x32) | Failed (p = 0.001) | Passed | 16th | |
| Idrus et al. [38] | Extraction of virgin coconut oil | yyield = f(x1, x2, x12, x22, x32) | Curved surface | yyield = f(x1, x2, x3, x2x3, x12, x22, x32) | Passed | Passed | 13th |
| x1: coconut milk x2: fermentation time x3: refrigeration time | yFFA = f(x2, x12) | Curved surface | yFFA = f(x1, x2, x3, x12, x2x3) | Passed | Passed | 1st, 5th, 6th | |
| yAV = f(x2, x12) | Curved surface | yAV = f(x1, x2, x3, x2x3, x12) | Passed | Passed | No | ||
| yPOV = f(x1, x2, x3, x1x3, x2x3, x12, x22, x32) | Curved surface | yPOV = f(x1, x2, x3, x1x3, x2x3, x12, x22, x32) | Passed | Passed | 3rd, 6th, 12th, 15th | ||
| Hong et al. [39] | Pumpkin flour with corn | Not reported | yRER: Curved surface | yRER = f(x1, x3, x1x2) | Passed | Passed | 15th |
| x1: pumpkin x2: moisture x3: screw speed | yRER (radial expansion ratio) | yBD: Curved surface | yBD = f(x1, x2, x3, x12) | Passed | Passed | no | |
| yBD (bulk density) yWAI (water adsorption index) yHD (hardness) | yWAI: Curved surface | yWAI = f(x1, x2, x3, x12, x22, x32) | Passed | Passed | 3rd, 12th | ||
| yHD: Curved surface | yHD = f(x1, x2, x3, x12) | Passed | Passed | 8th | |||
| Wu et al. [40] | Maleic anhydride content in biopolymer blends | yTS (tensile strength) | yTS: Curved surface | yTS = f(x1, x2, x3, x1x2, x1x3, x2x3, x32) | Passed | Passed | 1st |
| x1: Tapioca starch content x2: maleic anhydride content x3: screen speed | yEL (Elongation) = complete equation | yEL: Curved surface | yEL = f(x1, x2, x3, x1x2, x2x3, x22, x32) | Passed | Passed | 2nd, 3rd, 10th, 7th, 11th | |
| yWA (water ability) = complete equation | yWA: Curved surface | yWA = f(x1, x2, x3, x1x2, x12, x22) | Failed (p = 0.02) | Passed | 2nd, 6th, 11th | ||
| Yu et al. [41] | Pipernigrum microcapsules x1: wall materials x2: wall concentration x3: air temperature | yEFF (efficiency) = complete equation | Not reported | yEFF = f(x1, x2, x3, x1x3, x2x3, x22, x32) | Passed | Failed (p = 0.044) | 11th |
| Tshizanga et al. [42] | Biodiesel production x1: temperature x2: oil ratio x3: catalyst loading | yBY (biodiesel yield) = complete equation | Curved surface | yBY = f(x2, x22) | Passed | Passed | no |
| Wu et al. [43] | Cryoprotectants for direct vat set starters x1: skim milk powder x2: sucrose x3: L-proline or glycerol | ySICC = complete equation | Curved surface | ySICC = f(x1, x2, x3, x2x3, x12, x32) | Passed | Passed | 2nd, 3rd, 6th, 7th, 10th, 11th |
| y61 = complete equation | Curved surface | y61 = f(x1, x2, x3, x2x3, x12, x22, x32) | Passed | Passed | 2nd, 3rd, 6th, 7th, 10th, 11th | ||
| Savik et al. [44] | Antioxidant cellulose from walnut husks x1: UAE time x2: temperature x3: MWP time | yTAC = complete equation | Curved surface | yTAC = f(x1, x2, x12) | Passed | Passed | No |
| Source | Purpose | Reported Equations | Contour and Response Surface Plots | Adequate Equations | Normality Test | Constant Variance Test | Influential Data |
|---|---|---|---|---|---|---|---|
| Lee et al. [46] | Microencapsulation of peanut sprout | Complete equation | curved surface | yyield = f(x1, x2, x4, x1x2) | Passed | Passed | 4th 17th 30th |
| Yu et al. [47] | Yield of resveratrol content in peanut sprout | Complete equation | curved surface | yYRC = f(x1, x2, x3, x4, x1x3, x22, x32) | Passed | Passed | 18th 19th |
| Javanbakht and Ghoreishi [48] | Lead removal from aqueous solution | Complete equation | curved surface | yLRC = f(x1, x2, x3, x4, x1x4, x22, x32) | Failed (p = 0.023) | Passed | 7th 23rd |
| Vega et al. [50] | Natural food colorants from wild fruits | Complete equation | curved surface | yTAC = f(x1, x2, x3, x1x3) | Failed (p = 0.011) | Passed | 30th 34th 46th |
| Issue | References |
|---|---|
| [29,30,36,37,39,40,43,44,46,47,48,52] |
| [28,51] |
| [31,33,35,38,45]. |
| [32,42] |
| [35,40,48,50,52] |
| [28,41,51] |
| [28,29,31,33,34,35,36,37,38,39,40,41,43,44,45,46,47,48,49,50,51,52] |
| [28,31,37,39,40,43,49]. |
Disclaimer/Publisher’s Note: The statements, opinions and data contained in all publications are solely those of the individual author(s) and contributor(s) and not of MDPI and/or the editor(s). MDPI and/or the editor(s) disclaim responsibility for any injury to people or property resulting from any ideas, methods, instructions or products referred to in the content. |
© 2025 by the authors. Licensee MDPI, Basel, Switzerland. This article is an open access article distributed under the terms and conditions of the Creative Commons Attribution (CC BY) license (https://creativecommons.org/licenses/by/4.0/).
Share and Cite
Chen, H.-Y.; Chen, C. Importance of Using Modern Regression Analysis for Response Surface Models in Science and Technology. Appl. Sci. 2025, 15, 7206. https://doi.org/10.3390/app15137206
Chen H-Y, Chen C. Importance of Using Modern Regression Analysis for Response Surface Models in Science and Technology. Applied Sciences. 2025; 15(13):7206. https://doi.org/10.3390/app15137206
Chicago/Turabian StyleChen, Hsuan-Yu, and Chiachung Chen. 2025. "Importance of Using Modern Regression Analysis for Response Surface Models in Science and Technology" Applied Sciences 15, no. 13: 7206. https://doi.org/10.3390/app15137206
APA StyleChen, H.-Y., & Chen, C. (2025). Importance of Using Modern Regression Analysis for Response Surface Models in Science and Technology. Applied Sciences, 15(13), 7206. https://doi.org/10.3390/app15137206