Article

A Deep Learning-Driven CAD for Breast Cancer Detection via Thermograms: A Compact Multi-Architecture Feature Strategy

by
Omneya Attallah
1,2
1
Department of Electronics and Communications Engineering, College of Engineering and Technology, Arab Academy for Science, Technology and Maritime Transport, Alexandria 21937, Egypt
2
Wearables, Biosensing, and Biosignal Processing Laboratory, Arab Academy for Science, Technology and Maritime Transport, Alexandria 21937, Egypt
Appl. Sci. 2025, 15(13), 7181; https://doi.org/10.3390/app15137181
Submission received: 29 April 2025 / Revised: 20 June 2025 / Accepted: 24 June 2025 / Published: 26 June 2025
(This article belongs to the Special Issue Application of Decision Support Systems in Biomedical Engineering)

Abstract

Breast cancer continues to be the most common malignancy among women worldwide, presenting a considerable public health issue. Mammography, though the gold standard for screening, has limitations that catalyzed the advancement of non-invasive, radiation-free alternatives, such as thermal imaging (thermography). This research introduces a novel computer-aided diagnosis (CAD) framework aimed at improving breast cancer detection via thermal imaging. The suggested framework mitigates the limitations of current CAD systems, which frequently utilize intricate convolutional neural network (CNN) structures and resource-intensive preprocessing, by incorporating streamlined CNN designs, transfer learning strategies, and multi-architecture ensemble methods. Features are primarily obtained from various layers of MobileNet, EfficientNetB0, and ShuffleNet architectures to assess the impact of individual layers on classification performance. Following that, feature transformation methods, such as discrete wavelet transform (DWT) and non-negative matrix factorization (NNMF), are employed to diminish feature dimensionality and enhance computational efficiency. Features from all layers of the three CNNs are subsequently incorporated, and the Minimum Redundancy Maximum Relevance (MRMR) algorithm is utilized to determine the most prominent features. Ultimately, support vector machine (SVM) classifiers are employed for classification purposes. The results indicate that integrating features from various CNNs and layers markedly improves performance, attaining a maximum accuracy of 99.4%. Furthermore, the combination of attributes from all three layers of the CNNs, in conjunction with NNMF, attained a maximum accuracy of 99.9% with merely 350 features. This CAD system demonstrates the efficacy of thermal imaging and multi-layer feature amalgamation to enhance non-invasive breast cancer diagnosis by reducing computational requirements through multi-layer feature integration and dimensionality reduction techniques.

1. Introduction

Breast cancer remains a major global health issue, primarily impacting women, with around 2.3 million cases recorded in 2020 and considerable mortality rates [1,2]. Healthcare practitioners utilize various diagnostic methods to identify and treat this disease, encompassing clinical assessments, self-screening, and sophisticated imaging technologies. Mammography is a key diagnostic technique that proficiently detects microscopic tissue alterations and structural irregularities, although it has limitations in visualizing dense breast tissue [3,4]. Alternative diagnostic modalities, including ultrasound and magnetic resonance imaging (MRI), provide further insights, each presenting distinct benefits and challenges in differentiating between benign and malignant conditions [5,6]. Tissue biopsy remains the most definitive testing method, offering cellular-level analysis despite its invasive characteristics and the necessity for specialized equipment and expertise [7]. Current research progressively emphasizes the creation of more holistic, patient-centered diagnostic protocols that incorporate other screening methods avoiding the limitations of present screening modalities.
In present medical examinations, infrared (IR) thermal imaging has emerged as a powerful non-invasive scanning technique that uses physiological thermal radiation from biological surfaces to illuminate fundamental physiological functions [8]. Thermography employs IR cameras to capture the thermal patterns of the breast. The variation in temperature on the breast surface can thus indicate the presence of a tumor [9]. The fundamental principle of IR image diagnosis is that uncontrolled cellular proliferation results in an elevated metabolic rate, necessitating increased blood flow compared to adjacent tissue. The excess heat produced is transmitted to the tissue adjacent to the tumor, resulting in a temperature increase on the breast surface. The temperature increase is detected through IR imaging to identify the tumor [10]. This diagnostic method shows significant promise in breast cancer screening, especially for individuals with dense breast tissue, providing a radiation-free, economical alternative to traditional imaging techniques such as MRI and mammography [11]. The non-invasive characteristics of the technique, along with its ability to identify thermal abnormalities prior to structural tissue alterations, establish IR thermography as a promising avenue for early diagnostic interventions, attracting increasing academic interest in its extensive clinical potential [12].
The present practice of medical diagnosis has been transformed by emerging artificial intelligence (AI) frameworks, particularly neural network structures, and advanced machine learning approaches, which have significantly surpassed conventional diagnostic methods [13]. The use of computing intelligence methods is exhibiting exceptional diagnostic accuracy in various medical fields, with computer-assisted diagnosis (CAD) systems utilizing deep learning techniques attaining notable diagnostic efficacy [14] in oncological evaluations [15,16], lung abnormalities [17,18], encompassing neoplastic disorders in dermatological [19,20], reproductive, hematological, gastrointestinal [21], and breast cancer detection systems [22,23,24]. Convolutional neural networks (CNNs), a leading deep learning architecture, have demonstrated remarkable diagnostic proficiency in medical image analysis, especially in intricate imaging techniques like thermographic breast cancer screening [25]. Such cutting-edge computational approaches provide physicians with proficient diagnostic assistance, facilitating quicker, independent, and more complicated disease detection procedures; however, they also pose computational complexity issues concerning parameter optimization and possible overfitting [26].
Existing breast cancer CAD techniques exhibit considerable technological obstacles notwithstanding significant progress in diagnostic imaging [1]. Current CNN topologies employed in these systems exhibit considerable complexity, frequently integrating numerous deep layers that hinder classification tasks and elevate computational demands [2,3]. Prior studies primarily concentrated on complex segmentation algorithms and multi-stage preprocessing methods, often adding superfluous procedural intricacy without significantly enhancing diagnostic results [4,5]. Some studies that attempted to integrate clinical data with thermal imaging faced limitations in conclusively proving improved diagnostic accuracy [6]. Furthermore, researchers have primarily focused on creating customized CNN architectures, neglecting the potential benefits of transfer learning and pre-trained neural networks that might boost effectiveness while reducing computing resources and training data needs [7,8]. Conventional methods of analysis often derive features from individual CNN layers, neglecting the intricate feature representations found in multi-layered deep learning structures [9]. This research introduces a novel CAD framework that utilizes transfer learning, multi-architecture CNN integration, extensive multi-layer feature extraction, and sophisticated feature transformation techniques to overcome current CAD constraints in breast cancer identification through thermal imaging. The rationale for integrating multiple lightweight CNN models arises from the fact that various CNN structures exhibit distinct inductive biases, receptive field characteristics, and hierarchical feature extraction proficiencies. Many current CAD systems depend on a singular deep learning model [27,28,29,30], which may constrain the system’s capacity to generalize across varied image patterns and thermal anomalies linked to breast cancer. Incorporating numerous CNNs into the framework provides architectural diversity, allowing the system to capture complementary feature representations that improve classification robustness.
Each chosen CNN including MobileNet, EfficientNetB0, and ShuffleNet provides unique benefits regarding computational efficiency and feature extraction capabilities. MobileNet demonstrates superior performance in low-resource settings owing to its depthwise separable convolutions [31]; EfficientNetB0 adeptly balances depth, width, and resolution to enhance accuracy [32]; and ShuffleNet incorporates channel shuffling to improve gradient flow and feature diversity [33]. Utilizing these networks collectively enables the system to capitalize on the advantages of each while alleviating the constraints inherent in any singular architecture. This multi-model strategy enhances diagnostic performance and enhances the probability that the system will maintain efficacy across diverse imaging conditions and patient demographics. The incorporation of various CNN architectures is not simply a design decision but a strategically justified improvement intended to enhance both the accuracy and generalizability of the proposed CAD system for thermogram-based breast cancer detection.
Furthermore, The study highlights that extracting features from three distinct deep layers including shallow, middle, and deep within each CNN is not simply a method for enhancing feature diversity, but a strategic feature selection process designed to identify the most discriminative representations across varying levels of abstraction. Each layer encapsulates distinct semantic information: shallow layers encode low-level textures and edges, middle layers identify intermediate patterns, and deep layers extract high-level structural features pertinent to tumor detection [34,35]. Through the analysis and comparison of the classification performance of these individual layers, the study conducts a preliminary phase of feature space optimization, determining which depth level most significantly aids in differentiating between benign and malignant cases. This multi-layer evaluation is a fundamental step towards informed feature fusion. Rather than indiscriminately merging all features from every layer, the comparative efficacy of each layer informs the selection of those that most significantly enhance classification accuracy. This method diminishes redundancy, alleviates the curse of dimensionality, and guarantees that only the most significant feature subsets advance to later stages of the pipeline, including transformation and final feature selection via MRMR.
The novelty and contributions of the present research can be summarised in the following points:
  • Constructing a CAD paradigm based on compact CNN models instead of employing deep learning models of complex architectures and huge amounts of deep layers and parameters.
  • The implementation of multi-level and multi-model feature fusion mechanisms based on extracting and merging multi-level deep features from three distinct CNN structures, and applying a feature selection (FS) technique to choose the features with significant impact on classification performance.
  • Utilizing feature transformation approaches including discrete wavelet transform (DWT) and non-matrix negative matrix factorization (NNMF) to lower feature dimensionality, thereby decreasing classification complexity.
  • Enhancing the detection workflow by removing redundant processing and segmentation stages, thus reducing computation burden.

2. Previous Works

Current research indicates that the majority of prior studies have employed thermographic images from various disciplines, with minimal application in the medical field including breast cancer detection. Furthermore, numerous studies have combined AI methodologies with alternative diagnostic modalities for the analysis of breast cancer. Nonetheless, a limited number of studies have investigated the synergistic application of thermography and AI methods for breast cancer detection, underscoring a deficiency in the existing literature. The research [36] presented a U-Net-based approach for the automatic segmentation of breast zones, removing interference from adjacent anatomy. A tailored CNN was subsequently created to categorize breast thermograms as normal or abnormal, attaining a remarkable accuracy surpassing 99 percent on the DMR-IR dataset. An improved CNN was created in [27] to produce heatmaps from thermal breast images. These heatmaps, in conjunction with Fuzzy C-means clustering and thermal profiling, exhibited a classification success rate of 96.8 percent and a specificity of 93.7 percent.
Explainable AI (XAI) methodologies have improved comprehension of models and efficacy. Customized attributes integrated with SHAP-based explanations yielded substantial performance enhancements, achieving an accuracy of 98.27 percent and an F1 score of 98.15 percent [37]. In the research [38], Bayesian networks were merged with CNNs to construct two approaches for the early identification of breast cancer. The combined effect of XAI with thermal imaging and clinical information attained an accuracy of 84.07 percent whereas an independent CNN model attained an accuracy of 90.93 percent. Preprocessing and extracting features are crucial in improving thermogram-based CAD systems. A study [39] used morphological procedures and curvelet-texture analysis to extract statistical and textural features, attaining an accuracy rate for classification of 93.3 percent using a cubic support vector machine (SVM). A separate study [40] combined multi-view thermal imaging with clinical data, employing asymmetric dispersion and level-set techniques for segmentation. The retrieved texture attributes, in conjunction with kernel principal component analysis for dimensionality reduction, attained an accuracy of 96 percent. The study [28] employed a segmentation method that combines the curvature parameter k with the gradient vector flow, and for identification, it introduced a CNN applied to the fragmented breast, achieving an accuracy of 100 percent.
Transfer learning methodologies have demonstrated potential in the detection of breast cancer. A research investigation [29] employed the pre-trained VGG16 method, enhanced through data augmentation and normalization, attained remarkable outcomes, involving 99.4 percent accuracy. This methodology was contrasted with techniques such as SVM and Gradient Boosting, highlighting the effectiveness of pre-trained deep learning algorithms for thermogram analysis. A different approach, called LC-SCS, balanced high accuracy and computational efficiency by classifying thermograms using pre-trained networks such as VGG-19 and ResNet-50. The LC-SCS model attained an accuracy of 94 percent [41]. Furthermore, another system leveraged region of interest (ROI) retrieval and a multi-input design, merging thermal photographs with clinical data. Models developed through this methodology exceeded single-input models, attaining an accuracy of 90.48 percent [42]. A different approach deployed a customized CNN, incorporating preprocessing through morphological operations and object-oriented segmentation, yielding remarkable outcomes and illustrating the effectiveness of such methods in clinical applications [30].
An alternative method examined the processing of thermographic images through the integration of deep learning frameworks and evolutionary algorithms. The methodology involved decomposing images into red, green, and blue channels and then analysing each channel with distinct CNNs. An evolutionary algorithm was employed to allocate performance-based weights, enhancing the overall diagnosis. Furthermore, adaptive segmentation customized for individual patient variations in temperature was executed, employing hybrid approaches that capitalize on particular heat segments. A comprehensive method that inputs complete thermograms into CNNs produced notable outcomes, with one model attaining an accuracy score of 94 percent [43]. Conversely, lightweight models such as SqueezeNet, specifically optimized for breast thermogram analysis, were integrated with hybrid optimization algorithms, incorporating Genetic Algorithms and Grey Wolf Optimizers. This method exhibited exceptional effectiveness, attaining an accuracy of 100 percent yet employing merely 3% of the attributes gathered [44].
In recent years, recurrent neural networks (RNNs) have received immense hype owing to their capability of modeling sequential data and capturing temporal dependencies. In the field of medical diagnosis, RNNs have a reputation for time-series analysis of physiological signals or longitudinal studies in imaging. RNNs and their advanced variants, including long short-term memory networks (LSTM) and gated recurrent units (GRU), have shown promising capabilities to capture temporal dependencies and sequential patterns in medical imaging. Recent work has claimed efficacy for RNNs in dynamic feature extraction, which could complement CNN-based approaches by combining spatial and temporal correlation modeling in thermographic sequences. The inclusion of RNNs would encourage a wider range of new deductions about the changes in the temporal patterns in the frames, thus being able to more sensitively detect subtle changes associated with malignancies.
For example, in the study [45], hybrid convolution-recurrent neural network (CNN-RNN) models were evaluated in terms of five state-of-the-art pre-trained CNN architectures merged with three RNNs for detecting tumor abnormalities in dynamic breast thermographic images. The hybrid architecture that favored breast cancer detection is VGG16-LSTM with accuracy of 95.72%, and sensitivity and specificity of 92.76% and 98.68%, respectively. Thus hybrid CNN-RNN models showed better performance than standalone CNN models, which means temporal data recovery from dynamic breast thermographs is possible. Similarly, the article [46] provided a new hybrid model combining CNN and LSTM using two datasets accessible from the Kaggle repository for binary breast cancer classification. CNN obtained mammographic features which include spatial hierarchies and malignancy patterns; LSTM networks defined sequential dependencies and temporal interactions instead. Combining these components improved resilience and classification accuracy. Other deep learning models including standalone CNN, LSTM, GRUs, VGG-16, and ResNet-50 were evaluated against the proposed model. CNN-LSTM model showed better performance with accuracy of 99.17% and 99.90% on respective datasets.
The literature on CAD tools for breast cancer diagnosis identifies significant deficiencies that restrict the creation of effective and precise tools for diagnosis. A notable limitation in current research is the dependence on complicated CNN designs with multiple deep layers, which substantially elevate computational requirements and complicate classification processes [29,41,43,46]. These intricate models frequently result in overfitting and necessitate substantial training data, rendering them less feasible for use in practice. Furthermore, numerous studies concentrate on individual CNN structures [27,28,29,30], overlooking the advantages of merging various models to boost feature diversity while improving diagnostic precision. Moreover, traditional approaches generally extract features from singular CNN layers [41,45,46], inadequately leveraging the complex feature representations present in multi-layered deep learning architectures. This constraint limits the analytical depth and may neglect critical information that could improve diagnostic results. A significant deficiency is the absence of efficient feature transformation and dimensionality reduction methods [37,38,39,42,45,46], leading to large feature spaces that hinder the classification procedure. Finally, previous studies often include superfluous segmentation and preprocessing steps [28,30,36,39,40,42], introducing procedural complexity without significant enhancements in diagnostic outcomes.

3. Materials and Methods

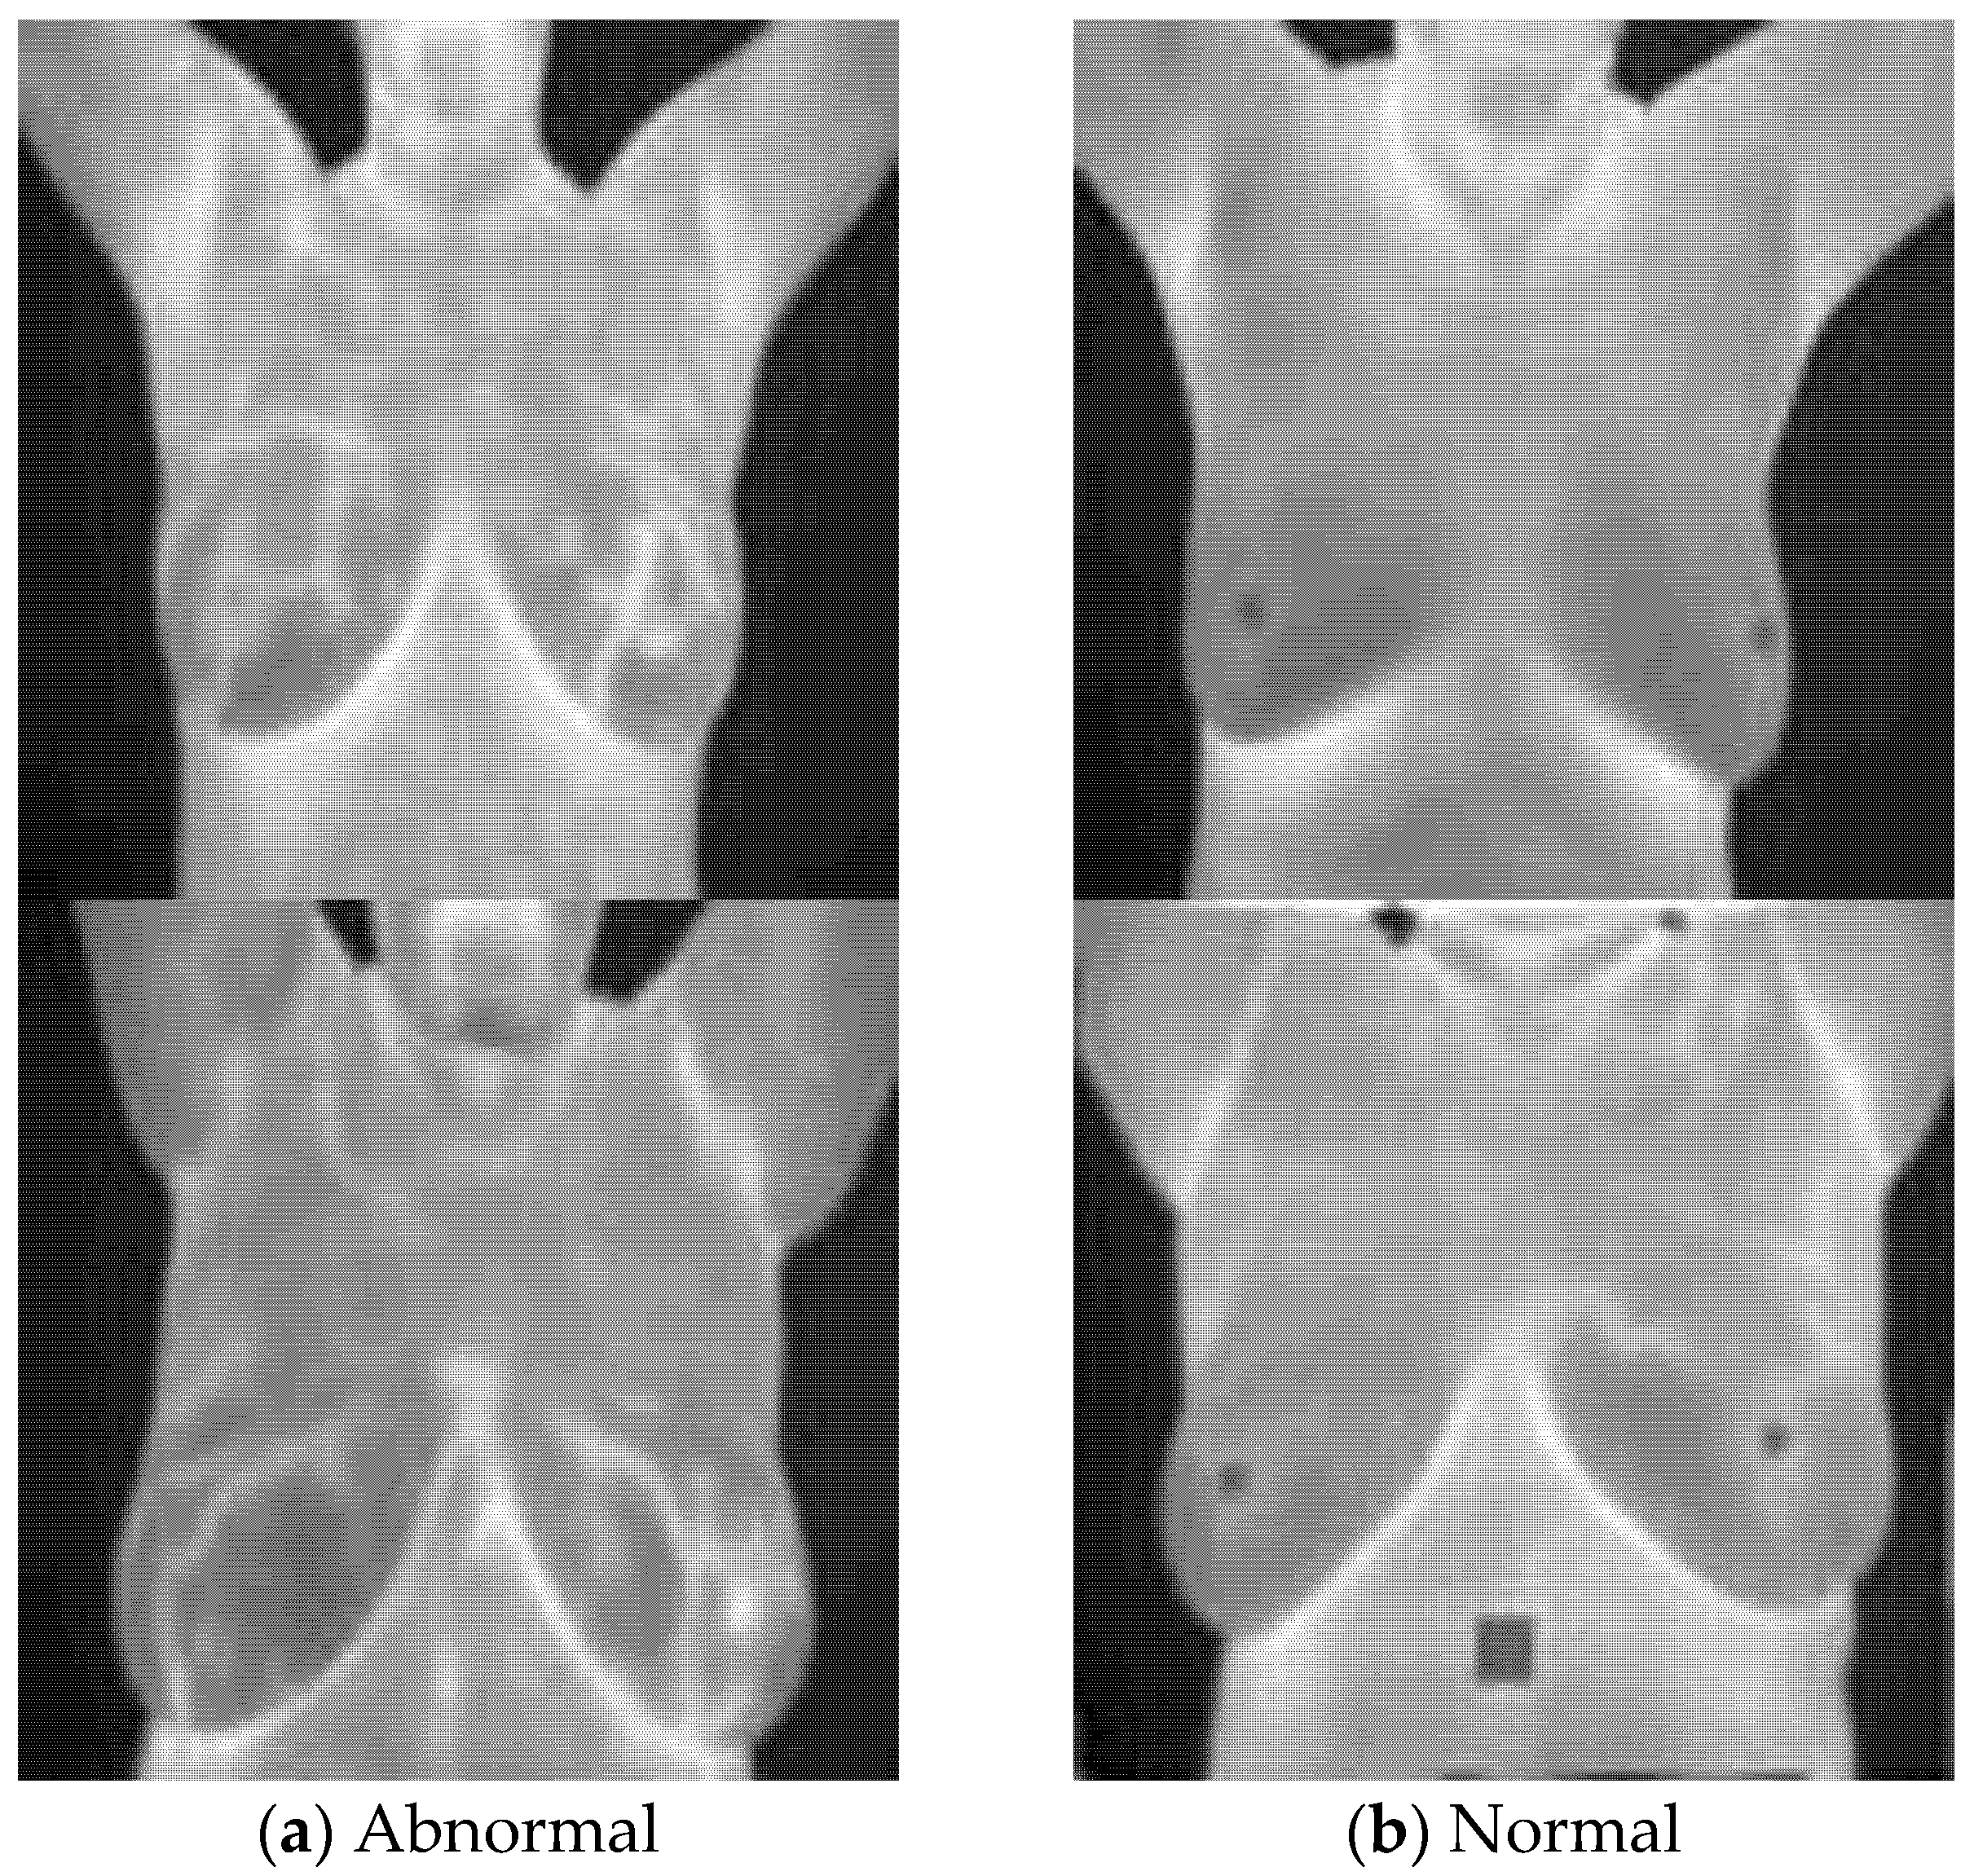
3.1. Breast Cancer Thermograms Dataset

The research utilizes the Database of Mastology Research Infrared Images (DMR-IR), a thorough collection developed in conjunction with the Antônio Pedro University Hospital in Brazil. The DMR-IR is publically open access benchmark dataset for breast cancer detection using thermograms [47]. The database was created in accordance with strict ethical guidelines, following approval by institutional review boards and individual patient consent. The original dataset includes female individuals aged 21 to 80 years, with confirmed diagnoses. The dataset consists of thermal photographs from individuals with healthy breasts and confirmed breast abnormalities. Blurry images were removed. As a result, only 1000 breast images (500 normal and 500 abnormal) were incorporated into the final dataset. The images are classified as either “normal” or “abnormal” according to clinical and diagnostic evaluations. The images are classified as either “normal” or “abnormal” according to clinical and diagnostic evaluations. The term “abnormal” in this context extends beyond malignant breast cancer cases; it includes a wider range of breast pathologies, encompassing both malignant conditions and benign entities. This classification signifies the clinical aim of promptly identifying any breast abnormalities that may require additional examination, regardless of their cancerous nature. The incorporation of in situ cancer instances is not explicitly mentioned in the dataset but can be deduced within the context of the ‘abnormal’ classification. In other words, specific lesion type subclassifications (e.g., benign, in situ, invasive) are not distinctly identified in the publicly accessible metadata.
On the contrary, the “normal” category pertains to subjects who display no obvious pathological findings during clinical examination and imaging. This group is devoid of both benign and malignant breast abnormalities, with the thermographic images serving as the baseline for healthy breast thermal patterns. The publicly available DMR-IR dataset lacks detailed clinical labels and histopathological confirmations for each individual image. Consequently, the proposed CAD utilized the binary classification established by the dataset curators, who classified the images based on a review of medical imaging examinations and clinical evaluations at the time of collection. Additionally, the publicly accessible DMR-IR dataset lacks comprehensive clinical annotations, including tumor size, stage, and histopathological validation, which are either absent or reported inconsistently.
The study employed frontal thermal photos obtained with a high-quality FLIR SC-620 infrared camera at a dimension of 640 × 480 pixels. This rigorously gathered database consists of 500 normal and 500 abnormal breast photographs, showcasing a broad range of breast anatomy differences and offering a distinct appearance of infrared breast scans, as depicted in Figure 1.

3.2. Feature Transformation and Reduction Approaches

3.2.1. Discrete Wavelet Transform

The DWT is a prevalent method for transforming a signal or photo into its wavelet representations, facilitating analysis in both temporal and frequency domains [48]. The process encompasses several kinds of wavelets, principally classified as orthogonal and biorthogonal. Orthogonal wavelets, originally developed by Hungarian mathematician Alfréd Haar [49], are particularly significant. According to [50], the DWT mechanism involves the transformation of data (which could be a signal or photo) D using a series of filters. In the beginning, D is subjected to a low-pass filter characterised by an impulse response P, leading to a convolution procedure represented as:
D W T m = D P m = q = X m L m q
where the instance is denoted by q and the decomposition step by m.
The data undergoes processing through a high-pass filter Hi, resulting in a pair of elements: detailed coefficient from the high-pass filter and approximation coefficients from the low-pass filter [51]. The Nyquist rule dictates that fifty percent of the input signal’s spectrum of frequencies is discarded. As a result, the result obtained from the low-pass filter is down-sampled by a value equal to two and subsequently analyzed by sending it across successive high-pass and low-pass filters. The low-pass filter output Lo and the high-pass filter output Hi are both decreased by a factor of 2, as illustrated here:
D W T l o w m = q = X m L o 2 m q
D W T h i g h m = q = X m H i 2 m q

3.2.2. Non-Negative Matrix Factorization

Non-Negative Matrix Factorization (NNMF) is a sophisticated statistical technique aimed at decomposing a non-negative matrix V into the resultant of multiplying two smaller non-negative matrices, W and H, where VWH [52]. This method is especially effective for diminishing feature matrix size [53]. In contrast to conventional matrix factorization techniques like Principal Component Analysis (PCA), NNMF imposes non-negativity limits guaranteeing that every aspect in the resultant matrices is non-negative [54].
The mathematical representation of NNMF could be articulated in the following manner: For a matrix V ∈ ℝ^(m × n), NNMF determines two non-negative matrices, W ∈ ℝ^(m × k) and H ∈ ℝ^(k × n), that diminish the discrepancy amongst V and the result of their multiplication WH [55]. This optimization problem is expressed as:
minimize ||V − WH||2 subject to W, H ≥ 0
In this context, ∣∣⋅∣∣ signifies the Frobenius norm, and k is typically selected to be lower than both m and n, yielding a reduced version of the initial data set [56].
  • W: A matrix of size m × r that serves as a basis for the data, where each column represents a distinct component or part.
  • H: A matrix of size r × n containing the coefficients or weights corresponding to the components in W.
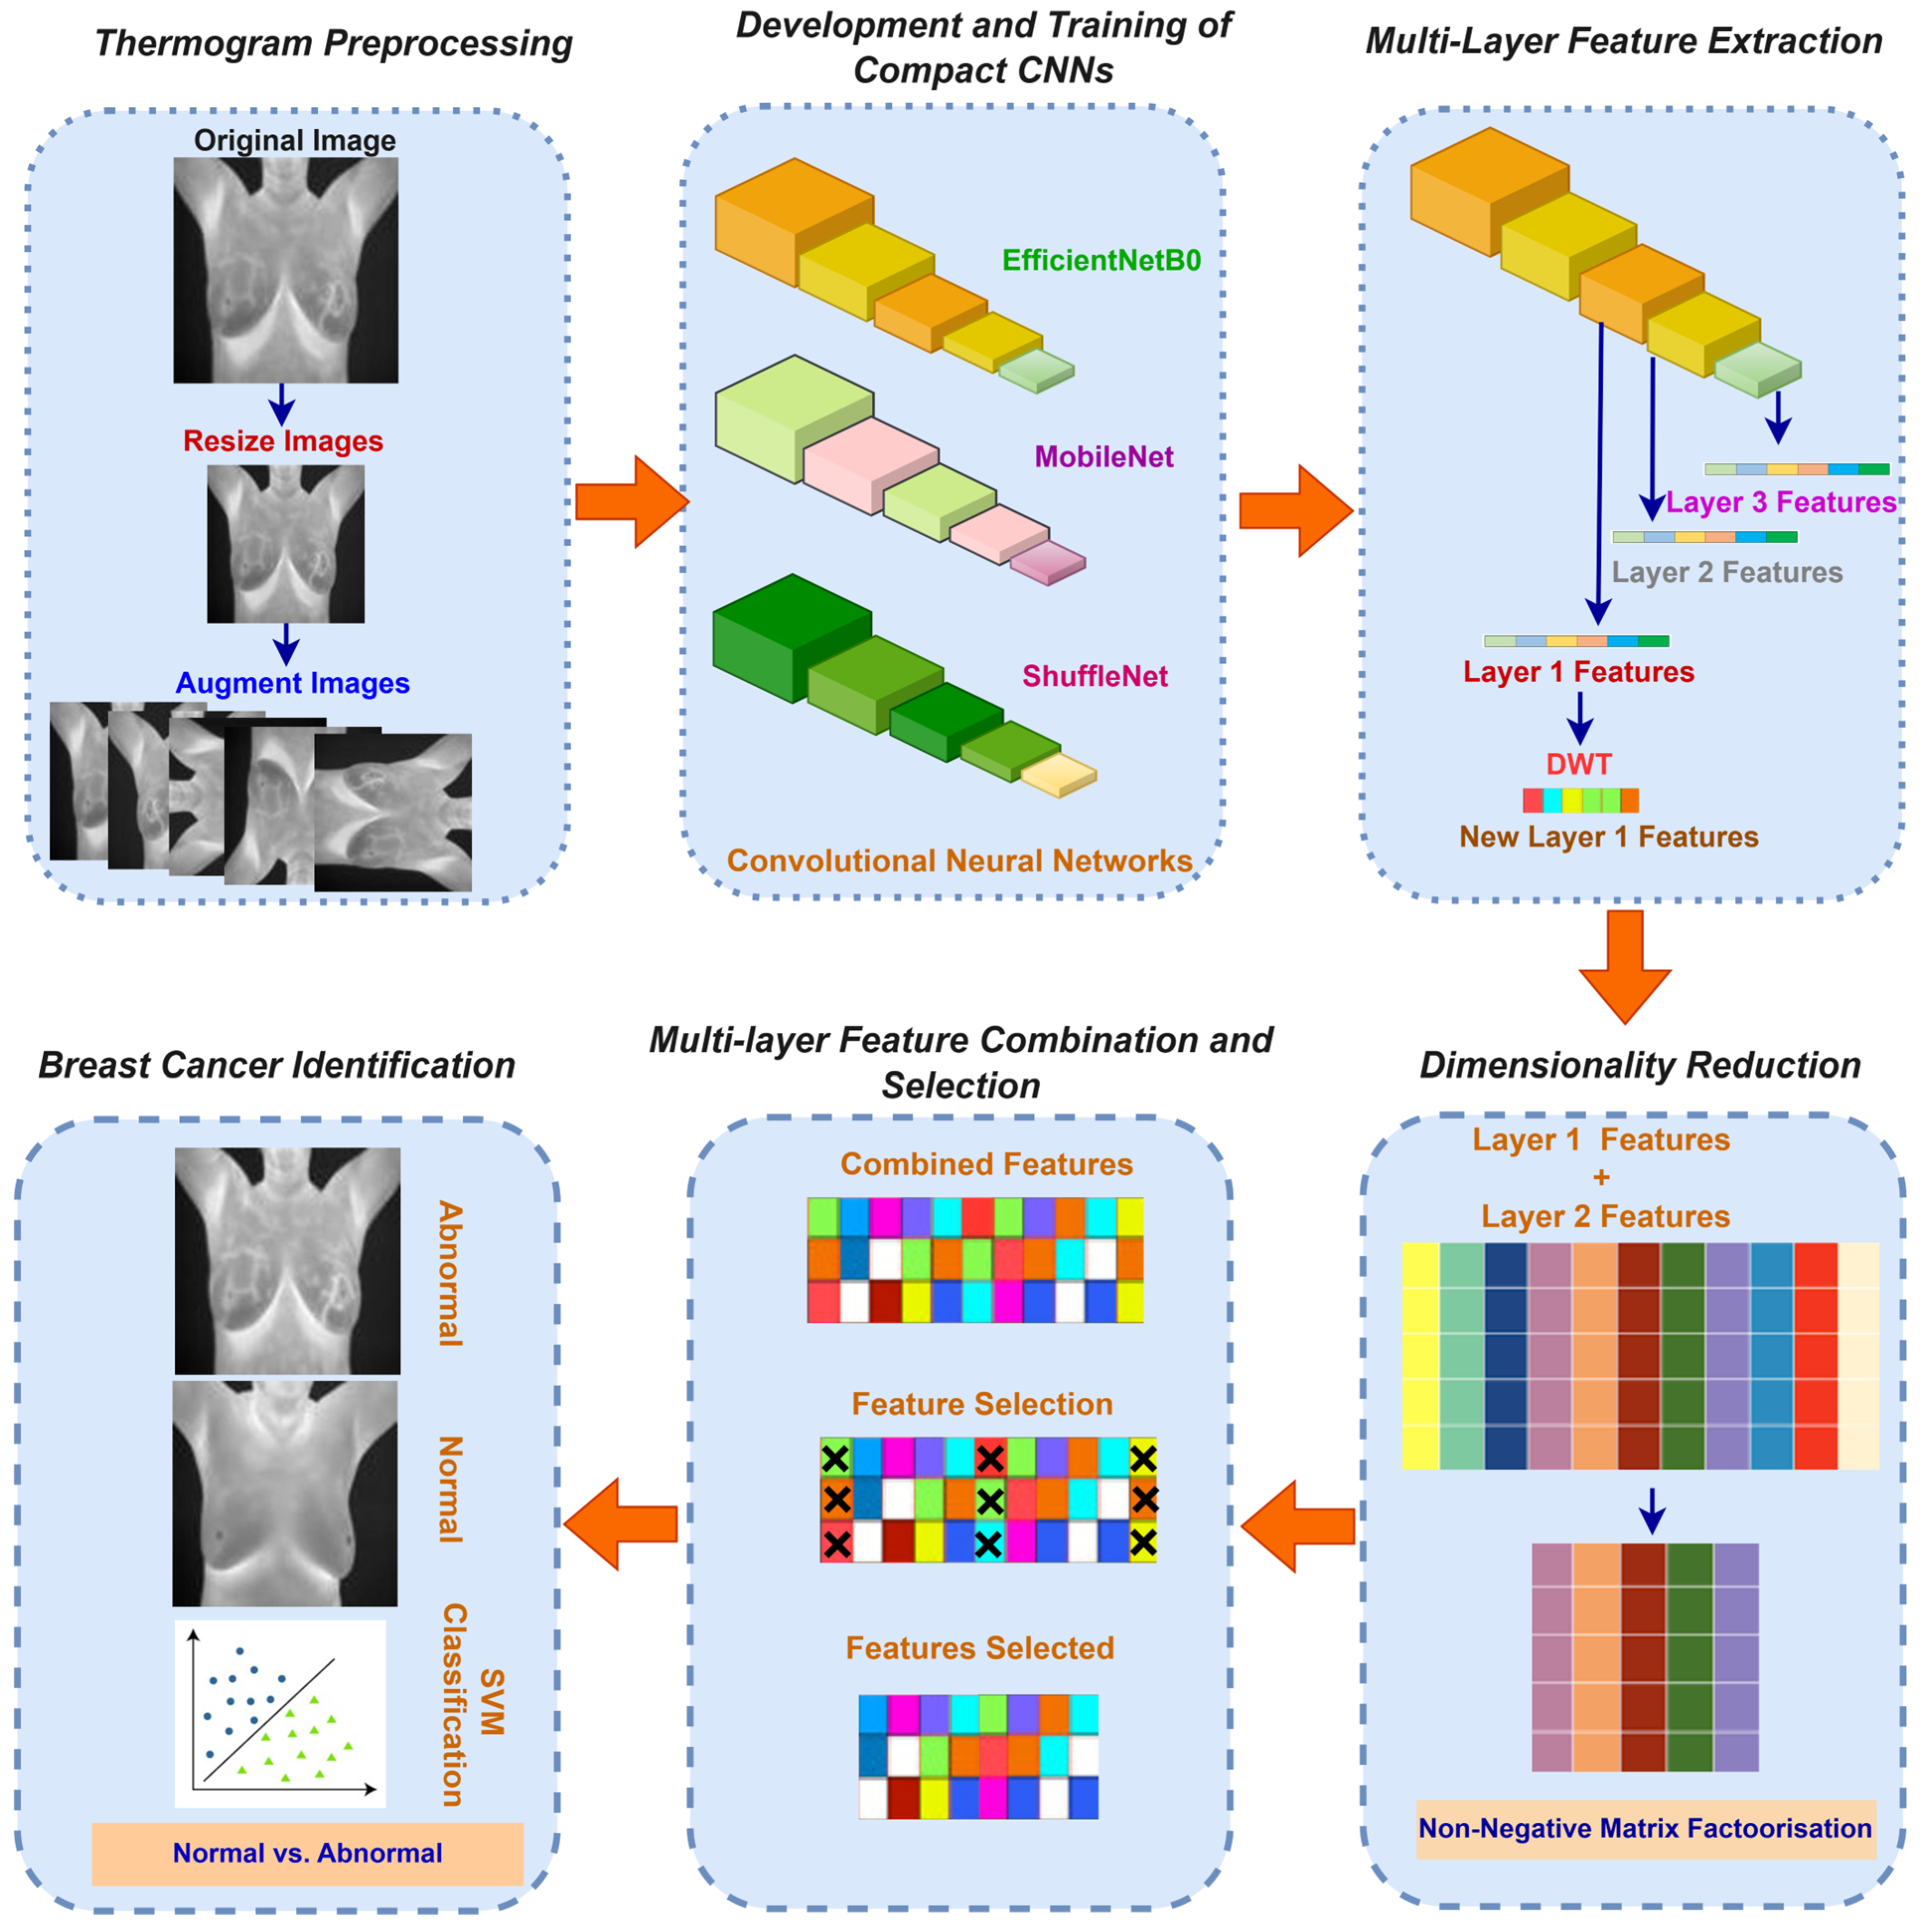
The enforcement of non-negativity presents numerous benefits. Primarily, it enhances comprehension by depicting each feature as a summation of cumulative elements, consistent with the instinctive interpretation of systems derived from their individual components. In addition, the resultant sparse representation frequently encapsulates the fundamental patterns in the data more efficiently than conventional methods [57]. This sparsity improves generalization and uncovers latent patterns within the original high-dimensional dataset.

3.3. Presented CAD

The suggested CAD approach adeptly resolves the deficiencies found in previous work by presenting innovative solutions designed to overcome the constraints of current systems. Initially, it employs lightweight CNN architectures like MobileNet [31], EfficientNetB0 [32], and ShuffleNet [33], which have been tailored to minimize computational demands while preserving excellent performance. Utilizing transfer learning with pre-trained networks, the framework diminishes the necessity for comprehensive training data and mitigates the possibility of overfitting [58]. This method improves computational efficiency and guarantees outstanding results in thermogram-based breast cancer detection. Furthermore, the framework combines attributes from three disparate CNN architectures, capitalizing on the advantages of each design to formulate a more extensive and resilient feature set [34,35]. This multi-architecture integration guarantees a more comprehensive depiction of thermal structures, enhancing the framework’s overall accuracy.
The proposed CAD framework implements a multi-layer feature extraction strategy designed to improve classification performance via an in-depth analysis of deep features. This study diverges from traditional methods that utilize features from individual CNN layers by extracting features from three separate deep layers across three lightweight CNN architectures—MobileNet, EfficientNetB0, and ShuffleNet—to assess their respective and collective influence on classification accuracy. This stratified methodology facilitates enhanced feature representations, augmenting the system’s responsiveness to nuanced thermal irregularities linked to breast cancer. The framework utilizes advanced feature transformation techniques, namely discrete wavelet transform (DWT) and non-negative matrix factorization (NNMF), to improve computational efficiency by effectively reducing feature dimensionality while maintaining essential diagnostic information. These transformations optimize the classification process and substantially reduce computational requirements, facilitating high accuracy with minimal resource expenditure. Moreover, the proposed paradigm streamlines the detection workflow by removing superfluous preprocessing and segmentation stages typically present in current systems. This simplification improves overall system efficiency and facilitates practical implementation in clinical environments. The Minimum Redundancy Maximum Relevance (MRMR) method is ultimately employed for feature selection, guaranteeing that solely the most informative features influence the final classification. This step enhances model performance and strengthens the reliability of the diagnostic process.
The proposed CAD system consists of six successive steps: thermogram preprocessing, development and training of compact CNNs, multi-layer feature extraction, dimensionality reduction, multi-layer feature combination and selection, and breast cancer identification. During the preliminary preprocessing phase, thermal photos have their sizes changed and boosted to improve their variability and resilience. In the subsequent stage, three lightweight pre-trained CNN models—ShuffleNet, MobileNet, and EfficientNetB0—are altered and optimized, particularly for thermographic images. After retraining those CNNs, deep attributes are obtained from three separate layers (Layer 1, Layer 2, and Layer 3) across each compact CNN to assess how each one contributes to diagnostic accuracy. Layer 1 variables are significantly large, so the DWT is used to decrease their size. After that, the NNMF method is employed on the features from Layer 1 and Layer 2 to additionally reduce their dimensions. This stage involves an ablation study to evaluate the effects of various diminished feature sizes on the effectiveness of breast cancer identification. The features extracted from each layer of the compact CNNs are subsequently combined to assess the impact of feature integration on diagnostic results. Afterwards, deep features from every single layer of the three CNN models are merged, and the Minimum Redundancy Maximum Relevance (MRMR) approach is applied to identify the most informative features, thereby reducing redundancy. In the ending phase, multiple SVM classifiers are employed to classify the thermal photographs as normal or abnormal. Figure 2 depicts the procedure of the suggested CAD system.

3.3.1. Thermogram Preprocessing

The thermal images are adjusted to the dimensions necessary for the three CNN models, specifically 224 × 224 × 3, ensuring consistency and compatibility with the network architecture. Subsequently, the dataset is split into training and testing sets, designating seventy percent of the pictures for training and the other thirty percent for testing, thus creating a standardized framework for assessing model performance. A variety of augmentation strategies was implemented on the training set to enhance the model’s generalization capability and mitigate the risk of overfitting. These encompassed transformations such as rotations, reflections, shearing, and scaling modifications, which significantly enhanced the dataset’s variability by incorporating variations. This method enhanced the model’s training procedure by presenting it with a broader array of photo scenarios.

3.3.2. Development and Training of Compact CNNs

This study employs transfer learning deploying three lightweight CNNs that have been pre-trained on the data set known as ImageNet. MobileNet, EfficientNetB0, and ShuffleNet were selected as the primary CNN architectures for feature extraction in the proposed CAD system due to several factors, such as their performance in resource-constrained scenarios, computational efficiency, and compatibility with transfer learning. Each of these deep neural networks possesses distinct advantages, rendering them appropriate for diverse deep learning applications. ShuffleNet employs pointwise group convolution and channel shuffle processes to markedly decrease the computational burden while maintaining the effective extracting of features, rendering it exceptionally appropriate for mobile and embedded systems [33]. MobileNet leverages depthwise separable convolutions to markedly decrease model complexity and computational demands, attaining high efficiency while maintaining accuracy [31]. EfficientNetB0 employs a hybrid scaling technique to optimize network depth, width, and resolution, attaining exceptional accuracy while preserving computational efficiency [32]. Collectively, these architectures provide versatility, accommodating both resource-limited applications and tasks necessitating high performance, demonstrating their adaptability across diverse real-world contexts.
Though other lightweight architectures, such as GhostNet and RegNet, had their own merits, the selected models seemed to match the specific requirements in thermographic breast cancer detection. The architectures were selected because they are proven to perform with a trade-off between accuracy and computational efficiency, making them suitable in real-world clinical deployments where high-performance hardware may not always be available. While GhostNet decreases redundancy through its innovative ghost modules, low reliance on linearity may not capture the non-linear thermal patterns inherent in breast thermography. Complex heat variations observing breast cancer thermograms themselves are features requiring powerful non-linear modelling. Therefore, these intricate thermal patterns are better represented by MobileNet and ShuffleNet, characterised by non-linear activation layers (e.g., ReLU6)-thereby ensuring a more accurate representation of the underlying features, thus subdividing into labor with each class.
RegNet’s merit lies in its systematic architecture search for generic tasks, giving flexibility and scalability across domains. However, since RegNet has larger parameter counts (for example, RegNetY-4GF has 21M parameters), it does not serve the purpose of lightweight deployment in resource-constrained clinical environments. Instead, EfficientNetB0 compounds its scaling methods such that it strikes a more optimized balance of model depth, width, and resolution for maximum performance toward medical imaging tasks without excessive compute overhead. Hence, EfficientNetB0 would be a proper fit since it gives preference to accuracy while being efficient.
Besides, the chosen architectures (MobileNet, EfficientNetB0, and ShuffleNet) are some of the most commonly used in transfer learning applications, thanks to their pre-trained weights on large-scale datasets (such as ImageNet). This allows the models to generalize well to new domains without too much fine-tuning and thus reduce the reliance on a lot of labeled data. In the case of breast cancer thermography, where labeled datasets are usually scarce, transfer learning is crucial in achieving high diagnostic accuracy. Even though GhostNet and RegNet also allow this, they do not have a fairly established record compared to MobileNet, EfficientNetB0, and ShuffleNet. All chosen architectures offer various advantages in terms of feature representation and layer-wise learning, which is very valuable to identify the minute thermal anomalies presenting with breast cancer.
In contrast, these models are extremely well validated in many medical imaging tasks that are capable of working efficiently with small datasets and, hence cope efficiently with noise images. These models have been used successfully in dermatology, ophthalmology, and radiology. The extent to which each of these models is generalized across many imaging modalities compared to GhostNet and RegNet is still relatively novel in medical imaging applications, particularly thermography, which requires specialized feature extraction techniques. The merged multi-layer feature extraction in these architectures ensures that the final feature set is compact as well as highly informative, thus contributing to the outstanding performance achieved by the proposed framework.
The architecture of each network (MobileNet, EfficientNetB0, and ShuffleNet) is altered to incorporate two fully connected layers, which are adequate for the binary classification task of breast cancer detection in the dataset exploited in the current research. The tweaking of hyperparameters is performed as outlined in the experimental setup, with each model training individually on the thermographic images. This autonomous training method enables each structure to leverage its distinct advantages while preserving the reliability of its learning procedure.

3.3.3. Multi-Layer Feature Extraction

Upon the retraining of the three deep neural networks, the extraction of deep features commences. The present research extracts attributes from three separate layers of each deep neural network to assess their impact on the effectiveness of classification, contrary to relying on just one layer. In MobileNet, the layers consist of the final convolutional layer (Layer 1), the pooling layer (Layer 2), and the fully connected layer (Layer 3). For ShuffleNet, the chosen layers include the final ReLU activation layer (Layer 1), the pooling layer (Layer 2), and the ultimate fully connected layer (Layer 3). For EfficientNetB0, the selected layers include the final element-wise multiplication layer (Layer 1), the last pooling layer (Layer 2), and the fully connected layer (Layer 3). The feature lengths for such layers are specified in Table 1. Given the considerable size of the attributes from Layer 1, as demonstrated in Table 1, it is imperative to diminish their dimensionality. The DWT is used for this objective, as it efficiently diminishes the amount of features yet offers a time-frequency depiction of the inputs, thereby improving the effectiveness of classification [48,59]. The Haar wavelet serves as the mother wavelet, employing six levels of decomposition. The approximation coefficients from the sixth level are the finalised feature vectors following the decrease in dimensionality.

3.3.4. Dimensionality Reduction

Dimensionality reduction approaches are employed in breast cancer diagnostic imaging to reduce classification complexity. Deep features obtained from Layers 1 and 2 are progressively condensed using NNMF, a dimensionality reduction technique. A systematic ablation study is performed to thoroughly examine the subtle effects of attribute alteration resulting from NNMF processing on the identification of breast cancer. The main aim of this methodological study is to enhance the accuracy and diagnostic efficacy of breast cancer detection algorithms. By systematically varying the attributes derived from the NNMF process, significant insights are gained concerning potential enhancements in classification accuracy and computational effectiveness among machine learning algorithms for breast cancer identification.

3.3.5. Multi-Layer Feature Combination and Selection

In this step, the attribute vectors from three different deep neural networks are sequentially combined for each layer, resulting in three unique feature combinations for Layers 1, 2, and 3. This fusion procedure seeks to investigate the possibility of boosts in performance attainable via multi-architecture feature incorporation and comparative combination sets assessment. Subsequent to the production of the feature combination sets of Layer 1, 2, and 3 separately, a thorough concatenation step is executed to merge these three combined sets of the three deep neural networks, yielding an extensive multidimensional representation. Given the computational challenges associated with high-dimensional data, an advanced FS technique is essential. FS is a vital computational method for recognizing and keeping the most valuable variables while progressively discarding redundant or unimportant ones [60]. The minimum redundancy and maximum relevance (mRMR) methodology [61] is utilized to perform this advanced FS procedure, using mutual information as the main analytical metric. The mRMR method systematically assesses feature replication and relevance to selectively identify feature subsets that exhibit maximal class correlation and minimal redundancy among features using mutual information (MI). This FS approach expedites model training, reduces overfitting risks [62], and improves computational effectiveness and predictive accuracy within the machine learning model.
MI measures the association between two variables, indicating the extent to which knowledge of one variable diminishes uncertainty regarding the other. The calculation employs Equation (5), which depends on the marginal probabilities P(A) and P(B), in addition to the joint probability P(A, B) for the associated attributes.
I A ; B = b B a A p a , b log p a , b p a p b
A different technique emphasizes the identification of features most pertinent to the target class, as delineated by the maximum relevance criterion in Equation (6). This approach aims to identify features Xi that demonstrate the highest MI I (X i; C) with the class C. Although effective, dependence on maximum relevance alone can lead to significant redundancy among chosen features, potentially impairing model performance. To resolve this, the minimum redundancy criteria, as delineated in Equation (7), is integrated. It reduces redundancy by evaluating pairwise MI I(Xi, Xj) between variables in the specified set, making sure the attributes of choice are maximally apart from each other [63].
max D X , C ; D = 1 X X i X I X i ,   C
min R X ; R = 1 X X i ,   X j X I X i ,   X j
The integration of these two principles—maximum relevance and minimum redundancy—constitutes the mRMR framework. Equation (8) consolidates both criteria and employs a greedy algorithm for the iterative selection of features. In this methodology, S denotes the collection of previously selected features, and at each iteration, the algorithm seeks to optimize the disparity between the significance of a prospective feature I (X i; C) and its mean redundancy in relation to the features within S. This strategy adeptly balances relevance and redundancy, guaranteeing the selection of an optimal subset of features that improves model performance while preserving computational efficiency.
m a x X i S I X i ; C 1 S X j S I ( X i , X j )

3.3.6. Breast Cancer Identification

The breast cancer identification phase of the suggested CAD system employs five various SVM classifiers, each adopting a separate kernel function to improve classification efficacy. The selected kernel functions are Linear (LSVM), Quadratic (QSVM), Cubic (CSVM), Medium Gaussian (MGSVM), and Coarse Gaussian (CGSVM), each selected for their distinct capacities to elucidate complex relationships in the data. The classifiers are evaluated using a five-fold cross-validation method, guaranteeing a rigorous and impartial assessment of their performance. This validation method divides the dataset into five equal segments, with each of them serving as the testing set in turn, while the other segments are employed for training, facilitating thorough performance evaluation across all data samples. This method employs various kernel functions to investigate the influence of numerous mathematical transformations on the model’s capacity to differentiate between classes, ultimately determining the most effective kernel for precise breast cancer classification. This strategy enhances the reliability of the CAD system and ensures generalizability to novel data, rendering it a valuable asset in clinical applications.

4. Experimental Settings
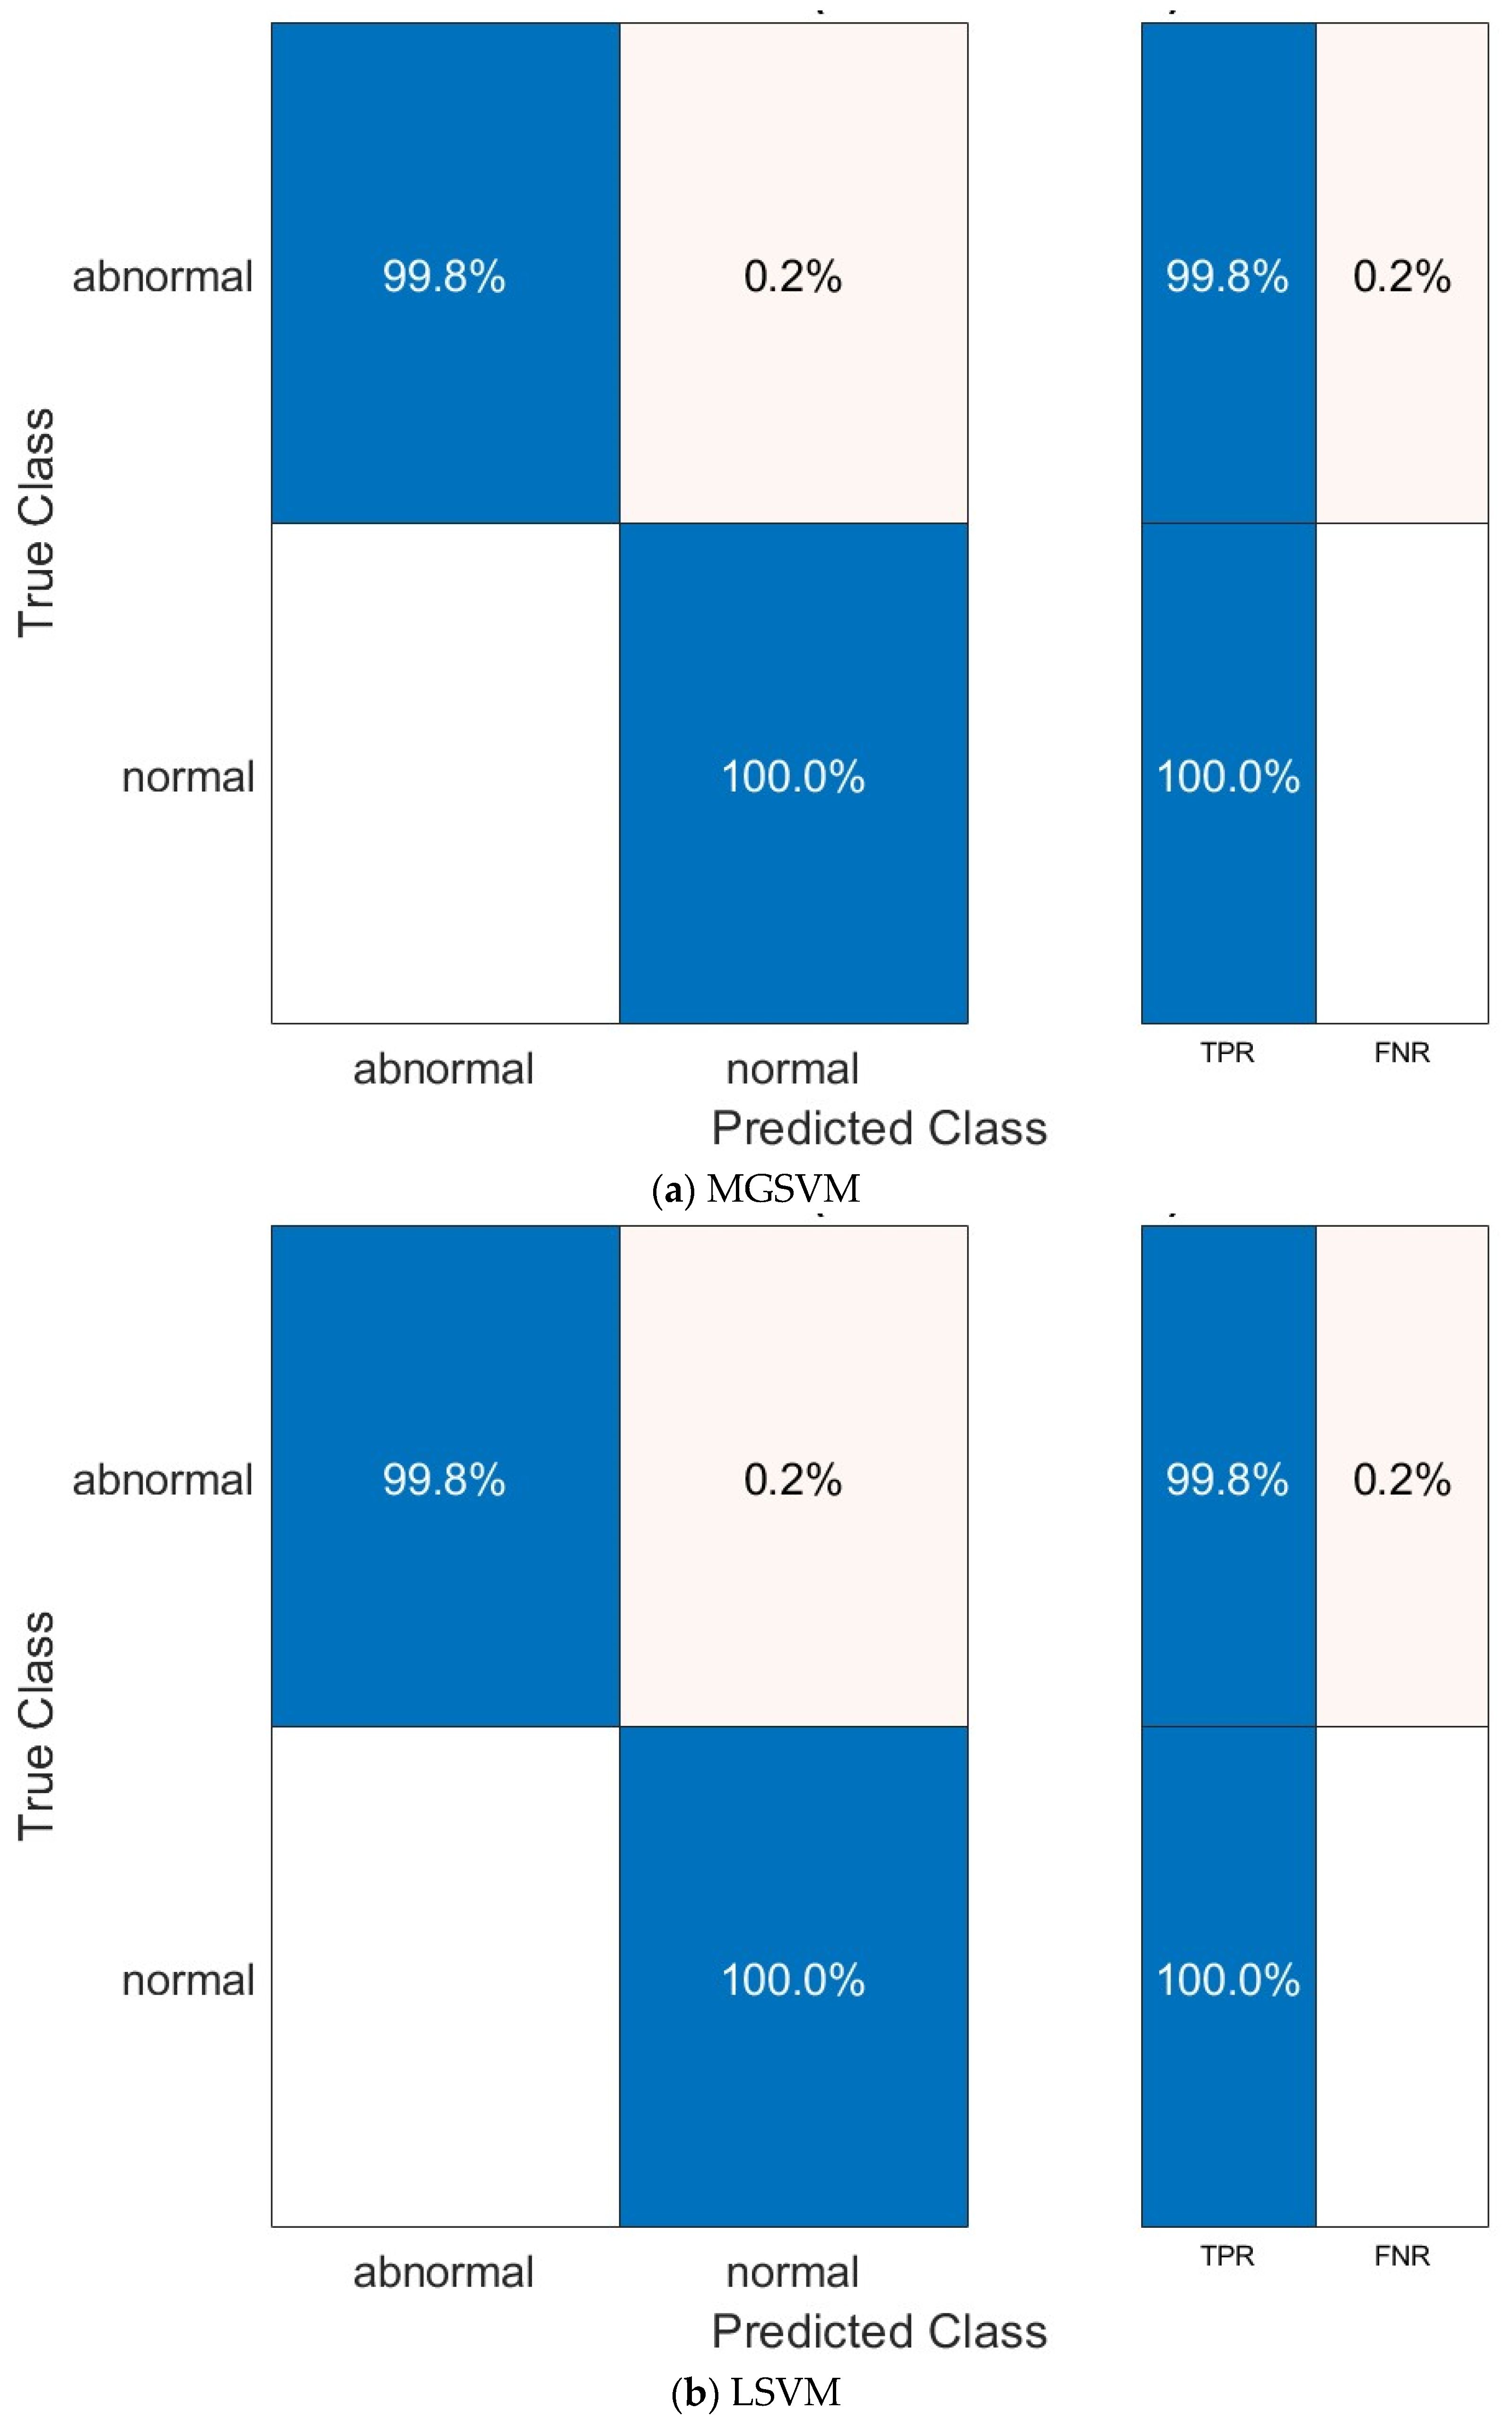
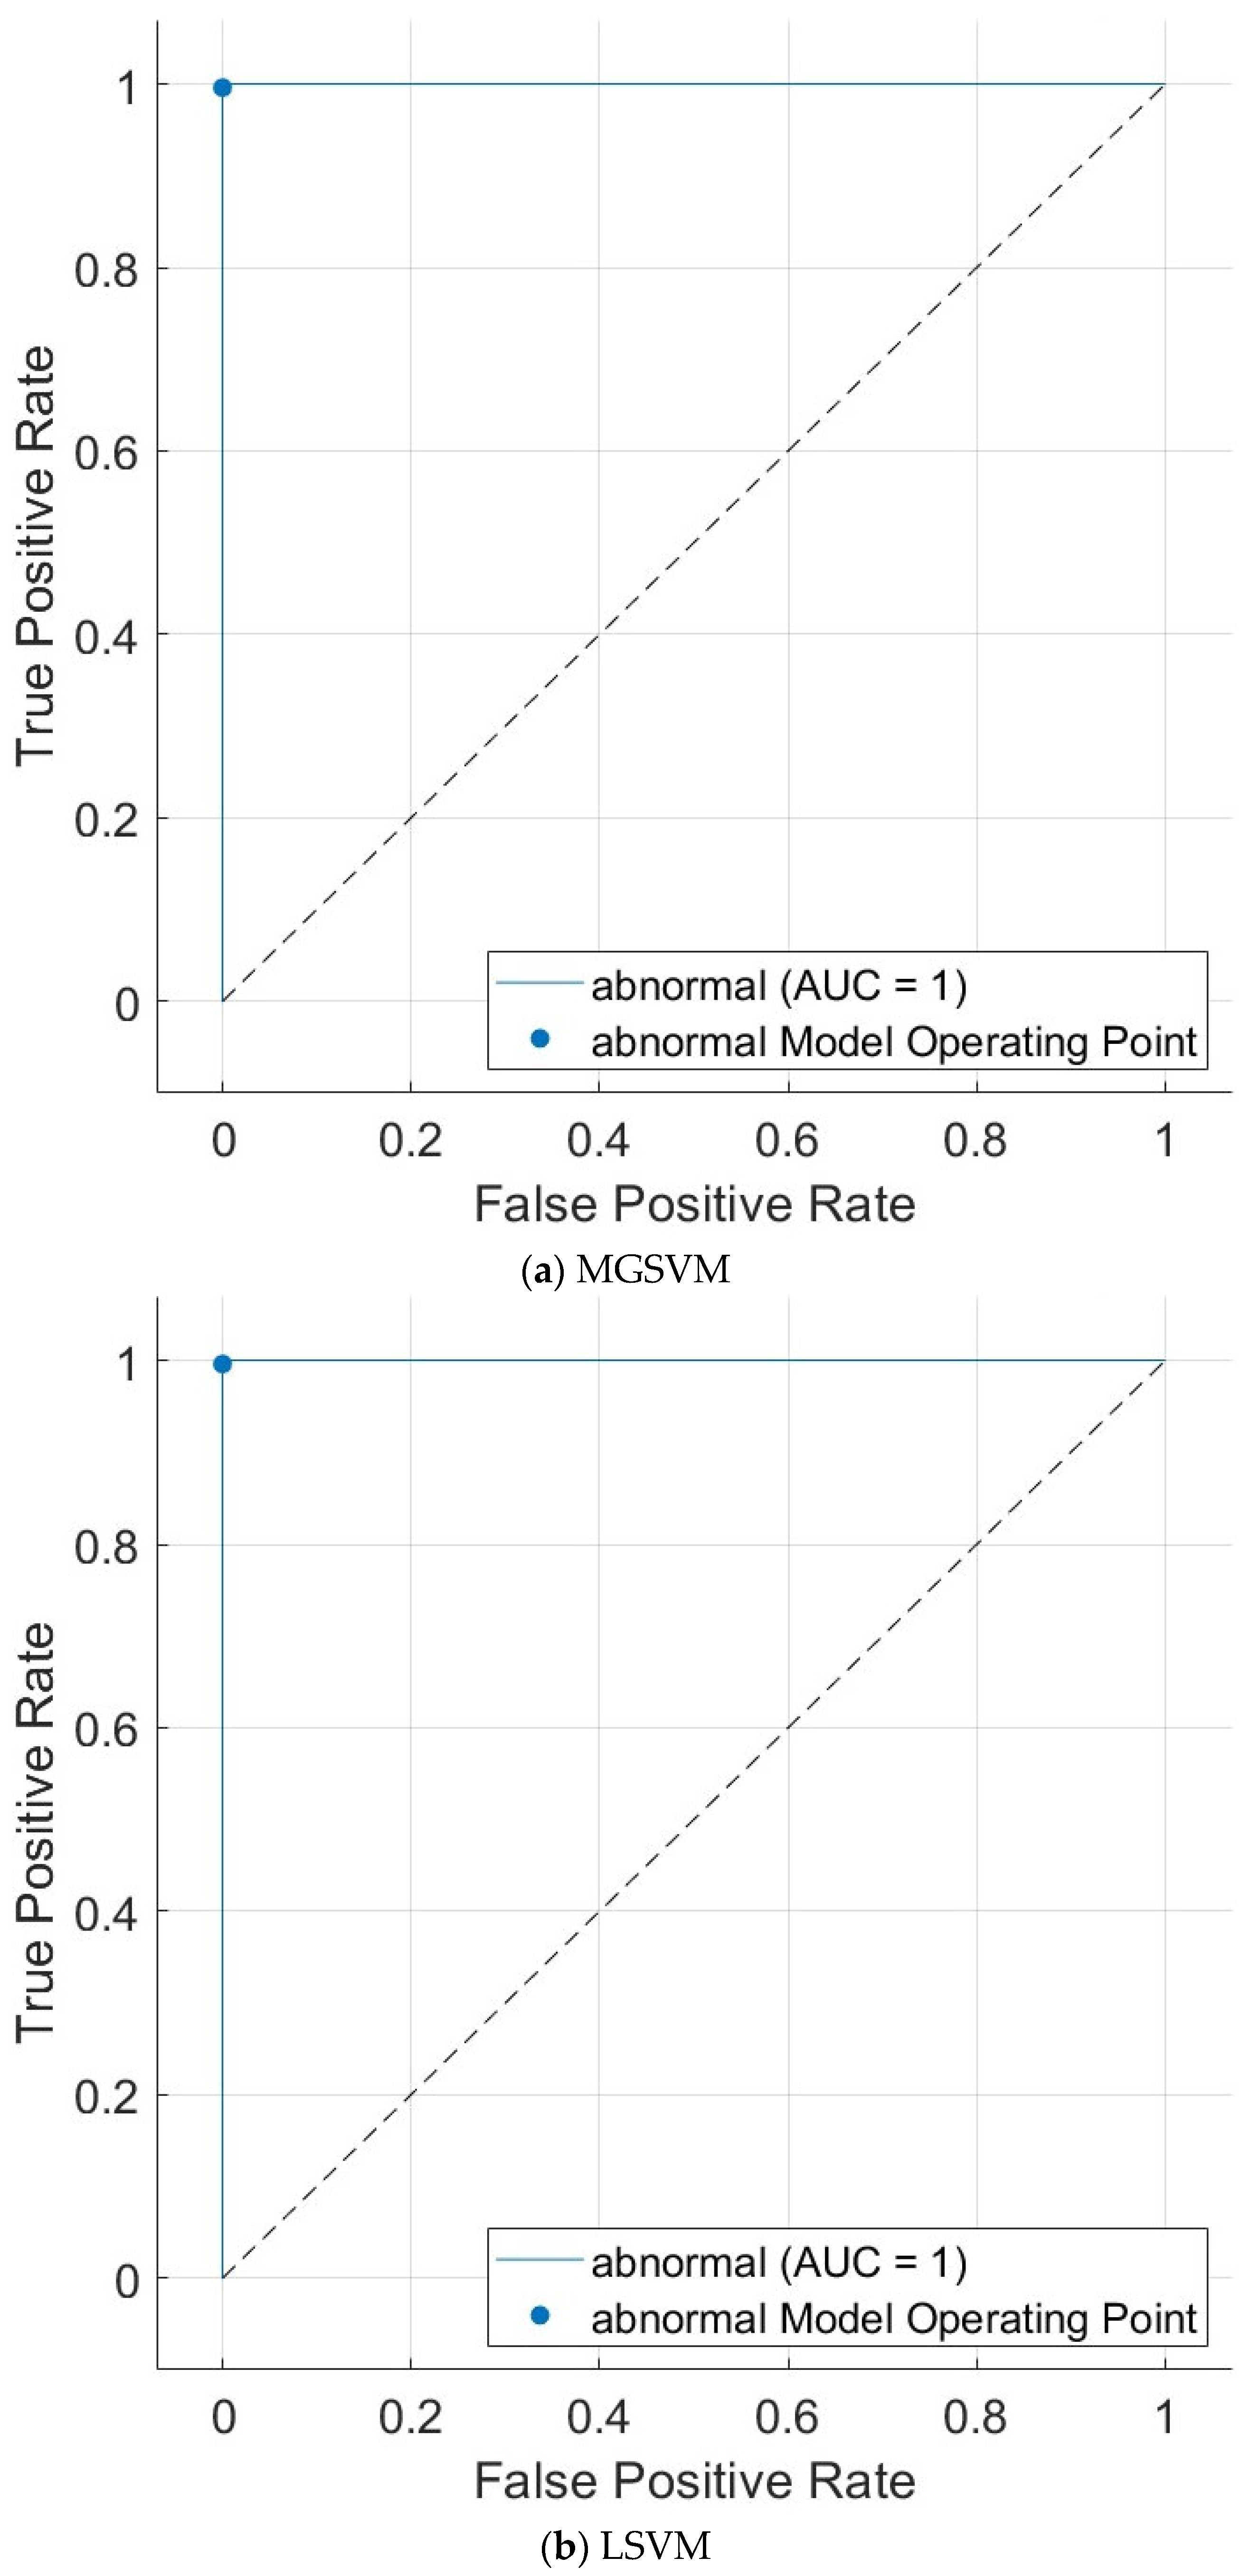
This section delineates the optimized hyperparameter setups implemented during training. Every CNN is subjected to comprehensive hyperparameter optimization to enhance its efficacy and precision. The established hyperparameter configurations comprise a mini-batch size of 5, optimizing memory usage during training, and the training are executed over 100 epochs to facilitate adequate learning iterations. The learning rate is set to 0.003 to optimize the balance between convergence speed and stability, while validation occurs every 140 iterations to track the model’s progress and prevent overfitting. All remaining parameters preserve their default configurations to ensure uniformity and streamline the training procedure. The Stochastic Gradient Descent with Momentum (SGDM) optimization algorithm is employed during the process of learning to improve convergence by integrating momentum, diminishing oscillations, and enhancing overall performance. The selection of these hyperparameters is essential for attaining an optimal equilibrium between computational efficiency and model accuracy, allowing the presented CAD to excel across the assessment measures.

5. Results

The results section delineates the findings of the suggested CAD system across four different evaluation scenarios aimed at assessing its efficacy in breast cancer identification. The initial scenario examines the contribution of features gathered from each layer of the three deep neural networks to identification accuracy. This analysis clarifies the contribution of each feature set to model performance. The second scenario assesses the influence of different quantities of features derived from the NNMF dimensionality reduction method on classification performance, particularly on features derived from Layers 1 and 2. This scenario evaluates the balance between dimensionality reduction and predictive accuracy by examining various feature subset lengths. The third scenario examines the advantages of incorporating features from deep neural networks with various structures to ascertain if the integration of attributes from disparate networks improves overall identification performance. Finally, the fourth scenario investigates the impact of consolidating features derived from various layers across the three compact deep neural networks. This involves identifying the most important attributes via selection procedures, thereby diminishing feature redundancy, reducing model complexity, and decreasing training duration. Such investigations together offer an in-depth comprehension of how different configurations of feature sets and combinations affect the performance and effectiveness of the CAD system.
Diverse assessment indicators are employed to evaluate the performance of the suggested CAD, guaranteeing a thorough comprehension of its efficacy. The metrics encompass accuracy, F1 score, precision, specificity, sensitivity, and Matthew’s correlation coefficient (MCC). Every metric offers different perspectives on the model’s classification accuracy, equilibrium between precision and recall, and capacity to manage imbalanced datasets. The computations for those indicators rely on the Equations (9)–(15). The assessment mechanism also employs confusion matrices, providing a comprehensive analysis of true positives, true negatives, false positives, and false negatives. This analysis aids in comprehending the model’s decision-making process and pinpointing areas for enhancement. Additionally, receiver operating characteristic (ROC) curves and the area under this curve (AUC) are produced to assess the balance between sensitivity and specificity at various classification thresholds, offering a visual depiction of the model’s discriminative capacity. These assessment techniques comprehensively assess the performance, reliability, and robustness of the suggested CAD.
S e n s i t i v i t y = T P T P + F N
S p e c i f i c i t y = T N T N + F P
P r e c i s i o n = T P T P + F P
M C C = T P × T N F P × F N ( T P + F P ) ( T P + F N ) ( T N + F P ) ( T N + F N )
F _ 1 s c o r e = 2 × T P 2 × T P + F P + F N
A c c u r a c y = T P + T N T N + F P + F N + T P
A U C = T P + T N P + N
True Negatives (TN) denote examples that are properly categorized as negative, indicating they belong to the negative class (N) and are accurately recognized to be so by the model. True Positives (TP) refer to occurrences successfully classified as belonging to the positive class (P), reflecting the model’s proficiency in identifying positive occurrences. Conversely, False Negatives (FN) arise when positive examples are erroneously classified as negative, indicating a failure of the model to identify true positive cases. False Positives (FP) occur when negative examples are erroneously classified as positive, indicating a miscalculation of the positive class by the model.

5.1. Ablation Study

This section represents an ablation study that investigates the impact of multiscale deep feature extraction from multiple CNN models on the classification performance of multiple SVM classifiers. In other words, it shows the influence of extracting deep features from multiple layers of three distinct CNN models (MobileNet, EfficientNetB0, and ShuffleNet) and compares the performance of various SVM classifiers fed with these features. Table 2 illustrates the identification accuracy attained by SVM classifiers developed employing deep features obtained from three separate layers of the MobileNet, EfficientNetB0, and ShuffleNet CNN structures, emphasizing the role of every layer in detection performance. In MobileNet, Layer 1 demonstrated superior performance among all SVM classifiers, attaining a peak accuracy of 98.5% with the MGSVM classifier. Layer 2 achieved marginally reduced accuracies, reaching a maximum of 97.2% using LSVM and MGSVM, whereas Layer 3 exhibited a substantial decline in performance, with accuracies plummeting to 73.5–91.4% where 91.4% was reached using LSVM and QSVM, suggesting that features from the deeper layers are less beneficial for classification accuracy. For EfficientNetB0, Layer 2 proved to be the most efficacious, repeatedly attaining the highest accuracies across all SVM variations, with a peak accuracy of 99.4%. In addition, Layer 1 demonstrated strong performance, achieving a maximum accuracy of 98.6%, whereas Layer 3 displayed significantly lower accuracies, fluctuating between 88.5% and 89.3%, indicating a consistent decline in performance for deeper layers.
The findings for ShuffleNet demonstrate the strong performance of Layer 2, attaining the highest accuracy of 97.2% with MGSVM. Layer 1 exhibited outstanding performance, achieving up to 96.4%, whereas Layer 3 yielded inconsistent and poor outcomes, with accuracies varying from 37.4% to 90.6%, indicating that its deep features are not as efficient as other deep layers for this kind of classification problem. The results demonstrate that intermediate layers (Layer 2) predominantly yield the most useful attributes for breast cancer detection, especially in EfficientNetB0 and ShuffleNet. These findings demonstrate the significance of choosing suitable layers for feature extraction to enhance classification efficacy and reveal the variance in contributions particular to each layer across various CNN designs.

5.2. Parameter Analysis

5.2.1. Reduction Dimensionality

This subsection examines the impact of dimensionality reduction through NNMF on classification efficacy. This study investigates the impact of altering the quantity of selected features (ranging from 10 to 100) derived from Layer 1 and Layer 2 of each CNN on the accuracy of various SVM classifiers. Table 3 and Table 4 provide an extensive overview of the identification accuracy derived from attributes gathered from Layer 1 and Layer 2 of EfficientNetB0, MobileNet, and ShuffleNet, subsequent to dimensionality reduction through NNMF. The results provide essential insights into the impact of various layers and SVM classifiers on the efficacy of breast cancer classification employing thermal imaging. Table 3 illustrates that the accuracy of the three deep neural networks leveraging features from Layer 1 varies according to the dimension of the feature set and the SVM classifier employed. The maximum classification accuracy for EfficientNetB0 was 98.1%, attained with both MGSVM and CGSVM exploiting feature sets of 10 and 80 dimensions, correspondingly. The comparable efficiency across various feature set lengths emphasizes the value of Layer 1 attributes in EfficientNetB0 for classification tasks, likely attributable to their capacity to collect lower-level spatial information.
MobileNet’s Layer 1 features achieved a peak accuracy of 98.6% with QSVM employing 40 features This outcome indicates that the features from Layer 1 of MobileNet proficiently encapsulate essential patterns for classification, leveraging concise yet meaningful representations. Nevertheless, accuracies diminished marginally as the feature set size exceeded 40, suggesting that excessive representation may introduce redundancy, thereby diminishing classifier efficacy. ShuffleNet demonstrated relatively lower accuracy, attaining a maximum performance of 96.6% when utilizing QSVM and MGSVM with 90 features. Notwithstanding the enhancements noted with increased feature dimensions, ShuffleNet’s performance remained inferior to that of EfficientNetB0 and MobileNet, indicating that its Layer 1 features may be deficient in robustness and discriminative capability compared to the other topologies.
Table 4 emphasizes Layer 2 features, demonstrating that enhanced performance among all CNNs highlights the significance of intermediate-layer features in classification tasks. The highest accuracy of 99.2% for EfficientNetB0 was attained with LSVM employing 90 features, rendering it the most precise configuration in the stage. The consistently elevated accuracies across various classifiers and feature set lengths for EfficientNetB0 Layer 2 demonstrate its capacity to identify intricate mid-level features that balance spatial and semantic information. MobileNet’s Layer 2 features achieved a peak accuracy of 97.6% with both LSVM and QSVM, deploying 100 features. This indicates a modest enhancement compared to Layer 1, yet the improvements were not as significant as those observed with EfficientNetB0, implying that MobileNet’s intermediate variables are less extensive. ShuffleNet exhibited superior performance with Layer 2 features, attaining a maximum accuracy of 97.2% using LSVM and 100 features. This enhancement relative to Layer 1 suggests that mid-level features in ShuffleNet substantially enhance classification accuracy, presumably owing to their capacity to encapsulate more intricate representations. Table 4 demonstrates that Layer 2 features consistently surpass Layer 1 features across all CNNs. This trend supports the hypothesis that intermediate layers in CNNs frequently entertain the most distinctive characteristics for classification tasks. EfficientNetB0 proved to be the best-performing construction, with its Layer 2 features yielding the highest overall accuracy, demonstrating the network’s capacity to effectively acquire significant features.

5.2.2. Feature Fusion

This subsection examines the advantages of integrating deep features from various CNN architectures (MobileNet, EfficientNetB0, and ShuffleNet) at the layer level. It examines the influence of fusing each layer of the three CNNs on the classification performance. Table 5 illustrates the influence of feature combination on classification efficacy independently throughout Layers 1, 2, and 3 of MobileNet, EfficientNetB0, and ShuffleNet. The combination of attributes from the different CNNs generally enhanced diagnostic performance, with the greatest pronounced improvements noted in Layer 3. Prior feature combination, MobileNet’s highest accuracy for Layer 1 was 98.5% with MGSVM, EfficientNetB0’s was 98.6% with QSVM and CGSVM, and ShuffleNet’s was 96.4% with MGSVM. The integration of features from all three CNNs enhanced accuracy to 98.8% with MGSVM and 98.7% with other classifiers except for LSVM which reached 98.6%, indicating a slight yet significant improvement. This enhancement illustrates that feature incorporation successfully integrates the advantages of distinct layouts, enhancing the lower-level spatial data acquired in Layer 1. On the other hand, in Layer 2, EfficientNetB0 surpassed each of the single CNNs, attaining 99.4% accuracy with LSVM, QSVM, and CSVM prior to feature combination, whereas MobileNet and ShuffleNet reached maximum accuracies of 97.2% with LSVM and MGSVM, correspondingly. Following feature combination, the accuracy rate increased to an exceptional 99.8% with MGSVM, while other classifiers consistently attained high results of 99.5% except for LSVM (99.4%). This improvement emphasizes the essential function of incorporating intermediate-layer features, which encapsulate a balance of spatial and semantic information, to optimize the accuracy of classification. Whereas in Layer 3, independent findings were significantly inferior for each of the CNNs. MobileNet attained a maximum accuracy of 91.4% using LSVM and QSVM, EfficientNetB0 attained 89.3% with QSVM, and ShuffleNet scored 90.6% with LSVM. Following the feature combination, the accuracy increased to 95.1% with CSVM, 94.7% for LSVM and QSVM, and 94.1% for MGSVM and CGSVM indicating the most significant enhancement across all layers. This substantial improvement highlights the efficacy of feature combinations in offsetting the deficiencies of deeper layers, where independent CNNs could fall short of delivering adequate discriminative capability.

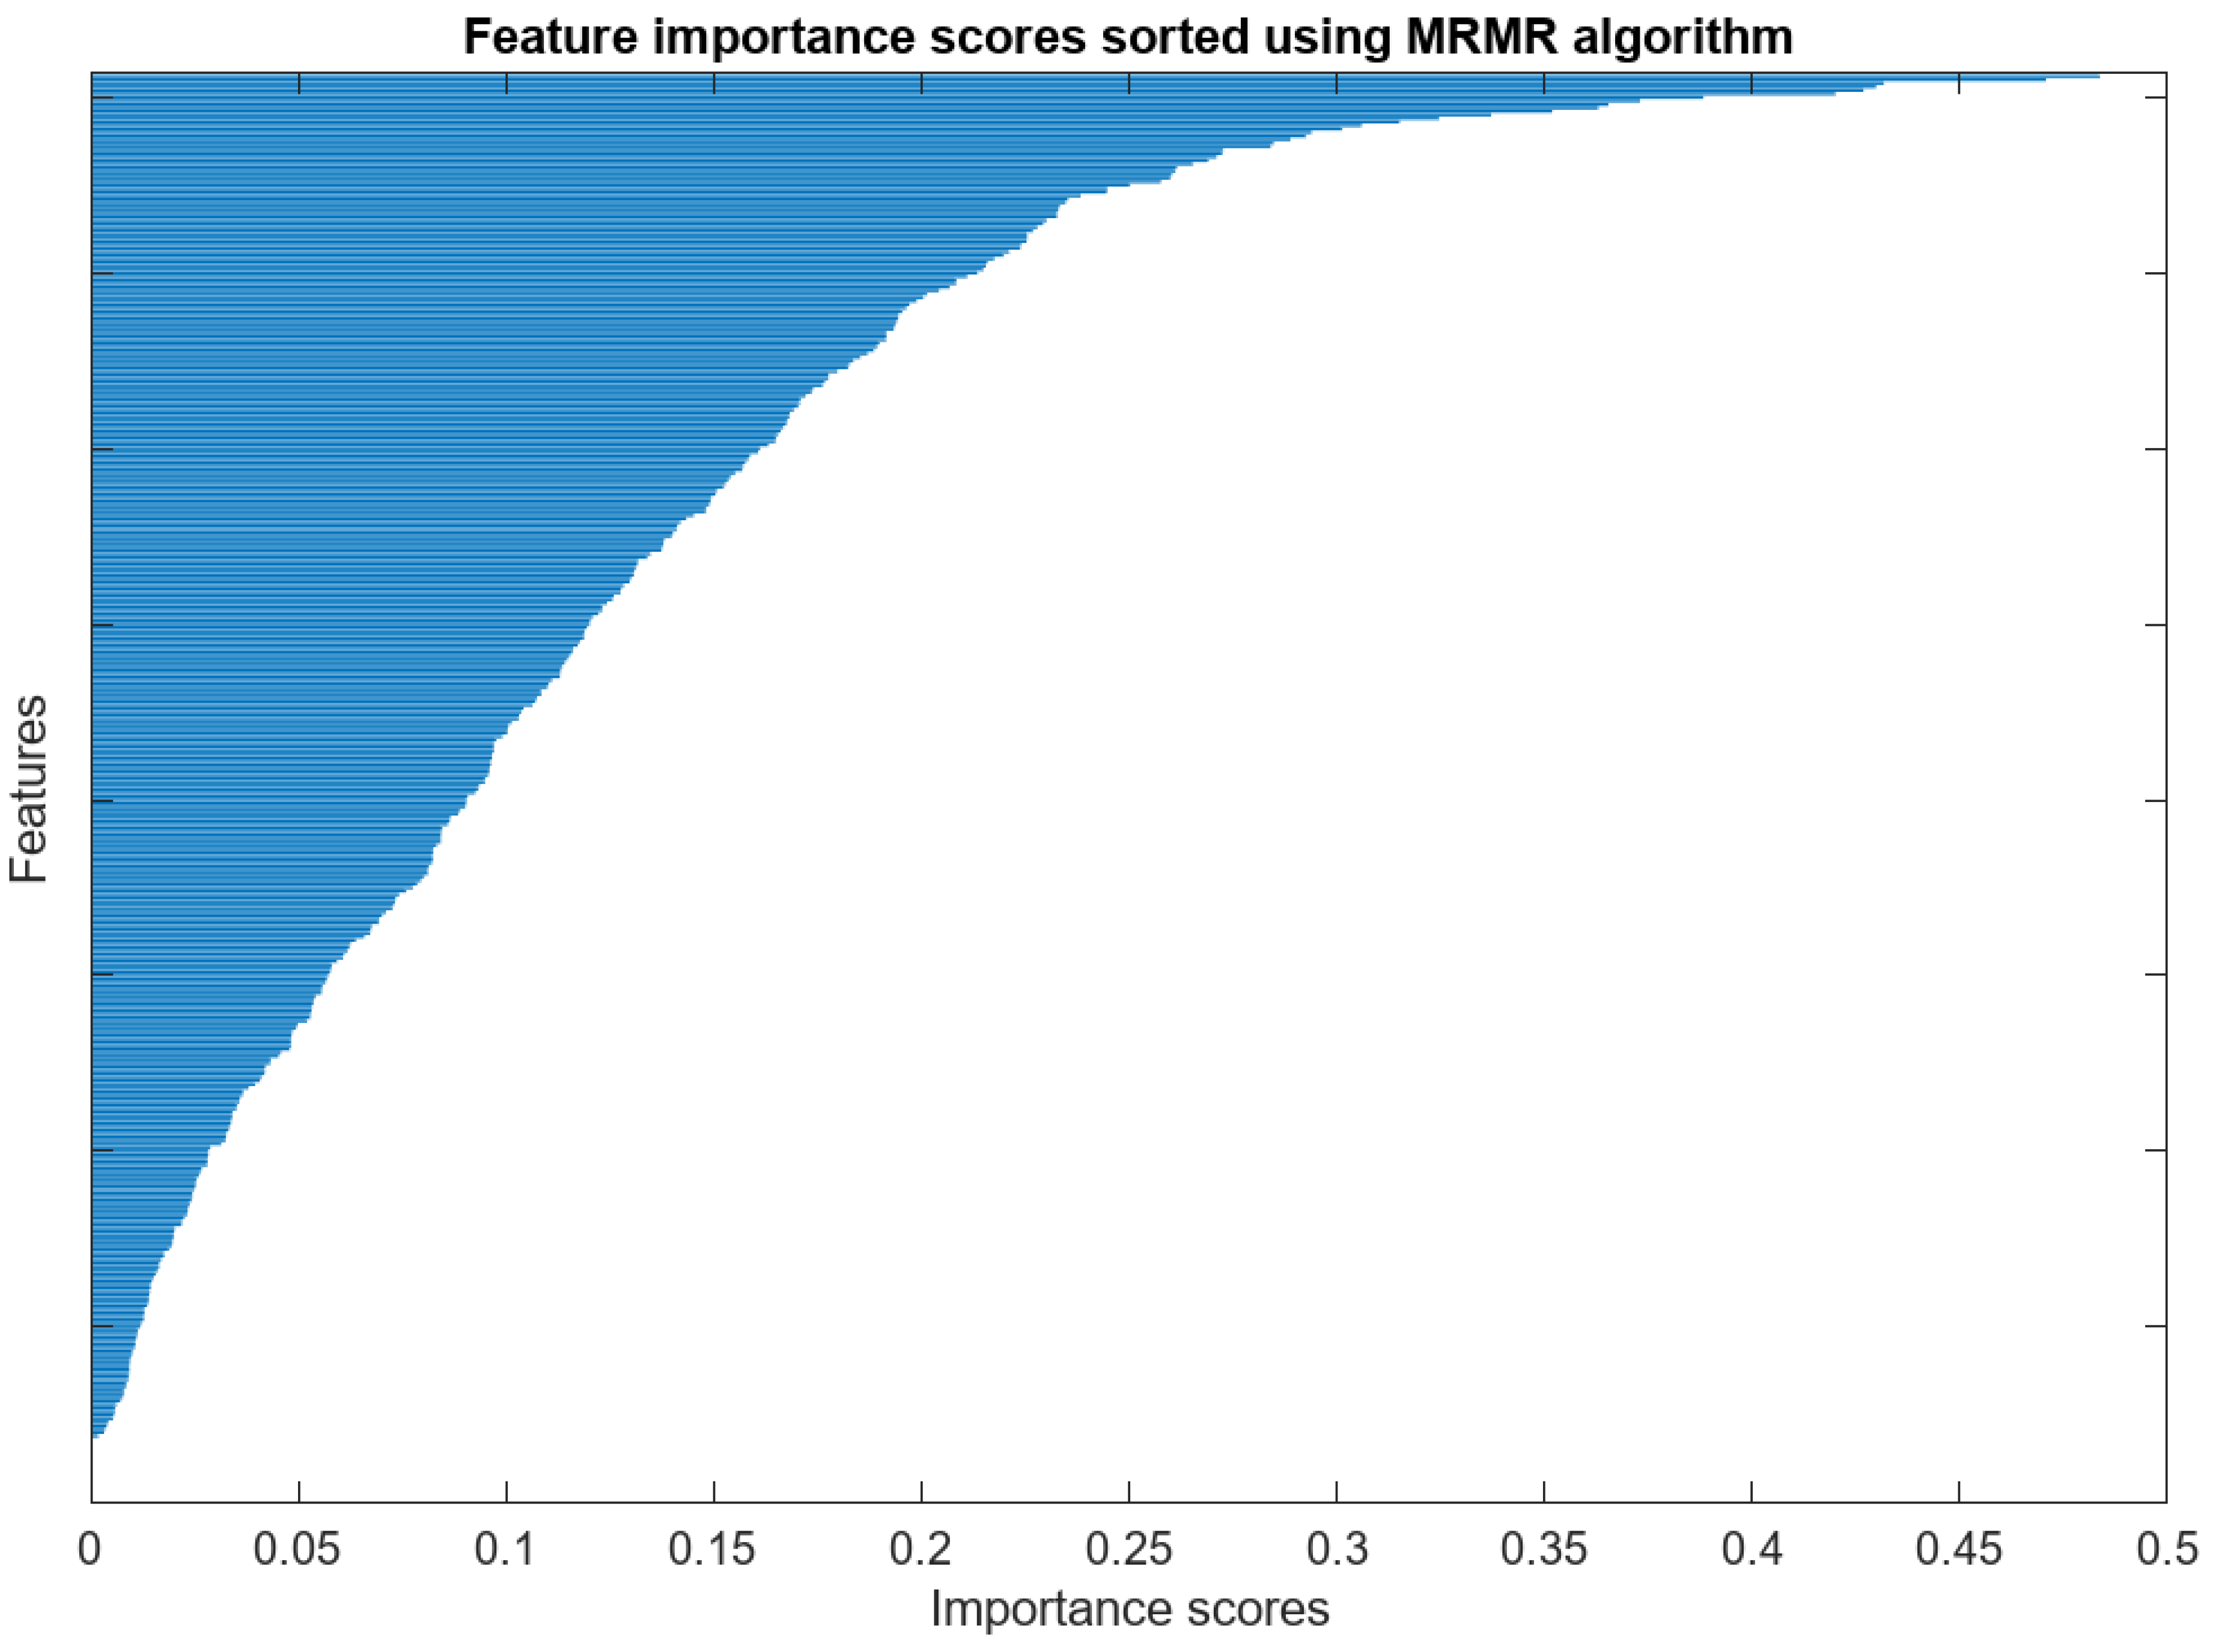
5.2.3. Feature Selection

This subsection delineates the outcomes of implementing MRMR-based feature selection on the integrated multi-layer features. It examines the effect of augmenting the number of selected features (from 50 to 400) on classification accuracy. A thorough examination of Table 6 shows the intricate connection between the classification accuracy of various SVM versions and the amount of attributes chosen using MRMR. The results indicate a steady pattern of enhanced classification accuracy as the number of attributes rises from 50 to 400. First, using 50 features, the identification accuracy scores vary from 96.1% (CGSVM) to 98.4% (CSVM), reflecting average performance. A substantial rise in accuracy is seen for all SVM classifiers as the attribute size steadily rises. The performance is especially notable when 350–400 features are chosen, with classification accuracies nearing perfection, achieving up to 99.9% for MGSVM and LSVM at 350 and 400 variables, respectively. In addition, the QSVM and CSVM demonstrate exceptional performance, consistently achieving accuracies reaching greater than 99.0% with the inclusion of over 150 features. This consistent improvement indicates an effective FS strategy, wherein additional feature dimensionality markedly improves diagnostic accuracy, though diminishing returns are noted beyond 350 features. Furthermore, QSVM, CSVM, and CGSVM reached 99.8% with 400 features. These features are much lower with higher performance (Table 2) than those of Layer 1 and Layer 2 features in scenario I of the proposed CAD. Moreover, these results are higher than those obtained in scenarios II and III of the proposed CAD (Table 3, Table 4 and Table 5). The results highlight the essential need for meticulous FS and dimensionality reduction in creating effective CAD systems for breast cancer detection via thermal imaging, indicating that deliberate FS can significantly enhance classification efficacy.
The results of Table 6 demonstrate that a reduction in the number of selected features correlates with a decrease in classification accuracy. This trend highlights the nuanced equilibrium between computational effectiveness and model accuracy in the suggested CAD system. With lower feature counts, specifically 50 or 100, the SVM classifiers demonstrate diminished accuracy—between 96.1% and 98.4%—indicating that excessive reduction in feature dimensionality may deprive the model of essential discriminative information required for precise breast cancer detection. Nonetheless, as the quantity of selected features surpasses 150, the classification performance consistently enhances, attaining outstanding accuracy (99.9%) at 350–400 features. This suggests that although diminishing feature dimensions can substantially decrease computational demands, it must be executed carefully to retain the most informative features that significantly aid classification.
The study utilizes the MRMR-based FS method to attain an optimal equilibrium between performance and computational efficiency, prioritizing features according to their relevance to the target class while reducing redundancy. This guarantees that, despite a diminished feature set, the chosen attributes are optimally informative and minimally redundant. Table 6 illustrates that when the feature count attains 350, the classification accuracy stabilises at 99.9%, signifying that additional increments in feature count do not produce substantial enhancements in performance. Consequently, choosing approximately 350 features achieves a pragmatic balance—maintaining elevated diagnostic precision while significantly reducing memory consumption, training duration, and inference complexity relative to employing the complete feature set, which initially encompassed over 1000 dimensions.
This optimized feature subset improves generalization by reducing overfitting risk and enables deployment in resource-limited settings like rural clinics or mobile health units. Consequently, the incorporation of MRMR-based feature selection allows the proposed CAD system to sustain outstanding diagnostic efficacy while guaranteeing scalability and efficiency in various clinical environments.
More evaluation measures are also calculated for the SVM classifiers trained with 350 (for MGSVM) and 400 features (all other SVMs) selected after the MRMR FS procedure. Table 7 shows these performance metrics. The outcomes of Table 7 exhibit outstanding consistency and nearly flawless performance throughout different metrics for assessment. Sensitivity scores span from 0.9960 to 0.9980, demonstrating an exceptional capacity to accurately detect positive breast cancer instances with negligible false-negative rates. Specificity and precision indicators consistently attain a maximum value of 1.000, indicating flawless differentiation between normal and abnormal thermal images with no false-positive occurrences. The F1-scores, varying from 0.9980 to 0.9990, highlight the remarkable equilibrium between precision and recall. The MCC, ranging from 0.9960 to 0.9980, reinforces the strong discriminative capability of the presented CAD system. LSVM and MGSVM slightly surpass other variants, attaining the highest sensitivity and F1-score of 0.9980, indicating their potential superiority in classifying breast cancer thermal images. The findings illustrate the effectiveness of the suggested multi-layer feature extraction, dimensionality reduction, and FS procedure in creating a highly accurate breast cancer diagnostic framework.
The confusion matrices illustrated in Figure 3 confirm the exceptional efficacy of the LSVM and MGSVM classification algorithms, showcasing their capacity to accurately categorize almost all instances as either normal or abnormal with only one instance that has been misclassified. This validates the classifiers’ capacity to consistently differentiate among normal and abnormal breast thermal photos, an essential criterion for early cancer detection and prevention. The impeccable classification outcomes presented in the confusion matrices emphasize the efficacy of the chosen features and highlight the crucial significance of the MRMR FS strategy for attaining such elevated accuracy. These results illustrate the classifiers’ discriminatory efficacy and their role in enhancing the accuracy of breast cancer diagnostics.
Figure 4 depicts the ROC curves for the LSVM and MGSVM classification algorithms, highlighting the models’ outstanding identification efficacy. Both curves attain an AUC of 1.000, indicating flawless sensitivity and specificity. The AUC score indicates that the classifiers exhibit outstanding accuracy and reliability throughout different threshold values, demonstrating their robust efficacy in differentiating between normal and abnormal cases.
Figure 5 represents the feature importance scores determined using the MRMR algorithm. These MRMR scores were calculated by taking into account both the mutual information between each feature and the class labels (relevance) and the mutual information among features (redundancy). The algorithm selects features iteratively with maximum relevance and minimum redundancy such that the features added are always contributing new information not included in the already selected features. Figure 5 presents the sorted feature importance scores, which reflect how the MRMR algorithm orders features by their contribution to classification accuracy with minimal redundancy. The smooth curve illustrated demonstrates that MRMR is successfully prioritizing the most discriminative features with decreasing returns as less informative features are included. This method avoids overfitting by removing redundant or correlated features from various CNN layers.

5.3. Cutting-Edge Comparisons

The following section presents the findings of the proposed CAD system in comparison to prior studies on breast cancer identification leveraging thermographic pictures. Table 8 demonstrates the effectiveness of the proposed CAD in breast cancer identification via thermal scans and provides an in-depth comparison with previous studies. The proposed CAD demonstrates superior results, achieving 99.9% accuracy, 99.8% sensitivity, 100% specificity, 100% precision, and 99.9% F1-score. These efficiency scores demonstrate the proposed CAD’s capabilities to identify anomalous thermal patterns associated with possible tumors, with merely one instance of misclassification. Previous studies [29] employing VGG16 alongside a sequential classifier achieved an accuracy of 99.4% and a sensitivity of 100%, with a slightly diminished specificity of 97.5%. A method adopting ResNet34 [64] in conjunction with chi-square FS and SVM achieved an accuracy of 99.62%, but it fell short of the outstanding outcomes demonstrated by the presented CAD throughout all metrics. Other studies [27,40,42,43] demonstrated significantly inferior performance relative to the presented CAD, as they relied solely on individual deep learning models. The CAD’s flawless performance in sensitivity, precision, and specificity indicates a highly reliable detection method that eliminates false negatives as well as false positives. This outcome is essential for clinical use, as it reduces the probability of missed diagnosis while concurrently eliminating unnecessary follow-up testing. The effectiveness of the proposed CAD arises from the integration of attributes from multiple compact CNN designs (SuffleNet, MobileNet, and EfficientNetB0), the application feature transformation, and mRMR for FS, which adeptly indicates distinguishing thermal features relevant to breast cancer identification.
Although research including [29,36,64] has demonstrated high accuracy with individual deep networks like VGG16 (99.4%), ResNet34 (99.62%), and custom CNN (99.33%), these approaches are predominantly dependent on end-to-end learning. This approach, while effective, frequently requires considerable computing power, a large number of parameters, and exhibits limited versatility in feature selection and dimensionality reduction. Therefore, these architectures are complex. On the other hand, the suggested CAD system mitigates such constraints by incorporating various compact CNN architectures—MobileNet, EfficientNetB0, and ShuffleNet—to create a more resilient and computationally effective system. This multi-architecture methodology improves feature diversity and minimizes architecture-specific biases, guaranteeing the model incorporates a wider array of thermal patterns linked to breast cancer.
Furthermore, the suggested CAD approach demonstrates exceptional accuracy and excels in essential clinical metrics. The model exhibits 100% specificity and precision, entirely eradicating false positives which is not the case in studies [29,36,64]. This represents a significant improvement in breast cancer screening, as false positives can result in unneeded biopsies, greater anxiety among patients, and elevated healthcare expenses. Furthermore, the model’s sensitivity of 99.8% guarantees precise detection of true positives, thereby reducing the likelihood of overlooked diagnoses. Although the absolute accuracy enhancements compared to previous studies may seem marginal, the consistent equilibrium across all performance metrics (e.g., 100% specificity vs. 97.5% in [29]) underscores the framework’s resilience and clinical dependability.
The proposed methodology also removes superfluous preprocessing phases, including intricate segmentation algorithms utilized in studies such as [27,30,36,42,65]. By optimizing the workflow and concentrating on feature extraction and classification, the study diminishes computational demands while maintaining diagnostic efficacy. The efficiency, coupled with the utilization of lightweight CNNs, guarantees that the proposed CAD system is practical and scalable for implementation in various clinical environments.
An essential novelty of the proposed CAD system resides in the multi-layer feature extraction approach. In contrast to traditional methods that exclusively utilize attributes from the final layer of a singular network, the proposed methodology extracts and integrates features from three separate layers of each CNN. This guarantees the integration of both detailed thermal variations from initial layers and overarching spatial dependencies from deeper layers into the classification process. To improve feature quality and minimize computational demands, the proposed framework utilizes sophisticated feature transformation methods including DWT and NNMF. These approaches separate physiologically pertinent thermal patterns while reducing redundancy and noise. The implementation of MRMR guarantees the retention of only the most valuable attributes, thereby condensing the feature set to 350 dimensions. This efficient method balances high diagnostic accuracy with computational efficiency, which is essential for practical application, especially in resource-limited settings. However, studies like [29,36] did not employ a feature selection approach.

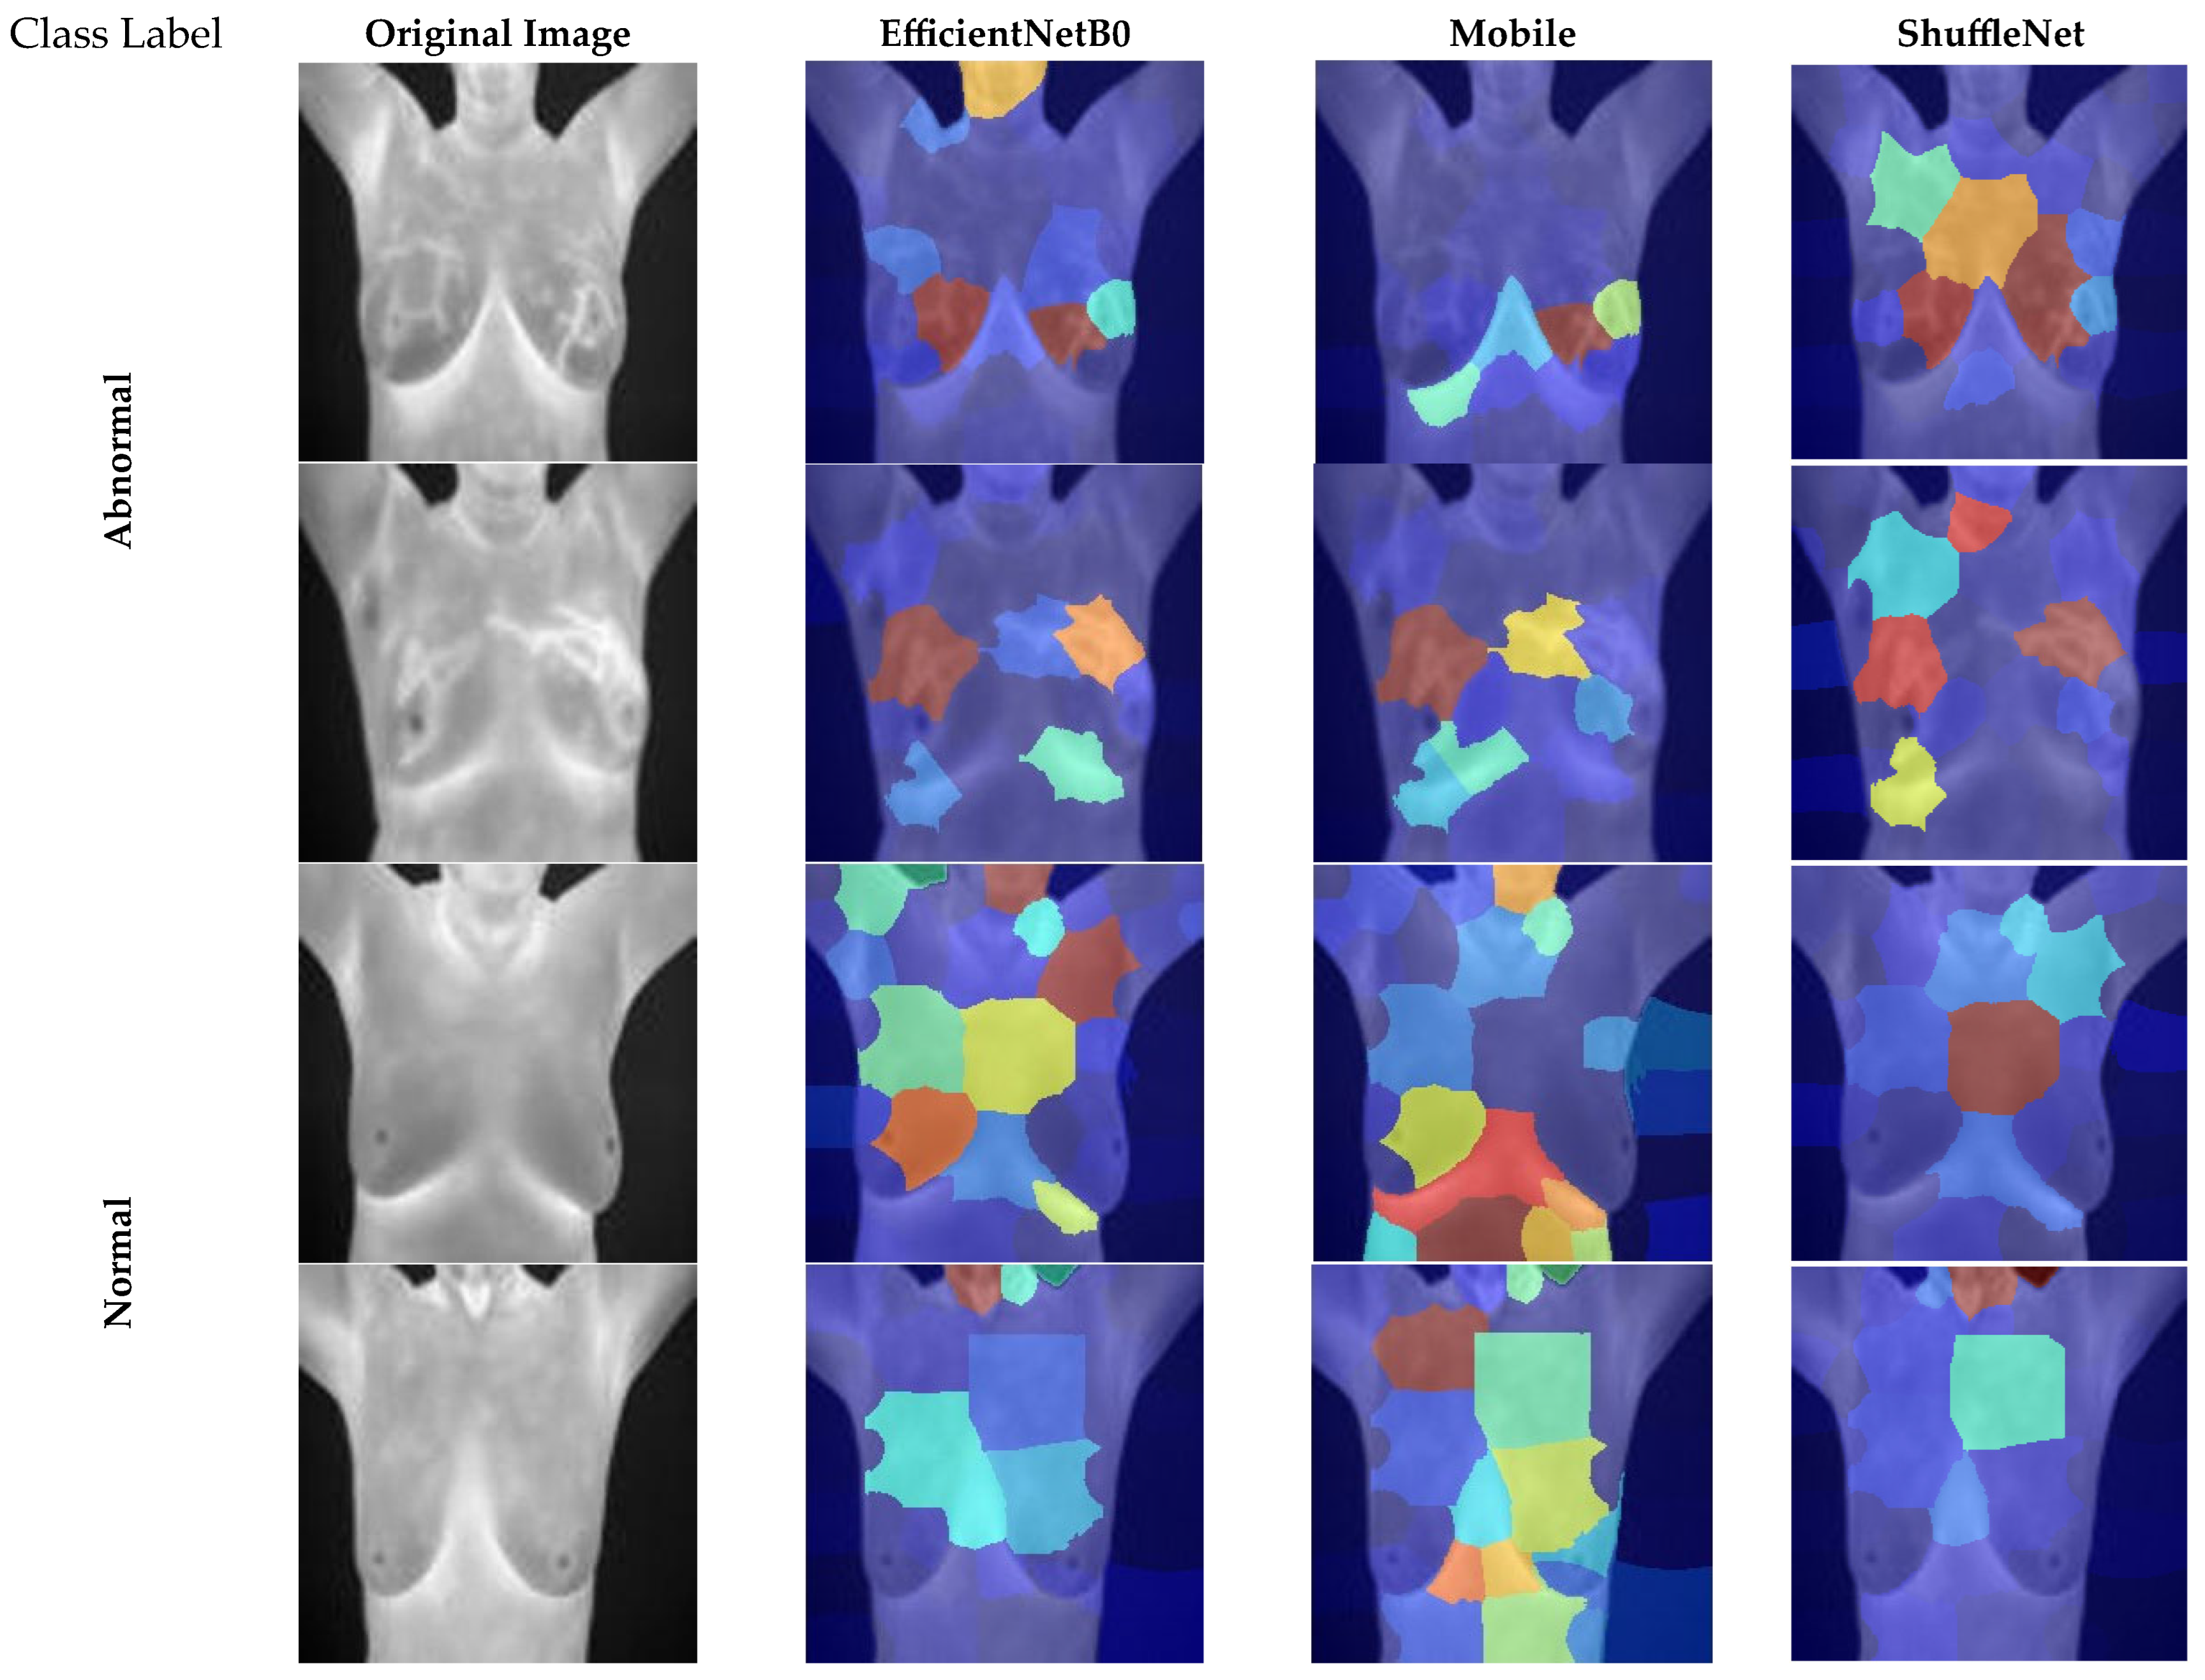
5.4. Explainability Analysis

This section provides the visual representation and interpretability analysis of the classification outcomes achieved by the three CNN models, leveraging the LIME (Local Interpretable Model-agnostic Explanations) methodology [66]. LIME is applied to produce comprehensible heatmaps that emphasize the most significant areas in thermographic photos of breasts that prompted the models to identify a case as normal or abnormal. Overlapping these clarifications on the original photos provides insight into the decision-making processes of each CNN structure, thus improving transparency and facilitating clinical interpretability. LIME is an explainable AI methodology that offers locally interpretable approximations of the behavior of complex models, including deep learning-based CNNs, facilitating a clearer understanding of the input features that most significantly influence a specific prediction. This method is particularly advantageous in medical image classification as it facilitates the visualization of the regions within a thermogram that the CNNs prioritized during their decision-making process. This interpretability is essential for verifying whether models are identifying clinically significant patterns instead of depending on artefacts or extraneous correlations. LIME generates heatmaps that emphasize areas of significant contribution, enabling clinicians to evaluate whether the model is concentrating on pertinent features, thus verifying its predictions.
Figure 6 illustrates the LIME approach used for three CNN architectures; EfficientNetB0, MobileNet, and ShuffleNet across normal and abnormal instances derived from thermographic breast images. The initial column presents the original thermogram, whereas the following columns exhibit the overlaid LIME heatmaps for each CNN. These heatmaps employ warmer hues (e.g., red) to signify areas with greater impact on the classification result. The LIME visualizations for the “abnormal” cases indicate localised areas of increased temperature or asymmetrical thermal patterns, frequently linked to pathological alterations such as inflammation or tumor formation in breast tissue. EfficientNetB0 seems to identify more accurate and localised thermal anomalies, emphasizing smaller yet highly significant areas within the breast region. Conversely, MobileNet and ShuffleNet emphasize wider thermal distributions, potentially identifying generalized patterns of heat variation along the breast contour. These differences may indicate variations in feature extraction abilities resulting from architectural design and computational efficiency limitations.
In normal instances, the LIME heatmaps demonstrate a more homogeneous distribution of the thermal contributions, with no identifiable focal hotspots observed in the breast region. This indicates that the models failed to detect any unusual thermal patterns commonly associated with abnormalities. These explanations correspond with anticipated thermal symmetry and typical vascular patterns observed in healthy individuals. The uniformity of these visual interpretations among the three CNN models strengthens confidence in their dependability and clinical validity. Furthermore, the correspondence between model explanations and established thermal properties of normal and abnormal breast tissue reinforces the reliability of the decision-making procedure of the underlying CNNs. The visual representation shown in Figure 6 illustrates the effective application of LIME to improve the interpretability of CNN-based classification systems in breast thermography, providing significant insights into model behavior and fostering increased trust and transparency in AI-assisted diagnostic decisions.

6. Discussion

The present study introduced a CAD paradigm that integrates thermal imaging, compact CNN structures, sophisticated feature transformation, selection, and combination methods to improve breast cancer identification. The CAD underwent assessment in four classification scenarios, providing a thorough understanding of the roles of individual layers, dimensionality reduction, multi-CNN feature integration, and FS in enhancing diagnostic performance. In the initial scenario, to evaluate each layer’s impact on identification, attributes were taken out of three different layers namely Layer 1, Layer 2, and Layer 3 of MobileNet, EfficientNetB0, and ShuffleNet and used to train the SVM classifiers independently. EfficientNetB0 proved to be the most proficient CNN, with Layer 2 attaining a peak accuracy of 99.4% across LSVM, QSVM, and CSVM classifiers. MobileNet demonstrated commendable performance, achieving 98.6% accuracy with its Layer 1 features when employing QSVM. In contrast, ShuffleNet exhibited inferior solo performance, reaching a maximum of 97.2% in Layer 2 with MGSVM. In addition, Layer 3 attributes across all CNNs demonstrated the poorest performance, with accuracies falling below 91.4%, highlighting their restricted discriminative capability when deployed independently.
On the other hand, the second scenario examined the effects of dimensionality reduction via NNMF on variables derived from Layers 1 and 2. The identification accuracy was enhanced while preserving computational efficiency by lowering feature dimensions to 40–80 after applying NNMF. Layer 2 attributes of EfficientNetB0 attained 99.1% accuracy with LSVM leveraging 80 features, demonstrating NNMF’s potential to maintain diagnostic significance while reducing sophistication. This dimensionality reduction efficiently balanced accuracy and feature length. Layer 2 variables significantly surpassed Layer 1 throughout all deep learning structures, highlighting their significance in classification tasks. QSVM and MGSVM proved to be highly efficient classifiers, effectively using features, while the selection of appropriate feature dimensionality (40–60 for Layer 1, 60–100 for Layer 2) was essential to prevent redundancy and uphold high accuracy. These results highlight the necessity of rigorously choosing CNN layers, SVM classifiers, and feature subset lengths to optimize diagnostic accuracy. EfficientNetB0, utilizing Layer 2 features and LSVM, constitutes the most advantageous architecture for effective breast cancer identification systems.
The third scenario emphasized the combination of features throughout the CNNs for each layer. The fusion of attributes markedly improved classification accuracy, particularly for Layer 3, where the combination of features elevated accuracy to 95.1%, in contrast to independent results that fell below 91.4%. The integration of Layer 2 features attained an accuracy of 99.8% with MGSVM, illustrating that the integration of complementary features from various CNNs encompasses diverse representations and enhances diagnostic performance. The results from Table 5 highlighted the substantial influence of feature combinations on improving classification accuracy. Prior to integration, each CNN offered restricted but complementary perspectives. Through the integration of features, especially for Layer 3, the system attained a cohesive representation that capitalized on the distinct advantages of each CNN, resulting in significant performance improvements. This illustrates the essential function of feature integration in enhancing the resilience and efficacy of CAD systems for breast cancer classification.
Finally, the fourth scenario employed mRMR FS on the integrated multi-layer attributes, attaining an outstanding accuracy of 99.9% with MGSVM exploiting merely 350 attributes. This indicated a significant enhancement across all classifiers relative to prior scenarios. For example, LSVM and QSVM, attained 98.6% and 98.7% accuracy using combined Layer 1 features, 99.4% and 99.1% accuracy using combined Layer 2 features, and 94.7% and 94.7% accuracy using combined Layer 3 features in Scenario III. These accuracies were enhanced to 99.9% and 99.8% following FS in scenario IV. Likewise, CGSVM and CSVM enhanced from 98.7% for combined Layer 1 features, 99.5% for combined Layer 2 features, and (95.1%, 94.1%) for Layer 3 features to 99.8% and 99.8%, correspondingly. All classifiers exhibited perfect specificity and precision values of 1.000, with F1-scores reaching as high as 0.999 in scenario IV. Additionally, in contrast to the second scenario, LSVM enhanced from 99.1% (EfficientNetB0 Layer 2 with NNFM) to 99.9%, QSVM escalated from 98.3% (MobileNet Layer 1 with NNMF) to 99.8%, and CGSVM advanced from 98.0% (EfficientNetB0 Layer 1 features with NNMF) to 99.8%. Furthermore, in comparison to the initial scenario, LSVM enhanced from 99.4% (Layer 2 features of EfficientNetB0 of size 1280) to 99.9% after FS with only 400 features. MGSVM enhanced from 98.5% (Layer 1 features of MobileNet of size 1280) to 99.9% with 350 features, while QSVM progressed from 98.6% (Layer 1 features of EfficientNetB0 with size 980) to 99.8% with only 400 features. The enhancements were comparable in both CGSVM and CSVM, with accuracies increasing from 98.1% and 98.4% (Layer 1 features of MobileNet with size 980) to 99.8% and 99.8%, respectively with 400 features. These comparisons highlight the significant influence of mRMR FS in optimizing feature subsets to enhance classification accuracy while reducing the cost of computation. The proposed CAD system achieved state-of-the-art accuracy by successfully combining and optimizing features from various CNN layers and structures, highlighting its capacity as a dependable and effective approach for non-invasive breast cancer detection, especially in resource-constrained environments.
Although feature extraction is routinely automated by deep networks using hierarchical learning, CNN layers encompass different levels of abstraction, ranging from low-level textures in the first layers to high-level meaningful patterns in the deeper layers. Exclusively depending on the terminal layers of a singular network may neglect intricate, layer-specific characteristics, especially in thermal imaging where pathological signs appear as localised thermal disparities instead of structural anomalies. The proposed framework utilizes features extracted from various layers of three CNN topologies (MobileNet, EfficientNetB0, and ShuffleNet) to capitalize on the unique advantages of different representations. Initial layers preserve nuanced thermal variations essential for identifying subtle anomalies, whereas intermediate layers capture spatial dependencies that augment discriminative capability.
End-to-end deep learning classification, although potent, exhibits specific drawbacks, especially in the context of medical imaging tasks. These models frequently necessitate substantial training data and computational power, and they may experience overfitting, particularly when confronted with small or imbalanced datasets, which is prevalent in medical diagnostics. Therefore, the dataset employed in the present research is insufficient for comprehensive end-to-end classification. The direct utilization of the final layers for classification may overlook significant intermediate features, thereby constraining the model’s capacity to discern nuanced patterns in thermal images.
To mitigate these limitations, the study utilized a transfer learning-based feature extraction method in conjunction with conventional classifiers. Transfer learning enables the use of pre-trained CNN algorithms, minimizing the requirement for extensive datasets and expediting convergence. The proposed framework obtained multi-layer features instead of depending exclusively on the networks’ final layers, which were subsequently enhanced with DWT and NNMF to minimize noise and redundancy. This optimized feature set was later categorized using SVM. By separating feature extraction from classification, the study enhanced accuracy and markedly decreased computational complexity, thereby rendering the model more appropriate for real-time and resource-limited contexts.
Furthermore, the effective use of DWT and NNMF fulfils two functions. Thermal images frequently exhibit noise resulting from physiological fluctuation and environmental influences. DWT disaggregates attributes into frequency sub-bands, separating physiologically pertinent thermal patterns while attenuating noise. NNMF mitigates redundancy by mapping attributes into a lower-dimensional subspace that retains non-negative, interpretable components, a characteristic especially beneficial for medical diagnostics. These transformations are not simply re-analyses of pre-extracted attributes but deliberate measures to enhance and streamline information, guaranteeing computational efficiency while maintaining diagnostic accuracy.
In addition, the MRMR feature selection technique determines a concise subset of attributes that maximizes discriminative ability and minimizes redundancy, thereby mitigating the risk of overfitting in high-dimensional feature space. This stratified methodology is empirically substantiated by the findings of the proposed framework: the integration of multi-layer, multi-architecture features with MRMR attained 99.9% accuracy utilizing merely 350 features. The findings indicate that deliberate dimensionality reduction improves generalization despite the framework’s initial complexity.
Moreover, the design of the proposed framework addresses the particular challenges associated with thermography. In contrast to mammography or MRI, thermal imaging does not possess standardized protocols for anomaly detection, and its diagnostic significance is predominantly based on dynamic thermal patterns rather than static structures. As a result, traditional deep learning frameworks designed for structural imaging could demonstrate suboptimal performance when directly employed in thermal imaging. The proposed framework methodically integrates multi-scale features and meticulously optimizes their representation to compensate for the inherent fluctuation and subtleties of thermal data.
The intricacy of the suggested approach is a deliberate attempt to reconcile reliability and computational efficiency. The utilization of compact CNNs, along with efficient feature transformation and selection methods, optimizes the workflow by removing superfluous preprocessing steps such as image enhancement and segmentation. This design decision improves classification performance and guarantees the framework’s applicability in resource-limited settings. The enhanced accuracy attained confirms the essentiality of these methodological selections, highlighting their significance in promoting non-invasive, radiation-free breast cancer detection.
Regarding the importance of minimizing model complexity and size, the study acknowledges that medical research settings frequently possess substantial computing resources. It is essential to highlight that the suggested CAD framework is intended for both well-equipped medical facilities and resource-limited environments, such as rural clinics, mobile health units, and developing areas with restricted access to advanced computing infrastructure. The proposed CAD framework aims to solve this problem by employing lightweight CNN topologies-MobileNet, EfficientNetB0, and ShuffleNet-so that the framework stays both accurate and computationally lightweight.
Besides, smaller models also provide much faster inference time, which is of great importance in real-time diagnostic applications and is conducive to rapid decisions on medical treatment without dependence on heavy-duty hardware. Besides, lightweight models are energy-efficient, in line with the more holistic movement towards sustainability in artificial intelligence work. Again, the level of energy efficiency makes these systems deployable in mobile health units or point-of-care diagnostics, thus increasing access to advanced technologies for breast cancer detection.
Also, moving from the 1000 dimensions using the full feature set to the feature set of 350 dimensions reduces memory consumption and processing loads, resulting in free and smooth integration into the existing hospital information systems without compromising their processing capabilities. This allows maximum flexibility for the proposed CAD system to perform thus it can be applied in high-end medical centers and decentralized healthcare setups.
Eventually, goal-directed simplification of the model improves scalability and broadens accessibility without compromising diagnostic proficiency. By the integration of high performance with computational efficiency, the proposed framework will ensure that state-of-the-art detection for breast cancer does not remain exclusive to medical institutions of some level and therefore promotes equitable care in all environments.

6.1. Comparative Performance Evaluation of Feature Reduction Approaches

The DWT is considered an excellent method for decomposing thermal images into multi-resolution frequency sub-bands, identifying biologically relevant thermal patterns (e.g., localized heat anomalies), and reducing high-frequency noise. As contrasted with the linear variance preservation by PCA, DWT gives the ability to capture spatial-frequency relationships that are vital for finding subtle thermal inconsistencies in breast thermograms. Low-frequency sub-bands capture global thermal trends, while the high-frequency bands accentuate subtle variations; these are hugely important for distinguishing benign from malignant cases.
NNMF was selected because it is a non-negativity constrained method consistent with the physical nature of thermal data (temperature values should be non-negative). This greatly favors the interpretability of the decomposed features from an additivity perspective, important in medical diagnosis. In contrast, PCA and Autoencoders allow for the presence of negative components; this makes clinical interpretation challenging. NNMF has the ability to provide parts-based representations that help in localizing thermal signatures (e.g., tumor-induced vascular changes) that would have otherwise gone unnoticed with linear methods, such as PCA.
  • PCA: generally effective for linear dimensionality reduction; however, it also assumes Gaussian distribution with linear correlations, which may not be effective on the nonlinear and heterogeneous thermal patterns in breast thermography.
  • t-SNE/UMAP: These techniques are best suited for visualization through local structure preservation. However, these are computationally very expensive and do not fit well for learning an effective subspace of features for further classification tasks. Their stochastic nature can also affect reproducibility by introducing variability.
  • Autoencoders: Though powerful in producing nonlinear embeddings, they require huge amounts of training data and significant computational resources to get them to perform well. This is opposed to what could be achieved by accomplishing a light, efficient deployment in the resource-limited context.
Table 9 shows a comparative performance evaluation with dimensionality reduction approaches including NNMF, PCA, and Autoencoders. The outcomes indicate that NNMF performs better than PCA and Autoencoders in all models and layers tested. For instance, with EfficientNetB0 Layer 1 deep features, NNMF achieved a classification accuracy of 98.1% with LSVM, whereas PCA and Autoencoders achieved 97.2% and 97.9%, respectively. Similarly, in Layer 2, NNMF achieved an accuracy of 98.9% with LSVM, whereas PCA and Autoencoders both achieved 98.7%. This trend is also seen in other architectures like MobileNet and ShuffleNet. Notably, NNMF yielded equal or better performance across all classifiers, i.e., QSVM, CSVM, MGSVM, and CGSVM. The advantage of NNMF is that it has the ability to factorize data into non-negative components without loss of additivity of features and with enhanced interpretability. These results show how well NNMF reduces dimensions and captures the most discriminative features—qualities especially important for higher classification accuracy. The method guarantees that only non-redundant and highly relevant features are extracted by means of the integration of NNMF and MRMR, so augmenting the resilience of our suggested method.

6.2. Complexity Analysis of the Proposed CAD

The computational effectiveness, feature dimensions, and classification complexity of the suggested CAD system in various configurations are all thoroughly examined in the complexity analysis shown in Table 10. This table demonstrates the influence of features extracted from different layers of multiple CNNs, along with feature reduction techniques like DWT, NNMF, and multi-layer fusion strategies, on overall model complexity and decision-making speed. The quantity of parameters, layer depth, input feature size, and classification duration collectively provide insights into the trade-offs among accuracy, interpretability, and computational feasibility in the deployment of these models for thermographic breast image classification.
Among end-to-end CNN models, ShuffleNet exhibits the least parameter number (~1.3 million) and a relatively shallow structure (~30 layers), leading to a shorter classification time of 6525 s. Conversely, EfficientNetB0, comprising roughly 5.3 million parameters and 82 layers, demonstrates markedly greater computational requirements, evidenced by its extended classification duration of 15,870 s. MobileNet possesses approximately 3.5 million parameters and requires 4194 s for classification. These figures correspond with the anticipated computational behaviors of each network, wherein deeper and more intricate architectures inherently entail increased processing overhead. Nonetheless, notwithstanding their disparities in computational expense, all three models function as proficient feature extractors across various network depths; layer 1 (early-level), layer 2 (mid-level), and layer 3 (high-level) prior to being input into the MGSVM classifier for conclusive decision-making.
The raw feature dimensions extracted from layer 1 of ShuffleNet, MobileNet, and EfficientNetB0 are 26,656, 62,720, and 62,720, respectively which are massive. Subsequent to the application of DWT, their dimensions approached 417, 980, and 980, respectively, resulting in a classification time ranging from 1.4029 to 2.3946 s. Subsequently, Layer 1 features are subjected to additional dimensionality reduction through NNMF, yielding compacted representations of 70, 40, and 60 features for ShuffleNet, MobileNet, and EfficientNetB0, respectively. This significant reduction demonstrates the efficacy of DWT and NNMF in maintaining discriminative information while reducing redundancy, thus enhancing both computational efficiency and classification duration (0.8532 to 1.1128 s). At layer 2, the initial feature dimensions are larger (544 for ShuffleNet; 1280 for MobileNet and EfficientNetB0) with classification durations ranging from 1.8921 to 3.3868 s; however, following the application of NNMF, they are diminished to 80, 100, and 50 features, respectively. These reductions enable expedited classification times (between 0.8532 and 1.1128 s) without noticeable degradation in diagnostic performance, indicating that the compressed feature sets maintain adequate discriminatory capacity for precise classification.
Fusion techniques at both intra-CNN and inter-CNN levels increase complexity while simultaneously improving model robustness by amalgamating complementary information from various layers and architectures. In Scenario II, where features from the same layer of all three CNNs are merged, the input feature dimensions expand to 6 (layer 3), 230 (layer 2), and 170 (layer 1). Notwithstanding this augmentation, the classification durations remain minimal (0.96–0.95 s), signifying that the MGSVM adeptly accommodates the expanded feature space. In Scenario III, employing a multi-CNN and multi-layer fusion method, succeeded by mRMR feature selection, the resultant feature set consists of 350 features. This configuration results in a classification time of 1.4045 s, but it likely provides the most thorough representation by integrating various hierarchical features from multiple CNNs, thereby improving the model’s capacity to detect subtle thermal variations indicative of abnormalities.
The complexity analysis highlights a distinct correlation among model depth, feature dimensionality, and classification efficacy. End-to-end deep learning methodologies provide substantial representational capacity, but they entail a heightened computational burden. Conversely, feature engineering methodologies such as DWT, NNMF, and mRMR-based fusion facilitate a balance between accuracy and efficacy, rendering them especially appropriate for real-time or resource-limited diagnostic applications. The findings substantiate the justification for the proposed hybrid CAD framework, which exploits the advantages of various CNNs and sophisticated feature processing techniques to attain both elevated diagnostic accuracy and comprehensible decision pathways via LIME-based visual elucidations.

6.3. Shortcomings and Possible Future Directions

The suggested CAD paradigm exhibited notable enhancements in breast cancer identification through thermal scanning; however, multiple drawbacks require consideration. First, it only considered identifying breast cancer without classifying the subcategory of breast cancer or whether it is benign or malignant. Second, the study employed several lightweight CNN structures—MobileNet, EfficientNetB0, and ShuffleNet—which, although efficient, may fail to capture specific complex characteristics that deeper or custom-designed networks, or other newer architectures such as vision transformers (ViT) could offer. Exploring the incorporation of more sophisticated topologies or ViT may enhance performance considerably. A further constraint pertains to the generalizability of the findings. The CAD paradigm was evaluated using a certain dataset that may not encompass all possible differences in breast cancer instances, especially those affected by demographics or environmental variables. Extending the assessment to larger, more heterogeneous datasets and conducting cross-validation on external datasets is crucial for ensuring robustness and wider applicability. The system presupposes the availability of high-quality, preprocessed thermal images; however, managing discrepancies in image quality and artefacts in practical situations poses an obstacle. Creating preprocessing algorithms capable of adapting to suboptimal data contexts would enhance the practicality of the CAD system for clinical application. Furthermore, this study did not use XAI to interpret the manner in which decisions were made using deep learning models. The future plans may encompass the real-time deployment of the CAD system for expedited diagnostic support and its incorporation into telemedicine platforms, especially in areas with limited access. Investigating XAI methodologies that clarify the model’s decisions would improve clinical acceptability by offering transparency and practical recommendations for healthcare practitioners. Enhancing the system via multimodal integration of other scanning modalities such as mammogram and ultrasound, using more datasets to increase generalizability, classifying breast cancer into subcategories, and using more recent deep learning models such as ViT which could enhance breast cancer diagnostics.
Regrettably, the publicly accessible DMR-IR dataset lacks comprehensive clinical annotations, including tumor size, stage, and histopathological validation, which are either absent or reported inconsistently. This limitation signifies a more extensive challenge in thermography-based research rather than a particular deficiency of the study. The study acknowledges the importance of integrating mammography data and BIRADS scoring to correlate thermographic findings with recognized radiologic reporting systems. Such an approach would undoubtedly enhance the analysis and facilitate the contextualizationization of each case within a standardized framework. This study concentrated solely on thermographic images due to dataset limitations and aimed to create a standalone, radiation-free alternative for situations where mammography is either unavailable or contraindicated. Although multimodal integration represents a promising avenue for future research, it was outside the parameters of the present study. The limitations identified pertain not only to the specific dataset but also to the overall accessibility and standardization of thermographic data in medical imaging research. These omissions may create biases and influence the generalizability of the results. The author advocates for the creation and dissemination of more extensive, clinically annotated thermographic datasets that encompass staging information, lesion type classifications, and correlations with other imaging modalities. These efforts will be crucial in progressing the field and ensuring that thermography-based CAD systems can be thoroughly validated for practical clinical application.
Moreover, the absence of external validation due to the lack of publicly accessible thermographic datasets impairs the generalizability of the model across varied populations and acquisition situations. Future work will focus on addressing these limitations by cooperating with medical organizations to acquire and annotate larger and more varied datasets to be able to perform external validation.
This study’s dataset categorizes both benign and malignant lesions as “abnormal”. The existing CAD framework is designed not to distinguish between cancer subtypes but serves as an initial screening technique that identifies potentially abnormal thermal patterns for subsequent clinical assessment. The lack of variables like tumor stage, the ratio of benign to malignant cases, and radiological correlation constitutes a limitation of the dataset and restricts the clinical applicability of the findings. Furthermore, despite the dataset consisting of thermal images from a limited cohort of patients, the incorporation of multiple views and images per subject, along with transfer learning, and cross-validation, alleviates data scarcity to a degree. Future research will concentrate on validating the model with broader, clinically annotated datasets that include histopathologic and radiologic ground truth to confirm the framework’s clinical relevance.

7. Conclusions

The present research presented a CAD paradigm that exploited features derived from compact CNN structures, integrated with sophisticated feature transformation and selection methods, to improve the identification of breast cancer through thermal imaging. The study analyzed the effects of feature extraction from various layers across three CNN structures and assessed which layer exerted the most significant effect on the identification process, yielding insights into the most essential interpretations for classification. The findings revealed the substantial influence of incorporating variables from various CNN layers and topologies on classification efficacy. EfficientNetB0 considerably surpassed MobileNet and ShuffleNet, especially regarding Layer 2 features, attaining a peak accuracy of 99.4%. Furthermore, the combination of attributes significantly enhanced classification accuracy throughout all layers, with the most pronounced enhancement occurring in Layer 3, where the combined features elevated accuracy to 95.1%, in contrast to individual Layer CNN accuracies below 91.4%. Furthermore, by integrating deep attributes from all three layers of the three CNNs and employing the NNMF FS method, the accuracy attained a remarkable accuracy of 99.9% with the MGSVM classifier deploying merely 350 features. The ROC analysis, exhibiting an AUC of 1.000 for both LSVM and MGSVM classifiers, affirmed the model’s outstanding sensitivity and specificity, thereby confirming its robustness and reliability in differentiating normal from abnormal cases. The results obtained demonstrated the potential of combining multi-layered features from lightweight CNNs with dimensionality reduction methods to enhance diagnostic accuracy and decrease computational burden, presenting a promising avenue for the advancement of CAD systems in medical imaging applications.

Funding

This research received no external funding.

Institutional Review Board Statement

Not applicable.

Informed Consent Statement

Not applicable.

Data Availability Statement

The dataset employed in this research is the DMR-IR collection, and could be cited as: Silva, L. F., Saade, D. C. M., Sequeiros, G. O., Silva, A. C., Paiva, A. C., Bravo, R. S., & Conci, A. (2014). A new database for breast research with infrared image. Journal of Medical Imaging and Health Informatics, 4(1), 92–100. Such database is available to the public via the Figshare repository at the following link: https://figshare.com/articles/dataset/S1_Dataset_rar/21225422?file=37645916, accessed on 2 September 2024. The images of DMR-IR are also available via the following link: https://visual.ic.uff.br/dmi/.

Conflicts of Interest

The author declares no conflicts of interest.

References

  1. Atrey, K.; Singh, B.K.; Bodhey, N.K.; Pachori, R.B. Mammography and Ultrasound Based Dual Modality Classification of Breast Cancer Using a Hybrid Deep Learning Approach. Biomed. Signal Process. Control 2023, 86, 104919. [Google Scholar] [CrossRef]
  2. Atrey, K.; Singh, B.K.; Bodhey, N.K. Multimodal Classification of Breast Cancer Using Feature Level Fusion of Mammogram and Ultrasound Images in Machine Learning Paradigm. Multimed. Tools Appl. 2024, 83, 21347–21368. [Google Scholar] [CrossRef]
  3. Yaffe, M.J. Mammographic Density. Measurement of Mammographic Density. Breast Cancer Res. 2008, 10, 209. [Google Scholar] [CrossRef]
  4. Nazari, S.S.; Mukherjee, P. An Overview of Mammographic Density and Its Association with Breast Cancer. Breast Cancer 2018, 25, 259–267. [Google Scholar] [CrossRef] [PubMed]
  5. Boca, I.; Ciurea, A.I.; Ciortea, C.A.; Dudea, S.M. Pros and Cons for Automated Breast Ultrasound (ABUS): A Narrative Review. J. Pers. Med. 2021, 11, 703. [Google Scholar] [CrossRef] [PubMed]
  6. Heller, S.L.; Moy, L. Breast MRI Screening: Benefits and Limitations. Curr. Breast Cancer Rep. 2016, 8, 248–257. [Google Scholar] [CrossRef]
  7. Dar, R.A.; Rasool, M.; Assad, A. Breast Cancer Detection Using Deep Learning: Datasets, Methods, and Challenges Ahead. Comput. Biol. Med. 2022, 149, 106073. [Google Scholar]
  8. Pokharel, A.; Luitel, N.; Khatri, A.; Khadka, S.; Shrestha, R. Review on the Evolving Role of Infrared Thermography in Oncological Applications. Infrared Phys. Technol. 2024, 140, 105399. [Google Scholar] [CrossRef]
  9. Yoshida, S.; Nakagawa, S.; Yahara, T.; Koga, T.; Deguchi, H.; Shirouzu, K. Relationship Between Microvessel Density and Thermographic Hot Areas in Breast Cancer. Surg. Today 2003, 33, 243–248. [Google Scholar] [CrossRef]
  10. Mashekova, A.; Zhao, Y.; Ng, E.Y.; Zarikas, V.; Fok, S.C.; Mukhmetov, O. Early Detection of the Breast Cancer Using Infrared Technology–A Comprehensive Review. Therm. Sci. Eng. Prog. 2022, 27, 101142. [Google Scholar] [CrossRef]
  11. Singh, D.; Singh, A.K. Role of Image Thermography in Early Breast Cancer Detection-Past, Present and Future. Comput. Methods Programs Biomed. 2020, 183, 105074. [Google Scholar] [CrossRef] [PubMed]
  12. Gonzalez-Hernandez, J.-L.; Recinella, A.N.; Kandlikar, S.G.; Dabydeen, D.; Medeiros, L.; Phatak, P. Technology, Application and Potential of Dynamic Breast Thermography for the Detection of Breast Cancer. Int. J. Heat Mass Transf. 2019, 131, 558–573. [Google Scholar] [CrossRef]
  13. Yousuff, M.; Babu, R.; Ramathulasi, T. Artificial Intelligence in Medical Image Processing. In Artificial Intelligence for Health 4.0: Challenges and Applications; River Publishers: Aalborg, Denmark, 2023; pp. 269–302. [Google Scholar]
  14. Chan, H.; Hadjiiski, L.M.; Samala, R.K. Computer-aided Diagnosis in the Era of Deep Learning. Med. Phys. 2020, 47, e218–e227. [Google Scholar] [CrossRef] [PubMed]
  15. Attallah, O. Acute Lymphocytic Leukemia Detection and Subtype Classification via Extended Wavelet Pooling Based-CNNs and Statistical-Texture Features. Image Vis. Comput. 2024, 147, 105064. [Google Scholar] [CrossRef]
  16. Pacal, I. MaxCerVixT: A Novel Lightweight Vision Transformer-Based Approach for Precise Cervical Cancer Detection. Knowl.-Based Syst. 2024, 289, 111482. [Google Scholar] [CrossRef]
  17. Attallah, O. RADIC: A Tool for Diagnosing COVID-19 from Chest CT and X-Ray Scans Using Deep Learning and Quad-Radiomics. Chemom. Intell. Lab. Syst. 2023, 233, 104750. [Google Scholar] [CrossRef]
  18. Attallah, O. Multi-Domain Feature Incorporation of Lightweight Convolutional Neural Networks and Handcrafted Features for Lung and Colon Cancer Diagnosis. Technologies 2025, 13, 173. [Google Scholar] [CrossRef]
  19. Attallah, O. Skin-CAD: Explainable Deep Learning Classification of Skin Cancer from Dermoscopic Images by Feature Selection of Dual High-Level CNNs Features and Transfer Learning. Comput. Biol. Med. 2024, 178, 108798. [Google Scholar] [CrossRef]
  20. Attallah, O. A Hybrid Trio-Deep Feature Fusion Model for Improved Skin Cancer Classification: Merging Dermoscopic and DCT Images. Technologies 2024, 12, 190. [Google Scholar] [CrossRef]
  21. Attallah, O. GabROP: Gabor Wavelets-Based CAD for Retinopathy of Prematurity Diagnosis via Convolutional Neural Networks. Diagnostics 2023, 13, 171. [Google Scholar] [CrossRef]
  22. Elkorany, A.S.; Elsharkawy, Z.F. Efficient Breast Cancer Mammograms Diagnosis Using Three Deep Neural Networks and Term Variance. Sci. Rep. 2023, 13, 2663. [Google Scholar] [CrossRef] [PubMed]
  23. Pacal, I.; Attallah, O. InceptionNeXt-Transformer: A Novel Multi-Scale Deep Feature Learning Architecture for Multimodal Breast Cancer Diagnosis. Biomed. Signal Process. Control 2025, 110, 108116. [Google Scholar] [CrossRef]
  24. Anwar, F.; Attallah, O.; Ghanem, N.; Ismail, M.A. Automatic Breast Cancer Classification from Histopathological Images. In Proceedings of the 2019 International Conference on Advances in the Emerging Computing Technologies (AECT), Al Madinah Al Munawwarah, Saudi Arabia, 10 February 2020; IEEE: Piscataway, NJ, USA, 2020; pp. 1–6. [Google Scholar]
  25. Chougrad, H.; Zouaki, H.; Alheyane, O. Deep Convolutional Neural Networks for Breast Cancer Screening. Comput. Methods Programs Biomed. 2018, 157, 19–30. [Google Scholar] [CrossRef]
  26. Shahid, A.H.; Singh, M.P. Computational Intelligence Techniques for Medical Diagnosis and Prognosis: Problems and Current Developments. Biocybern. Biomed. Eng. 2019, 39, 638–672. [Google Scholar] [CrossRef]
  27. Dharani, N.P.; Govardhini Immadi, I.; Narayana, M.V. Enhanced Deep Learning Model for Diagnosing Breast Cancer Using Thermal Images. Soft Comput. 2024, 28, 8423–8434. [Google Scholar] [CrossRef]
  28. Tello-Mijares, S.; Woo, F.; Flores, F. Breast Cancer Identification via Thermography Image Segmentation with a Gradient Vector Flow and a Convolutional Neural Network. J. Healthc. Eng. 2019, 2019, 9807619. [Google Scholar] [CrossRef]
  29. Ahmed, F.; Rahman, M.; Akter Shukhy, S.; Mahmud Sisir, A.; Alam Rafi, I.; Khan, R.K. Breast Cancer Detection with Vgg16: A Deep Learning Approach with Thermographic Imaging. Int. J. Intell. Syst. Appl. Eng. 2024, 12. [Google Scholar]
  30. Ekici, S.; Jawzal, H. Breast Cancer Diagnosis Using Thermography and Convolutional Neural Networks. Med. Hypotheses 2020, 137, 109542. [Google Scholar] [CrossRef]
  31. Howard, A.G.; Zhu, M.; Chen, B.; Kalenichenko, D.; Wang, W.; Weyand, T.; Andreetto, M.; Adam, H. Mobilenets: Efficient Convolutional Neural Networks for Mobile Vision Applications. arXiv 2017, arXiv:170404861. [Google Scholar]
  32. Tan, M.; Le, Q. Efficientnet: Rethinking Model Scaling for Convolutional Neural Networks. In Proceedings of the International Conference on Machine Learning, Long Beach, CA, USA, 9–15 June 2019; Proceedings of Machine Learning Research (PMLR). pp. 6105–6114. [Google Scholar]
  33. Zhang, X.; Zhou, X.; Lin, M.; Sun, J. Shufflenet: An Extremely Efficient Convolutional Neural Network for Mobile Devices. In Proceedings of the IEEE Conference on Computer Vision and Pattern Recognition, Salt Lake City, UT, USA, 18–23 June 2018; IEEE: Piscataway, NJ, USA, 2018; pp. 6848–6856. [Google Scholar]
  34. Rasti, R.; Teshnehlab, M.; Phung, S.L. Breast Cancer Diagnosis in DCE-MRI Using Mixture Ensemble of Convolutional Neural Networks. Pattern Recognit. 2017, 72, 381–390. [Google Scholar] [CrossRef]
  35. Du, C.; Wang, Y.; Wang, C.; Shi, C.; Xiao, B. Selective Feature Connection Mechanism: Concatenating Multi-Layer CNN Features with a Feature Selector. Pattern Recognit. Lett. 2020, 129, 108–114. [Google Scholar] [CrossRef]
  36. Mohamed, E.A.; Rashed, E.A.; Gaber, T.; Karam, O. Deep Learning Model for Fully Automated Breast Cancer Detection System from Thermograms. PLoS ONE 2022, 17, e0262349. [Google Scholar] [CrossRef] [PubMed]
  37. Dihmani, H.; Bousselham, A.; Bouattane, O. A New Computer Aided Diagnosis for Breast Cancer Detection of Thermograms Using Metaheuristic Algorithms and Explainable AI. Algorithms 2024, 17, 462. [Google Scholar] [CrossRef]
  38. Mirasbekov, Y.; Aidossov, N.; Mashekova, A.; Zarikas, V.; Zhao, Y.; Ng, E.Y.K.; Midlenko, A. Fully Interpretable Deep Learning Model Using IR Thermal Images for Possible Breast Cancer Cases. Biomimetics 2024, 9, 609. [Google Scholar] [CrossRef] [PubMed]
  39. Yadav, S.S.; Jadhav, S.M. Thermal Infrared Imaging Based Breast Cancer Diagnosis Using Machine Learning Techniques. Multimed. Tools Appl. 2022, 81, 13139–13157. [Google Scholar] [CrossRef]
  40. Sánchez-Cauce, R.; Pérez-Martín, J.; Luque, M. Multi-Input Convolutional Neural Network for Breast Cancer Detection Using Thermal Images and Clinical Data. Comput. Methods Programs Biomed. 2021, 204, 106045. [Google Scholar] [CrossRef]
  41. Nissar, I.; Alam, S.; Masood, S. Computationally Efficient LC-SCS Deep Learning Model for Breast Cancer Classification Using Thermal Imaging. Neural Comput. Appl. 2024, 36, 16233–16250. [Google Scholar] [CrossRef]
  42. Tsietso, D.; Yahya, A.; Samikannu, R.; Tariq, M.U.; Babar, M.; Qureshi, B.; Koubaa, A. Multi-Input Deep Learning Approach for Breast Cancer Screening Using Thermal Infrared Imaging and Clinical Data. IEEE Access 2023, 11, 52101–52116. [Google Scholar] [CrossRef]
  43. Nogales, A.; Perez-Lara, F.; García-Tejedor, Á.J. Enhancing Breast Cancer Diagnosis with Deep Learning and Evolutionary Algorithms: A Comparison of Approaches Using Different Thermographic Imaging Treatments. Multimed. Tools Appl. 2024, 83, 42955–42971. [Google Scholar] [CrossRef]
  44. Pramanik, R.; Pramanik, P.; Sarkar, R. Breast Cancer Detection in Thermograms Using a Hybrid of GA and GWO Based Deep Feature Selection Method. Expert Syst. Appl. 2023, 219, 119643. [Google Scholar] [CrossRef]
  45. Munguía-Siu, A.; Vergara, I.; Espinoza-Rodríguez, J.H. The Use of Hybrid CNN-RNN Deep Learning Models to Discriminate Tumor Tissue in Dynamic Breast Thermography. J. Imaging 2024, 10, 329. [Google Scholar] [CrossRef] [PubMed]
  46. Kaddes, M.; Ayid, Y.M.; Elshewey, A.M.; Fouad, Y. Breast Cancer Classification Based on Hybrid CNN with LSTM Model. Sci. Rep. 2025, 15, 4409. [Google Scholar] [CrossRef] [PubMed]
  47. Silva, L.F.; Saade, D.C.M.; Sequeiros, G.O.; Silva, A.C.; Paiva, A.C.; Bravo, R.S.; Conci, A. A New Database for Breast Research with Infrared Image. J. Med. Imaging Health Inform. 2014, 4, 92–100. [Google Scholar] [CrossRef]
  48. Chakraborty, J.; Nandy, A. Discrete Wavelet Transform Based Data Representation in Deep Neural Network for Gait Abnormality Detection. Biomed. Signal Process. Control 2020, 62, 102076. [Google Scholar] [CrossRef]
  49. Zhang, D. Wavelet Transform. In Fundamentals of Image Data Mining; Springer: Berlin/Heidelberg, Germany, 2019; pp. 35–44. [Google Scholar]
  50. Bahoura, M.; Ezzaidi, H.; Méthot, J.-F. Filter Group Delays Equalization for 2D Discrete Wavelet Transform Applications. Expert Syst. Appl. 2022, 200, 116954. [Google Scholar] [CrossRef]
  51. Alickovic, E.; Kevric, J.; Subasi, A. Performance Evaluation of Empirical Mode Decomposition, Discrete Wavelet Transform, and Wavelet Packed Decomposition for Automated Epileptic Seizure Detection and Prediction. Biomed. Signal Process. Control 2018, 39, 94–102. [Google Scholar] [CrossRef]
  52. Lee, D.D.; Seung, H.S. Learning the Parts of Objects by Non-Negative Matrix Factorization. Nature 1999, 401, 788–791. [Google Scholar] [CrossRef] [PubMed]
  53. Berry, M.W.; Browne, M.; Langville, A.N.; Pauca, V.P.; Plemmons, R.J. Algorithms and Applications for Approximate Nonnegative Matrix Factorization. Comput. Stat. Data Anal. 2007, 52, 155–173. [Google Scholar] [CrossRef]
  54. Févotte, C.; Idier, J. Algorithms for Nonnegative Matrix Factorization with the β-Divergence. Neural Comput. 2011, 23, 2421–2456. [Google Scholar] [CrossRef]
  55. Wang, Y.-X.; Zhang, Y.-J. Nonnegative Matrix Factorization: A Comprehensive Review. IEEE Trans. Knowl. Data Eng. 2012, 25, 1336–1353. [Google Scholar] [CrossRef]
  56. Gillis, N. The Why and How of Nonnegative Matrix Factorization. Regul. Optim. Kernels Support Vector Mach. 2014, 12, 257–291. [Google Scholar]
  57. Hoyer, P.O. Non-Negative Matrix Factorization with Sparseness Constraints. J. Mach. Learn. Res. 2004, 5, 1457–1469. [Google Scholar]
  58. Lu, J.; Behbood, V.; Hao, P.; Zuo, H.; Xue, S.; Zhang, G. Transfer Learning Using Computational Intelligence: A Survey. Knowl.-Based Syst. 2015, 80, 14–23. [Google Scholar] [CrossRef]
  59. Attallah, O. Deep Learning-Based CAD System for COVID-19 Diagnosis via Spectral-Temporal Images. In Proceedings of the 2022 The 12th International Conference on Information Communication and Management, London, UK, 13–15 July 2022; pp. 25–33. [Google Scholar]
  60. Attallah, O. ADHD-AID: Aiding Tool for Detecting Children’s Attention Deficit Hyperactivity Disorder via EEG-Based Multi-Resolution Analysis and Feature Selection. Biomimetics 2024, 9, 188. [Google Scholar] [CrossRef]
  61. Radovic, M.; Ghalwash, M.; Filipovic, N.; Obradovic, Z. Minimum Redundancy Maximum Relevance Feature Selection Approach for Temporal Gene Expression Data. BMC Bioinform. 2017, 18, 9. [Google Scholar] [CrossRef]
  62. Ershadi, M.M.; Seifi, A. Applications of Dynamic Feature Selection and Clustering Methods to Medical Diagnosis. Appl. Soft Comput. 2022, 126, 109293. [Google Scholar] [CrossRef]
  63. Peng, H.; Long, F.; Ding, C. Feature Selection Based on Mutual Information Criteria of Max-Dependency, Max-Relevance, and Min-Redundancy. IEEE Trans. Pattern Anal. Mach. Intell. 2005, 27, 1226–1238. [Google Scholar] [CrossRef]
  64. Nguyen Chi, T.; Le Thi Thu, H.; Doan Quang, T.; Taniar, D. A Lightweight Method for Breast Cancer Detection Using Thermography Images with Optimized CNN Feature and Efficient Classification. J. Imaging Inform. Med. 2024, 38, 1434–1451. [Google Scholar] [CrossRef]
  65. Madhavi, V.; Thomas, C.B. Multi-View Breast Thermogram Analysis by Fusing Texture Features. Quant. InfraRed Thermogr. J. 2019, 16, 111–128. [Google Scholar] [CrossRef]
  66. Ribeiro, M.T.; Singh, S.; Guestrin, C. “Why Should I Trust You?”: Explaining the Predictions of Any Classifier. In Proceedings of the 22nd ACM SIGKDD International Conference on Knowledge Discovery and Data Mining, San Francisco, CA, USA, 13–17 August 2016; ACM: San Francisco, CA, USA, 2016; pp. 1135–1144. [Google Scholar]
Figure 1. Thermal IR photos of the breast from the DMR-IR dataset.
Applsci 15 07181 g001
Figure 2. Summary of the steps of the presented CAD system.
Applsci 15 07181 g002
Figure 3. Confusion matrices for the LSVM and MGSVM classification algorithms after the NNMF approach.
Applsci 15 07181 g003
Figure 4. ROC curves for the LSVM and MGSVM classification algorithms after the NNMF approach.
Applsci 15 07181 g004
Figure 5. Sorted feature importance scores calculated using the MRMR feature selection approach by taking into account both the mutual information between each feature and the class labels (relevance) and the mutual information among features (redundancy).
Applsci 15 07181 g005
Figure 6. Visual representation of the LIME XAI approach for the three CNNs to interpret how decisions were made for each CNN in case of normal and abnormal cases.
Applsci 15 07181 g006
Table 1. The dimensions of the feature vectors obtained from the multiple layers of the three deep neural networks.
CNN ModelLayer 3 Number of FeaturesLayer 2 Number of FeaturesLayer 1 (Before Reduction) Number of FeaturesLayer 1 (After Reduction) Number of Features
MobileNet2128062,720980
ShuffleNet254426,656417
EfficientNetB02128062,720980
Table 2. An ablation study showing the identification accuracy (%) achieved by the SVM classifiers trained with deep attributes acquired from different layers of each deep neural network.
CNN ModelCNN LayerLSVMQSVMCSVMMGSVMCGSVM
MobileNetLayer 198.298.298.498.598.1
Layer 297.296.996.697.296.1
Layer 391.491.473.590.190.2
EfficientNetB0Layer 198.298.698.698.498.0
Layer 299.499.499.499.399.2
Layer 388.789.388.589.088.5
ShuffleNetLayer 195.696.196.396.492.8
Layer 296.096.596.597.293.6
Layer 390.685.937.489.389.1
Table 3. The identification accuracy (%) attained using the SVM classifiers learned with the reduced NNMF variables obtained from layer 1 of each deep neural network.
CNN Model and LayerNumber of FeaturesLSVMQSVMCSVMMGSVMCGSVM
EfficientNetB0 Layer 1 Deep Features1096.897.897.798.196.1
2097.797.997.697.897.5
3097.997.797.597.997.7
4097.898.097.997.898.0
5097.897.997.898.097.8
6098.197.997.798.098.0
7097.697.997.898.098.0
8098.198.197.997.497.8
9097.998.097.597.598.0
10097.397.297.297.297.6
MobileNet Layer 1 Deep Features1097.498.297.798.196.5
2098.298.298.597.995.9
3097.998.198.197.997.8
4098.398.698.198.398.2
5097.798.197.797.497.7
6097.898.098.097.997.9
7097.897.697.797.697.6
8097.897.697.797.697.6
9098.098.098.097.497.9
10097.797.897.797.797.7
ShuffleNet Layer 1 Deep Features1092.495.094.295.391.0
2095.596.496.296.196.3
3095.695.795.496.394.4
4095.396.395.996.294.0
5095.296.295.696.293.4
6095.295.895.596.094.2
7096.396.496.196.394.5
8096.096.296.596.594.2
9095.096.696.096.694.5
10095.494.794.695.793.9
Table 4. The identification accuracy (%) attained using the SVM classifiers learned with the reduced NNMF variables obtained from layer 2 of each deep neural network.
CNN Model and LayerNumber of FeaturesLSVMQSVMCSVMMGSVMCGSVM
EfficientNetB0 Layer 2 Deep Features1097.297.897.698.196.2
2098.698.798.798.898.5
3098.799.099.098.498.1
4098.798.498.598.598.6
5098.999.199.099.098.3
6098.598.298.098.598.6
7098.799.098.798.998.7
8099.198.898.898.698.8
9099.299.198.998.898.8
10098.598.898.798.298.2
MobileNet Layer 2 Deep Features1096.497.297.597.294.7
2097.097.297.497.596.9
3097.097.297.497.596.9
4097.497.497.397.397.4
5097.197.297.097.397.3
6097.196.996.796.997.1
7097.596.997.097.097.2
8097.297.697.397.597.2
9097.396.997.597.197.7
10097.697.597.697.297.0
ShuffleNet Layer 2 Deep Features1093.996.296.296.893.0
2095.197.096.596.293.9
3096.397.096.496.295.5
4096.095.595.596.495.8
5096.496.596.296.396.1
6096.796.096.096.495.5
7096.195.895.895.995.9
8096.797.096.896.995.8
9096.496.896.196.496.1
10097.296.795.796.596.0
Table 5. The identification accuracy (%) accomplished with the SVM classifiers learned with the combined deep feature sets of each independent layer (layer 1, layer 2, and layer 3) of the three CNNs.
CNN LayerCNN ModelLSVMQSVMCSVMMGSVMCGSVM
Layer 1 FeaturesMobileNet98.298.298.498.598.1
EfficientNet98.298.698.698.498.0
SuffleNet 95.6 96.1 96.3 96.4 92.8
Combined Features98.698.798.798.898.7
Layer 2 FeaturesMobileNet97.296.996.697.296.1
EfficientNet99.499.499.499.399.2
ShuffleNet96.096.596.597.293.6
Combined Features99.499.599.599.899.5
Layer 3 FeaturesMobileNet91.491.473.590.190.2
EfficientNet88.789.388.589.088.5
SuffleNet90.685.937.489.389.1
Combined Features94.794.795.194.194.1
Table 6. The identification accuracy (%) reached by the SVM classifiers versus the number of features selected using the MRMR FS approach and fed to these classifiers.
Number of FeaturesLSVMQSVMCSVMMGSVMCGSVM
5096.997.798.496.896.1
10097.898.998.997.997.2
15098.699.399.499.097.8
20099.499.499.599.598.2
25099.499.699.599.598.8
30099.499.699.699.599.4
35099.699.799.799.999.6
40099.999.899.899.999.8
Table 7. Assessment metrics computed for the SVM classifiers developed with the chosen attributes NNMF FS applied to the combined deep features of the three layers of the three deep neural networks.
MetricLSVMQSVMCSVMMGSVMCGSVM
Sensitivity0.99800.99600.99600.99800.9960
Specificity1.0001.0001.0001.0001.000
Precision1.0001.0001.0001.0001.000
F1-score0.99900.99800.99800.99900.9980
MCC0.99800.99600.99600.99800.9960
Table 8. Cutting-edge comparisons of the suggested CAD with related works.
StudySegmentationFeature SelectionMethodsAccuracySensitivitySpecificityPrecisionF1-Score
[36]U-NetNoCustomized CNN0.99331.000.9867
[27]Fuzzy C-means ClusteringNoCustomized EDCNN0.9680 0.9370
[43]Temperature RangesNoCustomized CNN0.93850.90530.97000.9666
[29]NoNoVGG16 + Sequential Classifier0.99401.000.97500.98900.9980
[40]NoNoCustomized CNN0.9701.000.830
[65]level-set segmentationNoGLCM + GLRM + GLSZM + NGTDM + PCA + SVM0.9601.000.920
[42]Canny Edge Detector + Morphological Operations +NoAlexNet0.90480.93330.83330.9333
[30]Morphological operation + object-oriented segmentationNoCustomized CNN0.98950.98280.99590.9956
[64]NoYesResNet34 + Chi-square + SVM0.99620.9963 0.99630.9963
ProposedNoYesMobileNet, EfficientNetB0, and ShuffleNet + NNMF + SVM0.99900.99801.0001.0000.9990
Table 9. A comparative performance evaluation with dimensionality reduction approaches including NNMF, PCA, and Autoencoders.
CNN ModelCNN LayerDimensionality ReductionLSVMQSVMCSVMMGSVMCGSVM
EfficientNetB0Layer 1 FeaturesNNMF98.197.997.798.098.0
PCA97.297.897.397.197.6
Autoencoders97.997.898.098.397.6
Layer 2 FeaturesNNMF98.999.199.099.098.3
PCA98.798.598.198.799.1
Autoencoders98.799.098.798.998.7
MobileNetLayer 1 FeaturesNNMF98.398.698.198.398.2
PCA98.197.897.297.997.9
Autoencoders98.197.997.798.198.2
Layer 2 FeaturesNNMF97.697.597.697.297.0
PCA97.697.196.997.397.0
Autoencoders97.196.896.897.095.8
ShuffleNetLayer 1 FeaturesNNMF96.396.496.196.394.5
PCA94.994.793.595.194.6
Autoencoders95.795.295.796.294.9
Layer 2 FeaturesNNMF96.797.096.896.995.8
PCA95.996.095.896.696.1
Autoencoders96.896.896.696.996.3
Table 10. A complexity analysis and classification time for the suggested CAD.
ModelInput Data/
Feature Size to Classifier
Amount of Deep Network
Parameters
Amount of LayersClassification Time
(Seconds)
Classification
Complexity (O)
CNN Models of the Proposed CAD (End-to-End Deep Learning Classification)
ShuffleNet224 × 224 × 3~1.3 M~306525 O ( k · n · d 2 )  
k: kernel length
n: The overall length of the pattern (the amount of input entries)
d: dimensionality of presentation
MobileNet224 × 224 × 33.5 M284194
EfficientNetB0224 × 224 × 35.3 M8215,870
Layer Level Features
(Scenario I of the Proposed CAD)
Layer 3
Features
ShuffleNet = 2MGSVM
P a r a m e t e r s = s · p + s + 1
s = number of support vectors
p: number of features
-
0.99779 O ( n 2 · p )
p: number of features
n: number of input samples
Mobile = 22.5092
EfficientB0 = 20.9251
Layer 2
Features
ShuffleNet = 5441.8921
Mobile = 12803.3620
EfficientB0 = 12803.3868
Layer 1
Features after DWT
ShuffleNet = 4171.4029
Mobile = 9802.3265
EfficientB0 = 9802.3946
Layer Level Features after NNMF
Layer 2 after NNMFShuffleNet = 80MGSVM
P a r a m e t e r s = s · p + s + 1
s = number of support vectors
p: number of features
0.9910 O ( n 2 · p )
p: number of features
n: number of input samples
Mobile = 1001.0079
EfficientB0 = 500.9373
Layer 1 after DWT and NNMFShuffleNet = 701.1128
Mobile = 400.8532
EfficientB0 = 600.8762
Layer Level Fusion
(Scienario II of the Proposed CAD)
Layer 3 Features of the three CNNs6MGSVM
P a r a m e t e r s = s · p + s + 1
s = number of support vectors
-
0.96421 O ( n 2 · p )
p: number of features
n: number of input samples
Layer 2 Features of the three CNNs2300.95033
Layer 1 Features of the three CNNs1700.95719
Multi-CNN Multi-Layer Level Fusion
(Scienario III of the Proposed CAD)
Features selected using mRMR350MGSVM
P a r a m e t e r s = s · p + s + 1
s = number of support vectors
-
1.4045 O ( n 2 · p )
p: number of features
n: number of input samples
Disclaimer/Publisher’s Note: The statements, opinions and data contained in all publications are solely those of the individual author(s) and contributor(s) and not of MDPI and/or the editor(s). MDPI and/or the editor(s) disclaim responsibility for any injury to people or property resulting from any ideas, methods, instructions or products referred to in the content.

