Featured Application
Testing and evaluation of physiological closed-loop controllers for ventilator management.
Abstract
Automated ventilator controllers have the potential to simplify oxygen and carbon dioxide management for trauma. In the pre-hospital or military medicine environment, trauma care can be required for prolonged periods by personnel with limited ventilator management training. As such, there is a need for closed-loop control systems that can adapt ventilator management to a complex, ever-changing medical environment. Here, we present a novel hardware-in-loop test platform for the independent troubleshooting and evaluation of oxygen and carbon dioxide automated ventilator management capabilities. The oxygen management system provides an analogue blood oxygen signal that is responsive to the fraction of inspired oxygen and the peak inspiratory pressure ventilator settings. A tested oxygenation controller successfully reached the target oxygen saturation within 5 min. The carbon dioxide removal system integrates with commercial ventilator technology and mimics carbon dioxide generation, lung compliance, and airway resistance while providing an end-tidal carbon dioxide level that is responsive to changes in the tidal volume and respiratory rate settings. A test mechanical ventilator controller was able to regulate EtCO2 regardless of the starting value within 10 min. This highlights the system’s functionality and provides proof-of-concept demonstrations for how the hardware-in-loop test platforms can be used for evaluating closed-loop controller technologies.
1. Introduction
Automated controllers have been developed for various tasks in a variety of different industries. Automation has been used in agriculture, the automotive industry, as well as the medical field [1,2,3]. Automation in medicine has the potential to streamline medical procedures, reduce the cognitive burden on medical providers, lower the skill threshold for challenging procedures, and improve patient outcomes, and has been implemented in extracorporeal circulatory support systems [4], resuscitation during hemorrhagic shock [5], and assisted ventilation in intensive care units [6].
Fully automated mechanical ventilation has been an increasingly researched topic due to the COVID-19 pandemic, resulting in studies on controllers being developed [7] and further integrated with patient monitoring [8]. Even with this increased research on mechanical ventilation, respiratory failure occurrences following trauma-induced shock occur, even as other parameters, such as hemodynamics, may have appeared satisfactory to medical providers [9]. Failure to manage appropriate ventilation during respiratory failure can rapidly become fatal, serving as a significant contributor to potentially preventable mortality in trauma emergencies [10]. To increase the survival of patients requiring ventilation, automated ventilator controllers need to be able to manage the delivery of oxygen (O2), normalize alveolar ventilation in the lungs, increase lung volume, reduce the work required for breathing, and aid in carbon dioxide (CO2) removal, ensuring appropriate oxygenation and the removal of waste from the system [11]. Automated ventilation controllers, in addition to managing various aspects of patient respiration, will also need to include safeguards for the prevention of ventilator-induced lung injuries, which can be caused by both the over- and under-inflation of the lungs. This highlights the need for automated controllers to include precise ventilator strategies that minimize extending the lungs into the ranges where injury can occur, unless absolutely necessary for patient survival [12,13].
Designing controllers to manipulate physiological parameters is difficult due to the complexity of biological systems [14]. This difficulty greatly increases with traumatic injury where the body’s natural “control” systems are rapidly changing and interacting with each other to mitigate the effects of trauma and increase the likelihood of survival [15,16]. The design of human physiological controllers often relies on data from animal studies [17,18], such as those performed on swine. While swine are a recognized model for certain human physiology due to their similarities [19], there remain differences compared to humans that must be fully addressed in clinical trials prior to regulatory approval [20]. Large amounts of data from animal studies are usually required for designing and debugging physiological controllers, with additional large animal studies needed to field test the controllers post-designing and debugging. This iterative process is costly as large animals require housing at an accredited research facility that must provide a highly regulated regimen of care, following strict standards for appropriate nourishment, general well-being, and veterinary services. This cost is compounded by the often-large number of animals required to statistically power these studies and the substantial time and personnel commitments required to complete studies.
To mitigate the downsides of extensive animal testing, hardware-in-loop (HIL) benchtops have been used for more streamlined testing. HIL testing enables the more robust evaluation of how controllers will perform when real-world equipment is in use—a feature lacking with strictly in silico models. With the rapidly accelerating advancement of computational capabilities that enable the use of larger and more sophisticated machine learning models, in silico ventilation patient simulators have been growing ever more robust. They have been able to predict individual patient changes in response to ventilator settings as well as gas/aerosol substance transport [21,22,23]. However, these models still require extensive, highly specialized datasets from clinical trials for training [22]. Some models enable communication with external sensors and devices, but the outputs of the physical devices do not directly impact the sensor readings [24]. The ventilator settings or measurements of the output are commonly used to estimate a change in the physiological variables, which are then simulated and streamed to the sensors. Previous benchtop models for simulating physiological data have been developed for testing patient care during a coma [25], the testing of cerebrospinal fluid shunt systems [26], and the testing of fluid resuscitation strategies for patients experiencing hemorrhagic shock [27]. There have been several HIL systems previously developed for mechanical ventilation. Simulated lungs that mimic specific respiratory dynamics have been used for controllers that manage positive end-expiratory pressure (PEEP) [28], and in silico simulations have been designed for modeling the interactions between mechanical ventilators and human lungs [29]. There have also been complex lung simulators developed, like the xPULM simulator developed by Pasteka et al. Their system combines in silico, ex vivo, and mechanical components into one physical platform to capture flow and pressure changes at differing respiratory rates (RRs) and tidal volumes (VT) [30]. Another group developed a physical lung model with adjustable mechanical properties that was able to mimic a normal lung, an obstructive lung, and restrictive lung diseases [31]. However, these models primarily focus on physically reproducing the pressure and volume mechanics of ventilation and—except for Laubscher et al.—still use in silico simulations for CO2 generation and/or end-tidal CO2 (EtCO2) waveforms. Additionally, none of these models account for O2 delivery, which is one of the primary purposes of mechanical ventilation. More recent HIL testbeds that have sought to incorporate a measurement of O2 delivery have done so by introducing an SpO2 simulator that interacts with the testbed [24]. The work described here presents novel oxygenation and CO2 ventilation HIL testing setups for the development and testing of automated ventilation controllers. In summary, this work provided the following contributions:
- The development and characterization of a HIL ventilation system for oxygenation
- The development and characterization of a HIL system for CO2 ventilation using commercial ventilator technology
- Proof-of-concept closed-loop ventilator controller evaluation using HIL systems and physiological scenarios to highlight the utility of the ventilator test platform
2. Materials and Methods
To establish an initial proof of concept for HIL platforms, we targeted two vital signs as corollaries to the primary purposes of mechanical ventilation mentioned above; these were (i) SpO2 for both O2 delivery [32] and atelectasis prevention and (ii) EtCO2 for the removal of carbon dioxide [33]. An effective test platform must not only be able to simulate normal physiologically relevant behavior but must also allow some degree of independent manipulation of the signals to simulate “sick” patients to test the limits of a controller’s capabilities. To achieve this, we opted to isolate the ventilation/CO2 removal module from the O2 transport module, reducing the complex challenges that would be involved in producing a controllable O2-CO2 gas exchange medium. We termed these two simulation modules MechVent and OxyVent, respectively. The following is a description of the design and initial system characterization testing for both the MechVent and OxyVent modules, ending with a description of the proof-of-concept automated ventilator control logic and testing approaches.
2.1. MechVent Development
To control EtCO2, mechanical ventilators modulate various settings including the PEEP, peak inspiratory pressure (PIP), and minute ventilation (MV)—which is itself the arithmetical product of VT and RR. Additional physiological characteristics that directly impact the dynamics of mechanical ventilation include airway resistance (Raw) and lung compliance (CL). The MechVent module was primarily designed to generate EtCO2 readings within a physiological range that responds to changes in the select ventilator settings mentioned above while also enabling the adjustment of simulated patient variables (namely Raw and CL). Development and testing were conducted using the MOVES® SLC™ ventilator platform (Thornhill Medical, Toronto, ON, Canada). This system was selected due to its ruggedized design for prehospital medicine and ongoing collaboration with the manufacturer, which allowed for the reading of input data and the sending of ventilator commands in real time. This capability was essential for tuning and characterizing the MechVent system, as well as testing a proof-of-concept automated ventilator controller.
The design and development of the MechVent system, as shown in Figure 1, began with the selection of cylindrical bellows (McMaster-Carr, Elmhurst, IL, USA) with cuff ends that could be sealed on one end using a cuff insert and secured to the manifold that connected to the ventilator on the other. The size of the bellows was chosen to operate within a relevant VT range of 200–1200 mL without overly stressing the bellows’ material. Key interface components—including the central three-way hub, hose fittings, a custom choke, and parts for the Raw and CL adjustments—were modeled using computer-aided design (CAD) software and were either 3D printed or assembled from laser-cut acrylic parts. A 5 in (127 mm) diameter acrylic cylinder was used to house the bellows, and a laser-cut lid was fixed to the cuff insert on the upper end of the bellows. The combination of the cylinder housing and lid served to ensure the even and unidirectional expansion of the bellows during respiration and provided a support platform for the CL adjustment compartment. Lung compliance was manually set by placing standardized weights in the CL compartment. As CL changes are more associated with chronic conditions and are not expected to rapidly change during trauma [34], setting this simulated patient characteristic once at the beginning of a test was considered acceptable; this was in comparison to an automated real-time adjustment. The lower end of the bellows was attached to the central three-way hub, which was seated within the base of the housing. The central hub contained three ports: the main port that attached to the bellows, a supply port that was connected to the CO2 supply, and the final port that connected to the ventilator.
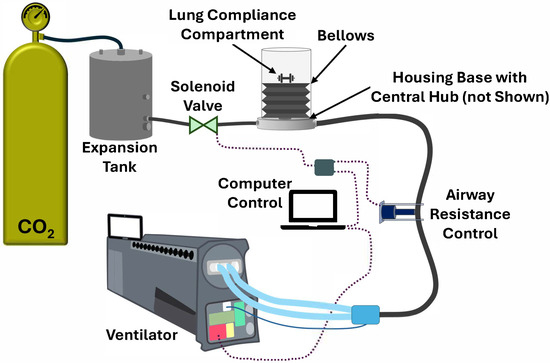
Figure 1.
Diagram of the MechVent hardware-in-loop test module for the evaluation of CO2 removal. CO2 gas flows from the supply tank to the expansion tank and bellows. Lung compliance and airway resistance can be adjusted in the hardware-in-loop system. The ventilator measures EtCO2 and enables the tidal volume and respiratory rate settings to be set via computer control.
As an analogue for CO2 generation, a compressed gas cylinder (Airgas, Radnor, PA, USA) supplying medical-grade CO2 was used, and components were connected using ¼ in (~6.4 mm) plastic tubing. A two-stage regulator was used to reduce the pressure to around 10 psi (~517 mmHg) and was connected to a 15 gal (~57-L) expansion tank (McMaster-Carr, Elmhurst, IL, USA) to stabilize the supply pressure. The initial MechVent design employed continuous flow and a custom-designed choke, which was connected to an adapter fitting that then connected to the supply port of the central hub. The custom choke was later replaced by an automated solenoid valve, as shown in the diagram, enabling variable CO2 generation based on how rapidly the valve opened and closed. The final port of the hub was connected to the ventilator using ¾ in (~19 mm) plastic tubing and a fitting that connected to the standardized vent hose. The Raw control was positioned along the ¾ in (~19 mm) tubing between the hub and the vent hose connection and comprised a 12 V linear actuator, a microcontroller (Arduino®, Monza, Italy), and two relays configured as an H-bridge circuit to control polarity. This setup enabled the bi-directional control of the actuator’s extension, allowing the tubing to be pinched at various levels to simulate different airway resistances. The Raw system was constrained to three positions: Open, Partial (occluding the tubing by approximately half), and Full (denoting full extension of the actuator, while still allowing minimal airflow). Intermediate positions were explored and found to have minimal to no effect on system responsiveness beyond what was already obtained by these three positions.
2.2. Characterization of the MechVent Module
A comprehensive series of tests was developed to characterize the system’s response; these focused on variations in MV, Raw, and CL. The calculated CL values and the corresponding expiratory tidal volume (VTE) were recorded using various loads in the CL compartment ranging from 200 to 1000 g. The calculated Raw values and corresponding VTE and inspiratory tidal volume (VTI) were also recorded at each Raw setting. A baseline CL load of 500 g and an ‘Open’ Raw level were used for all EtCO2 control testing. The system performance was evaluated across RRs ranging from 6 to 30 breaths per minute (BPM), and each test ran for 10 min, generating 600 data points per scenario. Pearson’s correlation values between the controller parameters and responses were calculated, as were the statistical significances for each correlation. Although the ventilator did not support Continuous Mandatory Ventilation (CMV), the system was tested using Intermittent Mandatory Ventilation (IMV) modes. This resulted in minor discrepancies between the VTI and VTE, but the testing protocol still facilitated the collection of critical data, enabling the simulation of real-world ventilatory conditions and contributing to system refinement.
In addition, a series of proof-of-concept tests were conducted on the MechVent module to confirm its usability for evaluating automated ventilation controllers. A simple decision-table-based controller following a modified version of the Acute Respiratory Distress Syndrome Network (ARDSNet) protocol (Figure 2A) [35] was used to bring the system within the target range of 30–40 mmHg. Test runs were conducted at 60 s sampling rates and included scenarios with either low (~20 mmHg) or high (~60 mmHg) starting EtCO2 values. To achieve the different baseline EtCO2 levels while holding the initial settings of the system constant (7 L/min, MV and 5 cm H2O, PEEP), a solenoid valve was used in place of the custom choke, with the duration of valve opening controlling the CO2 supply (Figure 2B). The simulated patient’s weight was defined as 70 kg in order to provide sufficient VT overhead for the upper MV range of the ARDSNet protocol. As mentioned above, MV is the product of RR and VT, either of which can be changed independently to produce the same net change in MV.
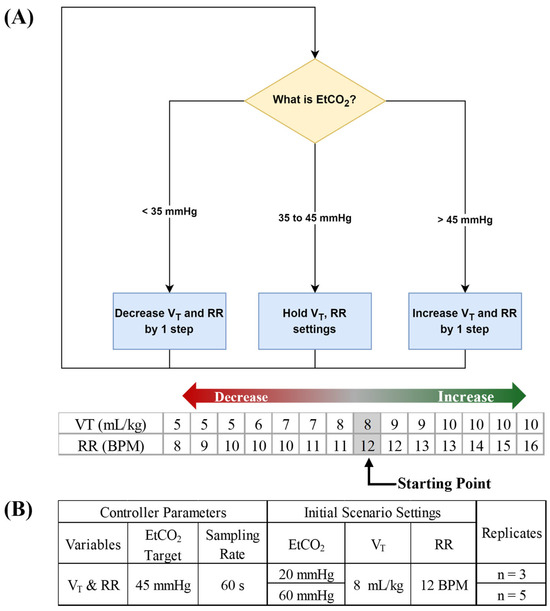
Figure 2.
Closed-loop ventilation controller logic for CO2 removal. (A) The functional controller logic flow chart is shown, followed by decision table steps of the controller logic for tidal volume (VT) and respiratory rate (RR). Arrows denote the direction for increases and decreases by controller logic and grey shaded values represent the starting point for controller logic. (B) Summary of test scenarios used for evaluating closed-loop ventilation controller logic.
2.3. OxyVent Development
When a patient is being mechanically ventilated, there are several settings that may be adjusted to maintain healthy SpO2 levels. Two such settings are the fraction of inspired oxygen (FiO2), based on the alveolar gas equation [36,37], and PEEP [38,39]. Thus, the OxyVent module needed to provide an analogue for SpO2 within a physiologically relevant range, as well as the ability to manipulate said SpO2 reading via changes in the provided analogues for FiO2 and PEEP.
To simulate SpO2, the OxyVent module incorporated the usage of a dissolved oxygen (DO) probe (Atlas Scientific, Long Island City, NY, USA) to measure the DO content in approximately 1200 mL of plain tap water contained in a closed, rigid cylindrical canister, as shown in Figure 3. The DO level within the water was controlled by bubbling a mixture of Breathing Grade Air and Ultra-High-Purity Grade Nitrogen (N2) into the water, and the ratio of this mixture could then be treated as an analogue for FiO2. Compressed gas cylinders (Airgas, Radnor, PA, USA) were used to supply the gases to the system using ¼ in (~6.4 mm) plastic tubing and barbed fittings to connect each major component. Similarly to the MechVent module, two-stage regulators were used to step down the supply pressure from each cylinder to 15 psi (~776 mmHg), and 15 gal (~57-L) expansion tanks (McMaster-Carr, Elmhurst, IL, USA) were used to improve the stability of the supplied pressure. The outlets of each of the two expansion tanks were connected to solenoid valves (US Solid, Cleveland, OH, USA), which enabled independent control over the flow of each gas. Following the solenoid valves, the two supply lines were merged using a T-fitting into a single line that was then connected to the inlet of the rigid canister, as shown in Figure 3. Since the solenoid valves functioned in a binary fashion, i.e., being either fully open or fully closed, further control over the composition of the supplied gas mixture was enabled by utilizing open–closed pulsations at various duty cycles. We used three duty cycles that were defined as Full, open 100% of the time; Partial, open 50% of the time; and Off, closed.
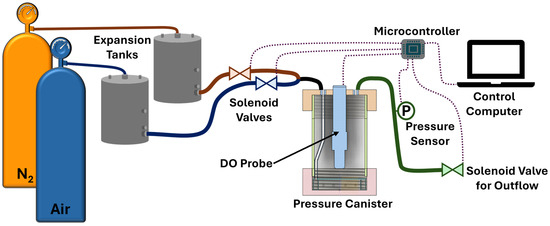
Figure 3.
Diagram of the OxyVent module. Compressed nitrogen (N2) and air flow from the supply tanks to expansion tanks and then to the pressure canister through solenoid valves controlled by a microcontroller. Dissolved oxygen (DO) in the pressure canister is measured, as is the canister pressure used to regulate the outflow through an additional solenoid valve.
Because the OxyVent module performance relied on the absorption of O2 into the water, multiple steps were taken in an attempt to improve consistency and reliability in the rapidity and homogeneity of said absorption. Firstly, a diffusion ring that was connected to the gas inlet and positioned at the bottom of the canister was designed. This diffusion ring distributed the gas from the supply line out around the perimeter of the canister through a series of holes, rather than a single centralized point. The canister was also placed on a magnetic stir plate (Thermo Scientific, Waltham, MA, USA) paired with a crosshead stir bar, which was set in the center of this diffusion ring and spun at 200 rpm. Finally, a secondary diffusion plate was integrated overtop the diffusion ring and stir bar. This plate spanned the entire cross section above the stir bar and included an array of 11 holes with spacings of approximately 23 mm. This prevented the formation of a vortex in the canister from the stir bar and helped to compensate for any higher concentration of gas coming from the diffusion ring holes closer to the supply line connection.
Even with this design, however, there remained a variable which impacted O2 absorption—system pressure. An outlet port alone would eliminate any pressure build up, but by connecting this outlet port to a pressure inducer followed by a third solenoid valve, this variable could be controlled. By taking advantage of the differences in O2 solubility in water at differing pressures, an analogue for PEEP could then be introduced by regulating the pressure within the canister. The regulation of this pressure was controlled via a microcontroller (Arduino®, Monza, Italy), whose behavior could be modified according to the needs of the experiment. With this implementation, the internal pressure of the system could be permitted to increase/decrease at any point, thus raising/lowering the O2 solubility in real time. Although temperature also affects O2 solubility, the ease and speed of pressure control combined with the naturally static nature of the system’s temperature made pressure the preferred variable to use. These two controls provided ample capacity to adjust the DO levels in response to the ventilator settings, allowing robust testing capabilities for automated ventilator controllers.
2.4. Characterization of the OxyVent Module
The system’s behavior was characterized by using a series of baseline and oxygenation procedures. Of particular interest were how the DO saturation ceiling and DO absorption rate were affected by the supplied gas mixture and canister pressure. Each experimental run started by deoxygenating the water via a nitrogen flush, followed by bubbling various air–nitrogen ratios whilst simultaneously regulating the pressure within the canister. The change in DO with time was recorded and analyzed to develop characteristic functions of the system’s response. Each test ran for a period of 5 min to allow sufficient time for the system DO to reach a reasonably steady state. Bubbled gas mixtures were tested in triplicate at a gage canister pressure of approximately 5 psi (~250 mmHg). To observe changes in the DO saturation and responsiveness with a dynamic pressure range, variable pressure tests were conducted with a selection of air–nitrogen ratios that began at an initial gage canister pressure of 0 psi, increasing to 5 psi, and then finally to 10 psi. The canister pressure was held at each step for 5 min, with tests run in triplicate.
To further test the OxyVent module, a preliminary decision-table-based closed-loop control logic was conceived for managing the O2 ventilator settings. Automated logic was based on the ARDSNet protocol developed by the NIH NHLBI ARDS Clinical Network [40], which has been used for automating ventilator function in other studies [41] (Figure 4A). We used the lower PEEP and higher FiO2 logic but added additional rules to further prioritize FiO2 adjustments when SpO2 fell below a certain threshold. Logic started on the first step in the ARDSNet table, and, if SpO2 ever drifted below 90%, immediate setting adjustments would be performed to increase FiO2 to 100% and then continue following PEEP adjustments based on the ARDSNet decision table. Once SpO2 was above 96%, FiO2 would decrease according to the ARDSnet decision table. Two sampling rates for the oxygen management logic were evaluated at 5 s and 60 s (Figure 4B).
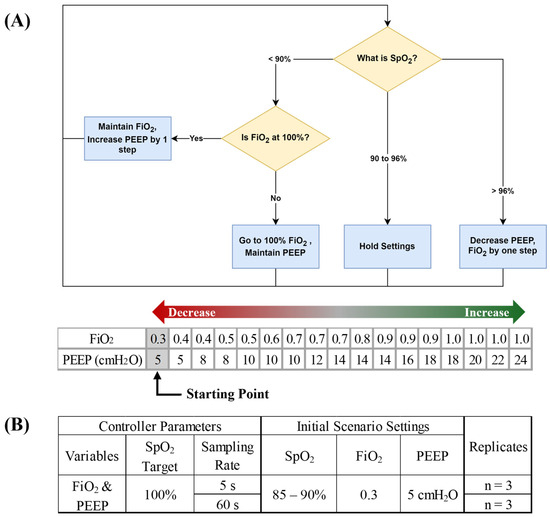
Figure 4.
Closed −loop ventilation controller logic for O2 delivery. (A) Flow chart of decision table functionality with ARDSnet controller logic for positive end-expiratory pressure (PEEP) and fraction of inspired oxygen (FiO2). Arrows denote direction for increases and decreases by controller logic and grey shaded values represent the starting point for controller logic. (B) Summary of test scenarios used for evaluating closed-loop ventilation controller logic.
3. Results
3.1. MechVent Characterization
Under normal conditions, the MechVent module was able to effectively reproduce EtCO2 readings in the 35–45 mmHg range when RR and VT were held in normal ranges (10 BPM and 500 mL, respectively), and the EtCO2 output of the system correlated with changes in either RR or VT, following normal physiology (Figure 5A). For the patient variability features, both VTE and VTI were similarly decreased by higher Raw, with Open, Partial, and Full resulting in VTE|VTI values of 963.3|983.0 mL, 621.4|607.4 mL, and 360.4|360.8 mL, respectively, and the range of calculated Raw levels was 2–3 cm H2O/L/s (Figure 5B). The lung compliance loads had a near-linear relationship with the corresponding lung compliance values, as measured by the ventilator, with 200 g producing a reading of ~56 mL/cm H2O and 1000 g producing a reading of ~14.5 mL/cm H2O (Figure 5C).
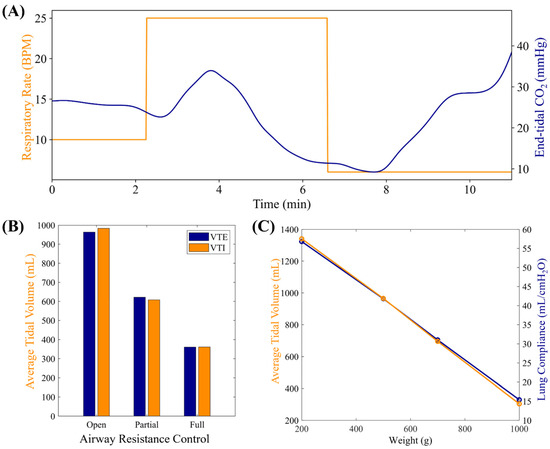
Figure 5.
Characterization results for MechVent module. (A) Evaluation of MechVent’s ability to successfully replicate an inverse relationship between the respiratory rate (RR) and EtCO2. (B) Average expiratory (VTE) and inspiratory (VTI) tidal volumes at three Raw settings. (C) Average VTE and CL setting.
3.2. MechVent Testing
To evaluate the closed-loop controller functionality of the MechVent module, we conducted tests at different starting EtCO2 settings by using the decision table logic shown in Figure 2 for the controller. A duty cycle of 3.3% for the solenoid valve supplying CO2 was found to result in generally stable EtCO2 readings of ~20 mmHg and a setting of 6% produced baseline readings of ~40 mmHg. A duty cycle of 7.3% produced high EtCO2 readings, stabilizing at ~60 mmHg. The controller was initialized at the middle of the ARDSNet table with a VT of 550 mL (8 mL/kg for 70 kg patient) and RR of 12 BPM, but was free to make adjustments immediately at the beginning of the test and then once every 60 s afterwards. Data were averaged across the three test runs, as shown in Figure 6. Further, plots of EtCO2 and MV against time across all trials for the low and high starting EtCO2 scenarios are shown in Figure 7A. Adjustments to RR and VT were shown to reliably control the system’s EtCO2, raising it from ~20 to ≥35 mmHg within 5 min, and lowering it from ~55 to ≤45 mmHg in ~4 min. It should be noted that there are two potential values for VT that are relevant and could be used to calculate MV. One is the ventilator’s setting for VT (VTSet), while the other is the real-time, physical measurement of VT during operation (VTMeasured). Large discrepancies between these values can indicate an issue with the system, helping to identify an early leak in the system, which was repaired, and VTSet vs. VTMeasured plots were regularly generated as a quality measure for all tests (Figure 7B). All MV values were calculated using VTMeasured. The scatter plots of tests starting at an EtCO2 level of 20 mmHg are shown in Figure 8A, which highlights the inverse relationship between MV and EtCO2 when changing VT and RR. Runs starting from this low position showed little to no correlation between EtCO2 and RR, as the controller was primarily updating VT values to the system (Figure 8B). The high EtCO2 tests revealed the same inverse relationship with MV, as shown with the low EtCO2 tests, showcasing the ability of the system to modulate EtCO2 down to a healthy range (Figure 8C). The main factor in the modulation of MV for the high tests was RR, which is shown by Figure 8D.
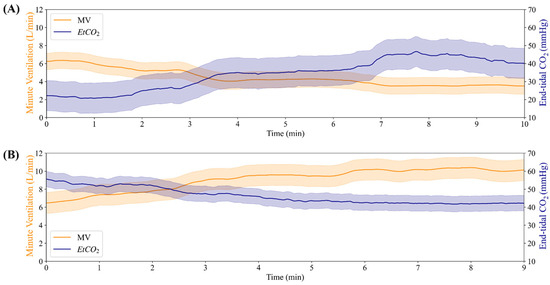
Figure 6.
Summary of closed-loop testing result with MechVent module. (A) Minute ventilation (MV) and EtCO2 for a high starting EtCO2 at 60 mmHg. (B) Minute ventilation and EtCO2 for a low starting EtCO2 at 20 mmHg.
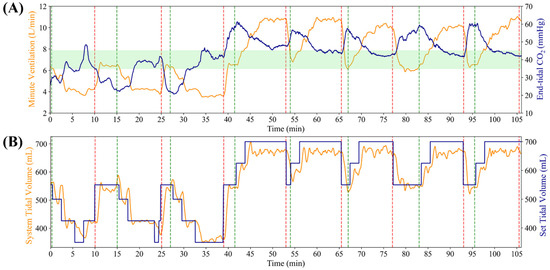
Figure 7.
Individual trial runs for each MechVent closed loop controller runs. (A) Minute ventilation (MV) and EtCO2 for each replicate, as partitioned by a red and green dotted line. Green shaded region indicates the target EtCO2 range. (B) Tidal volume (VT) set and measured for each individual run.
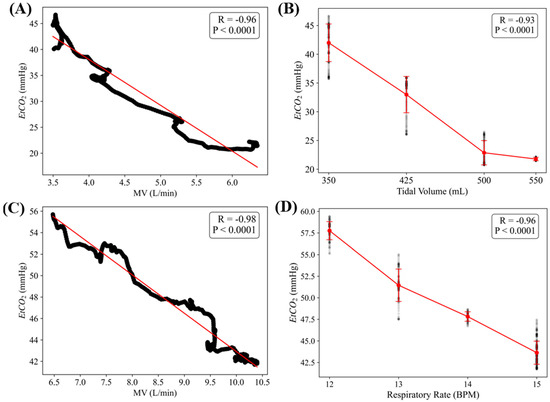
Figure 8.
EtCO2 and MV relationships in low and high tests. (A) Scatter plot with an inverse trend between minute ventilation (MV) and EtCO2 in low EtCO2 tests. (B) Effects of tidal volume (VT) on EtCO2 in low EtCO2 tests. (C) Relationship between MV and EtCO2 in high EtCO2 tests. (D) Effects of respiratory rate (RR) changes on EtCO2 in high EtCO2 tests. Pearson’s correlation (R) values are shown for each, along with the statistical significance for each data trend.
3.3. OxyVent Characterization
The OxyVent module was characterized regarding its DO responsiveness to FiO2 and PEEP levels. There was minimal variance in the DO during the initialization of each run between the six air–nitrogen ratios. The system had a range of DO between 2.63 (air–nitrogen ratio of Partial air and N2 Off) and 8.95 (air–nitrogen ratio of Full air and N2 Off) ppm, with a standard deviation of 0.181 and 1.04, respectively. The ability of the system to achieve both differing O2 absorption rates and O2 saturation levels using varying ratios of air–nitrogen is demonstrated in Figure 9. In addition, Figure 9 demonstrates how the DO trends compare to each air–nitrogen ratio when normalized by the minimum value of each respective ratio. DO values for each air–nitrogen ratio, with specific minimum, maximum, and mean values of DO and standard deviations for each respective ratio, are shown in Table 1.
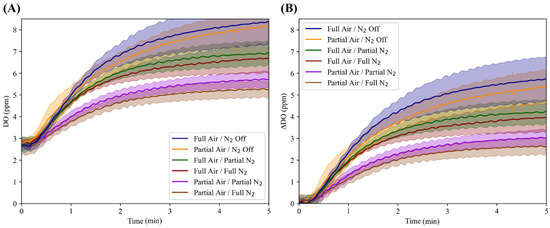
Figure 9.
Characterization of the OxyVent module FiO2 functionality. Average trends for six air–nitrogen ratios (n = 3 each) and their dissolved oxygen (DO, ppm) values over the course of five minutes. (A) DO versus time relations for each air–nitrogen ratio not normalized to the starting value; shaded regions denote standard deviation. (B) Each air–nitrogen ratio normalized to their minimum value to better illustrate the differences in DO values over the five-minute period.

Table 1.
Summary of the minimum, maximum and mean values of DO (ppm) and the respective minimum and maximum standard deviation values.
Adding a modification to PEEP, there was minimal variation in the DO values between the three air–nitrogen ratios during the initialization of the runs. Throughout the three varying canister pressures of 0, 5, and 10 psi, the system had a range of DO values between 2.39 ± 0.0873 and 9.72 ± 0.604 ppm (Figure 10). The pressures were each held for five minutes until the system reached steady-state DO values. At a canister pressure of 0 psi, the steady-state DO was 5.61, 6.72, and 7.24 ppm for air–nitrogen ratios of Partial/Partial, Partial/Off, and Full/Full, respectively. When the canister pressure was increased to 5 psi, the steady-state DO reached values of 6.42, 7.98, and 7.98 ppm for the air–nitrogen ratios previously mentioned. Finally, for the same previously listed air–nitrogen ratios, the steady-state DO values reached 7.26, 9.72, and 9.34 ppm at a canister pressure of 10 psi. In addition to the steady-state (maximum) DO values, the minimum DO values and standard deviation values at each respective pressure step are displayed in Table 2.
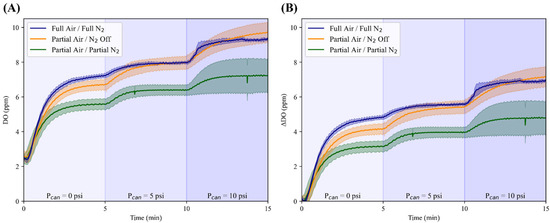
Figure 10.
Characterization of the OxyVent module PEEP functionality. Average results for three air–nitrogen ratios (n = 3 each) and their dissolved oxygen (DO, ppm) values across three different pressure steps (Pcan) held for five minutes. (A) DO values over time without normalization and (B) with normalization to their minimum values; shaded regions denote the standard deviation for each air–nitrogen ratio and the three pressure steps labeled above the horizontal axis on each plot.

Table 2.
Summary of minimum and maximum values of DO and the respective minimum and maximum standard deviation values at the varying pressure steps of 0, 5, and 10 psi.
This range of DO values was fit against a range of SpO2 values (80 to 100%) the system needed to mimic, resulting in the following calibration Equation (1) for DO to SpO2:
3.4. OxyVent Testing
After the conversion of DO to SpO2 values was implemented, the OxyVent module was tested with a closed-loop controller using the oxygen management logic described earlier (Figure 4). Three replicate runs at two sampling rates—5 s and 60 s—were averaged across each run and the resulting data are shown in Figure 11. The controller configuration in Figure 11A updated every 5 s and reached the target SpO2 range by keeping FiO2 constant at 100% while adjusting PEEP to increase SpO2. The controller in Figure 11B updated every 60 s and reached the target SpO2 range by keeping PEEP constant at 5 cm H2O while adjusting FiO2 from 100% to a final target of 90% due to overshooting the target SpO2. Overall, both controller configurations successfully adjusted either FiO2 or PEEP to reach the target SpO2 programmed in the controller logic.
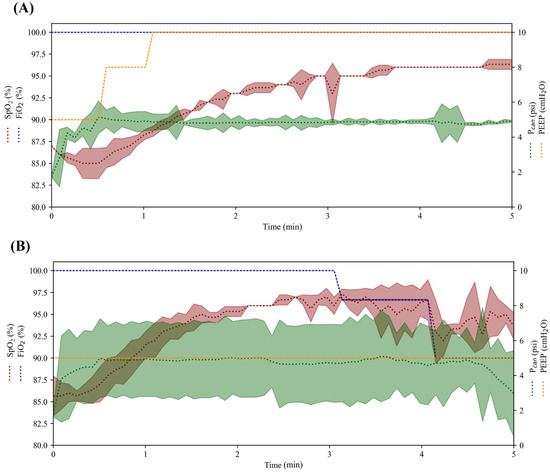
Figure 11.
Proof-of-concept evaluation of closed-loop controller logic with the OxyVent module. The average controller performance for maintaining SpO2 across five-minute testing scenarios using (A) 5 s and (B) 60 s sampling rate controller configurations (n = 3 each). Controllers adjusted FiO2 and PEEP/Pcan to reach the target SpO2 in each respective run. SpO2 and FiO2 are plotted on the left axis while Pcan and PEEP are shown on the right axis. The shaded region for each variable denotes the standard deviation.
4. Discussion
The modules we developed for testing automated ventilator controllers performed acceptably in this proof-of-concept evaluation. The MechVent system was able to generate EtCO2 values that are considered normal for healthy patients while being provided ventilation from the MOVES® SLC™ platform. The Raw and CL features of the system were effective and capable of reproducing the Raw and CL values calculated by the ventilator and that fall within physiologically normal ranges. In addition, the effects of different Raw and CL values on the dynamics of ventilation also matched what is considered normal. Specifically, increased Raw correlated to a decrease in VT, while a decrease in CL (lungs are stiffer) also correlated with a reduced VT. We showed how the key target variable, EtCO2, could be successfully raised or lowered within the MechVent module via adjustments to MV, which is traditionally used to adjust EtCO2 readings. Finally, we demonstrated the system’s ability to generate values outside the optimal “healthy” range, and using a representative, decision-table-driven controller modeled after recognized ventilator protocols, we successfully brought the system back within the optimal range.
The characterization of the OxyVent module showed that the system could produce a range of DO values that could easily be scaled to fit a relevant range of SpO2 values. We demonstrated how the DO value could be changed by adjusting the Air:N2 ratio of the supplied gas mixture or by changing Pcan. A few notable effects from these two settings were observed. First, the O2 absorption rate was impacted little by differences in the canister pressure and only seemed to be noticeably reduced when Air flow was partial and N2 was being supplied as well. These conditions were only met in two configurations, i.e., Partial Air/Partial N2 and Partial Air/Full N2, since interestingly, Partial Air with N2 Off had one of the fastest absorption rates. The more significant effects of the system settings were seen in the plateaus of the DO plots. These plateaus represent the short-term, steady-state DO level under the corresponding system conditions. It is not the saturation point of the mixture, since the solution is not technically O2 saturated; however, it can be loosely thought of as a dynamic saturation or equilibrium point, since it is the peak DO level that can be reasonably expected under those conditions.
Although our developed modules performed acceptably, there are still limitations in their functionality. First, isolating the O2 transport and CO2 removal systems, which are somewhat physiologically coupled, introduces a potential source of error since they lose interaction effects that may impact the patient’s status. The MechVent module is incapable of making automated changes to the CO2 generation rate, which constrains our testing ability. Additionally, there were discrepancies between VTI/VTE, which could be due to the nature of the inanimate system paired with the ventilator. Although the tests were conducted using an IMV setting, the ventilator can be switched between the Pressure-Controlled Mode (PCM) and Volume-Controlled Mode (VCM). Under PCM, the readings between VTI/VTE differed by 80–100 mL, but under VCM, the readings only differed by 10–25 mL. The discrepancy between VTI and VTE under PCM in the MOVES® SLC™ system can be attributed to several design and control characteristics. PCM uses a decelerating flow pattern, delivering a high initial flow to quickly reach the target pressure, which can lead to excess gas volume in the circuit [25]. Unlike VCM, PCM does not compensate for circuit compliance or minor leaks, as the tidal volume is not fixed [26]. Additionally, the MOVES® SLC™’s closed-circuit design continuously adds oxygen, and excess gas is vented through a relief valve that bypasses flow sensors, potentially leading to an underreported exhaled volume [25,27]. The ventilator’s emphasis on tidal volume in VCM and PIP in PCM further suggests that VCM has greater volume accuracy [25]. In testing the MechVent module, the developed controllers only modified VT and RR to change MV. Modifying PIP, VT, and RR simultaneously proved difficult since the MOVES® can only actively update these values in their respective modes, which results in the system rapidly changing between PCM/VCM to try and update values. This rapid change reduces the functionality of the ventilator and the MechVent module, so VCM is the primary mode of operation.
Another limitation is the range of DO levels within the OxyVent module, with challenges reaching values below 2 ppm and likely being caused by a few things. Firstly, the grade of N2 used, namely Ultra High Purity, is permitted to contain small amounts of O2, but not to exceed 2 ppm. These trace “impurities” may prevent the further expulsion of O2 from the canister. Additionally, although purging DO levels via N2 is an effective way of lowering DO levels in a liquid [42], attaining levels below a certain threshold is essentially impossible without the usage of a strong vacuum or certain chemical additives such as sodium sulfite, which are unusable for a design such as ours where the DO levels must be allowed to change rapidly [43]. Another limitation of the OxyVent module was the consistent appearance of an anomalous artifact regarding the DO readings at the beginning of each experiment. Specifically, the DO level can be seen dipping slightly at the onset of each test before climbing. One potential cause for this is the relatively low sampling rate of the DO probe (1 Hz), introducing a delay in readings carrying over from the N2 flush. Another factor may be residual N2 from the flush, which then gets introduced into the system before being expelled by the more oxygen-rich mixture. There were also limitations due to the response time of the valves in the supply and exhaust lines, which may introduce pressure and flow rate inconsistencies that adversely impact the performance.
The next steps will include further refinements to both modules. Some improvement opportunities for the MechVent module include automated CL adjustments that could be achieved by utilizing an actuator-driven spring similar to Pasteka et al.’s model [30]. Automated changes in CO2 generation could be achieved by automating the valve regulating the CO2 supply. Testing the system with other ventilators capable of alternative control modes would be highly beneficial. To achieve this, there would need to be a way to set certain parameters and send commands directly to the ventilator. Unfortunately, most commercial systems do not grant out-of-the-box access to this level of control. The OxyVent module can be modified to reduce the distance between the supply valves and where the mixture is bubbled into the water to reduce the impact of residual N2 in the system and improve the overall responsiveness. The valves can also be substituted with proportional solenoids that offer continuous, rather than binary, opening adjustment. This would enable greater granular control of the flow, reducing noise and improving the precision of both the mixture ratio and canister pressure. Although the systems currently operate independently, steps towards a singular ventilator module could be made by adding logic that mirrors relevant pressure values across both systems and by mapping both the oxygen consumption and CO2 output to a unifying “metabolic” function. Finally, these modules will be integrated into a larger, polytrauma HIL automated testbed for resuscitation controllers that incorporate systems for testing fluid resuscitation controllers for hemorrhagic shock, automated extremity/junctional tourniquet control, and anesthesia management. The final system will enable the evaluation of a wide range of automated technologies for managing trauma patients, including algorithms that identify contraindications that may not be accounted for by standalone devices or controllers.
5. Conclusions
Automated ventilation control has the potential to simplify critical care in civilian and military environments. However, control systems require extensive testing for proper tuning, which can be cost-ineffective when relying solely on animal studies for troubleshooting. Although in-silico models have become exceedingly advanced in recent years, they still require large and highly specialized data to be properly tuned and are not able to operate with physical devices, leaving an important gap in our ability to determine the performance of a controller. Systems that include hardware control still often lack a direct link between the real-world outputs of the ventilator and the feedback signals that serve as the inputs to the ventilator controller. Instead, the HIL testbed presented in this work allows for physical hardware debugging in a high-throughput manner for oxygen and mechanical ventilation controller logics. The OxyVent and MechVent modules were able to reproduce the physiological feedback signals of interest within ranges that have been observed in in-vivo studies. Both modules were also directly responsive to the outputs of a commercial ventilator when controlled by a simplistic control scheme. Using this platform, more extensive testing can be performed prior to animal experiments, allowing for more refined controllers to be evaluated and drastically streamlining the translation process for these life-saving medical devices. As a result, closed-loop ventilator development can be accelerated, thus lowering the skill threshold and improving ventilator management in future critical care and combat casualty care situations.
Author Contributions
Conceptualization, E.J.S. and D.B.; methodology, D.B., B.A., D.O. and I.M.; software, B.A. and D.O.; validation, D.B., B.A. and D.O.; formal analysis, D.B., B.A., D.O., J.M.G., S.I.H.T. and E.J.S.; investigation, E.J.S.; resources, E.J.S.; data curation, D.B., B.A. and D.O.; writing—original draft preparation, D.B., B.A., D.O., I.M., J.M.G., S.I.H.T. and E.J.S.; writing—review and editing, D.B., B.A., D.O., I.M., J.M.G., S.I.H.T. and E.J.S.; visualization, B.A., I.M., J.M.G., S.I.H.T. and E.J.S.; supervision, E.J.S.; project administration, E.J.S.; funding acquisition, E.J.S. All authors have read and agreed to the published version of the manuscript.
Funding
This work was funded by the U.S. Army Medical Research and Development Command (CO230029). This project was supported in part by an appointment to the Science Education Pro-grams at National Institutes of Health (NIH), administered by ORAU through the U.S. Department of Energy Oak Ridge Institute for Science and Education (B.A., D.O., I.M.).
Institutional Review Board Statement
Not applicable.
Informed Consent Statement
Not applicable.
Data Availability Statement
The datasets presented in this article are not readily available because they have been collected and maintained in a government-controlled database that is located at the US Army Institute of Surgical Research. As such, these data can be made available through the development of a Cooperative Research & Development Agreement (CRADA) with the corresponding author. Requests to access the datasets should be directed to Eric Snider, eric.j.snider3.civ@health.mil.
Acknowledgments
The authors would like to acknowledge Saul J. Vega for his assistance with the development of the testing procedures used to evaluate the hardware-in-loop test platform. The authors would also like to acknowledge ongoing collaboration with Thornhill Medical and their MOVES® SLC™ ventilator platform.
Conflicts of Interest
The funders had no role in the design of the study; in the collection, analyses, or interpretation of data; in the writing of the manuscript; or in the decision to publish the results.
DOD Disclaimer
The views expressed in this article are those of the authors and do not reflect the official policy or position of the U.S. Army Medical Department, Department of the Army, DoD, or the U.S. Government.
Abbreviations
The following abbreviations are used in this manuscript:
| CO2 | Carbon Dioxide |
| HIL | Hardware-in-Loop |
| PEEP | Positive End-Expiratory Pressure |
| RR | Respiratory Rate |
| VT | Tidal Volume |
| EtCO2 | End-tidal Carbon Dioxide |
| SpO2 | Blood Oxygen Saturation |
| PIP | Peak Inspiratory Pressure |
| MV | Minute Ventilation |
| Raw | Airway Resistance |
| CL | Lung Compliance |
| CAD | Computer-Aided Design |
| VTE | Expiratory Tidal Volume |
| VTI | Inspiratory Tidal Volume |
| BPM | Breaths Per Minute |
| CMV | Continuous Mandatory Ventilation |
| ARDSNet | Acute Respiratory Distress Syndrome Network |
| FiO2 | Fraction of Inspired Oxygen |
| DO | Dissolved Oxygen |
| N2 | Nitrogen |
| PCM | Pressure-Controlled Mode |
| VCM | Volume-Controlled Mode |
References
- Lee, P.G. A Review of Automated Control Systems for Aquaculture and Design Criteria for Their Implementation. Aquac. Eng. 1995, 14, 205–227. [Google Scholar] [CrossRef]
- Lygeros, J.; Godbole, D.N.; Sastry, S. Verified Hybrid Controllers for Automated Vehicles. IEEE Trans. Autom. Control 1998, 43, 522–539. [Google Scholar] [CrossRef]
- Khodaei, M.J.; Candelino, N.; Mehrvarz, A.; Jalili, N. Physiological Closed-Loop Control (PCLC) Systems: Review of a Modern Frontier in Automation. IEEE Access 2020, 8, 23965–24005. [Google Scholar] [CrossRef]
- García, A.M.; Krane, M.; Baumgartner, B.; Sprunk, N.; Schreiber, U.; Eichhorn, S.; Lange, R.; Knoll, A. Automation of a Portable Extracorporeal Circulatory Support System with Adaptive Fuzzy Controllers. Med. Eng. Phys. 2014, 36, 981–990. [Google Scholar] [CrossRef][Green Version]
- Vega, S.J.; Berard, D.; Avital, G.; Ross, E.; Snider, E.J. Adaptive Closed-Loop Resuscitation Controllers for Hemorrhagic Shock Resuscitation. Transfusion 2023, 63, S230–S240. [Google Scholar] [CrossRef]
- Dojat, M.; Pachet, F.; Guessoum, Z.; Touchard, D.; Harf, A.; Brochard, L. NeoGanesh: A Working System for the Automated Control of Assisted Ventilation in ICUs. Artif. Intell. Med. 1997, 11, 97–117. [Google Scholar] [CrossRef]
- Amudipe, S.O.; Kayode, J.F.; Adaramola, B.A.; Olatunbosun, O.J.; Afolalu, S.A. Simulation of Transient Response of PID Controller in an Automated Electro-Pneumatic System Using a Single-Acting Cylinder in a Clinical Ventilator. Heliyon 2024, 10, e27799. [Google Scholar] [CrossRef]
- Uddin, R.; Ali, A.H.; Kazmi, S.M.H.; Akbar, M. Rapid Design of an ICU Ventilator: An Approach Based on Smart Switching of Compressed Air-Oxygen. IEEE Trans. Biomed. Circuits Syst. 2024, 18, 63–75. [Google Scholar] [CrossRef]
- Matthay, M.A.; Zemans, R.L.; Zimmerman, G.A.; Arabi, Y.M.; Beitler, J.R.; Mercat, A.; Herridge, M.; Randolph, A.G.; Calfee, C.S. Acute Respiratory Distress Syndrome. Nat. Rev. Dis. Primers 2019, 5, 18. [Google Scholar] [CrossRef]
- Montmany, S.; Pallisera, A.; Rebasa, P.; Campos, A.; Colilles, C.; Luna, A.; Navarro, S. Preventable Deaths and Potentially Preventable Deaths. What Are Our Errors? Injury 2016, 47, 669–673. [Google Scholar] [CrossRef]
- Slutsky, A.S. Mechanical Ventilation. Chest 1993, 104, 1833–1859. [Google Scholar] [CrossRef] [PubMed]
- Ricard, J.-D.; Dreyfuss, D.; Saumon, G. Ventilator-Induced Lung Injury. Eur. Respir. J. 2003, 22, 2s–9s. [Google Scholar] [CrossRef] [PubMed]
- Slutsky, A.S.; Ranieri, V.M. Ventilator-Induced Lung Injury. N. Engl. J. Med. 2013, 369, 2126–2136. [Google Scholar] [CrossRef]
- Peng, C.-K.; Costa, M.; Goldberger, A.L. Adaptive Data Analysis of Complex Fluctuations in Physiologic Time Series. Adv. Adapt. Data Anal. 2009, 1, 61–70. [Google Scholar] [CrossRef]
- Dobson, G.P.; Morris, J.L.; Letson, H.L. Why Are Bleeding Trauma Patients Still Dying? Towards a Systems Hypothesis of Trauma. Front. Physiol. 2022, 13, 990903. [Google Scholar] [CrossRef]
- Muir, W. Trauma: Physiology, Pathophysiology, and Clinical Implications. J. Vet. Emerg. Crit. Care 2006, 16, 253–263. [Google Scholar] [CrossRef]
- Berard, D.; Vega, S.J.; Torres, S.I.H.; Polykratis, I.A.; Salinas, J.; Ross, E.; Avital, G.; Boice, E.N.; Snider, E.J. Development of the PhysioVessel: A Customizable Platform for Simulating Physiological Fluid Resuscitation. Biomed. Phys. Eng. Express 2022, 8, 035017. [Google Scholar] [CrossRef]
- Melinda, M.; Ridwan, M.; Nurbadriani, C.N.; Yunidar, Y. PID Controller Implementation on Animal Experimental Treadmill for Heart Medicine Purpose. Kinet. Game Technol. Inf. Syst. Comput. Netw. Comput. Electron. Control 2023, 8. Available online: https://kinetik.umm.ac.id/index.php/kinetik (accessed on 23 March 2025).
- Walters, E.M.; Prather, R.S. Advancing Swine Models for Human Health and Diseases. Mo. Med. 2013, 110, 212. [Google Scholar]
- Hou, N.; Du, X.; Wu, S. Advances in Pig Models of Human Diseases. Anim. Models Exp. Med. 2022, 5, 141–152. [Google Scholar] [CrossRef]
- Webb, J.B.; Bray, A.; Scheirich, H.; VanPelt, J.; Clipp, R.B.; Gerard, J.; Frembgen, S. Implementation of A Dynamic And Extensible Mechanical Ventilator Model For Real-Time Physiological Simulation. In Proceedings of the 2022 Annual Modeling and Simulation Conference (ANNSIM), San Diego, CA, USA, 18–20 July 2022; pp. 282–293. [Google Scholar]
- Mistry, S.; Brook, B.S.; Saffaran, S.; Chikhani, M.; Hannon, D.M.; Laffey, J.G.; Scott, T.E.; Camporota, L.; Hardman, J.G.; Bates, D.G. A Computational Cardiopulmonary Physiology Simulator Accurately Predicts Individual Patient Responses to Changes in Mechanical Ventilator Settings. In Proceedings of the 2022 44th Annual International Conference of the IEEE Engineering in Medicine & Biology Society (EMBC), Glasgow, UK, 11–15 July 2022; pp. 3261–3264. [Google Scholar]
- Hannon, D.M.; Mistry, S.; Das, A.; Saffaran, S.; Laffey, J.G.; Brook, B.S.; Hardman, J.G.; Bates, D.G. Modeling Mechanical Ventilation in Silico—Potential and Pitfalls. In Seminars in Respiratory and Critical Care Medicine; Thieme Medical Publishers, Inc.: Leipzig, Germany, 2022; Volume 43, pp. 335–345. [Google Scholar]
- von Platen, P.; Lesch, L.; Lohse, A.; Leonhardt, S.; Walter, M. Physiological Hardware-in-the-Loop Test Bench for Mechanical Ventilation. at-Automatisierungstechnik 2024, 72, 429–439. [Google Scholar] [CrossRef]
- An, J.; Purdon, P.L.; Solt, K.; Sims, N.M.; Brown, E.N.; Westover, M.B. Design, Implementation, and Evaluation of a Physiological Closed-Loop Control Device for Medically-Induced Coma. In Proceedings of the 2017 39th Annual International Conference of the IEEE Engineering in Medicine and Biology Society (EMBC), Jeju Island, Republic of Korea, 11–15 July 2017; IEEE: Piscataway, NJ, USA, 2017; pp. 4313–4316. [Google Scholar]
- Gehlen, M.; Kurtcuoglu, V.; Daners, M.S. Patient Specific Hardware-in-the-Loop Testing of Cerebrospinal Fluid Shunt Systems. IEEE Trans. Biomed. Eng. 2015, 63, 348–358. [Google Scholar] [CrossRef] [PubMed]
- Snider, E.J.; Berard, D.; Vega, S.J.; Hernandez Torres, S.I.; Avital, G.; Boice, E.N. An Automated Hardware-in-Loop Testbed for Evaluating Hemorrhagic Shock Resuscitation Controllers. Bioengineering 2022, 9, 373. [Google Scholar] [CrossRef]
- Arntz, J.; Gottlieb, D.; Lozano, S.; Guttmann, J.; Möller, K. Evaluation of an Automated PEEP Controller in Mechanical Ventilation Support. In Proceedings of the 4th European Conference of the International Federation for Medical and Biological Engineering: ECIFMBE 2008, Antwerp, Belgium, 23–27 November 2008; Springer: Berlin/Heidelberg, Germany, 2009; pp. 1080–1083. [Google Scholar]
- Giri, J.; Kshirsagar, N.; Wanjari, A. Design and Simulation of AI-Based Low-Cost Mechanical Ventilator: An Approach. Mater. Today Proc. 2021, 47, 5886–5891. [Google Scholar] [CrossRef]
- Pasteka, R.; Forjan, M.; Sauermann, S.; Drauschke, A. Electro-Mechanical Lung Simulator Using Polymer and Organic Human Lung Equivalents for Realistic Breathing Simulation. Sci. Rep. 2019, 9, 19778. [Google Scholar] [CrossRef]
- Laubscher, T.P.; Heinrichs, W.; Weiler, N.; Hartmann, G.; Brunner, J.X. An Adaptive Lung Ventilation Controller. IEEE Trans. Biomed. Eng. 1994, 41, 51–59. [Google Scholar] [CrossRef]
- Jensen, L.A.; Onyskiw, J.E.; Prasad, N.G.N. Meta-Analysis of Arterial Oxygen Saturation Monitoring by Pulse Oximetry in Adults. Heart Lung 1998, 27, 387–408. [Google Scholar] [CrossRef]
- Wang, J.; Zhang, J.; Liu, Y.; Shang, H.; Peng, L.; Cui, Z. Relationship between End-Tidal Carbon Dioxide and Arterial Carbon Dioxide in Critically Ill Patients on Mechanical Ventilation: A Cross-Sectional Study. Medicine 2021, 100, e26973. [Google Scholar] [CrossRef]
- Edwards, Z.; Annamaraju, P. Physiology, Lung Compliance. In StatPearls [Internet]; StatPearls Publishing: Treasure Island, FL, USA, 2023. [Google Scholar]
- Network, A.R.D.S. Ventilation with Lower Tidal Volumes as Compared with Traditional Tidal Volumes for Acute Lung Injury and the Acute Respiratory Distress Syndrome. N. Engl. J. Med. 2000, 342, 1301–1308. [Google Scholar]
- Fuentes, S.; Chowdhury, Y.S. Fraction of Inspired Oxygen; StatPearls Publishing: Treasure Island, FL, USA, 2020. [Google Scholar]
- Sharma, S.; Hashmi, M.F.; Burns, B. Alveolar Gas Equation. In StatPearls [Internet]; StatPearls Publishing: Treasure Island, FL, USA, 2022. [Google Scholar]
- Levenbrown, Y.; Hossain, M.J.; Keith, J.P.; Burr, K.; Hesek, A.; Shaffer, T. The Effect of Positive End-Expiratory Pressure on Cardiac Output and Oxygen Delivery during Cardiopulmonary Resuscitation. Intensive Care Med. Exp. 2020, 8, 36. [Google Scholar] [CrossRef]
- Rossi, A.; Santos, C.; Roca, J.; Torres, A.; Felez, M.A.; Rodriguez-Roisin, R. Effects of PEEP on VA/Q Mismatching in Ventilated Patients with Chronic Airflow Obstruction. Am. J. Respir. Crit. Care Med. 1994, 149, 1077–1084. [Google Scholar] [CrossRef] [PubMed]
- Thompson, B.T.; Bernard, G.R. ARDS Network (NHLBI) Studies–Successes and Challenges in ARDS Clinical Research. Crit. Care Clin. 2011, 27, 459. [Google Scholar] [CrossRef] [PubMed][Green Version]
- Pomprapa, A.; Schwaiberger, D.; Pickerodt, P.; Tjarks, O.; Lachmann, B.; Leonhardt, S. Automatic Protective Ventilation Using the ARDSNet Protocol with the Additional Monitoring of Electrical Impedance Tomography. Crit. Care 2014, 18, R128. [Google Scholar] [CrossRef]
- Butler, I.B.; Schoonen, M.A.; Rickard, D.T. Removal of dissolved oxygen from water: A comparison of four common techniques. Talanta 1994, 41, 211–215. [Google Scholar] [CrossRef]
- Ghaly, A.E.; Kok, R. The Effect of Sodium Sulfite and Cobalt Chloride on the Oxygen Transfer Coefficient. Appl. Biochem. Biotechnol. 1988, 19, 259–270. [Google Scholar] [CrossRef]
Disclaimer/Publisher’s Note: The statements, opinions and data contained in all publications are solely those of the individual author(s) and contributor(s) and not of MDPI and/or the editor(s). MDPI and/or the editor(s) disclaim responsibility for any injury to people or property resulting from any ideas, methods, instructions or products referred to in the content. |
© 2025 by the authors. Licensee MDPI, Basel, Switzerland. This article is an open access article distributed under the terms and conditions of the Creative Commons Attribution (CC BY) license (https://creativecommons.org/licenses/by/4.0/).