
Development of Multimodal Stimulator for Studying Human Tactile Perception and Cognitive Functions: Preliminary Results


Abstract
Featured Application
Abstract
1. Introduction
2. Materials and Methods
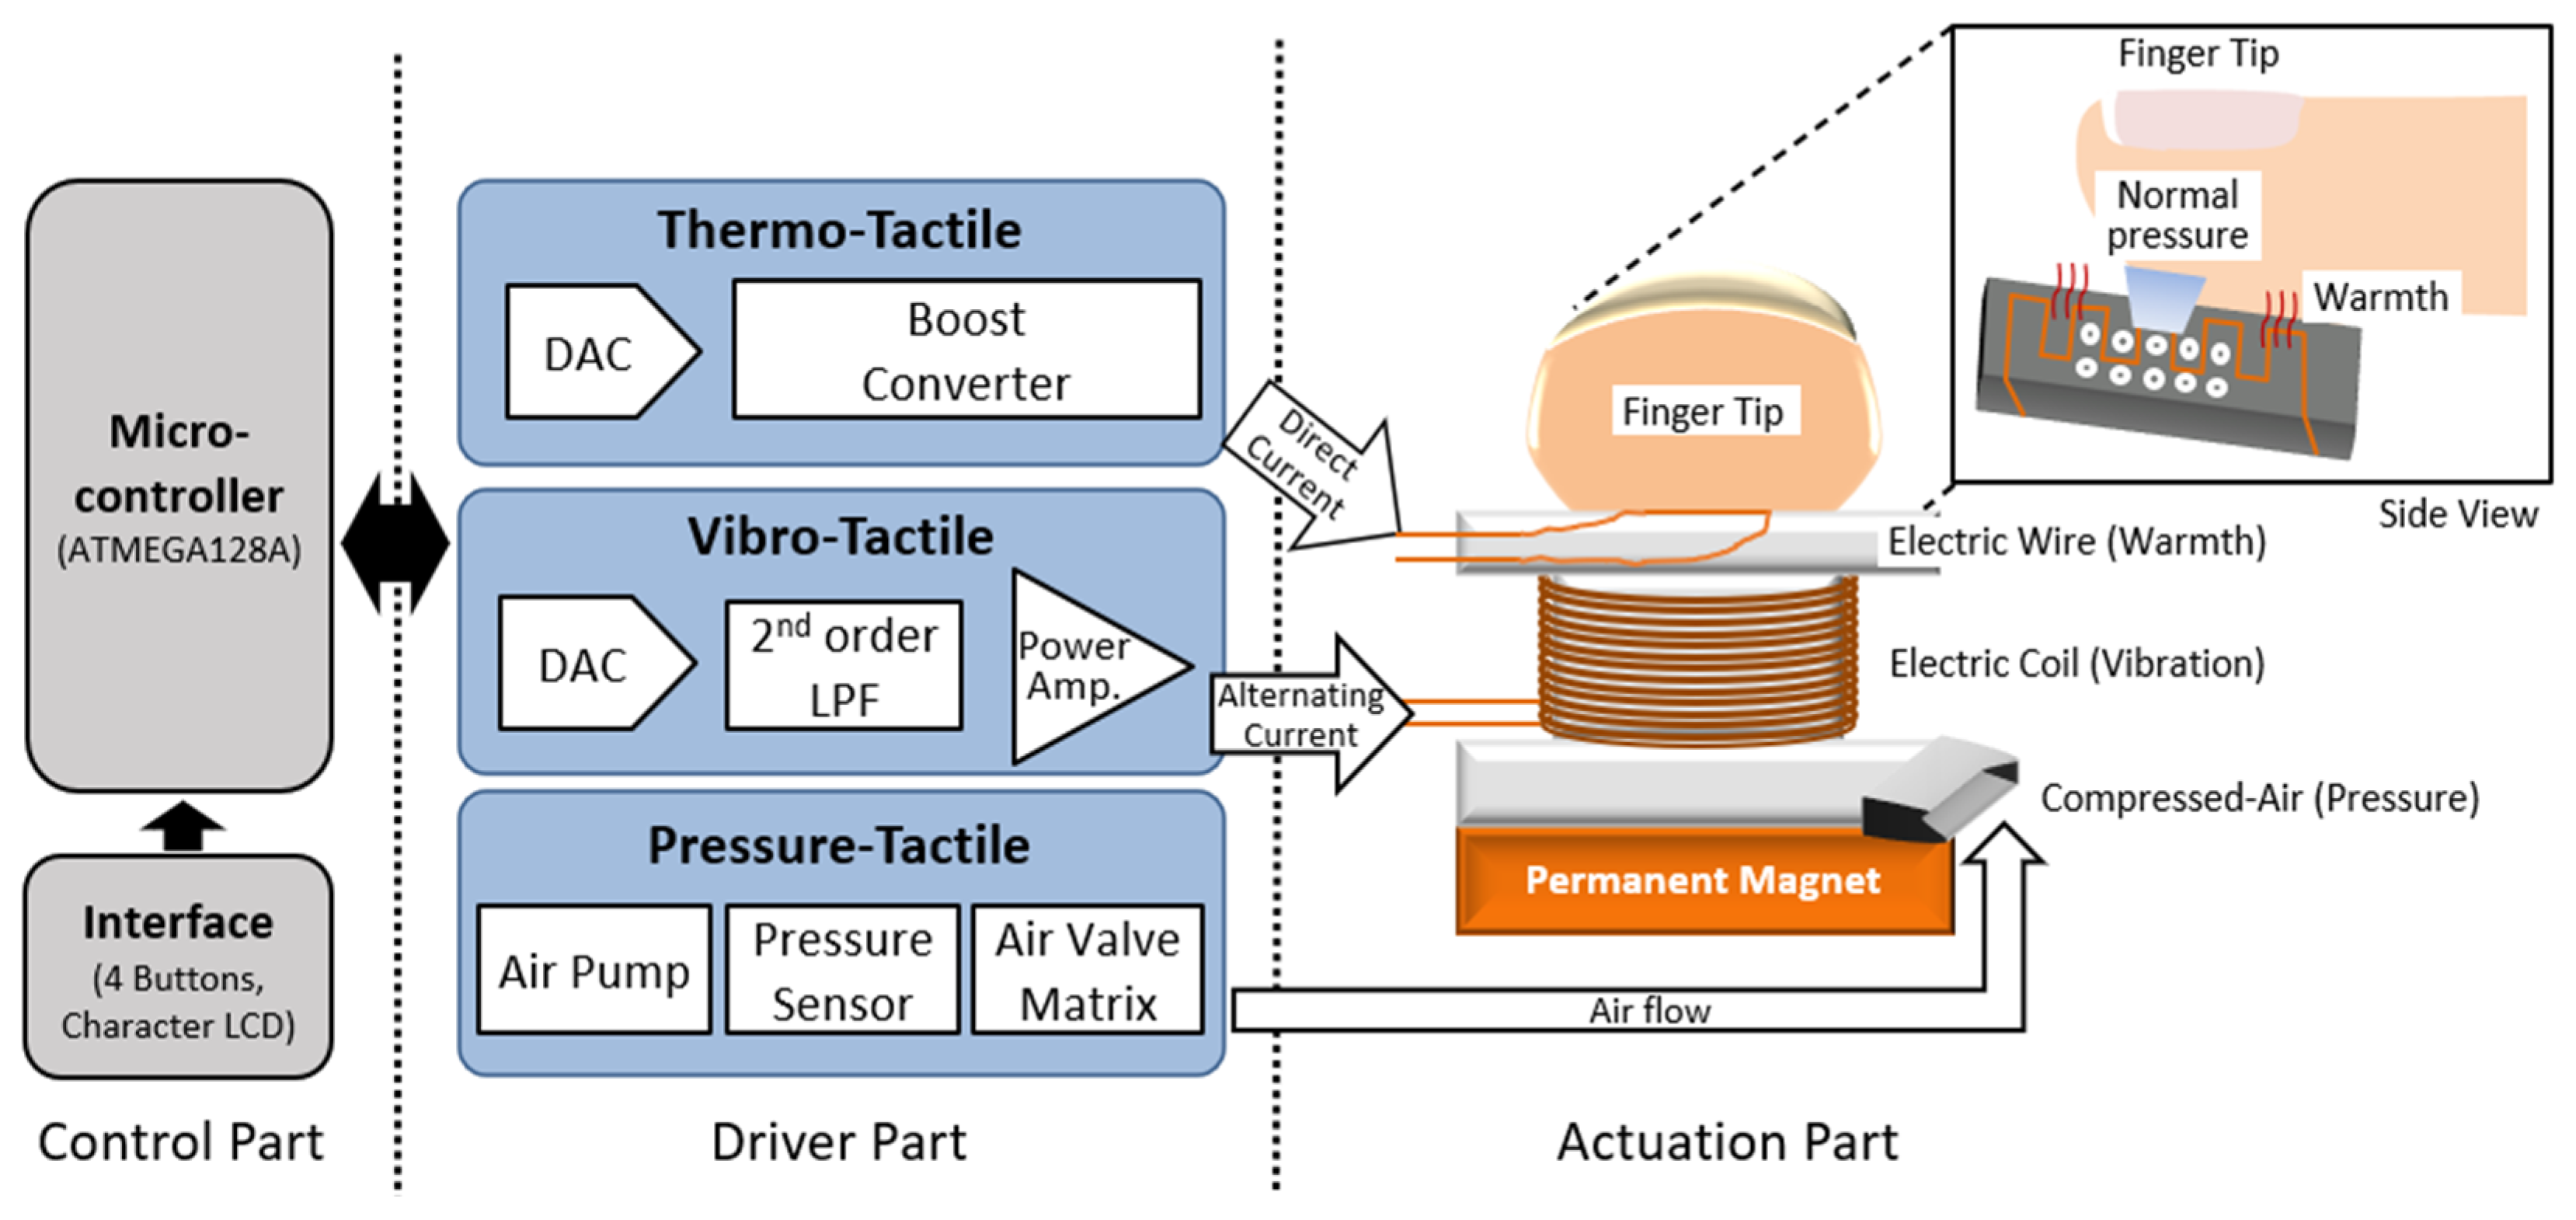
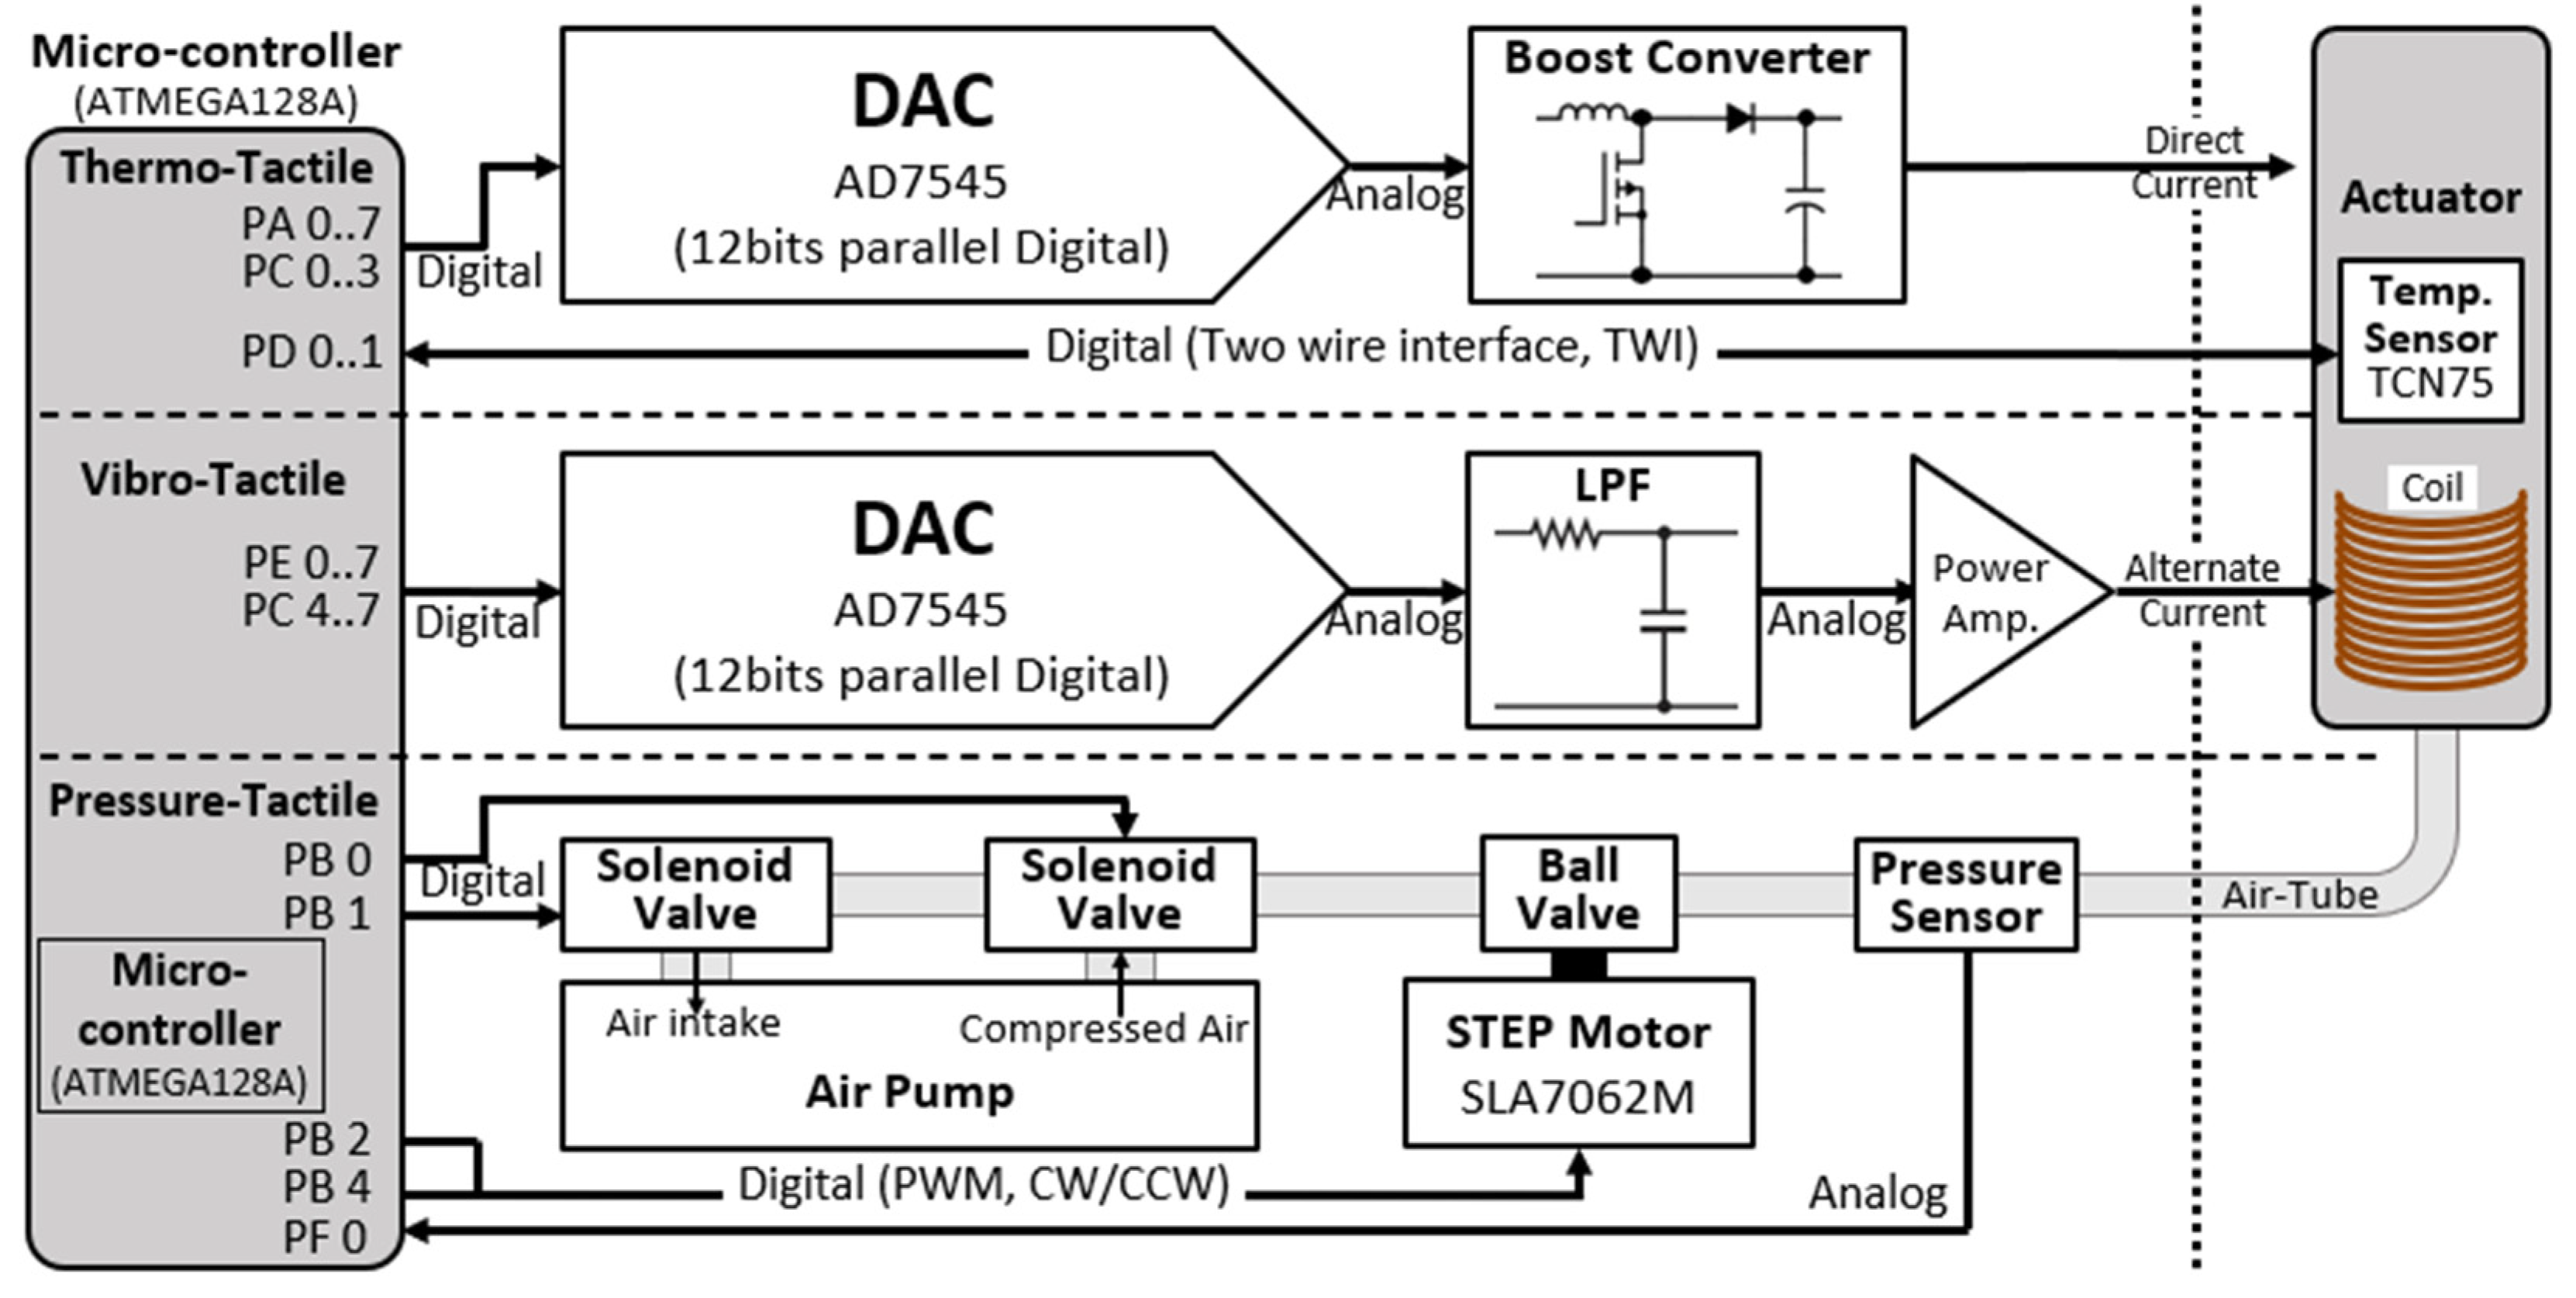
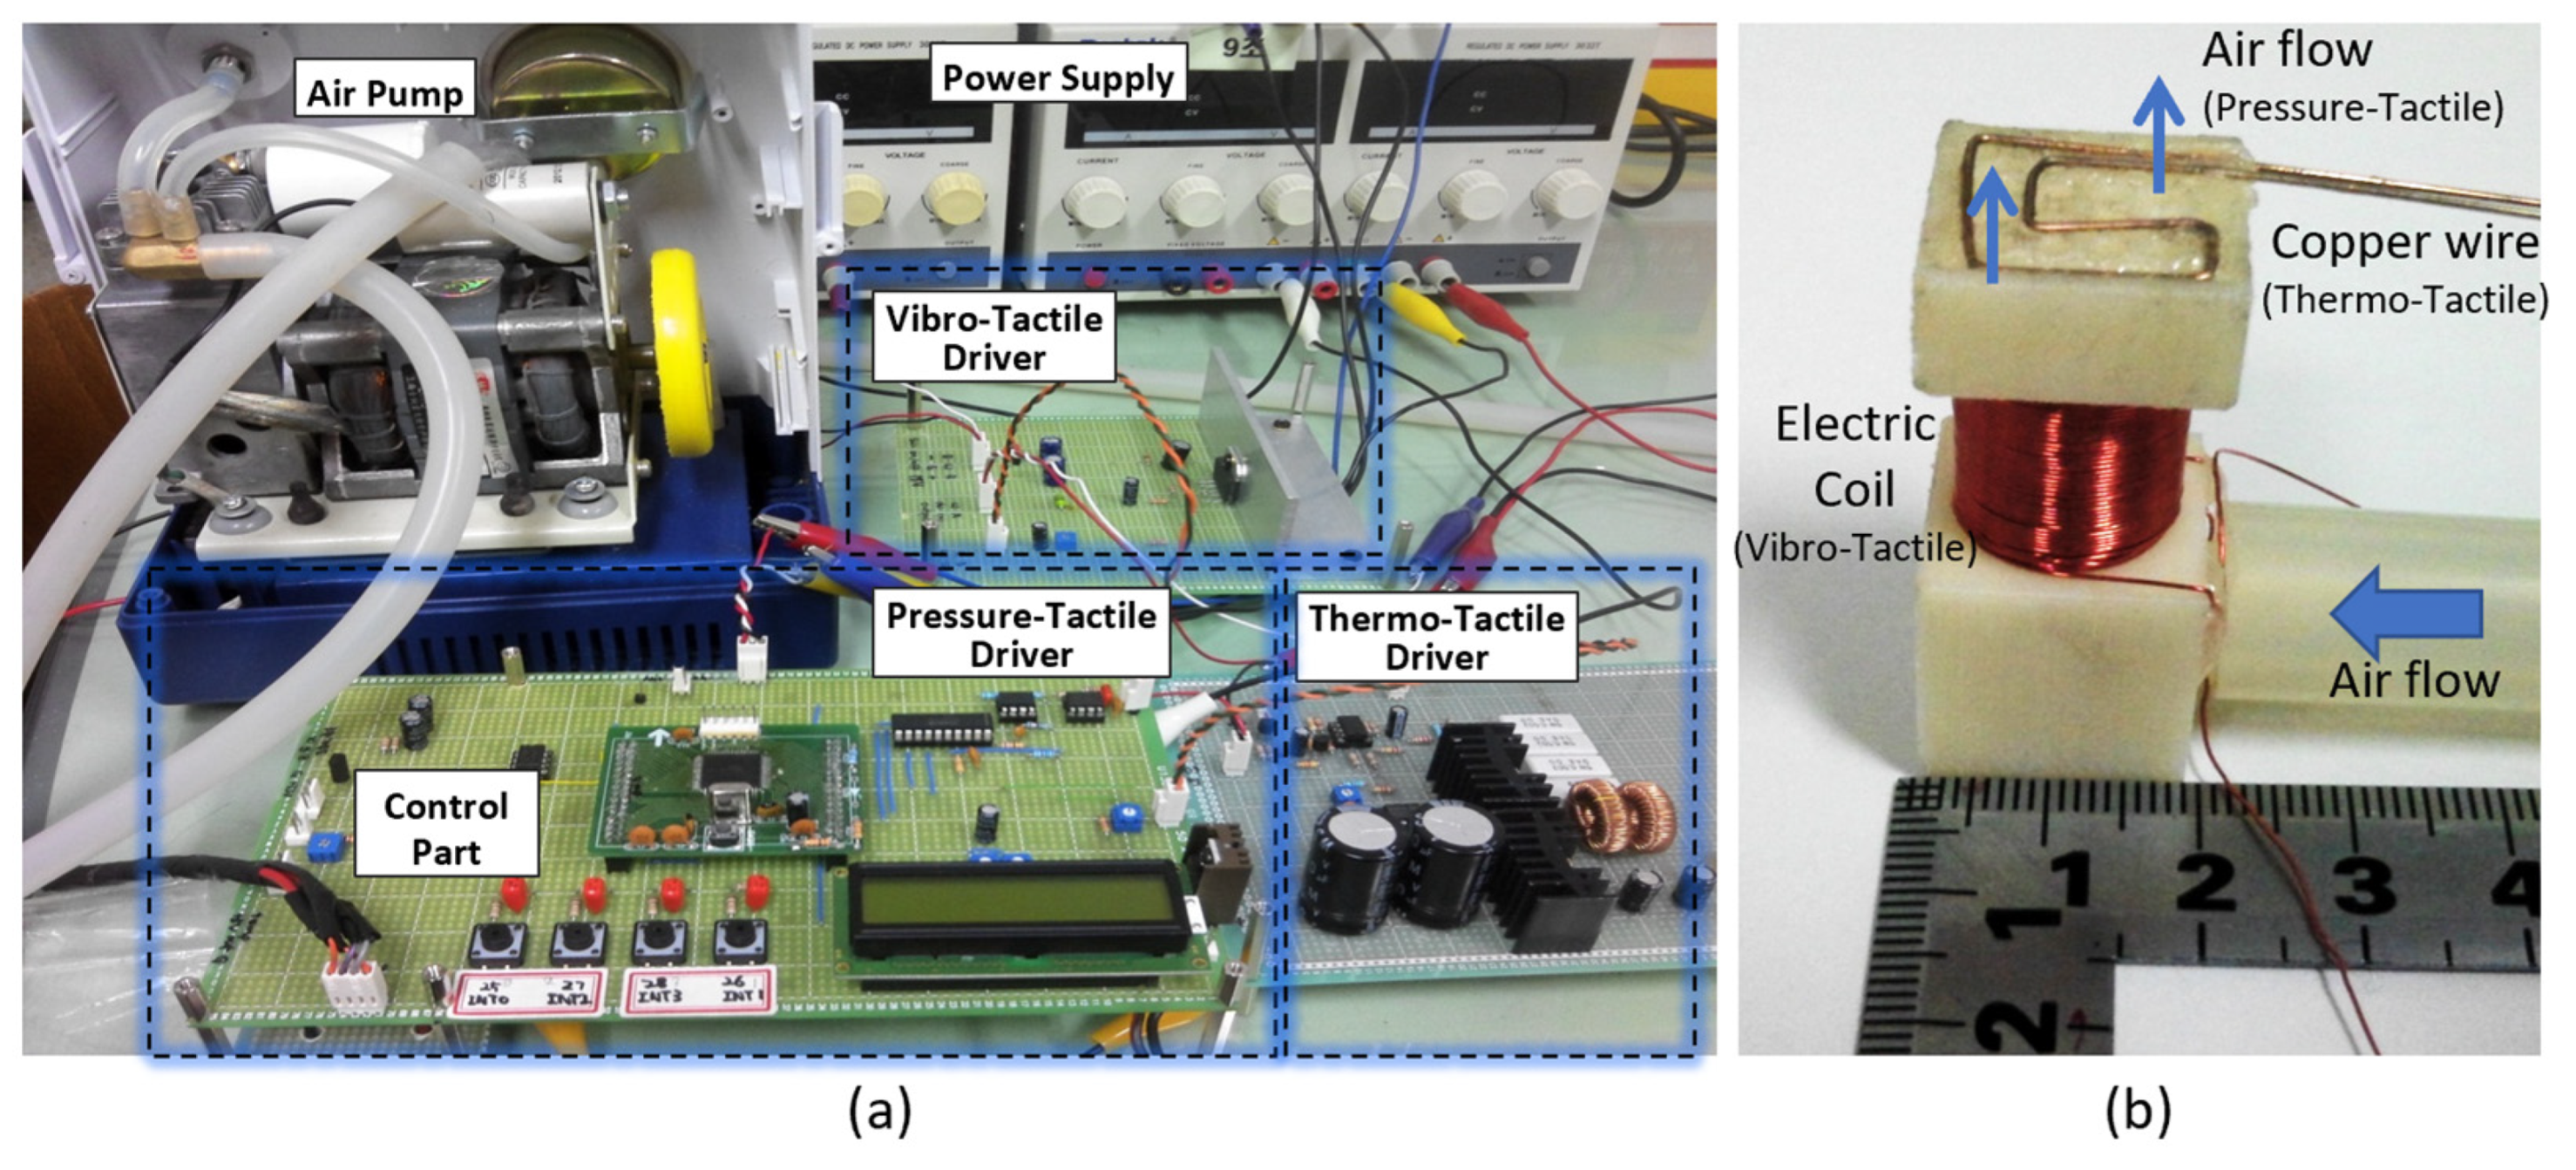
2.1. Control Part
2.2. Driver Part
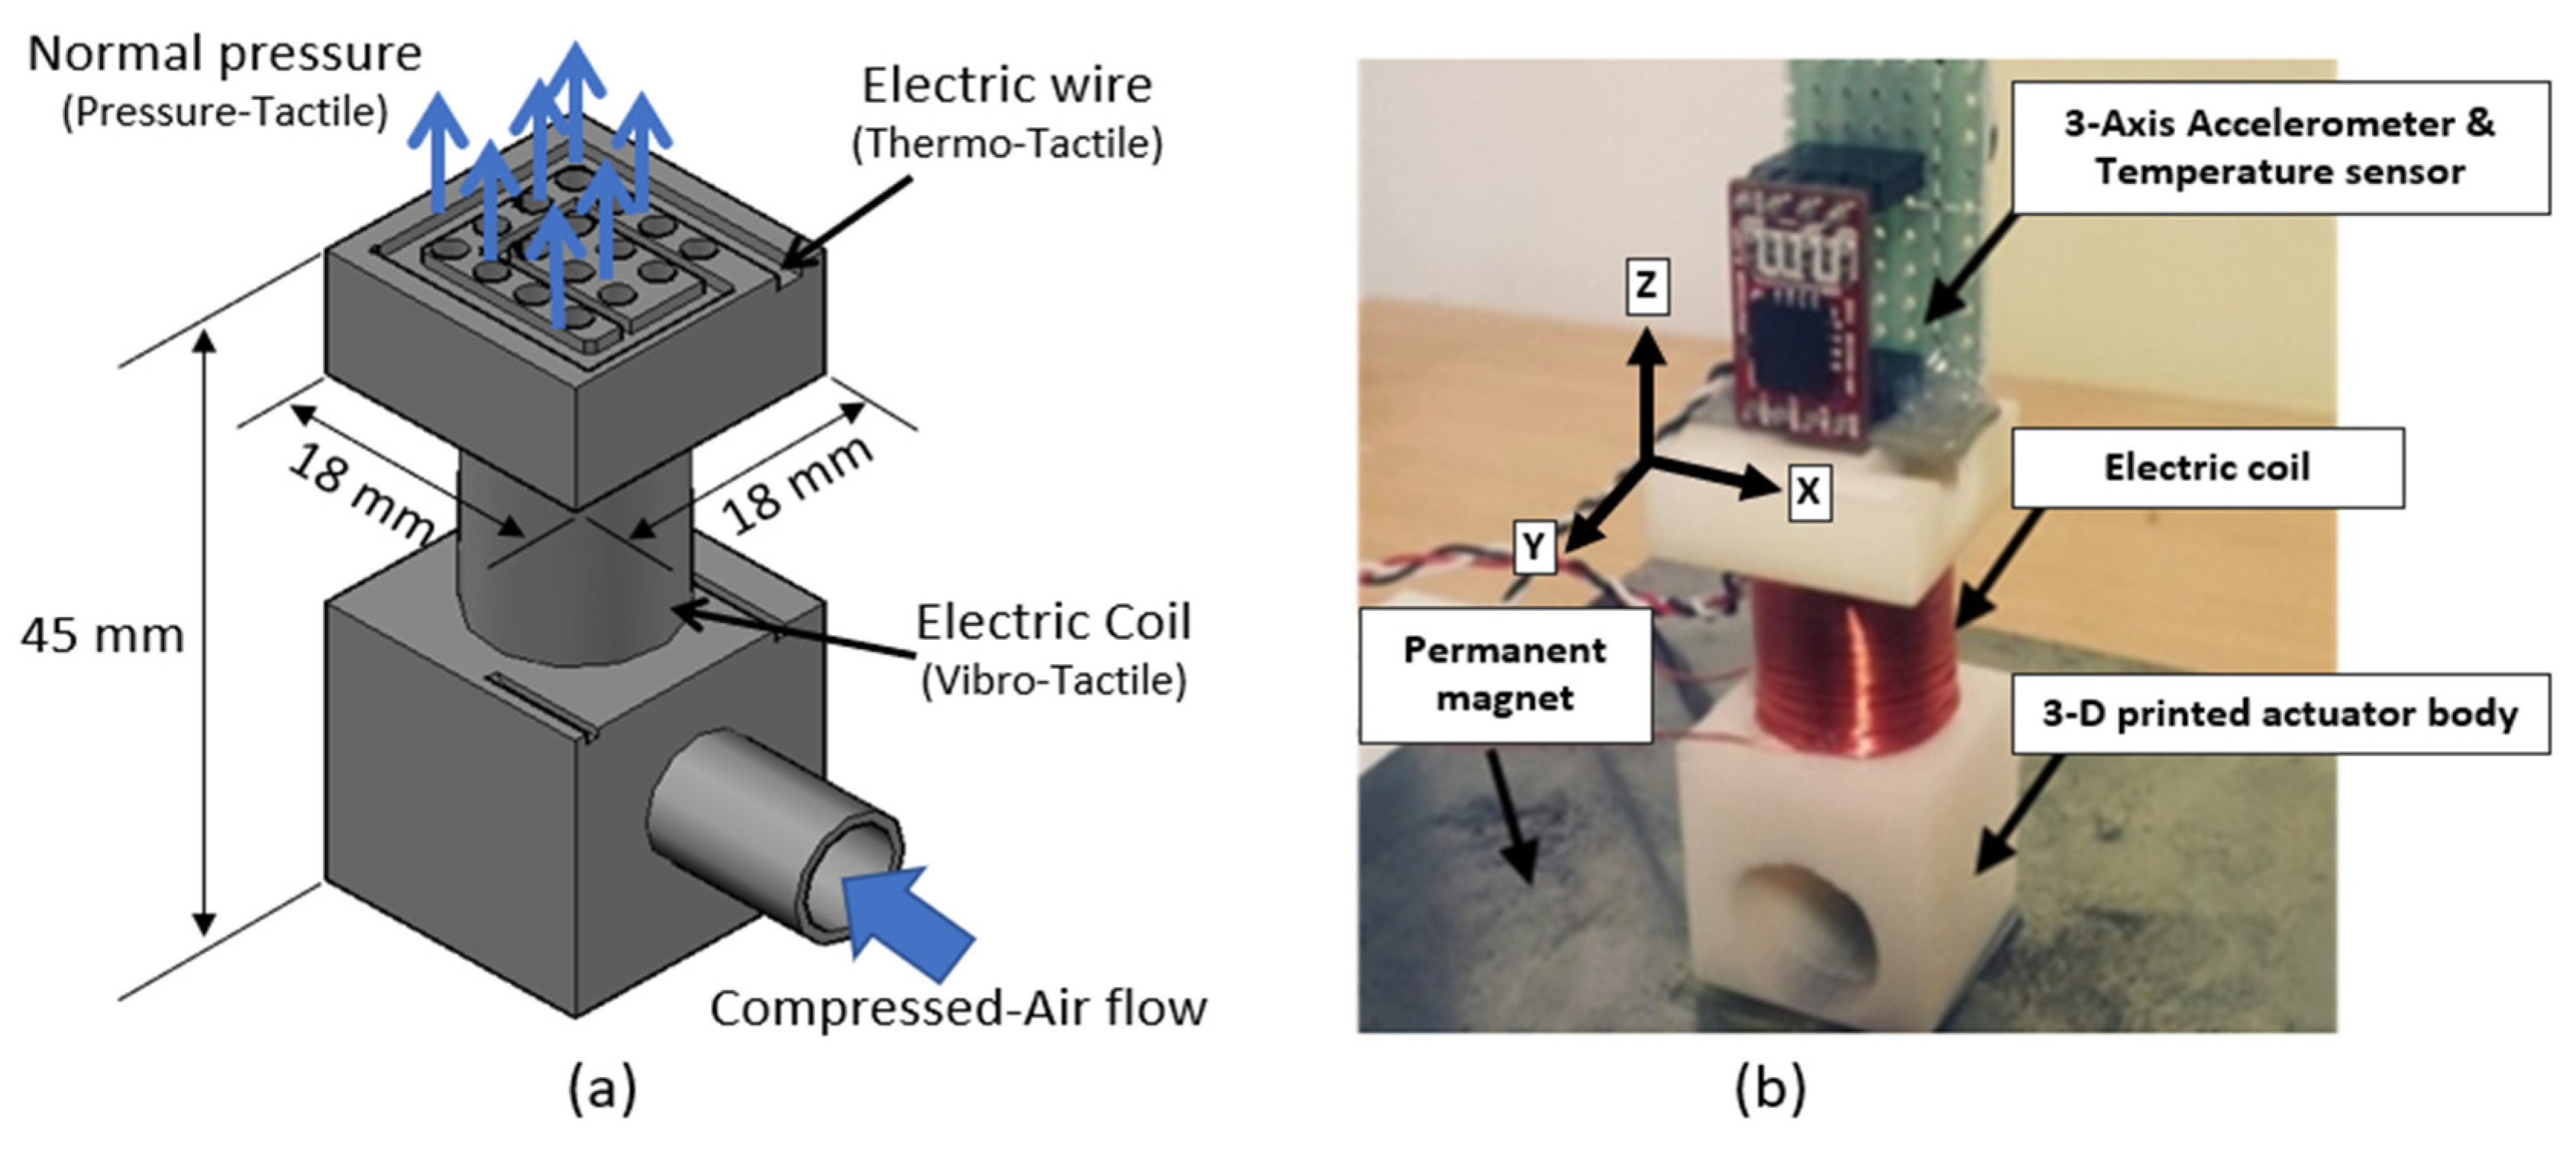
2.3. Actuator
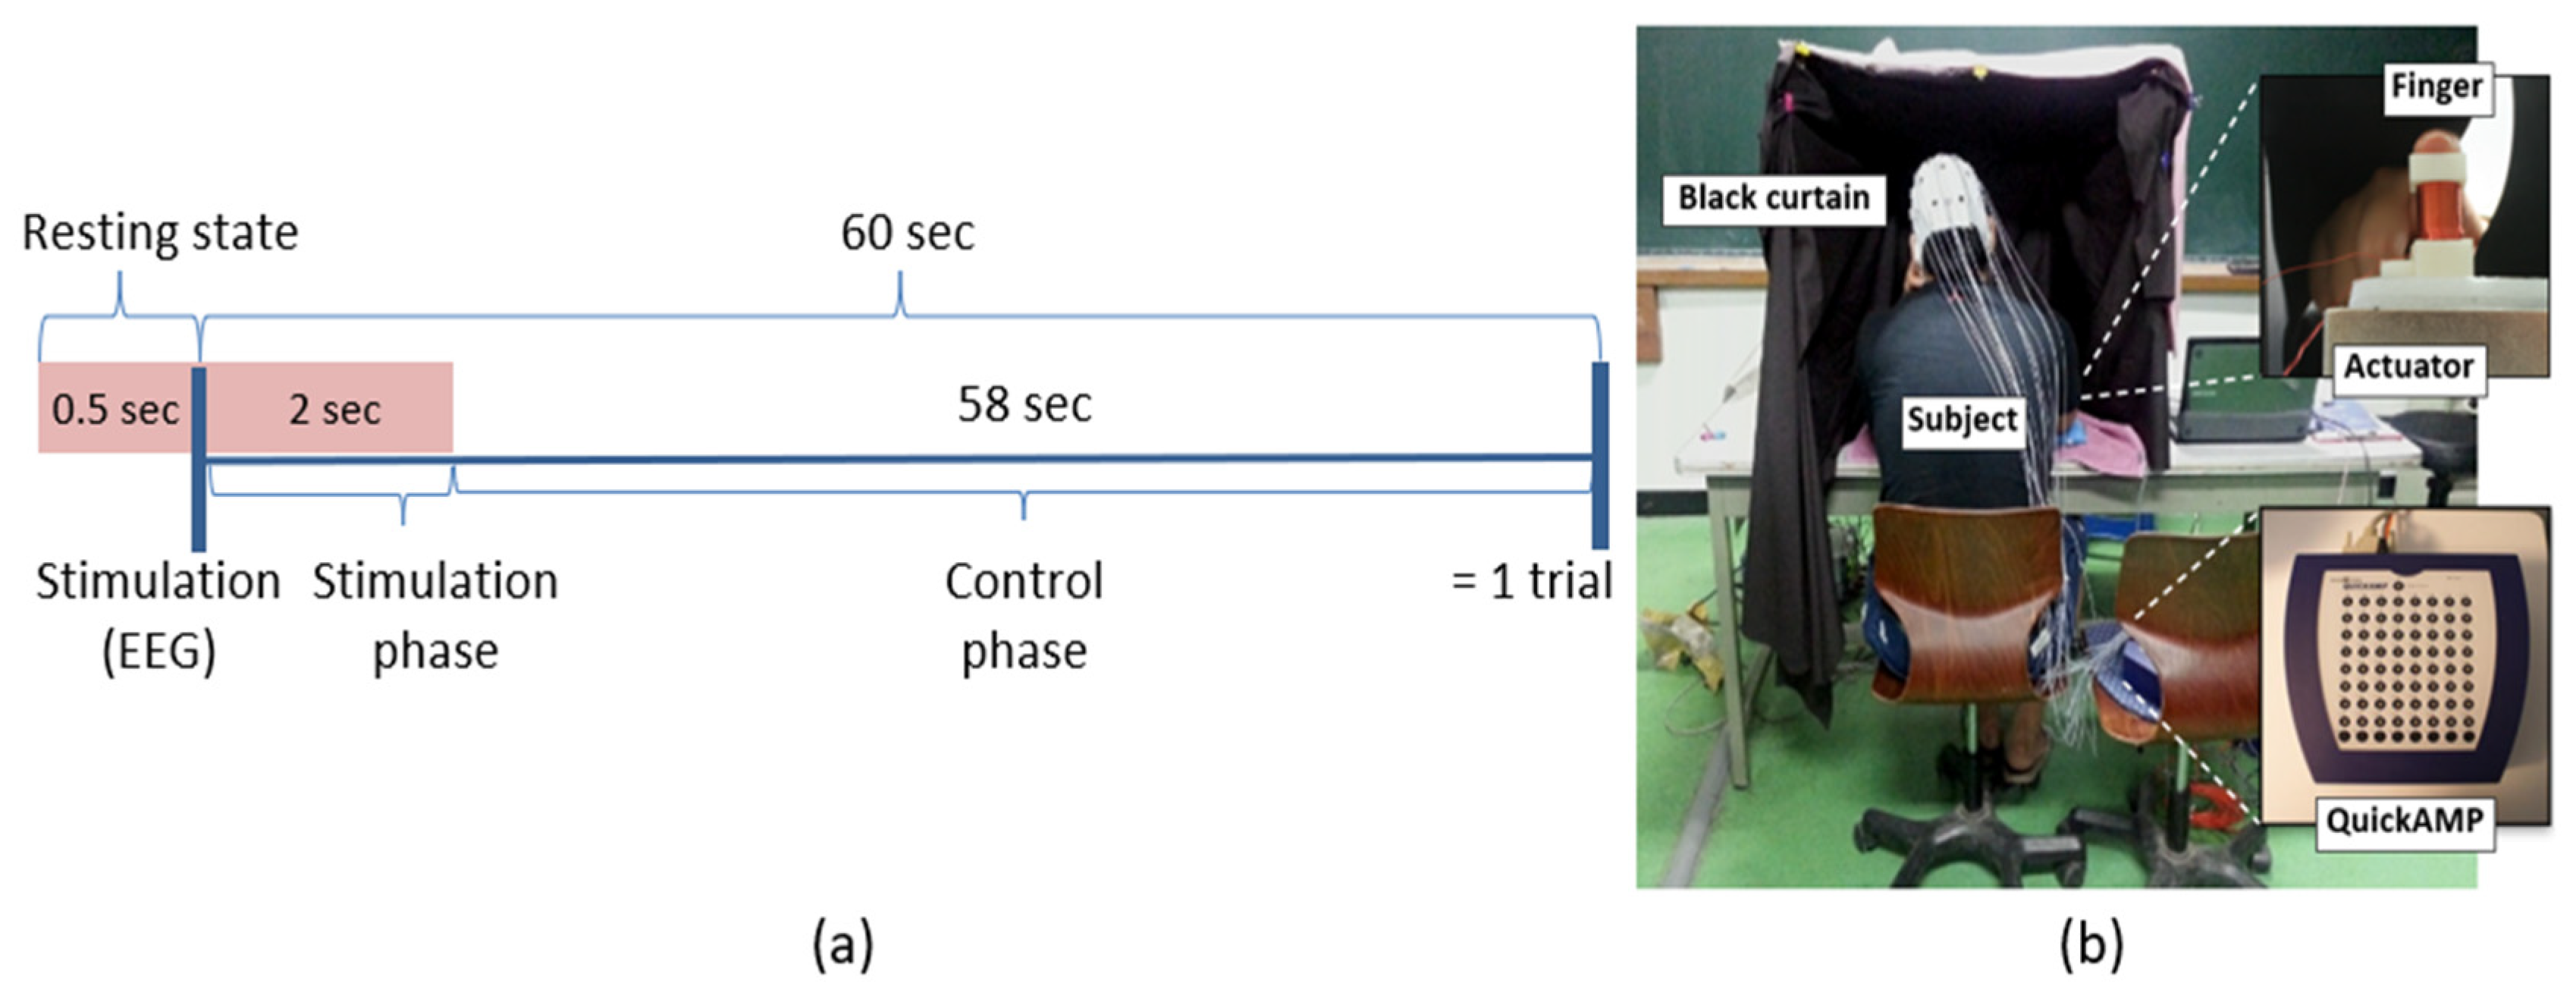
2.4. Preliminary Human Experiment
3. Results
3.1. Multimodal Stimulation Device and Actuator
3.2. Response Characteristics of the Actuator
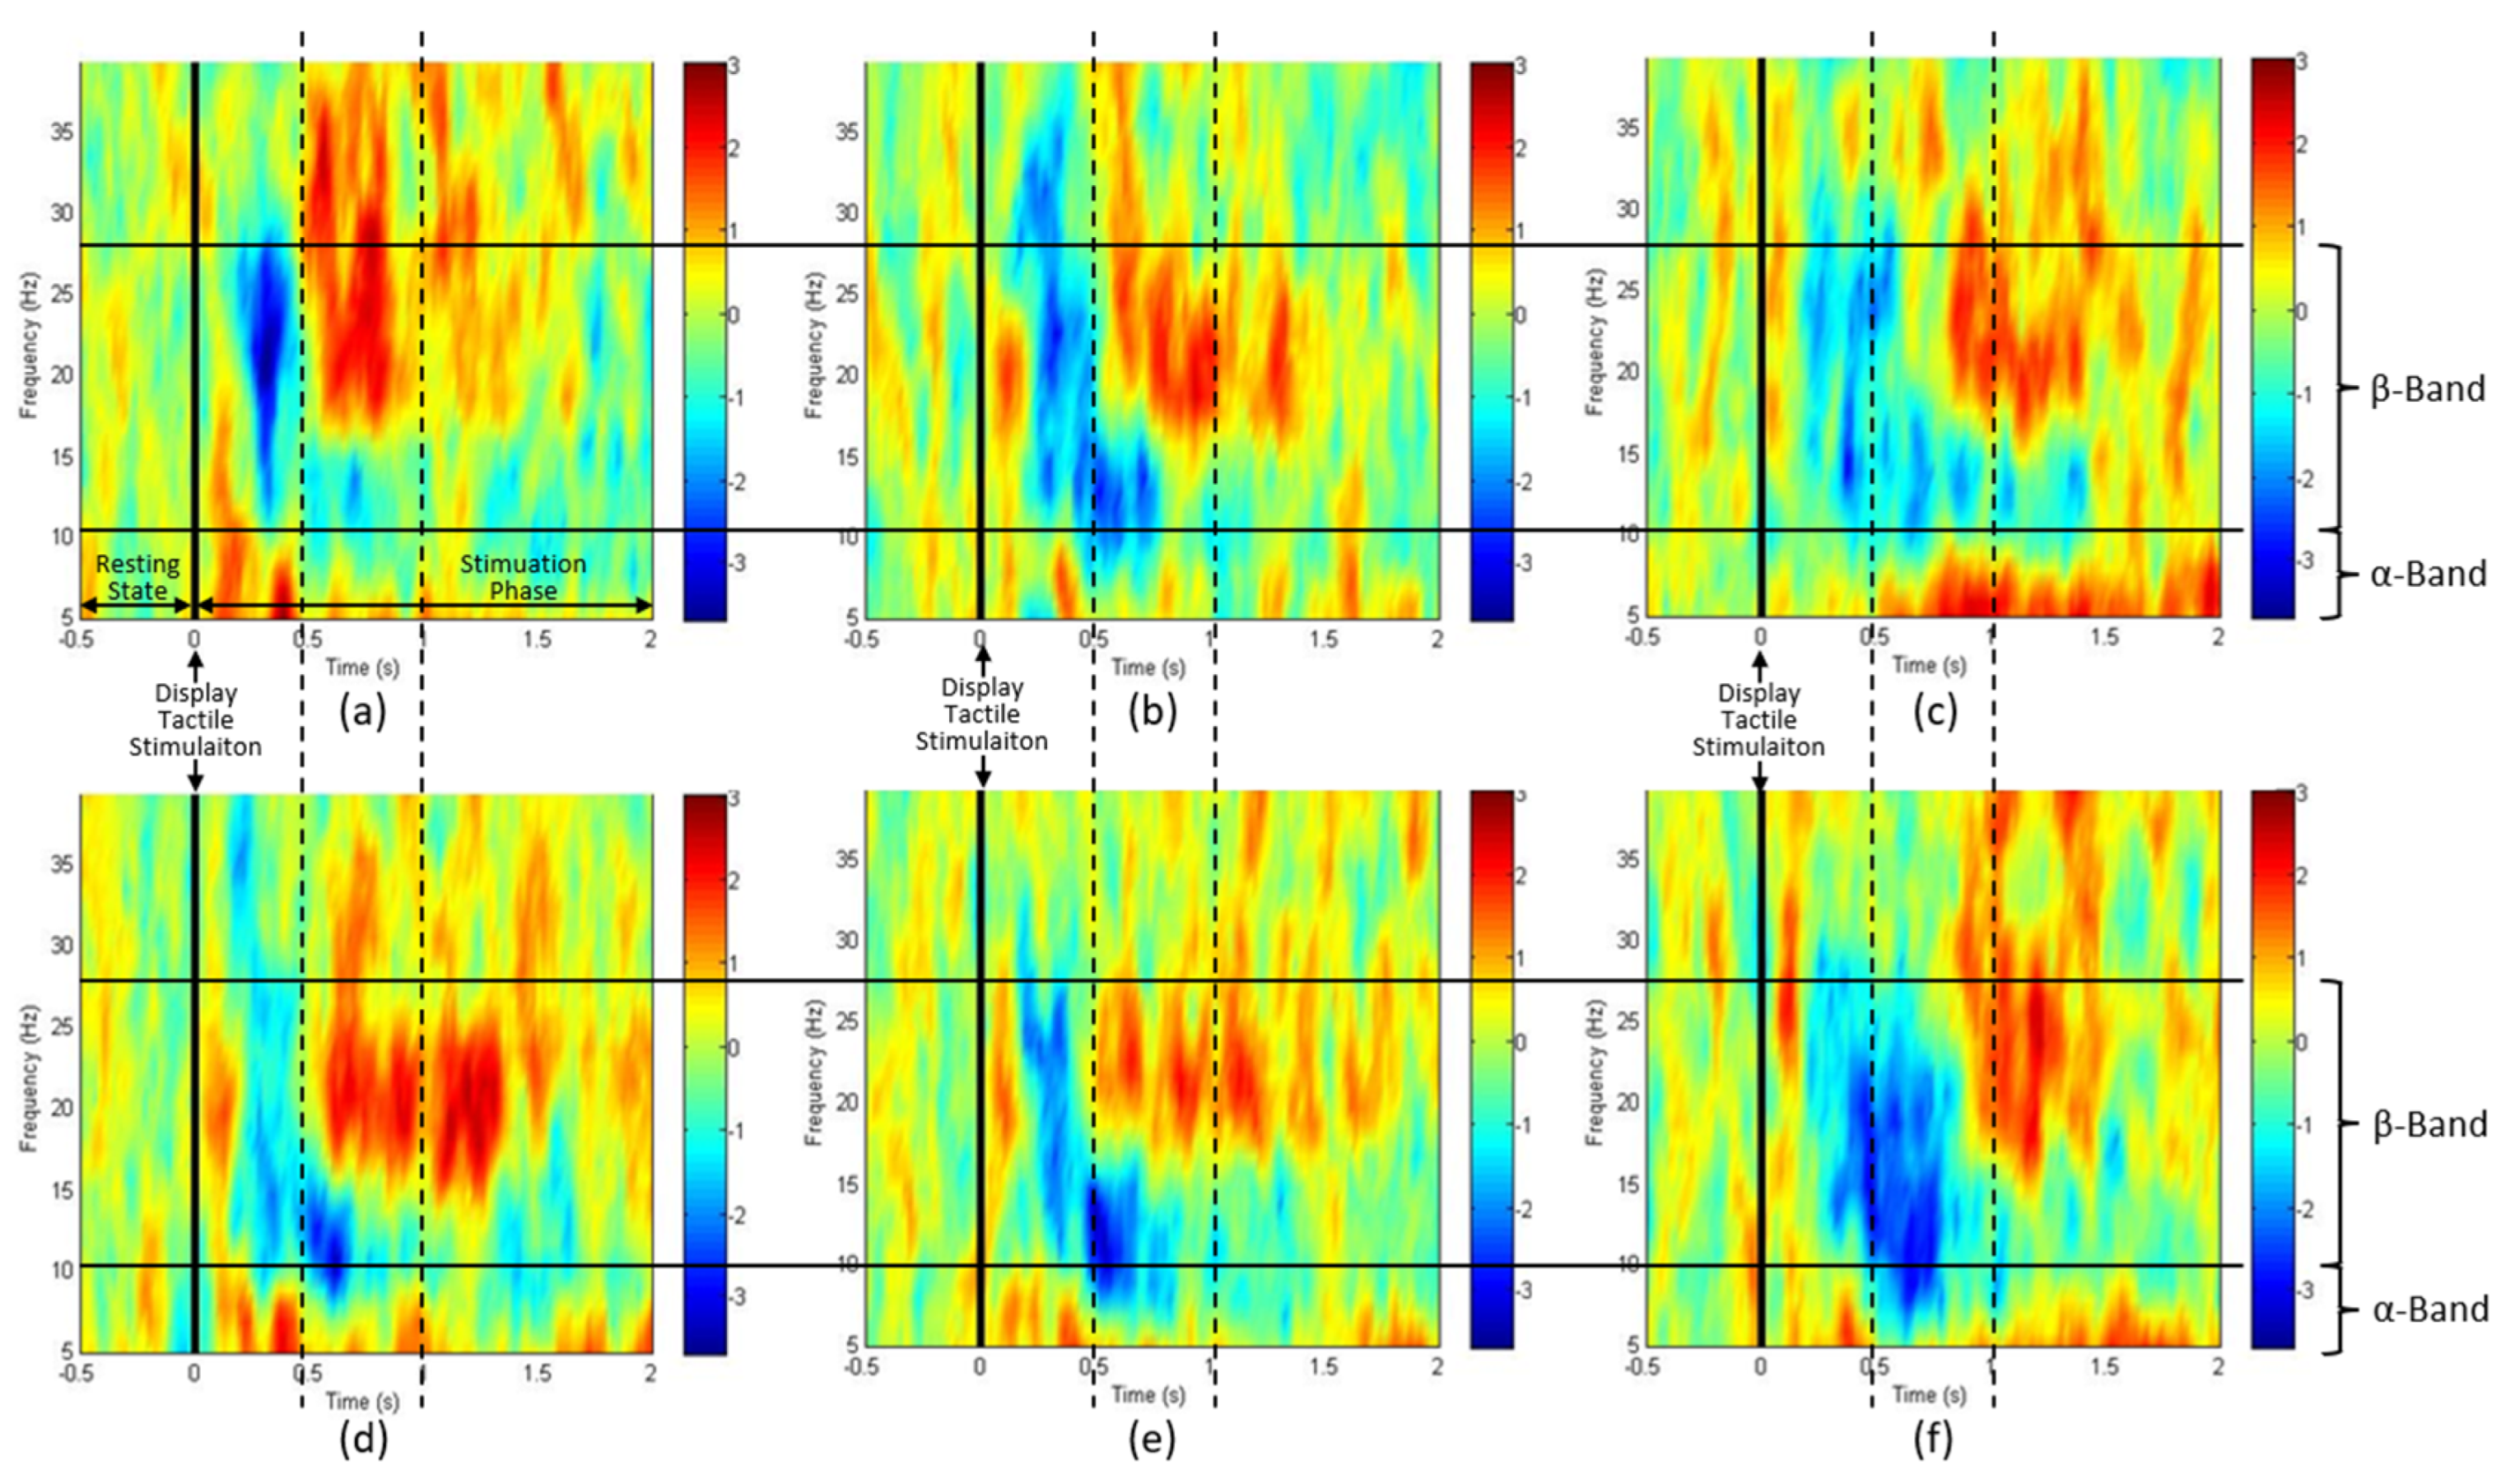
3.3. ERD/S Spectrogram Analysis
4. Discussion
5. Conclusions
Author Contributions
Funding
Institutional Review Board Statement
Informed Consent Statement
Data Availability Statement
Conflicts of Interest
References
- Park, B.J.; Hunt, S.J., III; Martin, C.; Nadolski, G.J.; Wood, B.J.; Gade, T.P. Augmented and mixed reality: Technologies for enhancing the future of IR. J. Vasc. Interv. Radiol. 2020, 13, 1074–1082. [Google Scholar] [CrossRef] [PubMed]
- Tang, Y.M.; Chau, K.Y.; Kwok, A.P.K.; Zhu, T.; Ma, X. A systematic review of immersive technology applications for medical practice and education—Trends, application areas, recipients, teaching contents, evaluation methods, and performance. Edu. Res. Rev. 2022, 35, 100429. [Google Scholar] [CrossRef]
- Sanfilippo, F.; Blazauskas, T.; Salvietti, G.; Ramos, I.; Vert, S.; Radianti, J.; Majchrzak, T.A.; Oliveira, D. A Perspective Review on Integrating VR/AR with Haptics into STEM Education for Multi-Sensory Learning. Robotics 2022, 11, 41. [Google Scholar] [CrossRef]
- Rokhsaritalemi, S.; Sadeghi-Niaraki, A.; Choi, S.-M. A Review on Mixed Reality: Current Trends, Challenges and Prospects. Appl. Sci. 2020, 10, 636. [Google Scholar] [CrossRef]
- Duan, H.; Zhu, X.; Zhu, Y.; Min, X.; Zhai, G. A Quick Review of Human Perception in Immersive Media. IEEE Open J. Immer. Displays 2024, 1, 41–50. [Google Scholar] [CrossRef]
- Yu, X.; Xie, Z.; Yu, Y.; Lee, J.; Vazquez-Guardado, A.; Luan, H.; Ruban, J.; Ning, X.; Akhtar, A.; Li, D.; et al. Skin-integrated wireless haptic interfaces for virtual and augmented reality. Nature 2019, 575, 473–479. [Google Scholar] [CrossRef] [PubMed]
- Xie, X.; Liu, S.; Yang, C.; Yang, Z.; Liu, T.; Xu, J.; Zhang, C.; Zhai, X. A Review of Smart Materials in Tactile Actuators for Information Delivery. Carbon. R. 2017, 3, 38. [Google Scholar] [CrossRef]
- Tan, M.W.M.; Wang, H.; Gao, D.; Huang, P.; Lee, P.S. Towards high performance and durable soft tactile actuators. Chem. Soc. Rev. 2024, 53, 3485–3535. [Google Scholar] [CrossRef]
- Bacheva, V.; Firouzeh, A.; Leroy, E.; Balciunaite, A.; Davila, D.; Gabay, I.; Paratore, F.; Bercovici, M.; Shea, H.; Kaigala, G. Dynamic control of high-voltage actuator arrays by light-pattern projection on photoconductive switches. Microsyst. Nanoeng. 2023, 9, 59. [Google Scholar] [CrossRef]
- Shultz, C.; Harrison, C. Flat Panel Haptics: Embedded Electroosmotic Pumps for Scalable Shape Displays. In Proceedings of the 2023 CHI Conference on Human Factors in Computing Systems, Hamburg, Germany, 23–28 April 2023; Volume 745, pp. 1–16. [Google Scholar] [CrossRef]
- Lee, S.; Jang, S.; Cha, Y. Soft wearable thermos+touch haptic interface for virtual reality. iScience 2024, 27, 111303. [Google Scholar] [CrossRef]
- Raza, A.; Hassan, W.; Jeon, S. Pneumatically Controlled Wearable Tactile Actuator for Multi-Modal Haptic Feedback. IEEE Access 2024, 12, 59485–59499. [Google Scholar] [CrossRef]
- Li, D.; He, J.; Song, Z.; Yao, K.; Wu, M.; Fu, H.; Liu, Y.; Gao, Z.; Zhou, J.; Wei, L.; et al. Miniaturization of mechanical actuators in skin-integrated electronics for haptic interfaces. Microsyst. Nanoeng. 2021, 7, 85. [Google Scholar] [CrossRef]
- Yang, T.H.; Kim, J.R.; Jin, H.; Gil, H.; Koo, J.H.; Kim, H.J. Recent Advances and Opportunities of Active Materials for Haptic Technologies in Virtual and Augmented Reality. Adv. Func. Mat. 2021, 31, 2008831. [Google Scholar] [CrossRef]
- Hashem, M.S.; Raza, A.; Jeon, S. Silicone-made Tactile Actuator Integrated with Hot Thermo-Fiber Finger Sleeve. In Proceedings of the 6th International Conference AsiaHaptics 2024, Bandar Sunway, Malaysia, 30 October 2024. [Google Scholar] [CrossRef]
- Kim, H.S.; Choi, M.H.; Chung, S.C. Development of a puff- and suction-type pressure stimulator for human tactile studies. Behav. Res. Methods 2018, 50, 703–710. [Google Scholar] [CrossRef] [PubMed]
- Bardouille, T.; Picton, T.W.; Ross, B. Attention modulates beta oscillation during prolonged tactile stimulation. Eur. J. Neurosci. 2010, 31, 761–769. [Google Scholar] [CrossRef] [PubMed]
- Cobo, R.; García-Piqueras, J.; Cobo, J.; Vega, J.A. The Human Cutaneous Sensory Corpuscles: An Update. J. Clin. Med. 2021, 10, 227. [Google Scholar] [CrossRef]
- Feldbusch, A.; Sadegh-Azar, H.; Agne, P. Vibration analysis using mobile devices (smartphones or tablets). Procedia Eng. 2017, 199, 2790–2795. [Google Scholar] [CrossRef]
- Deflorio, D.; Di, L.M.; Wing, A.M. Skin and Mechanoreceptor Contribution to Tactile Input for Perception: A Review of Simulation Models. Front. Hum. Neurosci. 2022, 16, 862344. [Google Scholar] [CrossRef]
- Pfurtscheller, G.; Lopes da Silva, F.H. Event-related EEG/MEG synchronization and desynchronization: Basic principles. Clin. Neurophysiol. 1996, 110, 1842–1857. [Google Scholar] [CrossRef]
- Stieger, J.R.; Engel, S.A.; He, B. Continuous sensorimotor rhythm based brain computer interface learning in a large population. Sci. Data 2021, 8, 98. [Google Scholar] [CrossRef]
- Yakovlev, L.; Syrov, N.; Miroshnikov, A.; Lebedev, M.; Kaplan, A. Event-Related Desynchronization Induced by Tactile Imagery: An EEG Study. eNeuro 2023, 10, 455–477. [Google Scholar] [CrossRef] [PubMed]
- Ede, F.V.; Szebényi, S.; Maris, E. Attentional modulations of somatosensory alpha, beta and gamma oscillations dissociate between anticipation and stimulus processing. NeuroImage 2014, 97, 134–141. [Google Scholar] [CrossRef] [PubMed]
- Delmas, P.; Hao, J.; Rodat-Despoix, L. Molecular mechanisms of mechanotransduction in mammalian sensory neurons. Nat. Rev. Neurosci. 2011, 12, 139–154. [Google Scholar] [CrossRef] [PubMed]
- Schepers, R.J.; Ringkamp, M. Thermoreceptors and thermosensitive afferents. Neurosci. Biobehav. Rev. 2010, 34, 177–184. [Google Scholar] [CrossRef]

Disclaimer/Publisher’s Note: The statements, opinions and data contained in all publications are solely those of the individual author(s) and contributor(s) and not of MDPI and/or the editor(s). MDPI and/or the editor(s) disclaim responsibility for any injury to people or property resulting from any ideas, methods, instructions or products referred to in the content. |
© 2025 by the authors. Licensee MDPI, Basel, Switzerland. This article is an open access article distributed under the terms and conditions of the Creative Commons Attribution (CC BY) license (https://creativecommons.org/licenses/by/4.0/).
Share and Cite
Chung, S.-C.; An, J.; Kim, K.-B.; Choi, M.-H.; Kim, H.-S. Development of Multimodal Stimulator for Studying Human Tactile Perception and Cognitive Functions: Preliminary Results. Appl. Sci. 2025, 15, 7184. https://doi.org/10.3390/app15137184
Chung S-C, An J, Kim K-B, Choi M-H, Kim H-S. Development of Multimodal Stimulator for Studying Human Tactile Perception and Cognitive Functions: Preliminary Results. Applied Sciences. 2025; 15(13):7184. https://doi.org/10.3390/app15137184
Chicago/Turabian StyleChung, Soon-Cheol, Jinsu An, Kyu-Beom Kim, Mi-Hyun Choi, and Hyung-Sik Kim. 2025. "Development of Multimodal Stimulator for Studying Human Tactile Perception and Cognitive Functions: Preliminary Results" Applied Sciences 15, no. 13: 7184. https://doi.org/10.3390/app15137184
APA StyleChung, S.-C., An, J., Kim, K.-B., Choi, M.-H., & Kim, H.-S. (2025). Development of Multimodal Stimulator for Studying Human Tactile Perception and Cognitive Functions: Preliminary Results. Applied Sciences, 15(13), 7184. https://doi.org/10.3390/app15137184