Article

A Simulation of the Densification Process of NdFeB Bulks by a Modified Drucker–Prager Cap Model

1
Magnetism Key Laboratory of Zhejiang Province, China Jiliang University, Hangzhou 310018, China
2
Department of Fundamental Courses, Wuxi Institute of Technology, Wuxi 214121, China
3
Creative Design Engineering Lab, School of Engineering, University of Liverpool, Liverpool L69 3BX, UK
4
JL MAG Rare-Earth Co., Ltd. of Jiangxi Province, Ganzhou 341000, China
*
Author to whom correspondence should be addressed.
These authors contributed equally to this work.
Appl. Sci. 2025, 15(13), 7173; https://doi.org/10.3390/app15137173
Submission received: 14 April 2025 / Revised: 16 June 2025 / Accepted: 16 June 2025 / Published: 26 June 2025

Abstract

During the sintering process of NdFeB bulks, temperature changes and significant temperature differences between the bulk interior and the surface region will produce high residual stress. Temperature field and stress field prediction during the sintering process is one of the key techniques for analyzing residual stress. Therefore, the sintering process simulation and residual stress prediction of NdFeB bulks under different sintering temperatures were conducted based on the modified Drucker–Prager cap (DPC) model in ABAQUS (ABAQUS 2024). The calculated field cloud charts were analyzed against the microstructure of the bulks observed by scanning electron microscope (SEM). The finite element analysis (FEA) results of the sintering process and the residual stress show good agreement with SEM morphologies, which validates the accuracy and predictability of the model. The results indicate that cracks predominantly formed in edge regions. As the sintering temperature increased, longitudinal compressive stress at the edge of the cross-section transitioned into tensile stress. These results indicate that the developed simulation framework effectively identifies crack-prone areas, enabling data-driven optimization to reduce experimental trial-and-error costs in engineering applications.

1. Introduction

NdFeB permanent magnets exhibit great performance in commercial applications. Since their introduction in the early 1980s, they have attracted much attention due to their excellent magnetic properties and low costs. They have been widely used in many high-tech applications, such as electric motors [1], generators [2], magnetic machines [3], magnetic levitation trains [4], magnetic resonance imaging (MRI) [5], and so on. In emerging sectors, such as new energy vehicles, wind power generation, and energy-saving household electrical appliances, the demand for NdFeB permanent magnets is increasing rapidly. Therefore, the highly efficient preparation of these magnet materials has become critical for advancing the magnetic materials industry. NdFeB magnets are prepared mainly by the adhesive process [6], the sintering process [7], and the thermal processing process [8]. Compared with the adhesive and sintering processes, the thermal process has fewer steps and is more suitable for commercial mass production. The spark plasma sintering (SPS) technique is a new energy-saving, efficient, and environment-friendly material thermal processing technology [9]. However, in the NdFeB preparation process, the contraction inconsistency among various parts leads to cracks during the sintering process [10]. In addition, the preparation of magnets has issues like uneven density, stress concentration, etc., which are detrimental to their shaping and performance. As a result, additional adjustment is required to reduce the cracks and generate better performance, causing wasted time and prolonged test cycles. To address this, finite element analysis (FEA) is used to transform the project into a visual model. The real-time changes in the microstructure of the green body (unsintered NdFeB bulk) can be assessed by observing the distribution of density and stress during the shaping of NdFeB powder under different sintering processes. This approach can reduce raw material usage, save trial costs, and further help improve sample quality.
Finite element software has a superior pre–post-processing program and a high-strength nonlinear solution system. Several yield models have been implemented into FEA to simulate the characteristics of metal powder [11]. Mardari et al. [12] simulated the pressing process of metal powder in ABAQUS software and used the DPC model to describe the properties of metal powders. Sun et al. [13] simulated three powder molding experiments based on the modified DPC model, and the results highly correspond to the density field, which shows that the cap model can reduce the error to make the modified model more accurate. Staf H et al. [14] used tungsten carbide powder as the research object to obtain cap model parameters by inverse modeling, showing the flexibility of the cap model. In current studies, the modified DPC model is more commonly applied in powder pressing and density analysis than many constitutive models, and a model with high simulation accuracy can be obtained through appropriate design. This is why researchers have focused more on the study of this type of model in recent years [12,13]. It was found that the modified DPC model is directly related to material density and yield strength, accurately simulating powder densification. Compared with traditional models, it conforms better to the mechanisms of material hardening. Moreover, a curvature-continuous transition function can be used between the cap and the shear yield surface to avoid stress jumps and improve the convergence of the calculation. The DPC constitutive model is based on the framework of elastic–plastic mechanics and describes the densification and shear failure behavior of powders under external pressure. It is widely used to simulate material behavior in powder metallurgy. It is especially suitable for describing unique non-uniform densification characteristics under spark plasma sintering loading conditions [15]. However, it cannot simulate spontaneous densification without external forces, such as expansion and contraction caused by sintering temperature. Moreover, the temperature difference between the edge and the center leads to differences in local shrinkage rates and deformation. Although the DPC model can load temperature fields, it does not consider the nonlinear effects of temperature on material parameters. Therefore, most studies have been based on the analysis results derived from pressing experiments. There have been very few studies on the densification of powder thermal processing processes, limiting a comprehensive understanding of the link between the sintering densification process of NdFeB powder and its microstructure. Modeling based on the DPC model is beneficial for assessing the area of stress generation before and after sintering to analyze the densification process of powders.
In this work, sequentially coupled thermal stress analysis is adopted. In sintering process simulations, a segmented simulation method of “pressing and sintering” is employed. The density evolution variables from the DPC model quantify the densification process, while shear surface parameters and cap parameters are used as state variables to control the evolution of the yield surface [13]. Thermal–mechanical coupling variables are defined to link temperature evolution with the mechanical response. FEA modeling was used to simulate the sintering densification process of NdFeB and calculate the temperature field and stress field, revealing the effects of different sintering temperatures on the microstructure. The model was established in the FEA software ABAQUS (ABAQUS 2024). Moreover, microstructural SEM analysis, an X-ray residual stress tester, and additional experimental methods were used to validate the FEA results and enhance model accuracy.

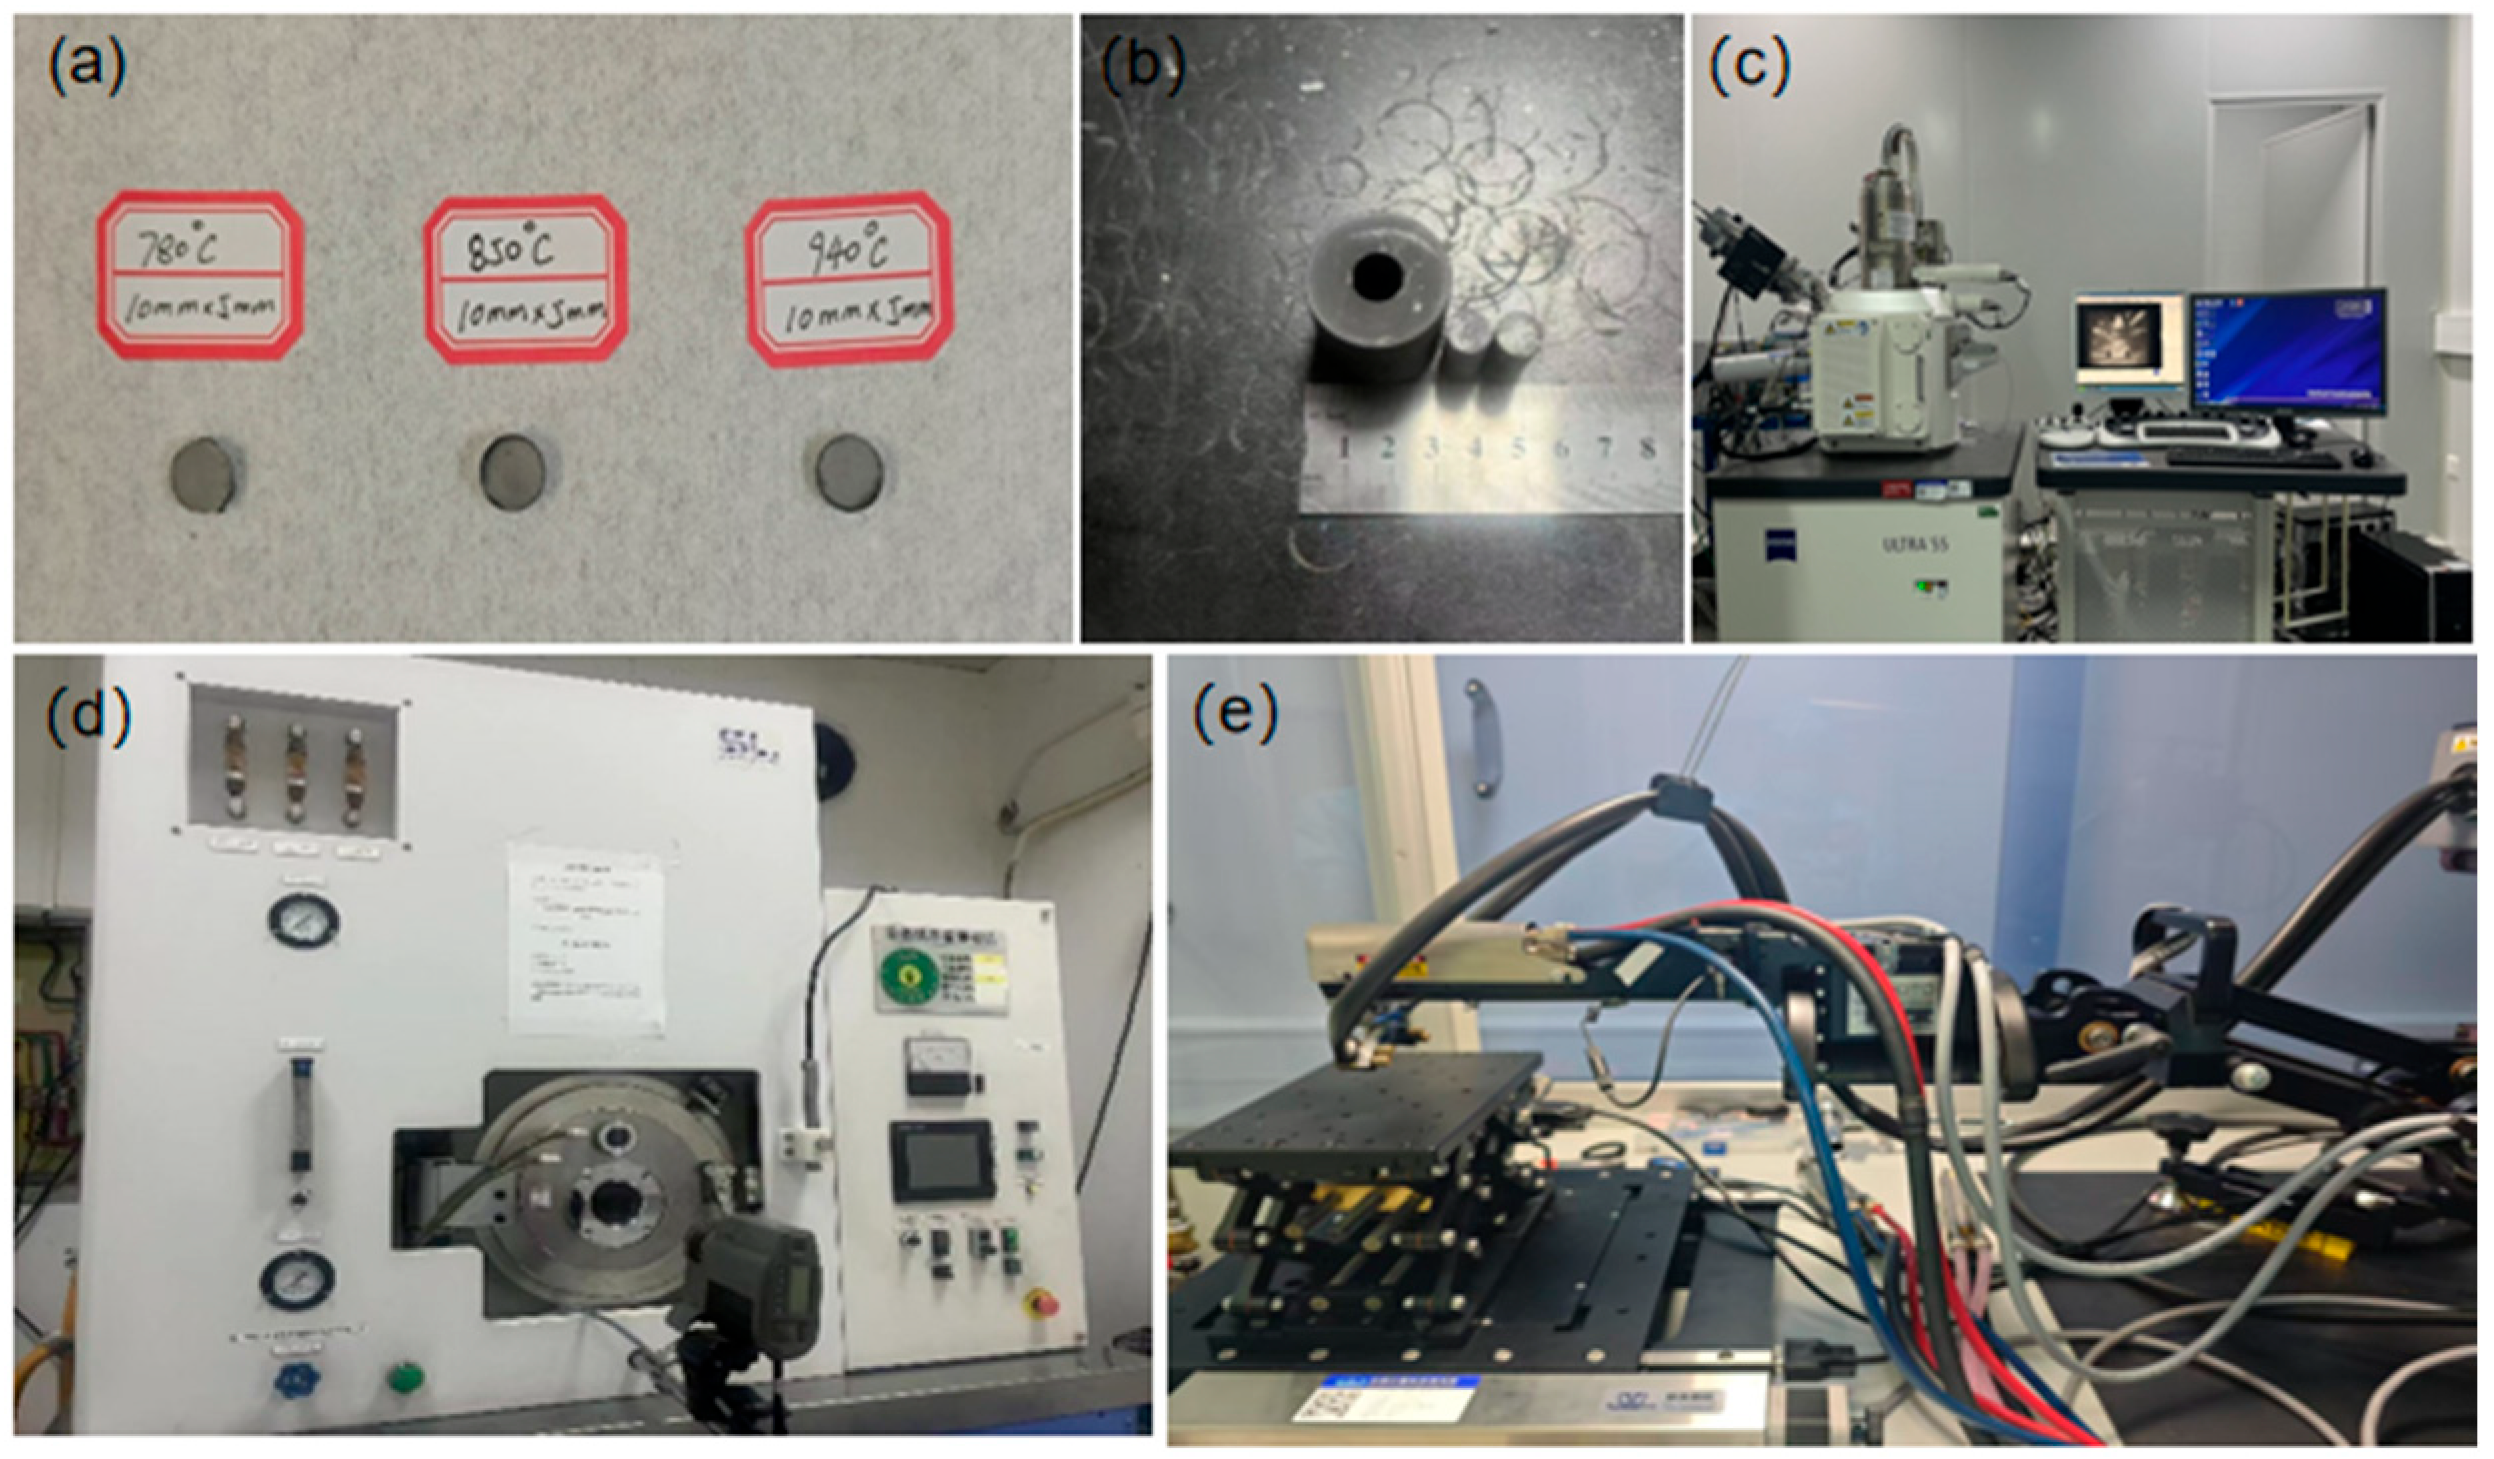
2. Materials and Methods

As already demonstrated by studies, the density of samples subjected to SPS at approximately 800 °C attained 99% of the theoretical value, with the augmentation of sintering temperatures rising within the 650–900 °C range. Grain growth was obvious when the T–sps reached about 900 °C [16].
This study aimed to explore the densification process across two distinct sintering temperature ranges. NdFeB bulks were sintered at 780 °C, 850 °C, and 940 °C via the spark plasma sintering technique. The density of NdFeB powder (2000 meshes) is 7.4 g/cm−3. NdFeB powder was placed into a graphite mold for SPS sintering. The SPS parameters were set as follows: a vacuum atmosphere of 10−3 Pa; a pressure of 60 MPa; sintering temperatures of 780 °C, 850 °C, and 940 °C; a heating rate of 30 °C/min; and a holding duration of 10 min. The equipment used for the preparation and testing of NdFeB is displayed in Figure 1 and listed as follows: mold with 10 mm diameter; Zeiss Ultra 55 Field Emission Scanning Electron Microscope from Carl Zeiss AG, Oberkochen, Germany; YLJ–SPS–T20 spark plasma sintering furnace; X-ray residual stress tester from Lianying Precision Machinery Technology Co., Ltd., Beijing, China.
The X-ray residual stress tester setting program is as follows: The sin2ψ method was adopted to measure the residual stress on the sample’s surface. First and foremost, a stress-free standard sample is employed to calibrate the diffraction angle’s zero point. Aside from this, replace the target with a Cr target and set the X-ray tube parameters to 20 kV and 4 mA. The detector is moved to collect diffraction peaks at different ψ angles, and the ψ angle range is usually set from 0° to 45° and needs to be evenly distributed (such as 0°, 12.24°, and 17.45°). At the end, the software (such as the XrdWin 2.0 system) is utilized to fit the diffraction peak shifts, and the residual stress is calculated. The SEM instrument parameters are as follows: The acceleration voltage and working distance were set to 5 kV and 4 mm. The InLens high-resolution detector from Carl Zeiss AG, Oberkochen, Germany was selected, and the contrast/brightness was adjusted to take images at different magnifications (50×, 500×, and 1000×) in multiple regions for subsequent selection analysis. The spark plasma sintering processing procedure is as follows: Prior to sintering, the powder undergoes fine grinding and is coated with nano-sized BN on the mold’s inner wall to avert adhesion, guaranteeing homogeneous filling. During sintering, the temperature is elevated to the target level under a vacuum, followed by pressure maintenance and temperature stabilization. Ultimately, the material is cooled under an inert atmosphere to prevent oxidation.
The modified DPC model has found widespread application in powder compaction simulations, concurrently serving as a density-dependent constitutive model employed for densification research. Figure 2 [17] illustrates the yield surface of the modified DPC model, which is composed of two parts. One part is the linear shear failure surface that exists within itself, while the other is the cap surface.
The shear failure surface is described by Equation (1):
F s = t d p a tan β
where t symbolizes the deviatoric stress, p a defines the hydrostatic pressure, and β and d represent the angle of friction of the material and its cohesion. t is defined by Equation (2):
t = 1 2 q 1 + 1 k 1 1 k r q 3
where q refers to the Mises equivalent stress; k is a parameter that ensures that the yield surface remains convex, which is controlled between 0.7 and 1.
The cap yield surface in Figure 2 provides an inelastic hardening mechanism, which is not only favorably suitable for powder compaction but also advantageous for controlling volume dilatancy during shear yielding, and it is described by Equation (3):
F c = p p a 2 + R t 1 + α α cos β 2 R d + p a tan β = 0
where R is a parameter that controls the shape of the cap within a range from 0.0001 to 1000; α defines the curvature coefficient of the transition surface, which is a small number that determines the transition surface between the shear failure surface and the cap surface.
Moreover, it is universally acknowledged that the size of the cap is determined by p b , which denotes the compressive yield stress, and p a is the value that corresponds to the intersection of the cap yielding surface and the transition surface, which is defined by Equation (4):
p a = p b R d ( 1 + R tan β )
The transition surface provides a connection that is defined in Equation (5):
F t = p p a 2 + t 1 α cos β d + p a tan β 2 α d + p a tan β = 0
It was mentioned that α determines the shape of the transition surface [16], which is reflected in Equation (5), and it generally ranges from 0.1 to 0.5. When α = 0 and p = pa, two points coincide, so there is no transition region on the yield surface. In this case, there is no softening on the cap yield surface [18]. The derived equation is shown below:
F t = ( p p a ) 2 + t d p a tan β = 0
F s = t d p a tan β = 0
p = p a
The plastic potential surface is defined by a flow potential that is associated in the cap region and non-associated in the shear failure surface and transition regions [17]. The flow potential surface in the meridional plane is depicted in Figure 3.
The associated flow potential is expressed as Equation (9):
G c = ( p p a ) 2 + R t 1 + α α cos β 2
The non-associated flow potential is mathematically formulated as Equation (10):
G s = p p a tan β 2 + t 1 + α α cos β 2
As Figure 2 illustrates, the Cap model’s plastic potential surface is an approximately elliptical nonlinear relationship. This association is suitable for modeling the process of metal powder unloading. As demonstrated in Figure 4, a correlation between the relative density and the relevant parameters was obtained by adopting a modified density–dependent DPC yield model and corresponding flow equation [18].
In this work, the modeling parameters of NdFeB are suggested in Table 1 and Table 2.
To reduce computational expenses and time, the mold’s outer wall is modeled through the application of boundary conditions. The model consists of two parts: the pressure head and the powder. The powder’s size is the same as what is actually engineered, and it is 10 mm in diameter and 5 mm in height. With a diameter of 10 mm and a height of 20 mm, the pressure head applies 60 MPa of force to produce tablets. In addition, the boundary conditions are imposed, with the outer side fixed and displacement constrained towards the bottom. The powder’s base is entirely immobilized to emulate the outer wall’s encapsulating influence on the powder. Meanwhile, the contact surface between the pressure head and the powder is set as the main secondary surface to avoid mold penetration.

3. Results

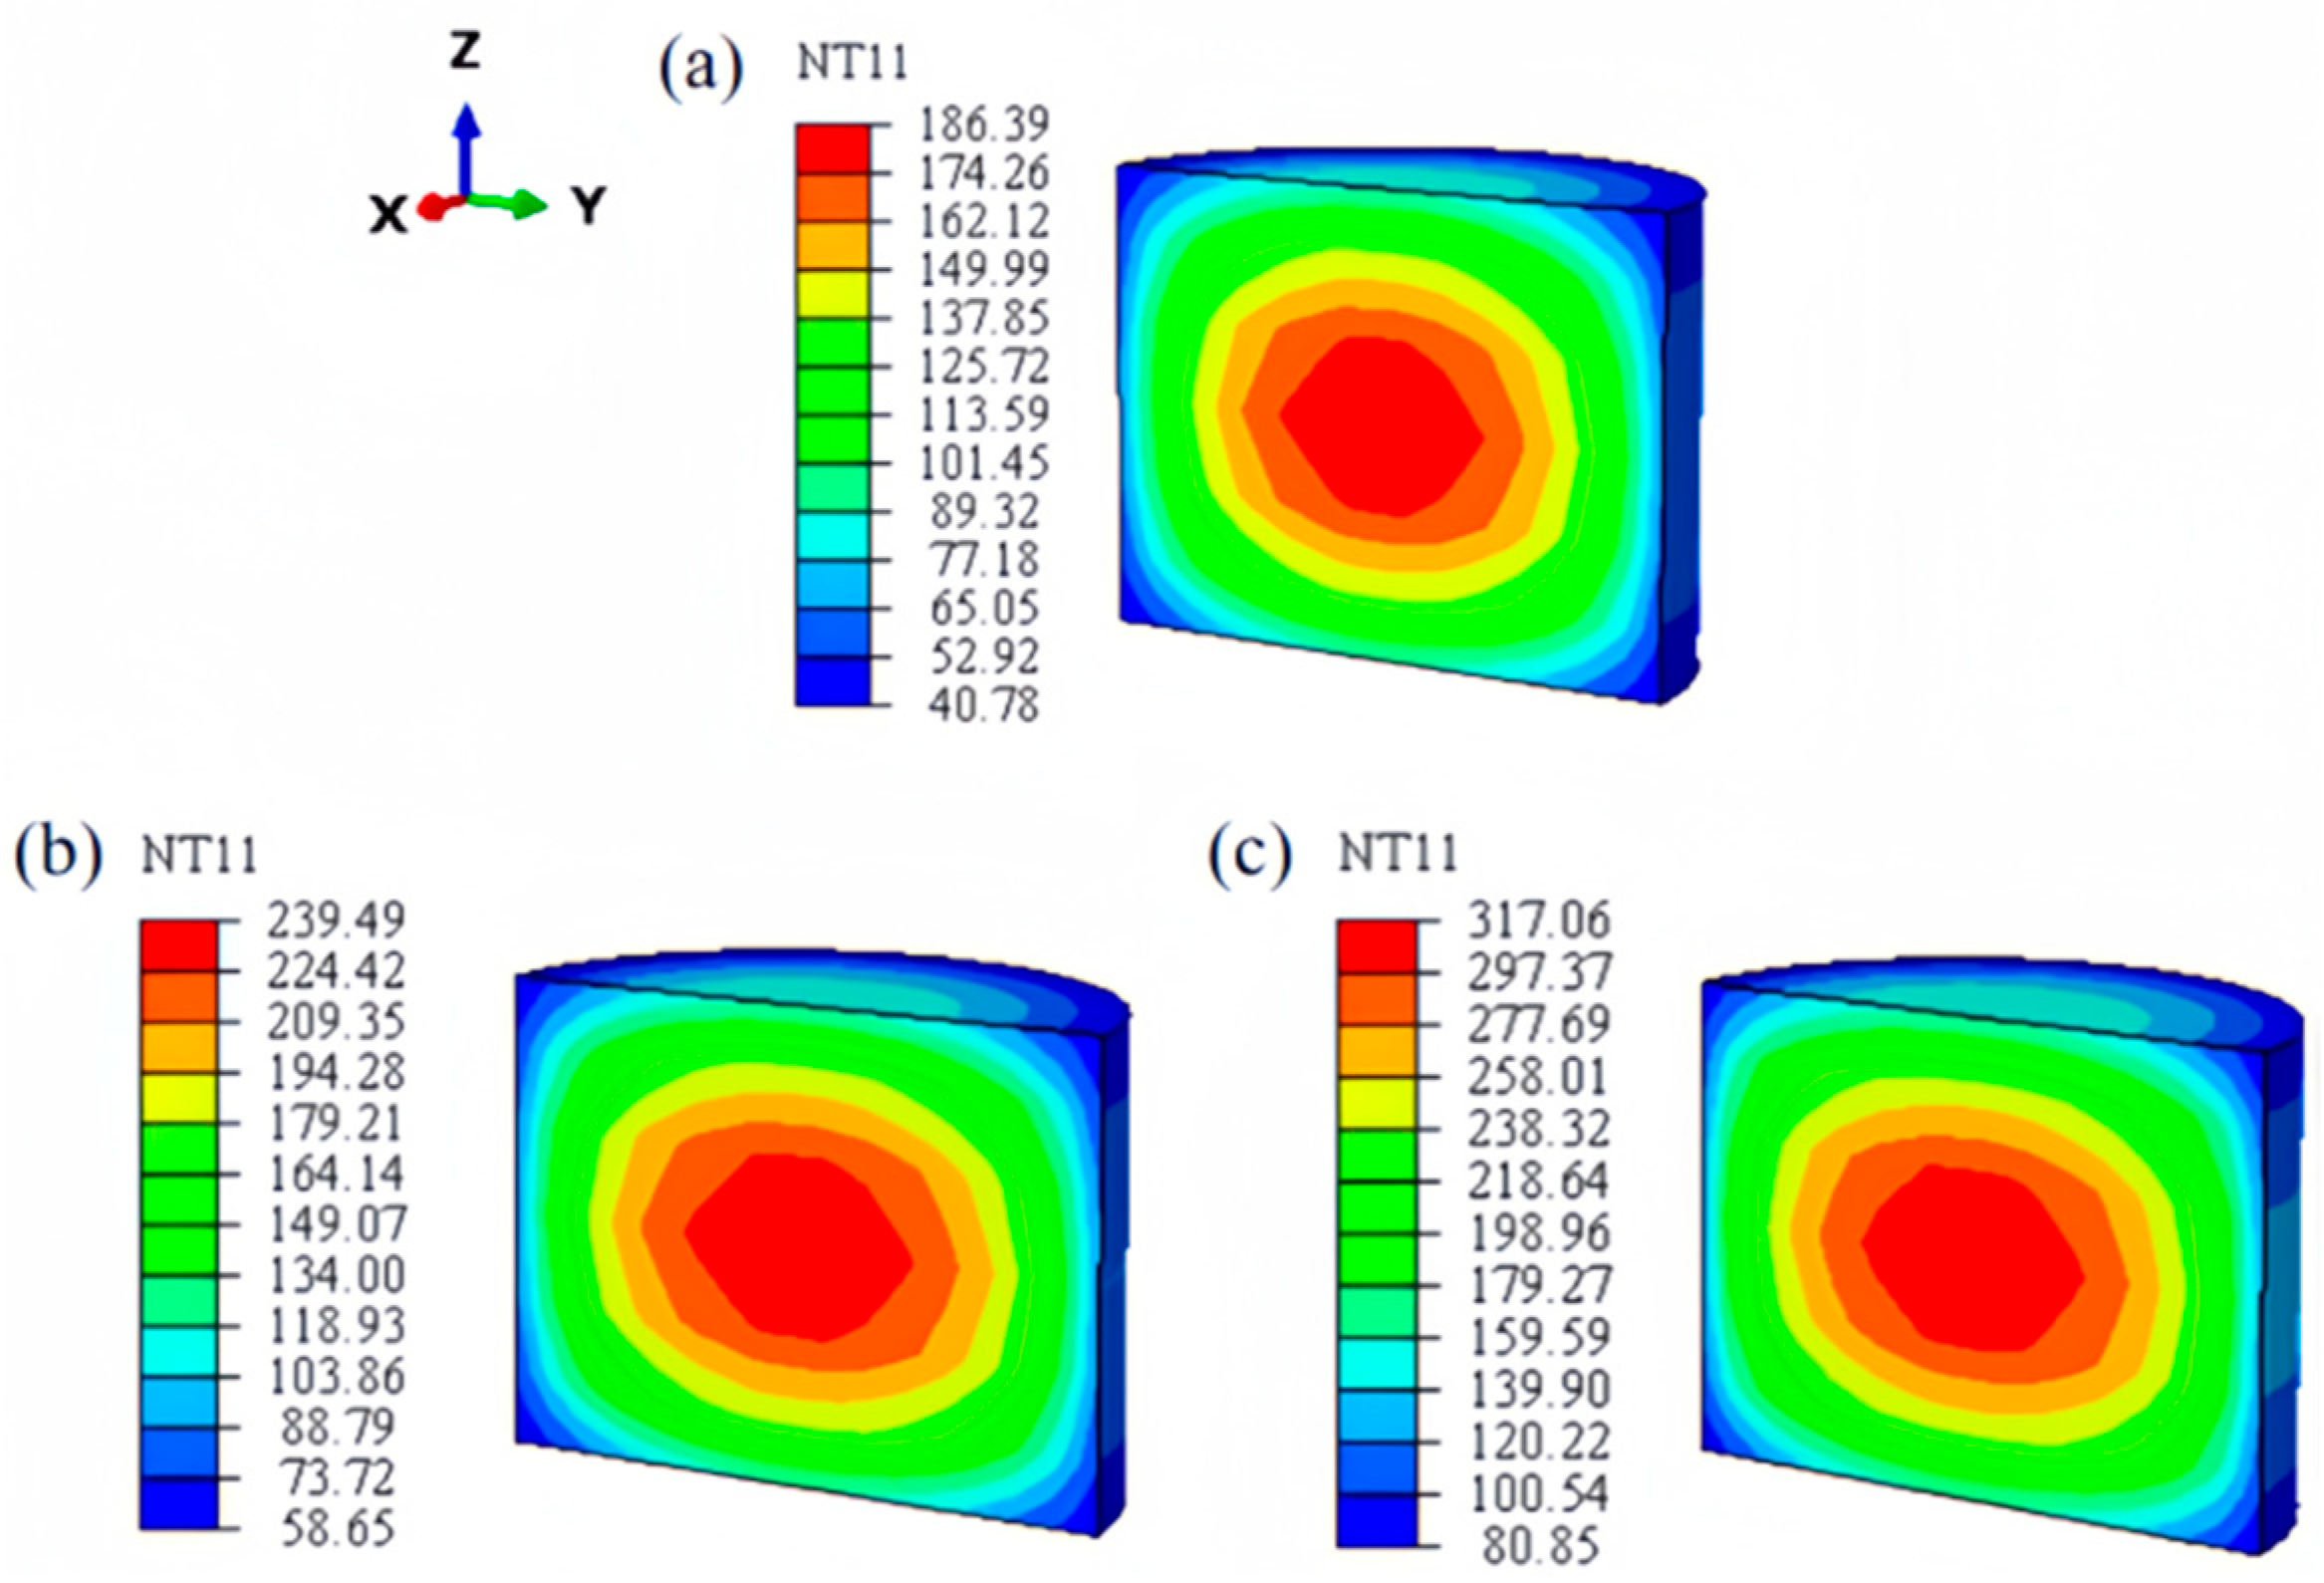
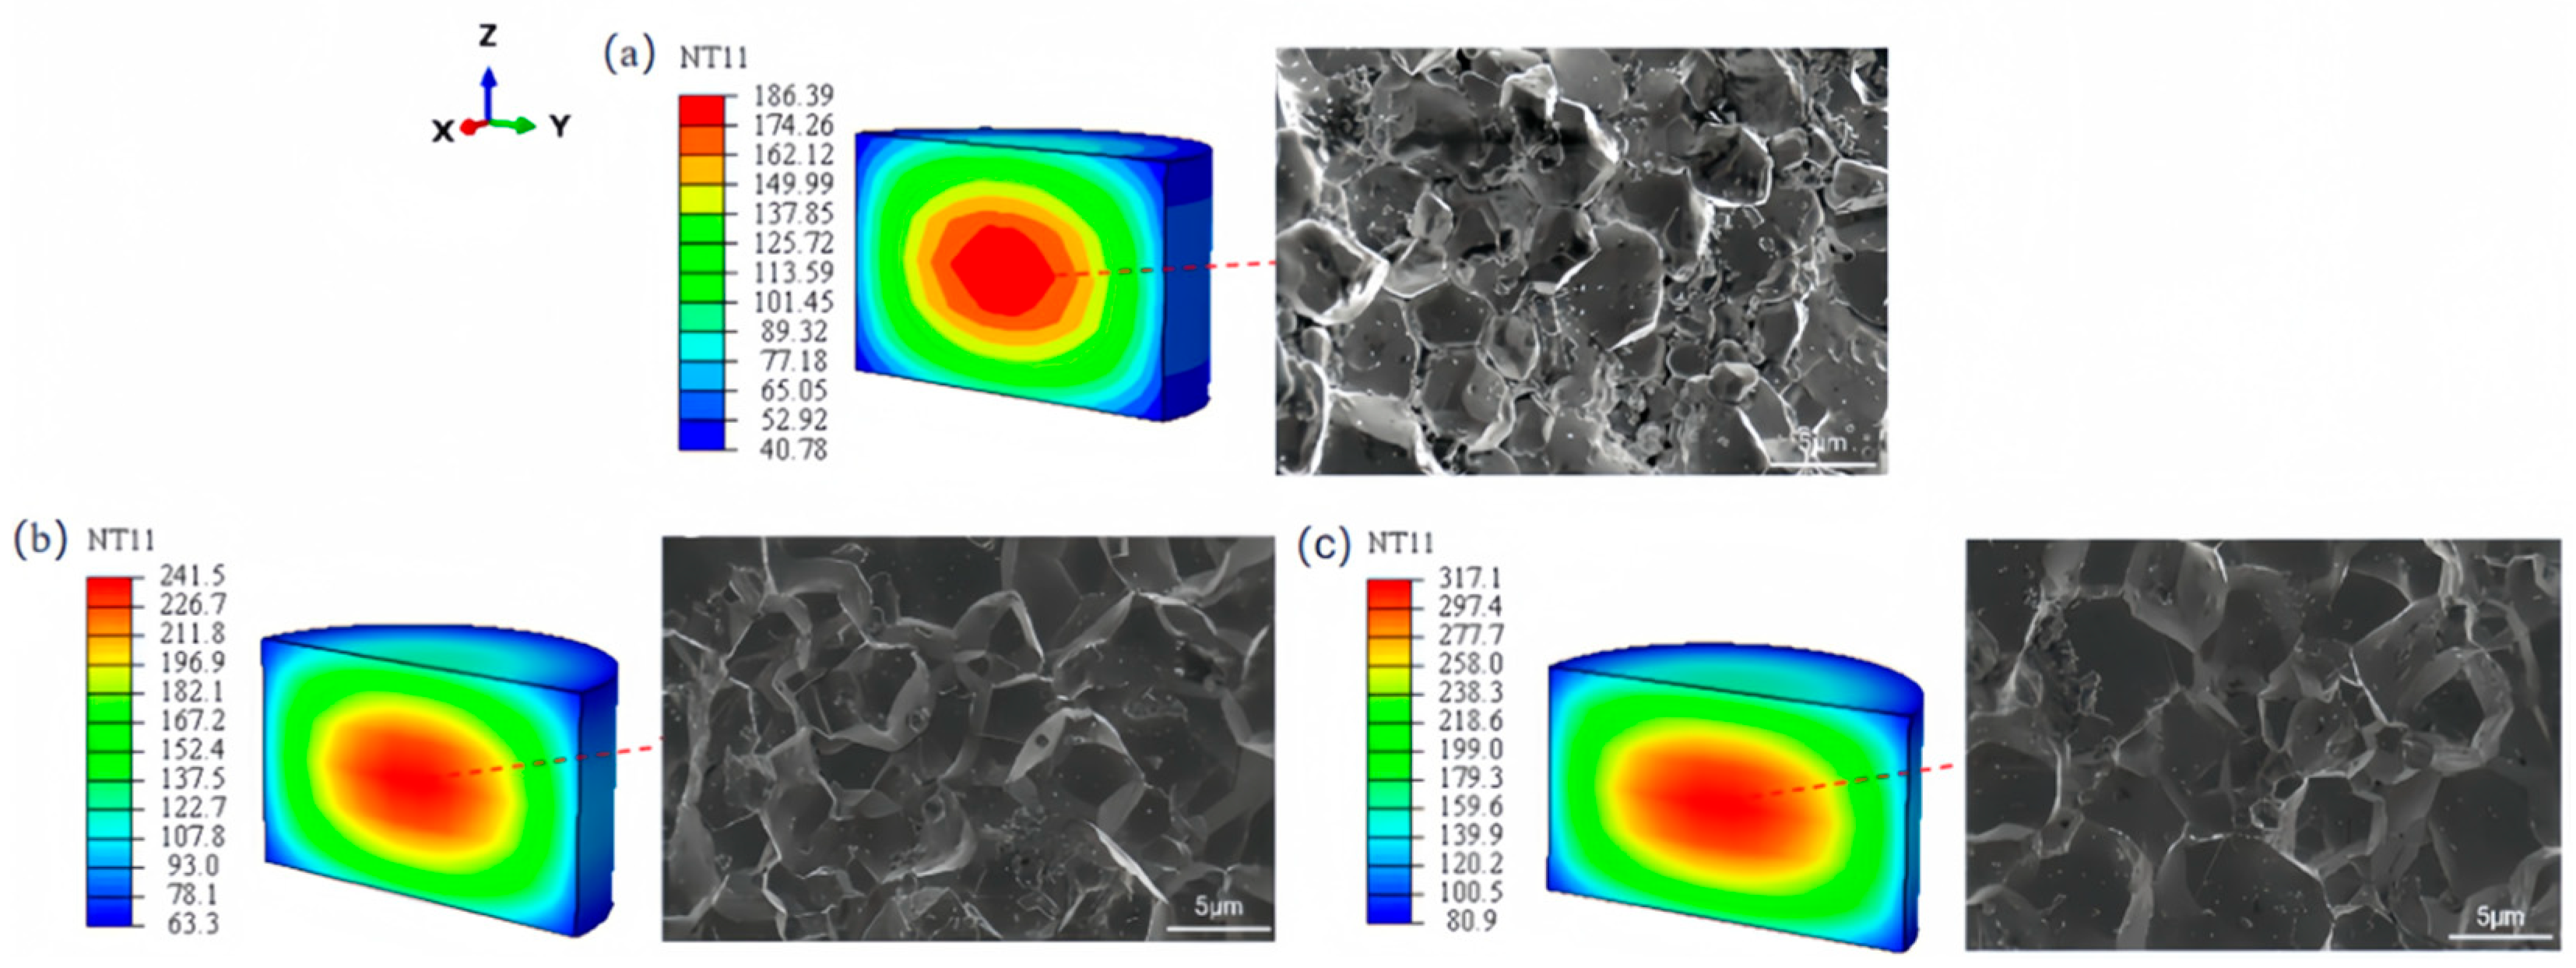
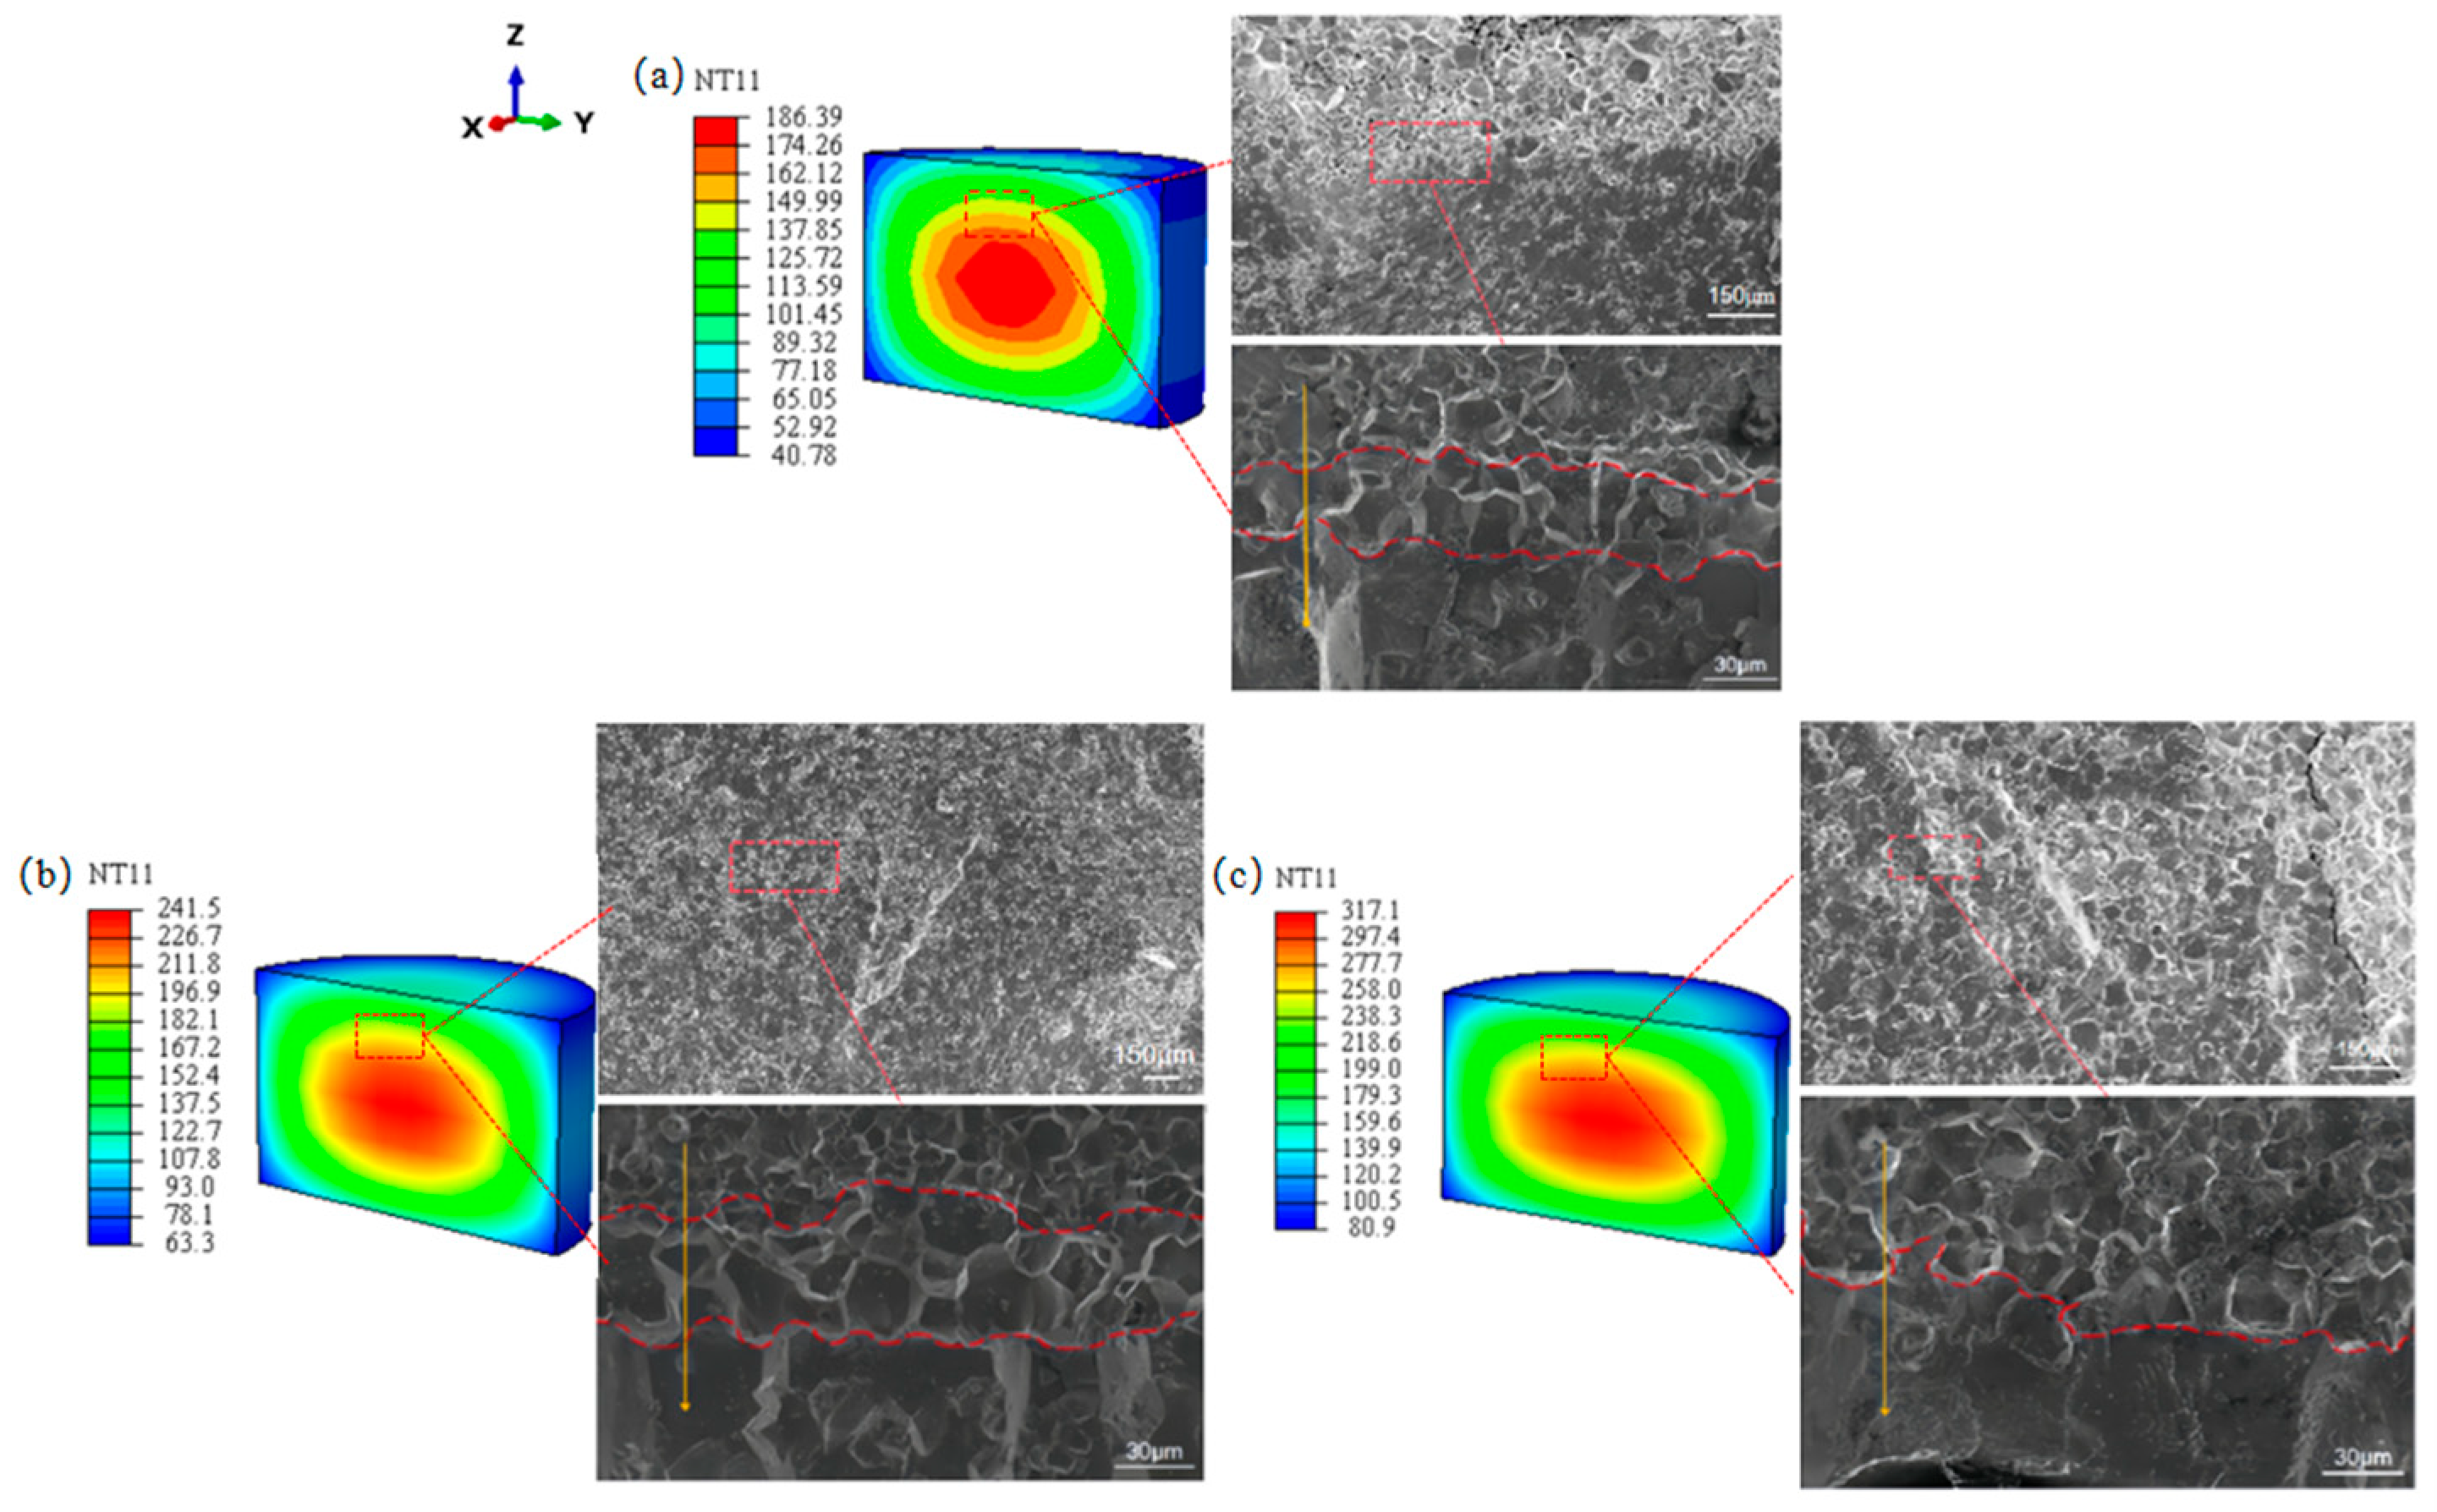
3.1. Analysis of Sintering Temperature Fields

In sequentially coupled thermal stress analysis, the influence of the stress field on the temperature field is negligible, and the determination of the stress field mainly depends on the calculation results of the temperature field.
When the temperature field is analyzed in ABAQUS, the control equation of the temperature field is established in accordance with the law of energy conservation and the law of Fourier heat conduction [20].
ρ i C i T t = k i ( 2 T x 2 + 2 T y 2 ) + Q
Thermal stress arises when an object undergoes temperature variations while being constrained, as it is unable to expand freely with temperature changes. To start with, the generalized Hooke’s law describing the association between stress and strain is defined in Equation (12) [21]:
ε x e = 1 E x ( σ x ( μ y x σ y + μ z x σ z ) ) ε y e = 1 E y ( σ y ( μ x y σ x + μ z y σ z ) ) ε z e = 1 E z ( σ z ( μ x z σ x + μ y z σ y ) )
γ x y e = 1 G x y τ x y , γ y z e = 1 G x z τ x z , γ z x e = 1 G y z τ y z
where superscript e denotes the elastic strain component; Ex, Ey, and Ez are the Young’s modulus in the x, y, and z directions, respectively; μxy, μyx, μxz, μzx, μyz, and μzy are the Poisson’s ratios in the xy, yx, xz, zx, yz, and zy directions, respectively; τxy, τxz, and τyz are the shear stresses in the xy, xz, and yz directions, respectively; G is the shear modulus.
Objects will undergo expansion or contraction during heating and cooling processes. The thermal strain experienced by a unit within a temperature field can be expressed in Equation (14) [22]:
ε x T = α x T ε y T = α y T ε z T = α z T
where T represents the thermal expansion strain components: αx, αy, and αz are the thermal expansion coefficients along the x, y, and z directions.
Subsequently, the total strain can be articulated using Equation (15).
ε = ε e + ε T
Consequently, the integration of Equation (12) with Equation (14) yields Equation (16):
ε x e = 1 E x ( σ x ( μ y x σ y + μ z x σ z ) ) + α x T ε y e = 1 E y ( σ y ( μ x y σ x + μ z y σ z ) ) + α y T ε z e = 1 E z ( σ z ( μ x z σ x + μ y z σ y ) ) + α z T
γ x y e = 1 G x y τ x y , γ y z e = 1 G x z τ x z , γ z x e = 1 G y z τ y z , ϕ = σ x + σ y + σ z
where E is the Young’s modulus of the material, μ refers to the Poisson’s ratio, G denotes the shear modulus, and ψ defines the volume stress. The generalized Hooke’s law expressed by strain and temperature differences (Equation (18)) can be derived from Equations (16) and (17).
σ x = 2 G ε x + μ 1 + μ ϕ 2 G α t σ y = 2 G ε y + μ 1 + μ ϕ 2 G α t σ z = 2 G ε z + μ 1 + μ ϕ 2 G α t
τ x y = G x y γ x y , τ y z = G y z γ y z , τ z x = G z x γ z x
By incorporating the relationship of volumetric strain e from elastic mechanics, the trio of equations in Equation (18) can be superimposed to derive Equation (20).
e = ε x + ε y + ε z = 1 2 μ 1 + μ ϕ 2 G + 3 α t = 1 2 μ E ϕ + 3 α t
So,
ϕ = E 1 2 μ ( E e 3 α t )
In this step, Equation (22) can be derived by substituting Equation (19) into Equation (17) and leveraging the relationship of the Lammer constant:
σ x = 2 G ε x + λ e β t σ y = 2 G ε y + λ e β t σ z = 2 G ε z + λ e β t
where β denotes the thermal stress, and λ refers to the Lame constant. The equations are as follows:
β = α E 1 2 μ = α ( 3 λ + 2 G )
λ = E μ ( 1 + μ ) ( 1 2 μ )
Eventually, the equation to express stress according to strain and temperature differences is as follows
τ xy = G γ x y = 2 G ε x y τ yz = G γ y z = 2 G ε y z τ zx = G γ z x = 2 G ε z x
where εxy, εyz, and εzx are the shear strains of elastic theory.
The stress and strain caused by external forces can be calculated through elastic–mechanical concepts, whereas those resulting from temperature differentials are determined using the thermoelastic principle. Eventually, these two parts are stacked together. Nonetheless, it is noteworthy that the calculation precision of this method may be affected to a certain degree when the structure undergoes significant deformation or involves extensive plastic deformation scenarios.
During the sintering process, temperature plays an important role in the densification of NdFeB powder [23]. As a consequence, the temperature field’s cloud chart of the finite element model is analyzed first.
Figure 5 suggests the temperature field at three time points in the sintering process. Figure 5a reveals the preliminary stage of rising temperatures. Figure 5b demonstrates the holding stage, and Figure 5c illustrates the final stage of falling temperatures. As Figure 5 reveals, the powder has a large temperature gradient throughout the heating and cooling processes. The temperature difference between the inside and the outside is about 56 °C (Figure 5a) to 146 °C (Figure 5c), which can be attributed to the rapid heating and cooling of the outer wall. Prolonged temperature and pressure holding allow the temperature inside to reach equilibrium.
During the temperature rise stage, the temperature of the outer layer is much higher than the internal temperature, attributable to the heat transfer from the outer wall of the rigid body. In such a case, the densification rate of the powder’s outside compactation is much faster than the inside. Meanwhile, as the densification rate rises, the volume of the powder’s compaction contracts while its density increases [24]. Therefore, both the temperature gradient and disparity in relative density progressively intensify as the powder’s compaction absorbs more heat. Until the temperature and pressure holding stage, the internal and external temperature of the powder compact homogenizes gradually, with the densification rate slowing down.

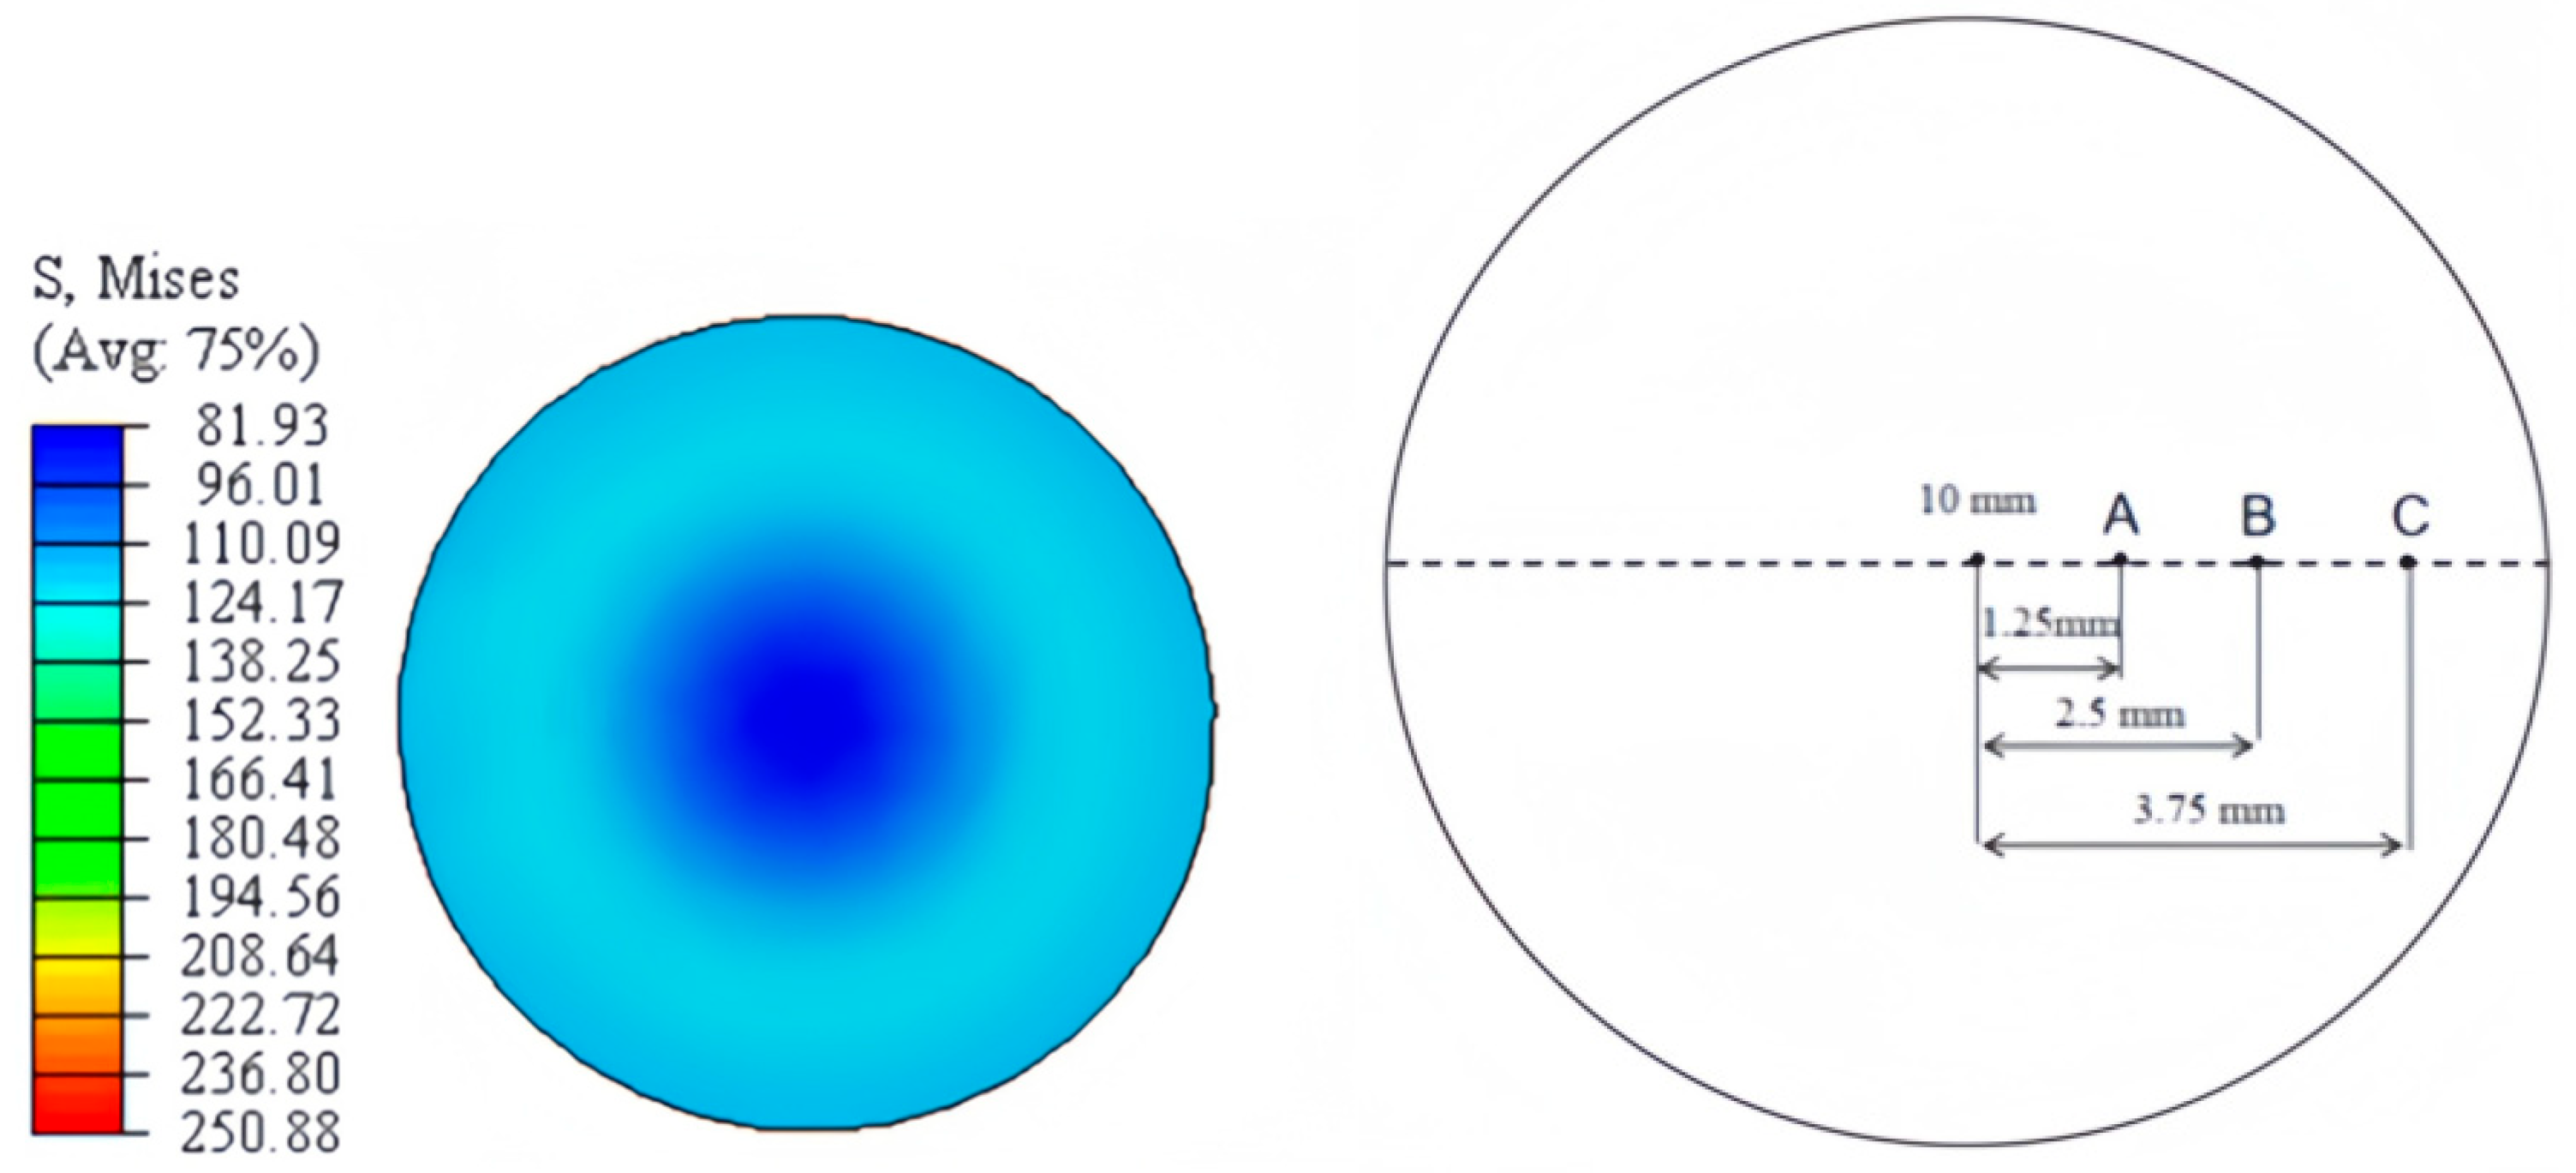
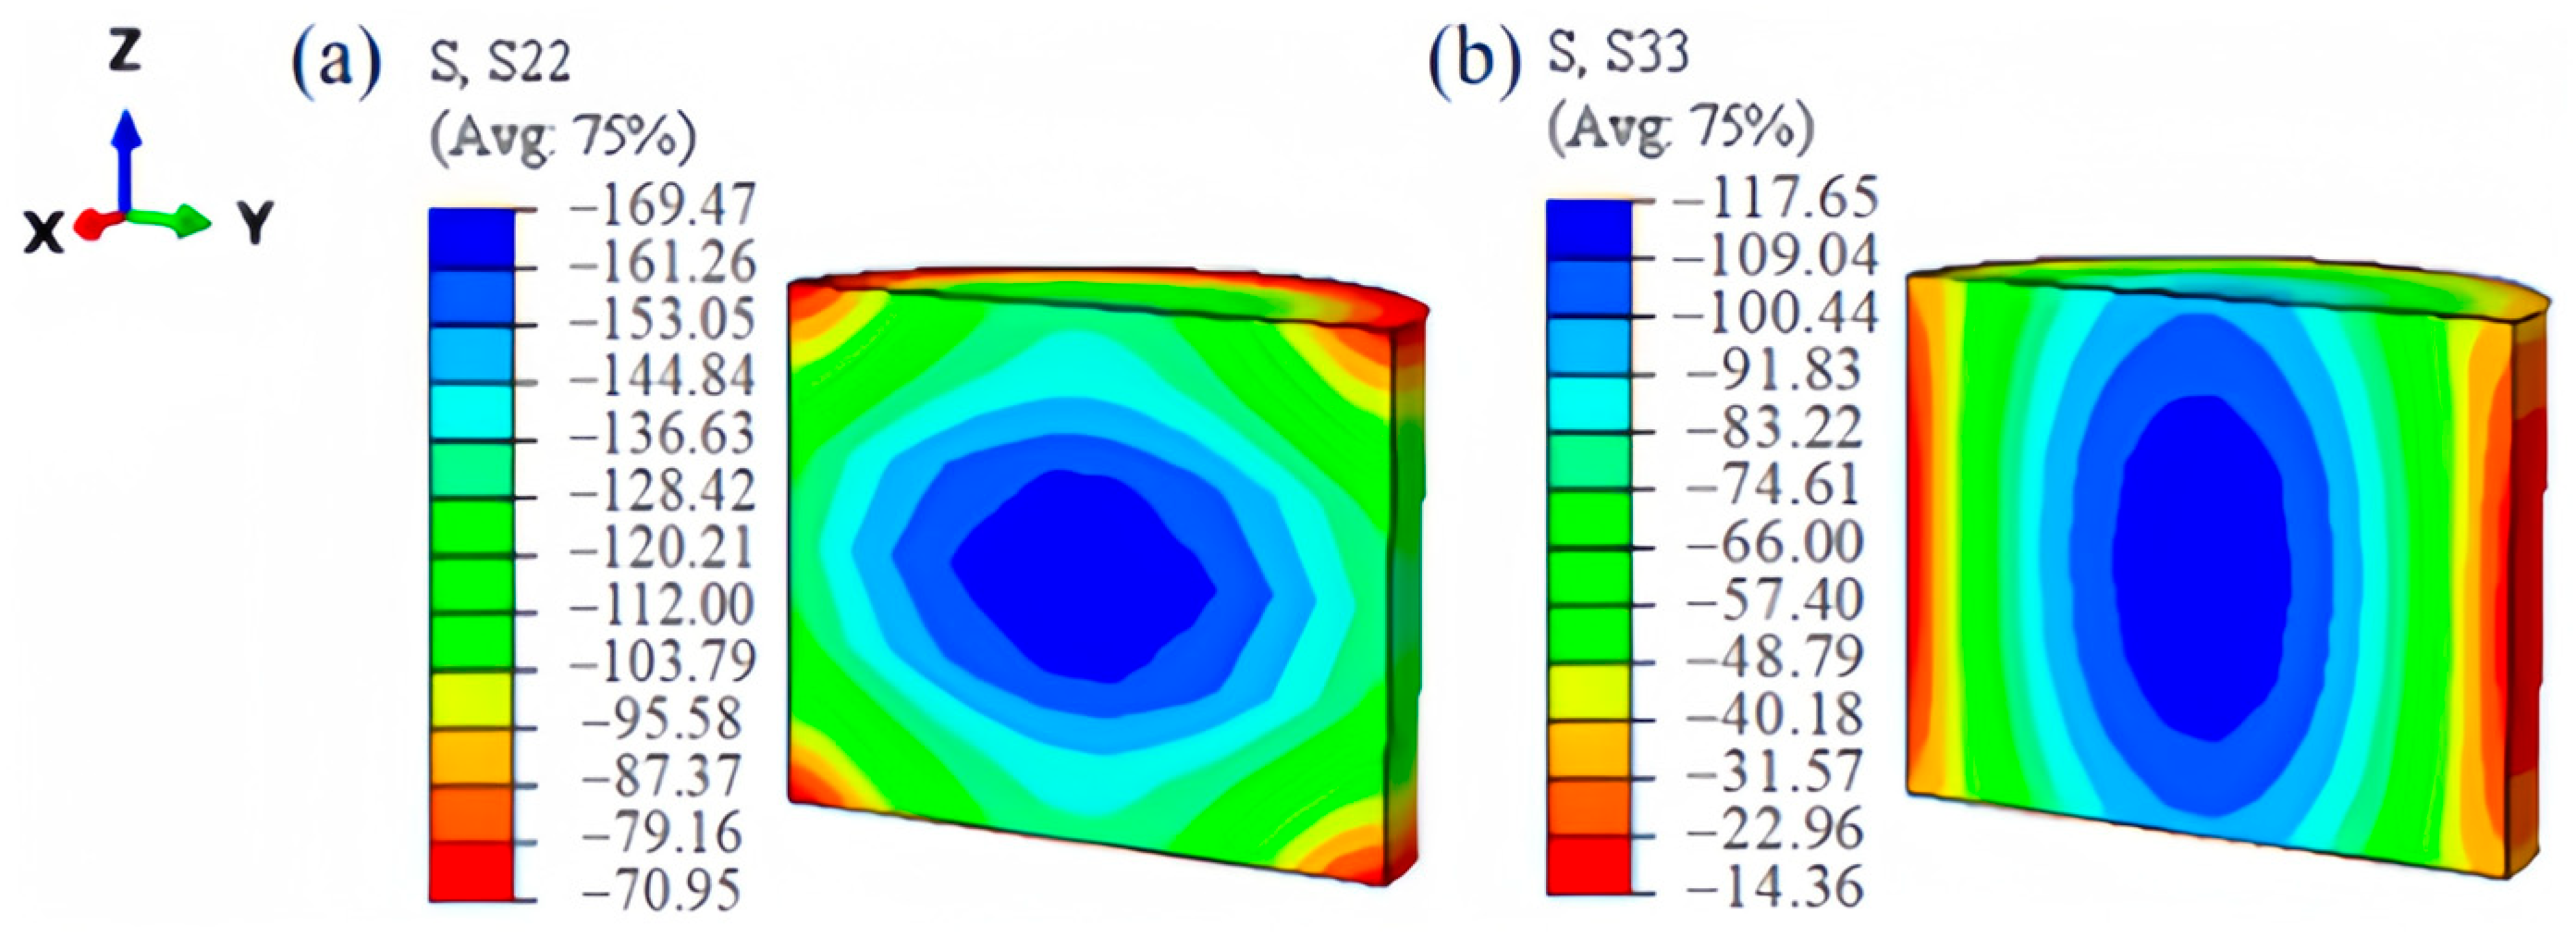
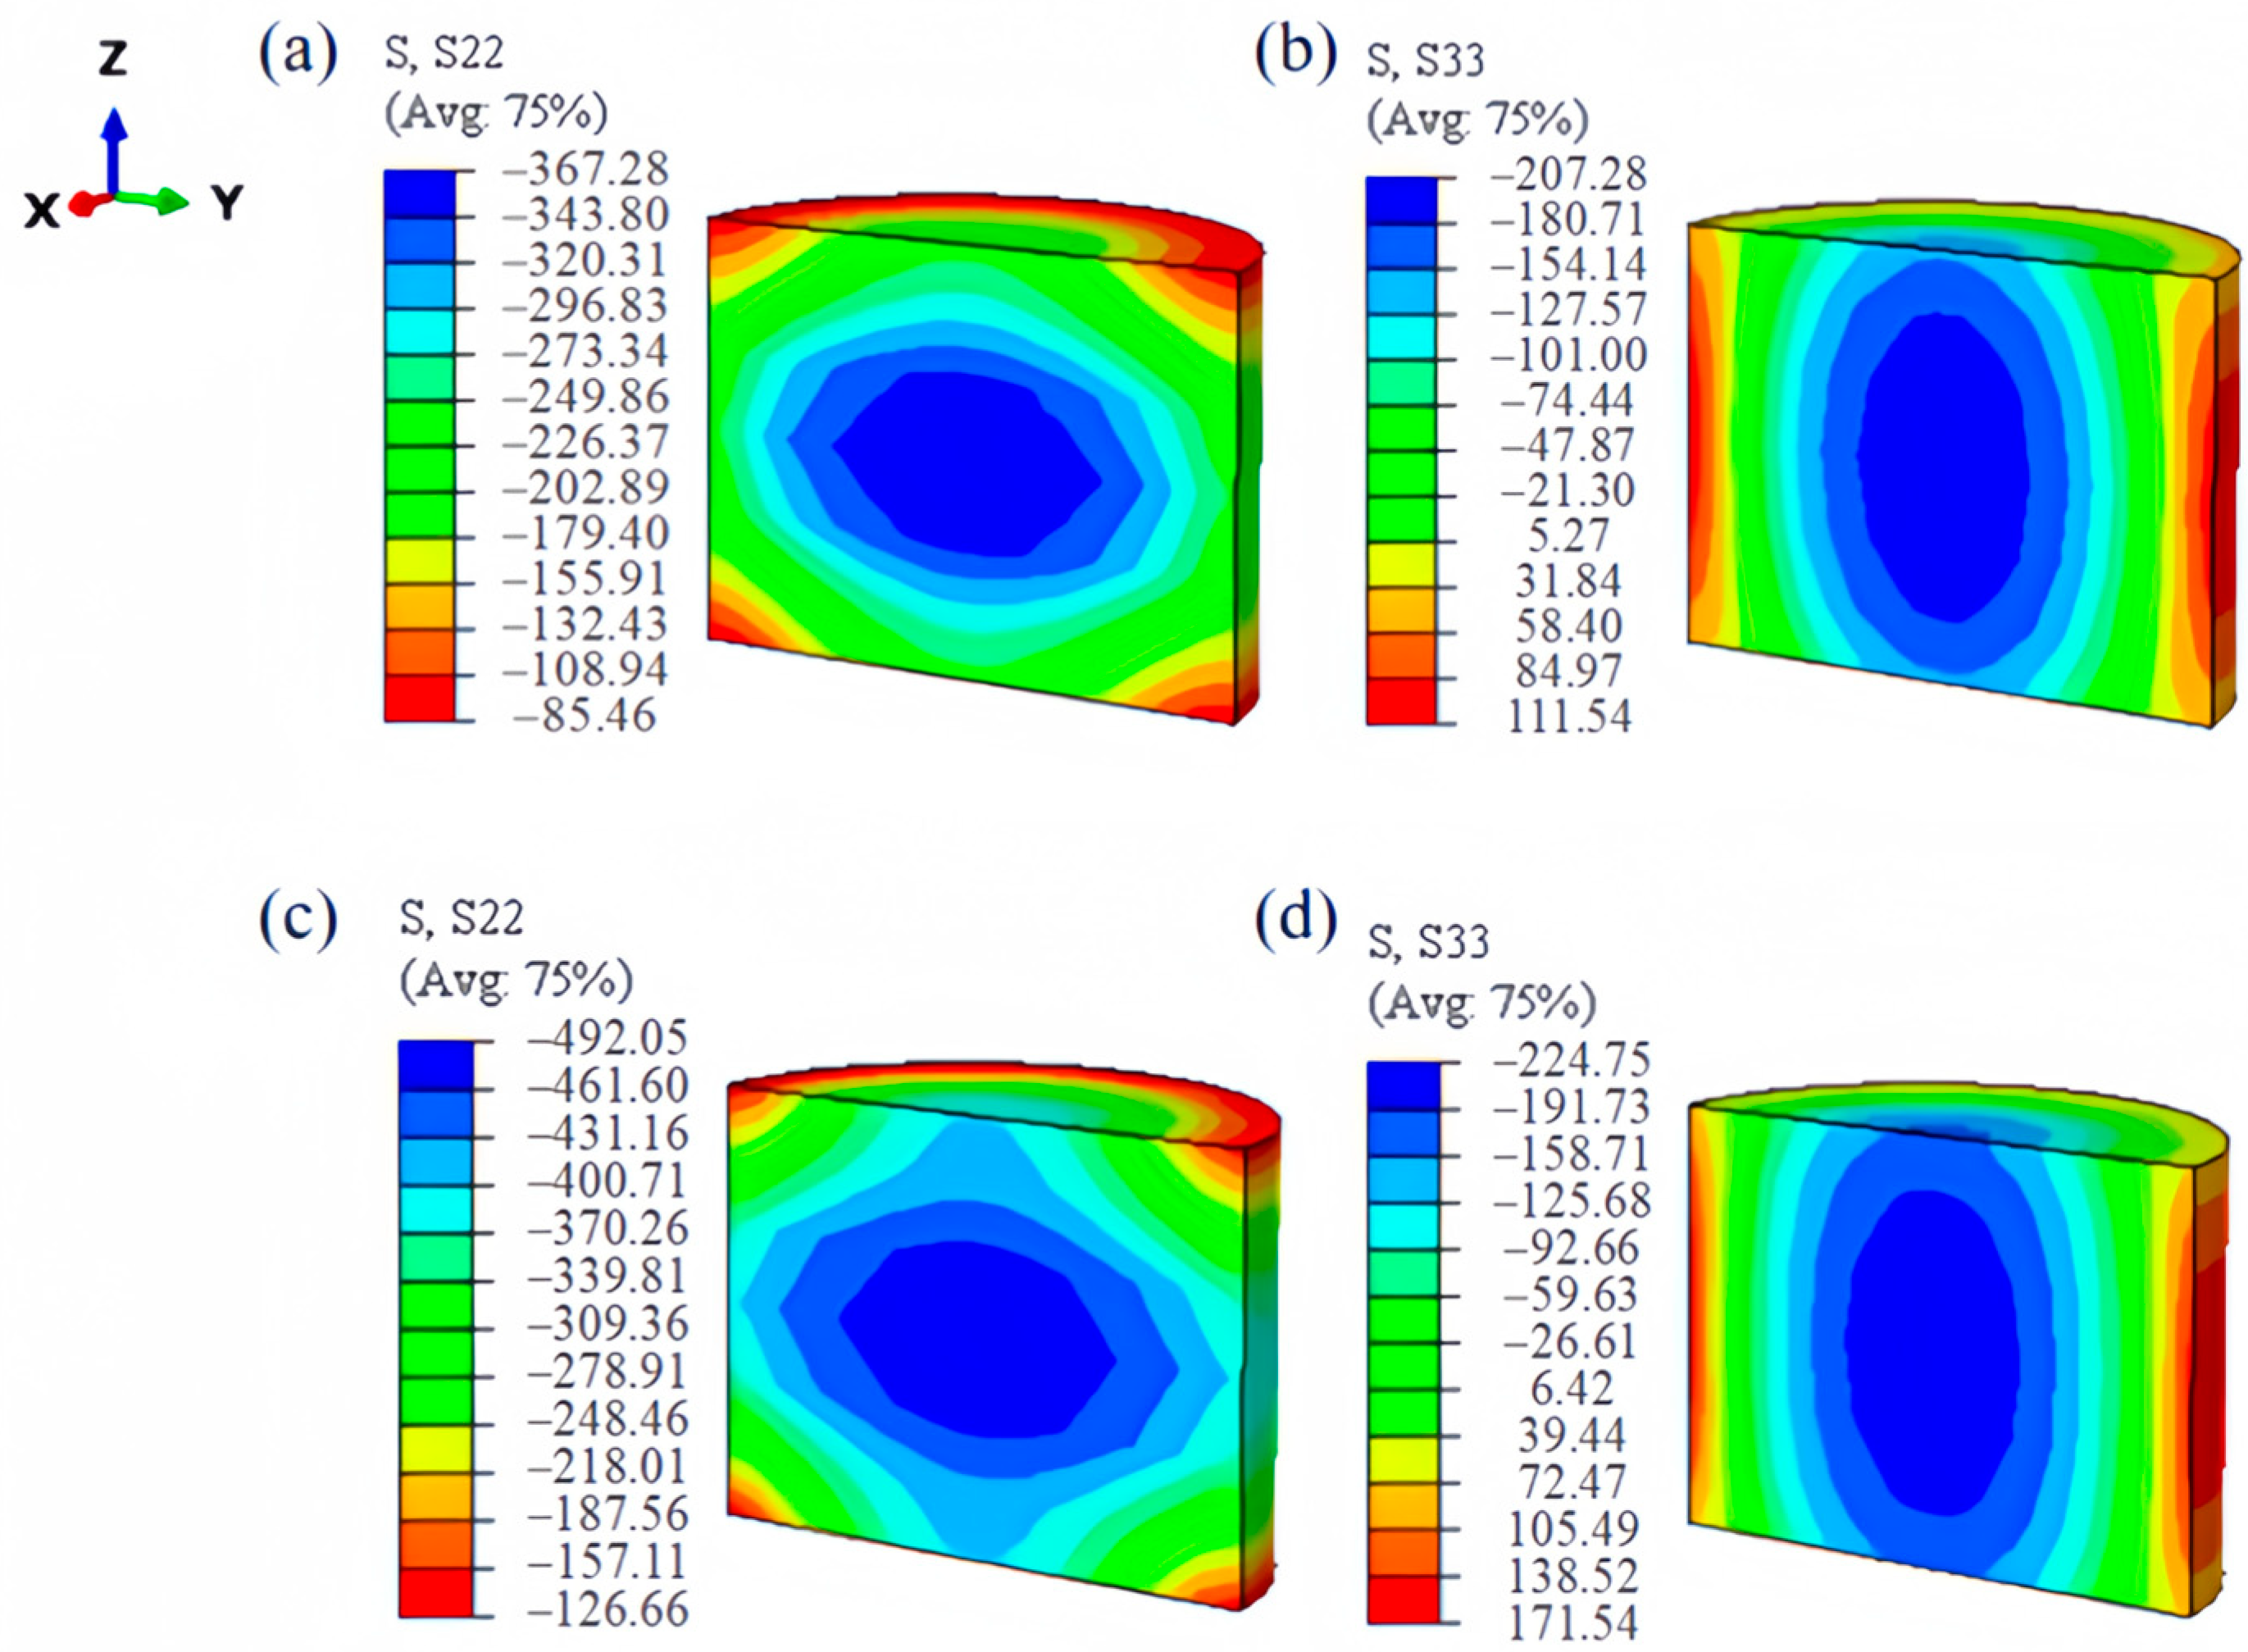
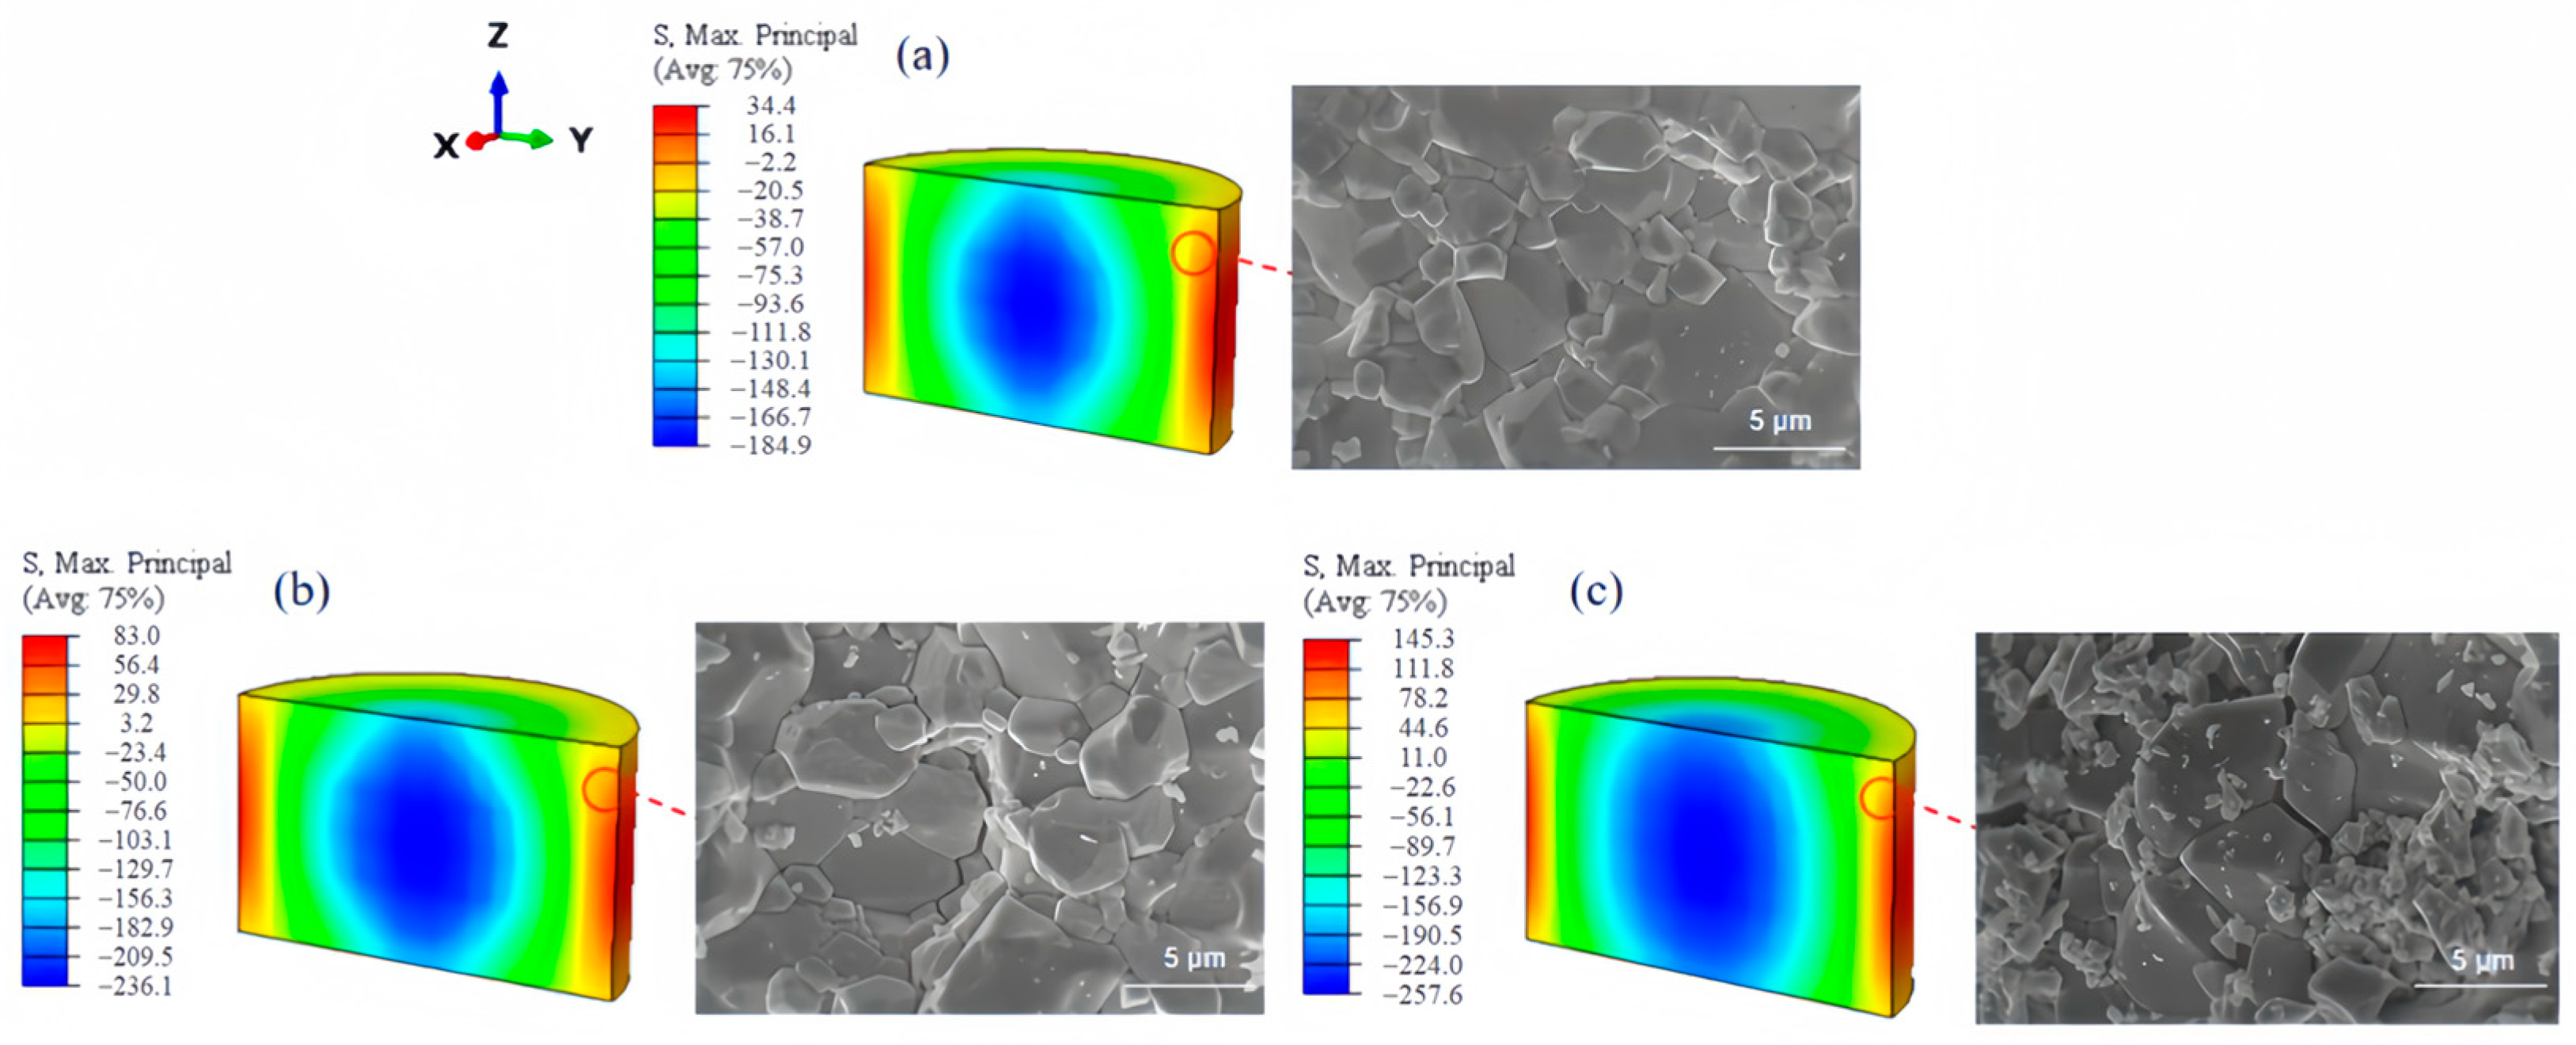
3.2. Analysis of Stress Field After Powder Sintering

This work integrates the temperature field with the stress field, as the temperature field alone fails to identify the region where cracks may occur. This integration enables a clearer observation of NdFeB’s stress variations in the stress field chart and facilitates the prediction of potential crack areas.
The accuracy of the model can be validated by comparing the numerical outcomes with experimental findings. The equivalent residual stress on the upper surface of the NdFeB bulk was measured by an X-ray residual stress tester. As depicted in Figure 6, three measurement locations were chosen to determine values on the upper surface of the NdFeB bulk, which are point A, point B, and point C. Each point was tested three times, and then the results were averaged, as revealed in Table 3.
As suggested in Figure 7, the test values and simulated values exhibit the same trend but significant discrepancies. This can be attributed to the natural aging of the material and the change in the internal structure of the material during the aging process, which releases the residual stresses on the surface. As already validated by studies, the aging temperature and aging time are directly proportional to the release of residual stress [25]. The highest temperature point on the upper surface (point A) released more residual stress after cooling, which confirms this finding. The model calculates the equivalent residual stress on the upper surface at the end of the cooling process. Nonetheless, over time, the release of residual stress causes discrepancies between test and simulation results. To explore the aging-induced decay of residual stress, distinct experimental groups featuring varied natural aging durations can be devised. Specific measurement techniques, like X-ray diffraction, can then be employed for quantitative residual stress analysis. The in-depth exploration of disparities between models and experiments can be conducted through experimental endeavors, thereby enhancing the comprehensiveness of the research.
Moreover, the source of residual stress is non-uniform deformation. In the case of powder compaction, residual stresses are mainly caused by mold friction and non-uniform densification [13]. As illustrated in Figure 7 and Figure 8, the residual stress distribution of NdFeB varies greatly after sintering. In combination with the analysis of the temperature field, the green body undergoes non-uniform deformation during the hot pressing of the powder, ultimately shifting the residual stress gradients from the center to the edge. It can be concluded that the green body is affected by the sintering temperature, which results in uneven residual stress. In the powder cylinder, high residual stress at the edges may adversely impact the green body’s densification.
In the ABAQUS visualization module, the X, Y, and Z axes are defined as 1, 2, and 3 axes, respectively. For the solid unit, “S22” and “S33” represent the two components of the stress tensor. In this work, the cross-section is the main observation, so we selected “S22” (transverse) and “S33” (longitudinal) to observe the two stress components.
Figure 8 demonstrates the distribution of residual stress in the cross-section of the NdFeB bulk after 780 °C sintering.
It can be seen that the stress distribution in the middle region of the cross-section is extremely uneven and primarily exhibits compressive stress, with a maximum value of 169 Mpa. This phenomenon is attributed to the unidirectional pressure applied through the mold during hot-pressing sintering, thereby giving rise to local plastic deformations at the particle contact points [26]. On top of this, during sintering, the temperature distribution across different regions of the material is uneven, thus resulting in thermal expansion disparities and subsequently causing non-uniform stress phenomena

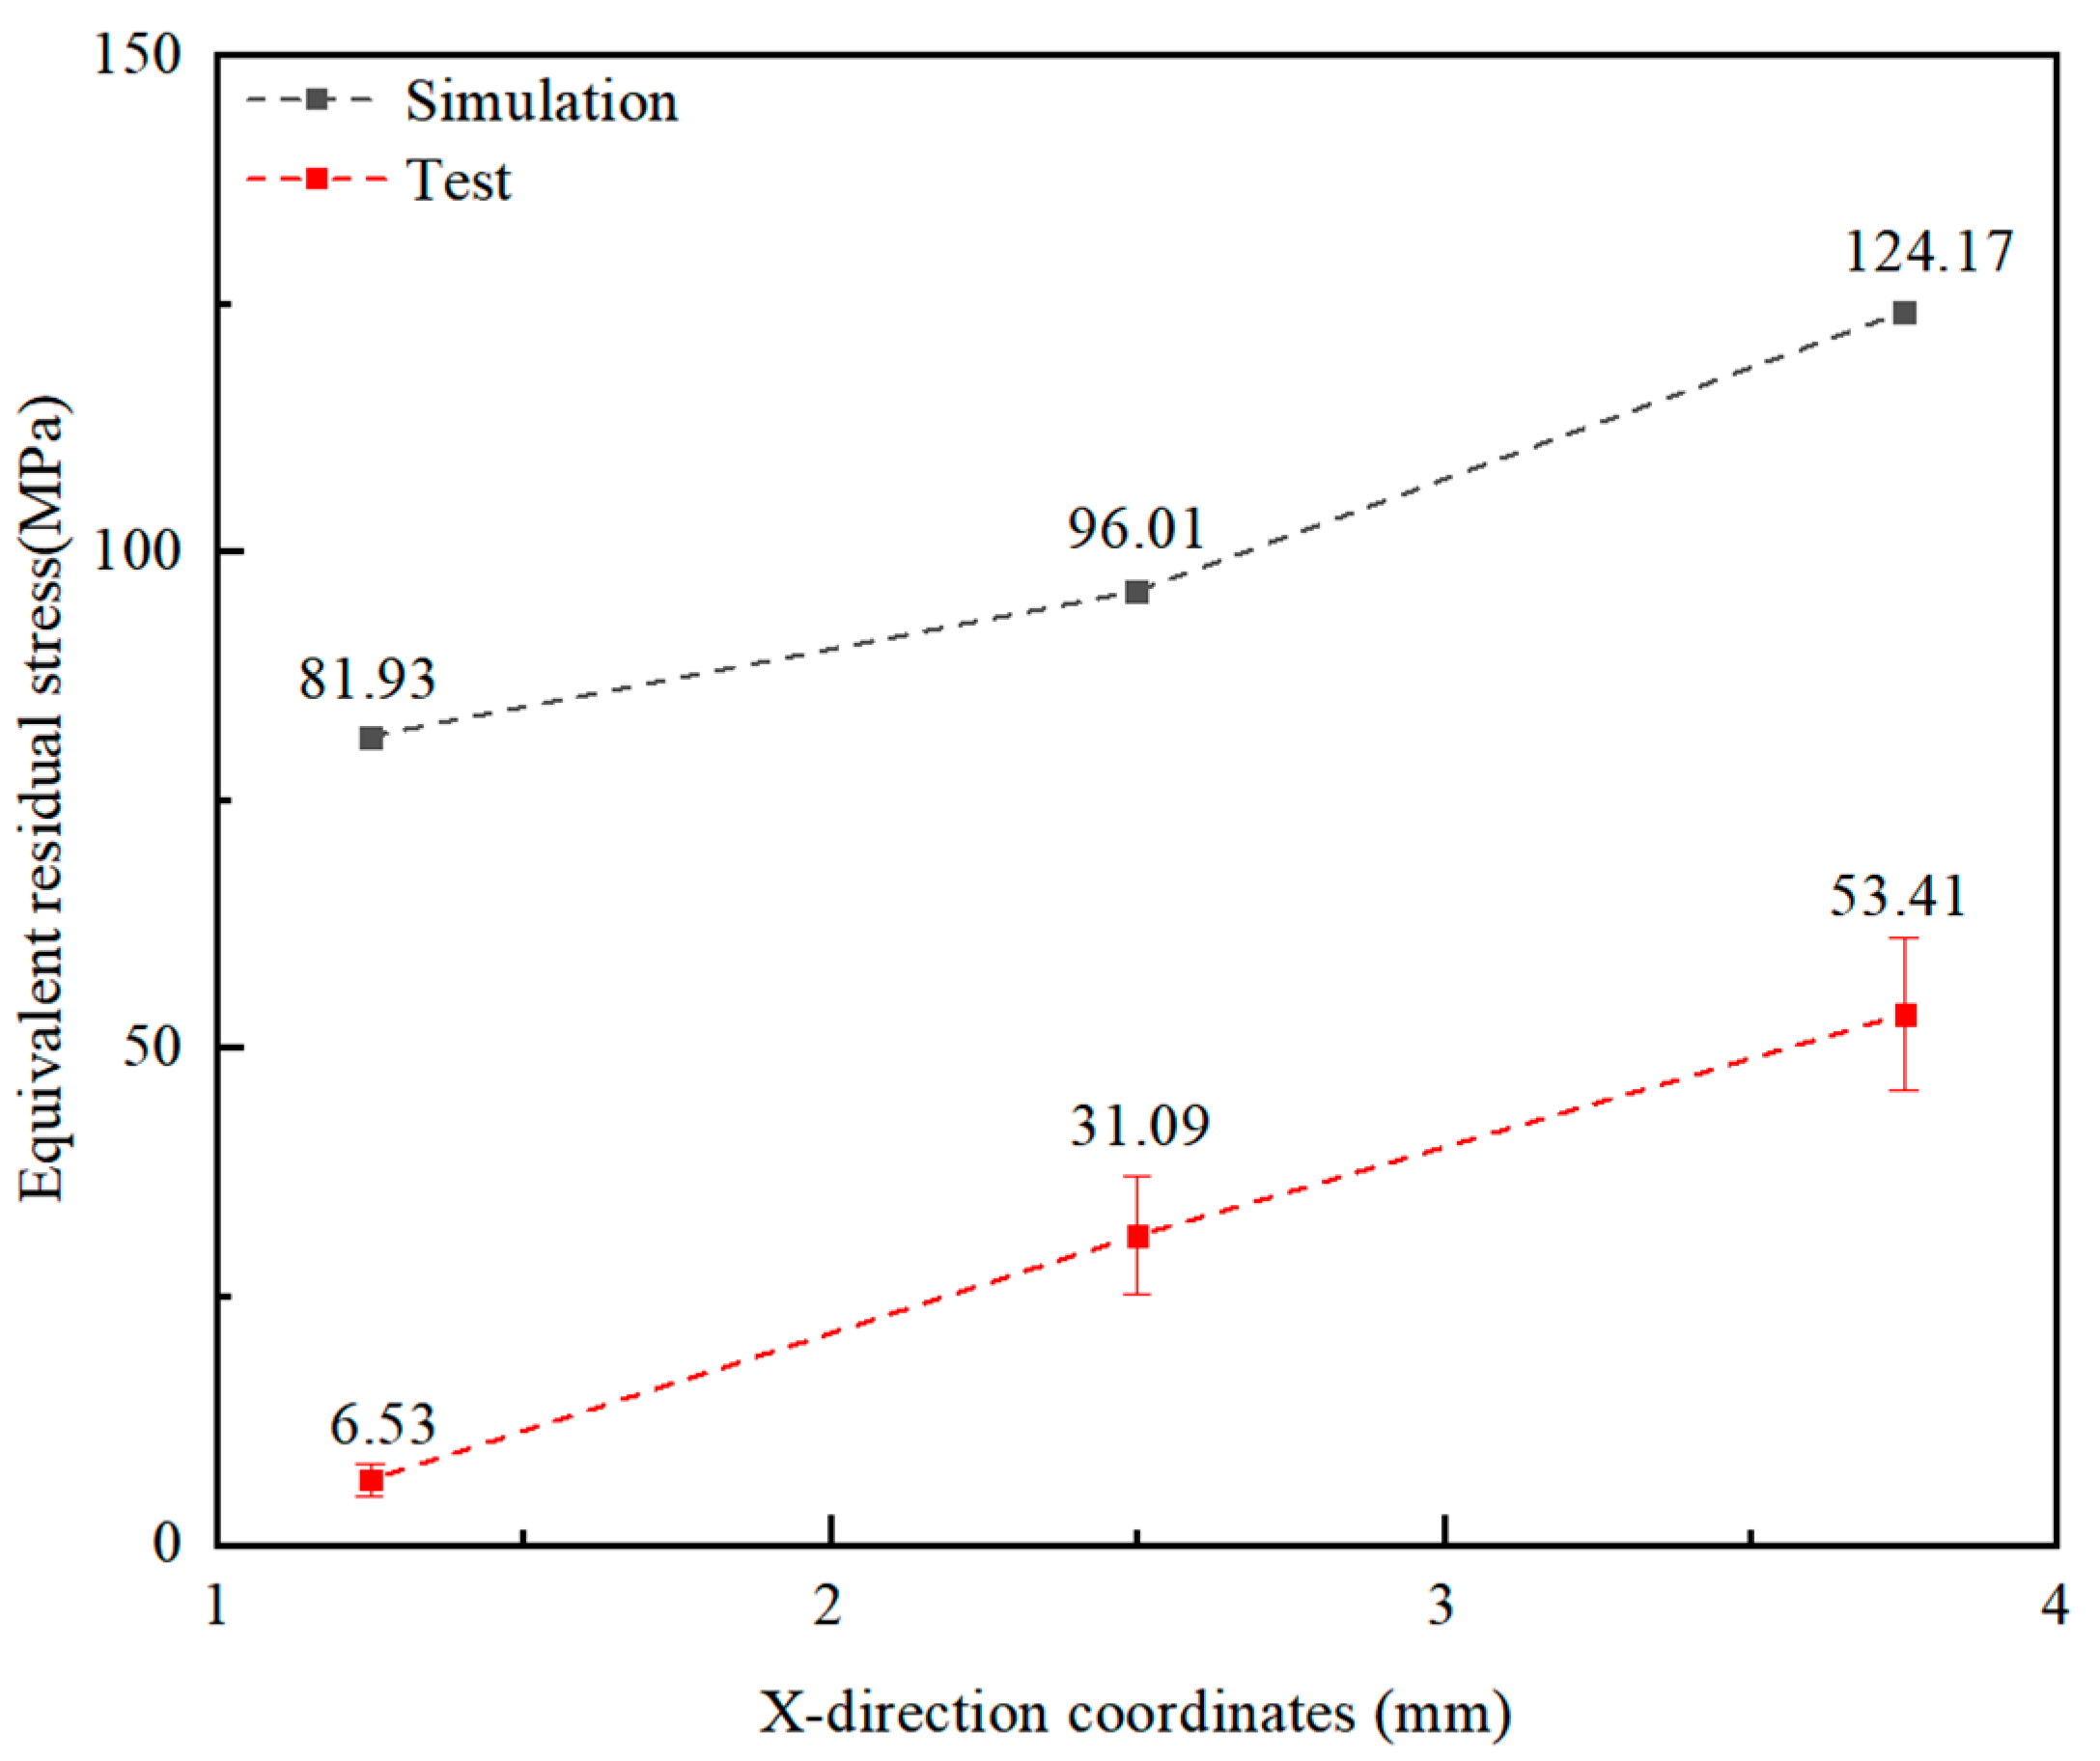
3.3. Simulation Analysis of Comparative Experiments

After preparing NdFeB magnets at a sintering temperature of 780 °C, NdFeB magnets were prepared at sintering temperatures of 850 °C and 940 °C under the same conditions. The temperature and stress field values were simulated and calculated to obtain cloud charts for comparative analyses.
Figure 9 shows the temperature fields in the final stage of cooling at three different sintering temperatures. The temperature exhibits its maximum value in the central region of the section. As the sintering temperature rises, the central cross-sectional temperature during the cooling process increases from 186 °C to 317 °C. The temperature gradient intensifies progressively, with the internal–external temperature differential ranging from approximately 146 °C (Figure 9a) to 237 °C (Figure 9c). In particular, Figure 10 reveals the stress fields in the final stage of cooling at two different sintering temperatures, where a significant stress transition was observed: At sintering temperatures of 850 °C and 940 °C, the longitudinal compressive stress at the cross-sectional edge shifts to longitudinal tensile stress. The value changes from −14 MPa (Figure 8b) to 112 MPa and 172 MPa (Figure 10b,d), which is inconsistent with the 780 °C condition.
This phenomenon arises as follows: As the sintering temperature escalates to the critical point of the material, it enters the high-temperature densification stage, wherein grain growth leads to the formation of new grain boundaries. Stress is relieved through lattice slip or dislocation movements, gradually releasing compressive stress [27]. Subsequently, the interior continues to contract during cooling to room temperature while the surface forms a hard shell. The internal contraction is constrained by the hard shell on the surface, causing the surface to transition from a compressed state to a tensile stress state. These tensile stresses reduce the compressive residual stresses resulting from the thermal expansion coefficient’s mismatch during compaction cooling [28].

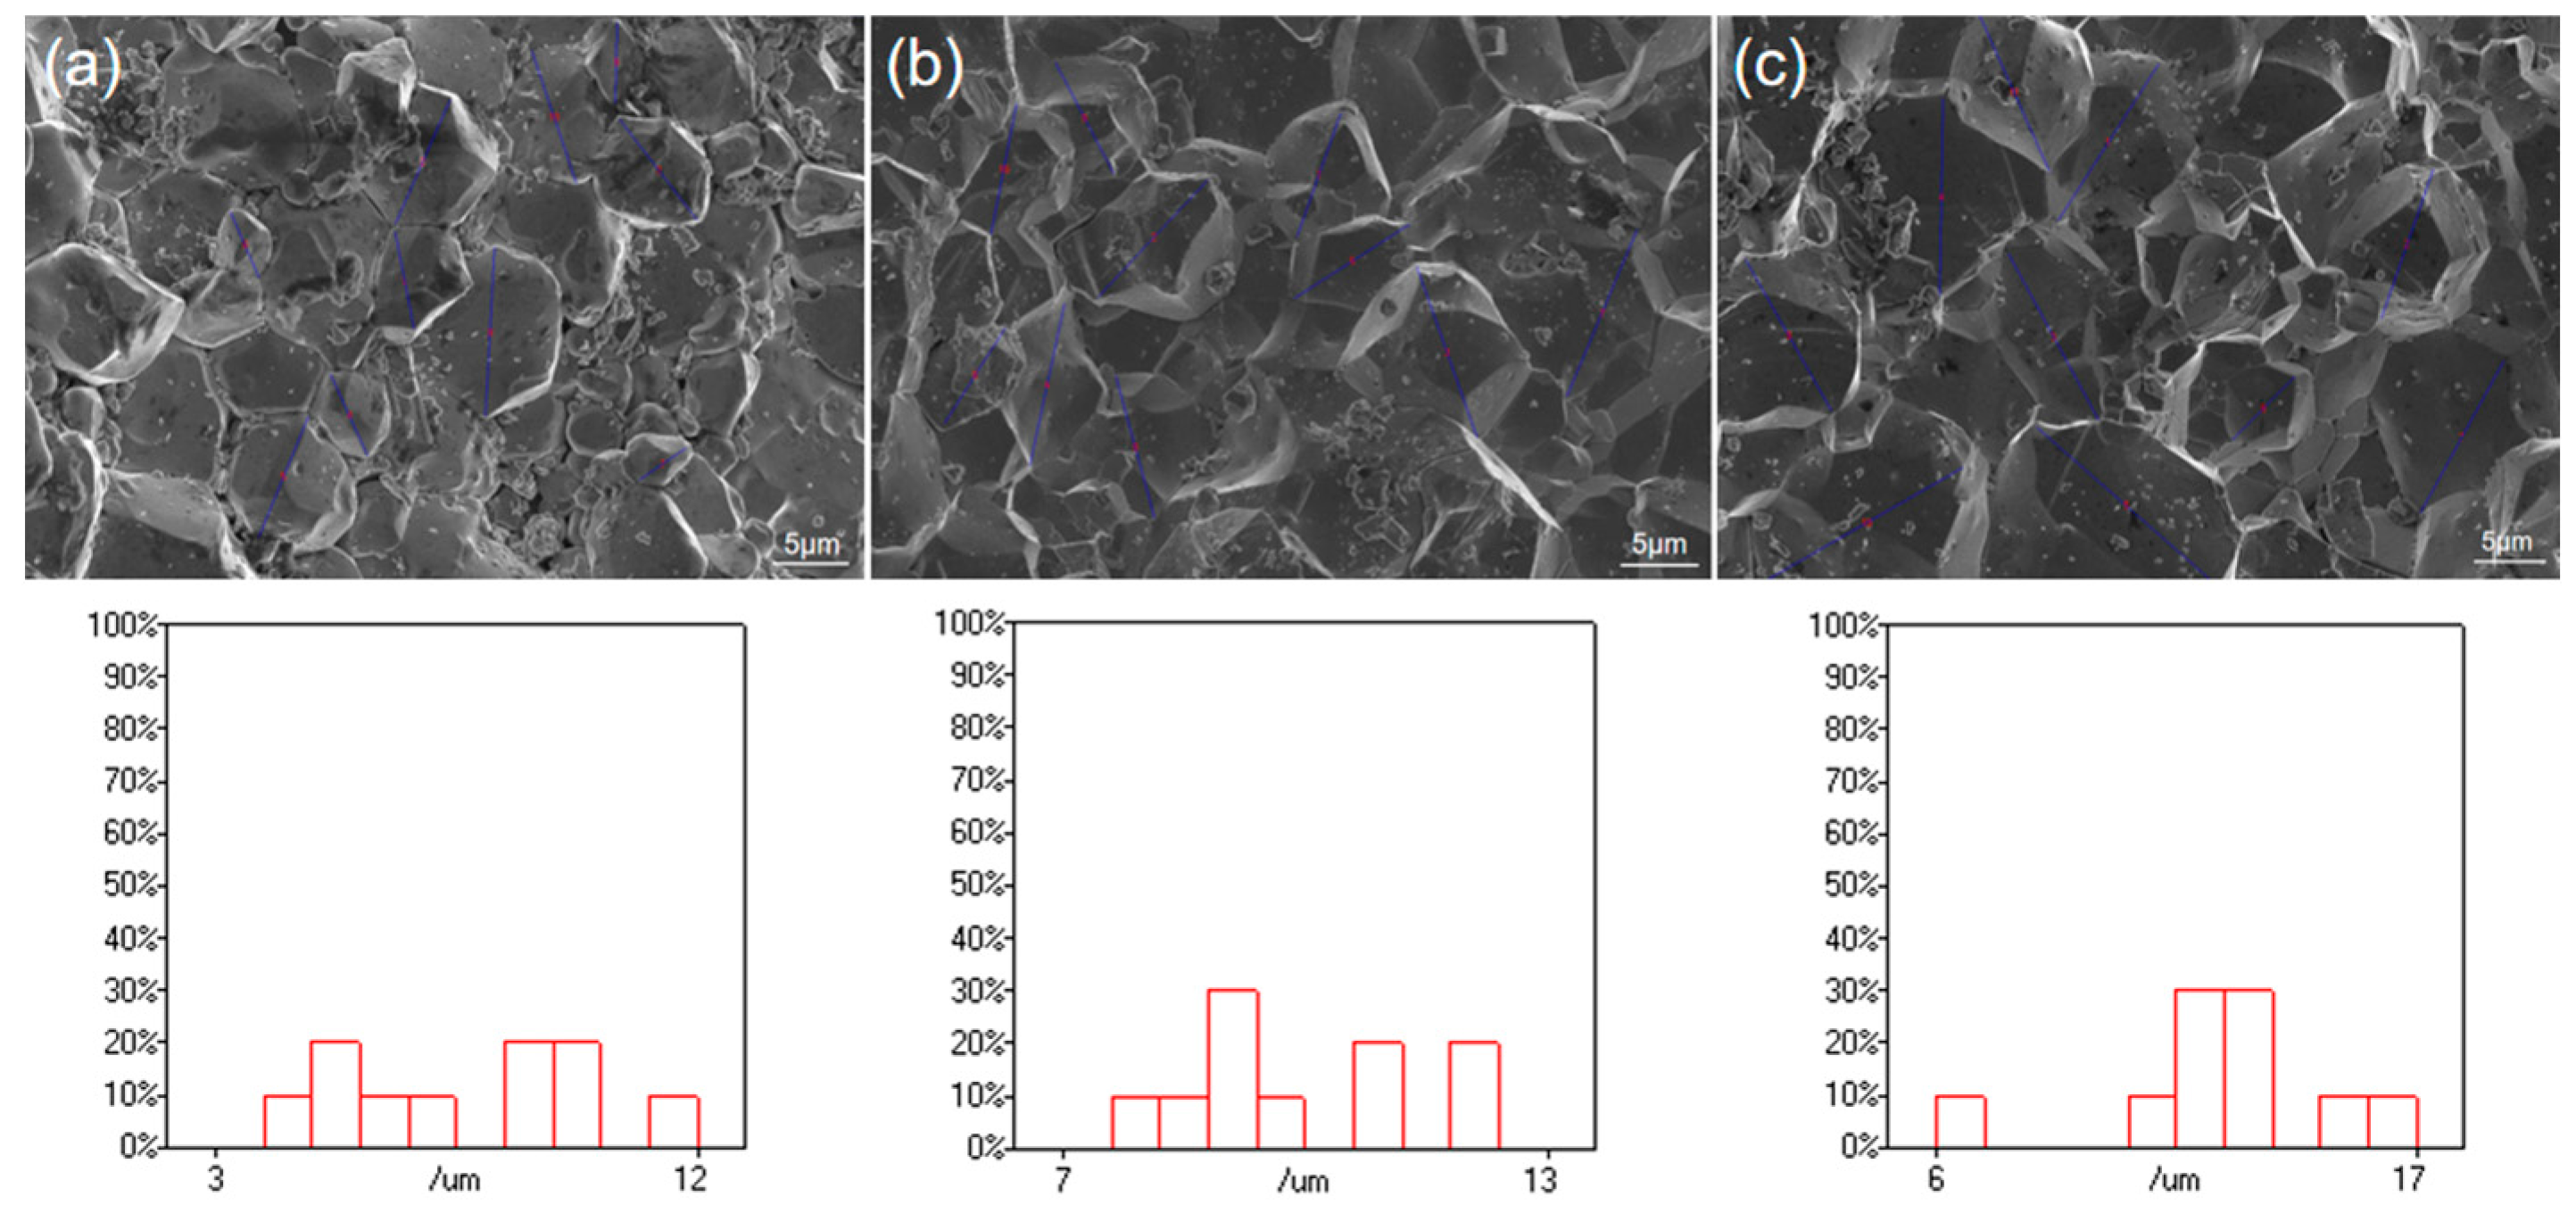
3.4. Scanning Electron Microscope Experiment Results

Figure 11 illustrates the grain size measurement at three sintering temperatures and the histograms of the grain size distribution obtained through software (Nano Measure 2.0). The calculated grain sizes are 7.82 μm, 9.95 μm, and 12.48 μm. As illustrated in Figure 11, the grain size undergoes a significant increase as the sintering temperature rises.
Figure 12 illustrates the grain microstructure of NdFeB bulks at three different sintering temperatures. The dashed line refers to the microstructure corresponding to the central area of the cross-section’s temperature field. When the distribution of the neodymium-rich phase and oxide is not uniform, the aggregation of grains easily occurs [29]. The aggregation of grains depends on the movement of the grain boundary, while the movement of the grain boundary depends on the diffusion of atoms. In such a case, a high sintering temperature will facilitate the aggregation of grains [30]. This corresponds to the stress transformation trend mentioned above. As suggested in Figure 12, at a sintering temperature of 780 °C (Figure 12a), the sample exhibits numerous small grains and pores with denser internal structures. In contrast, at 850 °C (Figure 12b), the pore area diminishes, and the grains grow considerably larger compared to the prior sample. At a sintering temperature of 940 °C, the grain size of the sample increases again, and densification displays remarkable elevation (Figure 12c).
Figure 13 further elucidates that temperature elevation facilitates the densification process of NdFeB, with the bulk cross-section grains displaying distinct stratification at three sintering temperatures. The dashed line refers to the microstructure corresponding to the stratification area of the cross-section’s temperature field. The grain’s size increases from the top to the bottom, and the grain distribution homogenizes as the temperature rises. Aside from this, densification is further improved, which highly fits with the cross-section simulation in cloud charts and verifies the accuracy of the simulation results.
Figure 14 demonstrates the microstructure at the corners of the cross-section in the simulated cloud charts of the stress field. The dashed line refers to the microstructure corresponding to the side of the cross-section’s stress field. The material will crack when the maximum primary stress exceeds the tensile strength of the material. Moreover, the expansion direction of the fracture can be inferred by observing the direction of the maximum principal stress. As illustrated in Figure 14, it can be seen that the fracture occurs in the high-tensile-stress concentration area, where the value exceeds the tensile strength of NdFeB (80 MPa). This verifies the feasibility and practicability of the simulation prediction. Under such circumstances, FEA can predict the regions prone to fracture occurrences and optimize the process parameters to minimize trial-and-error efforts.

4. Discussion

(1)
As evidently demonstrated in the analysis of the sintering temperature field, at the preliminary stage of rising temperatures, the temperature of the outer layer of the powder’s compaction is much higher than that of the interior, while the densification rate of the outer powder’s compaction is much faster than the interior. Variations in sintering temperature exert a negligible influence on the trend in the temperature field.
(2)
The analysis of stress-field cloud charts at three sintering temperatures revealed that longitudinal compressive stress at the cross-sectional edge transitions to tensile stress. This transformation stems from grain growth and constrained internal contraction on account of the hard surface shell, ultimately giving rise to a stress-state transition from compression to tension at the surface.
(3)
The simulated results show good agreement with the experimental data, which not only validates the model’s accuracy but also addresses the challenge of non-visualizable temperature and stress fields. Aside from this, the model effectively forecasts crack-susceptible regions, providing a data-driven strategy to mitigate rupture in green bodies during processing.

5. Conclusions

The spark plasma sintering experiment on NdFeB bulks under high temperatures and high pressure was conducted by utilizing the DPC model, which leverages relative density to predict temperature and stress fields. By using X-ray residual stress measurement technology and SEM characterization techniques, the accuracy of the model was ensured. Furthermore, the temperature and stress fields derived from the DPC constitutive model illustrate the densification process of NdFeB blocks under the conditions of “780 °C, 60 MPa; 850 °C, 60 MPa; 940 °C, 60 MPa”. A comprehensive evaluation was conducted to probe the impact of temperature on grain growth across various sintering temperatures, while the stress evolution within NdFeB blocks during the sintering process was also delineated. This study concluded that the increase in sintering temperature in the range of 780 °C to 940 °C promotes grain growth and accelerates the densification process. At sintering temperatures of 850 °C and 940 °C, the longitudinal compressive stress at the cross-sectional edge shifts to longitudinal tensile stress. The value changed from −14 MPa to 112 MPa and 172 MPa. Additionally, obvious cracks emerged at the cross-section’s edge under these two sintering temperatures, contrasting with the 780 °C scenario.
By employing finite element simulation techniques, the limitations of predicting temperature and stress fields in actual engineering are overcome, transforming real-world scenarios into visual models. This approach effectively reduces trial and error and enhances the sample’s quality.
This research method can be used to calibrate other special materials with high temperatures and high pressure, such as aerospace, ceramic, military, and other materials. The constitutive model, as an equation describing the mechanical properties of materials, has direct application value in engineering practice and can be used to guide engineering design and material selection.

Author Contributions

Conceptualization, N.L.; data curation, F.C.; formal analysis, T.S., W.J. and B.S.; funding acquisition, H.G.; investigation, T.S. and W.J.; methodology, T.S., W.J. and F.C.; project administration, H.G.; software, T.S., W.J. and N.L.; supervision, F.C.; validation, W.Q., R.W. and H.M.; visualization, W.Q., R.W. and H.M.; writing—original draft, T.S. and W.J.; writing—review and editing, F.C. All authors have read and agreed to the published version of the manuscript.

Funding

This research is funded by the National Key Research and Development Program of China, “study on the magnetic characteristics and defect detection technology in the production process of rare earth permanent magnet” (Grant No. 2023YFB3506500).

Institutional Review Board Statement

Not applicable.

Informed Consent Statement

Not applicable.

Data Availability Statement

The data presented in this study are available upon request from the corresponding author.

Conflicts of Interest

Author Huayun Mao is employed by the company JL MAG Rare-Earth Co., Ltd. The remaining authors declare that the research was conducted in the absence of any commercial or financial relationships that could be construed as a potential conflict of interest.

References

  1. Amato, A.; Becci, A.; Birloaga, I.; De Michelis, I.; Ferella, F.; Innocenzi, V.; Ippolito, N.; Gomez, C.P.J.; Vegliò, F.; Beolchini, F. Sustainability analysis of innovative technologies for the rare earth elements recovery. Renew. Sustain. Energy Rev. 2019, 106, 41–53. [Google Scholar] [CrossRef]
  2. Gutfleisch, O.; Kirchner, A.; Grünberger, W.; Hinz, D.; Schäfer, R.; Schultz, L.; Müller, K.H. Backward extruded NdFeB hddr ring magnets. J. Magn. Magn. Mater. 1998, 183, 359–364. [Google Scholar] [CrossRef]
  3. Sadullaho, A.G.; Altuncevahir, B.; Addemi, A.O. Effect of intergranular phase seg regation on magnetic properties of NdFeB magnet. Electron. Mater. Lett. 2014, 10, 153–157. [Google Scholar] [CrossRef]
  4. Henderson, R.; Chandler, H.; Akisanya, A.; Barber, H.; Moriarty, B. Finite element modelling of cold is ostatic pressing. J. Eur. Ceram. Soc. 2000, 20, 1121–1128. [Google Scholar] [CrossRef]
  5. Hamano, M. Overview and outlook of bonded magnets in Japan. J. Alloys Compd. 1995, 222, 8–12. [Google Scholar] [CrossRef]
  6. Ormerod, J.; Constantinides, S. Bonded permanent magnets: Current status and future opportunities (invited). J. Appl. Phys. 1997, 81, 4816–4820. [Google Scholar] [CrossRef]
  7. Herbst, J.F.; Croat, J.J. Neodymium-iron-boron permanent magnets. J. Magn. Magn. Mater. 1991, 100, 57–78. [Google Scholar] [CrossRef]
  8. Lee, R.W. Hot-pressed neodymium-iron-boron magnets. Appl. Phys. Lett. 1985, 46, 790–791. [Google Scholar] [CrossRef]
  9. Croat, J.J. Current status of rapidly solidified NdFeB permanent magnets. IEEE Trans. Magn. 1989, 25, 3550–3554. [Google Scholar] [CrossRef]
  10. Olevsky, E.A. Theory of sintering: From discrete to continuum. Mater. Sci. Eng. Rep. 1998, 23, 41–100. [Google Scholar] [CrossRef]
  11. Khoei, A.R.; Shamloo, A.; Azami, A.R. Extended finite element method in plasticity forming of powder compaction with contact friction. Int. J. Solids Struct. 2006, 43, 5421–5448. [Google Scholar] [CrossRef]
  12. Mardari, A.; Mazuru, S. Simulation of the pressing process with combined forces by using ABAQUS software. Appl. Mech. Mater. 2013, 371, 158–162. [Google Scholar] [CrossRef]
  13. Sun, Z.Z.; Peng, W.F.; Moliar, O.; Li, H. Simulation of Ti-30Cu powder rolling process based on Drucker Prager/Cap model. Mater. Mech. Eng. 2023, 47, 92–102. [Google Scholar]
  14. Staf, H.; Olsson, E.; Larsson, P.L. Mechanical characterization of powder materials: A general approach detailed for cemented carbides. Powder Technol. 2020, 364, 531–537. [Google Scholar] [CrossRef]
  15. Lu, Y.; Zhang, F.; Zhu, W. Calibration of a constitutive model for polycrystalline diamond sintering process. Diam. Relat. Mater. 2024, 148, 111422. [Google Scholar] [CrossRef]
  16. Li, X.Q.; Li, L.; Hu, K.; Chen, Z.C.; Qu, S.G.; Yang, C. Microstructure and magnetic properties of anisotropic Nd–Fe–B magnets prepared by spark plasma sintering and hot deformation. Trans. Nonferrous Met. Soc. China 2014, 24, 3142–3151. [Google Scholar] [CrossRef]
  17. Zhou, R.; Zhang, L.-H.; He, B.-Y.; Liu, Y.-H. Numerical simulation of residual stress field in green power metallurgy compacts by modified Drucker-Prager Cap model. Trans. Nonferrous Met. Soc. China 2013, 23, 2374–2382. [Google Scholar] [CrossRef]
  18. Shin, H.; Kim, J.B. Physical interpretations for cap parameters of the modified Drucker-Prager Cap model in relation to the deviator stress curve of a particulate compact in conventional triaxial testing. Powder Technol. 2015, 280, 94–102. [Google Scholar] [CrossRef]
  19. LaMarche, K.; Buckley, D.; Hartley, R.; Qian, F.; Badawy, S. Assessing materials’ tablet compaction properties using the Drucker-Prager Cap model. Powder Technol. 2014, 267, 208–220. [Google Scholar] [CrossRef]
  20. Manshoori Yeganeh, A.; Movahhedy, M.R.; Khodaygan, S. An efficient scanningalgorithm for improving accuracy based on minimising part warping in selected laser sintering process. Virtual Phys. Prototyp. 2018, 14, 59–78. [Google Scholar] [CrossRef]
  21. Panda, B.K.; Sahoo, S. Thermo-mechanical modeling and validation of stress field during laserpowder bed fusion ofAlSil0Mg built part. Results Phys. 2019, 12, 1372–1381. [Google Scholar] [CrossRef]
  22. Li, J.; Jin, Y.; Chang, Y.; Zuo, D. Finite element simulation and experimental study ofsingle-laser trackin laser polishing ofTi6Al4V. Int. J. Adv. Manuf. Technol. 2022, 121, 4571–4581. [Google Scholar]
  23. Yazici, B.A.; Kraft, T.; Riedel, H. Finite element modelling of pm surface densification process. Powder Metall. 2008, 51, 211–216. [Google Scholar] [CrossRef]
  24. Landi, E.; Tampieri, A.; Celotti, G.; Sprio, S. Densification behaviour and mechanisms of synthetic hydroxyapatites. J. Eur. Ceram. Soc. 2000, 20, 2377–2387. [Google Scholar] [CrossRef]
  25. Jiang, S.; Zhang, J.-C.; Yan, S.; Li, X.-L. A New Approach for Residual Stress Analysis of GH3535 Alloy by Using Two-Dimensional Synchrotron X-Ray Diffraction. Chin. Phys. Lett. 2020, 37, 070701. [Google Scholar] [CrossRef]
  26. Xie, L.; Jiang, C.; Lu, W. The influence of shot peening on the surface properties of (TiB+TiC)/Ti–6Al–4V. Appl. Surf. Sci. 2013, 280, 981–988. [Google Scholar] [CrossRef]
  27. Ren, X.; Zhang, T.; Zhang, Y.; Jiang, D.; Yongzhuo, H.; Guan, H.; Qian, X. Mechanical properties and residual stresses changing on 00Cr12 alloy by nanoseconds laser shock processing at high temperatures. Mater. Sci. Eng. A 2010, 528, 1949–1953. [Google Scholar] [CrossRef]
  28. Bhattacharya, S. Pressure-Assisted Densification of Non-Homogeneous Ceramic Compacts; University of Massachusetts Amherst: Amherst, MA, USA, 1997. [Google Scholar]
  29. Yin, W.; Chen, R.; Tang, X.; Ju, J.; Yan, A. Effect of pressless heat treatment on the magnetic performance and microstructure of hot-deformed Nd-Fe-B magnet. J. Magn. Magn. Mater. 2019, 482, 9–13. [Google Scholar] [CrossRef]
  30. Jing, Z.; Guo, Z.H.; Li, M.Y.; Hu, Y.H.; Song, K.K.; Fang, Y.K.; Zhu, M.G.; Li, W. Effects of Hot-Pressing Temperature on the Magnetic Properties of Hot-Pressed Nanocrystalline Nd–Fe–B Magnets. IEEE Trans. Magn. 2018, 54, 1–5. [Google Scholar] [CrossRef]
Figure 1. (a) NdFeB bulks sintered at 780 °C, 850 °C, and 940 °C; (b) mold (10 mm diameter); (c) scanning electron microscope (SEM); (d) spark plasma sintering furnace (SPS); (e) X-ray residual stress tester.
Applsci 15 07173 g001
Figure 2. Yield surface in the p–t plane [17].
Applsci 15 07173 g002
Figure 3. Flow potential in the p–t plane [17].
Applsci 15 07173 g003
Figure 4. The relationships between the relative density and the (a) angles of friction, (b) cap parameter, and (c) cohesion [18].
Applsci 15 07173 g004
Figure 5. Temperature cloud charts at 780 °C: (a) 10th incremental step; (b) 108th incremental step; (c) 623rd incremental step.
Applsci 15 07173 g005
Figure 6. Measurement locations on the upper surface.
Applsci 15 07173 g006
Figure 7. Equivalent residual stress simulation results and test measurements.
Applsci 15 07173 g007
Figure 8. Two stress components in the (a) transverse and (b) longitudinal cross-sections after 780 °C sintering.
Applsci 15 07173 g008
Figure 9. Temperature cloud charts after sintering temperatures of (a) 780 °C, (b) 850 °C, and (c) 940 °C.
Applsci 15 07173 g009
Figure 10. Stress cloud charts after sintering temperatures of (a,b) 850 °C and (c,d) 940 °C.
Applsci 15 07173 g010
Figure 11. Microstructure and crystal size distribution calculation diagram of NdFeB bulks at sintering temperatures of (a) 780 °C, (b) 850 °C, and (c) 940 °C.
Applsci 15 07173 g011
Figure 12. Microstructure and temperature cloud charts of NdFeB bulks at sintering temperatures of (a) 780 °C, (b) 850 °C, and (c) 940 °C.
Applsci 15 07173 g012
Figure 13. Cross-sectional microstructure and temperature cloud charts of NdFeB bulks at sintering temperatures of (a) 780 °C, (b) 850 °C, and (c) 940 °C.
Applsci 15 07173 g013
Figure 14. Microstructure of the fracture at corners at sintering temperatures of (a) 780 °C, (b) 850 °C, and (c) 940 °C.
Applsci 15 07173 g014
Table 1. Parameters of NdFeB powder materials [17].
SymbolPropertiesQuantity
ρDensity (Kg/m3)7400
vPoisson’s Ratio0.24
EYoung’s Modulus (MPa)158 × 103
σbcCompressive Strength (MPa)1100
RmTensile Strength (MPa)80
αtCoefficient of Thermal Expansion (1/k)5 × 10−6
CSpecific Heat (J/kg/K)502
dMaterial Cohesion (MPa)204
βAngle of Friction10
RCap Eccentricity0.4
αFlow Stress Ratio1
Table 2. Inter-material contact coefficients [19].
MaterialCoefficient of Static FrictionCoefficient of Rolling Friction
Powder–Powder0.5450.010
Powder–Tool0.300/
Table 3. Three-point equivalent stress values (Mpa) on the upper surface at 780 °C sintering temperatures.
Temperature (°C)X-Direction Coordinates (mm)Sampling PointsGroup 1Group 2Group 3Average
7401.25Point A4.998.326.286.53
2.5Point B24.2534.8534.1931.09
3.75Point C54.3860.5845.2653.41
Disclaimer/Publisher’s Note: The statements, opinions and data contained in all publications are solely those of the individual author(s) and contributor(s) and not of MDPI and/or the editor(s). MDPI and/or the editor(s) disclaim responsibility for any injury to people or property resulting from any ideas, methods, instructions or products referred to in the content.

