Article

Parametric Analysis of Static–Dynamic Characteristics of Adjacent Tunnels in Super-Large Twin Tunnels by DEM

1
School of Civil Engineering and Architecture, Wuhan Institute of Technology, Wuhan 430074, China
2
School of Civil Engineering and Architecture, Shaanxi University of Technology, Hanzhong 723001, China
*
Author to whom correspondence should be addressed.
Appl. Sci. 2025, 15(13), 7124; https://doi.org/10.3390/app15137124
Submission received: 30 April 2025 / Revised: 12 June 2025 / Accepted: 21 June 2025 / Published: 25 June 2025
(This article belongs to the Special Issue Structural Dynamics in Civil Engineering)

Abstract

Featured Application

The parametric analysis of super-large-diameter twin tunnels under train-induced vibrations provides scientific guidance for the design, construction, and operation of super-large twin tunnel engineering.

Abstract

The dynamic characteristics of super-large-diameter twin tunnels under train vibration loads have become a critical issue affecting not only the engineering safety of their own tunnels but also adjacent tunnels. A numerical model of super-large-diameter (D = 15.2 m) twin tunnels was established by the discrete element method (DEM) to analyze the static and dynamic responses of adjacent tunnel structures and surroundings under train-induced vibrations. Three parameters were considered: internal walls, absolute and relative spacing, and water pressure. The results indicate that internal walls in super-large twin tunnels can significantly reduce the static and dynamic responses in both the structures and surroundings of the adjacent tunnel. The vehicular lane board (wall2) plays a determinative role, followed by the smoke exhaust board (wall1), while the left and right partition walls (wall3 and wall4) exhibit the least effectiveness. The static–dynamic responses of the liners and surroundings of adjacent tunnels in super-large twin tunnels are significantly greater than those in smaller twin tunnels when the absolute spacing is identical. Moreover, the significant differences in displacement and velocity between the liners and surroundings can lead to cracks, leakage, or even instability. Appropriate water pressure (149 kPa) can effectively mitigate dynamic responses in adjacent tunnel structures and surroundings. The dynamic characteristics of super-large-diameter twin tunnels differ markedly from those of small-diameter twin tunnels, with internal walls, twin tunnel spacing, and water pressure all influencing their static and dynamic behaviors. This study provides theoretical guidance for the design and operation of super-large-diameter twin tunnels.

1. Introduction

With the rapid development of urban rail transit, super-large-diameter twin tunnels designed for combined highway and railway use are being extensively constructed due to their advantages in conserving underground space [1,2]. Subway train operations cause vibrations in their own and adjacent tunnel structures and surrounding soil, impacting stability, durability, and the safety and comfort of adjacent tunnels. As a result, research on the dynamic behavior of super-large-diameter twin tunnels is gaining more attention.
For small-diameter tunnels (d = 6.0–6.2 m), Heidary et al. [3] found ground vibration increases with higher axle loads when two trains pass in opposite directions inside twin tunnels (d = 6.0 m). Zhou et al. [4] conducted a 50× g centrifuge test on parallel tunnels (d = 6.0 m) under train and sweeping frequency loads. Their results showed that twin-tunnel interaction significantly amplifies dynamic responses. Li et al. [5] found the influence range of shield driving, and the interaction between the twin tunnels (d = 6.2 m) with different axis spacings in shield driving. Pang et al. [6] established a robust methodological framework for assessing tunnel face stability and offers valuable guidance for the design and construction of shield tunnels (d = 6.0 m) in analogous geological and operational contexts. Li et al. [7] demonstrated that the calculated displacement settlement trends align closely with the numerical simulation and are consistent with field monitoring data when new tunnels (d = 6.2 m) are excavated above existing tunnels. These studies demonstrate that research on standard-diameter tunnels (d = 6.0–6.2 m) under train-induced vibrations has been relatively thorough.
In research on large-diameter tunnels (D = 10.0–15.0 m), Wang et al. [8] found that wider faults significantly increase plastic zone expansion in the lining of a fault-crossing tunnel (D = 10 m). Zhang et al. [9] have identified “horizontal duck egg” deformation patterns and butterfly-shaped moment distributions under ultimate loads, crucial data for assessing the capacity of large tunnels (D = 11.6 m). Liu et al. [10] demonstrated that shield speed directly affects subgrade settlement, informing construction parameter optimization in sensitive areas in twin shield tunnels (D = 12.8 m). Zhang et al. [11] conducted long-term monitoring of segment loads and structural internal forces in a large-diameter shield tunnel (D = 14.5 m) and found that actual earth pressures are just 48–60% of theoretical values, which provides an empirical basis for the load calculation of large-diameter tunnels. These studies collectively demonstrate that large-diameter tunnels exhibit distinct dynamic characteristics compared to conventional sizes, warranting further investigation.
In research on super-large-diameter tunnels (D ≥ 15.0 m) [12,13,14,15], Shi et al. [16] defined the longitudinal ground settlement patterns of twin tunnels (D = 15 m), combining the three-dimensional random finite element methods and Monte Carlo simulation. Kou et al. [17] provided critical design guidelines of large-diameter tunnel (D = 15 m) joints for high-pressure environments. Wu et al. [18] compared vibration characteristics between ultra-large (D = 15.2 m) and small (d = 6.2 m) river-crossing twin tunnels using DEM models, demonstrating larger tunnels’ superior stability when the relative spacing is the same (l/d = 0.25, l/D = 0.25). Wang et al. [19] proved that thicker secondary linings enhance load capacity by optimizing segment-lining interaction in 15.2 m shield tunnels. Guo et al. [20] found that internal structures effectively reduce dynamic responses by physical model tests (D = 15.2 m). Li et al. [21] studied the impact of 15.4 m shield tunnel construction on adjacent existing subway tunnels by finite element model, measuring 17.9 mm displacements in adjacent subway tunnels and evaluating isolation pile effectiveness. Xue et al. [22] revealed that excavation of super-large-diameter tunnels (D = 15.56 m) causes the maximum compressive stress in the existing tunnel lining at the haunch and the maximum tensile stress at the crown. From the above research results, it can be seen that current research on super-large-diameter tunnels primarily examines single-tunnel configurations, with limited studies on the dynamic response of twin tunnels.
In this paper, the factors affecting the static and dynamic response of the ultra-large-diameter twin tunnels (D = 15.2 m) are further investigated by DEM based on the previous research of our group [18]. Three parameters with different internal walls, different spacings, and different water pressures are set up, and the static and dynamic responses of sleepers, segments, and surroundings of super-large twin tunnels under train vibration are investigated. This research provides scientific guidance for the design, construction, and operation of super-large-diameter twin tunnel projects.

2. Modeling Procedure

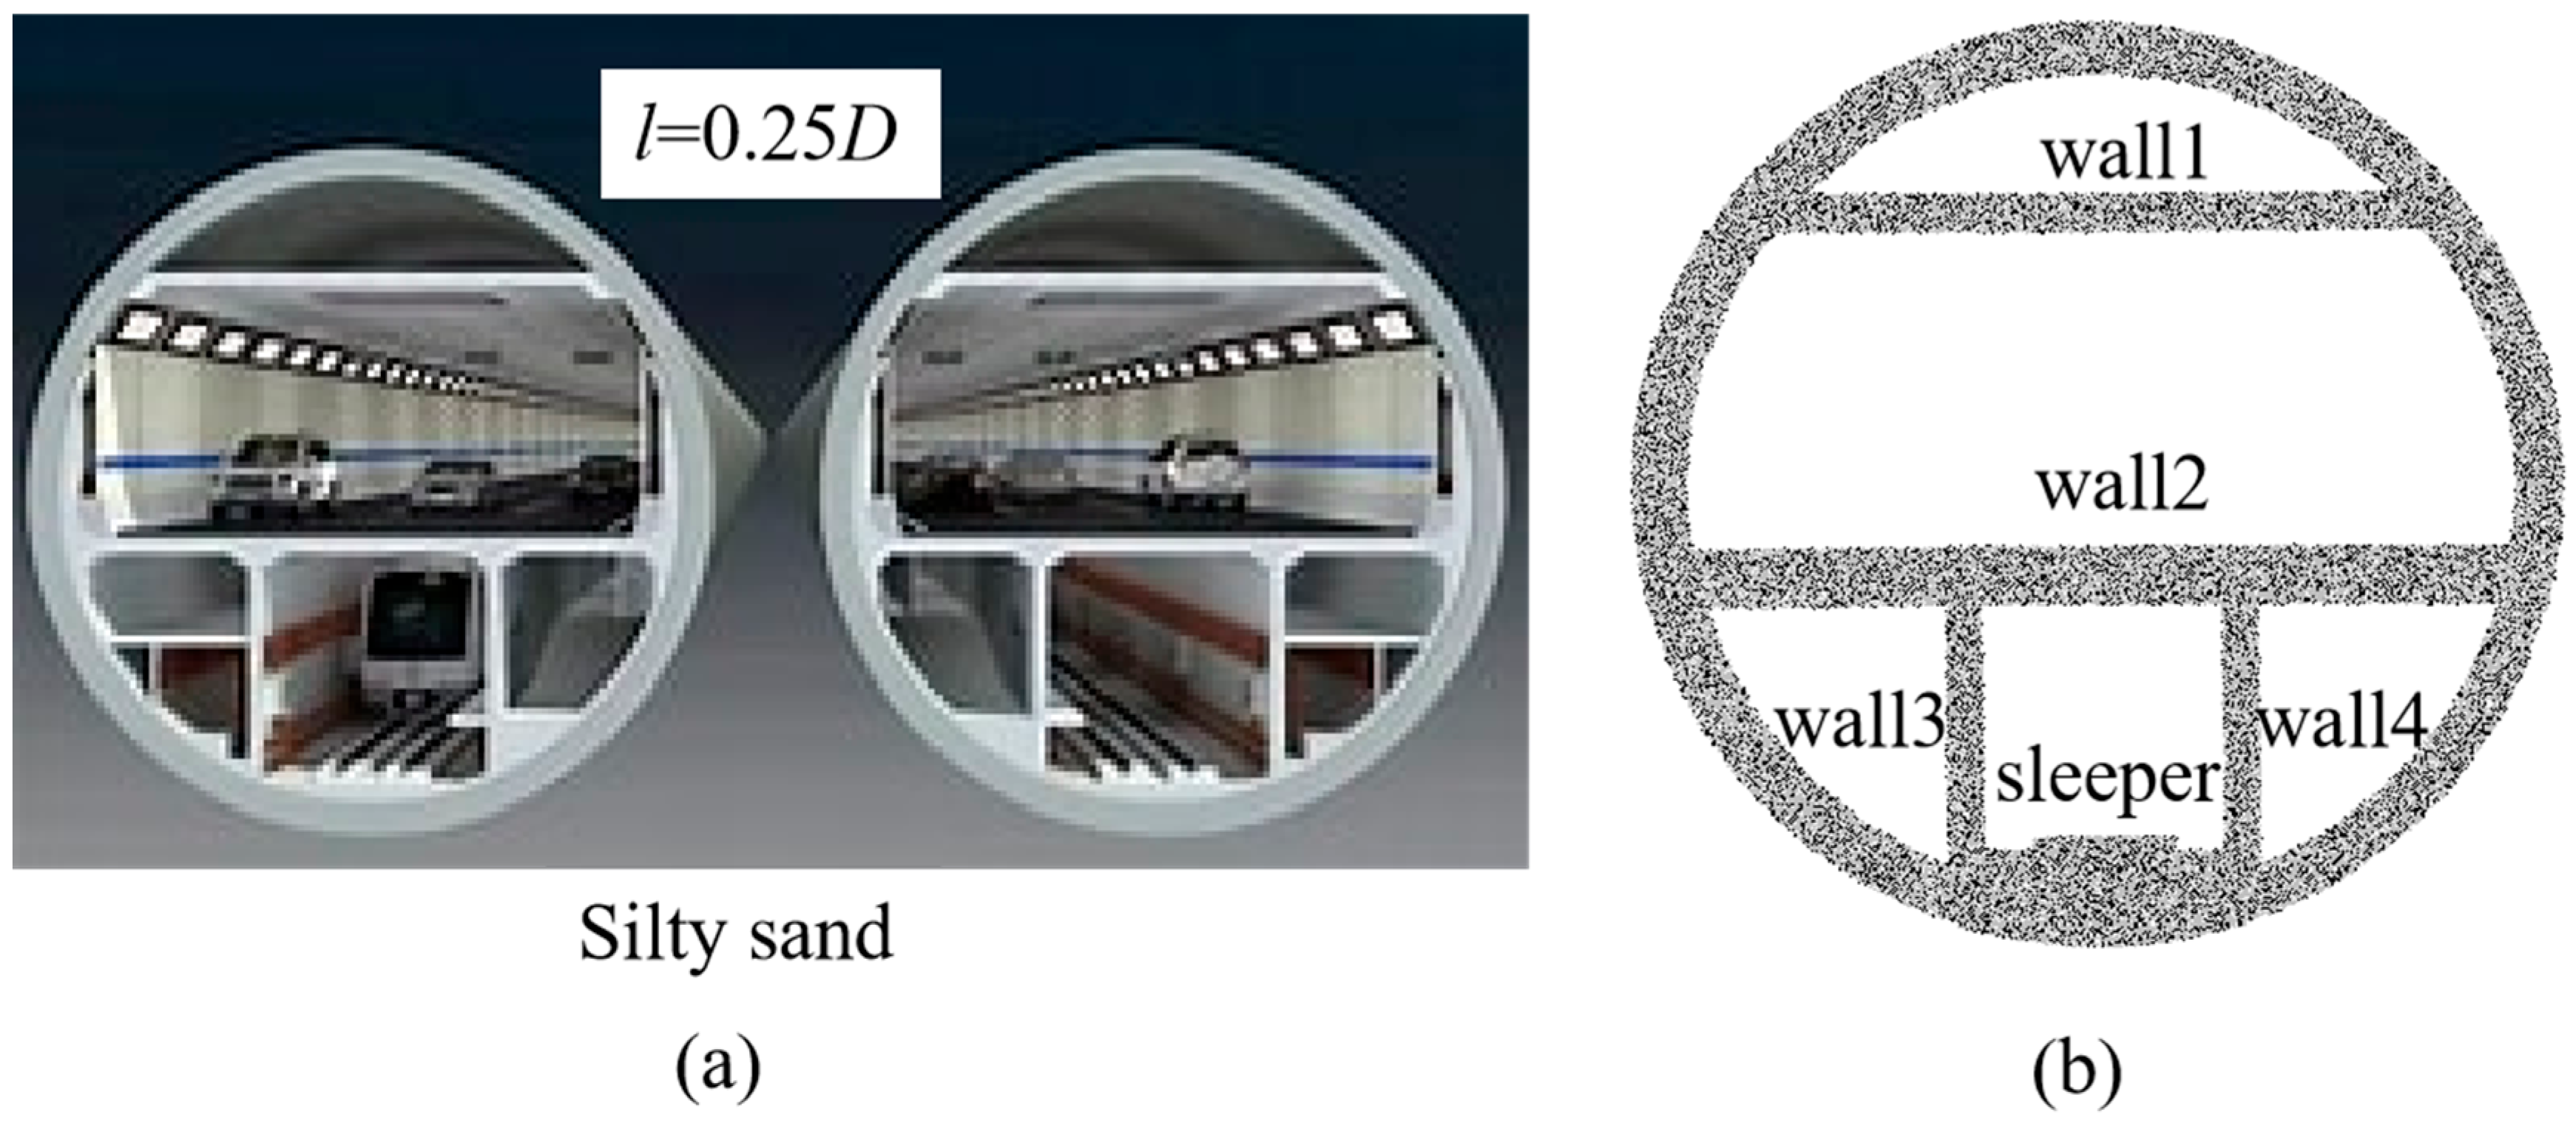
2.1. Project Overview

This study is based on the Sanyang Road combined road-rail twin tunnels of Wuhan Metro Line 7, the cross section of this super-large-diameter (D = 15.2 m) twin tunnels as shown in Figure 1. The burial depth of twin tunnels is 0.5 D, and the water depth varies between 0.5 D and 1.5 D, with a minimum clear spacing of l = 0.25 D between the twin tunnels. The geometric dimensions of the tunnels and the physical–mechanical parameters of the surroundings (silty sand) are summarized in Table 1 and Table 2. The Type A train, which operates in Wuhan Metro Line 7, and its corresponding train-induced vibration loads are illustrated in Figure 2. Detailed derivations of these loads can be found in the prior research [18].

2.2. Basic Model Information

The discrete element method (DEM) establishes a physical and mechanical model of contact based on Newton’s second law and the force-displacement equation to simulate discontinuous and discrete elements. This method has wide applicability and has been applied in fields such as mining [23,24], civil engineering, petroleum [25], chemical engineering [26,27], waste material isolation, agriculture [28,29], and materials science [30,31].
In this paper, the two-dimensional model recommended in the user manual is adopted for modeling. The modeling process is detailed in the literature [14]. The summary of mesoscopic parameters adopted for the surroundings and C60 segments is shown in Table 3 and Table 4.
Three sets of numerical models were established to investigate the influencing factors of the dynamic response of super-large-diameter twin tunnels under train-induced vibrations. These models analyze the static and dynamic characteristics of adjacent tunnel liners and surroundings under different conditions, including internal wall configurations, absolute and relative spacings between tunnels, and varying water pressures. The model details are summarized in Table 5.
The first set comprises five models (T2, W234, W12, W2, and NW), and the cross-section of T2 is illustrated in Figure 3. The analysis primarily addresses the displacement and velocity of adjacent tunnel sleepers, liners, and surroundings under train loads.
The second set of models, comprising three conditions (B1, B2, and B3), aiming to compare the absolute and relative spacing, are illustrated in Figure 4. The absolute spacing is defined as maintaining identical distances between the small and super-large twin tunnels, while relative spacing refers to controlling the ratio of the tunnel spacing to their respective diameters to be consistent.
The comparison between B1 and B2 aims to evaluate the influence of train-induced vibrations on adjacent tunnels under identical absolute spacing (0.25 d), whereas the comparison between B1 and B3 focuses on the effects under identical relative spacing. The spacing of the twin tunnel in B1-B3 conditions is calculated by Equations (1) and (2).
l1 = l2 = 0.25 d = 0.25 × 6.2 m = 1.55 m
l3 = 0.25 D = 0.25 × 15.2 m = 3.8 m
where d is the diameter of small twin tunnels, and D is the diameter of super-large twin tunnels.
The third set of models includes three conditions, comparing the static and dynamic responses of the adjacent tunnel of super-large-diameter twin tunnels under train-induced vibrations at different water pressures. The water pressures on the top surface of the model for conditions C1, C2, and C3 are 0.5 D, 1.0 D, and 1.5 D, respectively, and they are calculated by the following Equations (3)–(5):
C1: P1 = ρgh1 = 1 × 103 × 9.81 × 0.5 × 15.2 = 74.6 kPa
C2: P2 = ρgh2 = 1 × 103 × 9.81 × 1.0 × 15.2 = 149 kPa
C3: P3 = ρgh3 = 1 × 103 × 9.81 × 1.5 × 15.2 = 223 kPa
where ρ is the density of water, 1 g/cm3; g is gravitational acceleration, 9.81 m/s2; and hi (i = 1,2,3) is the depth of groundwater from the top surface of the model.
Taking the C2 condition as an example, a schematic diagram of water pressure calculation for the C2 condition in the third set of models can be seen in Figure 5. The length and height of the model are 64.6 and 38.0 m. The lateral pressure coefficient is specified as 0.4 [18]. The water pressures on all sides of the model are calculated as follows: Equations (6)–(8):
Pw1 = ρgh2 = 149 kPa
Pw2 = Pw1 + ρgH = 149 + 1 × 9.81 × 38.0 = 522 kPa
Pw3 = Pw4 = (Pw1 + Pw2) × 0.5 × 0.4 = 134 kPa
where Pw1 is the water pressure on the top surface of the model; Pw2 is the water pressure on the bottom surface of the model; and Pw3 and Pw4 are the water pressures on the left and right sides of the model.

3. Results and Discussion
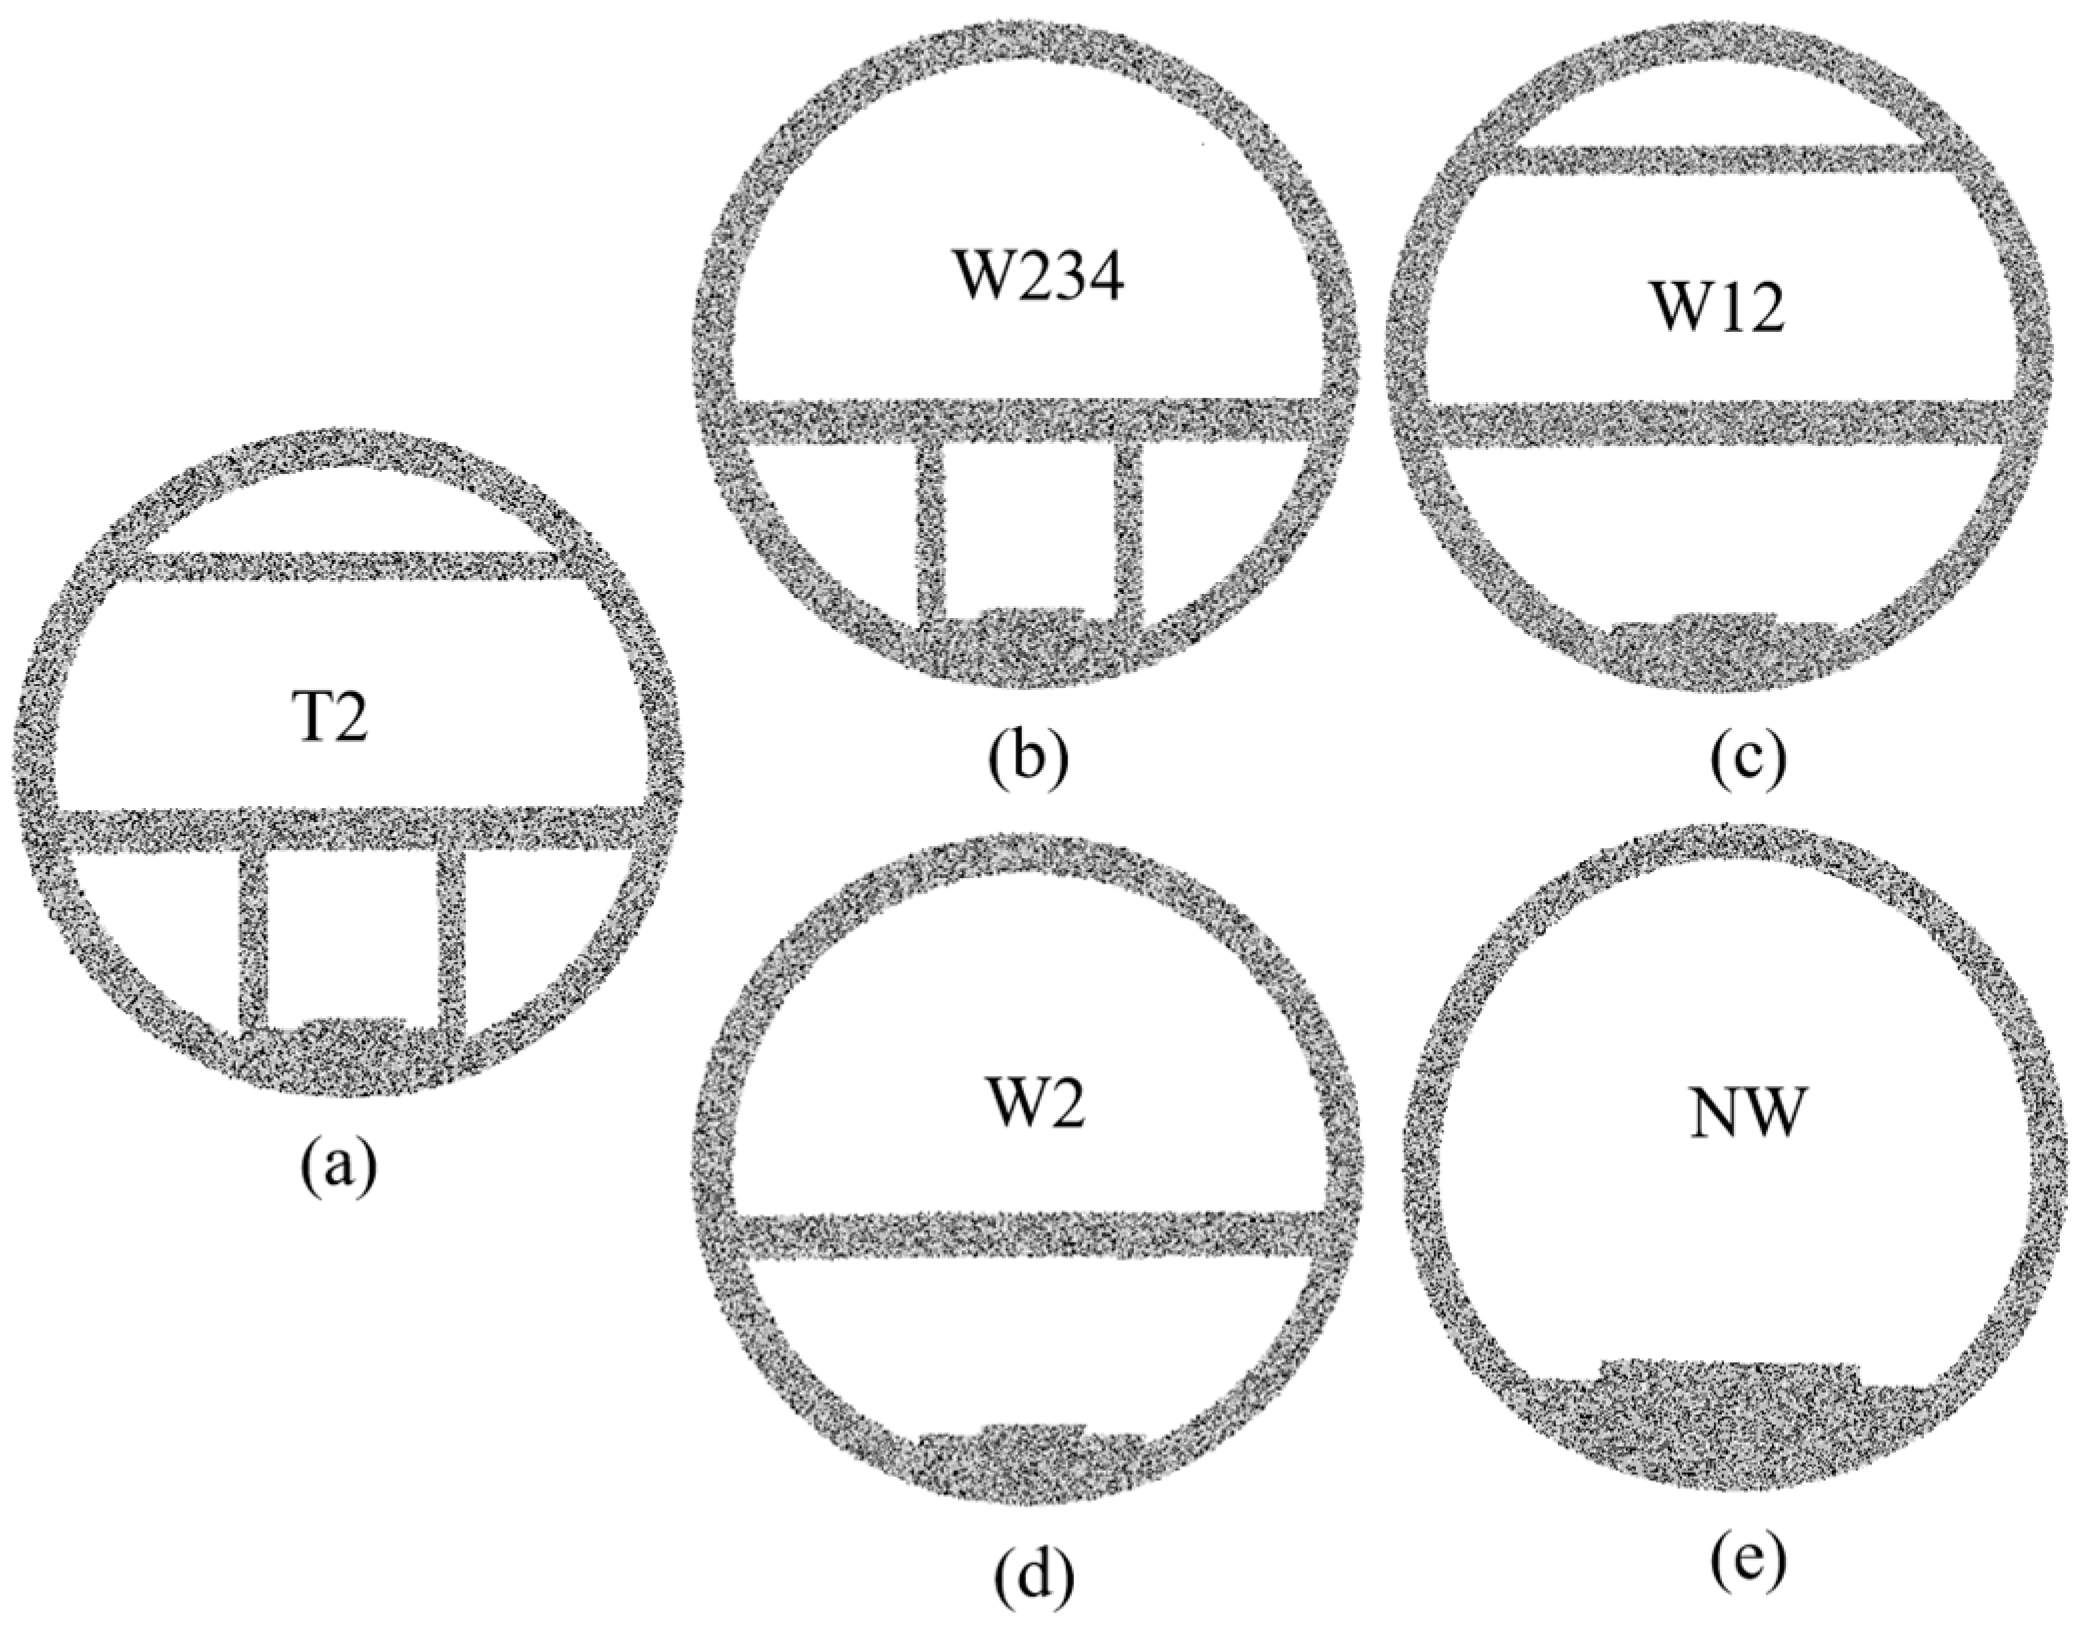
This chapter is divided into three subsections. Firstly, the vibration characteristics of adjacent super-large-diameter tunnels under train-induced vibrations under A1–A5 conditions (Figure 3), focusing on the analysis of displacement and velocity in tunnel sleepers, liners, and surroundings. Secondly, we compare the responses of liners and surroundings in adjacent tunnels under train-induced vibrations when the absolute and relative spacings between super-large and small twin tunnels are identical (Figure 4). Finally, we compare the maximum displacement and velocity of adjacent tunnel liners and surroundings under varying water pressure conditions (74.6 kPa, 149 kPa, 223 kPa) on the top face of super-large twin-tunnel models during train-induced vibrations.

3.1. Inner Walls

Super-large-diameter tunnels contain various inner walls: wall1 denotes the smoke exhaust board, wall2 represents the vehicular lane board, while wall3 and wall4 correspond to the left and right partition walls, respectively. This section focuses on investigating the static–dynamic response levels of these walls on adjacent tunnel sleepers, liners, and surroundings.

3.1.1. Sleeper

The horizontal displacement and velocity patterns of adjacent tunnel structures and surroundings are similar to their vertical counterparts, though the vertical displacement and vertical velocity (DV and VV) values consistently exceed horizontal measurements based on previous comparative studies [18]. Therefore, this study emphasizes the vertical responses of Tunnel 2 structures and surroundings.
Figure 6 illustrates the time–history curves of vertical displacement (DV) and velocity (VV) at the mid-point S3 of Tunnel 2 sleepers under conditions A1–A5. S1 and S5 are the left and right endpoints, and S2 and S4 are the points of application of the train load. As train-induced vibrations propagate, the DV and VV values at S3 exhibit oscillatory behavior under A1–A5 conditions, with the NW condition demonstrating significantly greater DV and VV compared to other conditions.
The DV of point S3 in T2 sleepers is shown in Figure 6a. The minimum and maximum values were −1.52 mm and 0.79 mm, respectively. The absolute values of negative DV for S3 were significantly larger than the positive values, indicating that the sleepers in adjacent tunnels primarily experience downward pressure under train loads.
The differences between maximum and minimum DV values under the five conditions were 1.19 mm (T2), 1.31 mm (W234), 1.3 mm (W12), 1.34 mm (W2), and 2.31 mm (NW). The NW condition exhibited the largest amplitude, with a 94.12% increase compared to T2. At 2.13 s, the DV reached −1.52 mm, showing distinct behavior from other conditions.
The DV trends for W234, W12, W2, and T2 were similar, with nearly overlapping curves. Compared to T2, the amplitude increases for these conditions were 10.08%, 9.24%, and 12.61%, respectively. The absence of wall2 in NW led to its significantly higher DV, confirming that wall2 plays a critical role in mitigating train-induced vibrations and maintaining tunnel stability.
The VV of point S3 in T2 sleepers is shown in Figure 6b. Under T2, W234, W12, and W2, the VV curves overlapped, with maximum positive and negative peaks at 7.78 mm/s and −9.39 mm/s, respectively. In contrast, the NW condition showed an outstanding VV trend, peaking at −21.35 mm/s (t = 2.05 s) and 20.87 mm/s (t = 2.22 s), followed by gradual stabilization.
The differences between maximum and minimum VV values at A1–A5 conditions are 16.17 mm/s (T2), 16.99 mm/s (W234), 16.81 mm/s (W12), 16.95 mm/s (W2), and 42.35 mm/s (NW). Compared to T2, the increases were 5.07%, 3.96%, 4.82%, and 161.90%, respectively. This indicates that the internal walls of super-large tunnels significantly reduce the VV of adjacent tunnel sleepers, with wall2 playing a decisive role in mitigating the dynamic response of Tunnel 2 sleepers.
As shown in Figure 6a,b, the VV curves largely overlap under A1–A4 conditions, while DV exhibits some differences. This indicates that inner walls exert a greater influence on DV than on VV. Adjacent tunnel sleepers oscillate vertically under these vibrations because metro train-induced vibrations induce pronounced dynamic disturbances in closely spaced tunnels. Internal walls in super-large-diameter tunnels markedly reduce the static–dynamic responses of sleepers, with wall2 playing a decisive role. Notably, the NW condition exhibits the most severe sleeper disturbances, significantly exceeding other conditions.
To further investigate the displacement patterns of Tunnel 2 sleepers, Figure 7 compares the DV and VV variations in A1–A5 conditions. The calculation formulas are provided in Equations (9) and (10).
D V = D V m a x D V m i n
V V = V V m a x V V m a x
where DVmax is the maximum value of vertical displacement; DVmin is the minimum value of vertical displacement; VVmax is the maximum value of vertical velocity; and VVmin is the minimum value of vertical velocity.
The DV variations at monitoring points of Tunnel 2 sleepers are shown in Figure 7a. The maximum and minimum DV variations are 2.36 mm and 1.12 mm, respectively. Under the NW condition, DV variations (2.27–2.36 mm) significantly exceed those of the other four conditions (1.12–1.43 mm), further confirming the decisive role of wall2 in reducing DV. Comparing W12 and W234, the differences between S1-S5 monitoring points are 0.02, 0.02, 0.02, 0.03, and 0.03 mm, respectively. The slightly higher DV variations in W234 indicate that horizontal wall1 contributes more to DV reduction than vertical wall3 and wall4.
The VV variations at monitoring points are shown in Figure 7b. The VV curves nearly overlap (15.40–17.85 mm/s) under A1–A4 conditions, while NW exhibits significantly higher values (41.61–42.99 mm/s). Compared to T2, NW shows VV variation increases of 152.97% (S1), 155.48% (S2), 161.10% (S3), 166.75% (S4), and 170.13% (S5). This underscores wall2’s dominant role in suppressing VV, while wall1, wall3, and wall4 have negligible effects.
Compared to Figure 7a,b, point S1 exhibits the largest DV and VV values, while point S5 shows the smallest under A1–A5 conditions. This indicates that sleeper regions closer to T1 experience greater vertical vibration impacts. The effectiveness of internal walls in reducing DV and VV for Tunnel 2 sleepers is ranked as wall2 > wall1 > wall3 = wall4, with wall2 playing a decisive role.
As shown in Figure 6 and Figure 7, adjacent tunnel sleepers oscillate vertically with train loads under metro train-induced vibrations. The DV and VV of Tunnel 2 sleepers under NW condition are significantly higher than other conditions, confirming that internal walls markedly reduce both static and dynamic responses. The stabilizing effect of Tunnel 2 internal walls follows the hierarchy: wall2 > wall1 > wall3 + wall4. Wall2 is critical for suppressing the static–dynamic characteristics of Tunnel 2 sleepers.

3.1.2. Liner

As shown in Figure 8, the maximum resultant displacements (DR) and velocities (VR) values at four monitoring points (0°, 90°, 180°, and 270°) of the Tunnel 2 liner vary significantly across the A1–A5 conditions. DR and VR are calculated by Equations (11) and (12).
D R = D h 2 + D v 2
V R = V h 2 + V v 2
where DH is the maximum horizontal displacement; DV is the maximum vertical displacement; VH is the maximum horizontal velocity; and VV is the maximum vertical velocity.
As shown in Figure 8a, the maximum DR values at the 0°, 90°, 180°, and 270° monitoring points of the Tunnel 2 liner vary significantly under A1–A5 conditions. DR magnitudes follow the order 180° > 90° > 270° > 0° across all conditions, reflecting distinct vibration impacts at each angle. The largest DR consistently occurs at 180° (closest to T1), while the smallest DR is observed at 0° (farthest from T1). DR attenuates progressively from the vibration source (180°) toward the opposite side (0°), demonstrating a clear distance-dependent decay pattern. Notably, DR at 270° is slightly smaller than at 90°, indicating that deeper burial depth enhances structural restraint from the surroundings, thereby improving the liner’s resistance to disturbances and reducing displacements. This highlights two key factors influencing DR: (1) proximity to the vibration source and (2) burial depth, with deeper sections benefiting from stronger soil support to mitigate displacement.
The maximum VR values of the Tunnel 2 liner are shown in Figure 8b. Under conditions with internal walls, the VR trends align with the DR patterns in Figure 8a, following the order 180° > 90° > 270° > 0°, further confirming that VR increases with proximity to the vibration source (T1). However, under the NW condition, the VR ranking shifts to 180° > 270° > 0° > 90°. This anomaly likely stems from the reduced structural stability of the liner without internal walls, making it more susceptible to vibrations from T1 and resulting in markedly different velocity patterns compared to wall-equipped conditions.
Under train-induced vibrations, both DR and VR at the four monitoring points of Tunnel 2 liner correlate strongly with distance from the vibration source and burial depth. The NW condition exhibits distinct DR and VR patterns (e.g., reversed ranking at 270° and 0°) and significantly higher magnitudes compared to other conditions, emphasizing the critical role of internal walls in stabilizing dynamic responses.

3.1.3. Surroundings

The surroundings play a critical role in supporting tunnel structures to maintain stability under dynamic loads. Analyzing the dynamic characteristics of the surroundings provides essential insights to complement the dynamic behavior of Tunnel 2 liners.
Figure 9 shows the DR and VR of Tunnel 2 surroundings under A1–A5 conditions. Figure 9a compares the maximum DR values of the T2 surroundings. The DR magnitudes at four monitoring points follow the order 180° > 90° > 270° > 0°, consistent with the trends observed in Figure 8a. This confirms that the DR of surroundings is similarly influenced by propagation distance from the vibration source and burial depth.
Figure 8a and Figure 9a reveal minimal differences in DR between Tunnel 2 liners and surroundings across A1–A5 conditions. Notably, the DR values at four angles (0°, 90°, 180°, 270°) are identical for both liners and surroundings under W2 and NW conditions, indicating that the displacement patterns of tunnel structures and surroundings are closely aligned under metro train-induced vibrations, signifying a structurally safe state.
Comparing T2 and NW conditions, the differences of DR in surroundings at 180° and 0° are 0.65 mm and 0.71 mm under the T2 condition are increased by 48.15% and 151.06% when compared to the NW condition. These results demonstrate that internal walls significantly reduce DR in surroundings, with effectiveness varying by proximity to the vibration source.
Figure 9b compares the maximum VR values of the Tunnel 2 surroundings under A1–A5 conditions. Similar to the DR trends in Figure 9a and the liner VR patterns in Figure 8b, the VR magnitudes under A1–A5 conditions follow 180° > 90° > 270° > 0° which is consistence with the DR trends in Figure 9a and the liner VR patterns in Figure 8b, confirming that VR increases with proximity to the vibration source, consistent with findings from liner analysis.
Under the NW condition, the VR ranking shifts to 180° > 0° > 270° > 90°, deviating from the established patterns observed in wall-equipped conditions. This indicates that the vibration transmission law identified in Figure 8b does not apply to NW condition.
Compared to the most stable condition T2, the VR differences in surroundings at 180° and 0° under NW condition are 11.79 mm/s and 15.03 mm/s, increased by 93.57% and 230.30% when compared to the value in the most stable condition T2. This indicates that the absence of internal walls (NW) leads to significantly amplified and complex dynamic responses in both liners and surroundings under dynamic loads, further proving the critical role of internal walls in stabilizing the surroundings.
As shown in Figure 9a, b, the DR and VR patterns in the surroundings at four monitoring points align closely with those of the liners, governed by their position, proximity to the vibration source, and burial depth. Additionally, the T2 condition exhibits the highest stability, and the internal walls significantly reduce the DR and VR of the surroundings when comparing T2 and NW conditions. Notably, wall2 contributes most prominently to maintaining the stability of the surroundings.
Figure 10 shows the coordination of the surroundings at various angles of Tunnel 2 under T2 and NW conditions. Coordination is defined as the average number of particles in contact with a central particle within a measurement circle, which can reflect structural stability. A higher coordination means greater stability. Each tunnel is monitored via eight measurement circles (0°, 45°, 90°, 135°, 180°, 215°, 270°, and 315°) to assess coordination at different angles. Changes in the coordination of Tunnel 2 surroundings indicate the disturbance level induced by train-induced vibrations from the adjacent tunnel.
Under the NW condition, coordination variations at all monitoring points are greater than those under T2. The most significant coordination changes occur at the vault (90°), followed by 180°, indicating that coordination changes in the Tunnel 2 surroundings correlate with monitoring distance and position. At the vault, train-induced vibrations cause particles to slide downward along the liners, leading to a decrease in coordination and stability, which also shows that the vault is the focus of dynamic characteristics.
Overall, the Tunnel 2 surroundings exhibit greater fluctuations in coordination under NW condition due to the absence of internal walls when compared to the T2 condition. Under T2 condition, the surroundings with greater burial depth demonstrate higher coordination, which remains nearly constant throughout the testing period. This indicates that the lower-right region of the Tunnel 2 surroundings is less affected by vibrations and maintains greater stability.
Combined with Figure 9 and Figure 10, the static–dynamic responses of Tunnel 2 surroundings are influenced by the position of liners and surroundings, proximity to the vibration source, and burial depth. Internal walls enhance surroundings stability, while coordination is governed by distance from the vibration source and burial depth. The T2 condition demonstrates higher and more stable coordination, highlighting the structural benefits of internal walls.

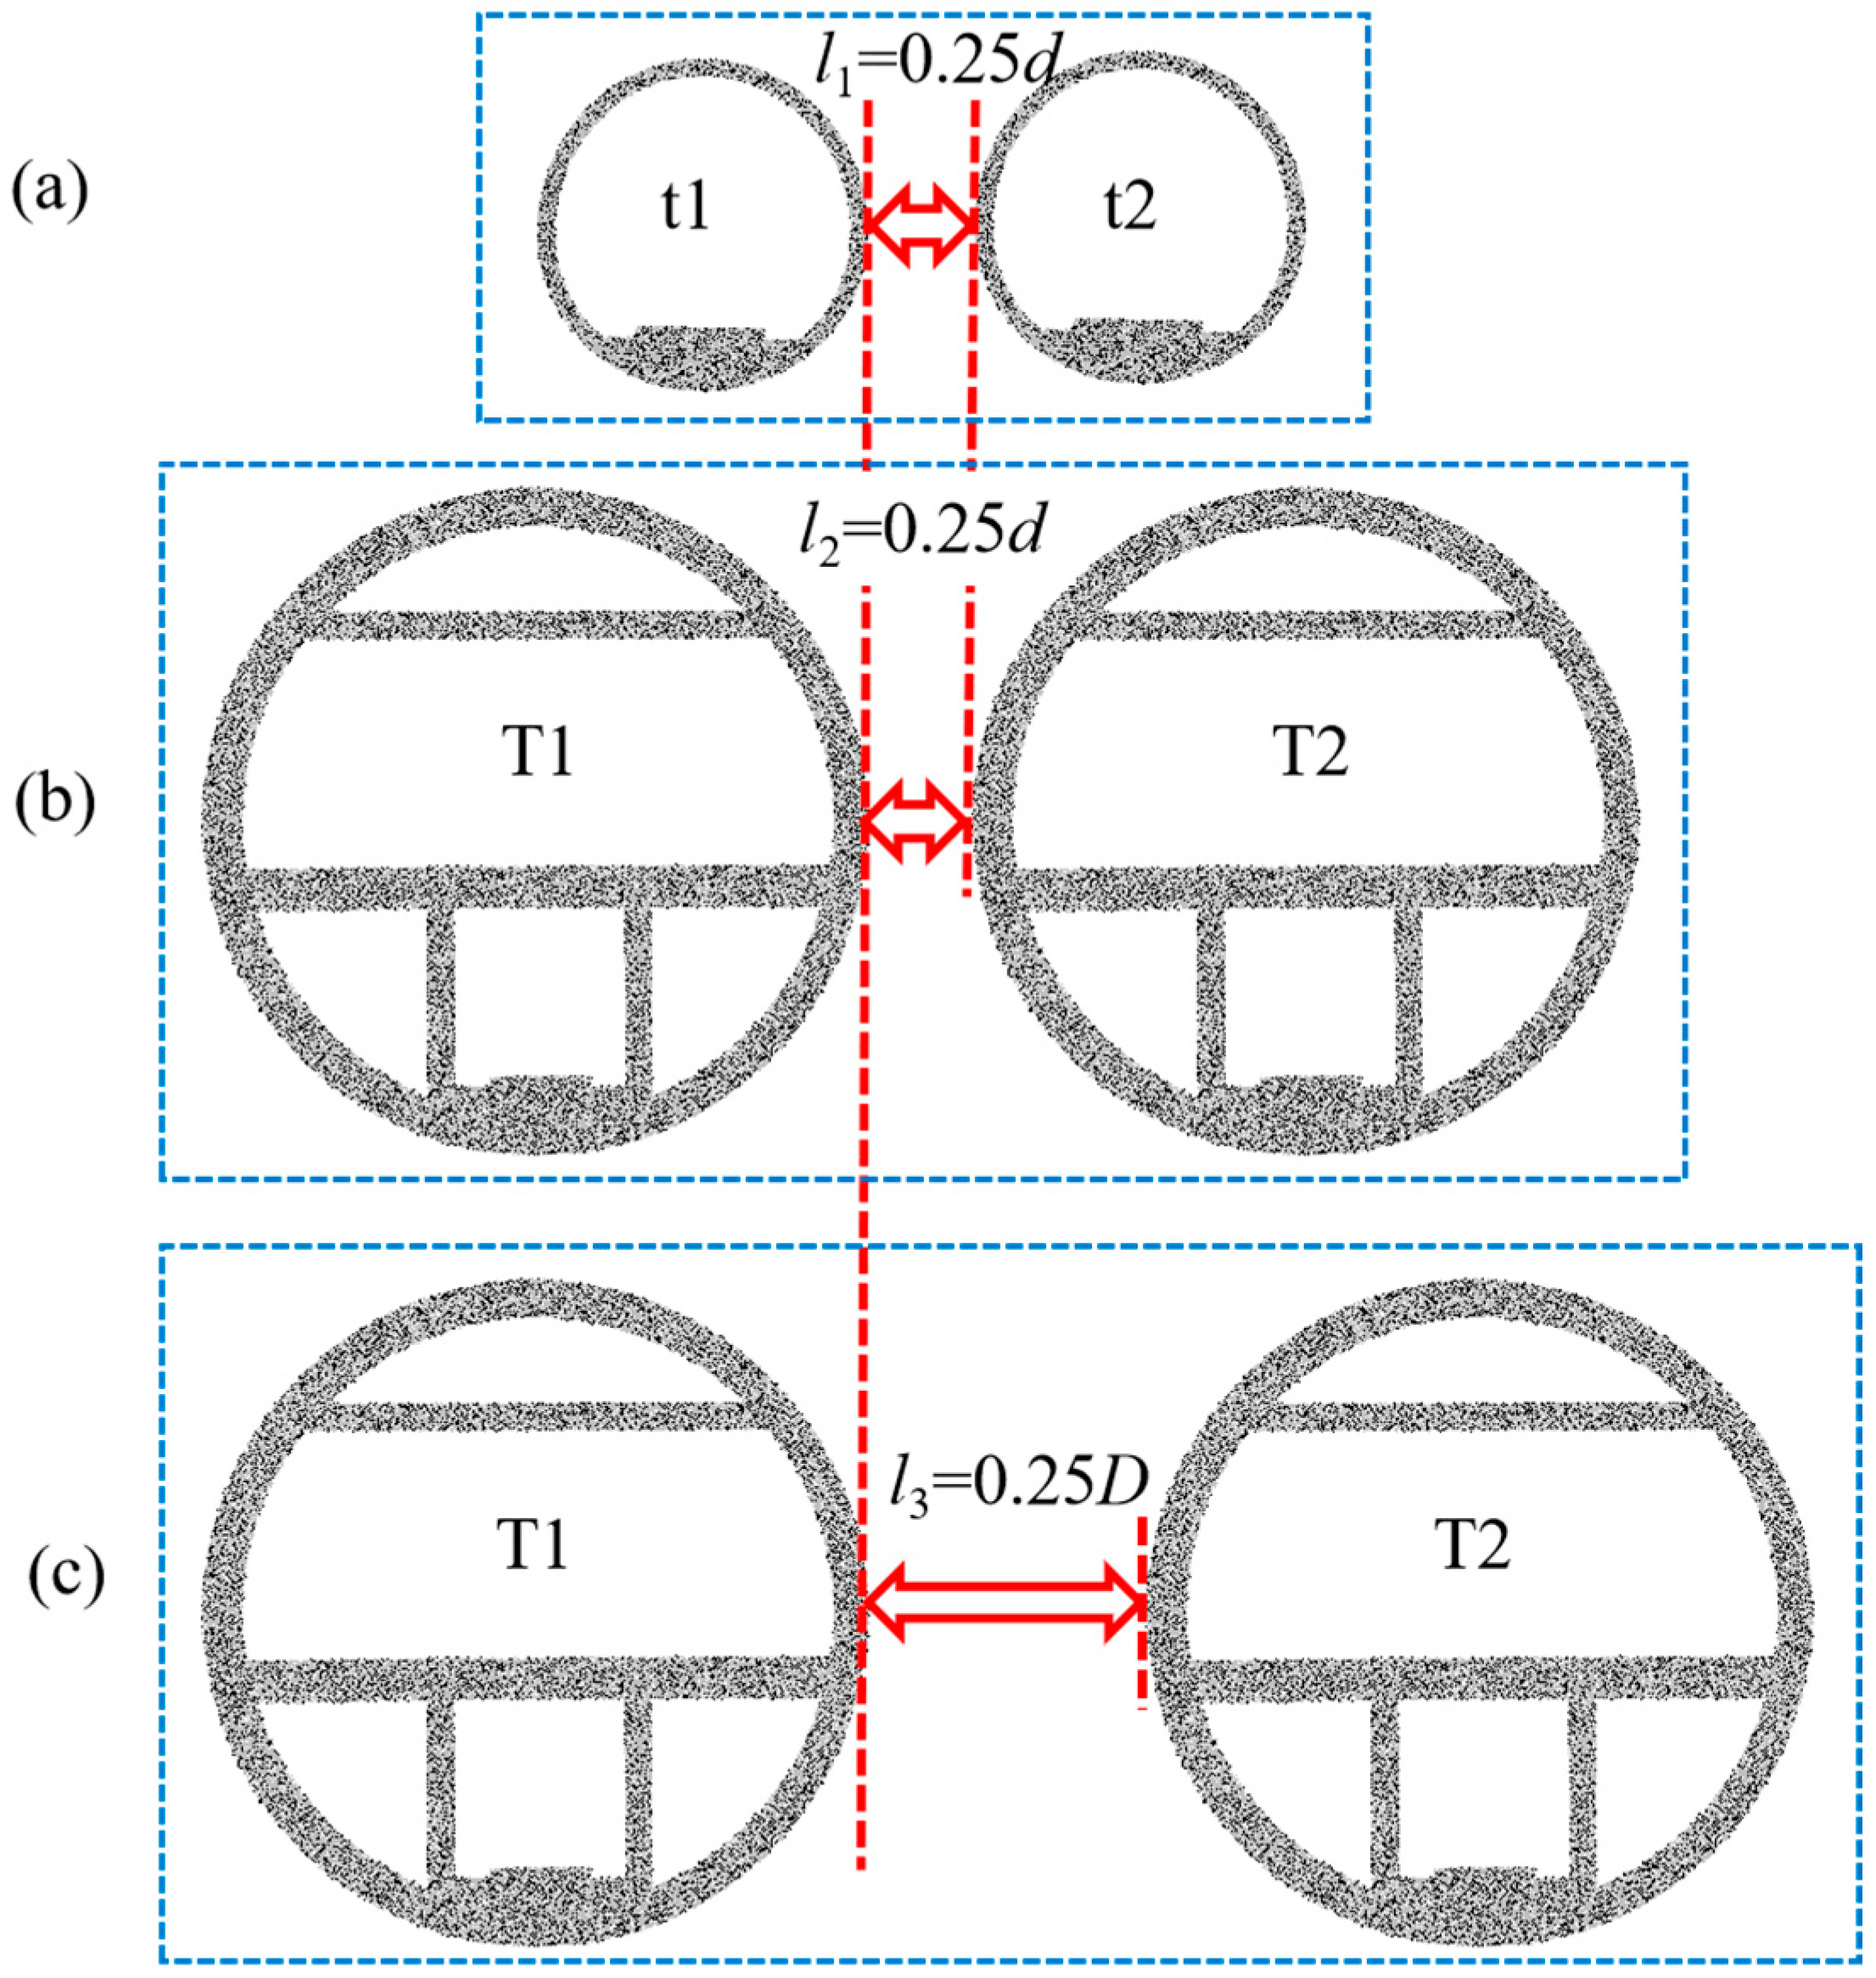
3.2. Absolute and Relative Spacing

It is well-known that the spacing between parallel twin tunnels significantly influences the dynamic characteristics of the adjacent tunnel [32,33,34]. Figure 11 compares the DR and VR of adjacent tunnel liners and surroundings under varying spacing conditions to investigate the effects of absolute and relative spacing.
As shown in Figure 11a, the maximum and minimum differences of DR of liners and surroundings under B1–B3 conditions occur at 180° (closest to T1), confirming that proximity to the vibration source dominates displacement patterns. The maximum liner-surroundings DR differences for B1, B2, and B3 are 0.49 mm, 0.33 mm, and 0.12 mm. Such discrepancies possibly destabilize the surroundings due to insufficient structural support.
The liners DR ranking is as follows: B2 > B1 > B3. For the surroundings, all other monitoring points align with the same ranking of the liners except at the vault (90°), where the DR of the small-diameter tunnels is slightly lower than that of the 0.25 D super-large-diameter tunnels. This indicates that super-large-diameter tunnels exhibit greater static–dynamic responses under the same absolute spacing while showing slightly lower responses under relative spacing equivalence. Additionally, the granular nature of the surroundings leads to distinct displacement patterns at the vault compared to other monitoring points, necessitating focused stability assessments in this region.
As shown in Figure 11b, the VR of liners and surroundings for the 0.25 D super-large-diameter twin tunnels (B3) is significantly smaller than those under B1 and B2 conditions. This indicates that the dynamic characteristics of super-large-diameter tunnels with equivalent relative spacing (B3) are markedly lower compared to small-diameter tunnels (B1) and super-large-diameter tunnels with 0.25 d (B2). Additionally, the VR of surroundings and liners align closely across all monitoring points, suggesting that the surroundings effectively support the tunnel structure, placing the super-large-diameter tunnel in a safer state.
Comparing B1 and B2 conditions, significant VR differences exist between surroundings and liners. In the 45–135°, the VR in surroundings is smaller than the value in liners, while in the 180–270°, the VR in surroundings exceeds the value in liners. This opposing dynamic behavior in the upper-right and lower-left regions of Tunnel 2 disrupts the support mechanism between surroundings and liners, potentially leading to liner cracking, leakage, or instability.
The VR in liners for super-large and small-diameter tunnels overlap at most monitoring points, with minor differences at 0°, 45°, and 315°. However, the VR in surroundings exhibits substantial disparities. In the 0–135° interval (upper half), super-large-diameter tunnels (B2) show higher VR than small-diameter tunnels (B1), while in the 180–270° interval (lower-left corner), small-diameter tunnels (B1) exhibit higher VR. This demonstrates that under equivalent absolute spacing, liner displacements are comparable between super-large and small-diameter tunnels, but the VR differences in surroundings are pronounced, highlighting distinct dynamic behaviors in super-large-diameter tunnel surroundings that warrant further investigation.
As shown in Figure 11a,b, the DR and VR of liners and surroundings follow the order B2 > B1 > B3. For twin tunnels with equivalent relative spacing, super-large-diameter tunnels exhibit smaller static–dynamic responses in both liners and surroundings compared to small-diameter tunnels, likely attributed to the vibration-damping effect of internal walls discussed in Section 3.1. In contrast, under equivalent absolute spacing, super-large-diameter tunnels demonstrate significantly enhanced dynamic responses, accompanied by increased discrepancies in displacements and velocities between liners and surroundings. Regardless of whether absolute or relative spacing is maintained, the static–dynamic characteristics of super-large-diameter tunnel liners and surroundings fundamentally differ from those of small-diameter tunnels. This highlights the complex interactions between structural and surroundings in super-large-diameter tunnels, necessitating further research to address their unique challenges in stability and dynamic performance.

3.3. Water Pressure

Under train-induced vibrations, the surrounding water pressure of super-large-diameter twin tunnels exerts varying influences on adjacent tunnel liners and surroundings. This section investigates the static–dynamic responses of liners and surroundings under different water pressures (P1 = 74.6 kPa, P2 = 149 kPa, P3 = 223 kPa).
Figure 12a compares the maximum DR values under different water pressures (C1–C3 conditions). The DR of liners and surroundings at C2 condition is slightly smaller than at C1 condition, while DR at C3 condition exceeds that at C2 condition. This suggests that moderate water pressure (P2 = 149 kPa) can mitigate train-induced vibrations in adjacent tunnels, whereas excessive water pressure (P3 = 223 kPa) possibly amplifies displacements.
Figure 12b compares the maximum VR values. Across all monitoring points (0–315°), VR initially increases and then decreases, peaking at 180° and 225°. The higher VR in the central tunnel region (90–270°) correlates with proximity to the vibration source. From 0° to 180°, the liner VR exceeds the surroundings VR, while the reverse occurs from 180 to 315°, indicating that the distance to the vibration source significantly influences velocity distributions.
As shown in Figure 12a, b, the DR and VR of liners and surroundings remain similar for most monitoring points under C1–C3 conditions, with only minor variations observed at specific points such as 180° and 225°. The maximum displacement occurs at 180°, while peak velocity appears at 225°, indicating a spatial shift between the locations. Both displacement and velocity patterns are closely tied to proximity to the vibration source. Moderate water pressure (P2 = 149 kPa) effectively reduces the static–dynamic responses of adjacent tunnel liners and surroundings under train-induced vibrations.
Figure 13a compares the average coordination of the surroundings. The results show significantly lower coordination under the C1 condition compared to the C2 and C3 conditions. This demonstrates that increasing water pressure from 74.6 kPa to 149 kPa substantially enhances surroundings stability, particularly in the central tunnel region, where coordination at 180° increases by up to 9.81%. Under the C3 condition, coordination improvements over the C2 condition are marginal, indicating comparable stability levels between these two pressure conditions.
The coordination variation rate is defined as in Equation (13), and its change rate of the surroundings is shown in Figure 13b. Under the C3 condition, the variation rate reaches its maximum at 180°, indicating significant instability in this region. The higher variation rate at the C3 condition reflects reduced stability in the tunnel and surroundings due to excessive water pressure, which increases stress in the twin tunnel structure and compromises stability.
A = M 1 M 2 M 1 × 100 %
where M1 is the maximum coordination, and M2 is the minimum coordination.
As shown in Figure 13a,b, the C2 condition exhibits the highest stability among the three conditions. The central region of the twin tunnels (particularly at 180°) experiences the greatest impact. Optimal water pressure (P2 = 149 kPa) effectively enhances the stability of super-large-diameter tunnels.
The displacements and velocities at the vault of super-large-diameter tunnels are significantly larger and exhibit distinct patterns compared to other monitoring points, necessitating focused investigation from Figure 11a and Figure 12a. Figure 14a compares the vertical strain at the vault under different water pressures. The vertical strain curves oscillate with metro train-induced vibrations but remain positive, indicating vertical elongation of particles and soil loosening. This phenomenon arises because the surroundings at the vault tend to slide laterally due to the structural features of the liners under vibrations. Under C2 and C3 conditions, the vertical strains at the tunnel crown are similar and smaller than those at the C1 condition, likely due to higher confining pressure in this region, which restricts particle movement and reduces strain.
Figure 14b compares the maximum and minimum values of vertical strain at the vault. Under C1–C3 conditions, the maximum vertical strain differences occur at 90° (0.015%, 0.014%, and 0.014%), while the minimum differences appear at 180° (0.004%, 0.002%, and 0.002%). This is likely due to the structural constraints of the twin tunnels at 180°, which limit lateral particle movement, resulting in minimal vertical strain. At 135°, strain differences are slightly smaller than at 90°, possibly because this region is closer to both the vibration source (T1) and the vault. These points are experiencing stronger disturbances and weaker resistance to sliding, leading to higher vertical strain.
As shown in Figure 14a,b, the structural features of the vault liners cause significant positive vertical strain in the surroundings. Larger differences in maximum-minimum strains at 90° and 135° indicate lower stability in these regions.
As shown in Figure 12, Figure 13 and Figure 14, increasing water pressure from C1 to C2 condition reduces the static–dynamic responses in super-large-diameter tunnels reduced when water pressure increase from C1 to C2 condition, while the static–dynamic responses increase when the water pressure further increases to C3 condition. Optimal water pressure (P2 = 149 kPa) is critical for maintaining stability. Displacement and velocity in the surroundings depend on proximity to the vibration source, with the central tunnel region (especially 180°) most affected. Vertical strain peaks at 90° and 135° require special attention due to their instability.

4. Conclusions

This study conducted a parametric analysis of the static–dynamic characteristics of adjacent tunnels for super-large-diameter twin tunnels under train-induced vibrations using the DEM. Three sets of models were developed to investigate the effects of internal walls, absolute and relative spacing, and water pressure on the static–dynamic responses of adjacent tunnel structures and surroundings. The main conclusions are as follows:
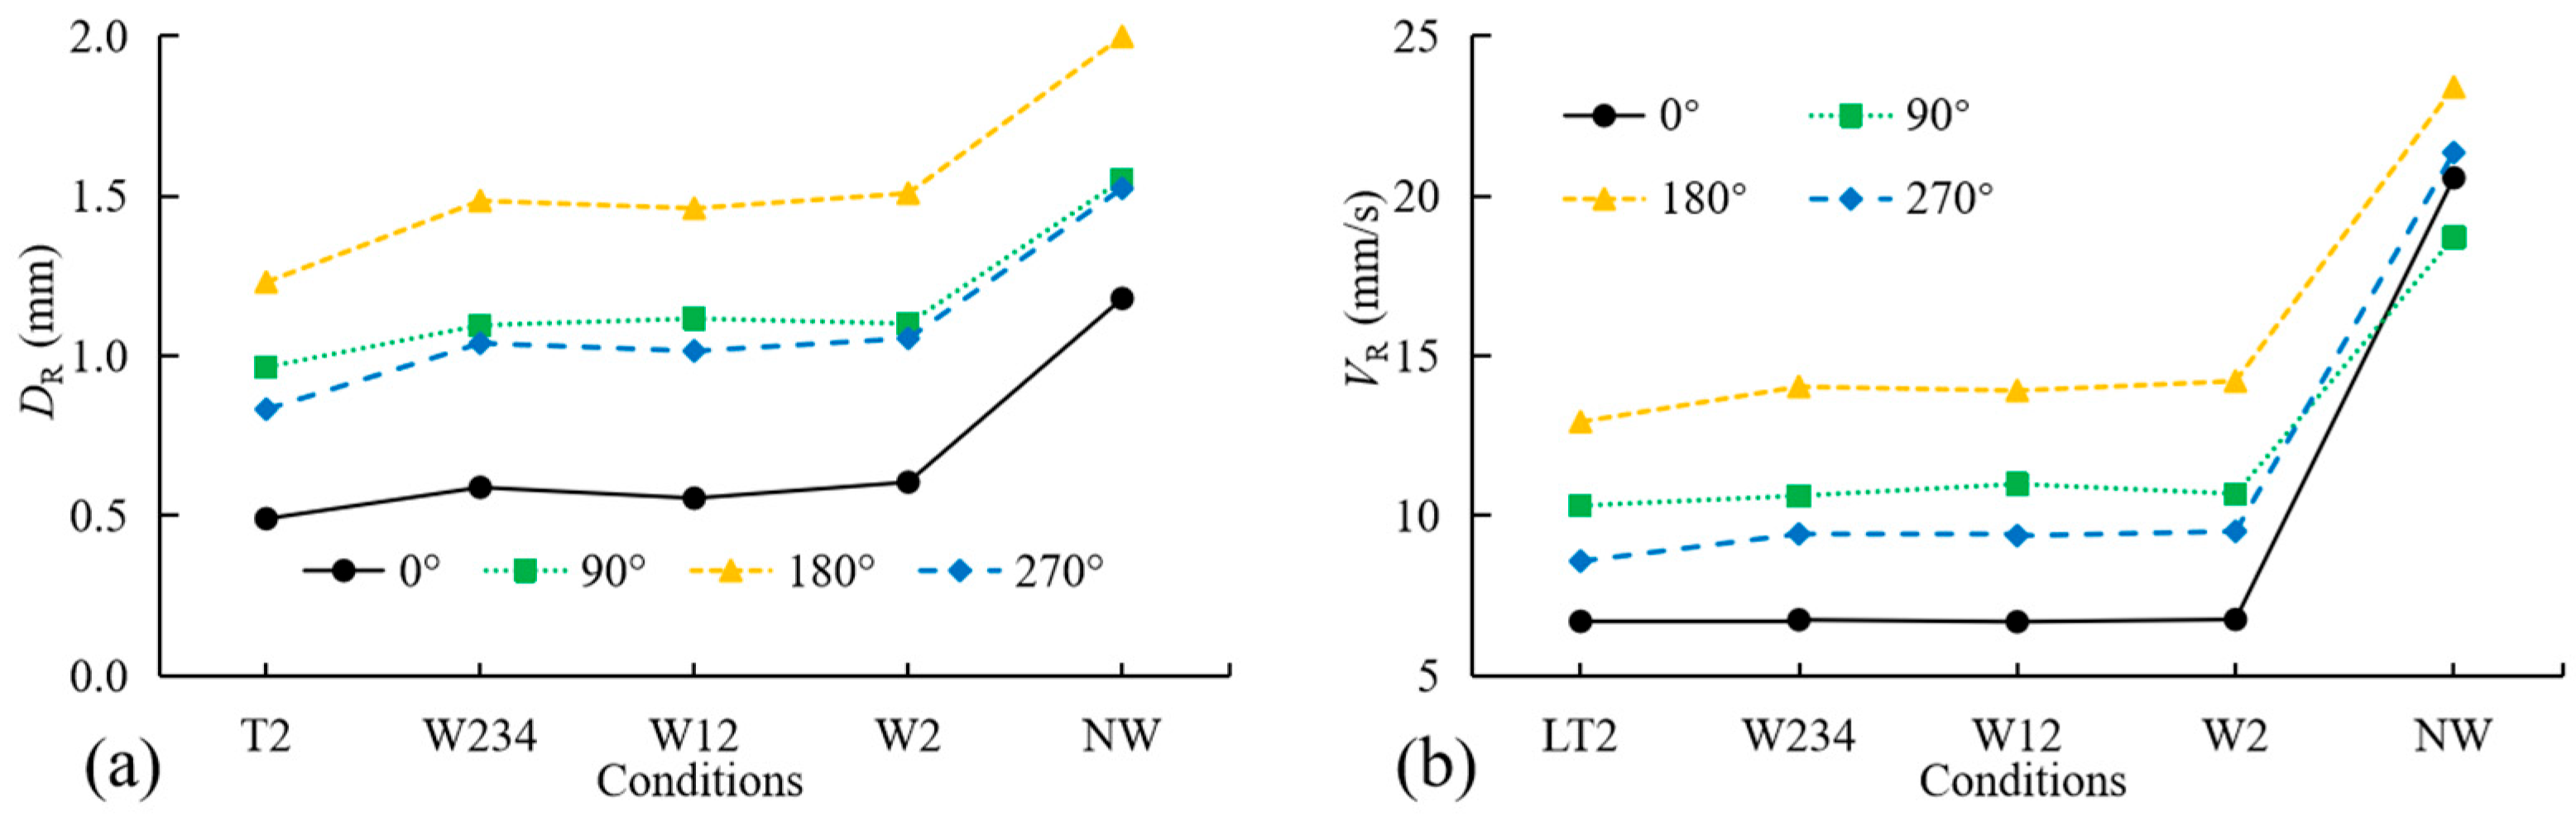
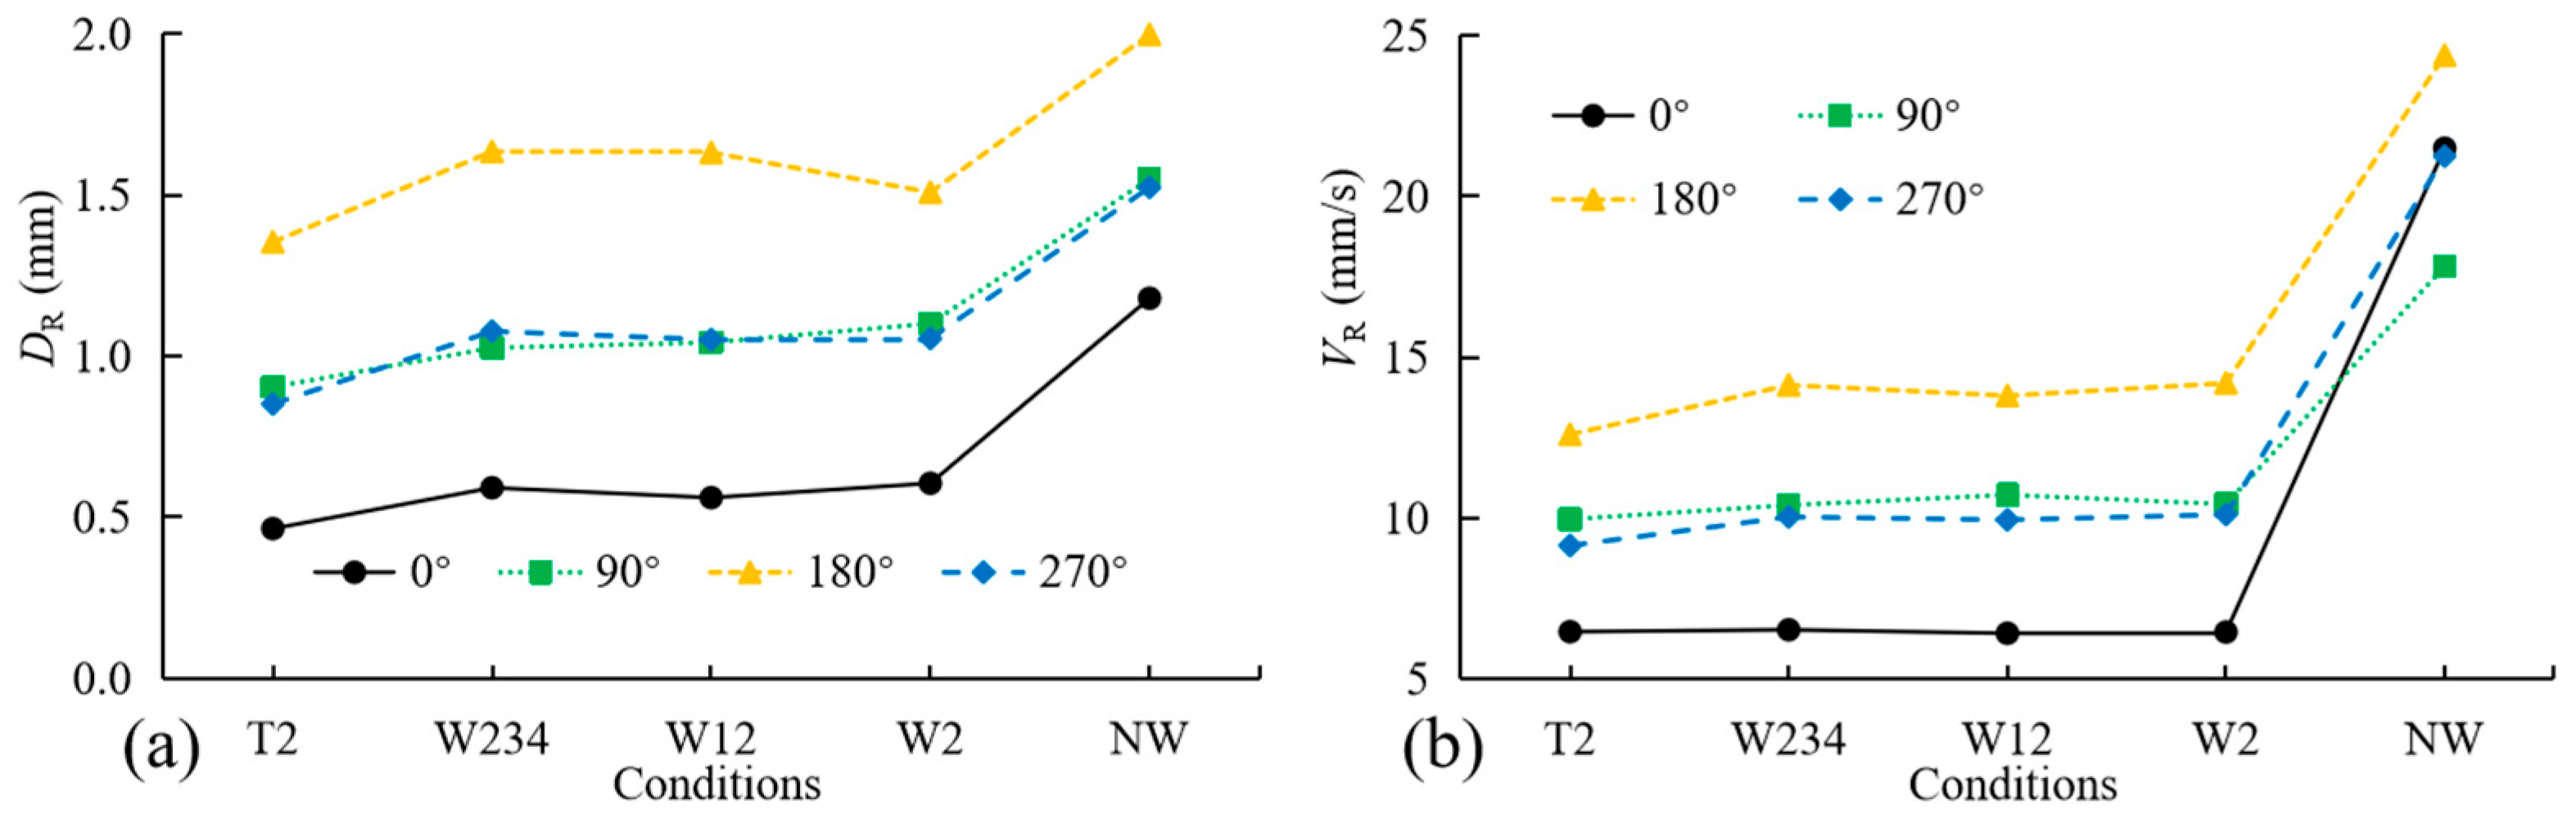
  • The NW condition (no internal walls) of T2 exhibits significantly greater static–dynamic responses in both liners and surroundings compared to other conditions. Internal walls in super-large tunnels markedly reduce these responses, with their stabilizing effectiveness ranked as wall2 > wall1 > wall3 = wall4. Wall2 plays a particularly decisive role. DR and VR in liners and surroundings correlate strongly with the burial depth and distance to the vibration source.
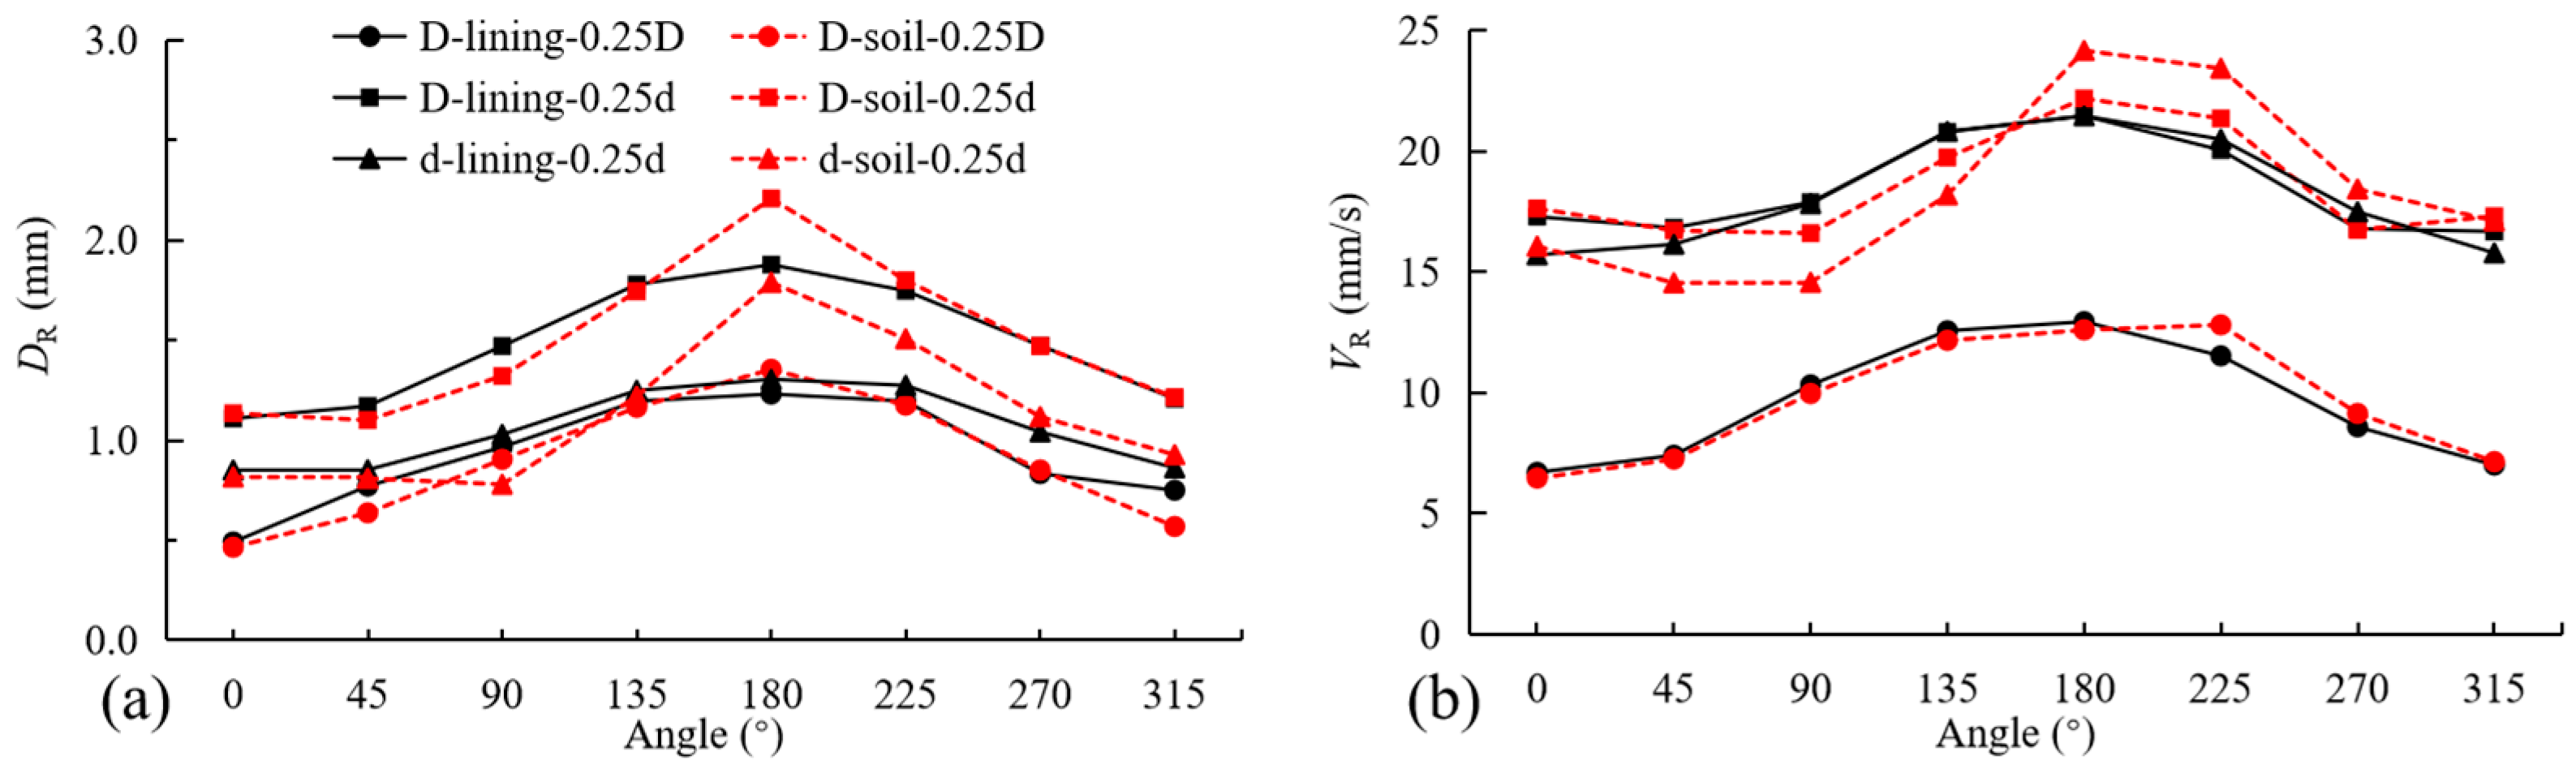
  • Under equivalent relative spacing, super-large twin tunnels show smaller static–dynamic responses in liners and surroundings than small twin tunnels. However, under equivalent absolute spacing, super-large twin tunnels exhibit significantly enhanced dynamic responses and larger discrepancies in liner and surroundings displacements and velocities. The static–dynamic characteristics of super-large twin tunnels fundamentally differ from those of small twin tunnels under any spacing.
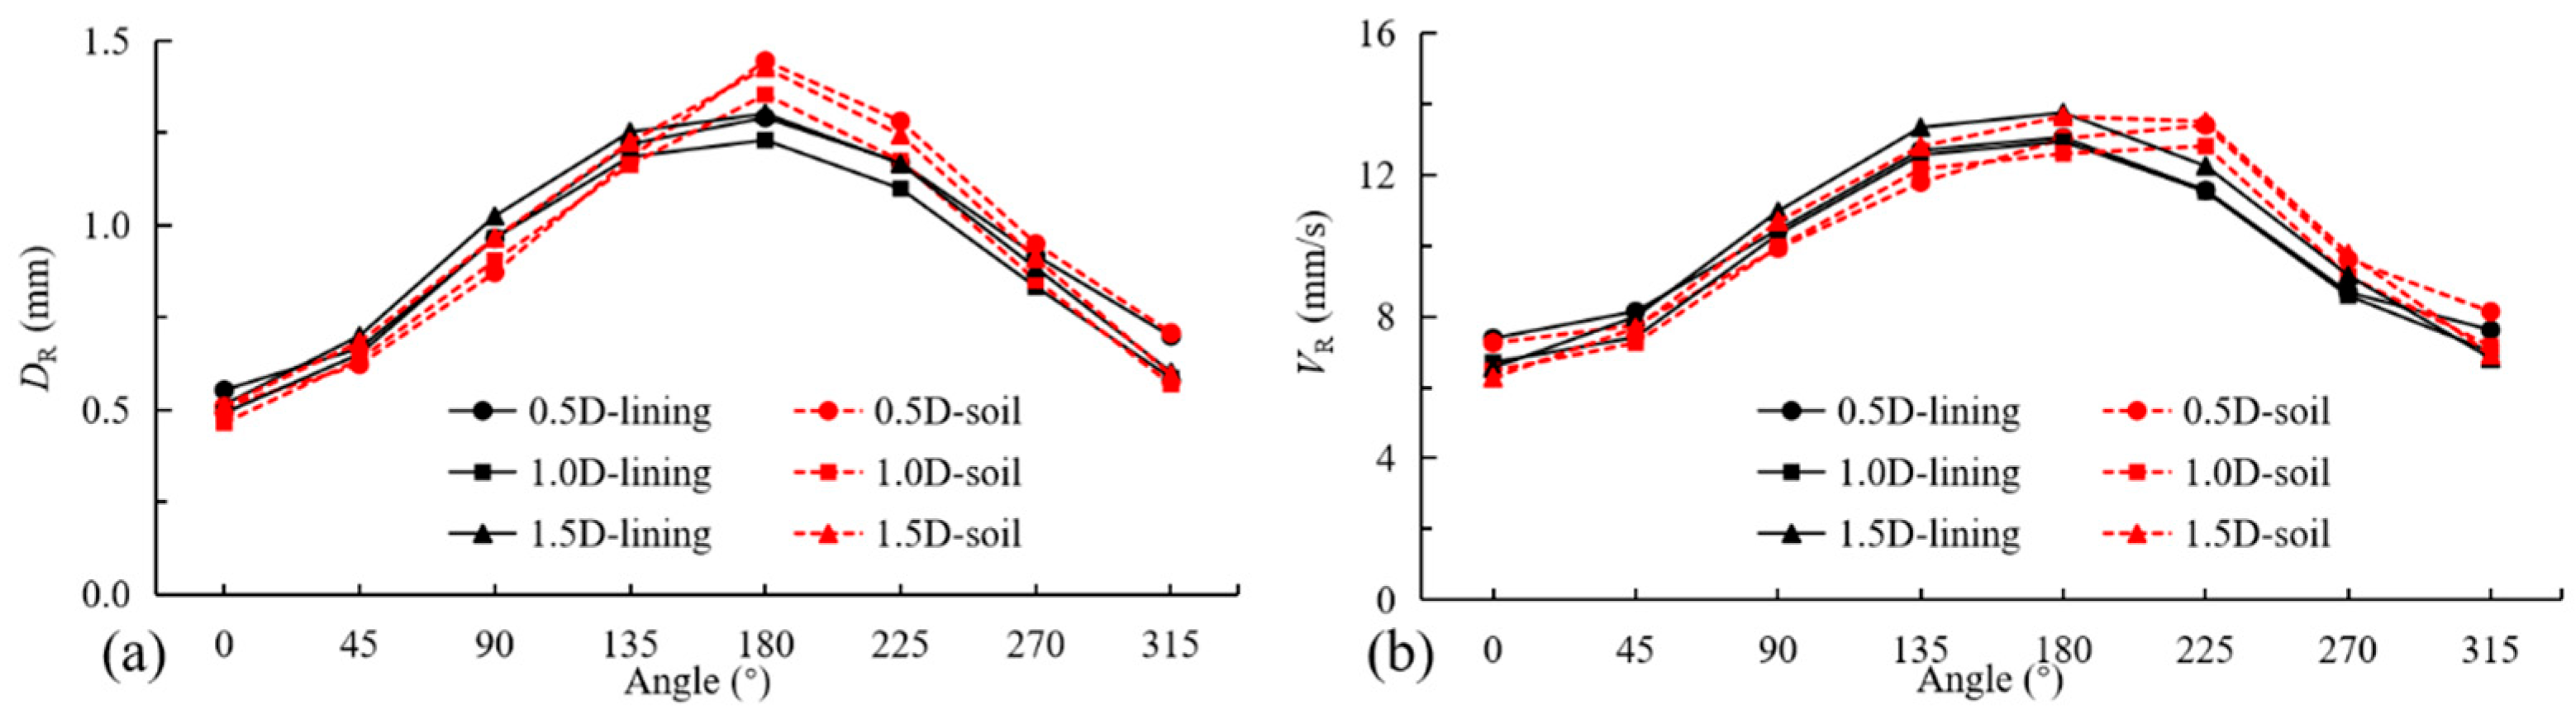
  • Optimal water pressure (P2 = 149 kPa) effectively suppresses displacements and velocities in liners and surroundings, while excessive pressure (P3 = 223 kPa) amplifies static–dynamic responses. Critical monitoring points requiring attention include the central tunnel region (180°), vault (90°), and 135°, where responses are most pronounced due to proximity to the vibration source and the surroundings easily sliding.
The static–dynamic characteristics of super-large-diameter twin tunnel liners and surroundings differ fundamentally from those of small twin tunnels, highlighting the complex interactions between their liners and surroundings. Future research will employ the scale model to explore the dynamic behavior of super-large twin tunnels under train-induced vibrations.

Author Contributions

Conceptualization, L.W. and X.B.; methodology, L.W.; software, Z.C.; validation, L.W., X.B. and Z.C.; formal analysis, L.W.; investigation, X.B.; resources, H.G.; data curation, H.G.; writing—original draft preparation, Z.C.; writing—review and editing, L.W.; visualization, Z.C. and J.W.; supervision, H.G.; project administration, X.B.; funding acquisition, X.B. All authors have read and agreed to the published version of the manuscript.

Funding

National Natural Science Foundation of China (52208403, 52478359) and the Scientific Research Fund of Wuhan Institute of Technology (K202221).

Institutional Review Board Statement

Not applicable.

Informed Consent Statement

Not applicable.

Data Availability Statement

The original contributions presented in this study are included in the article. Further inquiries can be directed to the corresponding author.

Conflicts of Interest

The authors declare no conflicts of interest.

Nomenclature

DDiameter of the large and super-large twin tunnels
dDiameter of the small twin tunnels
t1First small tunnel
t2Second small tunnel
T1First super-large-diameter tunnel
T2/Tunnel 2Second super-large-diameter tunnel
DVVertical displacement
DRResultant displacement
VVVertical velocity
VRResultant velocity
wall1Smoke exhaust board
wall2Vehicular lane board
wall3Left partition wall
wall4Right partition wall
DEMDiscrete Element Method
l, l1, l2, l3Spacing between twin tunnels

References

  1. Yang, W.; Yang, L.; Liang, Y.; Qian, Z.; Guo, W.; He, C.; Zhou, Y. Study on the Dynamic Response Characteristics of Road-metro Tunnels and Surrounding Soil under Train Vibration Loads. Chin. J. Rock Mech. Eng. 2022, 41, 1659–1670. [Google Scholar] [CrossRef]
  2. Yu, T.; Ying, K.; Wang, J.; Yao, Z.; Fang, Y. Stability Evaluation of the Sequential Excavation Method of Large-Section Double-Arch Tunnel in Fly Ash Accumulation Stratum Through Physical Model. Tunn. Undergr. Space Technol. 2025, 158, 106391. [Google Scholar] [CrossRef]
  3. Heidary, R.; Esmaeili, M.; Nik, M.G. Effects of Train Operational Parameters on Ground-Borne Vibrations Induced by Twin Metro Tunnels. Int. J. Rail Transp. 2020, 9, 144–156. [Google Scholar] [CrossRef]
  4. Zhou, Y.; Yang, W.; Yao, C.; Xu, Z. Centrifuge Modelling of the Dynamic Response of Twin Tunnels Under Train-Induced Vibration Load. Soil Dyn. Earthq. Eng. 2024, 185, 108908. [Google Scholar] [CrossRef]
  5. Li, L.; Yao, A. Investigation on Response of Site of Typical Soil–Rock Composite Strata in Changchun Induced by Shield Construction of Parallel Twin Tunnels. Appl. Sci. 2024, 14, 500. [Google Scholar] [CrossRef]
  6. Pang, Y.; Lin, H.; Cao, P.; Meng, G. The Influence of Overlying High-Speed Rail Dynamic Loads on the Stability of Shield Tunnel Faces During Excavation. Appl. Sci. 2025, 15, 2567. [Google Scholar] [CrossRef]
  7. Li, J.; Fang, X.; Yang, Y. Analysis of the Impact of the New Two-Lane Shield Tunnel Underpass on the Existing Tunnels. Appl. Sci. 2025, 15, 2642. [Google Scholar] [CrossRef]
  8. Wang, Y.-c.; Guo, Y.; Qiu, Y.; Jiang, W.; Li, Y.-h.; Cheng, C. Dynamic Behavior of Fault Tunnel Lining Under Seismic Loading Conditions. J. Cent. South Univ. 2023, 30, 584–598. [Google Scholar] [CrossRef]
  9. Su, A.; Feng, K.; He, C.; Liang, K.; Guo, W. Study on the Mechanical Characteristics of the Large Diameter Shield Tunnel Segment Structure under High Water Pressure. J. Southwest Jiaotong Univ. 2025, 1–14. [Google Scholar]
  10. Liu, X.; Zhang, R.; Fang, Q.; Li, Q.-q.; Jiang, A.-n.; Li, K.-c. Subgrade Settlements of Existing Railway Lines and Operational Parameters of Shield Machine Induced by Twin Shield Tunnel Excavations: A Case Study. J. Cent. South Univ. 2024, 31, 272–287. [Google Scholar] [CrossRef]
  11. Zhang, D.; Liu, Z.; Shen, G.; E, J. Measurement of Earth Pressure of Shallow Buried Tunnel with Super Large Diameter and Applicability Evaluation of Calculation Method. Rock Soil Mech. 2019, 40, 91–98. [Google Scholar] [CrossRef]
  12. Amjadi, A.H.; Johari, A. Stochastic Nonlinear Ground Response Analysis Considering Existing Boreholes Locations by the Geostatistical Method. Bull. Earthq. Eng. 2022, 20, 2285–2327. [Google Scholar] [CrossRef]
  13. Johari, A.; Amjadi, A.H.; Heidari, A. Stochastic Nonlinear Ground Response Analysis via a Case Study Site in Shiraz City. Sci. Iran. 2021, 28, 2070–2086. [Google Scholar] [CrossRef]
  14. Li, C.; Zhang, W.; Wang, X.; Pan, B.; Zhu, H.-H.; Spencer, B.F. Modeling Dynamic Responses of a Cross-River Road Shield Tunnel Under Stochastic Vehicle Loads. Tunn. Undergr. Space Technol. 2020, 102, 103432. [Google Scholar] [CrossRef]
  15. Zhang, S.; Yuan, Y.; Li, C.; Yang, Y.; Yu, H.; Mang, H.A. Effects of Interior Structure as Double Deck Lanes on Seismic Performance of Segmental Linings. Tunn. Undergr. Space Technol. 2020, 103, 103441. [Google Scholar] [CrossRef]
  16. Shi, J.-K.; Zhang, J.-Z.; Zhao, S.; Guan, Z.-C.; Huang, H.-W. Probabilistic Analysis of Ground Surface Settlement Induced by Super Large Diameter Shield Tunneling Based on 3D Random Finite Element Method. Comput. Geotech. 2025, 181, 107111. [Google Scholar] [CrossRef]
  17. Kou, L.; Xiong, Z.; Cui, H.; Zhao, J. Study on Mechanical Characteristics of Segmental Joints of a Large-Diameter Shield Tunnel under Ultrahigh Water Pressure. Sensors 2021, 21, 8392. [Google Scholar] [CrossRef] [PubMed]
  18. Wu, L.; Zhang, X.; Wang, W.; Meng, X.; Guo, H. Comparison of Dynamic Characteristics between Small and Super-Large Diameter Cross-River Twin Tunnels under Train Vibration. Appl. Sci. 2021, 11, 7577. [Google Scholar] [CrossRef]
  19. Wang, S.; He, X.; Peng, X.; Wang, Y.; Li, Z.; Song, Z. Influence of Secondary Lining Thickness on Mechanical Behaviours of Double-Layer Lining in Large-Diameter Shield Tunnels. Undergr. Space 2024, 18, 130–150. [Google Scholar] [CrossRef]
  20. Guo, W.; Yang, W.; Qian, Z.; Yang, L.; He, C.; Qu, S. The Effect of Internal Structure on Dynamic Response of Road-Metro Tunnels Under Train Vibration Loads: An Experimental Study. Tunn. Undergr. Space Technol. 2023, 138, 105182. [Google Scholar] [CrossRef]
  21. Li, Y.; Zou, Z. Numerical Investigation on the Influence of Super-Large-Diameter Shield Tunneling on Nearby Existing Metro Tunnels and the Protection Scheme. Appl. Sci. 2023, 13, 3179. [Google Scholar] [CrossRef]
  22. Zhang, X.; Zhang, M.; Javadi, A.A. Influence of a Super-Large Diameter Shield Tunnel Excavation on the Lining Structure of the Metro Lines in Operation. Iran. J. Sci. Technol. Trans. Civ. Eng. 2023, 47, 3851–3866. [Google Scholar] [CrossRef]
  23. Deng, L.; Lu, H.; Liu, S.; Hu, Q.; Yang, J.; Kang, Y.; Sun, P. Particle Anti-Accumulation Design at Impeller Suction of Deep-Sea Mining Pump and Evaluation by CFD-DEM Simulation. Ocean Eng. 2023, 279, 114598. [Google Scholar] [CrossRef]
  24. Yang, W.; Ge, F.; Chen, X.; Wang, L.; Ma, P.; Xu, Z. Optimization of Collection Efficiency for a Dual-Row Jet Mining Machine Based on CFD-DEM Coupling. Ocean Eng. 2024, 313, 119633. [Google Scholar] [CrossRef]
  25. Wang, X.; Gong, L.; Li, Y.; Yao, J. Developments and Applications of the CFD-DEM Method in Particle–Fluid Numerical Simulation in Petroleum Engineering: A Review. Appl. Therm. Eng. 2023, 222, 119865. [Google Scholar] [CrossRef]
  26. Lapshin, O.V.; Polyakov, I.S.; Boyangin, E.N. Macrokinetics of Mixing Binary Powder Compositions, Augmented by the DEM Method and Experimental Studies on the Chemically Reactive System 3Ni–Al. Powder Technol. 2025, 460, 121074. [Google Scholar] [CrossRef]
  27. Nadda, M.; Banaeizadeh, A.; Avilala, P.; Roy, S.; Yadav, A. Coupled Computational Fluid Dynamics-Discrete Element Method (CFD-DEM) Modeling of Moisture Removal in a Fluidized Bed Dryer for Heterogeneously Coated Solids. Chem. Eng. Sci. 2025, 316, 121811. [Google Scholar] [CrossRef]
  28. Kim, Y.-S.; Lee, S.-D.; Baek, S.-M.; Baek, S.-Y.; Jeon, H.-H.; Lee, J.-H.; Abu Ayub Siddique, M.; Kim, Y.-J.; Kim, W.-S.; Sim, T.; et al. Development of DEM-MBD Coupling Model for Draft Force Prediction of Agricultural Tractor with Plowing Depth. Comput. Electron. Agric. 2022, 202, 107405. [Google Scholar] [CrossRef]
  29. Su, J.; Zhou, C.; Jiang, X.; Qiao, Z. Orderly Arrangement of Agricultural Biomass Particles in Designed Gas–Solid Fluidized Beds Using CFD-DEM and Image Experiment. Comput. Electron. Agric. 2023, 204, 107510. [Google Scholar] [CrossRef]
  30. Widartiningsih, P.M.; Mori, Y.; Takabatake, K.; Wu, C.-Y.; Yokoi, K.; Yamaguchi, A.; Sakai, M. Coarse graining DEM Simulations of a Powder Die-Filling System. Powder Technol. 2020, 371, 83–95. [Google Scholar] [CrossRef]
  31. Shi, H.; Zhao, C.; Du, B.; Shen, G.; Ren, H. Calibration of Discrete Element Parameters and FEM-DEM Coupling Analysis for Solid Granules Medium Deep Drawing Forming. Powder Technol. 2025, 463, 121129. [Google Scholar] [CrossRef]
  32. Chen, Z.; Ni, P.; Cheng, C.; Jia, P.; Hu, D.; Wu, M. Monitoring Interaction of Shallowly Buried, Large-Section, and Long-Distance Twin Box Jacking Tunnels with Small Spacing Under the Beijing-Hangzhou Grand Canal. Tunn. Undergr. Space Technol. 2024, 153, 105973. [Google Scholar] [CrossRef]
  33. Lei, H.; Liu, Y.; Zhang, Y.; Hu, Y. Ground Deformation Behaviour Induced by Overlapped Shield Tunnelling Considering Vibration Loads of Subway Train in Sand. Acta Geotech. 2022, 18, 519–533. [Google Scholar] [CrossRef]
  34. Wu, F.; He, C.; Kou, H.; Wang, B.; Meng, W.; Meng, H.; Guo, D. Discussion on Reasonable Clear Spacing of Twin-Tunnels in Weak Surrounding Rock: Analytical Solution and Numerical Analysis. KSCE J. Civ. Eng. 2022, 26, 2428–2442. [Google Scholar] [CrossRef]
Figure 1. Cross section of super-large-diameter twin tunnels: (a) schematic diagram; (b) details of the cross-section of shield segments.
Applsci 15 07124 g001
Figure 2. Type A metro train and its load time–history curve.
Applsci 15 07124 g002
Figure 3. Five conditions of the first set of models: (a) A1; (b) A2; (c) A3; (d) A4; (e) A5.
Applsci 15 07124 g003
Figure 4. Three conditions of the second set of models: (a) B1; (b) B2; (c) B3.
Applsci 15 07124 g004
Figure 5. Schematic diagram of water pressure calculation for C2 condition in the third set of models.
Applsci 15 07124 g005
Figure 6. Time–history curves of DV and VV at point S3 of T2 sleeper under A1–A5 conditions: (a) DV; (b) VV.
Applsci 15 07124 g006
Figure 7. Comparison of DV and VV at S1–S5 points of Tunnel 2 sleepers: (a) DV; (b) VV.
Applsci 15 07124 g007
Figure 8. Comparison of maximum DR and VR at four monitoring points of Tunnel 2 liners under A1–A5 conditions: (a) DR; (b) VR.
Applsci 15 07124 g008
Figure 9. Comparison of maximum DR and VR in surroundings under A1–A5 conditions: (a) DR; (b) VR.
Applsci 15 07124 g009
Figure 10. Comparison of coordination in Tunnel 2 surroundings at various angles under A1–A5 conditions.
Applsci 15 07124 g010
Figure 11. Comparison of DR and VR in adjacent tunnel liners and surroundings under B1–B3 conditions: (a) DR; (b) VR.
Applsci 15 07124 g011
Figure 12. Comparison of maximum DR and VR at characteristic points of liners and surroundings under C1–C3 conditions: (a) DR; (b) VR.
Applsci 15 07124 g012
Figure 13. Comparison of coordination at characteristic points of surroundings under C1–C3 conditions: (a) average coordination; (b) coordination variation rates.
Applsci 15 07124 g013
Figure 14. Comparison of vertical strain at characteristic points of surroundings: (a) vertical strain at 90°; (b) difference between maximum and minimum vertical strain.
Applsci 15 07124 g014
Table 1. Basic dimensions of twin tunnels model.
Model ParameterDiameterThickness of LinerThickness of Wall1Thickness of Wall2Thickness of Wall3 and Wall4Size of Sleeper (Length × Height)
Dimension (m)15.20.650.651.00.651.2 × 0.2
Table 2. Physical–mechanical parameters of silty sand.
Silty Sandw/%Es/MPac/kPaφvγ/kN/m3
Physical and mechanical parameters20.421.97.031.90.4920
Note: w is the water content; Es is the compression modulus; c is the cohesion; φ is the friction; v is the Poisson’s ratio; γ is the bulk density.
Table 3. Micro-parameters of silty sand in the DEM model.
ParametersRadius of Particles (m)Density
(kg/m3)
Normal Stiffness (N/m)Tangential Stiffness (N/m)Coefficient of Friction
Silty sand①R1 = 0.12–0.220002.05 × 1072.05 × 1070.62
Silty sand②R2 = r1 = 0.06–0.120002.19 × 1072.19 × 1070.62
Silty sand③r2 = 0.03–0.0520002.27 × 1072.27 × 1070.63
Table 4. Micro-parameters of C60 segments in the DEM model.
ParametersC60①C60②ParametersC60①C60②
Radius of particles (m)r3 = 0.009–0.012R3 = 0.02–0.03Normal strength of parallel bond (Pa)7.1 × 1096.9 × 109
Density (kg/m3)25002500Tangential strength of parallel bond (Pa)7.1 × 1096.9 × 109
Normal stiffness (N/m)9 × 1089 × 108Normal stiffness of parallel bonding (N/m)9 × 1088.6 × 108
Tangential stiffness (N/m)9 × 1089 × 108Parallel bonding tangential stiffness (N/m)9 × 1088.6 × 108
Coefficient of friction1.981.98Parallel bonding radius1.01.0
Note: C60① for small-diameter twin tunnels and C60② for large-diameter twin tunnels.
Table 5. Summary of model information.
No.ObjectiveConditionExplanation
1Comparison of
inner wall effects
A1 (T2)Super-large-diameter twin tunnels
A2 (W234)Super-large twin tunnels with wall2, wall3, and wall4
A3 (W12)Super-large twin tunnels with wall1 and wall2
A4 (W2)Super-large twin tunnels with wall2
A5 (NW)Super-large twin tunnels with no internal walls
2Comparison of
absolute and relative spacing
B1Small-diameter twin tunnels with 0.25 d spacing
B2Super-large twin tunnels with 0.25 d spacing
B3Super-large twin tunnels with 0.25 D spacing
3Comparison of
water pressure
C10.5 D water pressure
C21.0 D water pressure
C31.5 D water pressure
Disclaimer/Publisher’s Note: The statements, opinions and data contained in all publications are solely those of the individual author(s) and contributor(s) and not of MDPI and/or the editor(s). MDPI and/or the editor(s) disclaim responsibility for any injury to people or property resulting from any ideas, methods, instructions or products referred to in the content.

