1. Introduction
Potholes, characterized as bowl-shaped pavement surface depressions, represent one of the most prevalent distresses in asphalt pavements. These structural failures primarily result from synergistic effects of moisture infiltration, freeze–thaw cycles, traffic loading, and inadequate roadbed support [
1]. Beyond compromising ride quality, potholes significantly jeopardize vehicle safety and traffic efficiency [
2]. A national survey conducted by the Tennessee Department of Transportation found that, on average, a state’s Department of Transportation (DOT) allocates USD 5.5 million annually for pothole repair [
3]. Notably, the Illinois DOT spent over USD 25 million in fiscal year 2019 on patching potholes [
4]. Consequently, developing effective pothole repair strategies remains a critical challenge in pavement maintenance engineering. However, conventional repair methods often lead to premature failures, with frequent occurrences of secondary damage within the first year post-repair [
5,
6].
Current pothole repair methodologies can be categorized into hot mix and cold mix techniques based on material characteristics [
7]. While hot mix asphalt (HMA) demonstrates superior durability and repair quality, its application is constrained by stringent temperature requirements (typically > 150 °C) and limited effectiveness in cold, wet conditions [
8]. Particularly for scattered, small-scale potholes (area < 0.5 m
2), HMA proves economically inefficient [
9]. In contrast, cold patch asphalt mixtures (CPAMs) offer distinct advantages in seasonal adaptability, environmental sustainability, and construction efficiency [
10,
11], making them particularly suitable for emergency repairs. Nevertheless, the performance variability of CPAMs, influenced by material composition and repair conditions [
12], necessitates rigorous quality evaluation protocols.
The road performance of a CPAM is intrinsically linked to its material properties. Early research primarily focused on immediate performance indicators, particularly cohesion and workability [
13,
14]. Subsequent studies expanded the evaluation framework to incorporate molding strength and moisture susceptibility, providing a more comprehensive durability assessment [
15,
16,
17]. Notably, the Canadian Materials Company established a pioneering quality specification encompassing molding strength, low-temperature stability, moisture resistance, and workability [
18]. However, existing evaluation methods predominantly rely on macroscopic tests, yielding inconsistent results across different materials and environmental conditions. This limitation underscores the need for microstructural analysis to establish universal quality standards.
The advent of X-ray computed tomography (CT) and advanced digital image processing techniques has revolutionized the characterization of asphalt mixtures, enabling unprecedented insights into their internal microstructure. Masad et al. [
19] employed CT imaging to elucidate the complex interplay between aggregate orientation and void fraction distribution, providing critical insights into mixture structural characteristics. Liu et al. [
20] used CT images to study the homogeneity of asphalt mixtures and established separation evaluation criteria based on fractal dimension and imaging methods. Chung et al. [
21], Mahmud et al. [
22], and Zhao et al. [
23] applied CT imaging to analyze the void anisotropy in asphalt mixtures. Xing et al. [
24] used CT images to investigate the characteristics of asphalt mixture crushing slender structure, including contact points and contact distance. Subsequent research by Li et al. [
25] established quantitative relationships between void characteristics and aggregate gradation through CT-based analysis.
The evolution of three-dimensional (3D) reconstruction techniques has further enhanced our understanding of asphalt mixture behavior. Wang et al. [
26] applied CT-based 3D modeling techniques to achieve detailed visualization and analysis of the internal mechanics of particles. On this basis, Omari and Mufleh [
27] developed innovative void network reconstruction techniques to investigate the fundamental relationships between void architecture and water permeability. Tashman et al. [
28] also conducted a comprehensive CT imaging analysis to investigate both void distribution patterns and aggregate particle arrangement within asphalt mixtures. Their findings revealed significant correlations between internal structural characteristics and macroscopic material properties, particularly in terms of mechanical performance and durability. Wang et al. [
29] extended this research direction by specifically examining the spatial uniformity of void distribution. Through quantitative CT analysis, they demonstrated that the degree of void spatial homogeneity significantly influences the performance characteristics of CPAM. Building upon these foundational studies, Król et al. [
30] performed systematic CT analysis on mixtures with varying aggregate gradations. Their work focused on establishing quantitative relationships between void network characteristics and material permeability, while also investigating the influence of particle size distribution on these properties. Enríquez-León et al. [
31] investigated voids based on a three-dimensional model of asphalt mixtures and showed that the nominal maximum aggregate size directly affects the void dimension and interconnectivity. Wang et al. [
32] and Ren et al. [
33] used 3D X-ray computed tomography to investigate the pore size distribution of voids and interconnectivity between voids within asphalt mixtures.
While previous studies have significantly advanced our understanding of CPAM performance through conventional testing methods, the integration of CT scanning and digital image processing technologies offers unprecedented opportunities for multiscale characterization. Recent advancements in microstructural analysis have demonstrated the critical role of aggregate composition and spatial distribution in determining material durability, yet these insights have not been systematically applied to CPAM evaluation. Furthermore, although the relationship between void characteristics and material performance has been established for conventional asphalt mixtures, similar comprehensive studies focusing specifically on CPAM remain limited. This study addresses these research gaps by developing a novel evaluation framework that synergistically combines macro-scale performance testing with microstructural characterization, aiming to provide theoretical foundations for scientific material selection and optimized repair strategies.
2. Materials and Methods
2.1. Laboratory Test of CPAM
This investigation selected five commercially available CPAM formulations (designated CPAM1-CPAM5) widely implemented in highway maintenance across China’s diverse climatic regions. The selected materials represent typical formulations used in both northern and southern regions, ensuring comprehensive coverage of varying environmental conditions and construction practices. As these materials were used in their original pre-mixed state and stored for extended periods, the bitumen binders were not separately extracted or tested, and their properties are not available. Preliminary field investigations revealed that CPAM4 and CPAM5 exhibited inferior field performance compared to other formulations, particularly in terms of durability and service life. A comprehensive laboratory evaluation was conducted, measuring six critical performance indicators: aggregate gradation, binder–aggregate ratio, penetration strength, molding strength, residual rate, and stability retention index.
Referring to the American Association of State Highway and Transportation Officials (AASHTO) standards [
14], three penetration tests (TP43-94) and three rolling sieve tests (TP44-94) were performed on each of the five CPAMs, with the average of three test results representing the penetration strength and residual rate. Following the Test Procedures for Asphalt and Asphalt Mixtures in Highway Engineering (JTG E20-2011) [
34], six Marshall strength tests (T 0710-2021) and six water immersion Marshall tests (T 0709-2021) were carried out on each CPAM at room temperature, and the average of six test results was adopted as the molding strength and stability retention. Additionally, in accordance with the combustion furnace method (T 0735-2021) and sieving method (T 0725-2000) specified in JTG E20-2011 [
34], two sets of samples from each CPAM were tested, and the average of three sets of samples was used to determine the asphalt content and mineral aggregate grading. Standard Marshall specimens were used for most of the performance tests, including water stability, residual stability, and cohesion tests. These specimens were cylindrical in shape with a diameter of 101.6 mm and a height of 63.5 mm, prepared in accordance with relevant testing standards. An exception was made for the penetration test, which did not require the preparation of standard Marshall specimens. Instead, the materials for the penetration test were compacted into molds according to the specific requirements of that test method. By maintaining consistent specimen dimensions for the majority of the tests, the reliability and comparability of experimental results were ensured. The quantitative test results, as shown in
Table 1 and
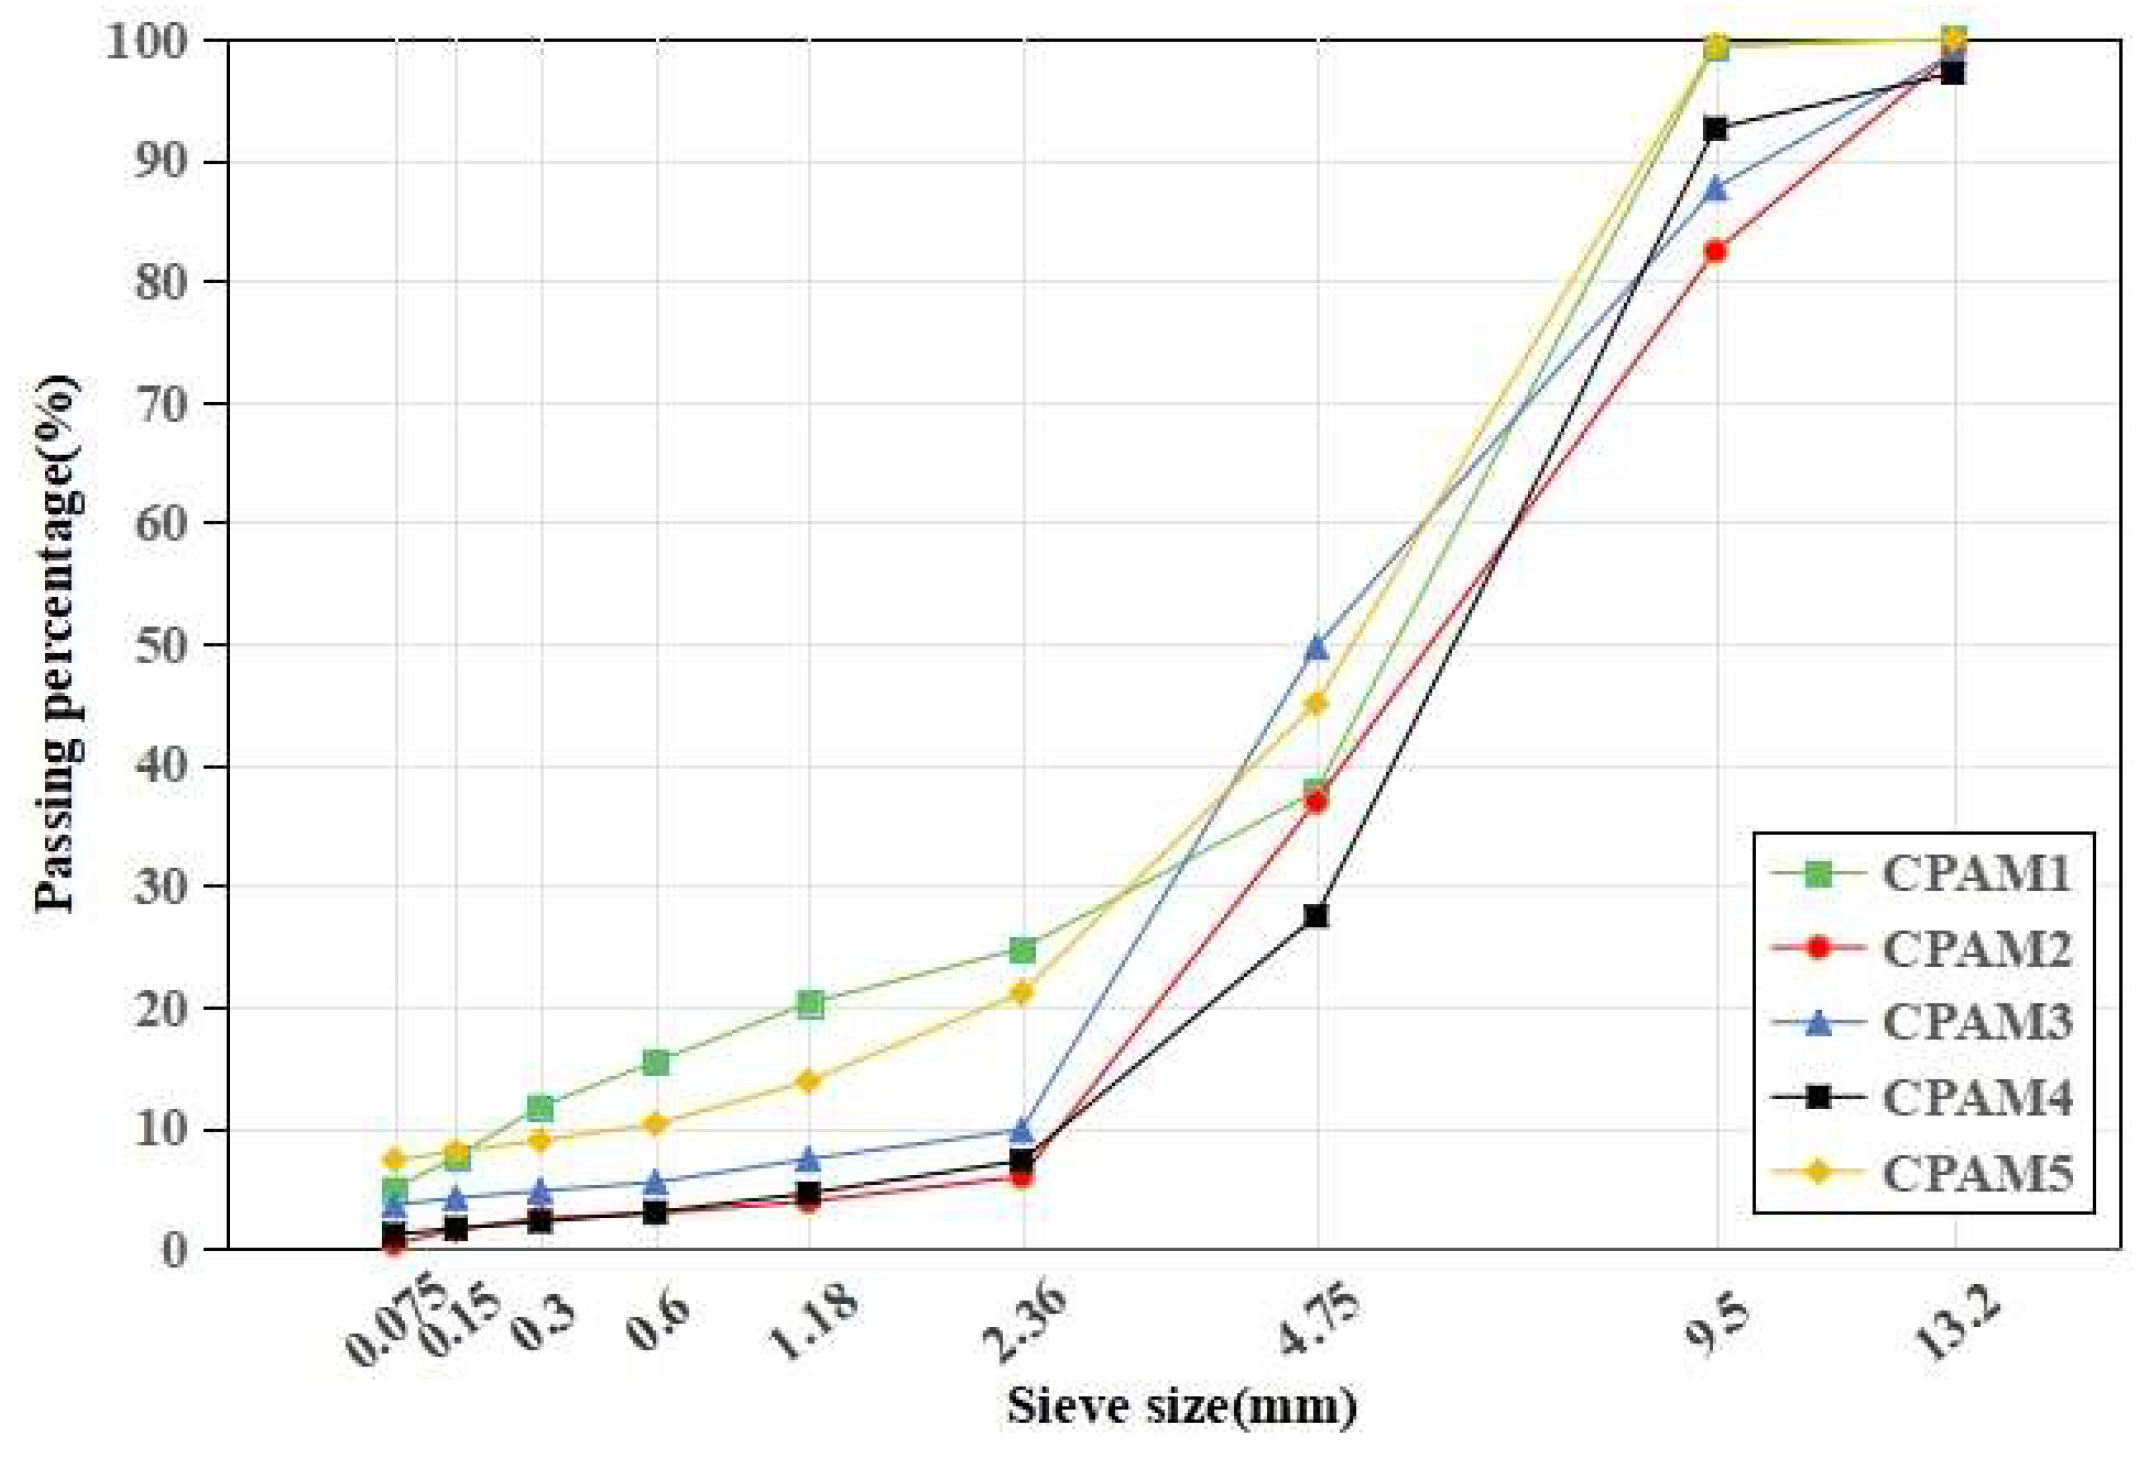
Figure 1, offer fundamental baseline data for follow-up microstructural analysis and performance correlation studies. These specific parameters were selected due to their well-documented relevance to field performance and their capacity to distinguish between material formulations under different service conditions.
Figure 1 reveals that CPAM2 and CPAM3, which exhibit higher forming strength, contain a greater proportion of coarse-grained mineral materials (9.5–13.2 mm). Conversely, CPAM1 and CPAM5, with lower molding strength, show reduced coarse-grained mineral content. This suggests that optimal coarse-grained material content enhances CPAMs’ molding strength.
Table 1 demonstrates that CPAM4, despite its higher coarse aggregate content, displays inferior performance across all parameters, indicating that simply increasing coarse aggregate content cannot improve CPAM performance. Comparative analysis of CPAM3 and CPAM5, which have similar total coarse aggregate content, reveals comparable performance but lower cohesion in CPAM3. Experimental results indicate this difference stems from CPAM3’s reduced mineral content in the 2.36–4.75 mm grading range, confirming that varying coarse aggregate gradations significantly influences CPAM performance. Consequently, optimizing the content distribution across different coarse aggregate gradations is essential for enhancing CPAM performance.
2.2. CT Scanning and Digital Image Processing
High-resolution CT scanning was conducted using an industrial micro-CT system (Model: CD-200CGA), developed in December 2005 by Chongqing University, and located at the Engineering Research Center for Non-Destructive Testing, Ministry of Education, Chongqing, China.
The cylindrical specimens for CT scanning were prepared according to the Marshall standard compaction method (T 0702-2011) [
34], with a diameter of 101.6 mm and a height of 63.5 mm. All five CPAM formulations underwent X-ray computed tomography using a high-resolution micro-CT scanner. The scanning procedure consisted of continuous axial imaging at 0.7 mm intervals throughout the specimen height, generating 85 cross-sectional images per specimen. This scanning arrangement enabled complete three-dimensional characterization of the internal microstructure while ensuring optimal contrast differentiation among aggregate, binder, and void phases.
The obtained CT images were processed through comprehensive digital image analysis to improve quality and enable precise phase identification. The processing sequence comprised four consecutive steps: (1) noise suppression using a hybrid median-Wiener filtering technique [
35], (2) localized contrast enhancement of void and aggregate regions via piecewise linear transformation [
36], (3) global image refinement through adaptive histogram equalization [
37], and (4) phase segmentation utilizing an enhanced Otsu-maximum entropy thresholding algorithm [
38].
For aggregate image processing, morphological operations were conducted using 5 × 5 pixel structural elements with linear, cross, and quadrangular configurations, effectively eliminating smaller particles and resolving particle adhesion issues. Following this, aggregate boundaries were accurately defined using the Canny edge detection operator. The efficacy of this image-processing approach is clearly demonstrated in
Figure 2, which shows the progressive improvement in aggregate identification and characterization.
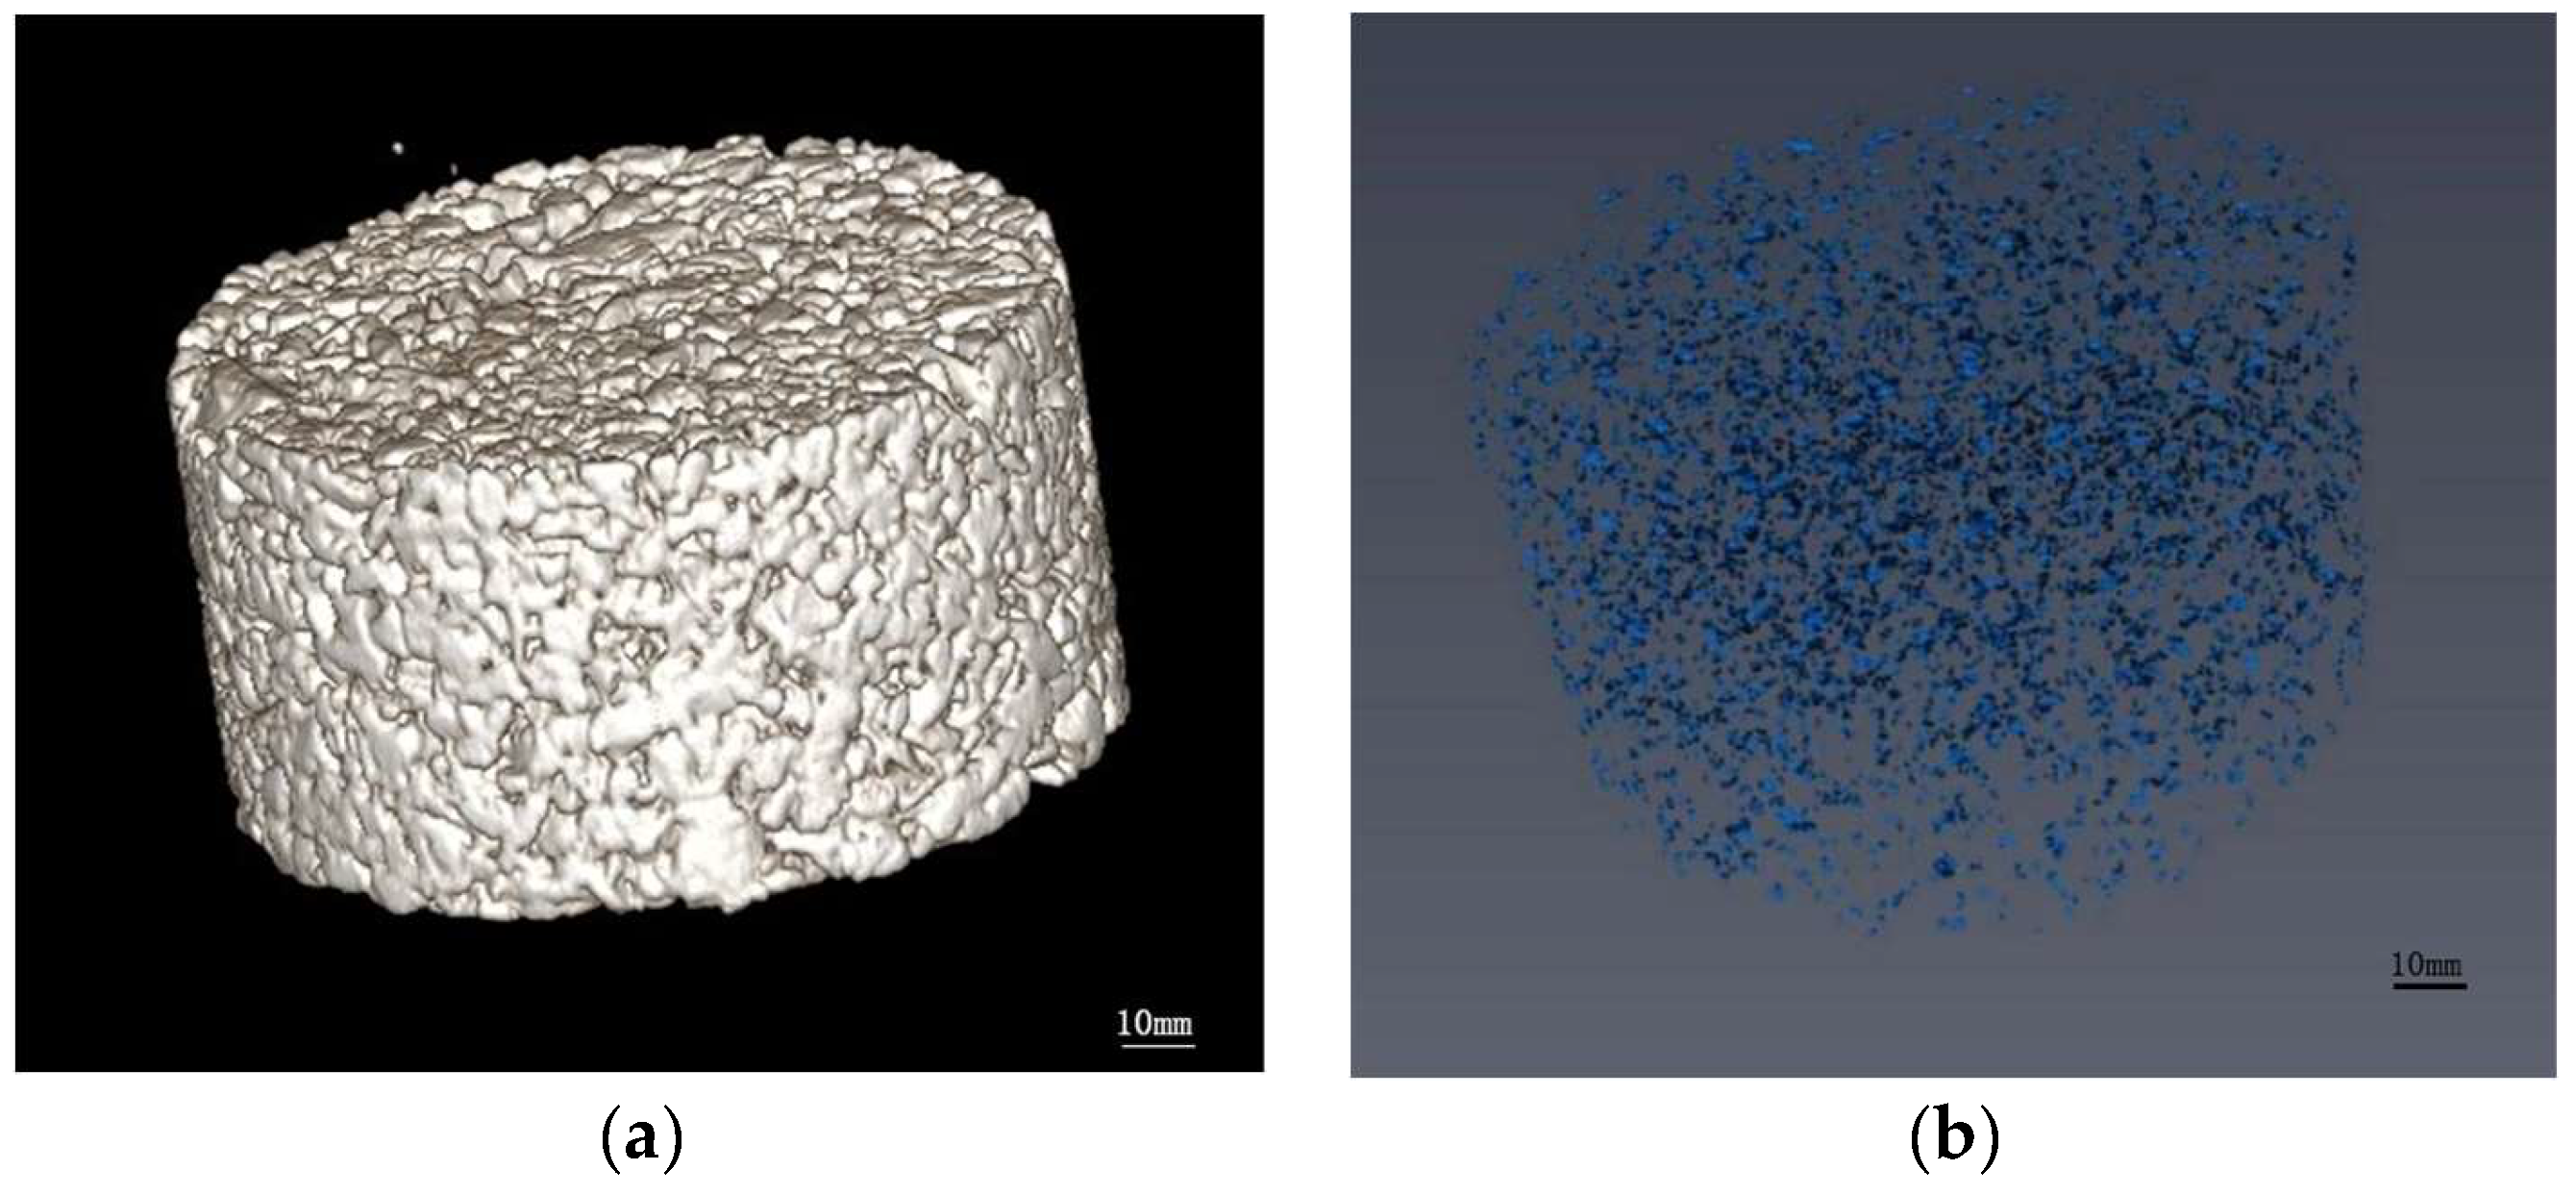
Extending beyond two-dimensional image analysis, this study employed advanced three-dimensional reconstruction techniques to fully characterize the internal structure of CPAM. The CT scan data were processed using RadiAnt DICOM Viewer (version 4.6.9, Medixant) to create three-dimensional volumetric reconstructions, with subsequent void network analysis performed through Avizo (version 9.0.0, Thermo Fisher Scientific) software’s visualization module. This integrated methodology facilitated the generation of precise three-dimensional models representing the void architecture within cold patch specimens. The reconstruction process effectively captured the complex spatial distribution and void connectivity, as illustrated in
Figure 3. Additionally, the three-dimensional visualization model yields quantitative data on void morphology and spatial organization, providing exceptional detail for microstructural examination.
2.3. Void Characteristic Analysis
Moisture-induced damage is a critical factor in pavement pothole deterioration, closely related to the void characteristics of repair materials. In cold patch asphalt mixtures (CPAMs), voids form an essential component of the internal structure, representing the volumetric space not occupied by aggregate particles and asphalt mortar. The three-dimensional visualization model allows accurate quantification and analysis of void characteristics, including void ratio and spatial distribution. To verify the accuracy of void ratio determination through CT image processing and 3D reconstruction, a comparative analysis was performed using two independent methods: the digital void ratio obtained from CT scanning digital image analysis and the test void ratio measured by the water weight method (T 0706-2021) [
34].
The test void ratio can be expressed as:
where
is the text void ratio;
is the relative density of asphalt mixture; and
is the bulk relative density of compacted specimens.
This study utilizes two fundamental geometric parameters—equivalent diameter [
25] and void area—for quantitative void morphology characterization. The complex void structures identified in CT images were simplified through circular approximations, where each void’s cross-sectional area was represented by an equivalent circular area. The diameter of this representative circle, defined as the equivalent diameter, serves as a standardized metric for void size assessment.
The equivalent diameter is calculated as:
where
is the equivalent diameter, and
is the void area.
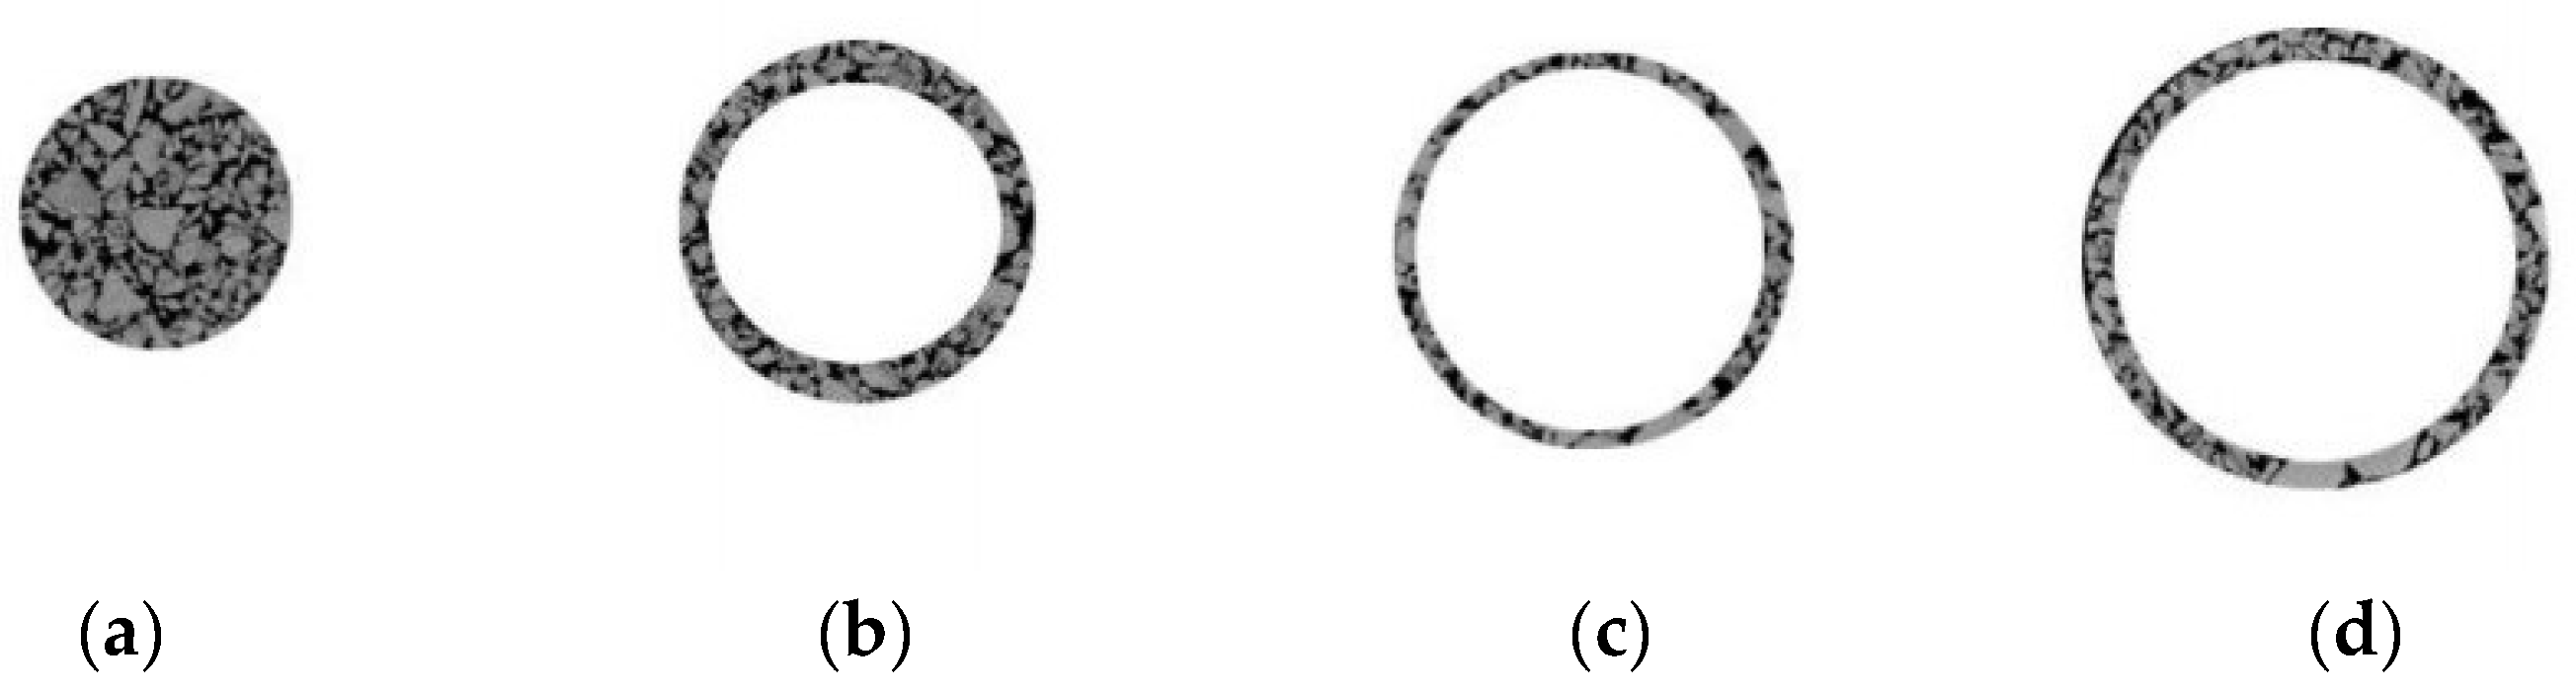
CT imaging enables comprehensive characterization of void characteristics beyond mere size quantification, particularly in assessing spatial distribution uniformity within CPAM specimens. This analysis incorporates three key aspects: (1) radial distribution patterns, (2) longitudinal distribution patterns, and (3) fractal dimension quantification of void networks.
The 3D visualization model was systematically divided into four concentric regions of equal area using circular boundaries with radii of
R,
R,
R, and
R (
Figure 4), where
R represents the specimen radius. This partitioning scheme facilitates the detailed characterization of void distribution gradients from the specimen center to its periphery.
With a total specimen height of 63.5 mm, longitudinal scanning was conducted at 0.7 mm intervals, yielding 90 CT images per specimen. After excluding incomplete images near the upper and lower surfaces (where porosity variations are most pronounced [
39]), 85 complete cross-sectional images were selected for analysis.
Fractal dimension analysis was employed to characterize void network complexity and spatial uniformity. As a robust metric for quantifying irregular geometric patterns [
40], the fractal dimension provides insights into void area distribution continuity. Lower fractal dimension values indicate more uniform void distribution with fewer large, continuous void areas.
The void cycle length can be expressed as:
where
is the void cycle length;
A is the void area;
B is the fractal dimension; and C is a constant.
2.4. Aggregate Characterization
Beyond porosity, initial molding strength constitutes another critical factor affecting cold patch material durability, particularly in determining the repaired area’s ability to withstand vehicular loads. From a microstructural perspective, material strength is primarily controlled by its aggregate skeleton density [
41]. Recent developments in CT imaging have allowed direct characterization of aggregate contact features in cross-sections, enabling quantitative evaluation of mixture skeleton density. Studies have demonstrated that coarse aggregate contact points represent reliable indicators of skeleton density [
42].
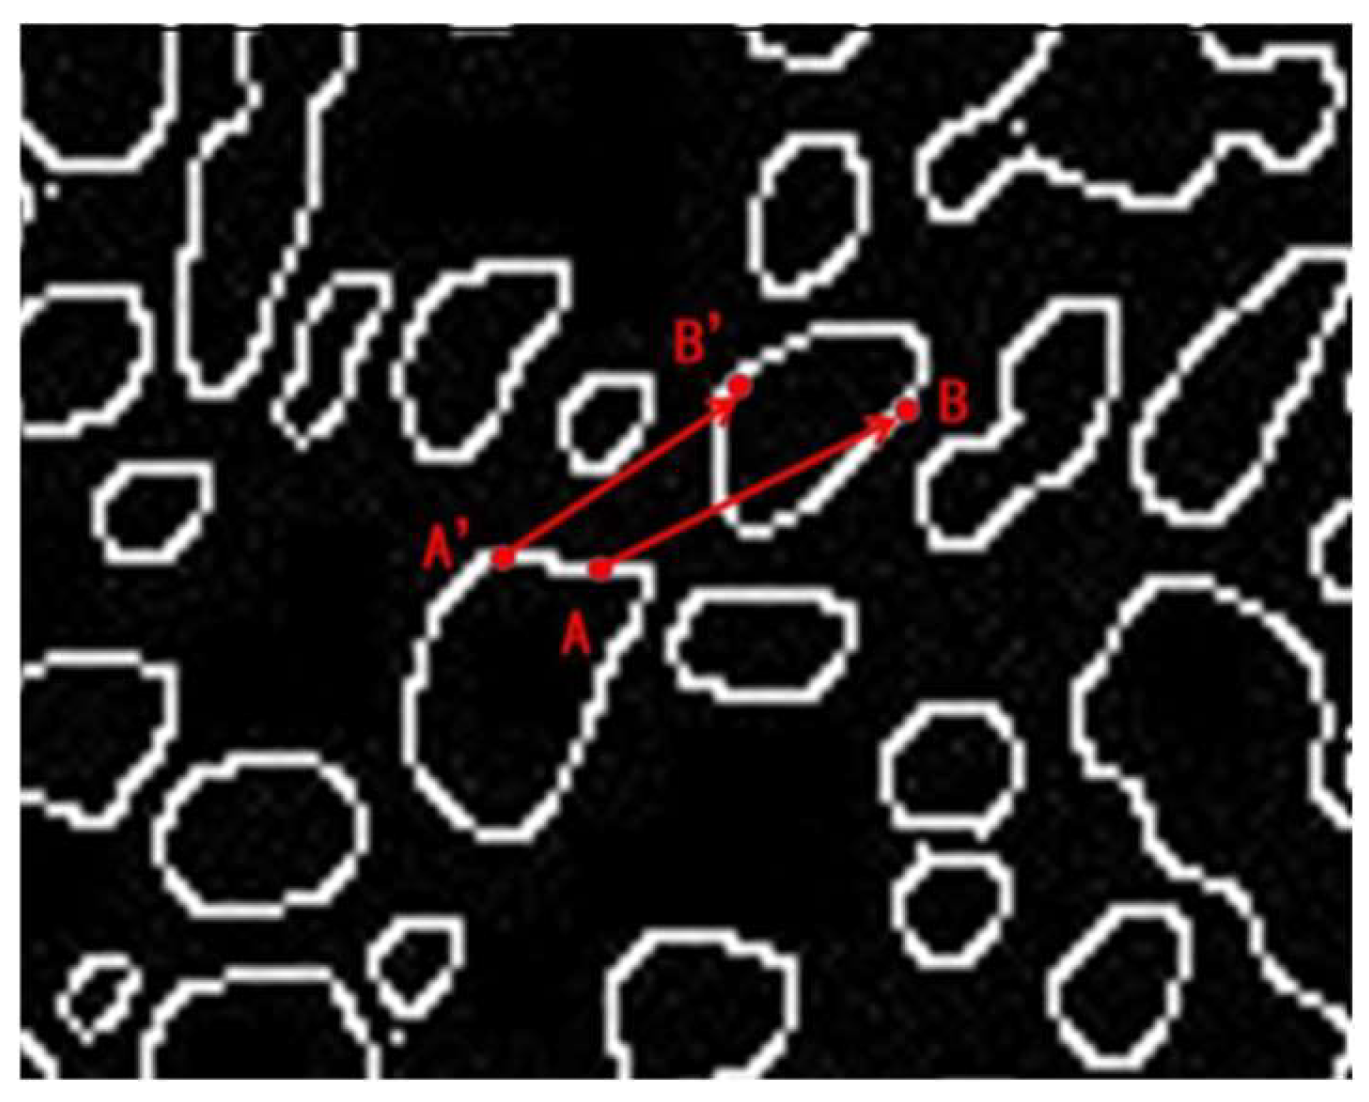
The identification of coarse aggregate contact points necessitates accurate measurement of inter-particle distances relative to a specified contact threshold. As shown in
Figure 5, the contact distance is defined as the edge-to-edge separation between neighboring coarse aggregates. The analysis procedure consists of (1) randomly selecting point A on one aggregate’s edge, (2) locating point B on an adjacent aggregate’s edge, and (3) computing their Euclidean distance through digital image analysis. This method is systematically repeated for all aggregate pairs within the image, with contact confirmed when the calculated distance is less than the predetermined threshold.
Existing research recommends setting the contact distance threshold at 23% of the minimum coarse aggregate particle length [
43]. Traditional particle size classification methods utilize fixed thresholds (4.75 mm for mixtures with maximum nominal size > 16 mm; 2.36 mm otherwise) [
44], while the Bailey method employs a dynamic threshold of 22% of the maximum nominal size [
44]. However, given the heterogeneous nature of cold patch materials, this study proposes an enhanced approach combining Bailey method principles with bulk mechanics to calculate weighted average particle size and set 23% of the weighted average particle size as the contact distance threshold. This modification better accounts for the proportional distribution of various aggregate sizes within the mixture.
The average particle size can be expressed as:
where
is average particle size;
is the mass fraction of the aggregate in group
; and
is the maximum nominal diameter of the aggregate in group
.
The contact threshold is converted to pixel distance according to the specimen diameter (101.6 mm) to digital image scale ratio. This conversion allows direct comparison with image-based inter-aggregate distances, enabling precise identification and quantification of contact points across various cold patch formulations.
3. Results
3.1. Void Characteristics Analysis
The comparison of void ratios obtained through digital image processing and the water weight method is presented in
Table 2. The term “errors” refers to the mathematical difference between the observed values and the true values, representing the prediction or estimation error of the model. The minor discrepancy between these measurements confirms the high accuracy of the digital image analysis approach. This verification demonstrates the effectiveness of the image segmentation methodology used in this study, particularly in achieving precise threshold segmentation and accurate void identification.
The microstructural analysis provides valuable insights into the performance variations among different CPAM formulations, enabling the establishment of quantitative relationships between void characteristics and macroscopic material properties.
Marshall stability, a primary indicator of CPAM’s load-bearing capacity, exhibits a moderate quadratic relationship with the void ratio, as shown in
Figure 6 (R
2 = 0.76). The initial stability increase with the void ratio indicates the development of a load-bearing skeleton structure requiring optimal void participation. However, beyond a critical threshold, excessive void content compromises structural integrity, resulting in stability reduction. This nonlinear relationship emphasizes the necessity of maintaining an optimal void ratio for maximizing load-bearing capacity.
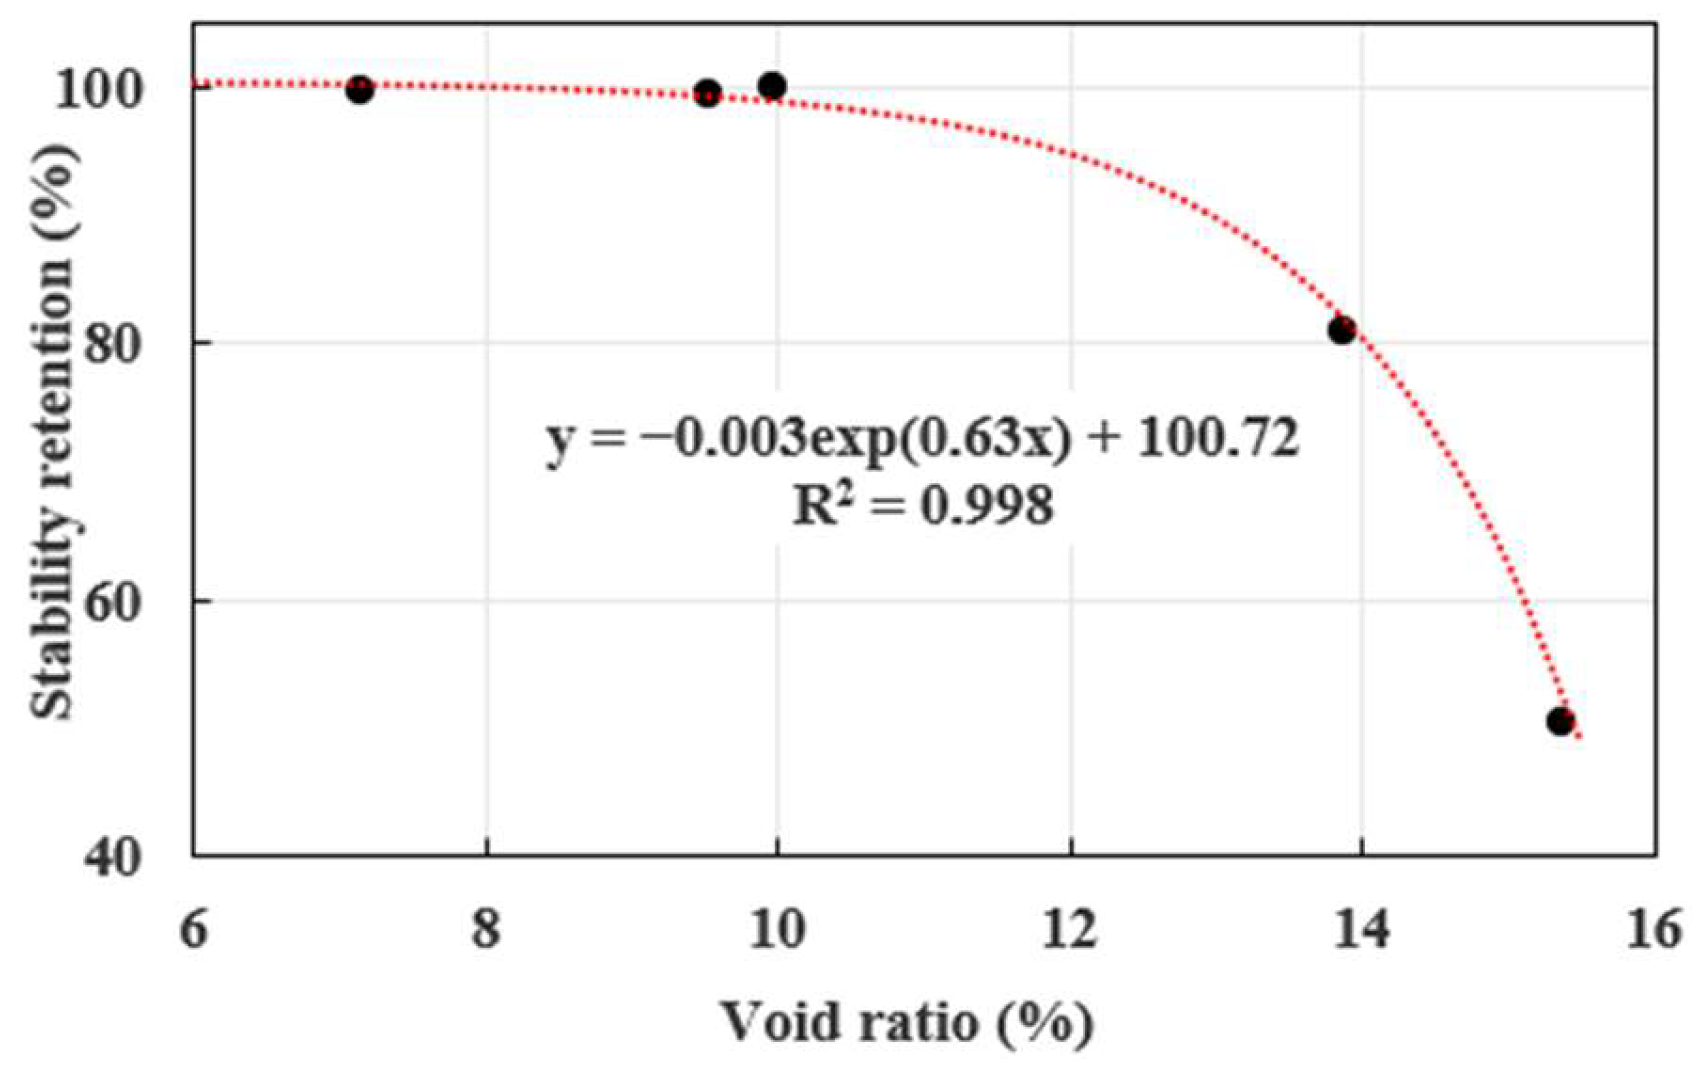
The moisture resistance of CPAM, measured by stability retention, shows a pronounced negative exponential relationship with the void ratio in
Figure 7. This indicates that a higher void ratio leads to a looser internal structure, making the material more susceptible to water intrusion and thereby reducing its water stability. The coefficient of determination (R
2 = 0.998) demonstrates an excellent fit between the model and the experimental data, suggesting that air void content is a key factor influencing the water stability of cold patch materials. Specifically, when the air void content is relatively low (e.g., below 10%), the residual stability approaches 100%, indicating strong water resistance. However, as the void content increases, residual stability drops rapidly, underscoring the requirement for accurate void content control in the mix design.
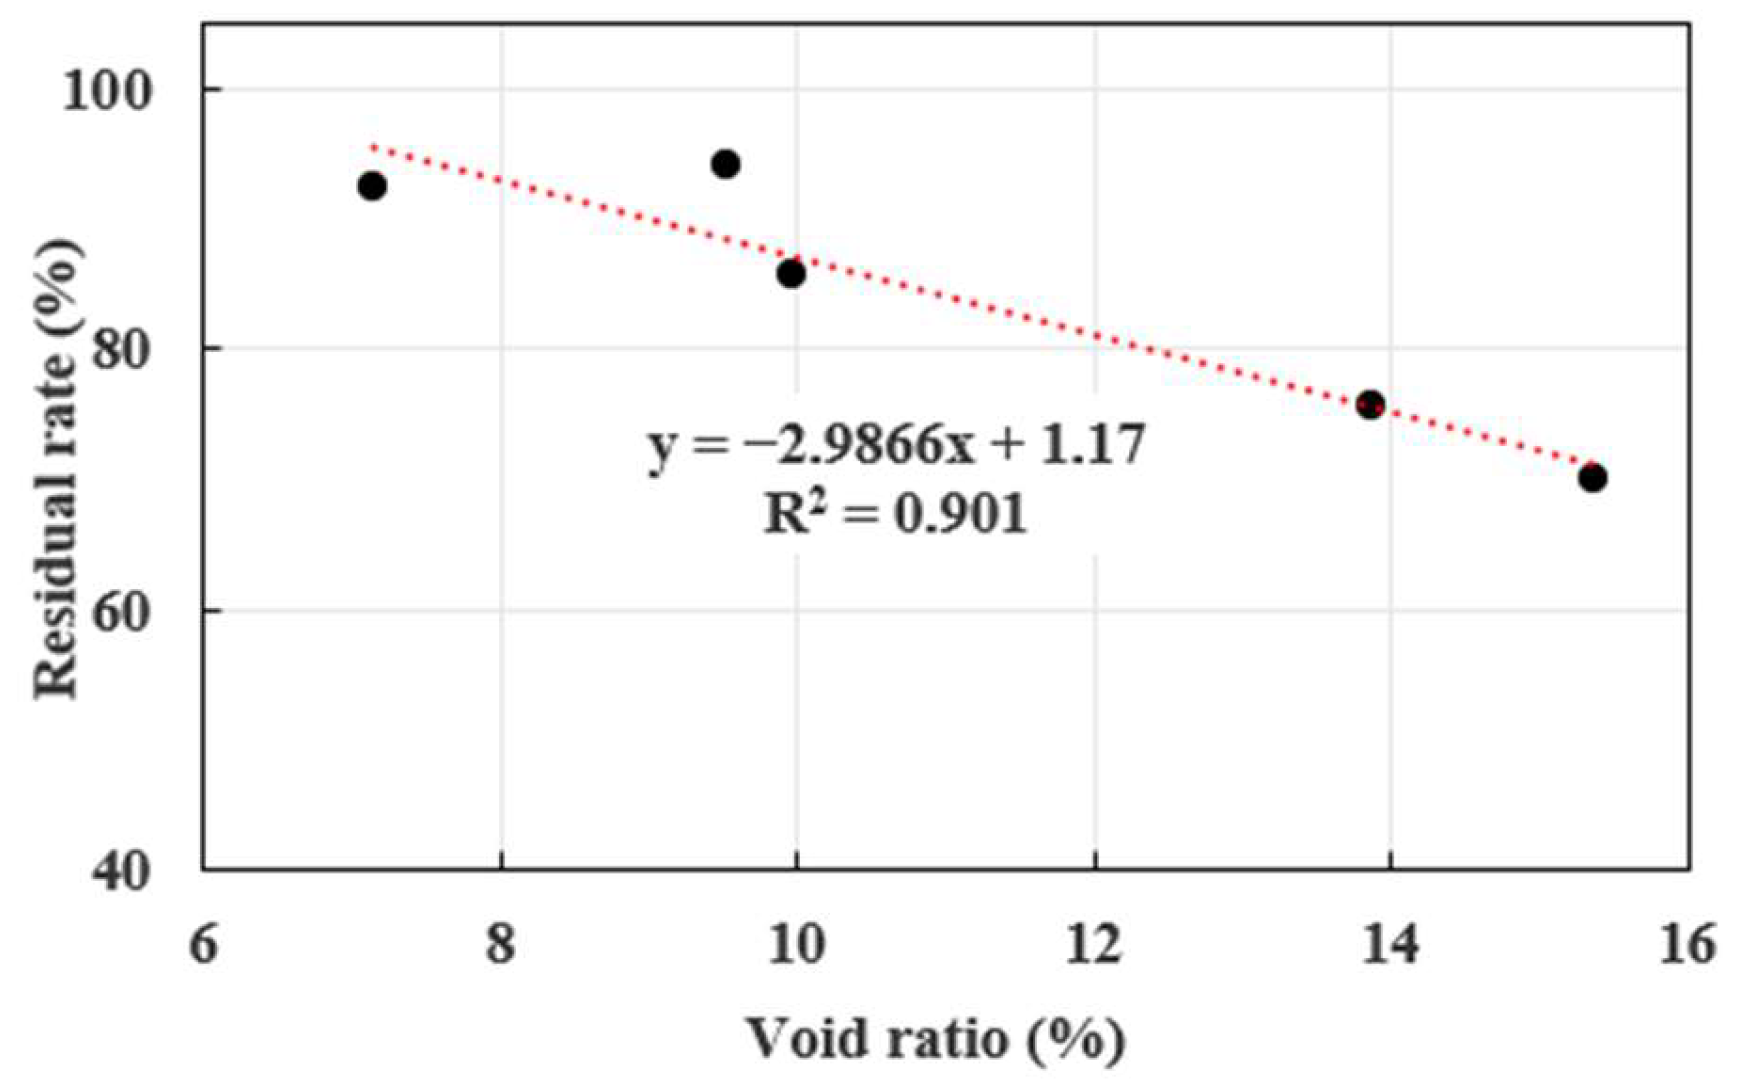
The cohesion characteristics, expressed through residual rate, exhibit a negative linear correlation with increasing void ratio in
Figure 8. The residual ratio decreases linearly with increasing air void content. The coefficient of determination (R
2 = 0.901) suggests that the linear model has good fitting accuracy and effectively captures the overall trend between air voids and residual cohesion. Although the fit is slightly lower than that observed in the exponential model for water stability (
Figure 7), it still provides strong explanatory power. When the air void content is high, the internal structure becomes looser, reducing the contact area between aggregates and weakening the bonding strength, which leads to a lower residual ratio. Conversely, a lower void content results in a denser structure and better bonding among aggregates, thereby improving the residual ratio. This correlation highlights the essential importance of void content control for improving long-term pothole repair performance, especially under wet environmental conditions.
These results collectively establish the void ratio as a fundamental microstructural parameter governing multiple CPAM performance characteristics. The identified correlations offer practical guidelines for mixture design optimization to achieve balanced performance, particularly regarding strength, moisture resistance, and cohesion properties.
3.2. Void Area and Equivalent Diameter
Table 3 presents the quantitative analysis of void characteristics, including void areas and equivalent diameters, for the five CPAM formulations.
The data indicate a direct relationship between void count, void area, and overall void ratio. Among the tested formulations, CPAM1 shows the most favorable void characteristics, with the lowest void ratio and smallest average equivalent diameter. CPAM2 and CPAM3 exhibit intermediate values, while CPAM4 and CPAM5 display the highest void ratios, however, with distinct differences in average equivalent diameters.
This variation in void characteristics stems from differences in aggregate gradation and binder content, as confirmed by previous performance tests. Excessive coarse aggregates tend to increase the void diameter, while properly sized fine aggregates (particularly 2.36 mm gradation) effectively fill voids, reducing both the void diameter and count.
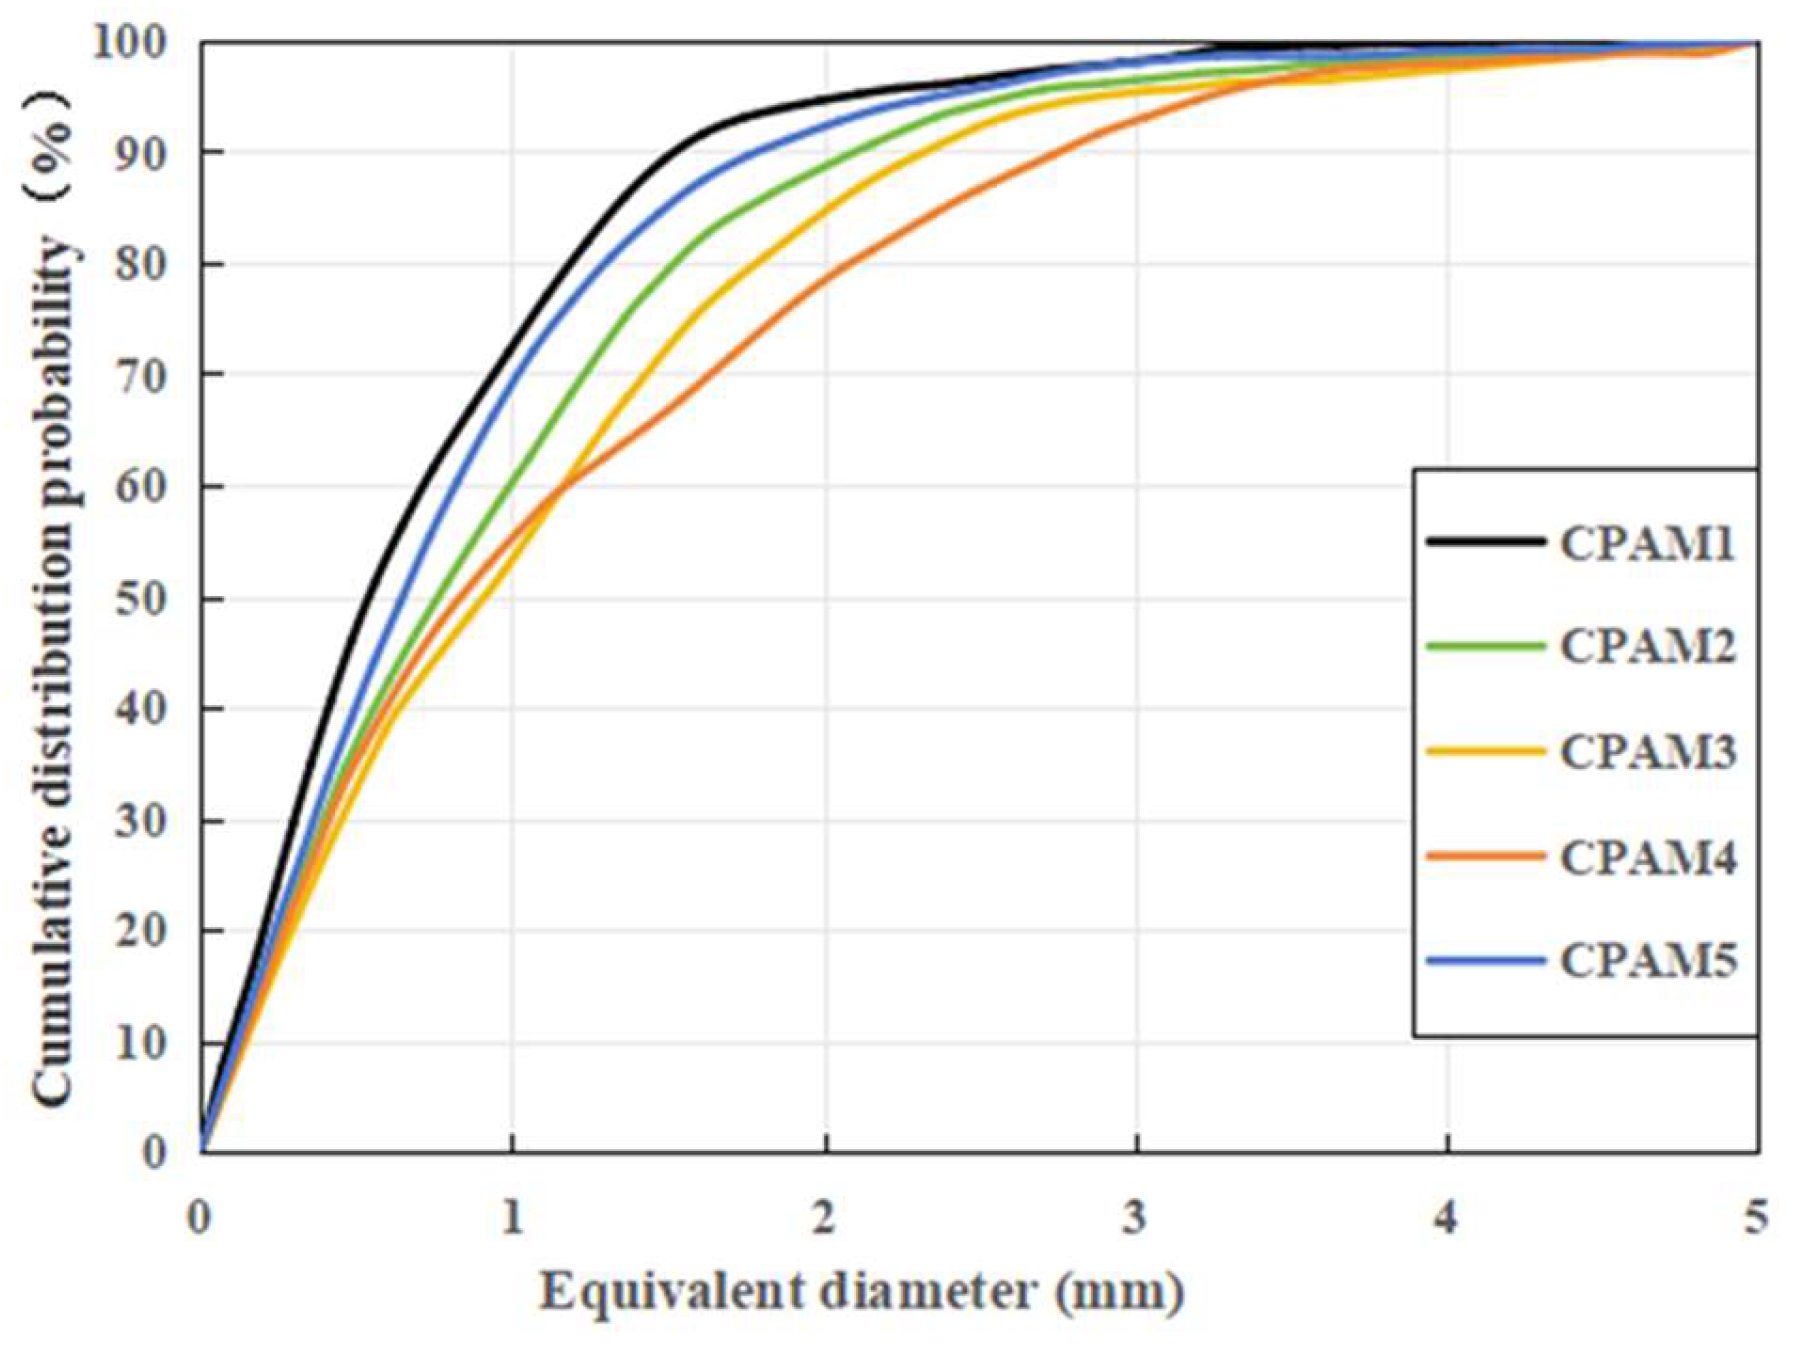
Figure 9 shows the relationship between the equivalent void diameter and the cumulative void ratio distribution. The
x-axis represents the equivalent diameter of individual voids (ranging from 0 to 5 mm), and the
y-axis represents the cumulative distribution probability—i.e., the proportion of total voids with diameters less than or equal to a given value. Most void diameters fall within the 0–3 mm range. The superior void characteristics of CPAM2 and CPAM3 result from their higher 2.36 mm aggregate content, which efficiently fills internal voids. In contrast, CPAM5’s more uniform gradation distribution and lack of >9.5 mm aggregates lead to fewer large voids and consequently a lower average equivalent diameter than CPAM4.
These results emphasize the essential role of optimized gradation in regulating void characteristics, demonstrating the significance of balanced aggregate distribution for achieving optimal microstructural properties.
3.3. Void Distribution and Fractal Dimension Analysis
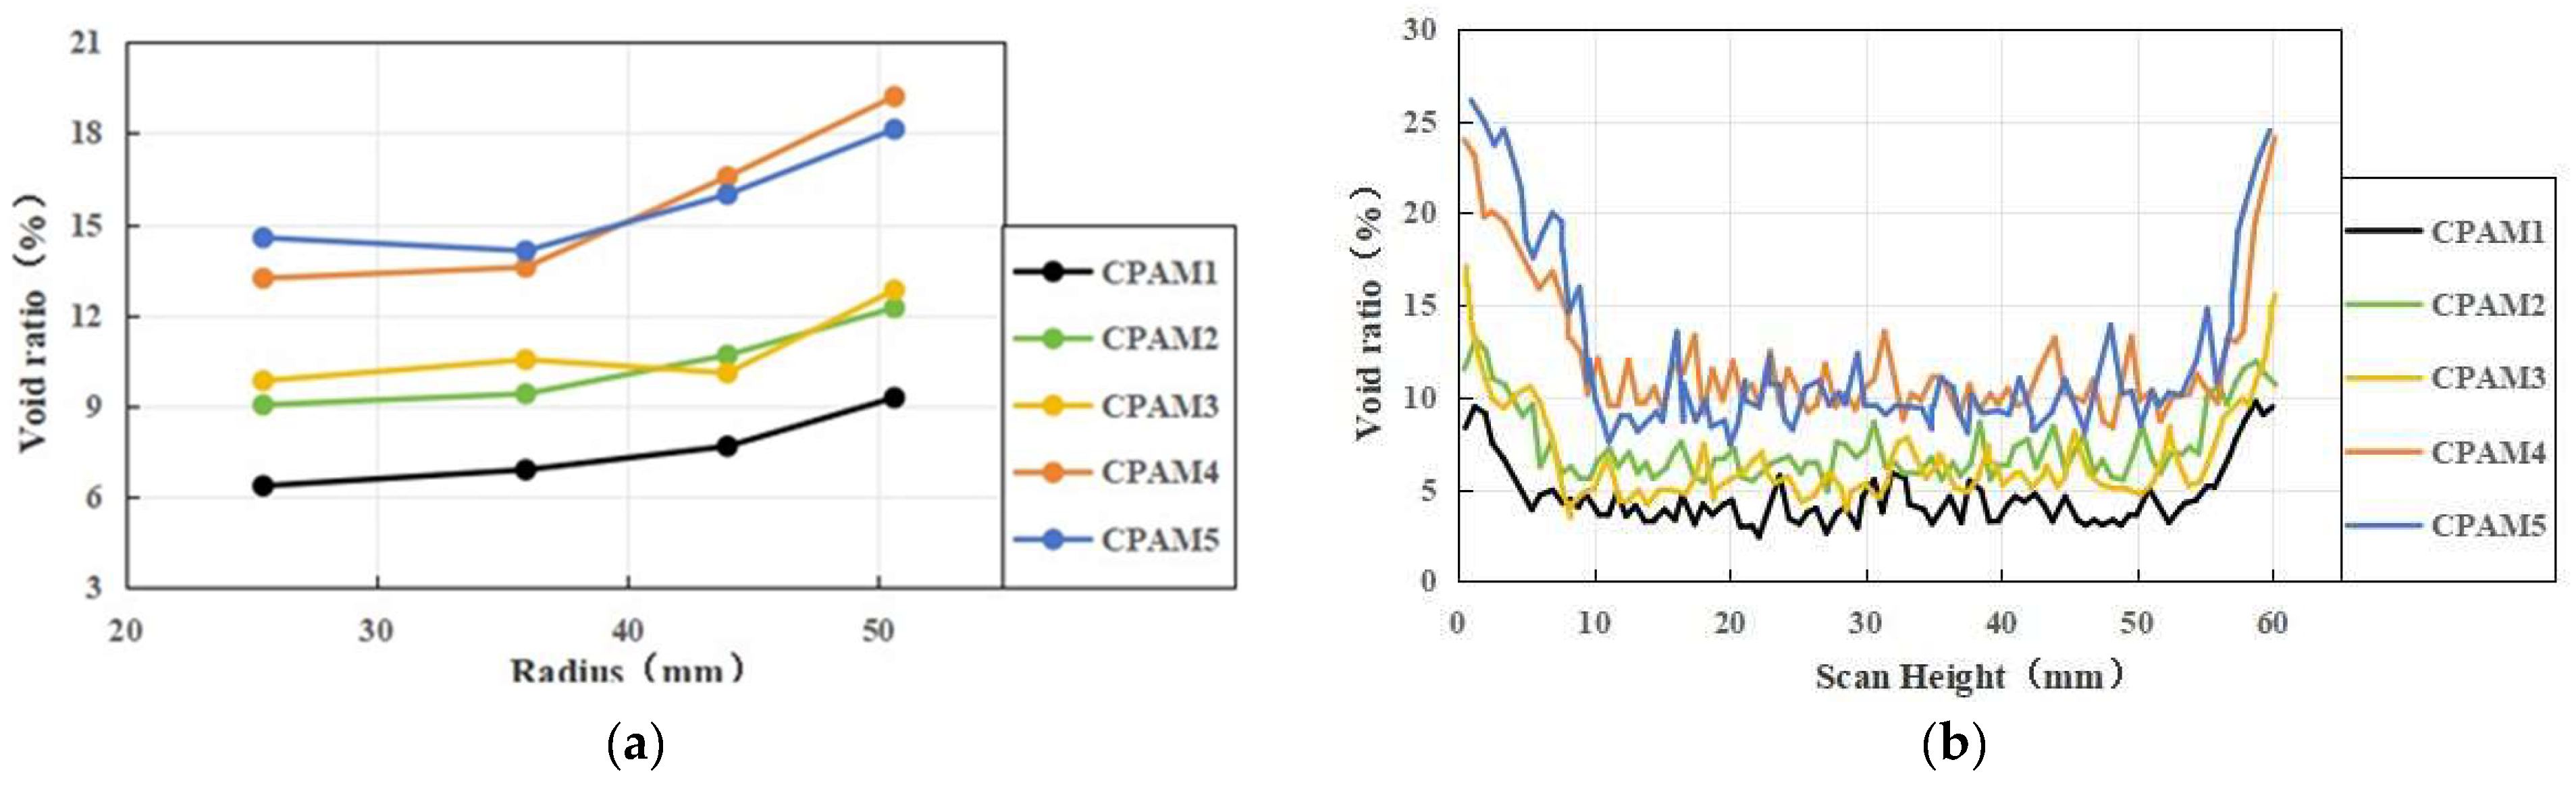
Figure 10a presents the radial void distribution patterns of CPAM specimens. The analysis shows a consistent trend of increasing void ratio with radial distance from the specimen center. CPAM1 and CPAM2 display superior radial uniformity, resulting from their optimized asphalt content (4.5–4.7%). Conversely, CPAM4 and CPAM5 exhibit significant radial variations, with void ratio fluctuations reaching 6%. This non-uniformity mainly results from insufficient 1.18–2.36 mm aggregate content, leading to inadequate void filling between coarse aggregates.
The longitudinal void distribution characteristics, shown in
Figure 10b, reveal three distinct zones: (1) an upper transition zone (0–15 mm) with rapidly decreasing void ratio, (2) a stable middle zone (15–55 mm) showing consistent void distribution, and (3) a lower transition zone (>55 mm) with accelerating void ratio increase. Comparative analysis indicates CPAM4 maintains a 4.6–12.5% higher void ratio than CPAM2 and CPAM3 at corresponding heights. This difference arises from CPAM4’s concentrated coarse aggregate distribution (primarily 13.2 mm and 4.75 mm fractions), which lacks adequate 2.36 mm aggregates for effective inter-particle void filling.
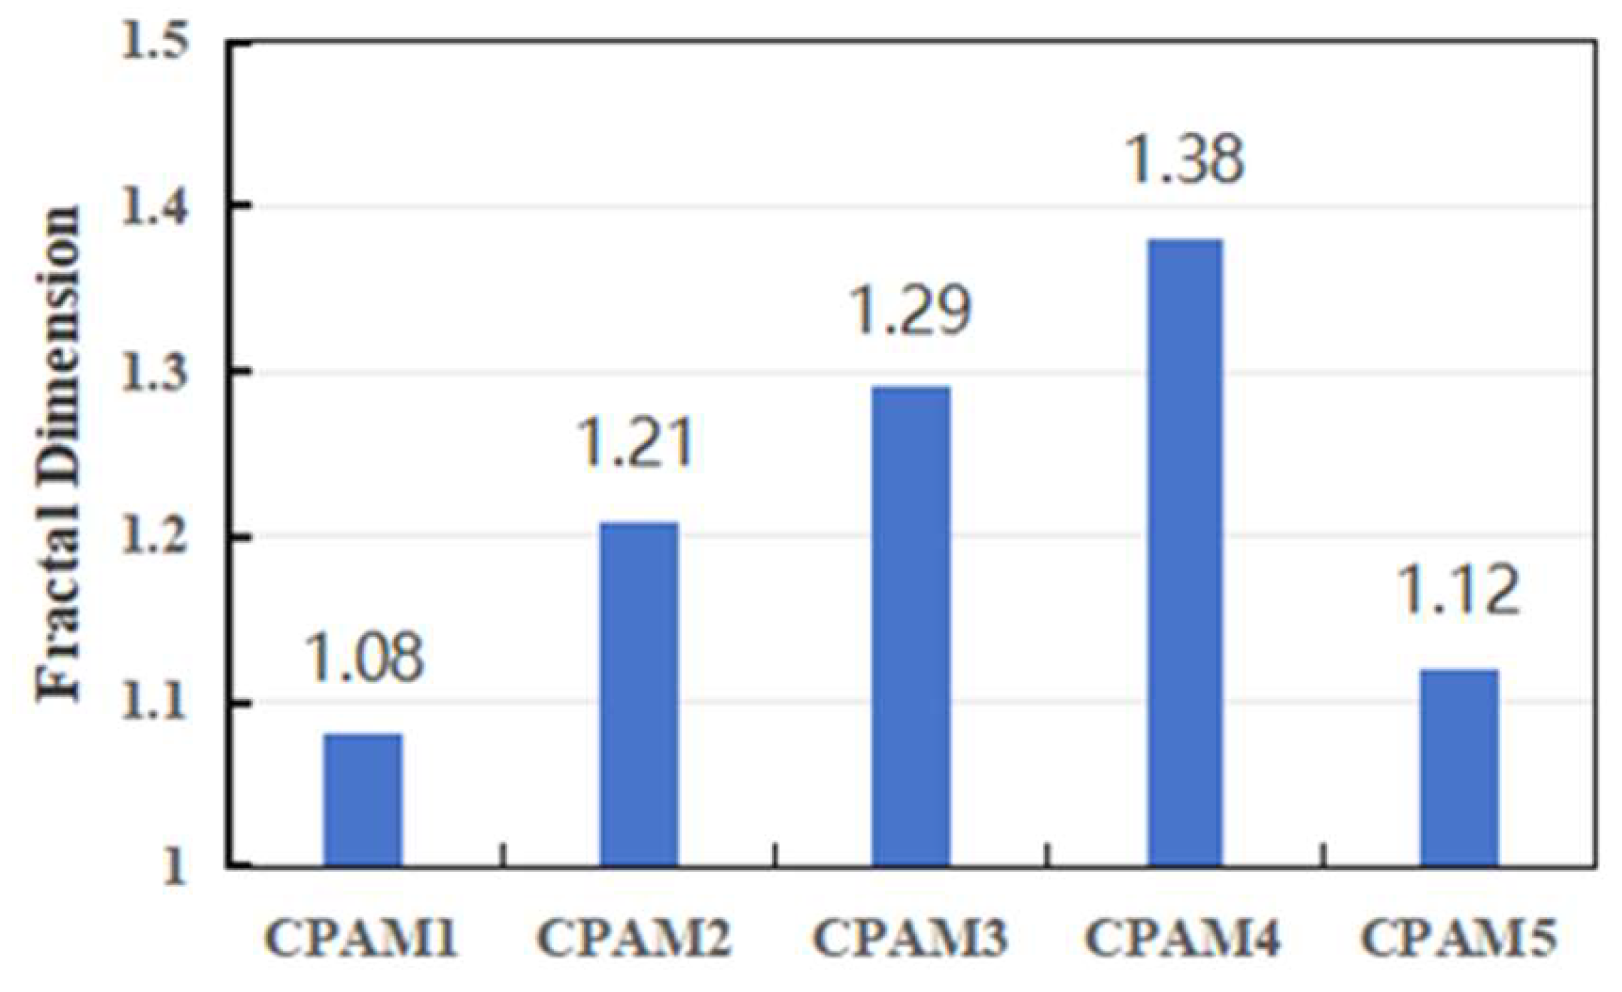
Fractal dimension analysis (
Figure 11) enables quantitative evaluation of void distribution uniformity. CPAM4 shows the highest fractal dimension (1.38), indicating non-uniform void distribution and greater potential for large void formation. This directly correlates with its unbalanced aggregate gradation, specifically the excessive 4.75 mm aggregate concentration. In contrast, CPAM1 and CPAM5 exhibit lower fractal dimensions (1.08 and 1.12, respectively), representing more homogeneous void distributions and decreased large void occurrence. These results verify that proper inclusion of small-sized aggregates (particularly 2.36 mm fraction) effectively fills inter-particle voids, improving overall void distribution uniformity.
3.4. Aggregate Contact Characteristics
Table 4 presents the quantitative analysis of coarse aggregate contact points.
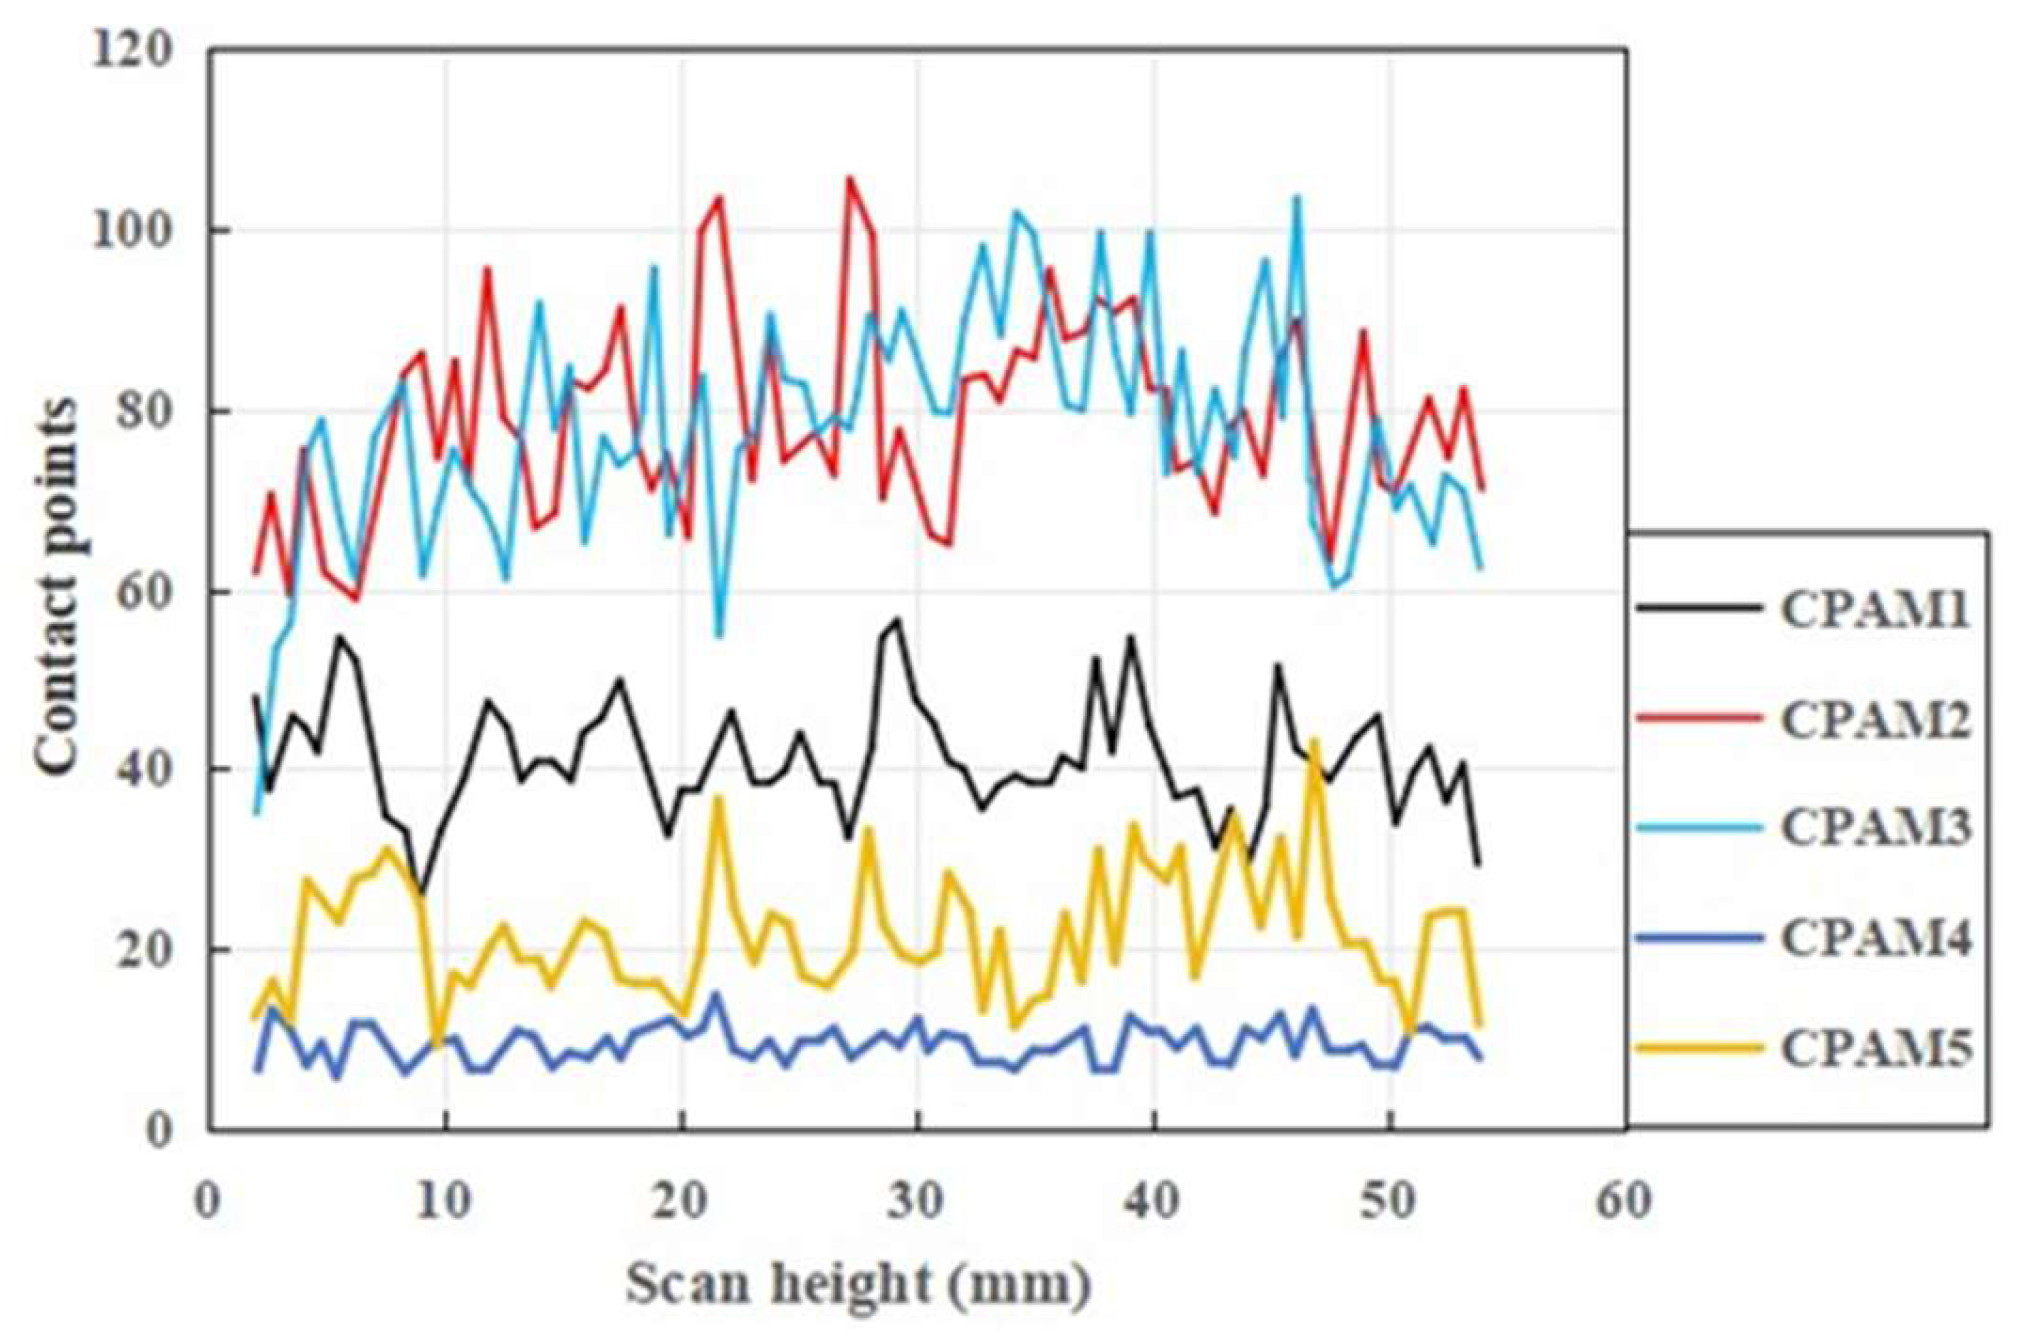
Figure 12 illustrates the longitudinal distribution patterns of contact points within CPAM specimens.
The analysis shows clear differences in contact point distribution across formulations. CPAM2 and CPAM3 display optimal contact characteristics, with average longitudinal contact points near 80, indicating excellent aggregate packing density. In comparison, CPAM4 and CPAM5 show substantially fewer contact points, primarily in the 10–20 range, demonstrating poor aggregate interlock. CPAM1 exhibits intermediate performance, with approximately 40 contact points.
These differences directly relate to aggregate gradation characteristics. CPAM2 and CPAM3’s superior performance results from their well-balanced coarse aggregate distribution, which enhances dense packing and inter-particle contact. The greater number of contact points improves load transfer efficiency, leading to higher material strength. By contrast, CPAM4 and CPAM5’s limited contact points stem from their unbalanced gradation, especially the inadequate 2.36 mm aggregate content, which weakens aggregate interlock and structural integrity.
3.5. Coordination Number Analysis
The coordination number, representing the count of adjacent particles in direct contact with a central particle, serves as a key parameter for evaluating aggregate packing characteristics. Using the established contact point data, coordination numbers for individual coarse aggregates were computed, with results detailed in
Table 5 and
Figure 13.
The analysis shows distinct variations in coordination number distribution across CPAM formulations. CPAM4 displays weak aggregate interlock, with coordination numbers mainly in the 0–1 range, reflecting inadequate contact between coarse aggregates to form a stable skeleton structure. By contrast, CPAM2 and CPAM3 exhibit optimal packing characteristics, with coordination numbers primarily in the 2–3 range and peak values up to 5. This efficient contact configuration enables the formation of a durable aggregate skeleton, improving overall mixture stability.
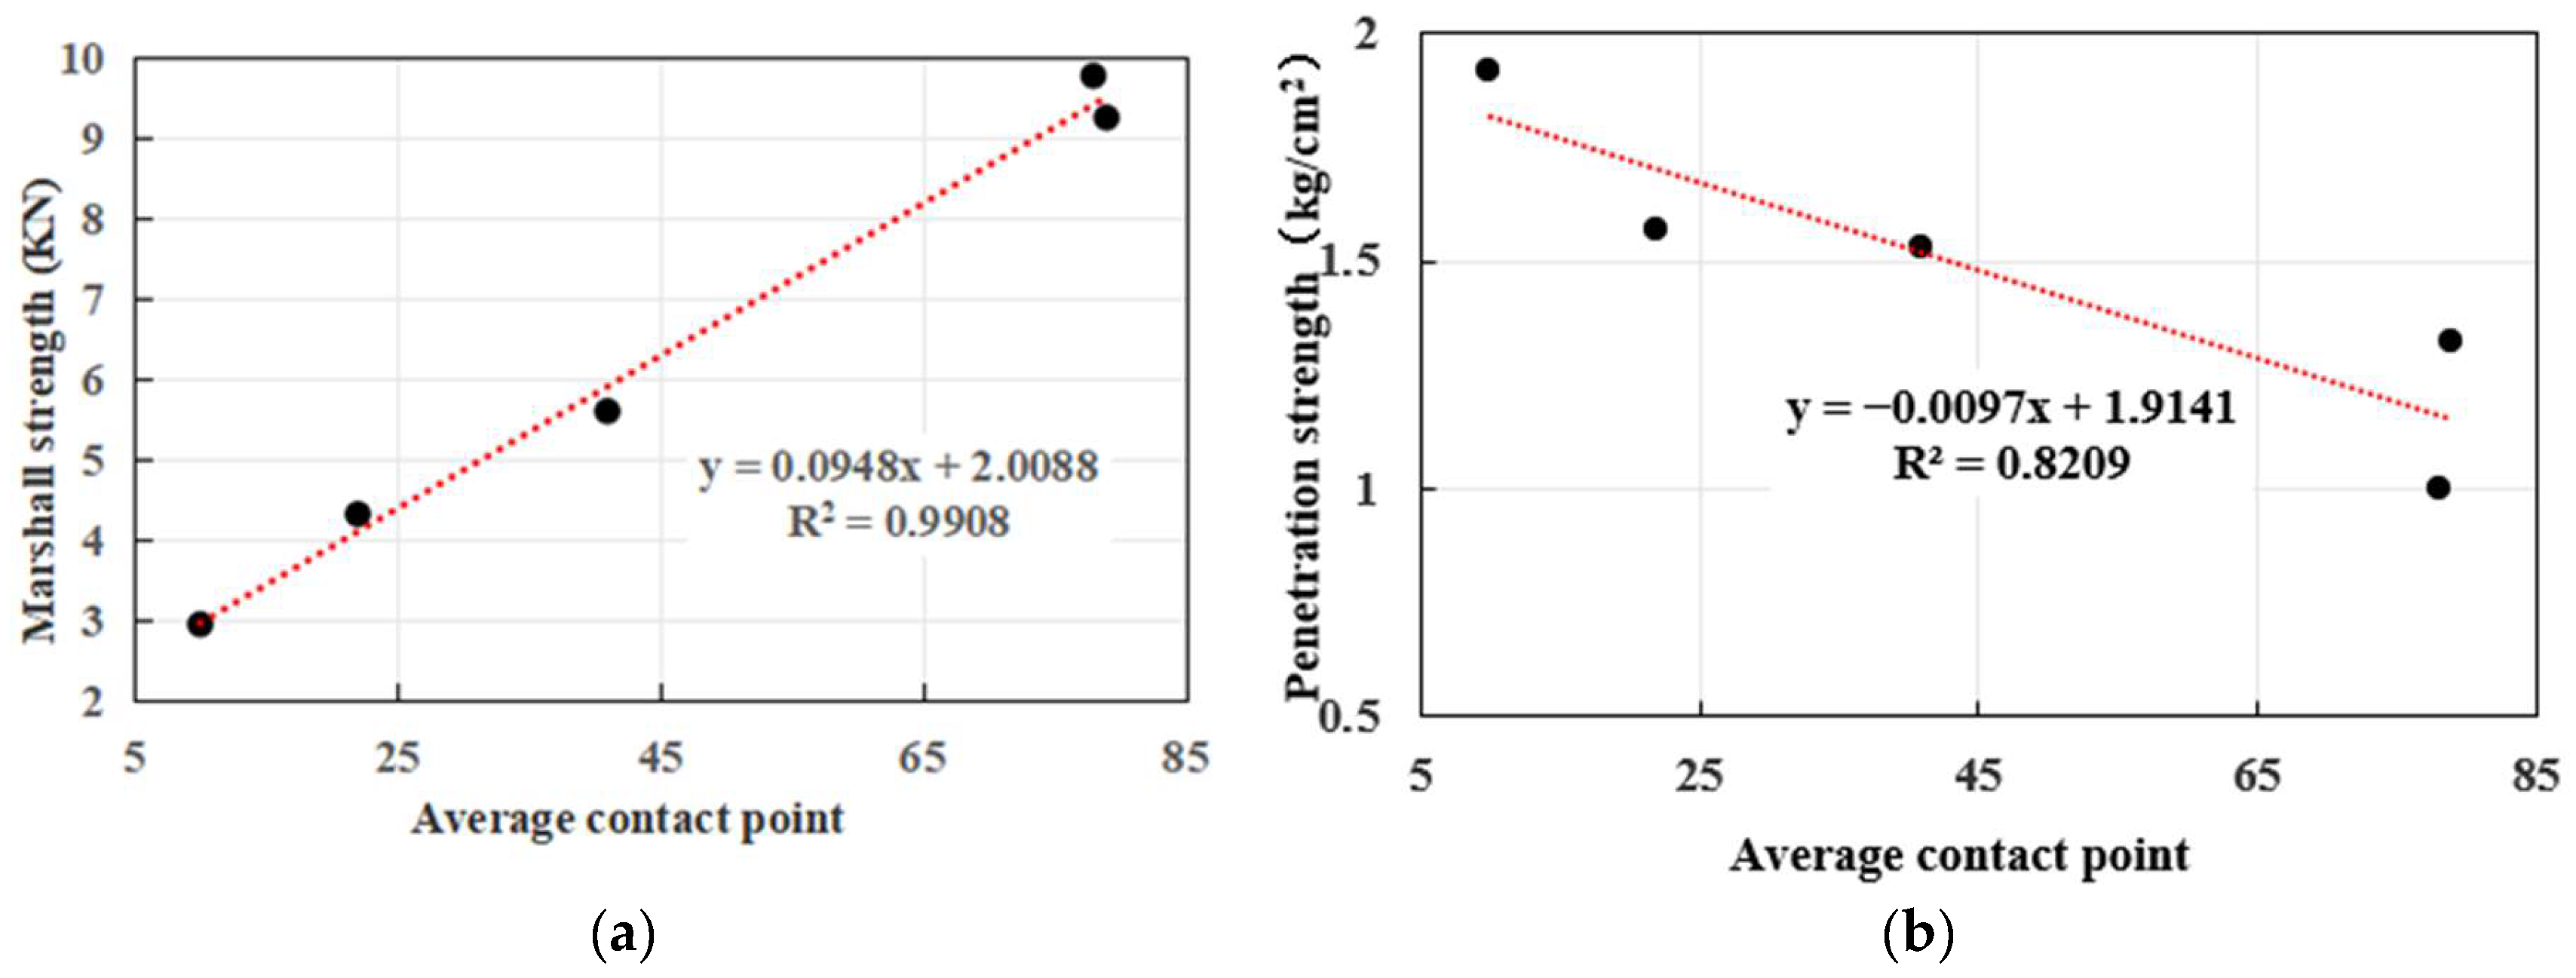
The identified relationships between contact characteristics and aggregate compactness form the basis for strength-performance correlation analysis. In
Figure 14a, Marshall stability tests demonstrate a direct correlation between contact number and mixture strength, where greater inter-particle contacts enhance load-bearing capacity and prolong pothole repair service life.
In
Figure 14b, penetration strength analysis indicates an inverse linear relationship with the contact number, showing better compaction performance at higher contact densities. This pattern suggests that increased inter-particle contacts improve aggregate interlock and packing density, leading to superior initial strength development. These properties are especially advantageous for supporting traffic loads immediately after pothole repair.
These results collectively establish the coordination number as a reliable microstructural parameter for predicting and optimizing CPAM performance, especially regarding strength development and compaction characteristics.
4. Discussion
This study has systematically advanced the evaluation of CPAM material properties. A comprehensive performance assessment framework encompassing both construction adaptability and long-term durability has been established. Through CT-based reconstruction technology, quantitative relationships between micro-porosity structures and macroscopic performance indicators have been developed. The findings provide enhanced scientific support for CPAM selection.
The research adopts the working hypothesis that CPAM damage mechanisms can be structurally modeled, where material composition parameters (e.g., aggregate size, asphalt content) exhibit predictable influence pathways on performance indicators (e.g., molding strength, water stability) within defined ranges.
However, the study incorporates several idealized assumptions, including the following: (1) negligible binder effects on CPAM performance due to the lack of access to binder composition or properties in the long-stored commercial mixtures used, (2) standardized patching procedures in field applications, and (3) exclusion of service-period factors like material aging and thermal deformation. While these assumptions facilitate modeling, they may introduce discrepancies in practical implementation.
Future research should prioritize field validation under diverse construction conditions, incorporating variables such as pavement structure, pothole geometry, and traffic loading patterns. Long-term performance monitoring is recommended to optimize the evaluation framework and develop performance-based CPAM specifications.


