Assessing the Techno-Economic Feasibility of Bamboo Residue-Derived Hard Carbon


Abstract
1. Introduction
2. Materials and Methods
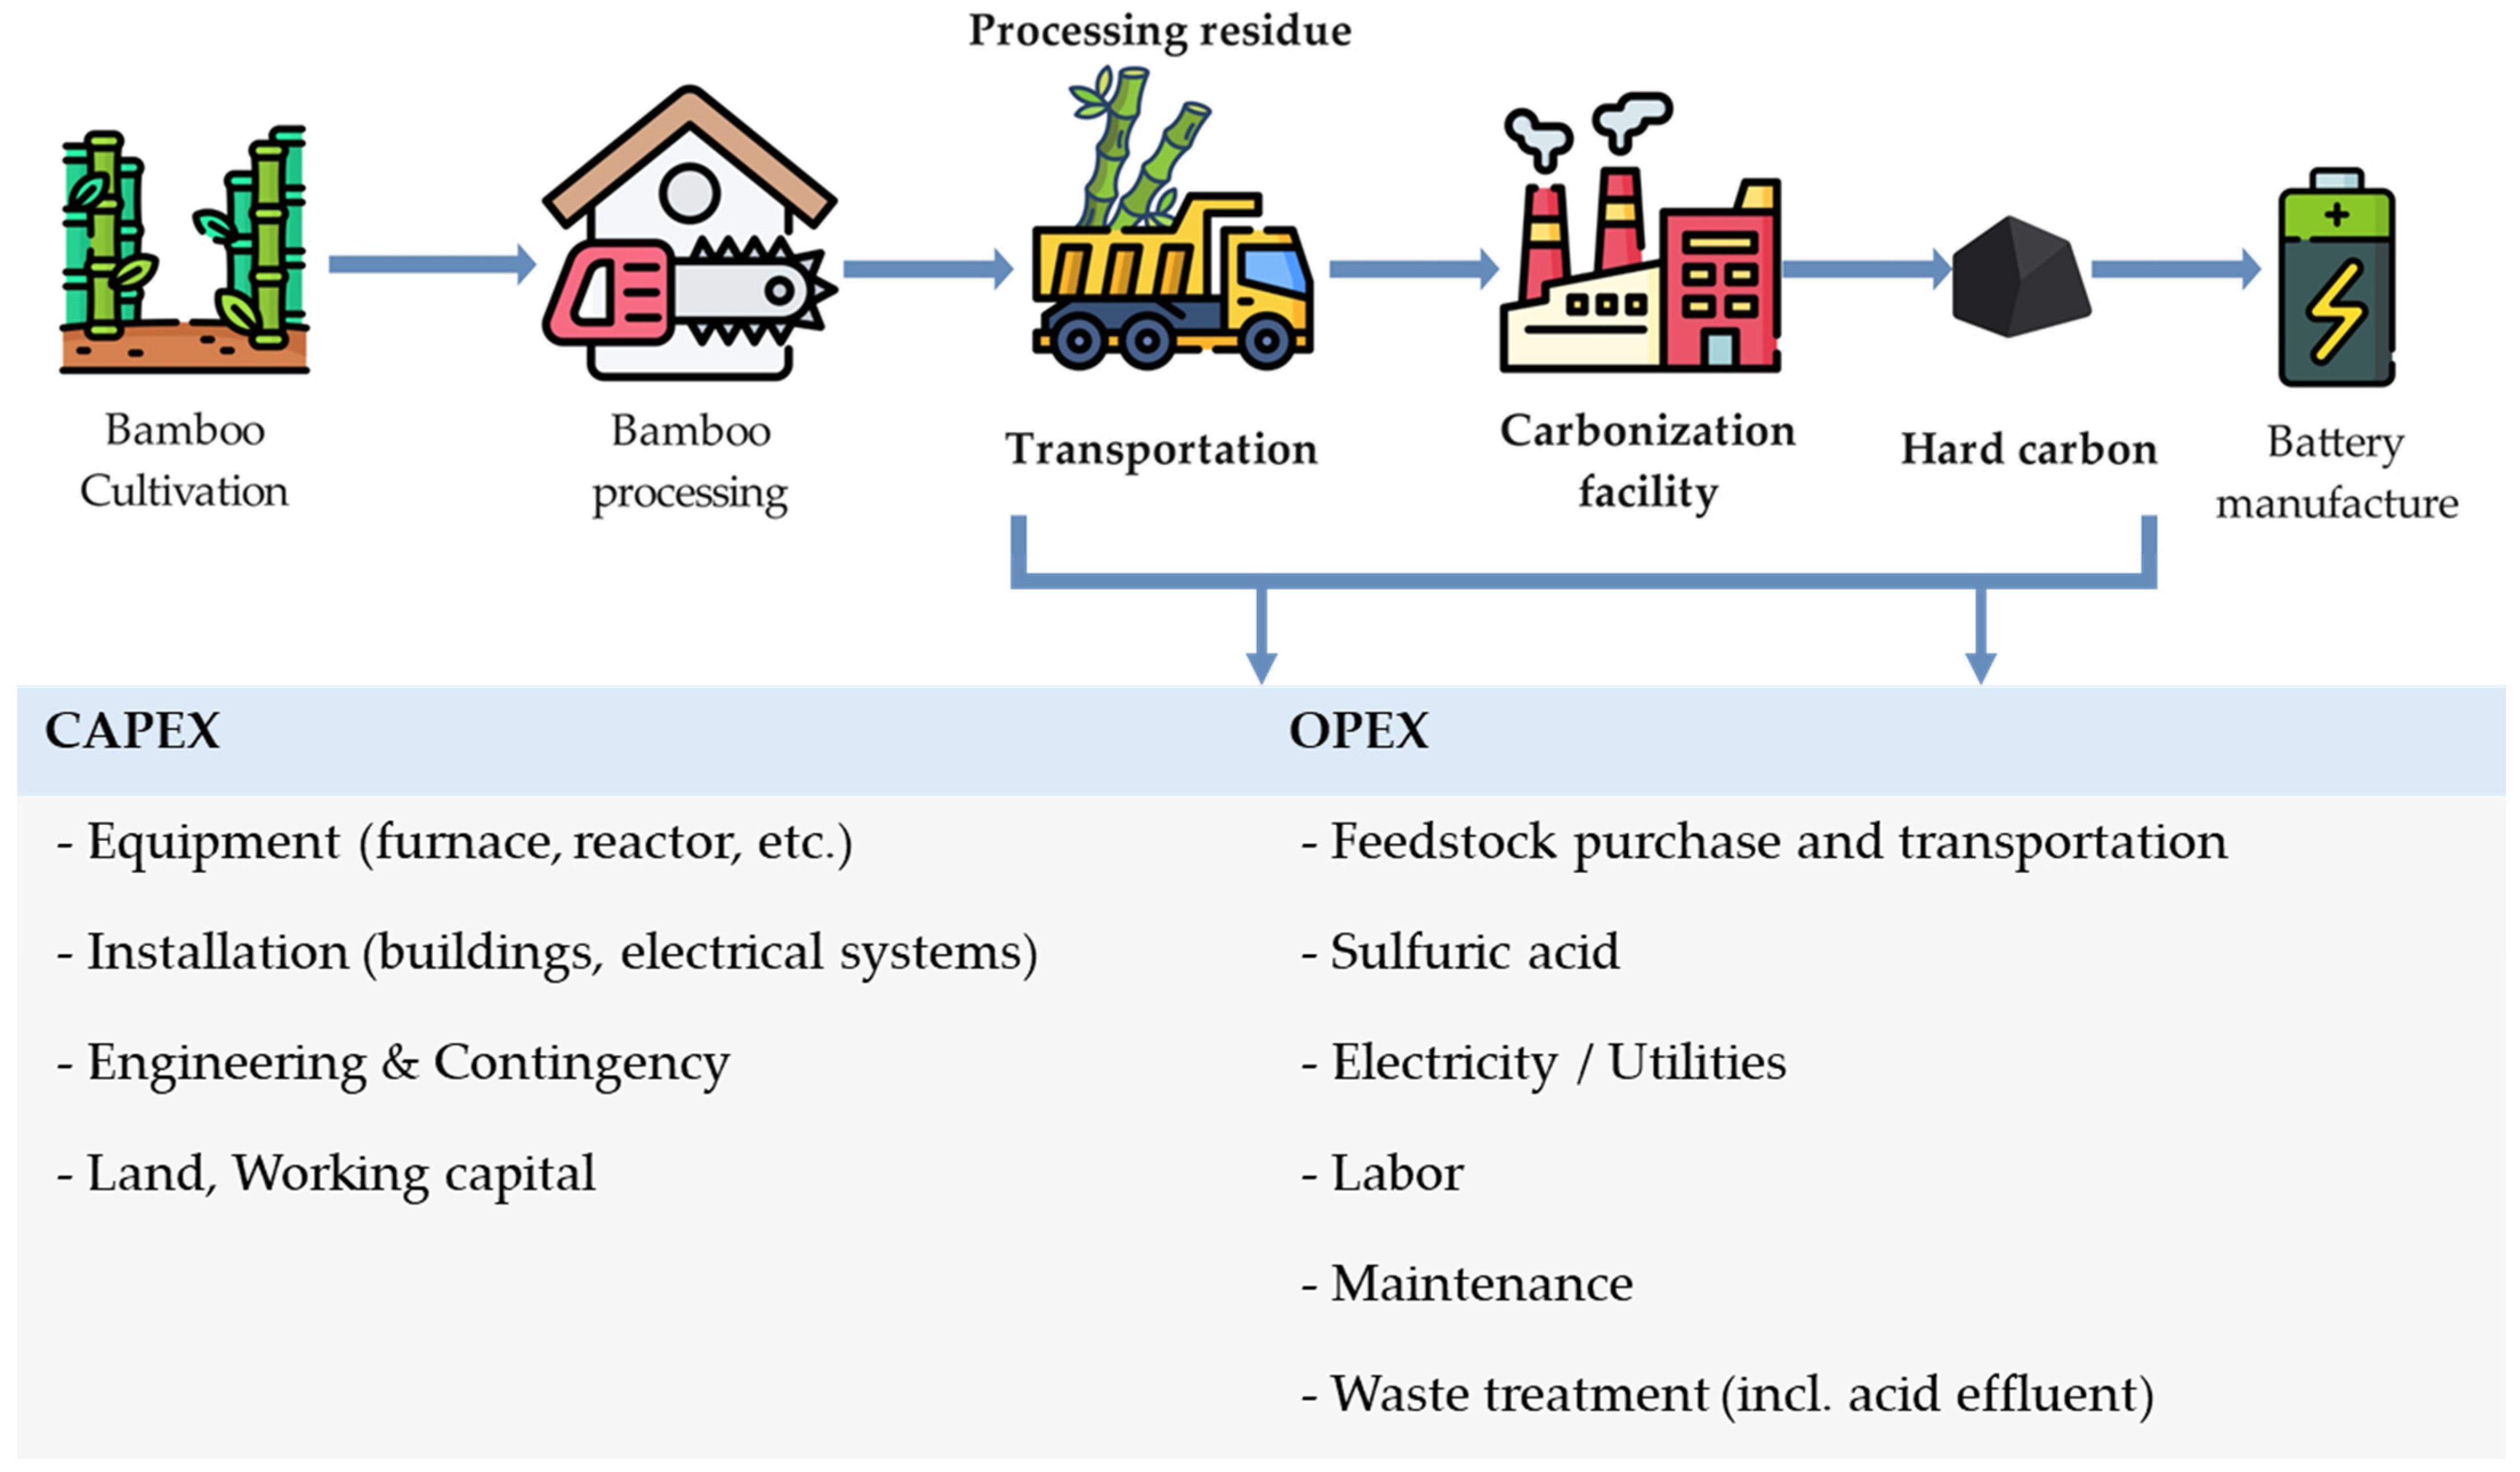
2.1. Hard Carbon Manufacturing Process
2.2. Feedstock Availability, Transportation Model, and Cost Assumptions
2.3. Manufacturing Data
2.4. Discounted Cash Flow Analysis
2.4.1. Capital Expenditure Estimation
2.4.2. Operating Expenditure Assumptions
2.4.3. Financial Structure and MSP Calculation
2.4.4. Sensitivity Analysis
3. Results
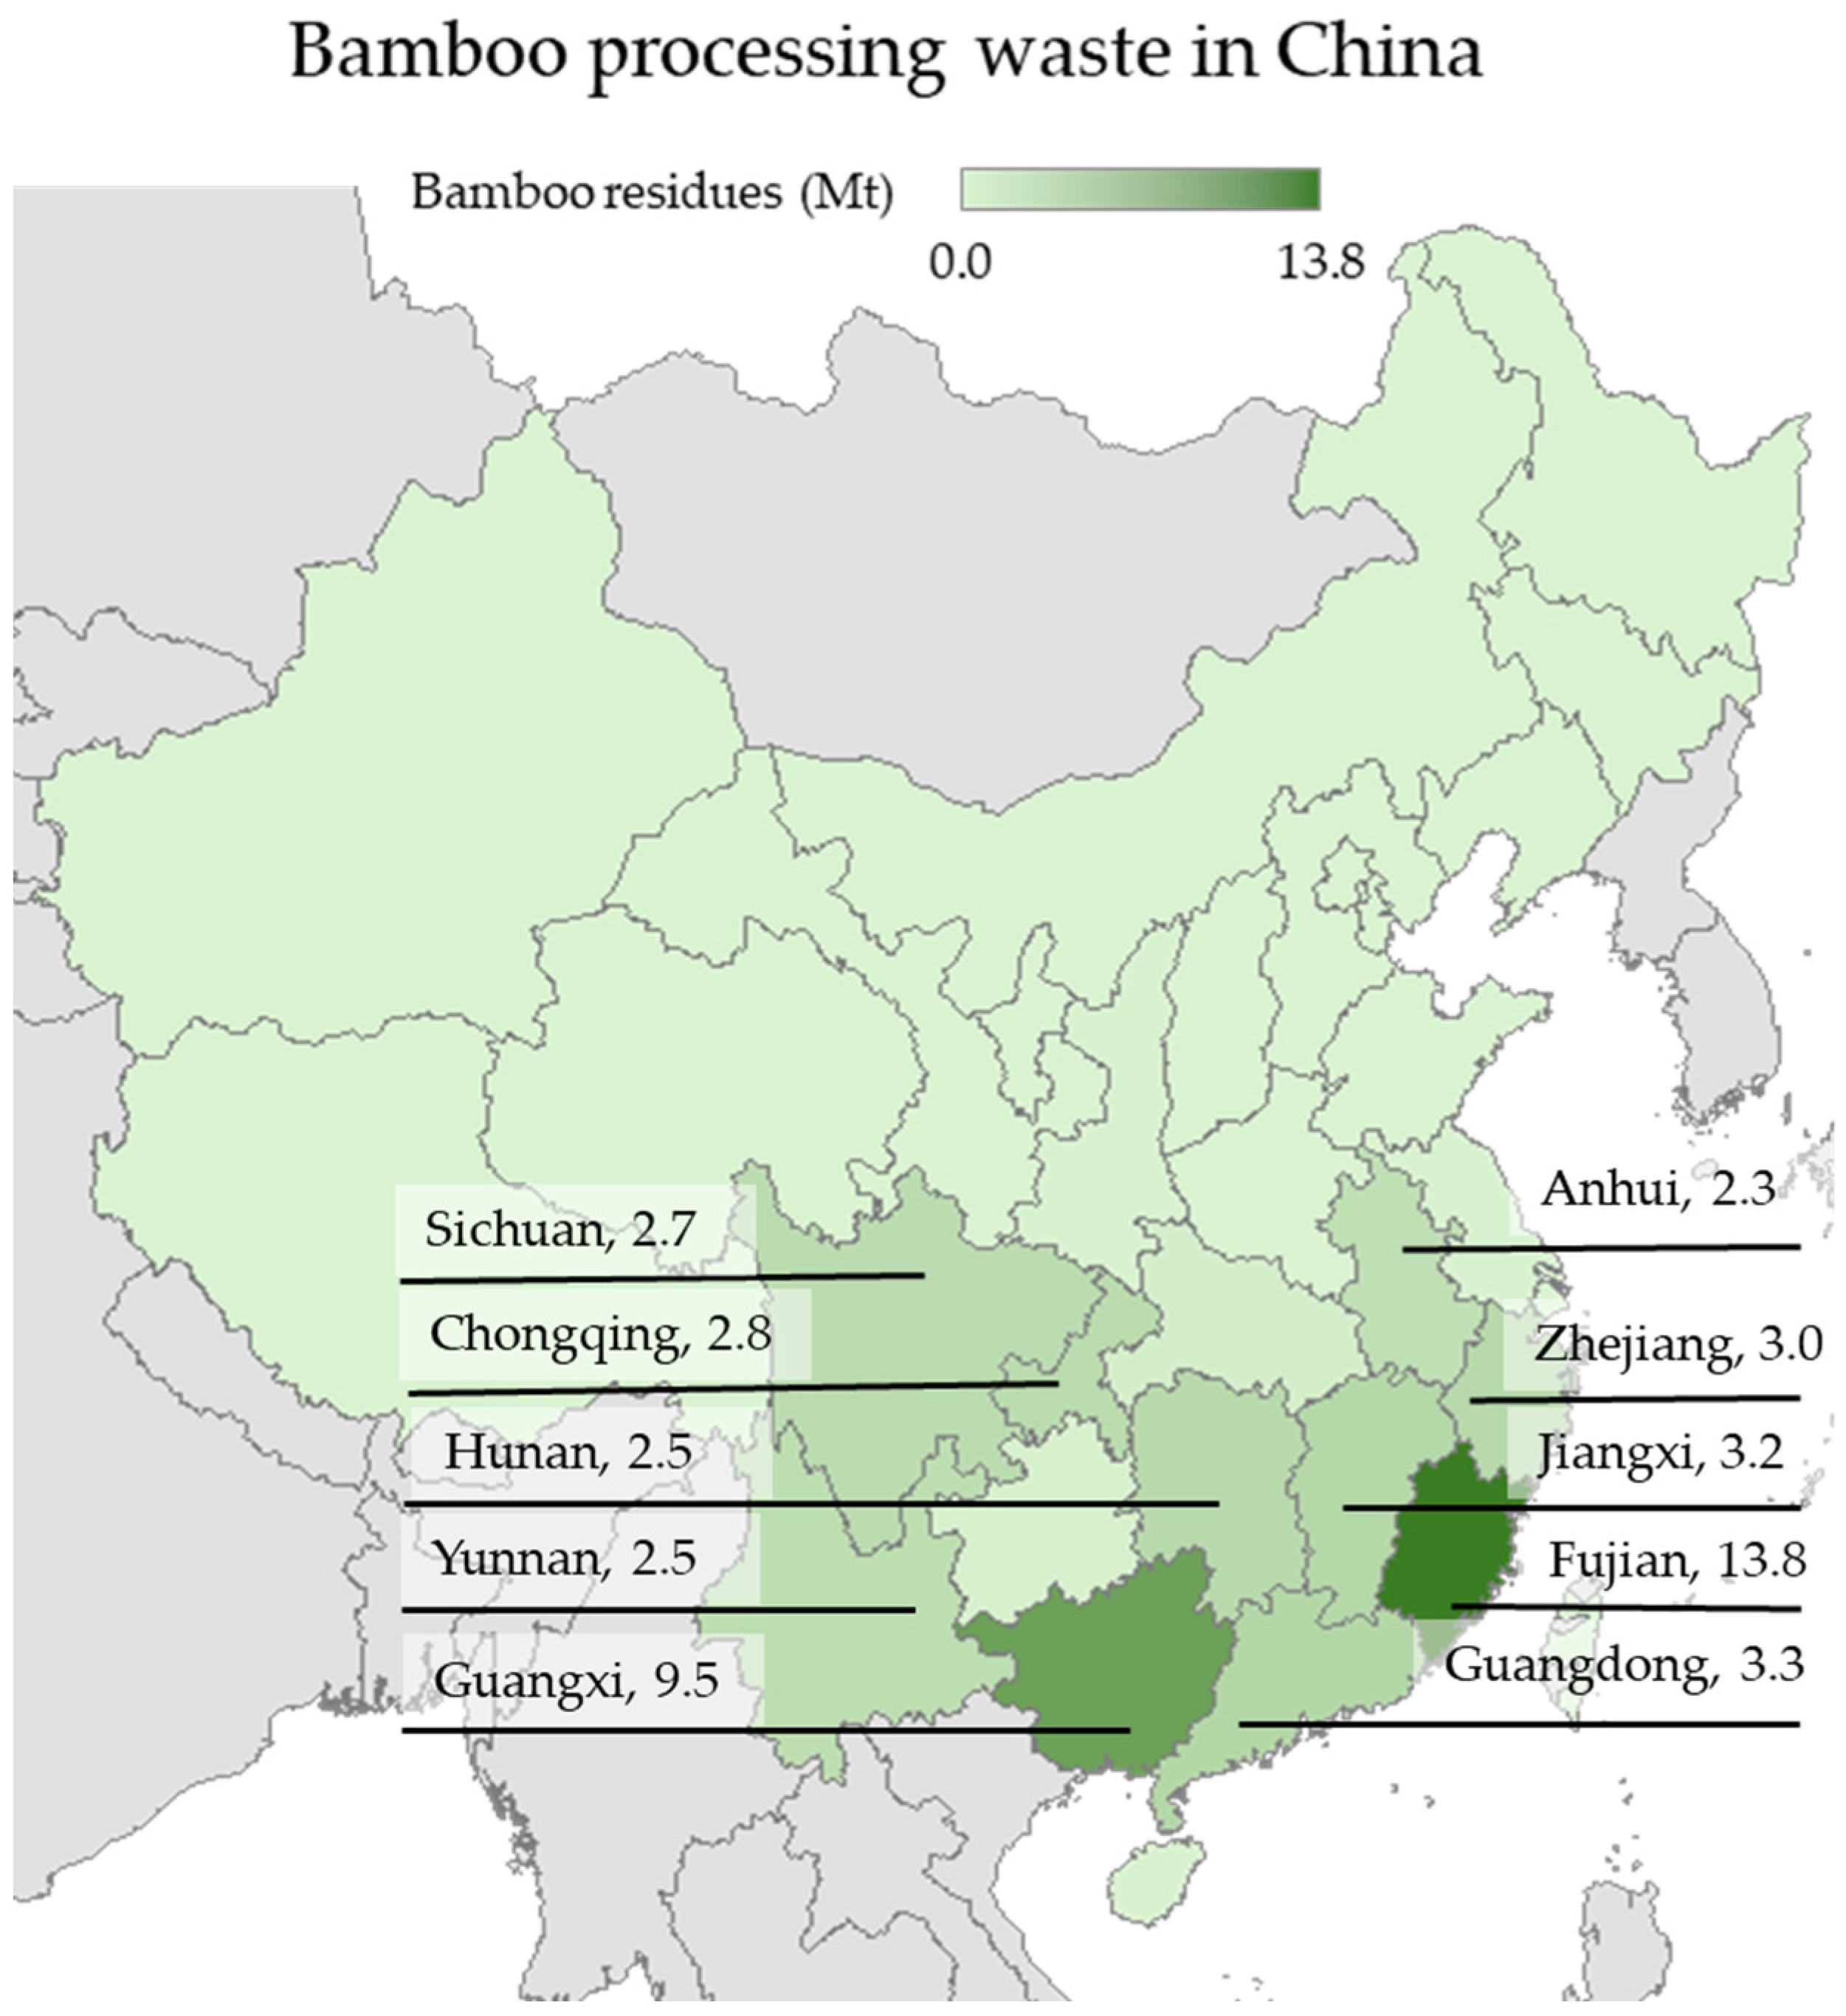
3.1. Feedstock and Transportation Analysis
3.2. Capital Cost
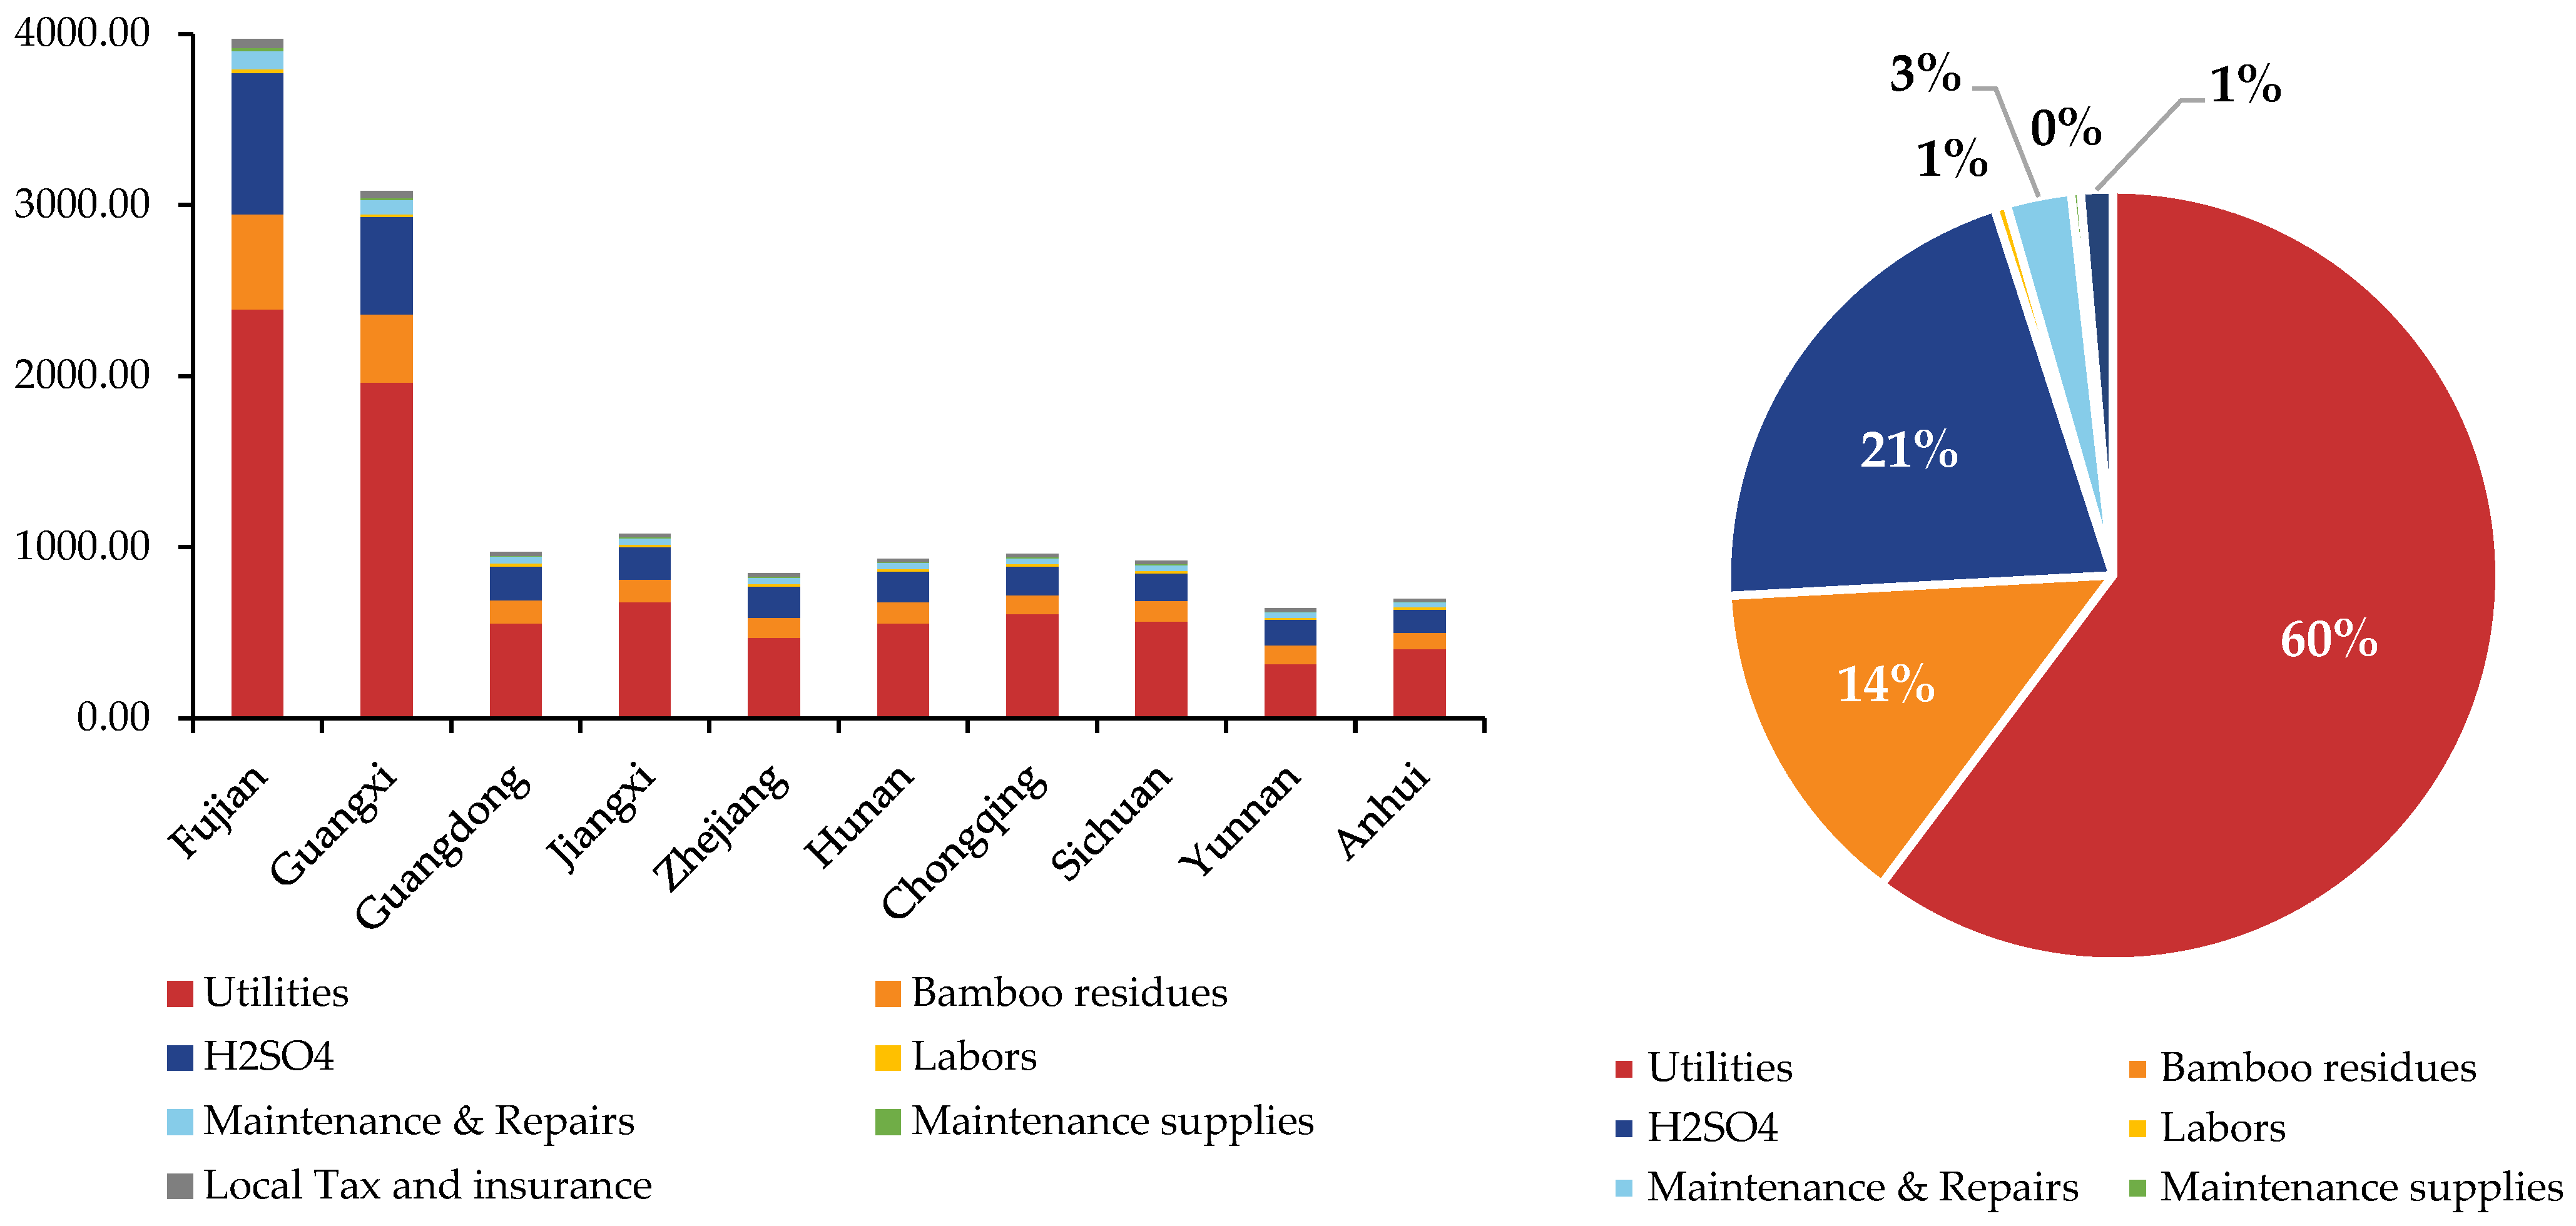
3.3. Operating Cost
3.4. Minimum Selling Price
3.5. Sensitivity Analysis Insights
4. Discussion
5. Conclusions
Author Contributions
Funding
Data Availability Statement
Acknowledgments
Conflicts of Interest
Abbreviations
| BR | Bamboo Residue |
| CAPEX | Capital Expenditure |
| CEPCI | Chemical Engineering Plant Cost Index |
| CNY | Chinese Yuan |
| DCF | Discounted Cash Flow |
| DE | Euclidean Distance |
| DR | Road-Based Transport Distance |
| DOE | Department of Energy |
| El | Electricity |
| FCI | Fixed Capital Investment |
| IRR | Internal Rate of Return |
| LCA | Life Cycle Assessment |
| LCI | Life Cycle Inventory |
| MACRS | Modified Accelerated Cost Recovery System |
| MSP | Minimum Selling Price |
| OPEX | Operating Expenditure |
| ROI | Return on Investment |
| TEA | Techno-Economic Analysis |
| TCI | Total Capital Investment |
| tkm | Ton-Kilometer |
| USD | United States dollar |
Appendix A

| Economic Parameters | Description |
|---|---|
| Equity | 40% of FCI |
| Loan Interest | 0.05 |
| Loan Term | 10 years |
| Plant Life | 30 years |
| Income Tax Rate | 25% |
| Construction Period | 3 years |
| % Spent in Year −2 | 8% |
| % Spent in Year −1 | 60% |
| % Spent in Year 0 | 32% |
| Start-up Time | 0.5 years |
| Land Cost | 6% of Costequip |
| CAPEX | |
| 1. Direct cost | |
| 1.1 Purchased equipment | Costequip |
| 1.2 Equipment installation | 40% of Costequip |
| 1.3 Instrumentation and controls | 20% of Costequip |
| 1.4 Piping | 15% of Costequip |
| 1.5 Electrical systems | 15% of Costequip |
| 1.6 Buildings | 30% of Costequip |
| 1.7 Yard improvements | 10% of Costequip |
| 1.8 Service facilities | 20% of Costequip |
| 2. Indirect capital cost | |
| 2.1 Engineering and supervision | 25% of Costequip |
| 2.2 Contingency | 30% of Costequip |
| 2.3 Contractors fees/overheads/profits | 10% of Costequip |
| 2.4 Start-up | 10% of Costequip |
| 3. Additional investment | |
| 3.1 Working capital | 15% of FCI |
| Fixed capital investment (FCI) | FCI = direct cost + indirect cost |
| Total capital investment (TCI) | TCI = FCI + WC |
| OPEX | |
| Raw materials collection | Depend on BR price and transportation cost |
| Labor hours | DOE Labor Estimator Mini Tool |
| Overheads | 0.95 |
| Maintenance and repairs | 6% of FCI |
| Maintenance supplies | 15% of maintenance and repairs |
| Depreciation | MACRS 7 years model |
| Local taxes and insurance | 3% of FCI |
| Equipment Cost | Equipment Installation | Other Direct Cost | Indirect Cost | Working Capital | |
|---|---|---|---|---|---|
| Fujian | 548.20 | 219.28 | 603.02 | 411.15 | 267.25 |
| Guangxi | 422.11 | 168.84 | 464.32 | 316.58 | 205.78 |
| Guangdong | 201.36 | 80.55 | 221.50 | 151.02 | 98.16 |
| Jiangxi | 197.07 | 78.83 | 216.78 | 147.80 | 96.07 |
| Zhejiang | 188.37 | 75.35 | 207.20 | 141.28 | 91.83 |
| Hunan | 188.37 | 75.35 | 207.20 | 141.28 | 91.83 |
| Chongqing | 179.49 | 71.79 | 197.43 | 134.61 | 87.50 |
| Sichuan | 174.97 | 69.99 | 192.47 | 131.23 | 85.30 |
| Yunnan | 165.80 | 66.32 | 182.38 | 124.35 | 80.83 |
| Anhui | 156.40 | 62.56 | 172.04 | 117.30 | 76.24 |
| Utilities | Bamboo Residues | H2SO4 | Labors | Maintenance and Repairs | Maintenance Supplies | Local Tax and Insurance | |
|---|---|---|---|---|---|---|---|
| Fujian | 2391.32 | 552.30 | 828.00 | 21.63 | 106.90 | 16.03 | 53.45 |
| Guangxi | 1961.84 | 399.08 | 570.00 | 15.06 | 82.31 | 12.35 | 41.16 |
| Guangdong | 553.56 | 135.66 | 198.00 | 18.30 | 39.27 | 5.89 | 19.63 |
| Jiangxi | 678.55 | 130.84 | 192.00 | 12.43 | 38.43 | 5.76 | 19.21 |
| Zhejiang | 470.01 | 119.05 | 180.00 | 16.48 | 36.73 | 5.51 | 18.37 |
| Hunan | 553.08 | 124.89 | 180.00 | 13.36 | 36.73 | 5.51 | 18.37 |
| Chongqing | 609.24 | 109.59 | 168.00 | 13.94 | 35.00 | 5.25 | 17.50 |
| Sichuan | 565.05 | 121.56 | 162.00 | 13.43 | 34.12 | 5.12 | 17.06 |
| Yunnan | 315.53 | 110.09 | 150.00 | 11.45 | 32.33 | 4.85 | 16.17 |
| Anhui | 404.92 | 92.91 | 138.00 | 12.38 | 30.50 | 4.57 | 15.25 |
| Bamboo Residues | H2SO4 | Utilities | Fixed Costs | Capital Depreciation | Average Income Tax | Average Return on Investment | Total MSP | |
|---|---|---|---|---|---|---|---|---|
| Fujian | 1.78 | 2.67 | 5.40 | 0.64 | 0.19 | 0.16 | 3.63 | 14.47 |
| Guangxi | 1.87 | 2.67 | 6.44 | 0.71 | 0.21 | 0.15 | 4.15 | 16.20 |
| Guangdong | 1.83 | 2.67 | 5.23 | 1.12 | 0.29 | 0.36 | 3.94 | 15.45 |
| Jiangxi | 1.82 | 2.67 | 6.61 | 1.06 | 0.30 | 0.20 | 4.49 | 17.14 |
| Zhejiang | 1.77 | 2.67 | 4.88 | 1.14 | 0.30 | 0.17 | 3.86 | 14.81 |
| Hunan | 1.85 | 2.67 | 5.75 | 1.10 | 0.30 | 0.29 | 4.39 | 16.35 |
| Chongqing | 1.74 | 2.67 | 6.78 | 1.14 | 0.31 | 0.22 | 4.67 | 17.54 |
| Sichuan | 2.00 | 2.67 | 6.52 | 1.15 | 0.31 | 0.28 | 5.21 | 18.15 |
| Yunnan | 1.96 | 2.67 | 3.93 | 1.15 | 0.32 | 0.26 | 4.25 | 14.54 |
| Anhui | 1.80 | 2.67 | 5.49 | 1.21 | 0.33 | 0.29 | 4.83 | 16.62 |
| Sensitivity Parameters | Parameter Description | Result (CNY/kg Hard Carbon) | ||
|---|---|---|---|---|
| Low Value | Baseline | High Value | ||
| Labor salary (CNY/year) | Low: 4294/Base: 5638/High: 6724 | 14.46 | 14.47 | 14.49 |
| Equity percentage | Low: 0.2/Base: 0.4/High: 0.6 | 14.43 | 14.47 | 14.51 |
| Average transportation distance (km) | Low: −20%/Base: 0/High: +20% | 14.43 | 14.47 | 14.52 |
| Income Tax Rate | Low: 0.15/Base: 0.25/High: 0.35 | 14.40 | 14.47 | 14.56 |
| Transportation price (CNY/tkm) | Low: 0.2/Base: 0.3/High: 0.4 | 14.39 | 14.47 | 14.55 |
| Scaling factor | Low: 0.6/Base: 0.7/High: 0.8 | 14.61 | 14.47 | 14.35 |
| Bamboo residue price (CNY/ton) | Low: 200/Base: 350/High: 500 | 13.76 | 14.47 | 15.18 |
| H2SO4 price (CNY/ton) | Low: 500/Base: 750/High: 1000 | 13.53 | 14.47 | 15.42 |
| El price (CNY/kWh) | Low: 0.45/Base: 0.62/High: 0.78 | 12.25 | 14.47 | 16.57 |
| Hard carbon yield | Low: −20%/Base:0/High: +20% | 17.82 | 14.47 | 12.23 |
| Electricity efficiency | Low: 0.5/Base: 0.7/High: 0.9 | 22.29 | 14.47 | 11.25 |
References
- Sánchez, A.; Zhang, Q.; Martín, M.; Vega, P. Towards a new renewable power system using energy storage: An economic and social analysis. Energy Convers. Manag. 2022, 252, 115056. [Google Scholar] [CrossRef]
- Li, G.; Hua, Z.; Yang, J.; Hu, H.; Zheng, J.; Ma, X.; Lin, J.; Cao, S. Bamboo—A potential lignocellulosic biomass for preparation of hard carbon anode used in sodium ion battery. Biomass Bioenergy 2025, 194, 107673. [Google Scholar] [CrossRef]
- Long, Y.; Zhang, J.; Li, P.; Han, J.; Geng, C.; Yang, Q.-H. Carbonaceous Electrode Materials. In Encyclopedia of Energy Storage; Cabeza, L.F., Ed.; Elsevier: Oxford, UK, 2022; pp. 47–65. [Google Scholar]
- Thompson, M.; Xia, Q.; Hu, Z.; Zhao, X.S. A review on biomass-derived hard carbon materials for sodium-ion batteries. Mater. Adv. 2021, 2, 5881–5905. [Google Scholar] [CrossRef]
- Jin, Y.; Shi, Z.; Han, T.; Yang, H.; Asfaw, H.D.; Gond, R.; Younesi, R.; Jönsson, P.G.; Yang, W. From Waste Biomass to Hard Carbon Anodes: Predicting the Relationship between Biomass Processing Parameters and Performance of Hard Carbons in Sodium-Ion Batteries. Processes 2023, 11, 764. [Google Scholar] [CrossRef]
- Mettler, M.S.; Vlachos, D.G.; Dauenhauer, P.J. Top ten fundamental challenges of biomass pyrolysis for biofuels. Energy Environ. Sci. 2012, 5, 7797–7809. [Google Scholar] [CrossRef]
- Li, J.; Jin, Y.; Sun, K.; Wang, A.; Zhang, G.; Zhou, L.; Yang, W.; Fan, M.; Jiang, J.; Wen, Y.; et al. Unveiling the role of lignin in biomass-derived hard carbon anodes via machine learning. J. Power Sources 2025, 631, 236323. [Google Scholar] [CrossRef]
- Li, Y.; Vasileiadis, A.; Zhou, Q.; Lu, Y.; Meng, Q.; Li, Y.; Ombrini, P.; Zhao, J.; Chen, Z.; Niu, Y.; et al. Origin of fast charging in hard carbon anodes. Nat. Energy 2024, 9, 134–142. [Google Scholar] [CrossRef]
- Wang, A.; Zhang, G.; Li, M.; Sun, Y.; Tang, Y.; Sun, K.; Lee, J.-M.; Fu, G.; Jiang, J. Lignin derived hard carbon for sodium ion batteries: Recent advances and future perspectives. Prog. Mater. Sci. 2025, 152, 101452. [Google Scholar] [CrossRef]
- Kuttiraja, M.; Sindhu, R.; Varghese, P.E.; Sandhya, S.V.; Binod, P.; Vani, S.; Pandey, A.; Sukumaran, R.K. Bioethanol production from bamboo (Dendrocalamus sp.) process waste. Biomass Bioenergy 2013, 59, 142–150. [Google Scholar] [CrossRef]
- Gao, T.; Zhou, Y.; Jiang, Y.; Xue, Z.; Ding, Y. Bamboo waste derived hard carbon as high performance anode for sodium-ion batteries. Diam. Relat. Mater. 2024, 150, 111737. [Google Scholar] [CrossRef]
- Li, Y.; Wang, N.; Latiff, A.R.A. Development of the bamboo forest economy: Reviewing China’s ‘bamboo as a substitute for plastic initiative’ and its development. Adv. Bamboo Sci. 2025, 11, 100130. [Google Scholar] [CrossRef]
- Gilani, H.R.; Ibrik, K.; Sanchez, D.L. Techno-economic and policy analysis of hydrogen and gasoline production from forest biomass, agricultural residues and municipal solid waste in California. Biofuels Bioprod. Biorefining 2023, 17, 988–1002. [Google Scholar] [CrossRef]
- Ran, B.; Ma, Y.; Tian, H.; Zhu, Y.; Qi, C.; Shang, L. The joint production of green diesel and activated carbon from spent coconut shells (SCS): An energy techno-economic and Life Cycle Assessment case for China. J. Clean. Prod. 2024, 472, 143319. [Google Scholar] [CrossRef]
- Jiang, P.; Zhao, G.; Liu, L.; Zhang, H.; Mu, L.; Lu, X.; Zhu, J. A negative-carbon footprint process with mixed biomass feedstock maximizes conversion efficiency, product value and CO2 mitigation. Bioresour. Technol. 2022, 351, 127004. [Google Scholar] [CrossRef]
- Struhs, E.; Mirkouei, A.; You, Y.; Mohajeri, A. Techno-economic and environmental assessments for nutrient-rich biochar production from cattle manure: A case study in Idaho, USA. Appl. Energy 2020, 279, 115782. [Google Scholar] [CrossRef]
- Liu, H.; Baumann, M.; Moon, H.; Zhang, X.; Dou, X.; Zarrabeitia, M.; Crenna, E.; Hischier, R.; Passerini, S.; Assen, N.v.d.; et al. Life cycle assessment of bio-based hard carbon for sodium-ion batteries across different production scales. Chem. Eng. J. 2024, 495, 153410. [Google Scholar] [CrossRef]
- Wang, R.; Cai, W.; Yu, L.; Li, W.; Zhu, L.; Cao, B.; Li, J.; Shen, J.; Zhang, S.; Nie, Y.; et al. A high spatial resolution dataset of China’s biomass resource potential. Sci. Data 2023, 10, 384. [Google Scholar] [CrossRef]
- Stone, R.E. Technical Note—Some Average Distance Results. Transp. Sci. 1991, 25, 83–90. [Google Scholar] [CrossRef]
- Yang, H.; Ke, J.; Ye, J. A universal distribution law of network detour ratios. Transp. Res. Part C Emerg. Technol. 2018, 96, 22–37. [Google Scholar] [CrossRef]
- Daily, P.S. National People’s Congress Deputy Proposes “Turning Waste INTO Value” to Develop the Bamboo Industry. Available online: https://paper.people.com.cn/rmrb/html/2023-01/13/nw.D110000renmrb_20230113_1-13.htm (accessed on 27 May 2025).
- News, T. Bamboo Industry Drives Green Development: From Waste Residues to New Material Supply Chains. Available online: https://tidenews.com.cn/news.html?id=2646989 (accessed on 27 May 2025).
- Finance, S. Turning Bamboo into “Gold”: Chinese Provinces Explore Bamboo Industry Development as Experts Call for National Standards. Available online: https://cj.sina.com.cn/articles/view/7517400647/1c0126e4705906ulte?froms=ggmp (accessed on 27 May 2025).
- Daily, P.S. Logistics Prices Remain Stable While Green Freight Continues to Advance. Available online: https://paper.people.com.cn/rmrb/html/2024-04/24/nw.D110000renmrb_20240424_1-18.htm (accessed on 27 May 2025).
- Yadav, G.; Singh, A.; Dutta, A.; Uekert, T.; DesVeaux, J.S.; Nicholson, S.R.; Tan, E.C.D.; Mukarakate, C.; Schaidle, J.A.; Wrasman, C.J.; et al. Techno-economic analysis and life cycle assessment for catalytic fast pyrolysis of mixed plastic waste. Energy Environ. Sci. 2023, 16, 3638–3653. [Google Scholar] [CrossRef]
- Kobe, K.A. Plant Design and Economics for Chemical Engineers (Peters, Max S.). J. Chem. Educ. 1958, 35, A506. [Google Scholar] [CrossRef]
- Dutta, A.; Sahir, A.H.; Tan, E.; Humbird, D.; Snowden-Swan, L.J.; Meyer, P.A.; Ross, J.; Sexton, D.; Yap, R.; Lukas, J. Process Design and Economics for the Conversion of Lignocellulosic Biomass to Hydrocarbon Fuels: Thermochemical Research Pathways with In Situ and Ex Situ Upgrading of Fast Pyrolysis Vapors; Pacific Northwest National Lab. (PNNL): Richland, WA, USA, 2015; 275p. [Google Scholar]
- Alibaba. Zhuzhou Silicon Carbide Vacuum Sintering Furnace Product Page. Available online: https://chinese.alibaba.com/product-detail/Zhuzhou-Silicon-Carbide-Vacuum-Sintering-Sintering-60725557700.html (accessed on 27 May 2025).
- ChemicalBook. Sulfuric Acid Price Index. Available online: https://m.chemicalbook.com/priceindex_cb9675634.htm (accessed on 27 May 2025).
- Nengy.net. 2024 Provincial Electricity Prices in China (Industrial, Residential, Agricultural). Available online: https://www.nengy.net/m/view.php?aid=1767 (accessed on 27 May 2025).
- Silla, H. Chemical Process Engineering; CRC Press: Boca Raton, FL, USA, 2003. [Google Scholar]
- US Department of Energy. Labor Cost Estimator Mini Tool; US Department of Energy: Washington, DC, USA, 2024. [Google Scholar]
- University of Minnesota Human Rights Library. China Administrative Divisions by Area. Available online: http://hrlibrary.umn.edu/research/china-admin.html (accessed on 16 June 2025).
- Company, T.B.R. The Global Market for Graphite 2025–2035. Available online: https://www.globenewswire.com/news-release/2024/11/20/2984181/28124/en/The-Global-Market-for-Graphite-2025-2035.html (accessed on 26 May 2025).
- Wan, F. Latest SIB Anode Hard Carbon Research Update: What’s New in Sodium-Ion Battery Anodes? Available online: https://www.linkedin.com/pulse/latest-sib-anode-hard-carbon-research-update-wan-sodium-ion-battery-fenqc/ (accessed on 26 May 2025).
- China Society for Environmental Sciences and Department of Science and Technology Standards, M.o.E.P. Case Compilation of National Environmental Protection Engineering Technology Centers (Water Sector). Available online: https://www.mee.gov.cn/ywgz/kjycw/tzyjszd/gjhjjstx/201811/P020181129550492569259.pdf? (accessed on 26 May 2025).
- H2O-China. Overview of China’s Urban Wastewater Treatment Costs: A 1.37 RMB/m3 National Average. Available online: https://www.h2o-china.com/news/112210.html (accessed on 16 June 2025).
- AnalytIQ, B. Activated Carbon Price Index. Available online: https://businessanalytiq.com/procurementanalytics/index/activated-carbon-prices/ (accessed on 16 June 2025).
- Resources, W. Graphite Market Overview. Available online: https://westwaterresources.net/minerals-portfolio/graphite-market/ (accessed on 16 June 2025).
- Engels, P.; Cerdas, F.; Dettmer, T.; Frey, C.; Hentschel, J.; Herrmann, C.; Mirfabrikikar, T.; Schueler, M. Life cycle assessment of natural graphite production for lithium-ion battery anodes based on industrial primary data. J. Clean. Prod. 2022, 336, 130474. [Google Scholar] [CrossRef]
- Wang, S.; Yang, H.; Shi, Z.; Zaini, I.N.; Wen, Y.; Jiang, J.; Jönsson, P.G.; Yang, W. Renewable hydrogen production from the organic fraction of municipal solid waste through a novel carbon-negative process concept. Energy 2022, 252, 124056. [Google Scholar] [CrossRef]


| Materials/kg | Power/kWh | ||||||||
|---|---|---|---|---|---|---|---|---|---|
| Specific input | BR | H2SO4 | Water | Stirring | Washing | Drying | Pyrolysis | Carbonization | Milling |
| Value | 4.45 | 3.56 | 10.43 | 0.00040 | 0.037 | 0.64 | 3.35 | 1.98 | 0.03 |
| Parameter | Cost/CNY | Capacity |
|---|---|---|
| Feedstock and Product Treatment | 2,160,000 | 2000 tons per day |
| Pyrolysis | 223,920,000 | 2000 tons per day |
| Graphitization | 384,000,000 | 2000 tons per day |
| Cooling Water and Other Utilities | 33,840,000 | 2000 tons per day |
| Water Management | 51,840,000 | 2000 tons per day |
| Parameter | Low | Base | High |
|---|---|---|---|
| Labour salary (CNY/year) | 4294 | 5638 | 6724 |
| Equity percentage | 0.2 | 0.4 | 0.6 |
| Average transportation distance (km) | −20% | Baseline | +20% |
| Income Tax Rate | 0.15 | 0.25 | 0.35 |
| Transportation price (CNY/tkm) | 0.2 | 0.3 | 0.4 |
| Scaling factor | 0.6 | 0.7 | 0.8 |
| Bamboo residue price (CNY/ton) | 200 | 350 | 500 |
| H2SO4 price (CNY/ton) | 500 | 750 | 1000 |
| El price (CNY/kWh) | 0.45 | 0.62 | 0.78 |
| Hard carbon yield | −20% | Baseline | +20% |
| El efficiency | 0.5 | 0.7 | 0.9 |
| Province | Area (103 km2) [33] | Avg. Straight Distance (km) | Avg. Transport Distance (km) | Annual Bamboo Residue (Mt) [18] |
|---|---|---|---|---|
| Fujian | 121.4 | 129.7 | 167.4 | 13.8 |
| Guangxi | 236.7 | 181.2 | 233.6 | 9.5 |
| Guangdong | 179.8 | 157.9 | 203.6 | 3.3 |
| Jiangxi | 167.0 | 152.2 | 196.2 | 3.2 |
| Zhejiang | 105.5 | 120.9 | 156.1 | 3.0 |
| Hunan | 211.8 | 171.4 | 221.0 | 3.0 |
| Chongqing | 82.4 | 106.9 | 138.0 | 2.8 |
| Sichuan | 485.0 | 259.3 | 334.1 | 2.7 |
| Yunnan | 394.0 | 233.7 | 301.2 | 2.5 |
| Anhui | 140.1 | 139.4 | 179.8 | 2.3 |
Disclaimer/Publisher’s Note: The statements, opinions and data contained in all publications are solely those of the individual author(s) and contributor(s) and not of MDPI and/or the editor(s). MDPI and/or the editor(s) disclaim responsibility for any injury to people or property resulting from any ideas, methods, instructions or products referred to in the content. |
© 2025 by the authors. Licensee MDPI, Basel, Switzerland. This article is an open access article distributed under the terms and conditions of the Creative Commons Attribution (CC BY) license (https://creativecommons.org/licenses/by/4.0/).
Share and Cite
Qin, S.; Yu, C.; Jin, Y.; Zhang, G.; Xu, W.; Wang, A.; Fan, M.; Sun, K.; Wang, S. Assessing the Techno-Economic Feasibility of Bamboo Residue-Derived Hard Carbon. Appl. Sci. 2025, 15, 7113. https://doi.org/10.3390/app15137113
Qin S, Yu C, Jin Y, Zhang G, Xu W, Wang A, Fan M, Sun K, Wang S. Assessing the Techno-Economic Feasibility of Bamboo Residue-Derived Hard Carbon. Applied Sciences. 2025; 15(13):7113. https://doi.org/10.3390/app15137113
Chicago/Turabian StyleQin, Senqiang, Chenghao Yu, Yanghao Jin, Gaoyue Zhang, Wei Xu, Ao Wang, Mengmeng Fan, Kang Sun, and Shule Wang. 2025. "Assessing the Techno-Economic Feasibility of Bamboo Residue-Derived Hard Carbon" Applied Sciences 15, no. 13: 7113. https://doi.org/10.3390/app15137113
APA StyleQin, S., Yu, C., Jin, Y., Zhang, G., Xu, W., Wang, A., Fan, M., Sun, K., & Wang, S. (2025). Assessing the Techno-Economic Feasibility of Bamboo Residue-Derived Hard Carbon. Applied Sciences, 15(13), 7113. https://doi.org/10.3390/app15137113