Abstract
This study proposes a deep learning framework for Protein Secondary Structure Prediction (PSSP) that prioritizes computational efficiency while preserving classification accuracy. Leveraging ProtBERT-derived embeddings, we apply autoencoder-based dimensionality reduction to compress high-dimensional sequence representations. These are segmented into fixed-length subsequences, enabling efficient input formatting for a Bi-LSTM-based classifier. Our experiments, conducted on a curated PISCES-based dataset, reveal that reducing input dimensions from 1024 to 256 preserves over 99% of predictive performance (Q3 F1 score: 0.8049 → 0.8023) while reducing GPU memory usage by 67% and training time by 43%. Moreover, subsequence lengths of 50 residues provide an optimal trade-off between contextual learning and training stability. Compared to baseline configurations, the proposed framework reduces training overhead substantially without compromising structural accuracy in both the Q3 and Q8 classification schemes. These findings offer a practical pathway for scalable protein structure prediction, particularly in resource-constrained environments.
1. Introduction
Protein structure is a complex and hierarchical concept, encompassing several organizational levels that are critical for biological function. The primary structure, defined by the linear amino acid sequence encoded by DNA, determines the protein’s folding and, ultimately, its three-dimensional conformation [1]. At the secondary structure level, recurring spatial motifs such as helices, sheets, and random coils are formed and stabilized by hydrogen bonds between backbone amide and carbonyl groups [2]. These local conformations significantly influence the overall tertiary structure and, consequently, the biological activity of proteins [3].
Understanding protein structure is essential in biochemistry, molecular biology, and drug discovery. The well-established “sequence–structure–function” paradigm highlights the importance of predicting a protein’s 3D structure from its amino acid sequence [4,5]. Structural predictions enable the identification of drug-binding sites, protein–protein interactions, and conformational dynamics, facilitating the development of novel therapeutics [6,7,8].
Protein Secondary Structure Prediction (PSSP) combines experimental and computational techniques to infer local structural motifs. While X-ray crystallography and cryo-electron microscopy provide high-resolution data, they are labor-intensive and resource-demanding [9]. In contrast, advances in computational methods, particularly in machine learning (ML) and deep learning (DL), have substantially improved the prediction of protein structures from primary sequences [10].
CNNs have been employed to detect spatial hierarchies in amino acid sequences, contributing to fine-grained secondary structure predictions [11,12]. RNN-based models such as LSTMs and their bidirectional variants (Bi-LSTMs) are capable of modeling long-range dependencies and sequential context [13], which are crucial for accurate structure inference.
A transformative development in computational biology is the application of BERT (Bidirectional Encoder Representations from Transformers) models to protein sequences. BERT’s architecture enables bidirectional context modeling, allowing for the simultaneous consideration of preceding and succeeding amino acids [14]. This ability enhances interpretability and facilitates the extraction of high-level features relevant to structure and function. Among these models, ProtBERT has shown promising results in PSSP tasks. Trained on large-scale protein sequence datasets, it captures both structural and functional properties and can be fine-tuned for specific bioinformatics applications [15]. However, the use of BERT-derived embeddings introduces computational challenges due to their high dimensionality and the variable lengths of protein sequences.
Notably, the maximum token limit of 512 in BERT models imposes constraints on long protein sequences, often requiring truncation or sliding windows, which may result in the loss of important contextual information [16]. Furthermore, encoding the complexity of sequences comprising 20 amino acids in a model originally designed for natural language understanding necessitates careful adaptation.
In PSSP, two widely adopted classification schemes are Q3 and Q8. The Q3 model simplifies predictions into three categories: helix (H), strand (E), and coil (C). Q8 expands this into eight categories: helix (H), strand (E), turns (T), and various coil types (C, G, I, B, and S). While Q3 offers simplicity and higher per-residue accuracy, Q8 provides more nuanced structural information critical for advanced applications [4]. The choice between Q3 and Q8 depends on the required resolution for the intended biological or medical application.
The comprehensive goals and specific contributions of this study are presented below.
The primary objectives of this study are
- To develop a deep learning framework for protein secondary structure prediction that balances computational efficiency with predictive accuracy;
- To compress ProtBERT-derived high-dimensional embeddings using stacked autoencoders, enabling efficient representation without significant information loss;
- To implement a fixed-length subsequence strategy for the handling of variable-length protein sequences, thereby improving memory usage and model consistency;
- To empirically identify an optimal configuration that offers a practical trade-off between biological fidelity and computational cost;
- To evaluate the model’s performance across both Q3 and Q8 classification schemes using a comprehensive, high-quality dataset.
The main contributions of this study are
- A hybrid deep learning pipeline integrating ProtBERT embeddings, autoencoder-based dimensionality reduction, and Bi-LSTM sequence modeling tailored for protein secondary structure prediction;
- A novel subsequencing approach that standardizes protein input representations, leading to enhanced training stability and efficient GPU utilization;
- A comprehensive experimental evaluation on a curated PISCES-derived dataset, exploring multiple feature dimensionalities and subsequence lengths under Q3 and Q8 schemes;
- An empirical demonstration that reducing the embedding dimensions to 256 preserves over 99% of predictive performance while decreasing GPU memory usage by 67% and training time by 43%;
- Identification of the 256D–50L configuration as an optimal balance point, enabling scalable deployment on resource-constrained platforms without compromising accuracy.
The rest of this paper is organized as follows. Section 2 reviews related studies, including traditional and recent deep learning approaches in PSSP. Section 3 describes the proposed methodology in detail. Section 4 presents experimental results and analysis. Section 5 discusses the trade-offs and implications, and Section 6 concludes the paper with future research directions.
2. Related Work
Protein secondary structure prediction (PSSP) has long been a central research focus in bioinformatics and computational biology. Its primary goal is to predict local structural motifs—such as helices, sheets, and loops—based on amino acid sequences. These local arrangements play a crucial role in determining a protein’s three-dimensional (3D) conformation and its biological functions. Over the years, a wide range of machine learning and deep learning techniques have been proposed to enhance prediction accuracy and computational efficiency.
Early PSSP methods were predominantly rule-based and statistical, utilizing the physicochemical properties of amino acids and probabilistic analysis of structural motifs. Approaches like the Chou–Fasman and GOR (Garnier–Osguthorpe–Robson) methods were among the first widely used models [17]. However, these techniques often lack generalization capabilities and are computationally intensive, limiting their practical utility.
The integration of machine learning into PSSP began with feedforward neural networks, which classify residues using local sequence patterns [18]. This was followed by the application of Support Vector Machines (SVMs) and Hidden Markov Models (HMMs), which introduce more robust mechanisms for modeling residue dependencies. Nevertheless, these models struggle in capturing long-range interactions, which are critical for accurate secondary structure prediction.
A major breakthrough came with the rise of deep learning. Convolutional Neural Networks (CNNs) proved effective in recognizing local spatial features [6], while Long Short-Term Memory (LSTM) networks improved sequence modeling by learning long-range dependencies [19]. Bidirectional LSTMs (Bi-LSTMs) further enhanced performance by enabling simultaneous forward and backward context propagation [20].
In the late 2010s, research increasingly focused on deeper and more complex architectures. Yang-Xu et al. emphasized the limitations of shallow models and advocated for deeper networks with improved abstraction capabilities [10]. Similarly, Wardah et al. provided a comprehensive review of neural network-based approaches and their impact on PSSP performance [21].
The year 2020 marked a turning point, with the introduction of hybrid architectures. Cheng et al. proposed a CNN-LSTM hybrid that captures both local and global dependencies [22]. Yang et al. later introduced a lightweight CNN combined with label distribution-aware marginal loss to improve generalization [10]. Sonsare and Gunavathi advanced the field further with a cascaded 1D ConvNet–Bi-LSTM architecture specifically tailored for PSSP [23].
In 2022, CulledPDB-based datasets contributed to more accurate and generalizable models [24]. Yang et al. also explored deep metric learning strategies to better represent structural relationships between proteins [10]. Meanwhile, the release of AlphaFold revolutionized protein structure prediction by offering near-experimental accuracy, reinforcing the need for strong secondary structure predictors as a foundation for tertiary structure modeling [2].
In 2023, Geethu and Vimina proposed a hierarchical feature learning model for PSSP, showcasing the continued evolution of deep learning in computational biology [9]. Transformer-based architectures, particularly those leveraging self-attention mechanisms, gained momentum due to their capacity to model both short- and long-range residue interactions. AlphaFold’s success exemplifies the power of these architectures in achieving state-of-the-art structural predictions [25].
This historical trajectory—from early statistical models to modern deep learning frameworks—has significantly advanced the field of PSSP. Each innovation builds upon prior methodologies, forming a rich body of research that continues to evolve with the rapid emergence of new techniques and high-quality biological datasets.
3. Methodology
3.1. Dataset
This study employed a dataset curated using the PISCES (Protein Sequence Culling Server) tool [26] and publicly released under the title Protein Secondary Structure 2022 on Kaggle. PISCES is a well-established platform in structural bioinformatics that filters protein sequences based on sequence identity and structural resolution criteria to produce non-redundant, high-quality datasets. For this study, a 25% sequence identity cutoff was applied to eliminate redundancy, and only crystallographic structures resolved at 2.5 Å or better were retained. These constraints ensured the inclusion of unique and experimentally validated protein structures.
The resulting dataset comprises 10,931 proteins, with chain lengths ranging from 40 to 1500 amino acid residues. Each sequence is annotated with its corresponding secondary structure under two classification schemes: Q3 (three-class) and Q8 (eight-class). The Q3 scheme categorizes residues into alpha helices (H), beta strands (E), and coils (C), while Q8 offers a more granular view, dividing residues into eight structural states, including beta bridges (B), 310 helices (G), helices (I), turns (T), and bends (S). Table 1 summarizes the correspondence between the Q3 and Q8 classes, and Table 2 provides a statistical overview of the dataset.

Table 1.
Q3/Q8 secondary structure classifications.
Table 2.
Dataset characteristics.
To support model training and evaluation, we first split the entire dataset into two disjoint parts: 80% for training and 20% for testing. This split was performed at the protein level to prevent information leakage due to overlapping subsequences. Subsequently, during training, we allocated 20% of the training data as a validation set. As a result, the final composition of the dataset was 64% training, 16% validation, and 20% testing. We used stratified sampling based on both Q3 and Q8 labels to maintain the consistency of class distribution across all subsets.
3.2. Protein Representation Using BERT Models
BERT (Bidirectional Encoder Representations from Transformers) is a Transformer-based deep language model that revolutionized natural language processing by modeling bidirectional context through masked language modeling [27]. Instead of predicting the next word in a sequence, BERT predicts randomly masked tokens using both left and right context, enabling more effective representation learning.
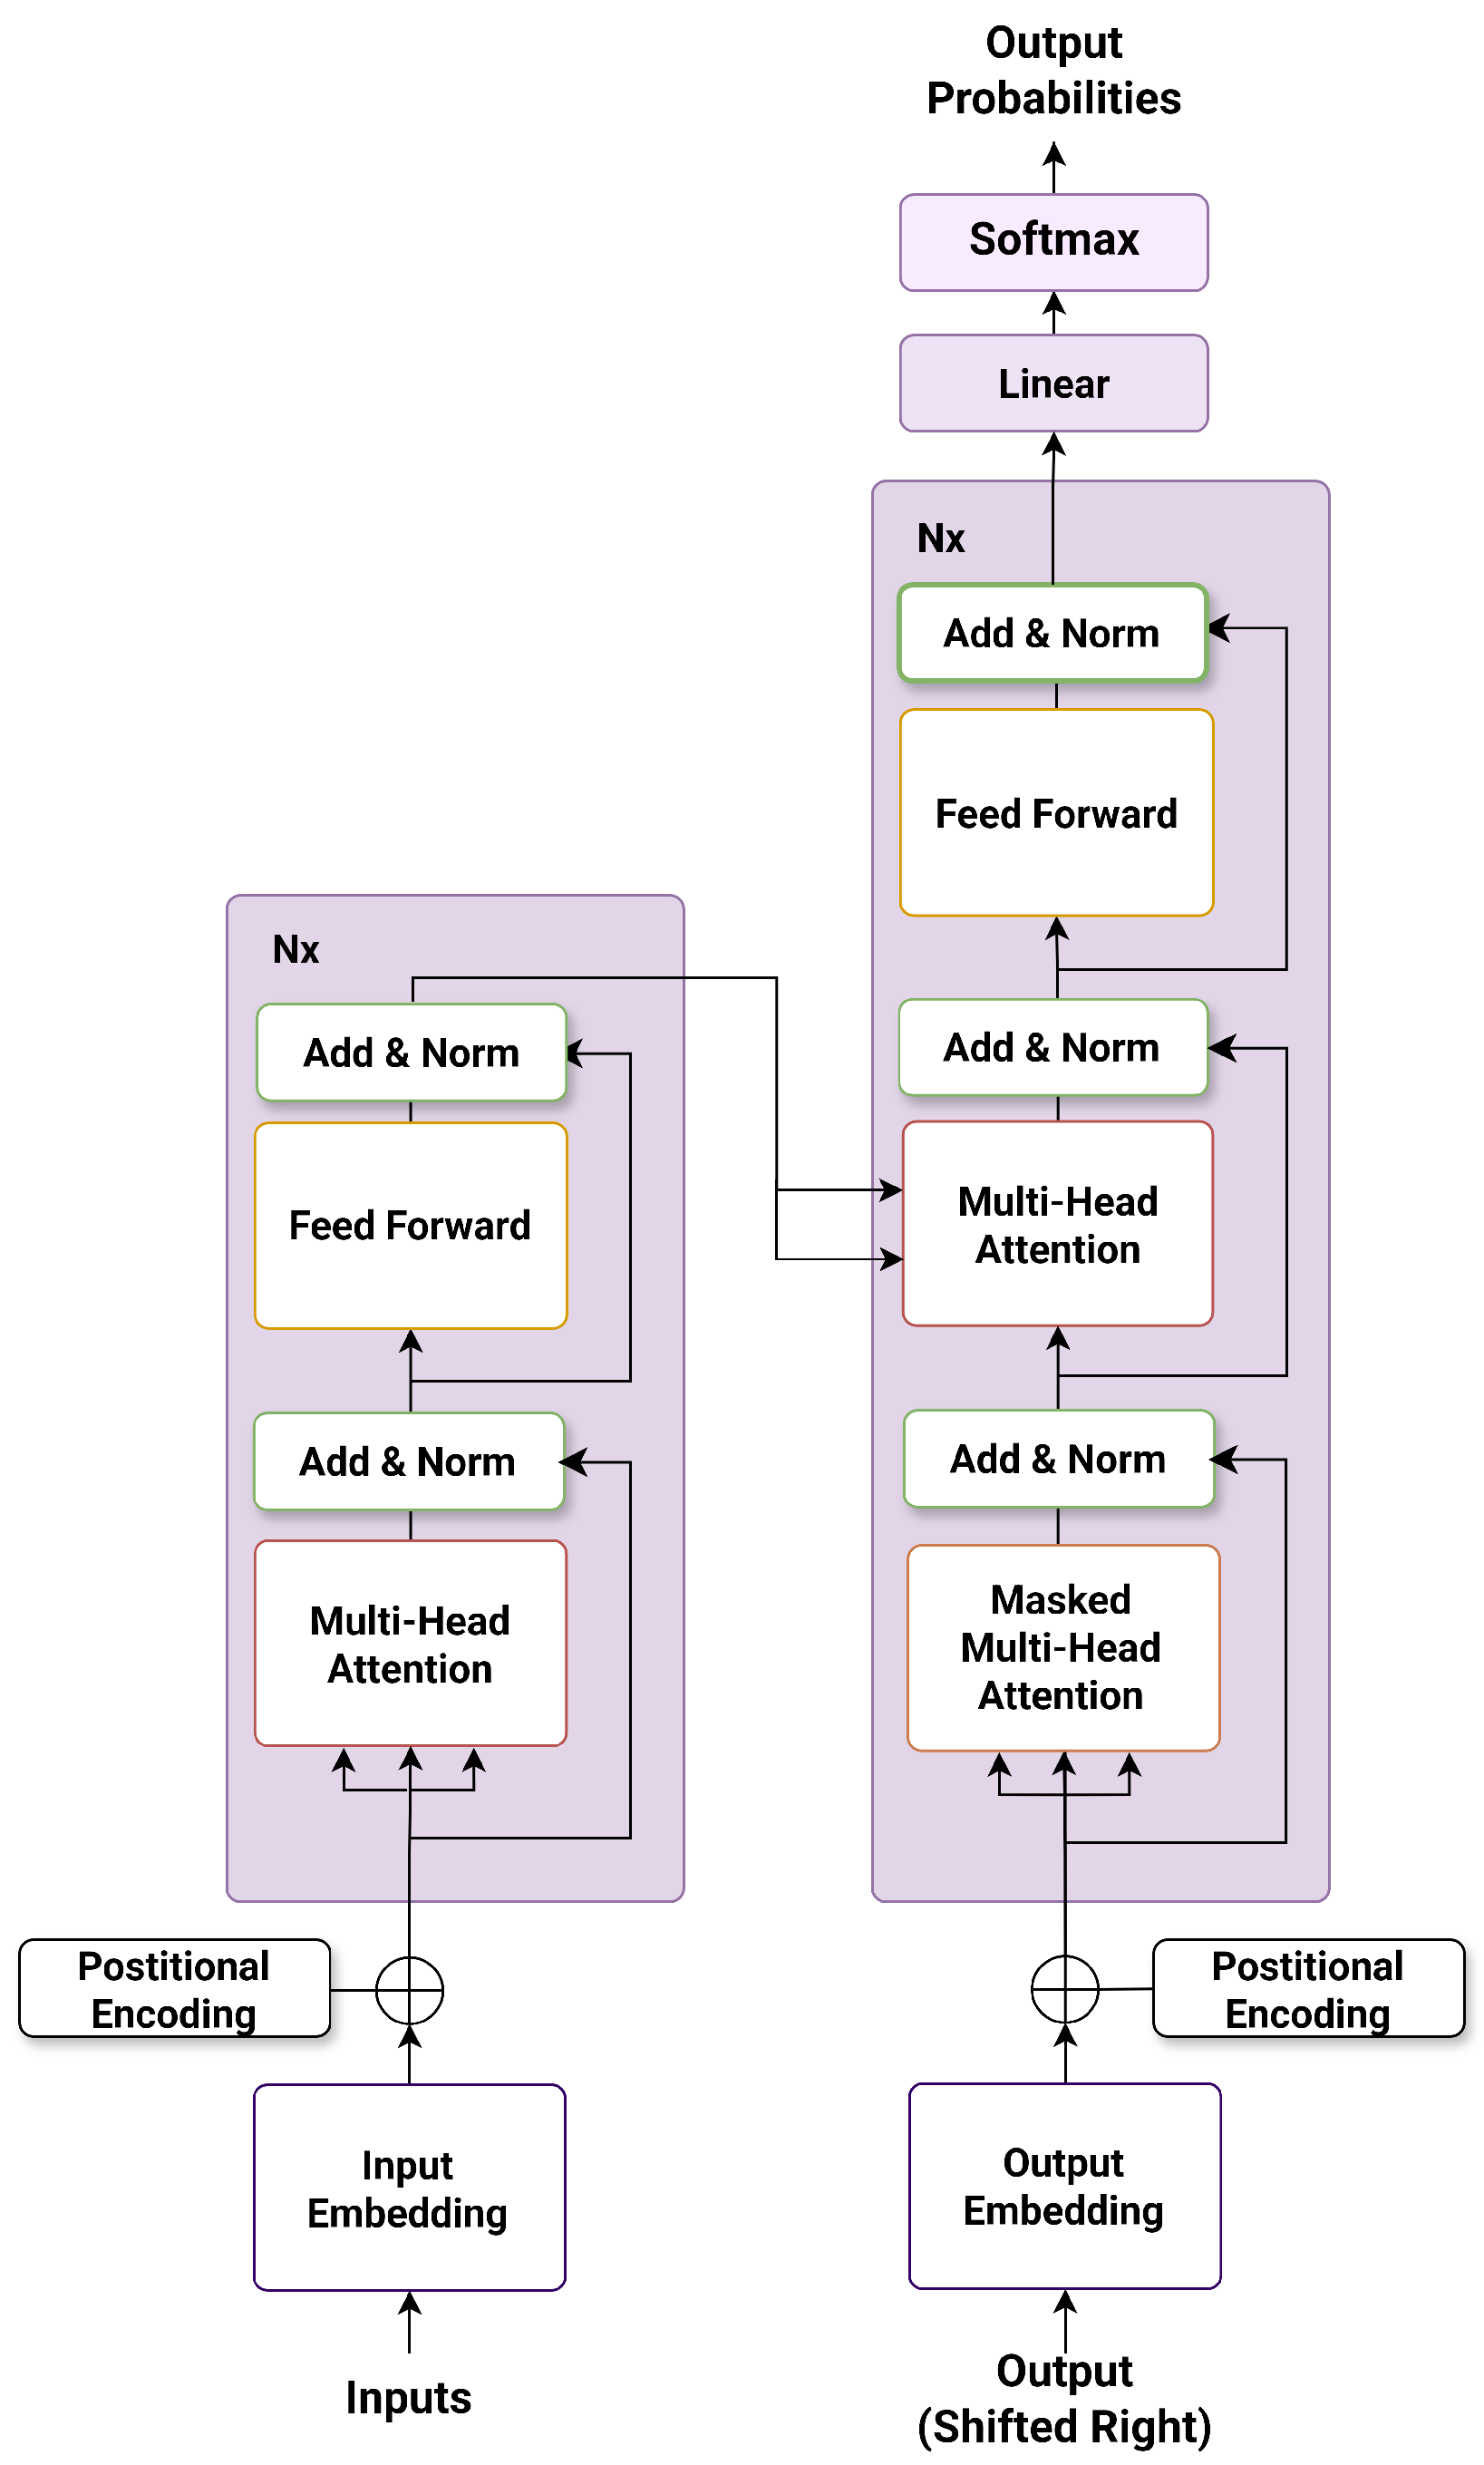
Unlike earlier models, BERT incorporates token embeddings, segment embeddings, and positional embeddings, allowing the model to encode both the identity and location of each token. Its encoder-only architecture consists of multiple layers of multi-head self-attention and feed-forward sublayers, as illustrated in Figure 1.

Figure 1.
The encoder structure of the BERT architecture.
ProtBERT adapts this architecture for protein sequence modeling [28,29]. It treats amino acids as tokens and applies masked token prediction over large-scale biological corpora. Pre-trained on over 106 million sequences from UniRef90, ProtBERT captures local and global contextual dependencies across entire sequences. It also includes Gene Ontology (GO)-based multi-task objectives, which enhance its ability to learn structural and functional protein features.
ProtBERT generates embeddings of size for a sequence of length n, where each row represents a dense, context-aware representation for an amino acid. These embeddings serve as the input features for downstream structure prediction models.
3.3. Dimensionality Reduction with Autoencoders
Autoencoders are neural network models designed to reconstruct their input by compressing it into a lower-dimensional representation, then decoding it back [30]. They consist of two main components: the encoder, which maps the input x to a latent code , and the decoder, which reconstructs the input as . The training objective is to minimize the reconstruction error between x and r, typically using mean squared error (MSE).
In our study, we utilize stacked autoencoders to compress high-dimensional BERT embeddings from to lower-dimensional spaces (e.g., 512, 256, 128). The encoder layers gradually reduce the feature dimensionality, while the decoder layers attempt to reconstruct the original embedding. This compression retains essential features while reducing computational cost and memory usage during model training.
The use of stacked autoencoders for dimensionality reduction is well-founded in their ability to learn non-linear manifolds within high-dimensional spaces through unsupervised representation learning [31,32]. In the context of protein sequence modeling, stacked autoencoders have been widely adopted for feature compression tasks due to their capacity to preserve biologically meaningful information while minimizing reconstruction loss [33,34]. In this study, the dimensionality of ProtBERT-derived embeddings was reduced from 1024 to as low as 32 through empirical tuning, guided by a trade-off between reconstruction fidelity and downstream classification performance (F1 score).
The reconstruction loss in autoencoders is quantified using the Mean Squared Error (MSE), which measures the average squared difference between input vectors and their reconstructions:
Here, is the input embedding for residue i, and is its reconstruction, with d being the original feature dimension and n representing the number of input residues per batch. The use of MSE is theoretically grounded in its role as a convex loss function that promotes global minimization of Euclidean distance in the feature space. In the context of autoencoders, minimizing MSE encourages the network to learn a compressed latent representation that retains essential information from the input while discarding noise or redundancy. This choice is consistent with prior studies that utilized MSE to encode high-dimensional biological representations [34,35].
3.4. Secondary Structure Prediction Models
In this study, we adopt a Bidirectional Long Short-Term Memory (Bi-LSTM) architecture due to its effectiveness in modeling sequential data and its ability to capture dependencies in both temporal directions. This bidirectional context modeling is particularly advantageous for protein secondary structure prediction (PSSP), where the structural identity of a residue is influenced by both its preceding and succeeding amino acids.
The proposed Bi-LSTM network consists of five stacked layers with progressively decreasing hidden-layer sizes: 1024, 512, 256, 128, and 64 units. This hierarchical configuration facilitates the extraction of increasingly abstract representations from the input sequence. To mitigate overfitting, dropout layers are inserted between Bi-LSTM layers. Although a relatively low dropout rate of 0.0001 is used, it provides lightweight regularization suited for long sequences. A final dense layer with softmax activation maps the output to either Q3 (three-class) or Q8 (eight-class) predictions, depending on the classification scheme.
This architecture is inspired by prior studies demonstrating the utility of deep recurrent structures in PSSP tasks [36,37,38]. The conservative dropout setting aligns with best practices for small and deep recurrent models in biological sequence modeling, where over-regularization can hinder the capture of subtle long-range dependencies [39,40].
The framework is flexible and scalable, supporting input tensors of shape , where L is the fixed subsequence length and D is the embedding dimension obtained after autoencoder-based compression. This modularity allows the architecture to adapt to diverse sequence lengths and feature dimensionalities with minimal reconfiguration.
3.5. Proposed Method
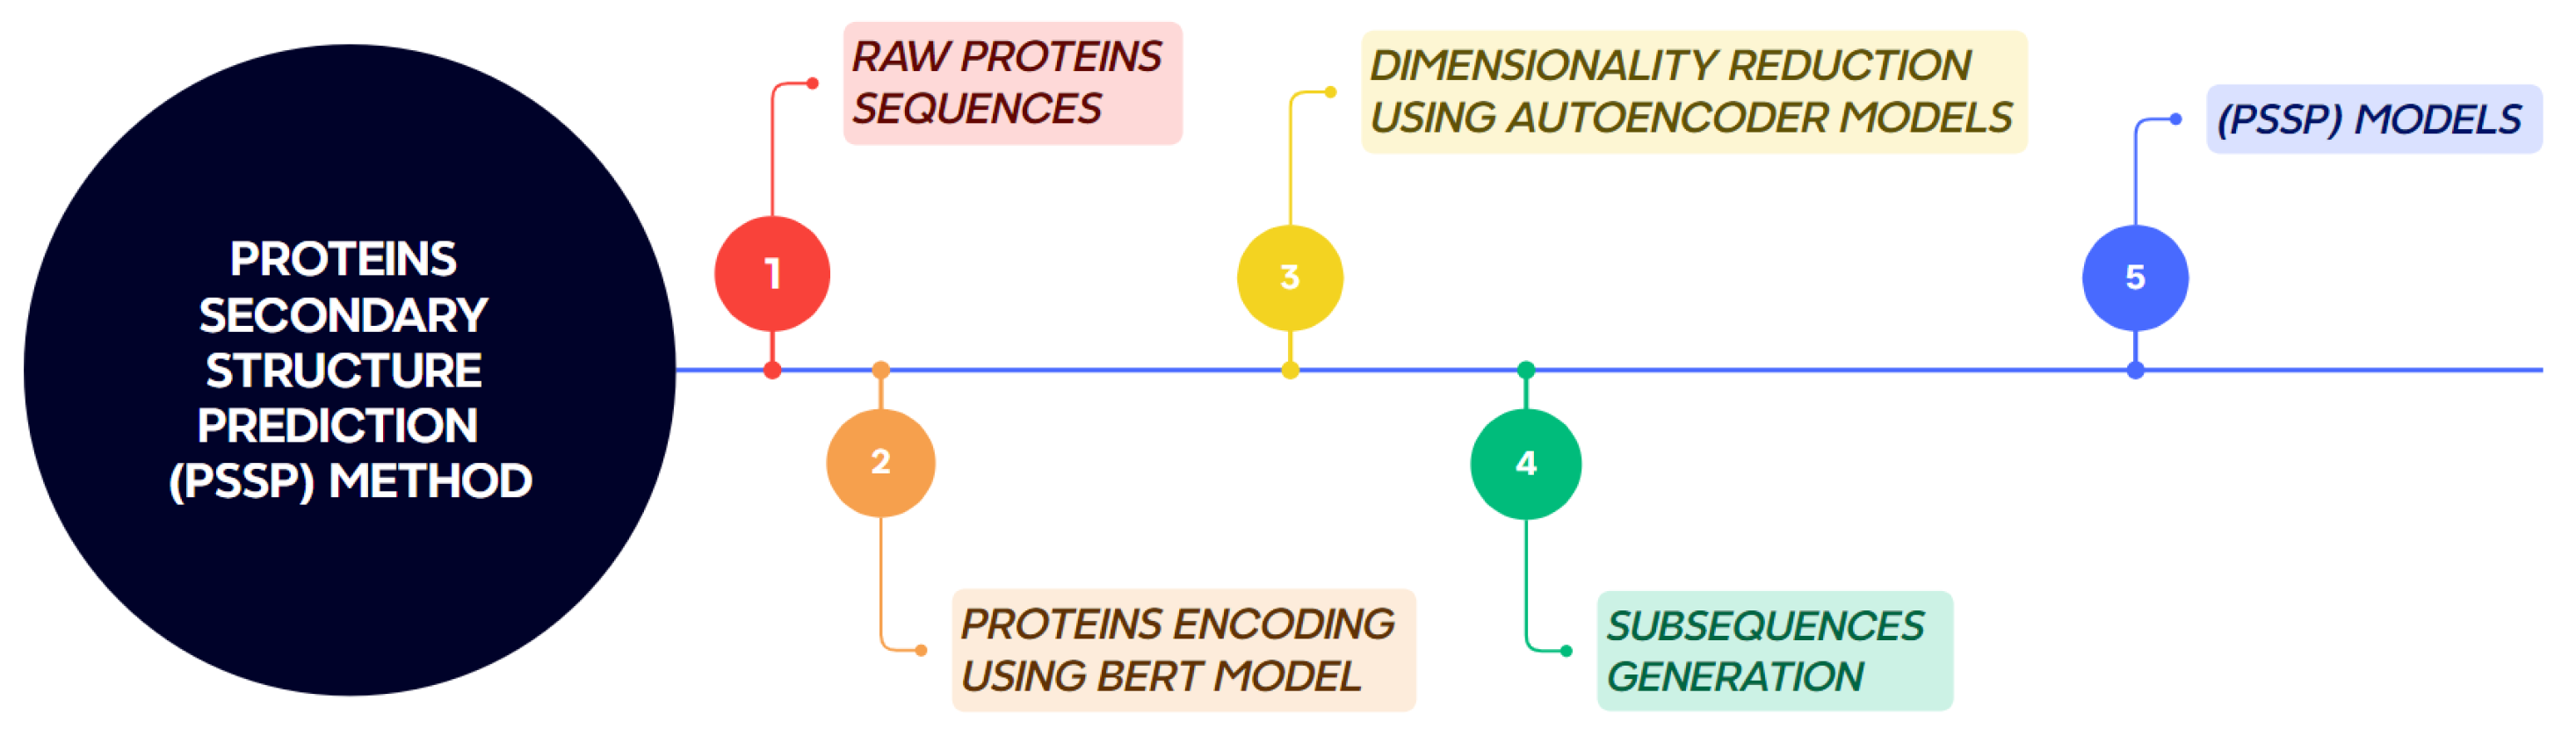
The proposed methodology for protein secondary structure prediction consists of five main stages, as illustrated in Figure 2. These stages are described in detail below.
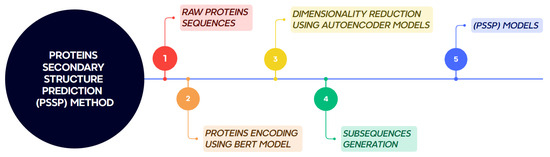
Figure 2.
Workflow of the proposed method for protein secondary structure prediction.
3.5.1. Raw Protein Sequences
The dataset described in Section 3.1 provides protein sequences labeled under the Q3/Q8 classification schemes. In this phase, only raw amino acid sequences are processed. The secondary structure labels are excluded and reserved for supervised learning during the training phase.
3.5.2. Feature Extraction Using Pre-Trained BERT
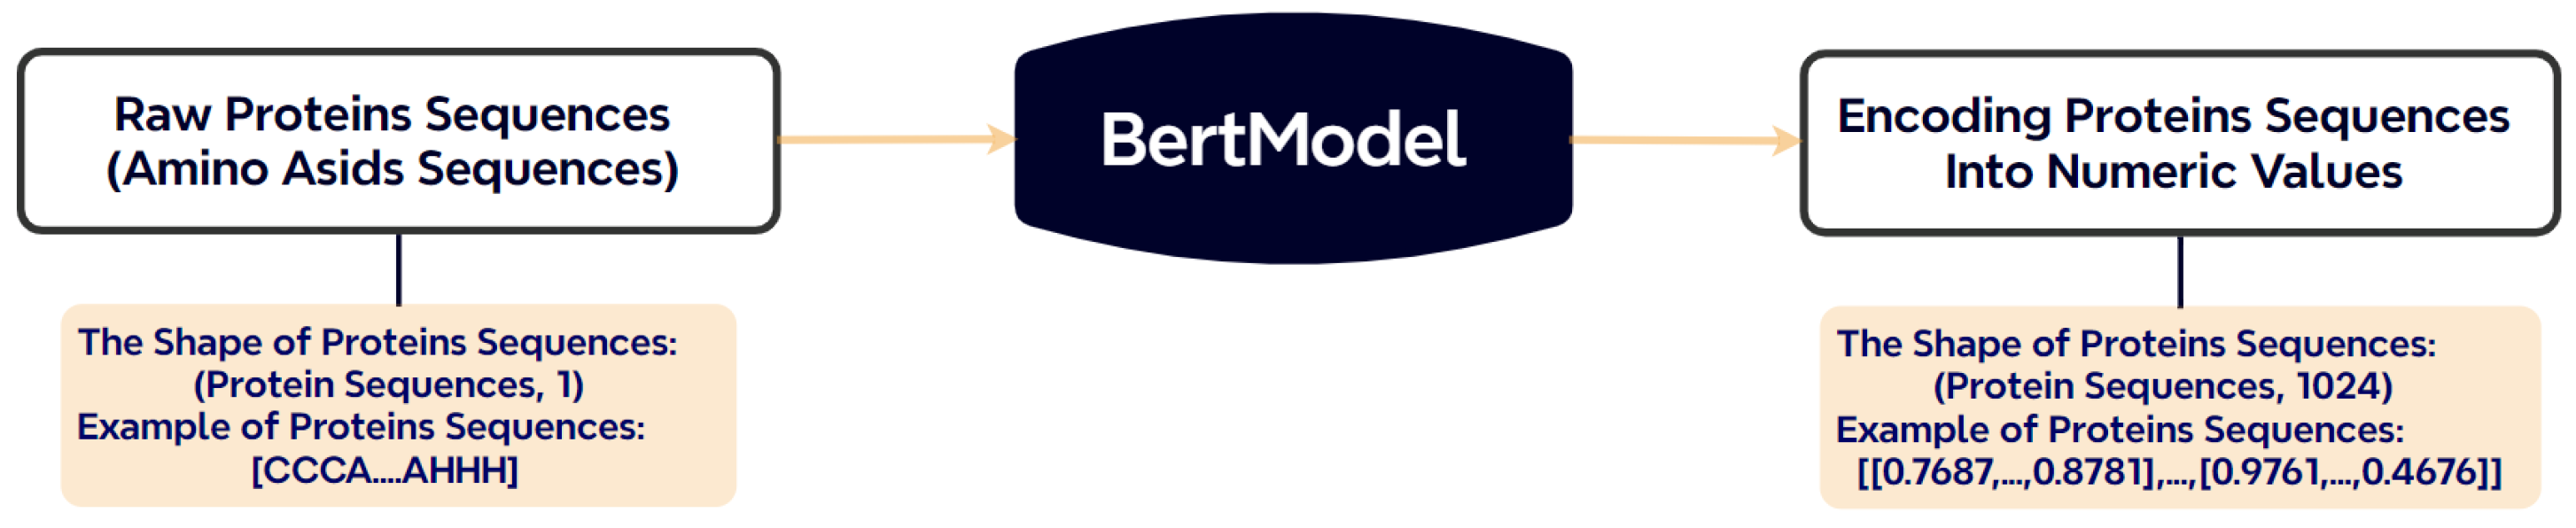
A pre-trained ProtBERT model is used to generate high-dimensional, context-aware embeddings from the input sequences. For a protein sequence of length n, this produces an embedding matrix of size , where each row corresponds to the encoded representation of a single amino acid residue. Figure 3 illustrates the transformation of a raw sequence into BERT embeddings.
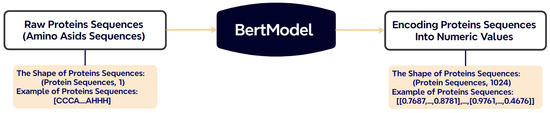
Figure 3.
Conversion of amino acid sequences into numerical vectors using ProtBERT.
3.5.3. Dimensionality Reduction via Autoencoders
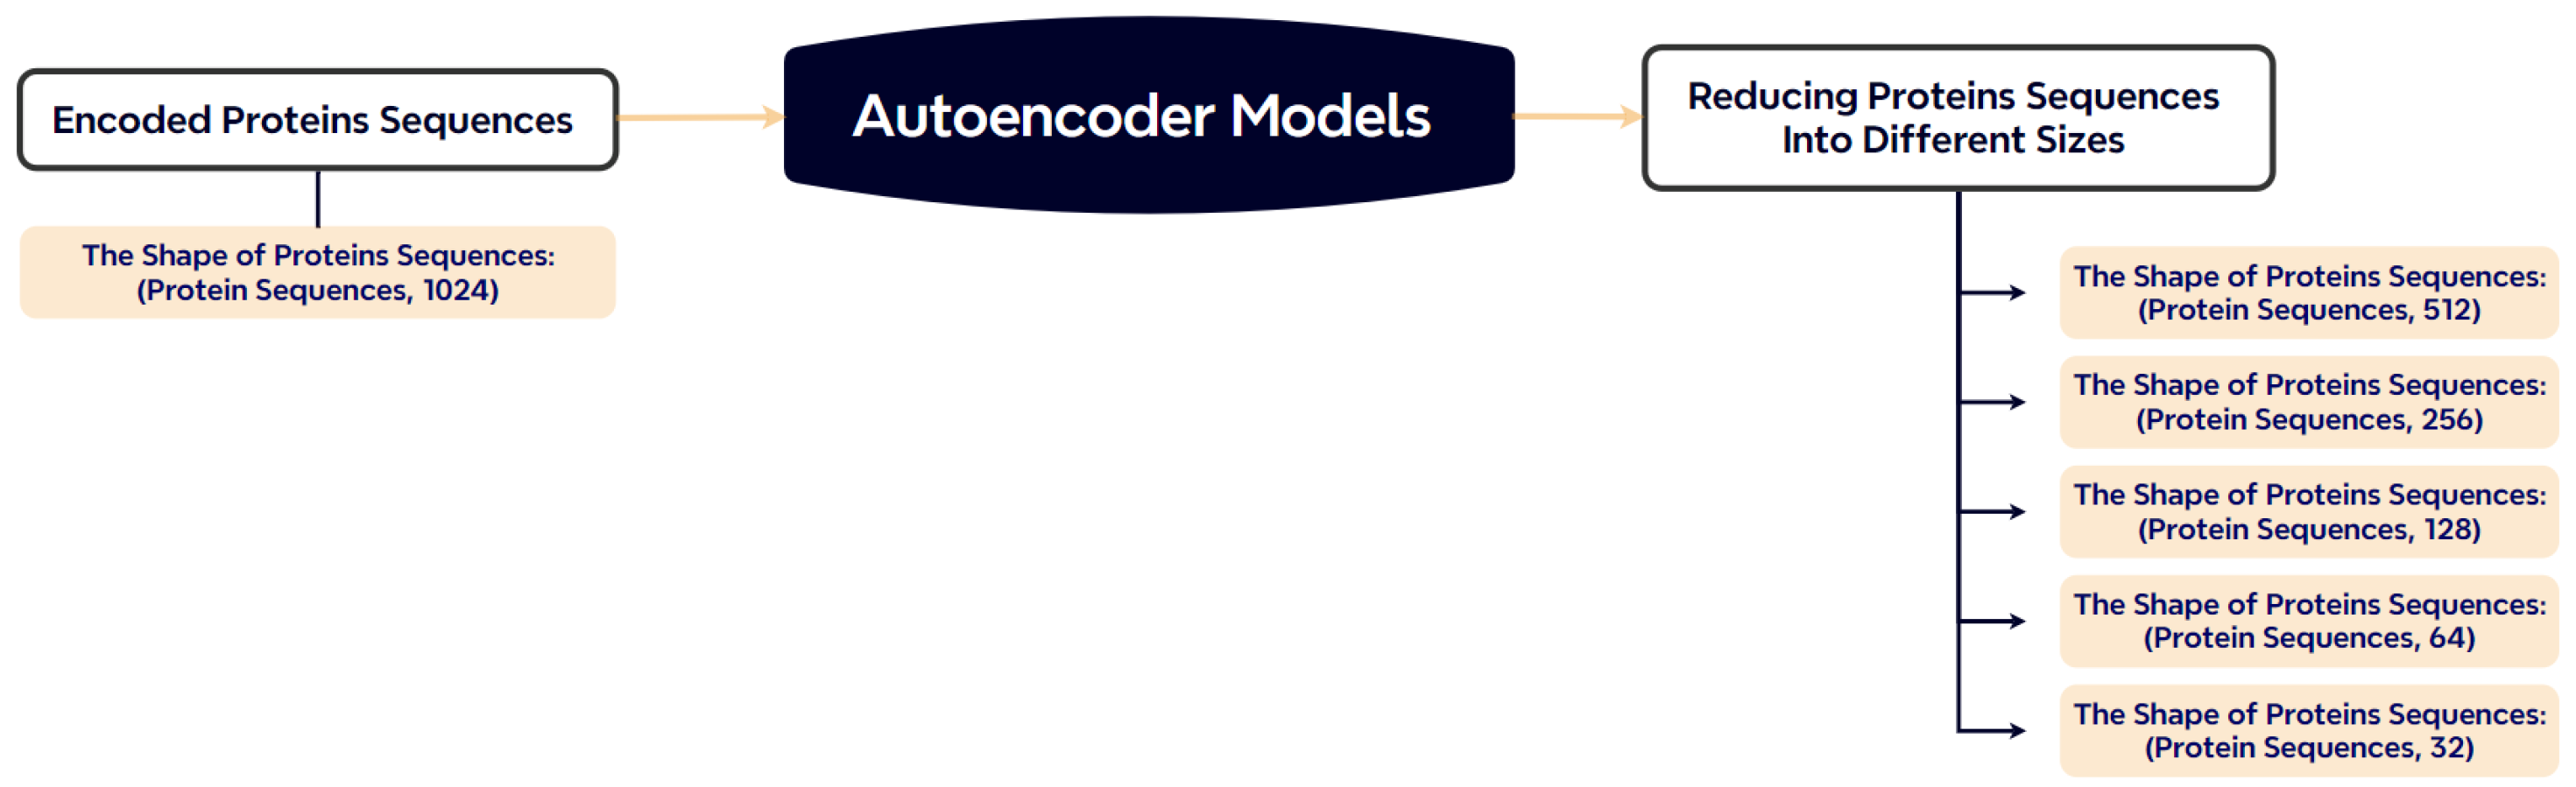
To alleviate the computational burden associated with 1024-dimensional embeddings, we employ stacked autoencoders to compress the feature representations. Depending on the experimental setup, the output dimensions are reduced to 512, 256, or 128. This operation preserves the most relevant information while making downstream training more memory-efficient. The architecture of the autoencoder is illustrated in Figure 4.

Figure 4.
Dimensionality reduction of ProtBERT embeddings using stacked autoencoders.
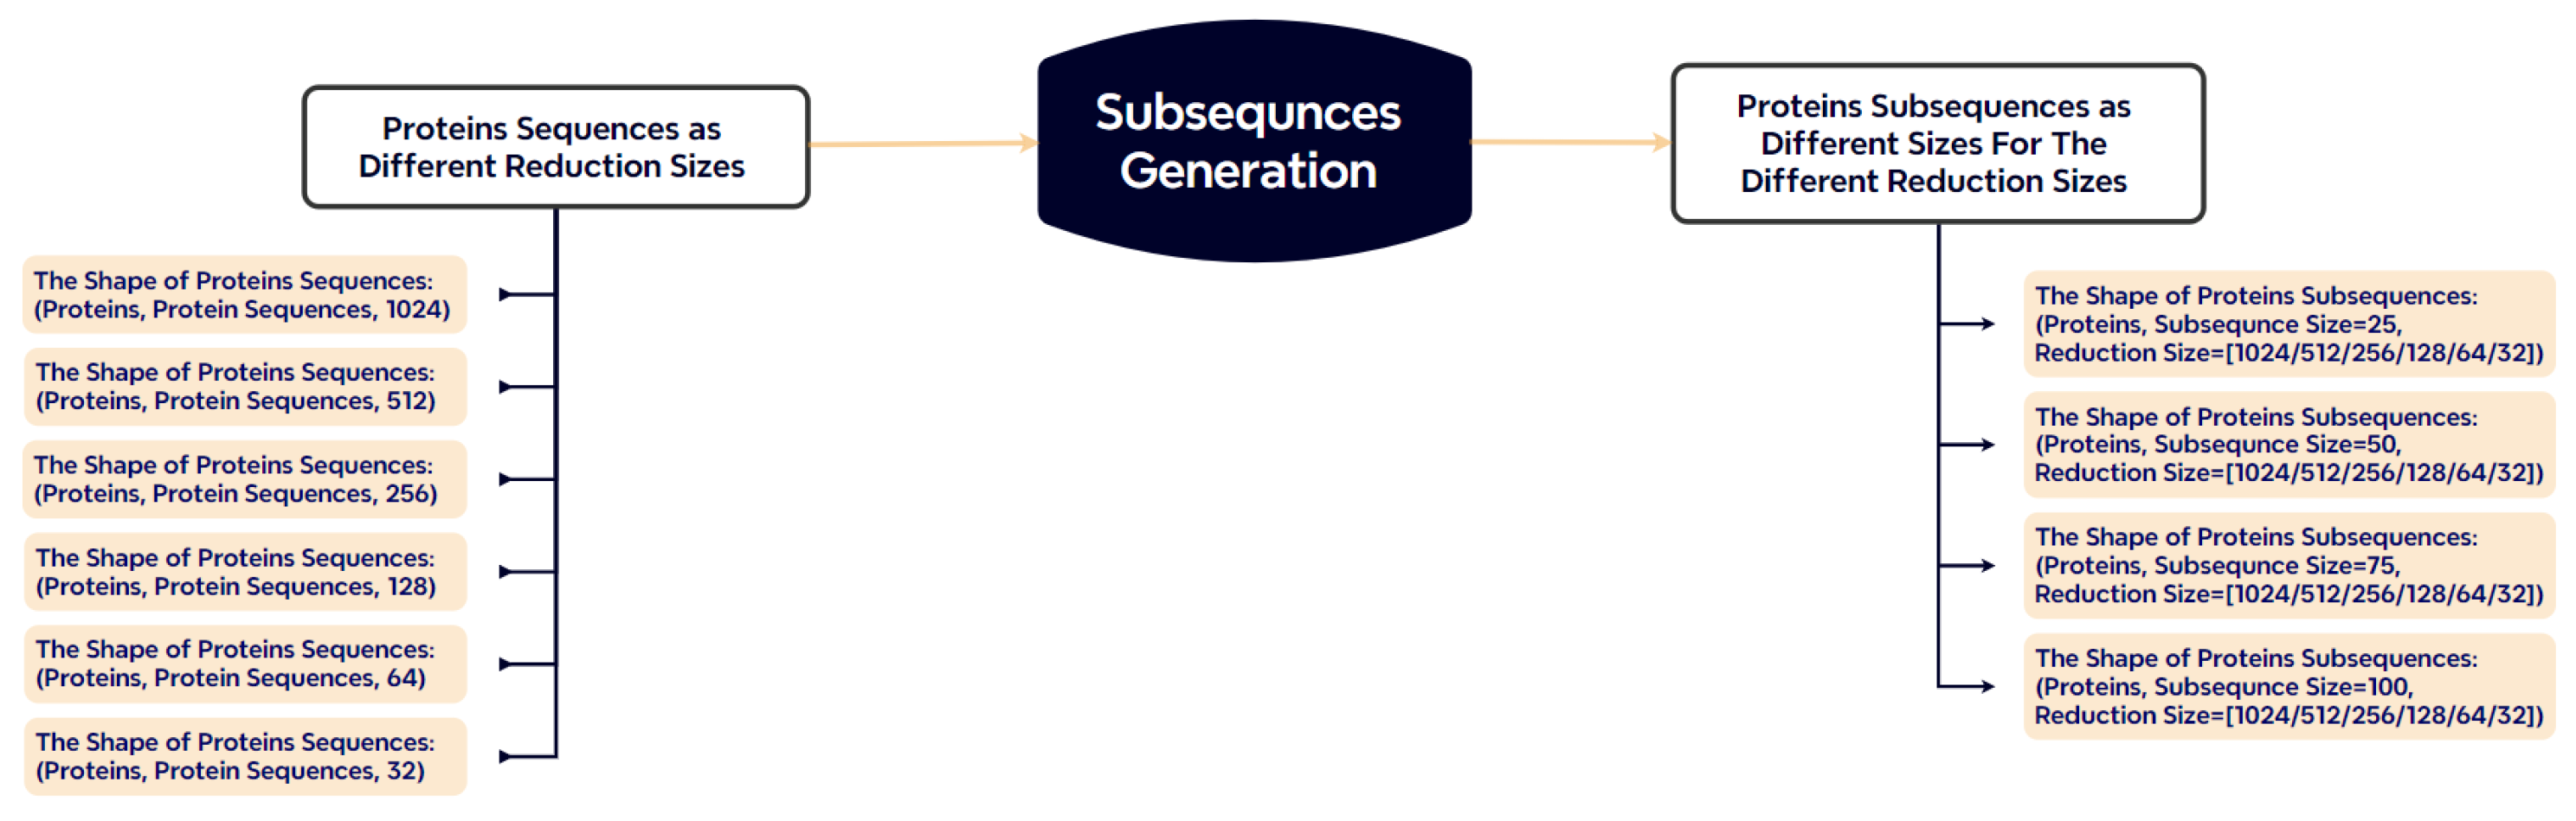
3.5.4. Subsequence Generation
Protein sequences vary significantly in length (50 to 1500 residues), which poses a challenge for batch-based model training. To address this, we segment each sequence into fixed-length subsequences of 25, 50, 75, or 100 residues (Figure 5). Sequences shorter than the target length are padded with zeros, while longer sequences are truncated. This segmentation strategy reduces padding overhead and increases input uniformity across batches.
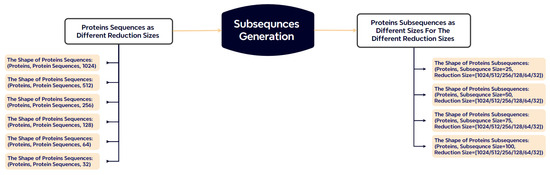
Figure 5.
Subsequence generation strategy. Proteins are split into fixed-length segments, minimizing padding/truncation compared to traditional approaches.
The resulting subsequences, along with their corresponding labels, are organized into input–label pairs for supervised training.
3.5.5. PSSP Model Training
The Bi-LSTM network is trained using the output of the autoencoder-compressed subsequences as input. Each subsequence of shape (where L is the fixed length and D is the reduced dimension) is passed through the Bi-LSTM layers. The output layer employs a softmax function to generate class probabilities for each residue:
Here, denotes the predicted probability for class i, is the raw logit, and C is the number of classes (3 for Q3, 8 for Q8).
For the Q3 and Q8 secondary structure classification tasks, we adopt the categorical cross-entropy loss, a standard objective function for multi-class classification. It is defined as follows:
where denotes the ground-truth label for residue i and class c, is the predicted probability output by the softmax function, C is the number of classes (3 for Q3, 8 for Q8), and n is the number of residues in the batch. This loss encourages the model to maximize the log-likelihood of the correct class and is theoretically justified as the negative log likelihood of the multinomial distribution under maximum likelihood estimation (MLE).
Categorical cross-entropy has favorable convergence properties in deep networks when paired with softmax output layers, especially under stochastic optimization settings like Adam. It has also been shown to yield well-calibrated probabilistic outputs, making it suitable for biological tasks where prediction confidence is important [41]. In our experiments, early stopping based on validation loss was used to mitigate overfitting and ensure generalization to unseen sequences.
4. Experiments and Results
This section presents a comprehensive evaluation of the proposed model, including the experimental setup, performance metrics, and analysis of results. The experiments focus on assessing the predictive capacity of the model in protein secondary structure prediction (PSSP) under varying configurations of subsequence lengths and feature dimensionalities. We provide both quantitative metrics and training diagnostics to examine model behavior in detail.
This section is organized as follows: In Section 4.1, we describe the evaluation metrics used to assess model performance, including accuracy, precision, recall, and F1 score. Section 4.2 presents and analyzes the model’s performance across different configurations, with a focus on Q3/Q8 classification schemes.
4.1. Evaluation Metrics
To comprehensively evaluate the model’s performance in PSSP tasks, we employ standard classification metrics: accuracy, precision, recall, and F1 score. These metrics provide insights into class-level prediction quality, particularly in imbalanced settings. The confusion matrix (Table 3) serves as the foundation for calculating these metrics [42].
Table 3.
Confusion matrix structure.
- TP (True Positive): Correctly predicted positive samples.
- TN (True Negative): Correctly predicted negative samples.
- FP (False Positive): Incorrectly predicted positive samples.
- FN (False Negative): Incorrectly predicted negative samples.
From these values, the evaluation metrics are computed as follows:
The F1 score, in particular, provides a balanced measure between precision and recall, making it well-suited for imbalanced datasets [12,43].
4.2. Results
As described previously, the dataset was partitioned into training and test sets using an 80:20 split, preserving the original protein sequence order to maintain intra-chain structural integrity. Additionally, 20% of the training set was reserved for validation during model training using the validation_split parameter in Keras.
The proposed architecture comprises five stacked bidirectional LSTM layers with hidden unit sizes of 1024, 512, 256, 128, and 64, respectively. Each Bi-LSTM layer is followed by a dropout layer with a rate of 0.2 to prevent overfitting. The final layer is a fully connected softmax classifier, configured with three output units for Q3 classification or eight units for Q8 classification, depending on the task. The input to the model is a tensor of shape , where L denotes the fixed subsequence length (25, 50, 75, or 100 residues) and D corresponds to the embedding dimension, ranging from 32 to 1024, as determined by autoencoder-based dimensionality reduction. Model training was conducted using the Adam optimizer with a learning rate of 0.00005, a batch size of 128, and a maximum of 100 epochs. Early stopping was employed with a patience of five epochs based on validation loss to prevent overfitting. All models were implemented using TensorFlow 2.9 and Keras. Training was carried out on a workstation equipped with an 11th Gen Intel® Core™ i7-11700F @ 2.50 GHz processor and 32 GB RAM, including an RTX 3060 Ti GPU card.
This proposed recurrent architecture was selected after comparative evaluations with alternative deep learning configurations, offering a robust trade-off between classification accuracy and computational efficiency. Model performance was evaluated under multiple configurations of reduced feature dimensions and subsequence lengths, with Q3/Q8 results reported separately to capture task-specific behavior.
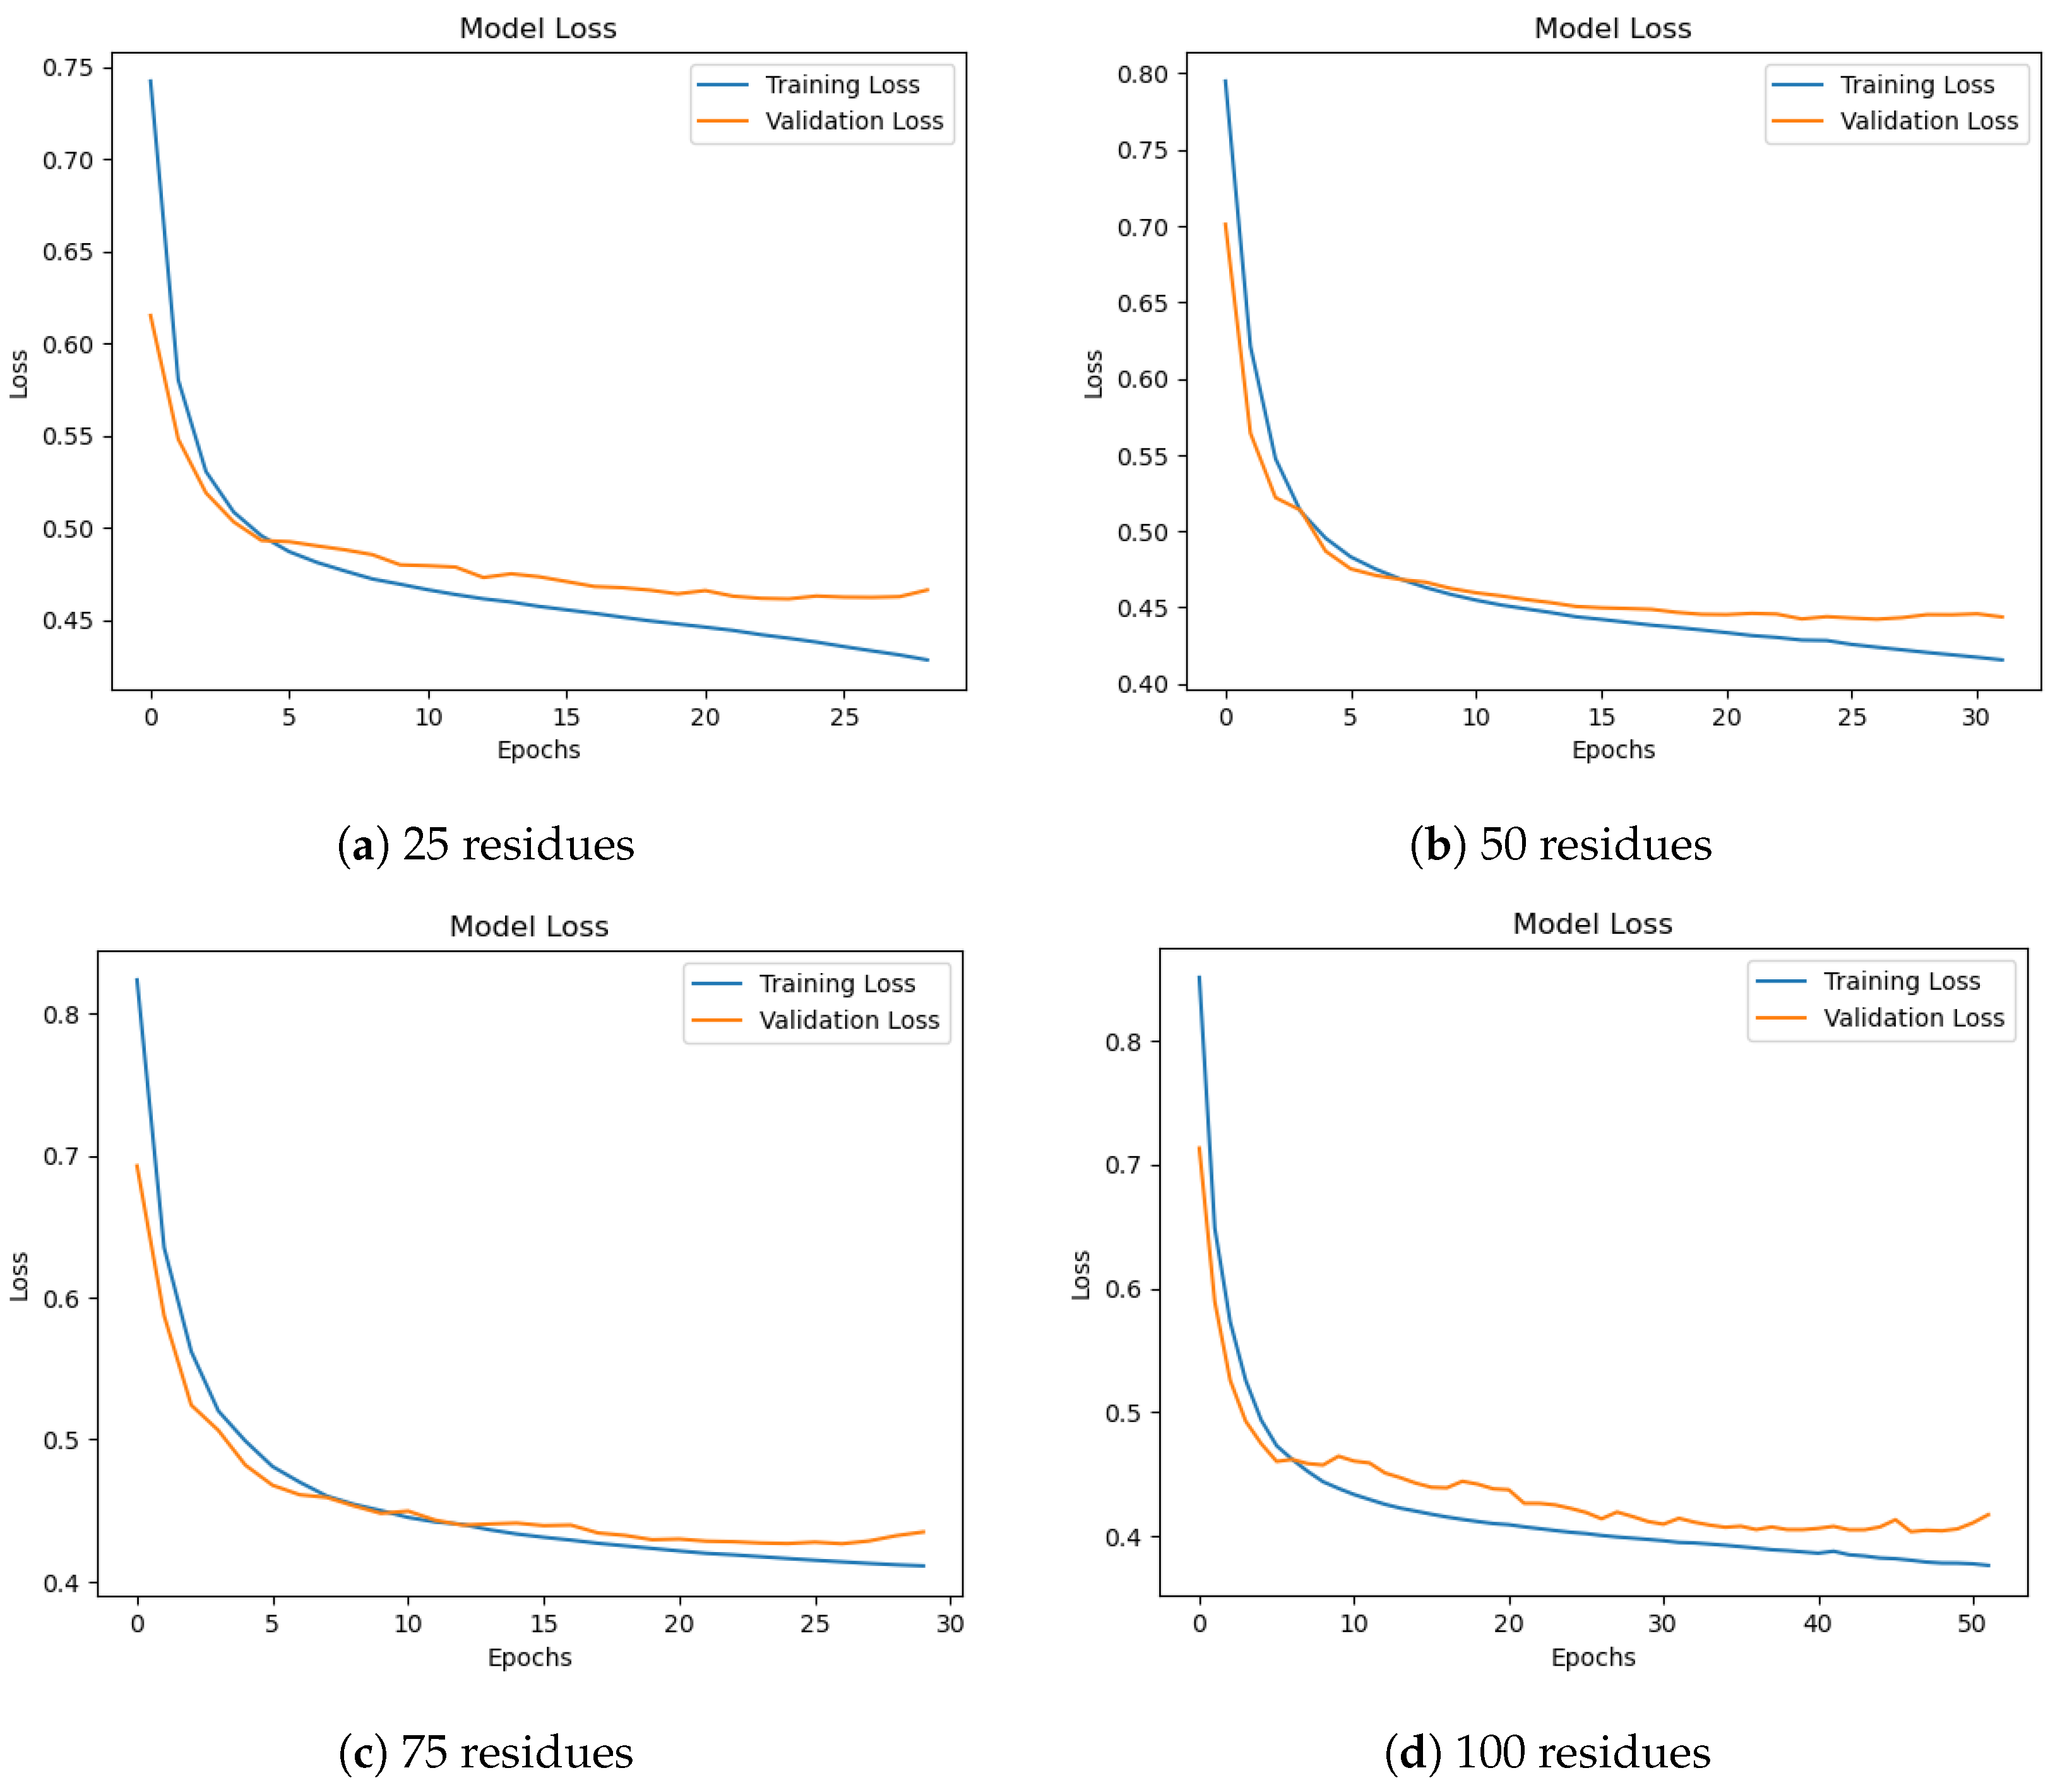
Figure 6 shows training and validation loss curves for different subsequence lengths. All settings demonstrate stable convergence, though 50-residue subsequences yield the most balanced learning curve. Longer subsequences (75–100) exhibit smoother validation loss but require more training epochs. From a biological standpoint, secondary structure elements such as helices and strands typically span 8–15 and 5–10 residues, respectively. However, these motifs do not exist in isolation; rather, they often occur in organized clusters or domains that range from 40 to 60 residues in length, as noted in previous studies [44,45]. Thus, a 50-residue window aligns well with the typical size of such secondary structure-rich regions, enabling the model to capture inter-motif dependencies and local folding patterns that would be lost in shorter subsequences.
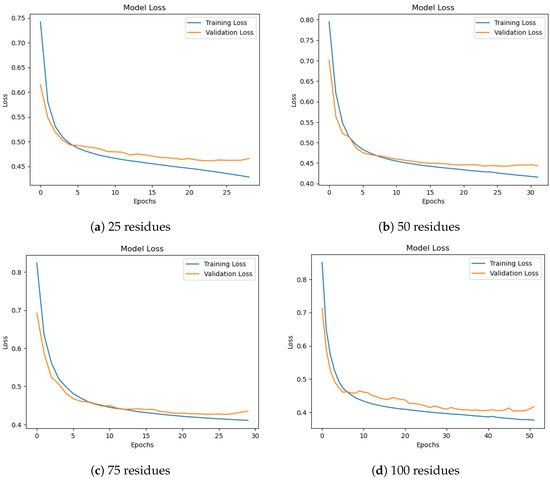
Figure 6.
Training and validation loss for different subsequence lengths. Longer subsequences show smoother convergence, especially at 75 and 100 residues.
Table 4 shows that 1024-dimensional features consistently deliver the highest Q3 classification performance. Notably, reducing the feature size to 256 dimensions preserves over 99% of performance while substantially lowering training cost. Performance degradation becomes more noticeable at 32 dimensions.
Table 4.
F1 scores for 3-class (Q3) PSSP classification.
Table 5 reveals that models with larger feature dimensions converge faster but require more GPU memory. The 256D–50L configuration offers the best balance between convergence speed and accuracy.
Table 5.
Training epochs required for model convergence.
Table 6 shows that Q8 classification is more sensitive to dimensionality reduction than Q3. The 32D representation yields up to 9.8% lower F1 scores, though longer subsequences (e.g., 75 residues) partially mitigate this loss.
Table 6.
F1 scores for 8-class (Q8) PSSP classification.
Key Observations:
- The highest Q3 and Q8 F1 scores are achieved using 1024D features.
- Reducing the feature size to 256D preserves 99% of Q3 and 98.5% of Q8 performance.
- The 256D–50L configuration offers an optimal trade-off between efficiency and accuracy.
- Longer subsequences (75–100) provide more stable training but increase training time.
- Q8 classification requires more training epochs to reach convergence due to higher class complexity.
Overall, the results confirm that the proposed framework offers an effective balance between computational cost and predictive accuracy. The 256-dimensional configuration combined with 50-residue subsequences yields efficient and high-performing models for large-scale protein sequence analysis.
To contextualize the contributions of our proposed framework, we provide a structured comparison with recent state-of-the-art protein secondary structure prediction methods in Table 7. The compared models include CSI-LSTM [46], DeepACLSTM [47], and MHTAPred-SS [48], all of which have demonstrated competitive performance in the literature.
Table 7.
Comparison of our proposed model with recent studies on secondary structure prediction.
As shown in Table 7, our model is distinguished by its integration of ProtBERT embeddings with a lightweight autoencoder that effectively reduces embedding dimensionality by over 90%, significantly improving computational efficiency. Unlike CSI-LSTM, which requires fixed-length NMR-derived input segments and incurs high preprocessing costs, our approach handles full-length protein sequences directly and operates efficiently on general-purpose hardware. Compared to transformer-based methods such as MHTAPred-SS, our model achieves a more favorable trade-off between model complexity and inference speed.
This comparison highlights the practicality and scalability of our approach, especially in environments with limited computational resources, while maintaining accuracy levels comparable to or better than those of more complex architectures.
5. Discussion
This section provides an in-depth analysis of the findings presented in the previous section, focusing on the implications of architectural design choices and experimental outcomes. In particular, we examine how dimensionality reduction and subsequence length affect both computational efficiency and predictive performance in protein secondary structure prediction (PSSP). Additionally, we explore the interaction between classification task complexity (Q3 vs. Q8) and model behavior across different configurations. The discussion is structured around key experimental variables and concludes with a synthesis of lessons learned and their relevance for future work in the field.
5.1. Effects of Dimensionality Reduction and Subsequence Selection on Performance
This subsection analyzes the impact of dimensionality reduction and subsequence selection on training efficiency, computational requirements, and classification performance in both Q3/Q8 tasks across different hardware configurations.
High-dimensional embeddings (e.g., 1024D) frequently exceeded GPU memory capacity, necessitating CPU-based training. This substantially increased training times—especially for larger datasets—highlighting a critical scalability issue. In contrast, dimensionality reduction using autoencoders proved effective in maintaining performance while enabling GPU-based acceleration.
A key trade-off was observed between subsequence length and computational load. Longer subsequences preserved broader contextual dependencies essential for accurate prediction but incurred higher memory usage and slower convergence. Conversely, shorter subsequences reduced computational burden but risked losing crucial long-range interactions.
As shown in Table 8, compressing the embedding dimension from 1024D to 256D reduced Q8 training time by 92.3% (from 13,217 s to 1057 s) for 25-length subsequences. However, extreme reduction to 32D increased training time relative to 64D due to more training epochs being required to compensate for information loss. Notably, the 64D–100L configuration achieved the lowest training time (582 s), likely due to efficient batch fitting in GPU memory.
Table 8.
Training times (seconds) and platforms for Q8 classification.
For Q3 classification (Table 9), reducing from 1024D to 256D led to a 94.4% decrease in training time (from 16,804 s to 937 s). Interestingly, the 32D–75L configuration yielded the fastest training (524 s), despite the representation’s sparsity—indicating potential convergence instability in extremely compressed embeddings.
Table 9.
Training times (seconds) and platforms for Q3 classification.
Across all configurations, Q3 classification consistently required 37% less training time than Q8, which is attributable to the reduced class complexity. Furthermore, 50-residue subsequences achieved a favorable balance between computational efficiency and contextual integrity, aligning with structural studies on local folding windows [20].
GPU acceleration was only feasible below 512 dimensions due to Video Random-Access Memory (VRAM) constraints. While 1024D models suffered from memory swapping, the 256D models ran up to 8.9× faster, with manageable VRAM consumption (10.1 GB vs. 31.1 GB). Thus, the 512D setting emerges as a practical upper limit for GPU viability in current hardware environments.
Key Observations:
- Memory Optimization: Reducing from 1024D to 256D decreased VRAM usage by 67.4% (31.1 GB to 10.13 GB).
- Speed–Accuracy Trade-off: The 50-residue subsequences maintained 99% accuracy while reducing training time by 43%.
- Hardware-Aware Design: GPU acceleration is viable only for models below 512D, emphasizing the value of dimensionality control.
- Model Complexity: Q8 classification required 2.7× more epochs than Q3 to reach equivalent convergence.
These findings confirm that the combination of dimensionality reduction and adaptive subsequence generation enables computationally efficient protein structure prediction without compromising accuracy. The 256D–50L configuration emerges as an optimal setup, delivering near-baseline accuracy while significantly lowering computational cost, making it suitable for scalable, high-throughput applications.
5.2. Biological Insight and Interpretability
While our framework primarily emphasizes computational efficiency, it also yields biologically relevant predictions. For instance, secondary structure motifs such as -helices and -strands tend to occur in recurring residue spans—typically between 8 and 15 amino acids for helices and 5 and 10 for strands. The empirical finding that 50-residue subsequences outperform shorter or longer segments aligns with known domain-level folding patterns in proteins, where secondary motifs often appear in clusters spanning 40–60 residues [44,45]. This setting offers a trade-off: it is long enough to retain contextual dependencies yet short enough to fit efficiently in GPU memory. To provide biological validation, we selected a subset of proteins with known experimental annotations from the test set and compared their predicted secondary structures with the DSSP-annotated ground truth. Although our model is not explicitly designed for interpretability, the use of context-aware embeddings (ProtBERT) inherently embeds evolutionary and functional signals into the learned representations. Future integration with attention mechanisms or saliency maps could enable residue-level visualization of learned features, aiding interpretability in biomedical contexts.
6. Conclusions
In this study, we proposed a deep learning framework that aims to reduce training costs and enhance computational efficiency for Protein Secondary Structure Prediction (PSSP). The approach integrates autoencoder-based dimensionality reduction with a subsequencing strategy, converting full-length protein sequences into smaller, fixed-length segments. This transformation facilitates more efficient model training without sacrificing predictive accuracy.
Experimental results confirm that dimensionality reduction—particularly at 256D and 128D—significantly decreased training time while preserving critical contextual information within the protein sequence embeddings. Leveraging GPU acceleration further enhanced training speed for lower-dimensional models. In contrast, high-dimensional embeddings often exceeded GPU memory limits, necessitating CPU-based execution and, thus, prolonging training times. While increasing subsequence length improved the model’s capacity to capture long-range dependencies, it also raised memory requirements and computational load. These findings underscore the need to balance representation richness with system-level efficiency.
The proposed framework performed effectively in Q3/Q8 classification tasks, maintaining high F1 scores, even under reduced-dimensionality settings. The 256D–50L configuration, in particular, emerged as the optimal setup—delivering nearly 99% of baseline accuracy while reducing the training duration by up to 43%. These outcomes highlight the efficacy of combining dimensionality compression and sequence segmentation in training deep learning models for large-scale protein analysis.
In conclusion, the presented method offers a practical and scalable solution for protein secondary structure prediction, especially in environments with limited computational resources. By maintaining a strong trade-off between accuracy and efficiency, the framework contributes meaningfully to the domains of bioinformatics and computational biology. Moreover, the proposed strategy has the potential to serve as a foundational tool for future studies involving more complex structural predictions or multi-task learning in protein science.
7. Future Work
While the proposed approach demonstrates strong performance in both Q3 and Q8 classification tasks, several directions remain open for future exploration.
- Integration with Pretrained 3D Models: Future work can explore the integration of the proposed framework with state-of-the-art 3D structure predictors such as AlphaFold2 or ESMFold. Leveraging tertiary structure outputs as additional input features may enhance secondary structure prediction accuracy and offer multi-level structural consistency.
- Attention-Based Interpretability: Incorporating attention mechanisms into Bi-LSTM or replacing it with Transformer-based architectures could provide interpretability, enabling the identification of sequence regions critical for structural transitions.
- Multi-task Learning: Extending the model to jointly predict related structural features—such as solvent accessibility, contact maps, or intrinsically disordered regions—could improve generalization and model robustness across protein families.
- Cross-platform and Edge Deployment: Given the model’s compact design with dimensionality-reduced embeddings, deploying optimized variants on mobile or embedded platforms could open avenues for real-time protein structure analysis in portable lab devices.
- Data Augmentation and Self-Supervised Pretraining: Utilizing contrastive learning or masked amino acid prediction on large unlabeled protein datasets can improve feature richness, especially in low-resource scenarios where labeled data are limited.
- Dataset Diversity: The curated PISCES dataset, while high-quality, may suffer from structural bias—particularly the under-representation of membrane proteins. This may limit the model’s generalizability to under-represented structural classes. Future efforts should consider incorporating more diverse protein families, including membrane-associated proteins (e.g., GPCRs) and intrinsically disordered proteins (IDPs), to enhance structural diversity and real-world applicability.
- Dynamic Subsequence Lengths: In this study, we adopted fixed-length subsequences (25, 50, 75, and 100 residues) for computational consistency. However, proteins naturally exhibit domain structures of varying lengths. Future research could investigate dynamic or adaptive subsequence segmentation strategies—possibly guided by domain prediction tools or sequence entropy—to better capture structural boundaries and improve biological relevance.
These directions aim to enhance the biological relevance, interpretability, and computational accessibility of secondary structure prediction systems. The proposed framework offers a solid foundation for these future extensions, particularly in applications requiring scalability and adaptability across different protein domains.
Author Contributions
Conceptualization, İ.K., H.G. and Y.N.H.A.-S.; methodology, İ.K., H.G. and Y.N.H.A.-S.; software, İ.K. and Y.N.H.A.-S.; validation, İ.K., H.G., Ö.F.Y. and Y.N.H.A.-S.; formal analysis, İ.K., H.G. and Y.N.H.A.-S.; investigation, Y.N.H.A.-S. and İ.K.; resources, İ.K.; data curation, Y.N.H.A.-S. and İ.K.; writing—original draft preparation, İ.K., H.G., Ö.F.Y. and Y.N.H.A.-S.; writing—review and editing, İ.K., H.G., Ö.F.Y. and Y.N.H.A.-S.; visualization, Y.N.H.A.-S.; supervision, İ.K. and H.G.; project administration, İ.K.; funding acquisition, İ.K. All authors have read and agreed to the published version of the manuscript.
Funding
This study was supported by the Kocaeli University Scientific Research Projects Coordination Unit under project number FBA-2023-3043.
Data Availability Statement
Publicly available datasets were analyzed in this study. This data can be found here: https://www.kaggle.com/datasets/kirkdco/protein-secondary-structure-2022/data.
Acknowledgments
During the preparation of this manuscript, the authors used ChatGPT (OpenAI, GPT-4, May 2025 version) for the purposes of language refinement and typographical error correction. The authors have reviewed and edited the output provided by the tool and take full responsibility for the content of this publication.
Conflicts of Interest
The authors declare no conflicts of interest.
References
- Pauling, L.; Corey, R.B.; Branson, H.R. The Structure of Proteins: Two Hydrogen-Bonded Helical Configurations of the Polypeptide Chain. Proc. Natl. Acad. Sci. USA 1951, 37, 205–211. [Google Scholar] [CrossRef]
- Ismi, D.P.; Pulungan, R.; Afiahayati, N. Deep Learning for Protein Secondary Structure Prediction: Pre and Post-AlphaFold. Comput. Struct. Biotechnol. J. 2022, 20, 6271–6286. [Google Scholar] [CrossRef]
- Yuan, L.; Hu, X.; Ma, Y.; Liu, Y. DLBLS_SS: Protein Secondary Structure Prediction Using Deep Learning and Broad Learning System. RSC Adv. 2022, 12, 33479–33487. [Google Scholar] [CrossRef]
- Patel, M.S.; Mazumdar, H.S. Knowledge base and neural network approach for protein secondary structure prediction. J. Theor. Biol. 2014, 361, 182–189. [Google Scholar] [CrossRef] [PubMed]
- Kösesoy, İ.; Gök, M.; Öz, C. PROSES: A web server for sequence-based protein encoding. J. Comput. Biol. 2018, 25, 1120–1122. [Google Scholar] [CrossRef] [PubMed]
- Li, Z.; Wang, J.; Zhang, S.; Zhang, Z.; Wu, W. A new hybrid coding for protein secondary structure prediction based on primary structure similarity. Gene 2017, 618, 8–13. [Google Scholar] [CrossRef] [PubMed]
- Kosesoy, I.; Gok, M.; Oz, C. A new sequence based encoding for prediction of host–pathogen protein interactions. Comput. Biol. Chem. 2019, 78, 170–177. [Google Scholar] [CrossRef]
- Kösesoy, İ.; Gök, M.; Kahveci, T. Prediction of host-pathogen protein interactions by extended network model. Turk. J. Biol. 2021, 45, 138–148. [Google Scholar] [CrossRef]
- Geethu, S.; Vimina, E.R. Protein Secondary Structure Prediction Using Cascaded Feature Learning Model. Appl. Soft Comput. 2023, 140, 110242. [Google Scholar] [CrossRef]
- Yang, W.; Hu, Z.; Zhou, L.; Jin, Y. Protein Secondary Structure Prediction Using a Lightweight Convolutional Network and Label Distribution Aware Margin Loss. Knowl.-Based Syst. 2021, 237, 107771. [Google Scholar] [CrossRef]
- Ema, R.R.; Khatun, M.A.; Adnan, M.N.; Kabir, S.S.; Galib, S.M.; Hossain, M.A. Protein Secondary Structure Prediction Based on CNN and Machine Learning Algorithms. Int. J. Adv. Comput. Sci. Appl. 2022, 13, 115–126. [Google Scholar] [CrossRef]
- Zhou, J.; Wang, H.; Zhao, Z.; Xu, R.; Lu, Q. CNNH-PSS: Protein 8-Class Secondary Structure Prediction by Convolutional Neural Network with Highway. BMC Bioinform. 2018, 19, 60. [Google Scholar] [CrossRef]
- Lyu, Z.; Wang, Z.; Shuai, J.; Huang, Y. Protein Secondary Structure Prediction with a Reductive Deep Learning Method. Front. Bioeng. Biotechnol. 2021, 9, 687426. [Google Scholar] [CrossRef]
- Ghazikhani, H.; Butler, G. Enhanced Identification of Membrane Transport Proteins: A Hybrid Approach Combining ProtBERT-BFD and Convolutional Neural Networks. J. Integr. Bioinform. 2023, 20, 20220055. [Google Scholar] [CrossRef]
- Yamada, K.; Hamada, M. Prediction of RNA-Protein Interactions Using a Nucleotide Language Model. Bioinform. Adv. 2022, 2, vbac023. [Google Scholar] [CrossRef]
- Chowdhury, R.; Bouatta, N.; Biswas, S.; Rochereau, C.; Church, G.M.; Sorger, P.K.; AlQuraishi, M. Single-Sequence Protein Structure Prediction Using Language Models from Deep Learning. bioRxiv 2021. [Google Scholar] [CrossRef]
- Chou, P.Y.; Fasman, G.D. Prediction of the secondary structure of proteins from their amino acid sequence. Adv. Enzymol. Relat. Areas Mol. Biol. 1978, 47, 45–148. [Google Scholar]
- Qian, N.; Sejnowski, T.J. Predicting the Secondary Structure of Globular Proteins Using Neural Network Models. J. Mol. Biol. 1988, 202, 865–884. [Google Scholar] [CrossRef]
- Heffernan, R.; Yang, Y.; Paliwal, K.; Zhou, Y. Capturing non-local interactions by long short-term memory bidirectional recurrent neural networks for improving prediction of protein secondary structure. Bioinformatics 2015, 33, 2842–2849. [Google Scholar] [CrossRef]
- Hanson, J.; Paliwal, K.; Litfin, T.; Yang, Y.; Zhou, Y. Accurate prediction of protein secondary structure using an ensemble of deep learning methods. Bioinformatics 2017, 33, 868–878. [Google Scholar]
- Wardah, W.; Khan, M.G.M.; Sharma, A.; Rashid, M.A. Protein Secondary Structure Prediction Using Neural Networks and Deep Learning: A Review. Comput. Biol. Chem. 2019, 81, 1–8. [Google Scholar] [CrossRef]
- Cheng, J.; Liu, Y.; Ma, Y. Protein Secondary Structure Prediction Based on Integration of CNN and LSTM Model. J. Vis. Commun. Image Represent. 2020, 71, 102844. [Google Scholar] [CrossRef]
- Sonsare, P.M.; C, G. Cascading 1d-Convnet Bidirectional Long Short Term Memory Network With Modified COCOB Optimizer: A Novel Approach for Protein Secondary Structure Prediction. Chaos Solitons Fractals 2021, 153, 111446. [Google Scholar] [CrossRef]
- Zubair, M.; Hanif, M.K.; Alabdulkreem, E.; Ghadi, Y.Y.; Khan, M.I.; Sarwar, M.U.; Hanif, A. A Deep Learning Approach for Prediction of Protein Secondary Structure. Comput. Mater. Contin. 2022, 72, 3705–3718. [Google Scholar] [CrossRef]
- Jumper, J.; Evans, R.; Pritzel, A.; Green, T.; Figurnov, M.; Ronneberger, O.; Tunyasuvunakool, K.; Bates, R.; Žídek, A.; Potapenko, A.; et al. Highly accurate protein structure prediction with AlphaFold. Nature 2021, 596, 583–589. [Google Scholar] [CrossRef]
- Wang, Y.; Mao, H.; Yi, Z. Protein Secondary Structure Prediction by Using Deep Learning Method. Knowl.-Based Syst. 2017, 118, 115–123. [Google Scholar] [CrossRef]
- Devlin, J.; Chang, M.W.; Lee, K.; Toutanova, K. BERT: Pre-training of Deep Bidirectional Transformers for Language Understanding. arXiv 2018, arXiv:1810.04805. [Google Scholar]
- Elnaggar, A.; Heinzinger, M.; Dallago, C.; Rehawi, G.; Wang, Y.; Jones, L.; Gibbs, T.; Feher, T.; Angerer, C.; Steinegger, M.; et al. ProtTrans: Toward Understanding the Language of Life Through Self-Supervised Learning. IEEE Trans. Pattern Anal. Mach. Intell. 2022, 44, 7112–7127. [Google Scholar] [CrossRef]
- Brandes, N.; Ofer, D.; Peleg, Y.; Rappoport, N.; Linial, M. ProteinBERT: A Universal Deep-Learning Model of Protein Sequence and Function. Bioinformatics 2022, 38, 2102–2110. [Google Scholar] [CrossRef]
- Vincent, P.; Larochelle, H.; Lajoie, I.; Bengio, Y.; Manzagol, P.A.; Bottou, L. Stacked Denoising Autoencoders: Learning Useful Representations in a Deep Network with a Local Denoising Criterion. J. Mach. Learn. Res. 2010, 11, 3371–3408. [Google Scholar]
- Jha, K.; Saha, S.; Tanveer, M. Prediction of protein-protein interactions using stacked auto-encoder. Trans. Emerg. Telecommun. Technol. 2022, 33, e4256. [Google Scholar] [CrossRef]
- Manzoor, U.; Halim, Z. Protein encoder: An autoencoder-based ensemble feature selection scheme to predict protein secondary structure. Expert Syst. Appl. 2023, 213, 119081. [Google Scholar]
- Wang, L.; You, Z.H.; Chen, X.; Xia, S.X.; Liu, F.; Yan, X.; Zhou, Y.; Song, K.J. A computational-based method for predicting drug–target interactions by using stacked autoencoder deep neural network. J. Comput. Biol. 2018, 25, 361–373. [Google Scholar] [CrossRef]
- Patre, S.; Kanani, R.; Alam, F.F. SuperFoldAE: Enhancing Protein Fold Classification with Autoencoders. In Proceedings of the Computational Structural Bioinformatics Workshop; Springer: Cham, Switzerland, 2024; pp. 1–15. [Google Scholar]
- Sevgen, E.; Moller, J.; Lange, A.; Parker, J.; Quigley, S.; Mayer, J.; Srivastava, P.; Gayatri, S.; Hosfield, D.; Korshunova, M.; et al. ProT-VAE: Protein transformer variational autoencoder for functional protein design. bioRxiv 2023. [Google Scholar] [CrossRef]
- Sharma, A.K.; Srivastava, R. Protein secondary structure prediction using character bi-gram embedding and Bi-LSTM. Curr. Bioinform. 2021, 16, 333–338. [Google Scholar]
- Roslidar, R.; Brilianty, N.; Alhamdi, M.J.; Nurbadriani, C.N.; Harnelly, E.; Zulkarnain, Z. Improving Bi-LSTM for High Accuracy Protein Sequence Family Classifier. Indones. J. Electr. Eng. Inform. 2024, 12, 40–52. [Google Scholar] [CrossRef]
- Tran, T.X.; Le, N.Q.K.; Nguyen, V.N. Integrating CNN and Bi-LSTM for protein succinylation sites prediction based on Natural Language Processing technique. Comput. Biol. Med. 2025, 186, 109664. [Google Scholar] [CrossRef]
- Hannigan, G.D.; Prihoda, D.; Palicka, A.; Soukup, J.; Klempir, O.; Rampula, L.; Durcak, J.; Wurst, M.; Kotowski, J.; Chang, D.; et al. A deep learning genome-mining strategy for biosynthetic gene cluster prediction. Nucleic Acids Res. 2019, 47, e110. [Google Scholar] [CrossRef]
- Lilhore, U.K.; Simaiya, S.; Dalal, S.; Faujdar, N.; Sharma, Y.K.; Rao, K.B.; Maheswara Rao, V.; Tomar, S.; Ghith, E.; Tlija, M. ProtienCNN-BLSTM: An efficient deep neural network with amino acid embedding-based model of protein sequence classification and biological analysis. Comput. Intell. 2024, 40, e12696. [Google Scholar] [CrossRef]
- Wang, D.; Zou, C.; Wei, Z.; Zhong, Z. Disease Phenotype Classification Model Based on Multi-channel Deep Supervised Bi-LSTM. In Proceedings of the 2024 5th International Conference on Computer Engineering and Application (ICCEA), Hangzhou, China, 12–14 April 2024; pp. 760–766. [Google Scholar]
- Gunduz, H. Comparative analysis of BERT and FastText representations on crowdfunding campaign success prediction. PeerJ Comput. Sci. 2024, 10, e2316. [Google Scholar] [CrossRef]
- Powers, D.M.W. Evaluation: From precision, recall and F-measure to ROC, informedness, markedness and correlation. J. Mach. Learn. Technol. 2011, 2, 37–63. [Google Scholar]
- Sun, P.D.; Foster, C.E.; Boyington, J.C. Overview of protein structural and functional folds. Curr. Protoc. Protein Sci. 2004, 35, 17-1. [Google Scholar] [CrossRef]
- Liu, J.; Rost, B. Domains, motifs and clusters in the protein universe. Curr. Opin. Chem. Biol. 2003, 7, 5–11. [Google Scholar] [CrossRef]
- Miao, Z.; Wang, Q.; Xiao, X.; Kamal, G.M.; Song, L.; Zhang, X.; Li, C.; Zhou, X.; Jiang, B.; Liu, M. CSI-LSTM: A web server to predict protein secondary structure using bidirectional long short term memory and NMR chemical shifts. J. Biomol. NMR 2021, 75, 393–400. [Google Scholar] [CrossRef]
- Guo, Y.; Li, W.; Wang, B.; Liu, H.; Zhou, D. DeepACLSTM: Deep asymmetric convolutional long short-term memory neural models for protein secondary structure prediction. BMC Bioinform. 2019, 20, 341. [Google Scholar] [CrossRef]
- Feng, R.; Wang, X.; Xia, Z.; Han, T.; Wang, H.; Yu, W. MHTAPred-SS: A Highly Targeted Autoencoder-Driven Deep Multi-Task Learning Framework for Accurate Protein Secondary Structure Prediction. Int. J. Mol. Sci. 2024, 25, 13444. [Google Scholar] [CrossRef]
Disclaimer/Publisher’s Note: The statements, opinions and data contained in all publications are solely those of the individual author(s) and contributor(s) and not of MDPI and/or the editor(s). MDPI and/or the editor(s) disclaim responsibility for any injury to people or property resulting from any ideas, methods, instructions or products referred to in the content. |
© 2025 by the authors. Licensee MDPI, Basel, Switzerland. This article is an open access article distributed under the terms and conditions of the Creative Commons Attribution (CC BY) license (https://creativecommons.org/licenses/by/4.0/).