1. Introduction
Acoustic Emission (AE) is a non-invasive, non-destructive technique particularly suited for Structural Health Monitoring across a wide range of applications, including infrastructure, reinforced concrete elements, and historic masonry buildings. While AE has been extensively applied to concrete structures [
1], its use in masonry remains more complex due to the intrinsic heterogeneity of the materials and the considerable attenuation of signals.
In masonry, AE wave propagation is influenced by various factors, such as the density and stratigraphy of the construction, the presence of voids, and the nature of the mortar joints. Generally, wave velocities are higher in bricks and masonry blocks than in mortar. Interfaces between different components—such as brick-to-mortar contacts, pre-existing cracks, and composite wall sections—can act as reflective barriers, further complicating signal transmission [
2].
These characteristics render the interpretation and localisation of AE signals in historic masonry particularly challenging. The AE signal is typically composed of high-frequency elastic waves ranging between 5 kHz and 5 MHz, well outside the audible range [
3]. The source-to-sensor path, along with the presence of internal inhomogeneities, plays a fundamental role in shaping signal features, making source identification in masonry far from straightforward [
2].
Nevertheless, AE remains an effective diagnostic method for evaluating damage evolution in historic masonry, especially under conditions of long-term load, fatigue, or seismic action [
4,
5,
6]. AE enables real-time detection of micro- and macro-crack initiation, offering valuable insight into damage progression without compromising the structural integrity of the artefact [
7].
Among the most widely adopted approaches is the parametric analysis of AE signals, which relies on basic parameters such as signal amplitude, counts, energy, and Rise Time [
8]. More advanced techniques, such as the Load–Calm method, have been successfully applied to masonry to track AE activity over successive loading cycles [
9]. This approach is particularly useful as it focuses on relative activity levels, rather than absolute signal amplitude, thus mitigating the effects of attenuation typical in masonry [
8].
Additionally, the application of classical AE concepts such as the Kaiser effect and the Felicity ratio has proven valuable in masonry diagnostics [
10,
11]. The Kaiser effect refers to the absence of AE activity below previously reached load levels, while the Felicity ratio quantifies deviations from this ideal behaviour, offering insight into internal damage accumulation [
10]. These effects are less sensitive to signal degradation, making them well suited for applications in irregular, historic walls [
8].
Significant research efforts have also been directed towards linking AE signal features with damage mechanisms through analytical or numerical models. For instance, Carpinteri et al. proposed a correlation between AE data and fracture mechanics theory [
12], while multiscale approaches have linked AE activity to the fractal dimension of crack patterns [
13,
14]. Other studies have employed finite element modelling and lattice models to simulate AE behaviour in masonry under mechanical loads, providing a basis for interpreting real-time monitoring results [
6,
15].
An illustrative in situ application was reported by Carpinteri et al., who performed a load test on a historic vaulted masonry structure using water cushions as distributed loads. AE monitoring revealed activity only after surpassing the previously reached load level, providing experimental evidence of the Kaiser effect in historic masonry [
16].
Despite certain limitations—such as the lack of a direct quantitative correlation between AE parameters and damage severity and sensitivity to environmental noise—AE remains a highly valuable technique for heritage conservation [
17]. Its advantages include real-time monitoring, the ability to detect early-stage damage, and minimal invasiveness. Particularly in the case of ancient masonry, where mechanical properties and boundary conditions are often poorly understood, AE offers a non-destructive method to assess structural behaviour in situ. Moreover, the integration of AE-based observations with stiffness-based modelling strategies, such as the stiffness separation method, has been recently proposed for structural diagnostics of complex systems, especially in large-scale truss structures [
18,
19]. These approaches enable efficient damage localisation without the need for complete global modelling, suggesting promising pathways for simplifying the interpretation of AE data and its integration with reduced or partial numerical models.
This study applies AE monitoring to the historic masonry dome of Santa Maria delle Grazie in Barano d’Ischia. The objective is to evaluate the potential of AE for identifying micro-cracking and damage propagation in a highly heterogeneous material that cannot be well replicated under laboratory conditions. The experimental design is integrated with advanced numerical modelling and traditional structural assessments to validate the AE findings and develop a robust framework for monitoring similar historic structures.
3. Theoretical Framework
3.1. AE for Structural Applications
An AE signal consists of a sequence of waves whose velocity depends on the nature of the material through which they propagate. The structure of an impulsive signal (Burst Event) is characterised by a rapid increase in the energy of the generated elastic waves, followed by a decrease after reaching the peak amplitude. A structural monitoring campaign is generally focused on the analysis of Burst Events.
This type of event differs from those classified as continuous signals, which are associated with plasticisation phenomena. These continuous signals have low energy content and are characterised by stationary waveforms that are difficult to distinguish from background noise.
The analysis of AE phenomena begins with the definition of the following two key concepts:
Acoustic Emission Hit (hereinafter referred to as hit): An impulse detected and processed by a specific channel within a transient interval. During this interval, the signal transitions from a stationary condition, where no significant variations occur, to a state in which the signal exhibits substantial amplitude variations, indicating an event that has generated an elastic wave.
Acoustic Emission Event (hereinafter referred to as event): A group of hits received by two or more channels from a single localised source. In the case of a single channel, the number of hits is equal to the number of events.
An AE signal generated by a source is detected and processed only if it exceeds a predefined minimum voltage value, known as the threshold level. This level is initially set by the operator and depends on the environment in which the test is conducted. Determining the appropriate threshold level allows for the maximum possible reduction in background noise.
When the signal first exceeds the threshold level, it is referred to as a trigger, initiating the recording and processing of the signal by the dedicated software.
The standard terminology used to define the parameters associated with the analysis of these signals is established by the international standard ASTM E610 [
20]. The main parameters are summarised below:
Amplitude (A): The highest value present in the waveform of the signal, which is correlated with both the type of source generating it and the material. It is a fundamental measure linked to signal intensity [
21].
Event Duration: The time interval between the first and last threshold exceedance. The ratio between this quantity and amplitude provides useful information for determining the waveform shape.
Rise Time: the time interval between the first threshold exceedance and the moment when the maximum amplitude is reached.
Arrival Time: The exact moment when an Acoustic Emission (AE) signal is first detected by a sensor. It marks the start of the transient, indicating the transition from a stationary condition to a significant variation in the signal.
Decay Time: complementary to the Event Duration, this represents the time interval between the moment the maximum amplitude is reached and the last threshold exceedance.
Dead Time: The time interval after which, if no further threshold exceedance is detected, the AE event is considered to have ended. This parameter must be defined based on the material.
Counts: The number of times the signal amplitude exceeds the threshold level. Depending on the waveform shape, a single hit may generate either a small or large number of counts.
Counts to Peak: the number of counts recorded before and including the one corresponding to the maximum amplitude.
Counts Rate: the number of counts per unit of time.
Signal Strength: the elastic energy released by each AE event, conventionally.
A complete list of AE properties and definitions is provided in [
13,
22,
23].
Ozevin [
24] presents an interesting correlation of the described parameters, analysed in the time domain, and their interpretation in terms of information related to the source. An excerpt of these correlations is provided in
Table 1.
3.2. Signal Attenuation
When AE waves propagate through a material, their amplitude decreases as they move away from the source. This phenomenon, known as attenuation, is directly related to diffusion, reflection, and absorption processes. Attenuation can be expressed as follows:
where A
f is the wave amplitude at the sensor location, A
0 is the wave amplitude at the source, α is the attenuation coefficient (which varies depending on the material), and d is the distance travelled by the wave [
22].
Attenuation assessment is an essential aspect of any AE-based testing or monitoring process. Understanding the attenuation law not only enables the differentiation of background noise but also facilitates the localisation of the signal source detected by the sensor.
The ASTM E976 standard provides a methodology for evaluating attenuation laws through source simulation. The majority of tests are conducted by simulating the source through the breakage of a calibrated lead (Hsu–Nielsen source) on the surface of the specimen under examination. This test is commonly referred to as the pencil test [
25]. When the lead, pressed against the element’s surface, breaks, it generates a short-duration localised impulse, closely resembling that produced by a natural AE source following crack formation. The Hsu–Nielsen lead break test must be repeated multiple times, progressively increasing the distance from the sensor and recording, for each break, the amplitude of the signal detected by the transducer.
Signal attenuation plays a critical role in the application of AE monitoring to masonry structures. Due to the heterogeneous composition of masonry, characterised by irregular stone units, variable mortar joints, and inherent discontinuities, acoustic energy emitted from microstructural events undergoes significant amplitude reduction and frequency distortion during propagation. This directly impacts the accuracy of event localization, damage classification, and the reliability of AE parameters, making a quantitative understanding of material-specific attenuation indispensable. Proper characterisation of signal loss as a function of distance and propagation direction enables the calibration of detection thresholds, the optimisation of sensor placement, and more accurate interpretation of AE data. In historical structures, where invasive testing is limited and preservation is paramount, understanding attenuation behaviour is essential to ensure the effectiveness and precision of real-time structural monitoring.
3.3. Kaiser Effect and Felicity Ratio
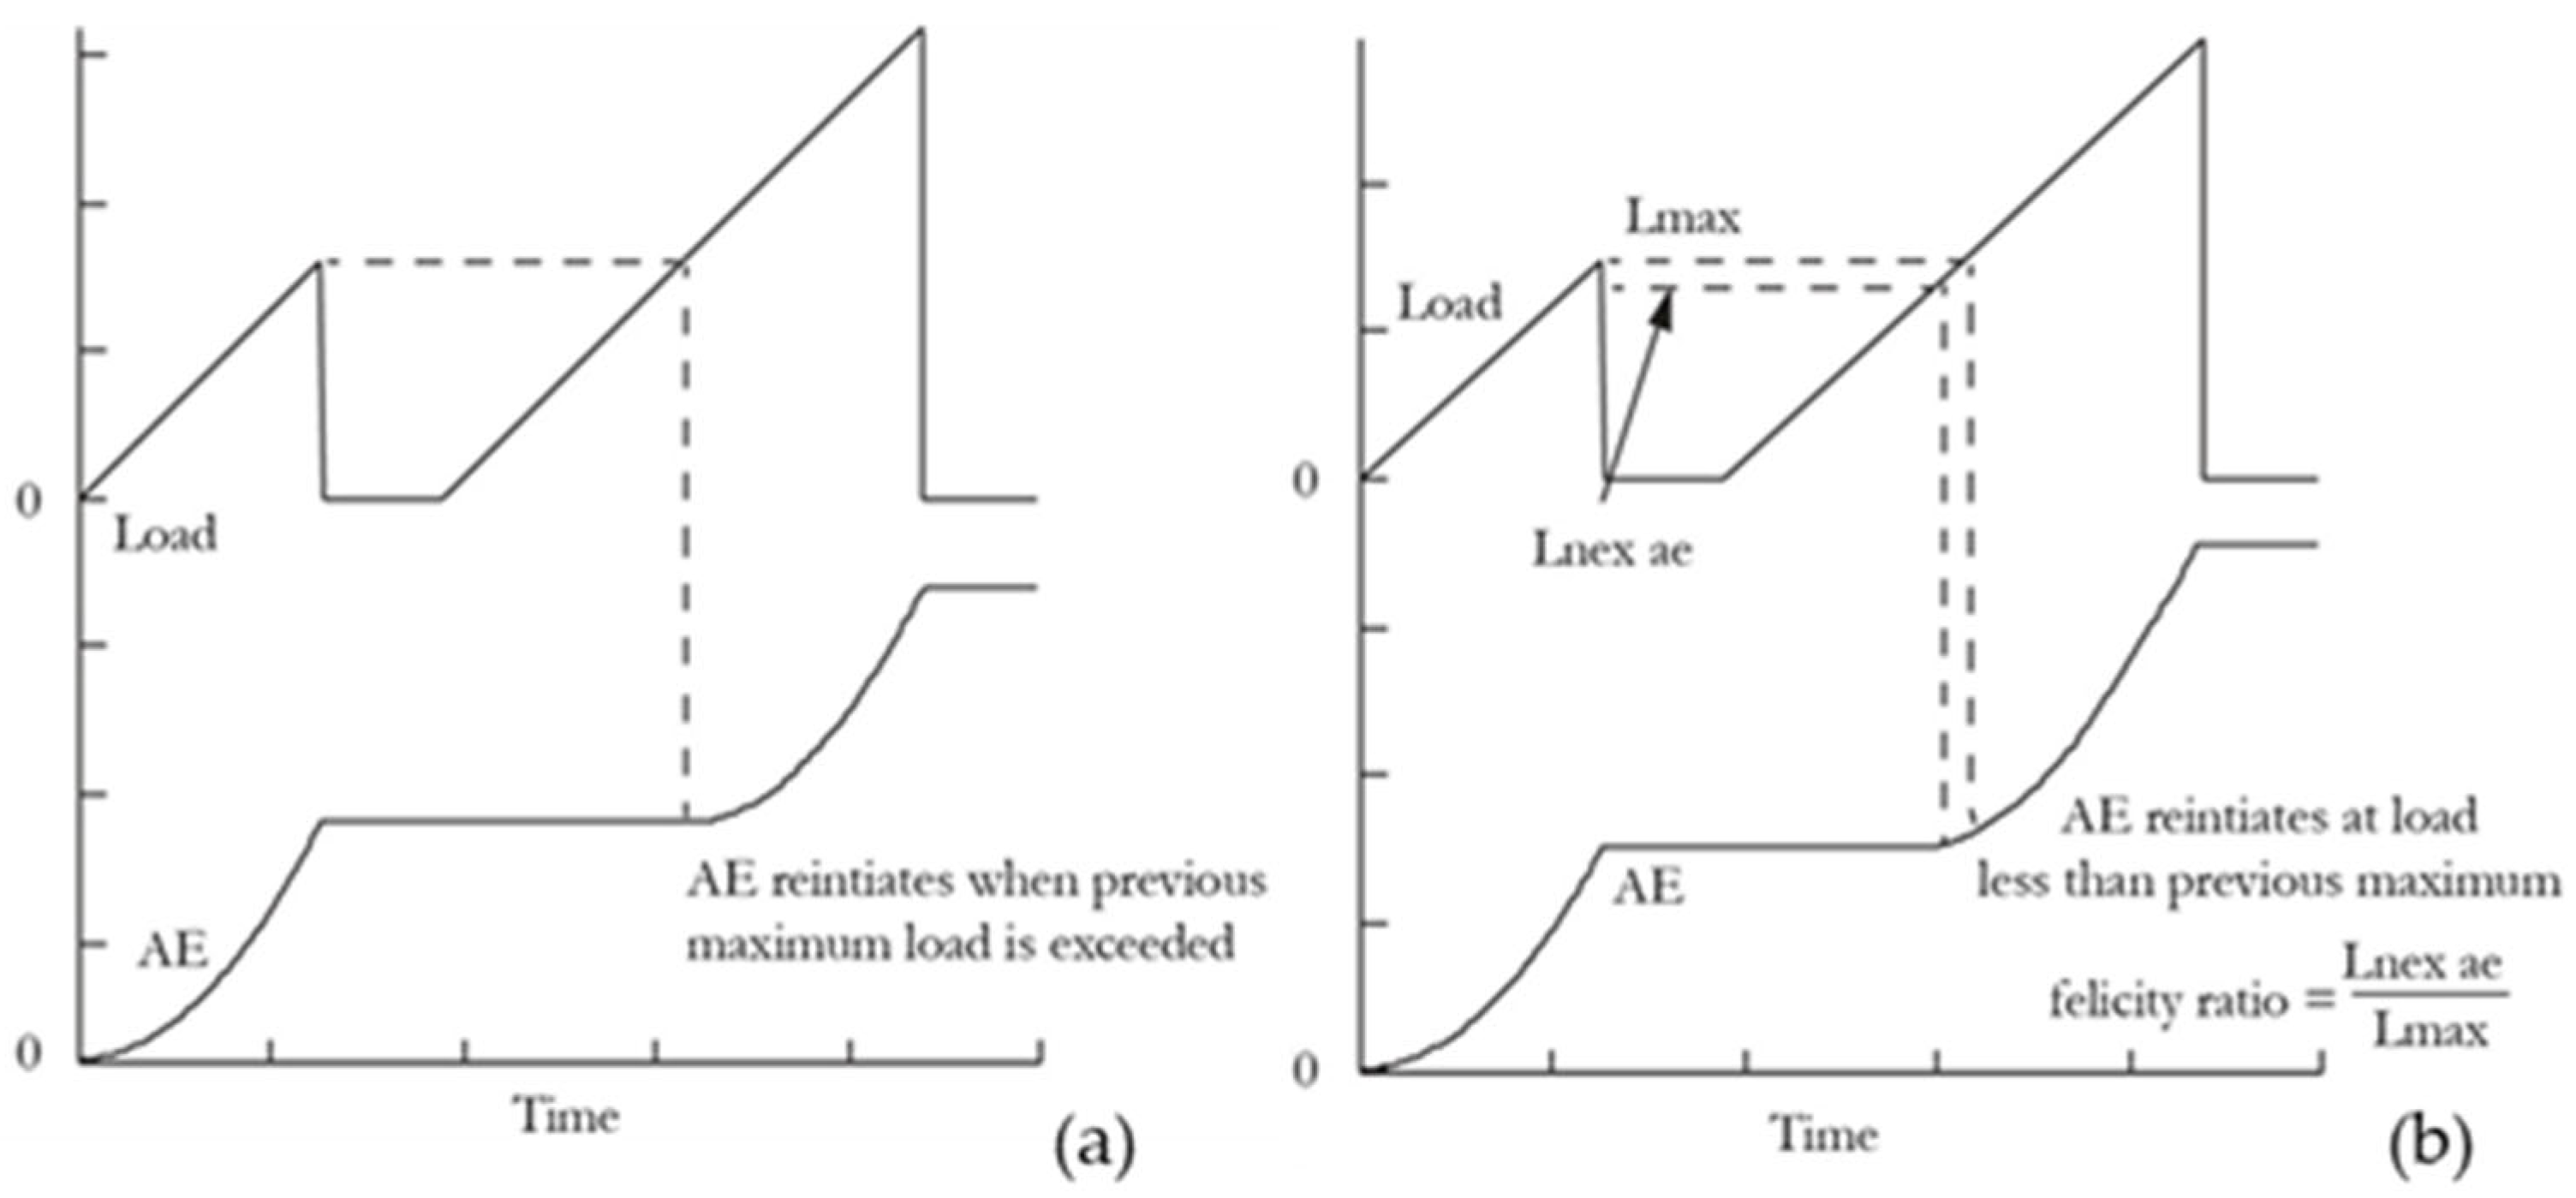
In the field of Acoustic Emission (AE) monitoring, the Kaiser effect is a well-documented phenomenon, whereby a material subjected to cyclic loading does not exhibit significant AE activity until the previously applied maximum load level is exceeded. The Kaiser effect is graphically represented by the absence of AE activity until the previously applied maximum load is exceeded (
Figure 1a). This load is referred to as Lmax [
26]. This effect is indicative of an undamaged or non-degraded state, as the material “remembers” the past maximum stress and remains silent under repeated lower loads. It is particularly useful in distinguishing between new and existing damage within a structure and in assessing whether ongoing loading conditions are inducing further deterioration.
However, deviations from the Kaiser effect may occur in materials that have already experienced damage. In such cases, AE activity is detected even before reaching the previous maximum load. This behaviour is quantified by the Felicity ratio, defined as the ratio between the load at which emissions resume and the maximum load previously applied (
Figure 1b). The Felicity ratio is calculated by dividing the load at which AE activity next occurs (Lnex ae) by the previous maximum load (Lmax): Felicity Ratio = Lnex AE/Lmax. A Felicity ratio close to 1 indicates minimal damage accumulation; values below 0.95 suggest internal deterioration. Specifically, a Felicity ratio close to 1 suggests that the material retains its structural integrity, whereas lower values (typically below 0.95) may indicate progressive damage and a reduced ability of the material to sustain repeated loading.
The combined use of these parameters provides a valuable tool for interpreting the mechanical response of materials, especially in the case of historic masonry, where micro-crack propagation under sustained or cyclic loads may not be visible externally. When applied to load test data, the Kaiser effect and Felicity ratio allow for the detection of early warning signs of structural degradation. Their effectiveness is enhanced when interpreted alongside the AE hit rate, cumulative energy, and source localisation methods, contributing to a more comprehensive understanding of the internal state of the structure.
However, as will be discussed in
Section 5, the experimental conditions did not allow for a quantitative evaluation of the Kaiser effect and Felicity ratio due to the absence of a prior load history and the limitations inherent to in situ testing on restored heritage structures.
3.4. AE Source Location
In this study, the linear localisation of Acoustic Emission (AE) sources is performed using the Arrival Time Method [
28,
29,
30]. This technique is based on the comparison of the Arrival Times of AE signals at different sensors arranged along the monitored element. The Arrival Time is defined as the instant at which the signal amplitude first exceeds the threshold level. Assuming a constant propagation velocity within the material, the position of the AE source can be estimated by solving a system of equations derived from the time differences between sensors.
Given the known distance D between two sensors, S1 and S2, the distance L
1 from the AE source to sensor S1 can be determined using the following expressions:
where T
1 and T
2 are the Arrival Times of the signal at sensors S1 and S2, ΔT is the difference T
2 − T
1, and c is the acoustic wave velocity.
Despite its simplifications, this method is particularly effective in masonry structures where full 3D localisation is often unfeasible due to limited sensor accessibility and the heterogeneous nature of the material.
4. Case Study: Santa Maria Delle Grazie
The Santa Maria delle Grazie complex is a masonry structure situated in the municipality of Barano in the southeastern part of Ischia Island.
The building was selected as the test site based on several key considerations. The structure forms part of a culturally and historically valuable heritage site, subject to strict conservation regulations, making non-invasive diagnostic techniques essential. This condition offered a suitable scenario for testing AE techniques under semi-controlled loading conditions on a rehabilitated structural element. The presence of a reinforced but still heterogeneous masonry arch allowed for the investigation of internal damage phenomena and stress redistribution mechanisms without compromising the structural safety or historical value of the building. Due to its relevance, the site also hosted an experimental campaign involving the use of optical fibre-based sensing systems [
31,
32,
33].
The structure is made of several elements. The church and the related annexed buildings were built for religious purposes at the behest of the Baldino family in the late Baroque period, who lived in the annexe behind the church. In 1883, the structures were damaged by the earthquake of Casamicciola Terme. No restoration work is documented, at least until 1889. However, it is probable that some minimal interventions were carried out in the following years, just as it is impossible to attribute to that seismic event the instability that still interests researchers in the artefact today. It was certainly open to worship until the first few decades of the twentieth century. Upon the death of Mattia Baldino in 1920, the church was closed. In the first few decades of the last century, Baldino’s family left Barano, moving to another municipality of the Isle. Since then, the continuous hereditary disputes that developed within the family led to the progressive abandonment of the complex. The lack of maintenance over several decades is undoubtedly the leading cause of the substantial deterioration. In 1992, the last heirs, Aniello and Raffaella Baldino, sold the entire complex, including the Chapel, to the Municipality of Barano.
The structure is made of Arso lava stone and lime mortar, with some parts arranged in regular blocks and others chaotically. The horizontals were made up of stone barrels, cross vaults, and wooden floors.
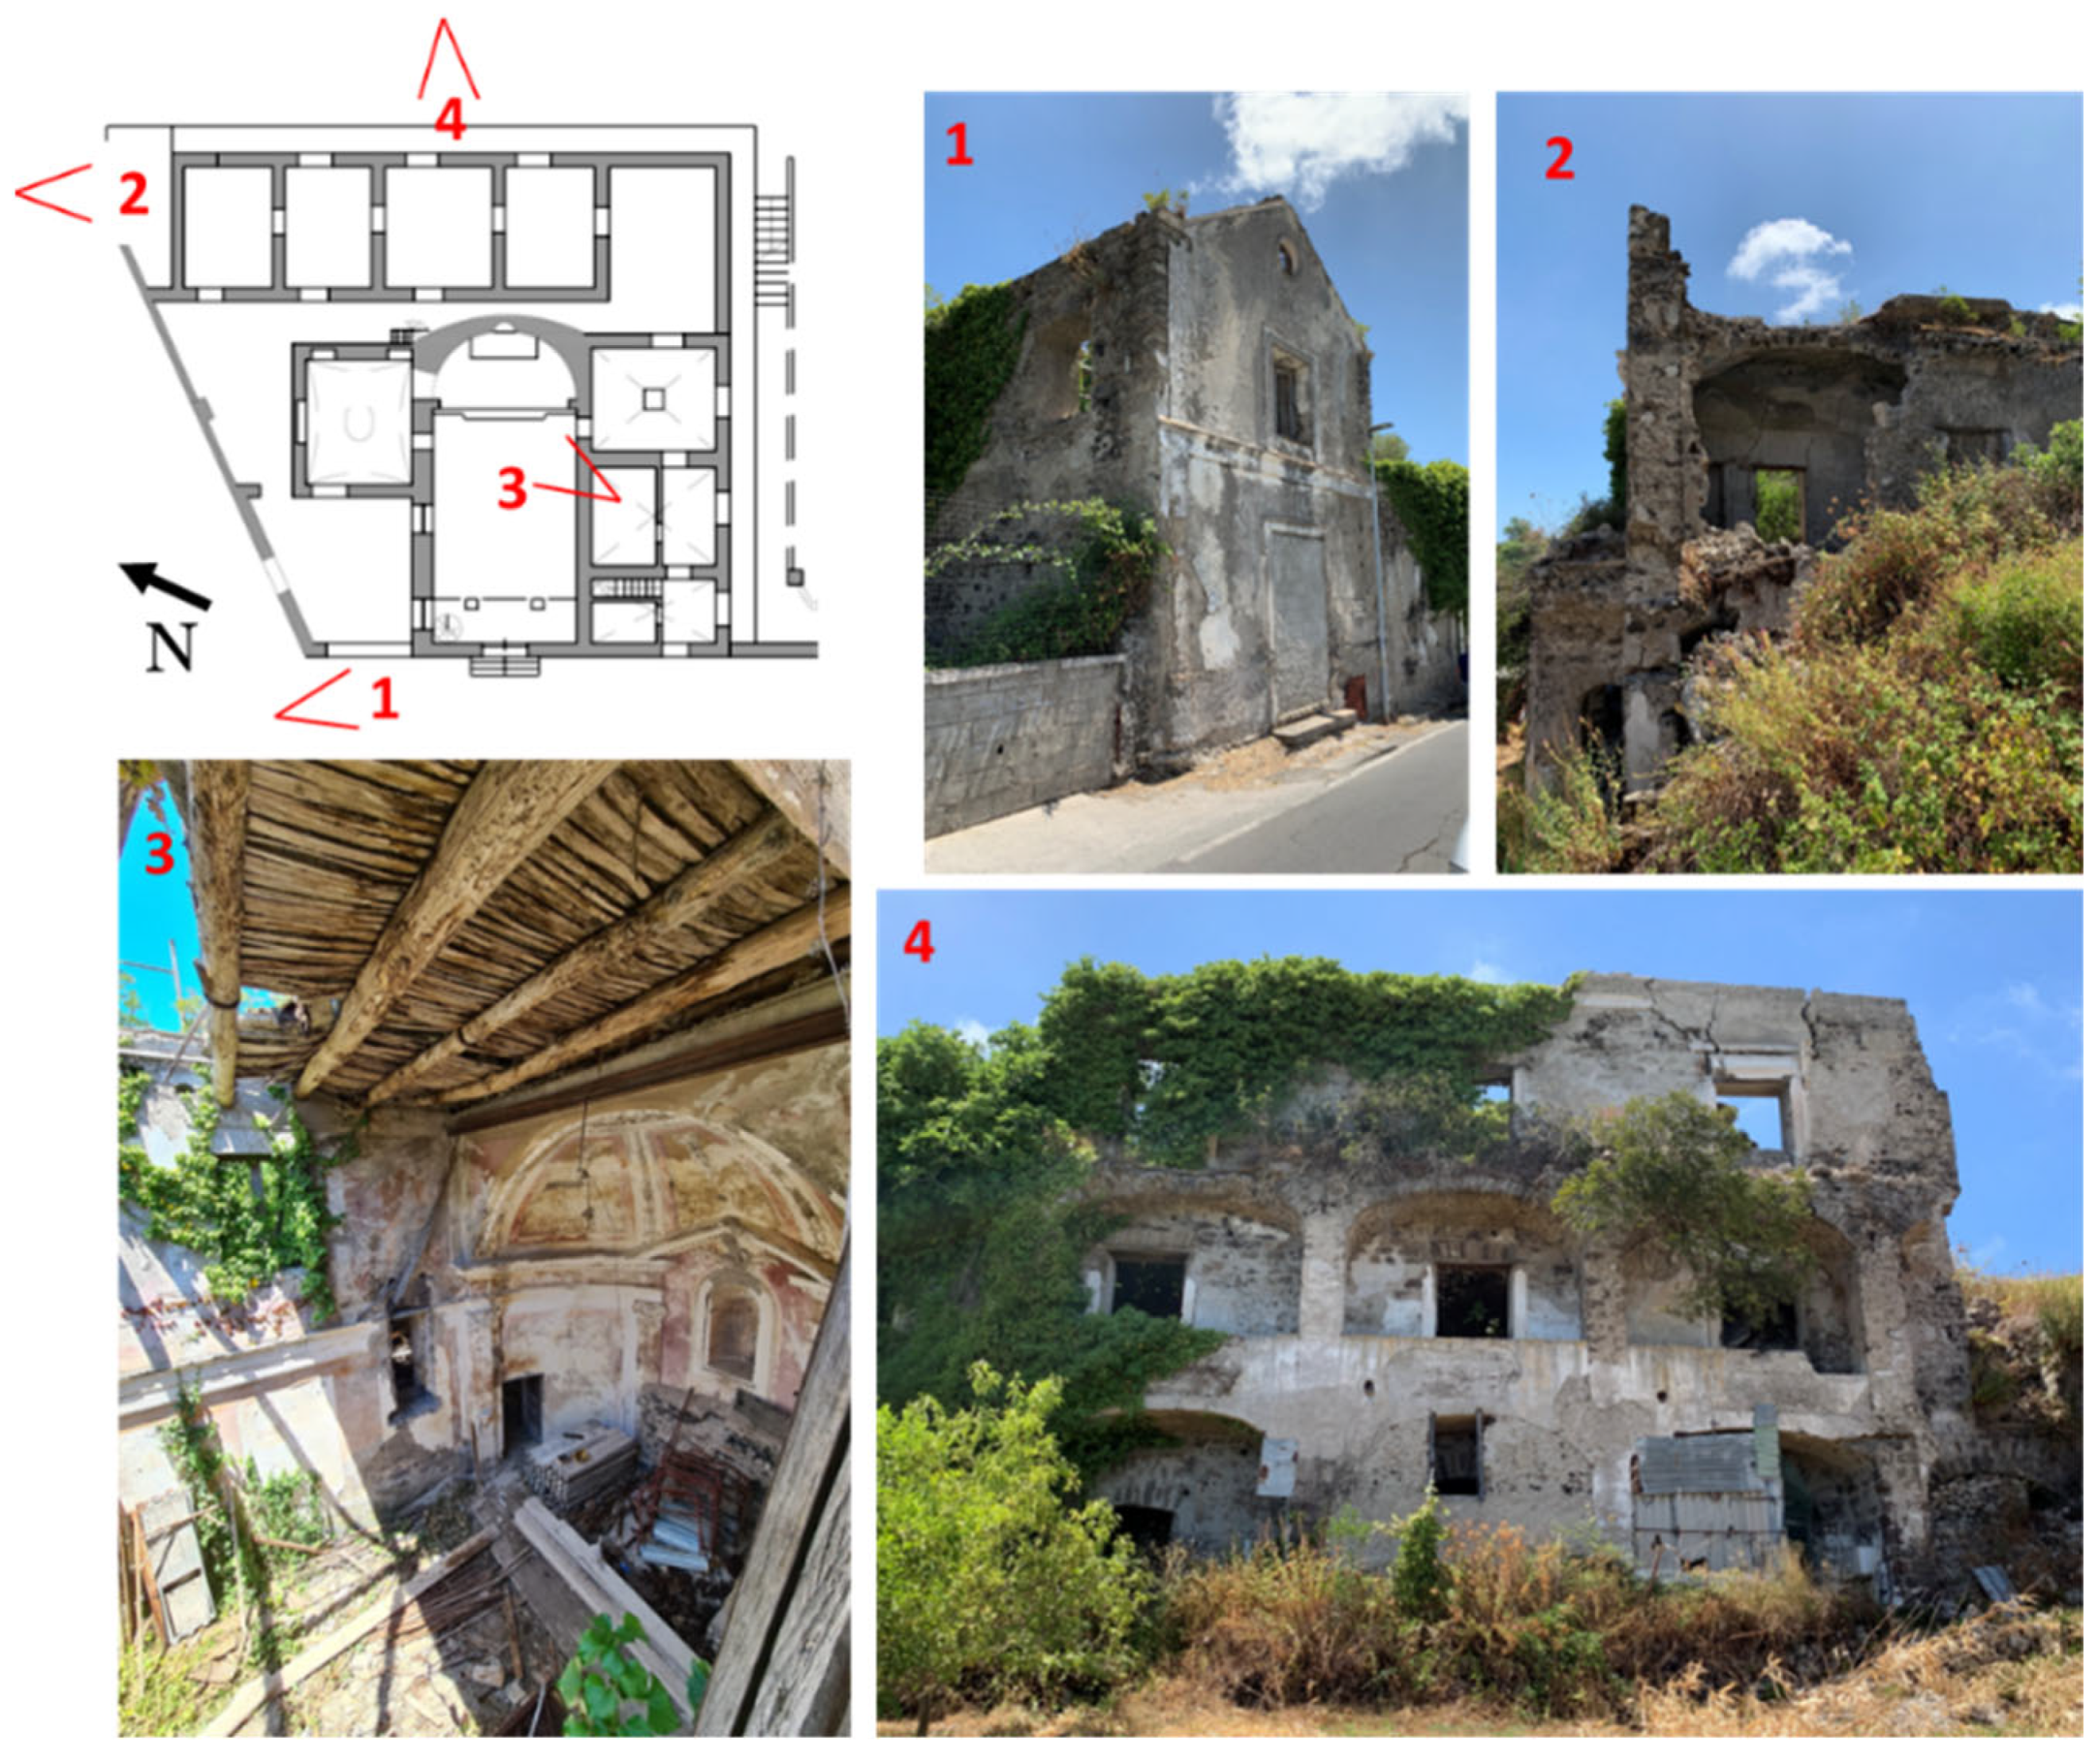
Nowadays, the monument is subjected to restoration work since the state of the structure was very poor (
Figure 2), and the whole complex was almost entirely obstructed by weeds, which had grown freely over the years of neglect.
The deterioration has also been increased by the continuous exposure of the building to atmospheric agents due to its apical and isolated position. The church, occupying the ground floor, was entirely devoid of a roof, affected by a generalised collapse. The edge wall structures were intact and protected by a finishing layer of painted plaster enriched with various mouldings. The church’s facade almost entirely lacks plaster. The annexes behind the church were residential areas, with some walls remaining and others having collapsed or been demolished for safety purposes. The first basement floor is about three metres beneath road level. The related facade bordering the road has no windows, while the other three sides open freely onto the surrounding landscape. This floor mainly had service areas, such as rooms, vats for vinification, kitchens, and washrooms. The east and south sides opened onto panoramic balconies and loggias as part of arcades, probably added at a later date. In some cases, arches effectively disconnected the facades. The structural consolidation works aim to improve static and seismic capacity through a series of global and local interventions [
34,
35,
36].
The global level involved widespread masonry consolidation in terms of increasing in-plane and out-of-plane strength [
37,
38] by first reconstructing mortar joints and then plating with the FRCM technique performed with basalt meshes and inorganic matrix [
39]. Box-like behaviour has been improved by connecting masonry hammers and angles and inserting cross-link chains. The local level synthetically involved the reconstruction of the timber roof, the application of strips of PBO fibres in an inorganic matrix on the intrados of arches and vaults [
40], including the south and east arcades, and rebuilding collapsed floors and flatbeds.
The experimental campaign’s design focused on the monument’s south façade, particularly the arcade that defines a little loggia.
The south arcade is made of five arches, of which the first is round and the other four are three-centred. As shown in
Figure 3, the arches have different spans; the size of the round one is 1.65 m, that of the second and third is 4.30 m, and that of the others is 3.55 and 3.25 m. The mount is 1.25 m for all arches (
Figure 3). Among the five arches, the third one—characterised by a three-centred geometry and a span of 4.30 m—was selected for instrumentation and monitoring during the experimental campaign.
The in situ tests performed by the executing company did not detect any filling in the upper part of the arches, highlighting that the entire arcade is made up of a single material.
The restoration project provides two main interventions for this part of the structure. At first, an FRCM-type intrados reinforcement was applied to the arches with unidirectional PBO strips. PBO (Polyparaphenylenebenzobisoxazole) is a synthetic fibre used in structural reinforcement systems with a cementitious matrix (FRCM). Compared to the most commonly used fibres, it has notable mechanical characteristics and has high chemical compatibility with inorganic compounds. It is often used for reinforcement interventions on masonry buildings (even those of historical value) thanks to the high compatibility of the matrix with which it is applied to the wall support. For the south arcade, three bands of 25 cm width and weight equal to 105 g/m2 were placed with additional bands set orthogonally. Joint elements were placed at the intersection between longitudinal and transversal bands to prevent debonding from the support. The FRCM system was completed with PBO-MESH 105-type mortar (Ruregold, LATERLITE S.p.A., Solignano, Italy).
The second intervention concerned the connection between the arcade and the back façade with 3 m stainless steel bars injected at a low pressure with grout to provide the substance and fill any voids in the masonry.
4.1. Experimental Setup
The structure was assessed with both Acoustic Emission (AE) sensors (AE1, AE2, AE3, and AE4) and displacement transducers (D1, D2, D3, D4, and D5) in order to monitor the arch’s response under a semi-static load test. A schematic representation of the setup is reported in
Figure 4.
Unlike applications involving concrete, for which the selection of AE sensing equipment is generally regulated by ASTM E1932, no specific standards or guidelines currently exist for masonry structures. In this study, due to the lack of a clear expectation regarding the frequency range of potential AE phenomena, broadband frequency sensors were selected. The equipment used for the experimental campaign was provided by Vallen Systeme GmbH (Wolfratshausen, Germany). The sensors employed were of type VS150, with a sensitivity range between 100 and 450 kHz and a resonance peak at 150 kHz. The data acquisition system used was the AMSY-6 model.
As a preliminary step, the masonry attenuation profile was characterised using a Hsu–Nielsen pencil lead break test [
25] conducted in accordance with [
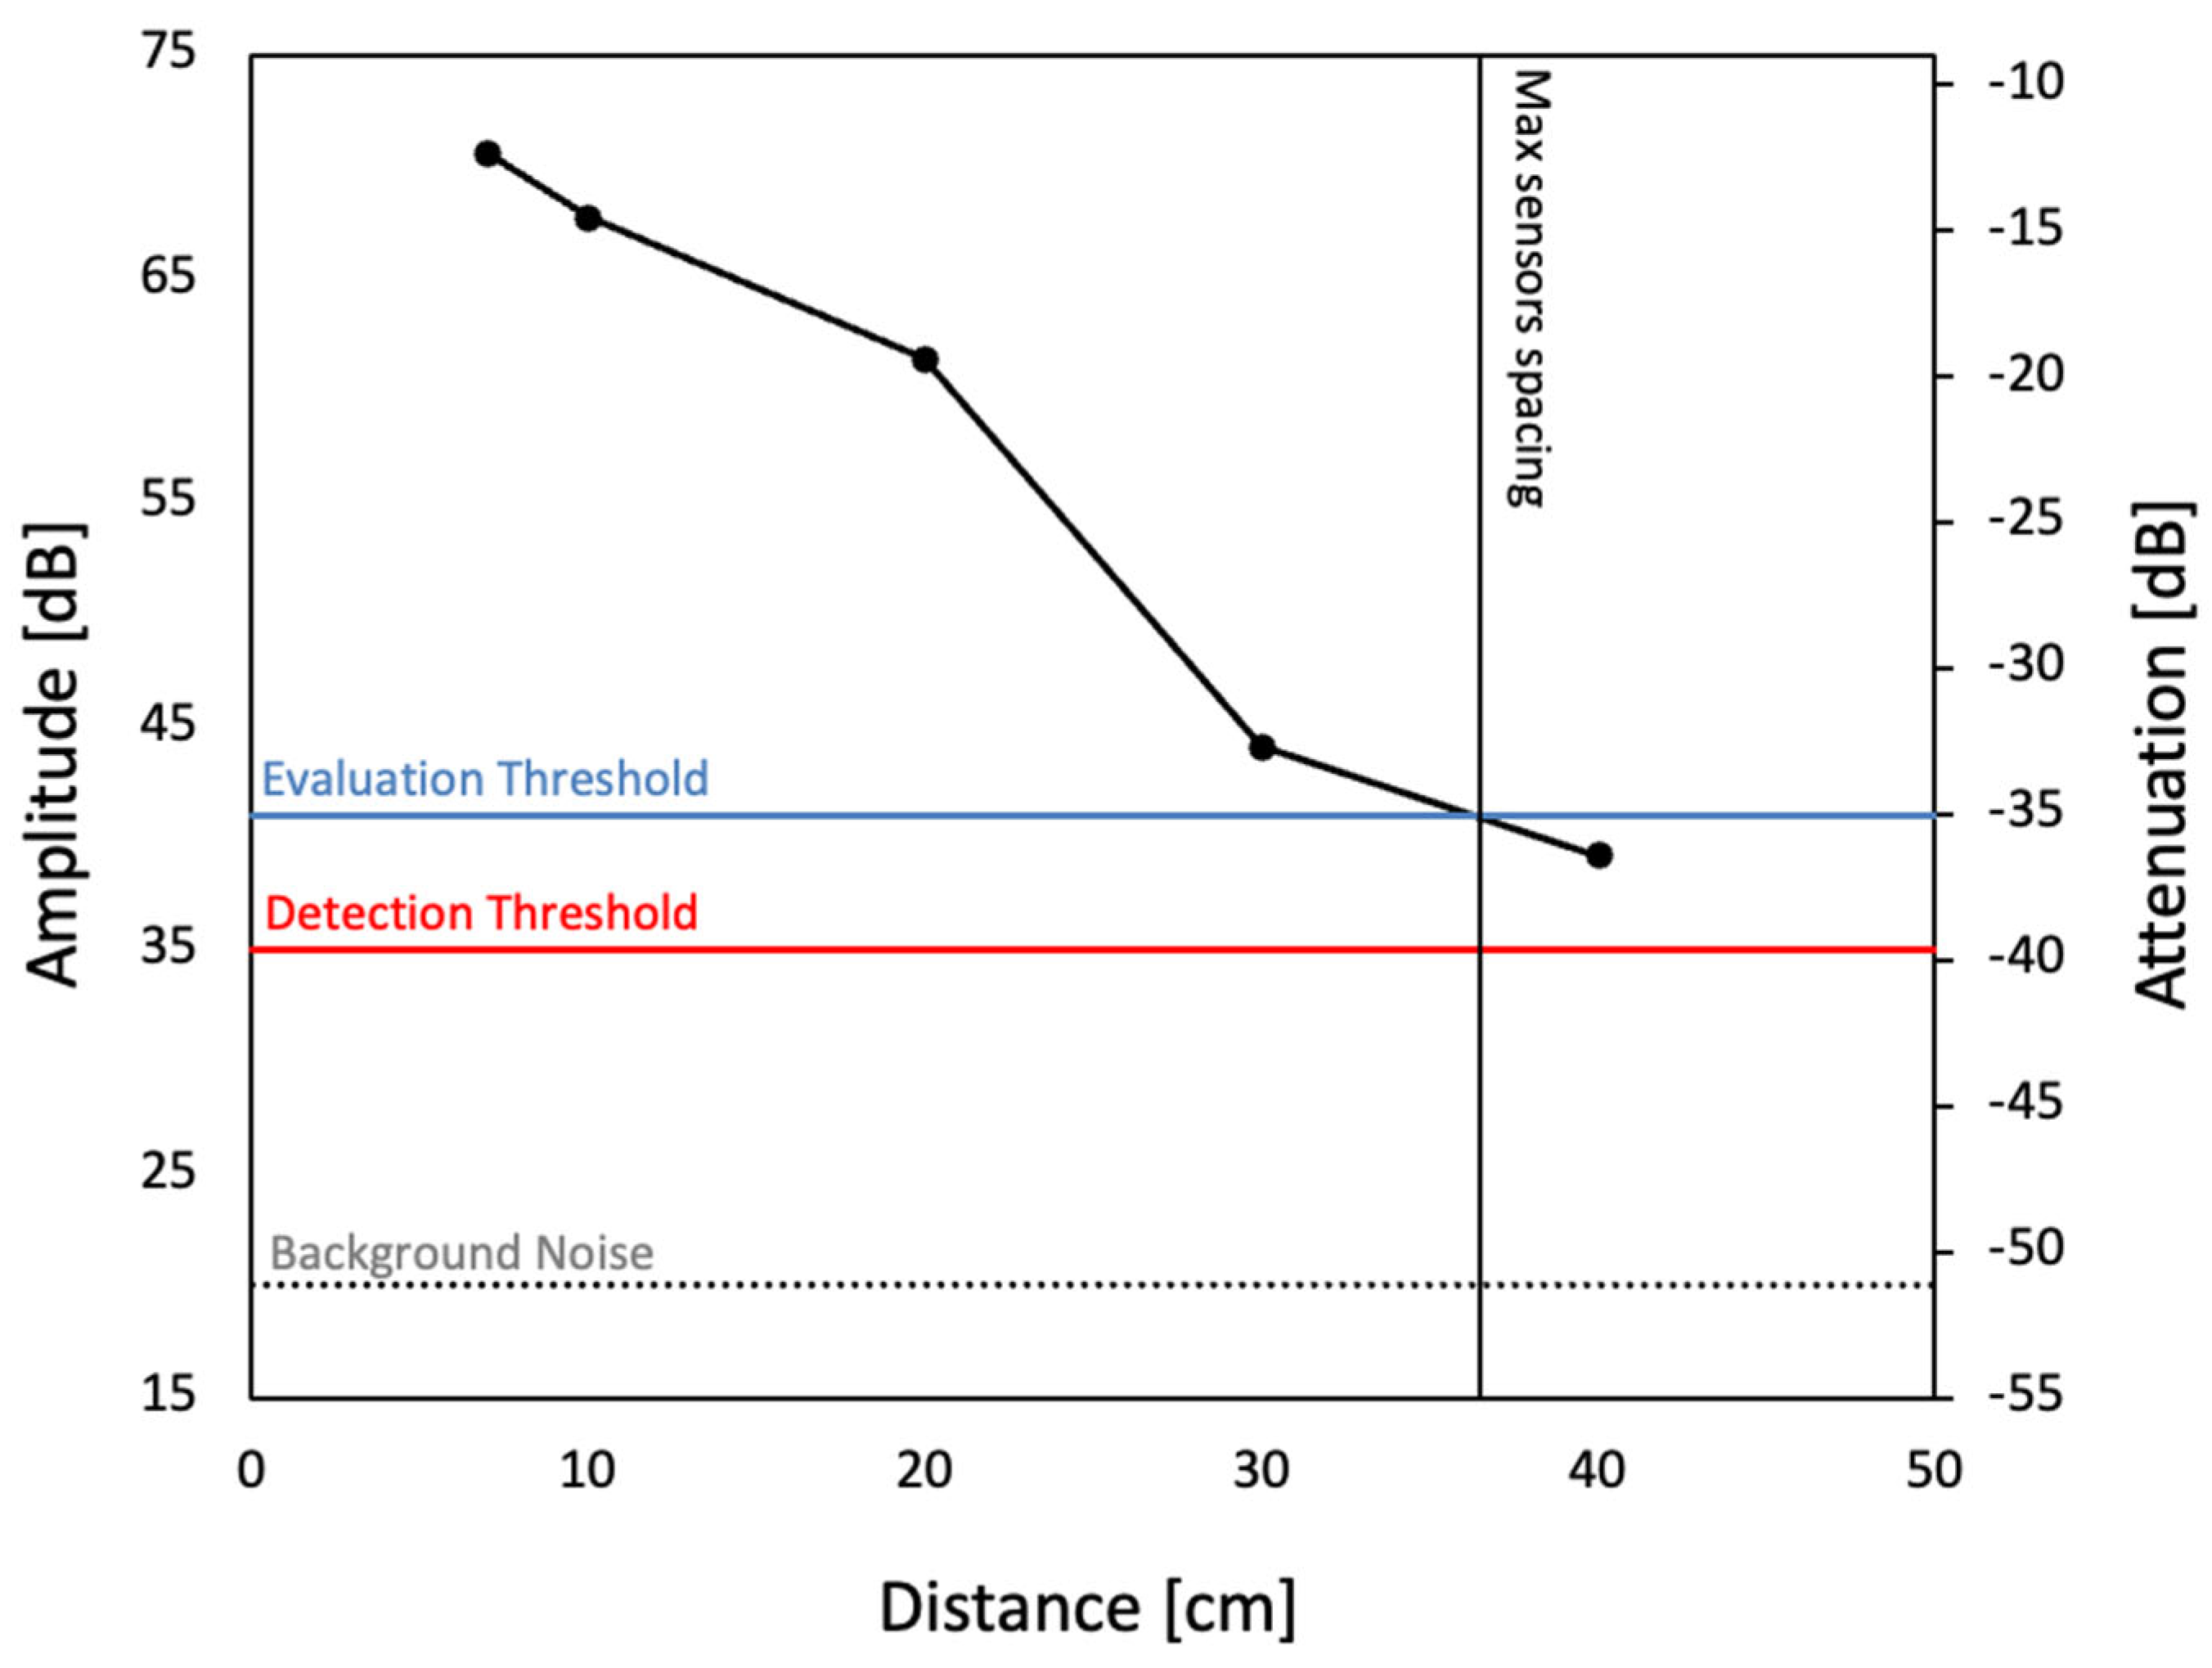
41]. The use of high-frequency sensors effectively minimised background noise, which remained consistently low (approximately 20 dB) except for sporadic transient signals caused by the passage of vehicles with significant vibrational impact. The propagation range of the sensors was studied using an attenuation analysis (
Figure 5). Based on amplitude readings recorded at increasing distances (e.g., 70.6 dB at 7 cm, 67.7 dB at 10 cm, and 39.2 dB at 40 cm), the attenuation profile demonstrated progressive signal decay with distance, crossing the evaluation threshold (41 dB) at around 36.3 cm, identified as the maximum effective sensor spacing.
The analysis further quantified the near-field attenuation at 0.967 dB/cm and the far-field attenuation at 1.014 dB/cm, with a total signal loss of approximately 29.6 dB over the tested range. To ensure reliable detection within these constraints, the AE sensors were spaced at 30 cm intervals, remaining within the maximum operational range. In order to correlate the data obtained from the different instruments, the AE sensors were arranged linearly in proximity to the FRCM strips applied at the intrados. The FRCM reinforcement, due to its composite layering, might have influenced surface wave transmission. To mitigate this, AE sensors were positioned adjacent to but not over reinforcement bands. Preliminary attenuation analysis showed consistent signal profiles across both reinforced and unreinforced paths within the effective detection range.
This calibration step was essential to optimise sensor placement and ensure effective signal acquisition. Although irregularities in masonry might affect propagation paths, sensor spacing was selected to ensure overlapping detection zones. While localised phenomena between sensors cannot be entirely ruled out, the use of the Arrival Time Method and observed redundancy in detection across multiple sensors provided confidence in signal capture adequacy.
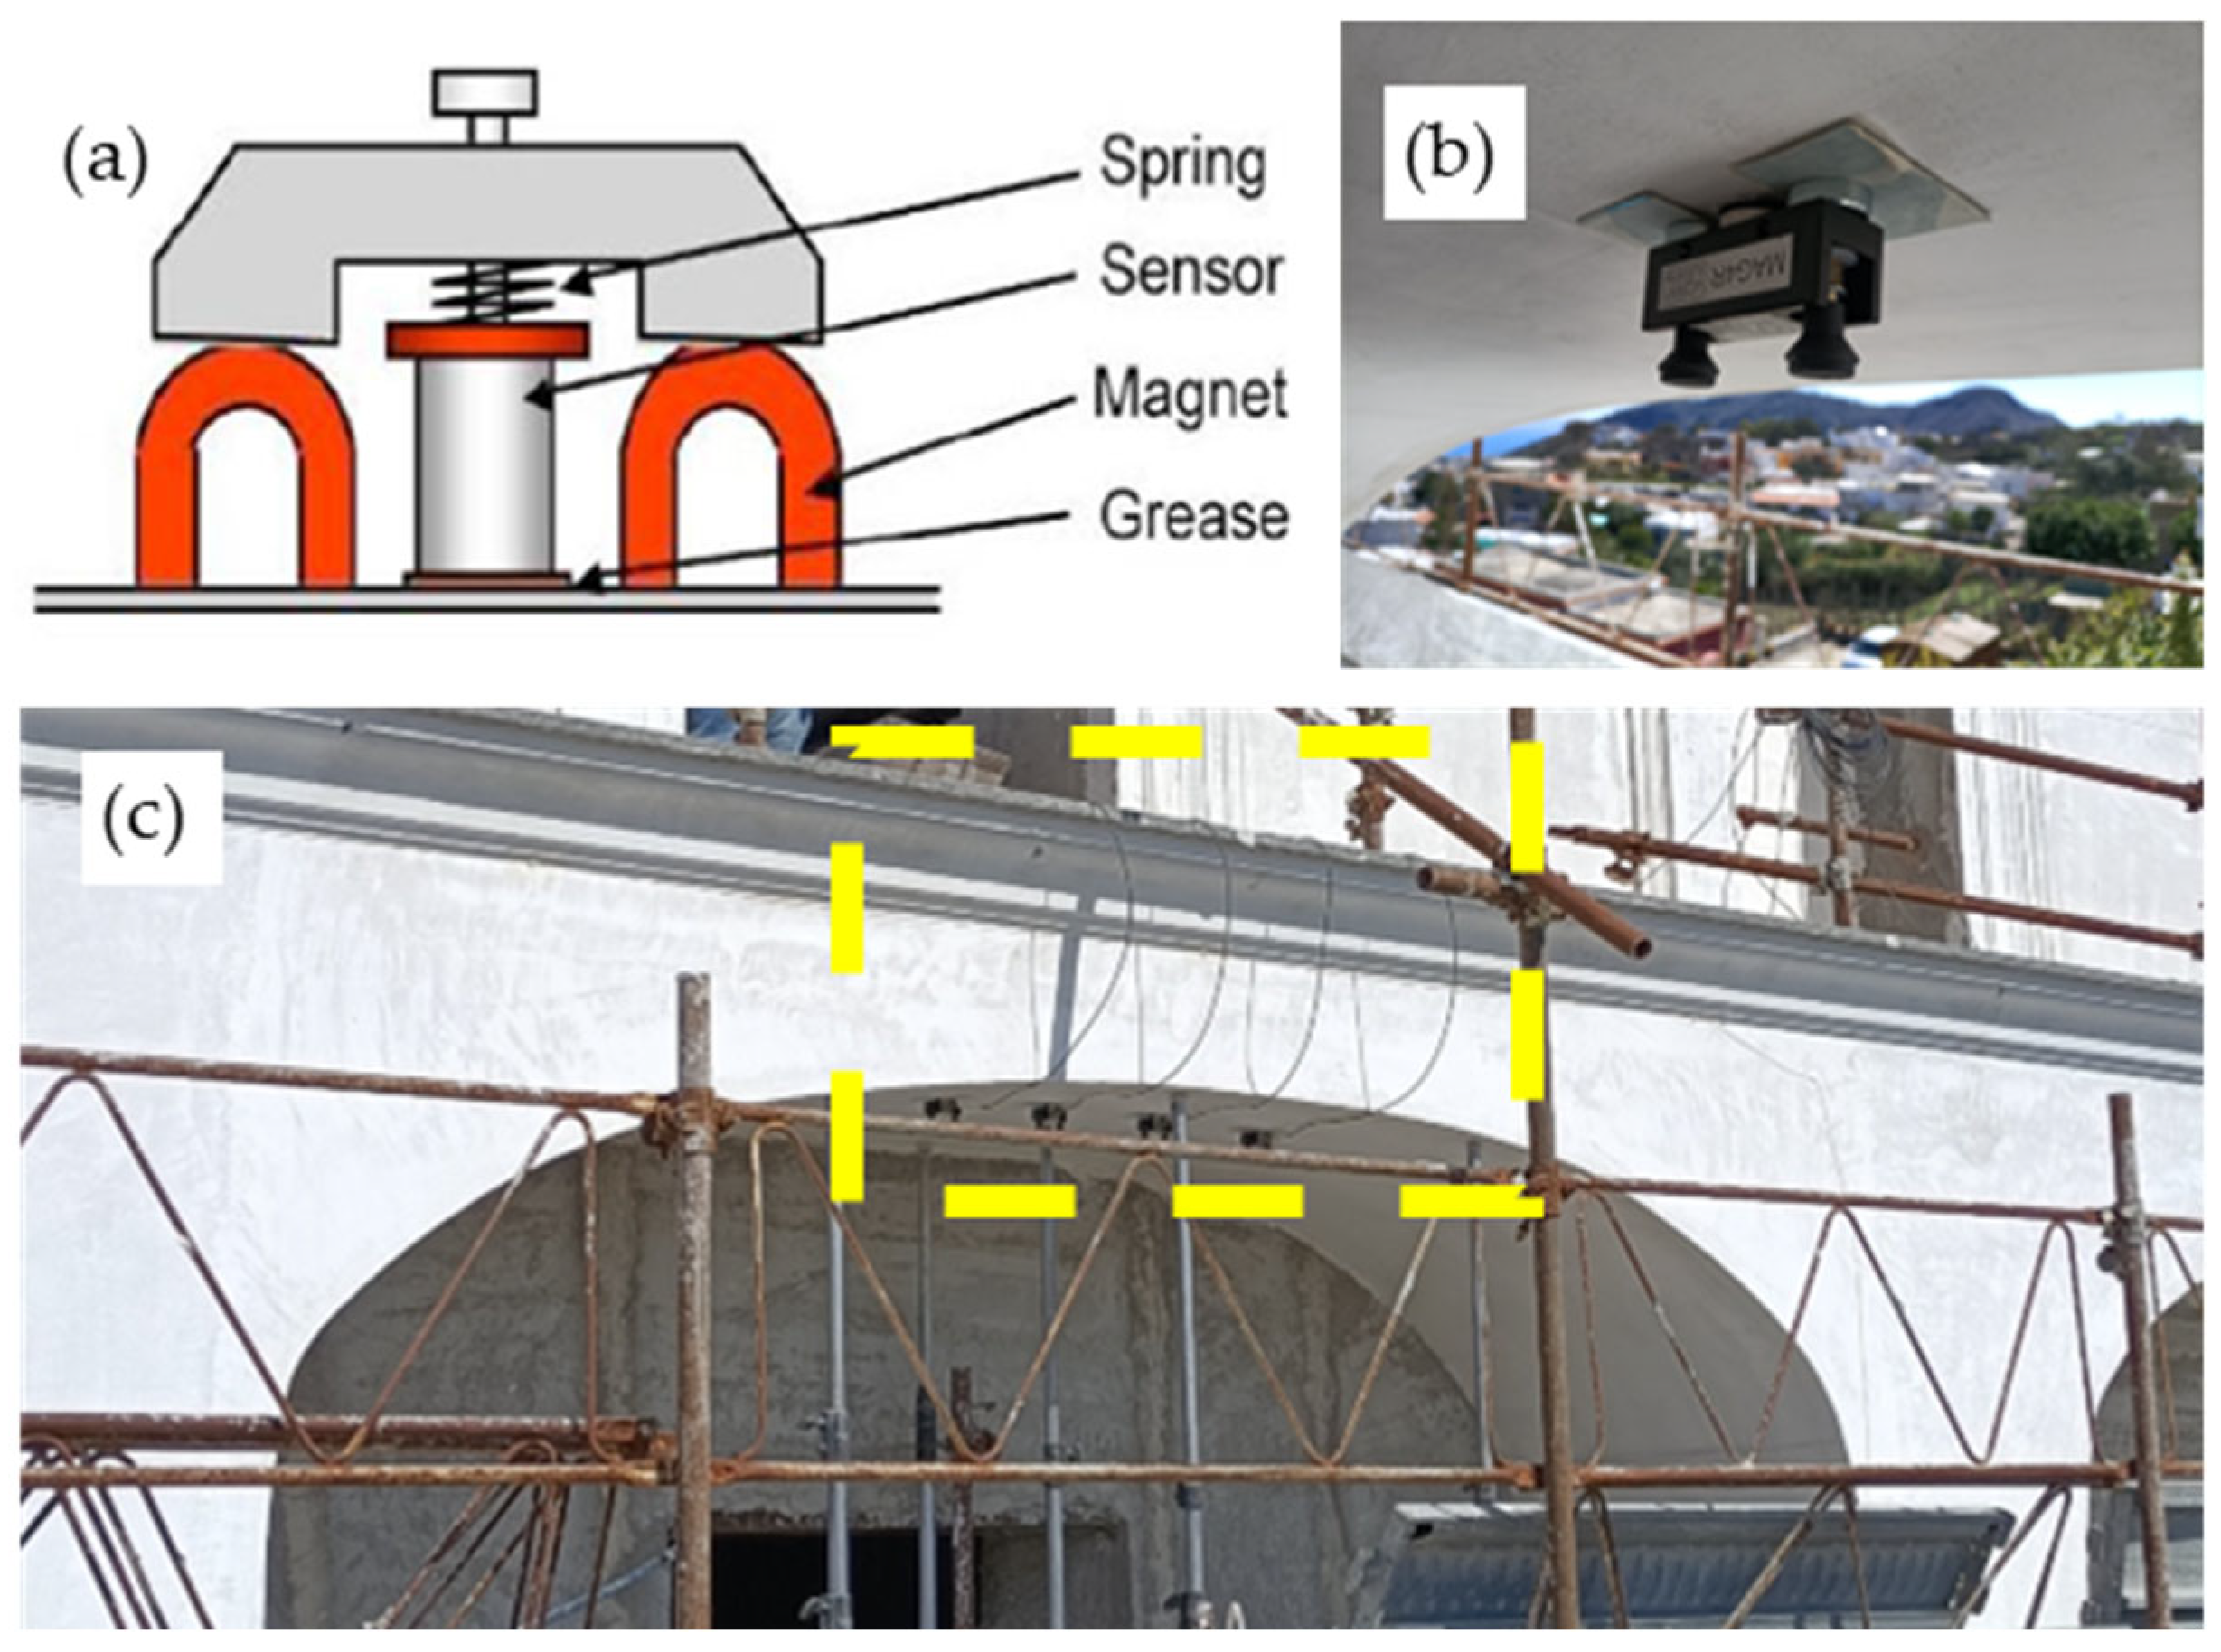
To secure the sensors, magnetic clamps were used, mounted on backing plates directly fixed to the intrados of the arch. These magnetic clamps were equipped with a spring mechanism that allowed for adjustment of the sensor’s pressure against the structure. Additionally, petroleum jelly was applied between the sensor and the surface as an acoustic couplant (
Figure 6a,b).
To prevent the sensors from being detached due to the weight of the cables, the acquisition unit was placed in the room on the ground floor directly above the tested arch. The cables were securely fastened to avoid exerting any downward force on the clamps (
Figure 6c).
In order to correlate the data obtained from the different instruments, the AE sensors were arranged linearly in proximity to the FRCM strips applied at the intrados, but not directly above them, so as to avoid interference with surface wave propagation caused by the presence of the reinforcement.
4.2. Load Test
The load test was conducted through three loading and unloading cycles under a quasi-static regime to optimally detect AE events. Loads were applied using a system of sandbags positioned vertically above the arch at points D1 to D5, each aligned with one of the arch’s voussoirs to distribute the load incrementally. Load increments were controlled manually under quasi-static conditions. Five displacement transducers were installed at the arch’s intrados along the span, corresponding to key positions near the springing points, haunches, and crown. The displacement transducers used were mechanical dial gauge comparators (accuracy: 0.01 mm), selected for their robustness and ease of use in field conditions. Each comparator was affixed using stainless steel brackets bonded to the masonry surface with reversible adhesive to avoid damage. The transducers were positioned along the intrados of the arch to record vertical displacement at representative locations. Their layout is illustrated in the updated experimental setup schematic (
Figure 4), and corresponding data are reported in
Table 2.
Considering the high degree of uncertainty regarding the potential initiation of micro- and/or macro-cracks and their associated emission frequencies, the first cycle was designed with numerous loading steps. This procedure also enabled the calibration of the system by setting the appropriate threshold value and accurately identifying background noise.
The first loading cycle was thus performed with nine loading steps and two unloading steps. The limited number of unloading steps was due to the absence of AE detection during the loading phase. In the first cycle, a maximum load of 11.25 kN was reached, and no significant responses were observed in terms of displacements and deformations.
It was therefore decided to proceed with the second cycle by reducing the number of loading steps and increasing the maximum load to 20.00 kN. The second cycle comprised five loading steps and two unloading steps. The third cycle was conducted with three loading steps of greater magnitude, each reaching a maximum load of 20.00 kN, and two unloading steps.
5. Results
5.1. Load Test Results: Displacement Analysis
Table 2 presents the results obtained in terms of displacements recorded by the comparators, excluding the values registered by rod No. 6 (“inactive”).
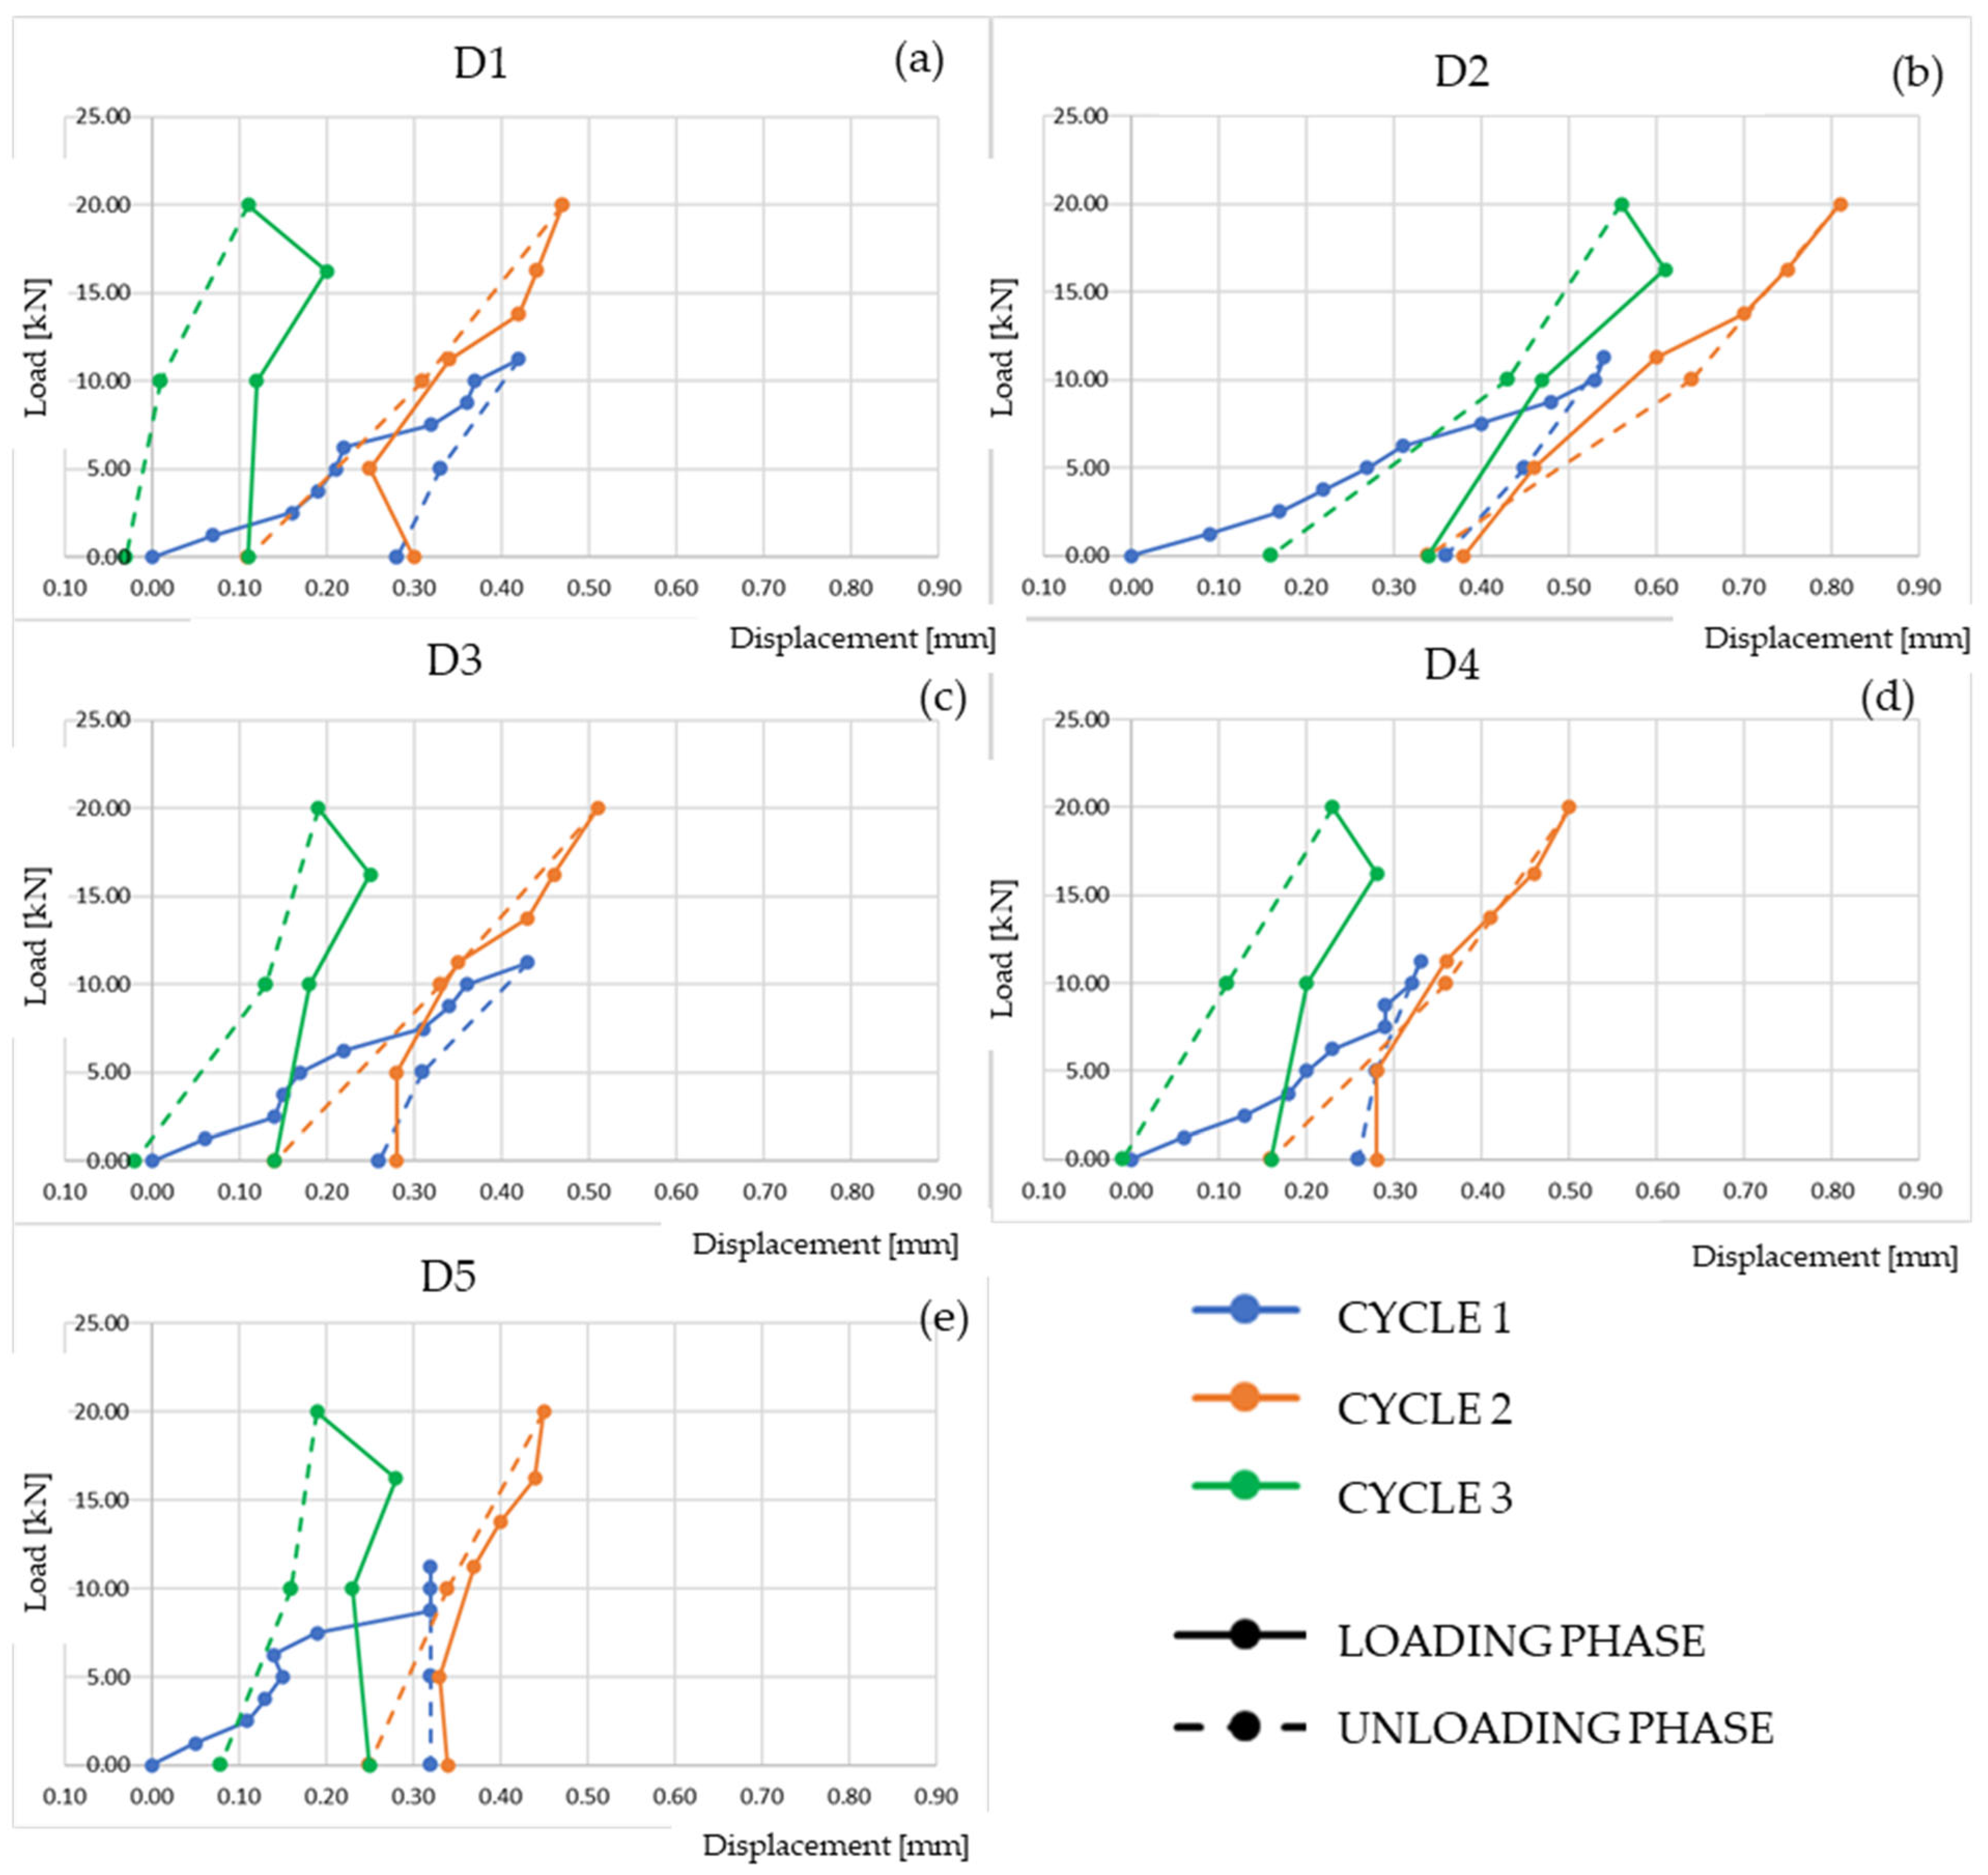
The following figure (
Figure 7) shows the load–displacement curves for each active comparator, with displacement values corrected by subtracting the readings from the inactive comparator. For clarity, the loading and unloading phases are distinguished within each graph.
The results from the first cycle show a residual displacement at the end of unloading, albeit minimal. This behaviour is likely attributable to a settling phenomenon within the structure, which had not previously been subjected to the imposed external loads. The second cycle indicates partial recovery of the residual displacement observed after the first cycle. This suggests a redistribution of internal stresses and further accommodation of the masonry under load.
In contrast, the third loading cycle reveals a more pronounced recovery of the residual displacements accumulated during the previous cycles. This behaviour was consistently recorded by all comparators and may be interpreted as the result of internal reorganisation within the arch, potentially indicating a stabilisation of the structural system.
Overall, the displacement results confirm that, despite the inherent irregularities of the masonry and the presence of reinforcement, the arch demonstrated a predominantly elastic response up to the maximum applied load of 19.62 kN. These findings are in agreement with those obtained from the numerical model and the Acoustic Emission (AE) analysis, which will be discussed in the following sections.
5.2. AE Results
The load test had an overall duration of approximately 2 h and 20 min.
Each loading/unloading step lasted sufficiently long to allow the signals to stabilise, with particular attention to AE.
The following figure (
Figure 8) presents the cumulative number of AE hits recorded by each sensor over time, in correlation with the applied load curve.
The graph clearly illustrates the brief duration of the first cycle and the near-complete absence of AE activity during this phase. This outcome is primarily attributed to an overly high initial threshold setting, which hindered the detection of AE events with amplitudes below the threshold level.
It is important to note that the test was inherently unrepeatable due to the progressive and irreversible nature of the damage mechanisms—such as micro- and macro-cracking—being investigated. Consequently, it was necessary to dynamically adapt the acquisition parameters in real time, particularly in response to fluctuations in background noise during the experiment. The revised threshold was validated using repeat Hsu–Nielsen pencil lead break tests, which confirmed the system’s ability to detect real AE events within the site-specific noise environment. Signal validation was further supported by temporal and spatial correlation with mechanical loading steps and source localization patterns consistent with expected stress concentrations.
During the second loading cycle, after adjusting the threshold value, moderate AE activity was observed. Notably, an event was detected by sensors 3 and 4 during the loading phase between 5.00 and 11.25 kN, followed by a subsequent event recorded by sensors 2 and 3 at the maximum load of 20.00 kN. AE activity of moderate intensity was also observed during the unloading phases.
In the third cycle, between 0 and 10.00 kN of applied load, a significant AE event was detected by all sensors, with sensors 3 and 4 registering the highest intensity. Upon reaching the peak load of 20.00 kN and during a substantial portion of the unloading phase, multiple high-intensity events were recorded across all sensors, with a concentration of hits again noted in sensors 3 and 4. The AE activity gradually stabilised during the final unloading stage from 10.00 to 0 kN.
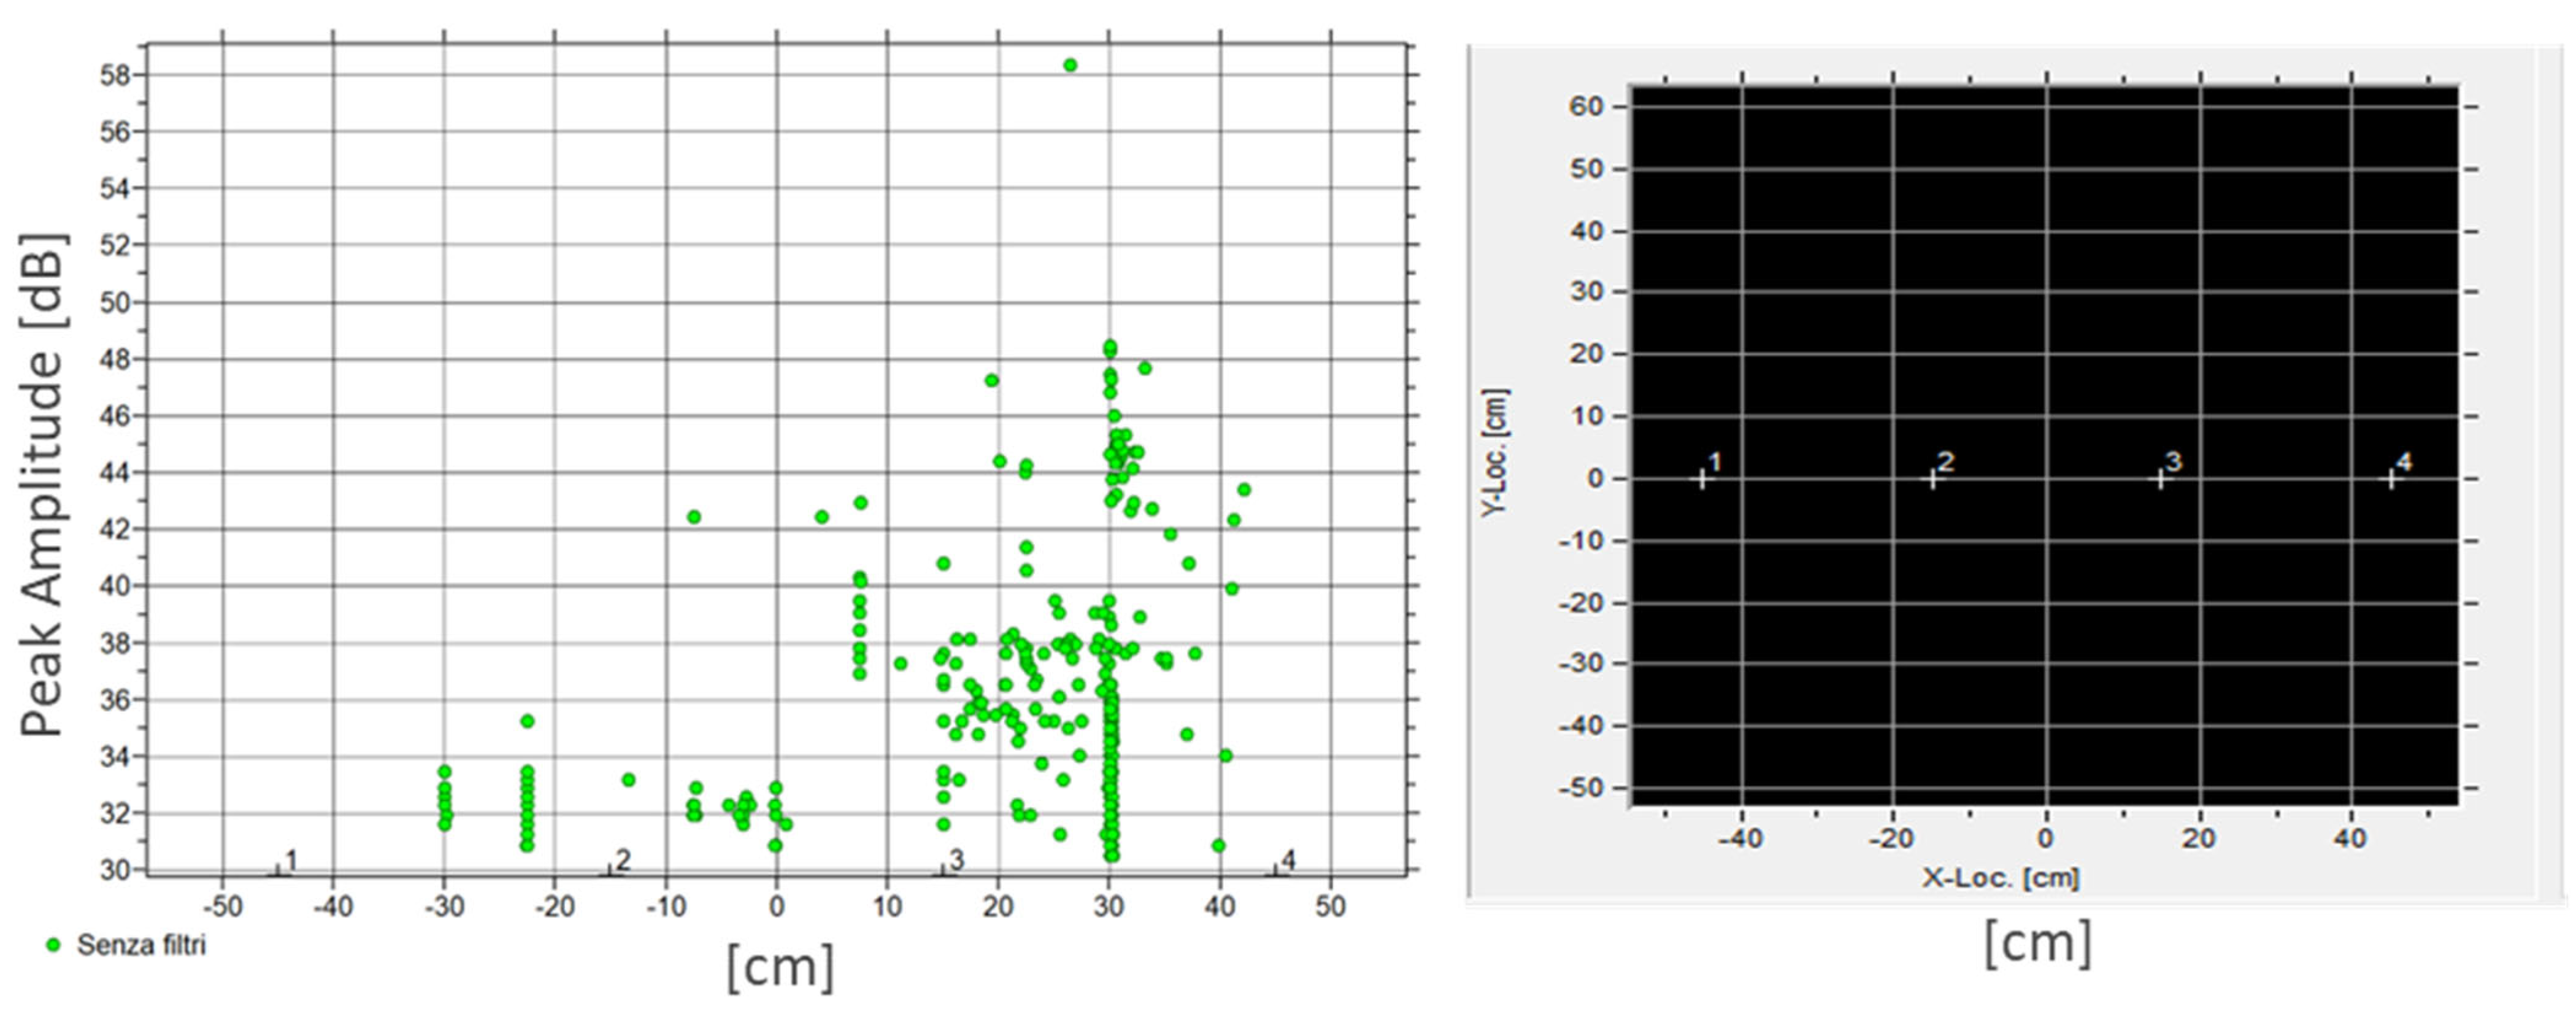
To gain further insight into the origin of the AE signals, a linear source localisation analysis was conducted using the Arrival Time Method. This approach compares the first-hit times across the sensor network, whereby the Arrival Time is defined as the moment the signal exceeds the detection threshold.
Figure 9 presents the results of the source localisation procedure.
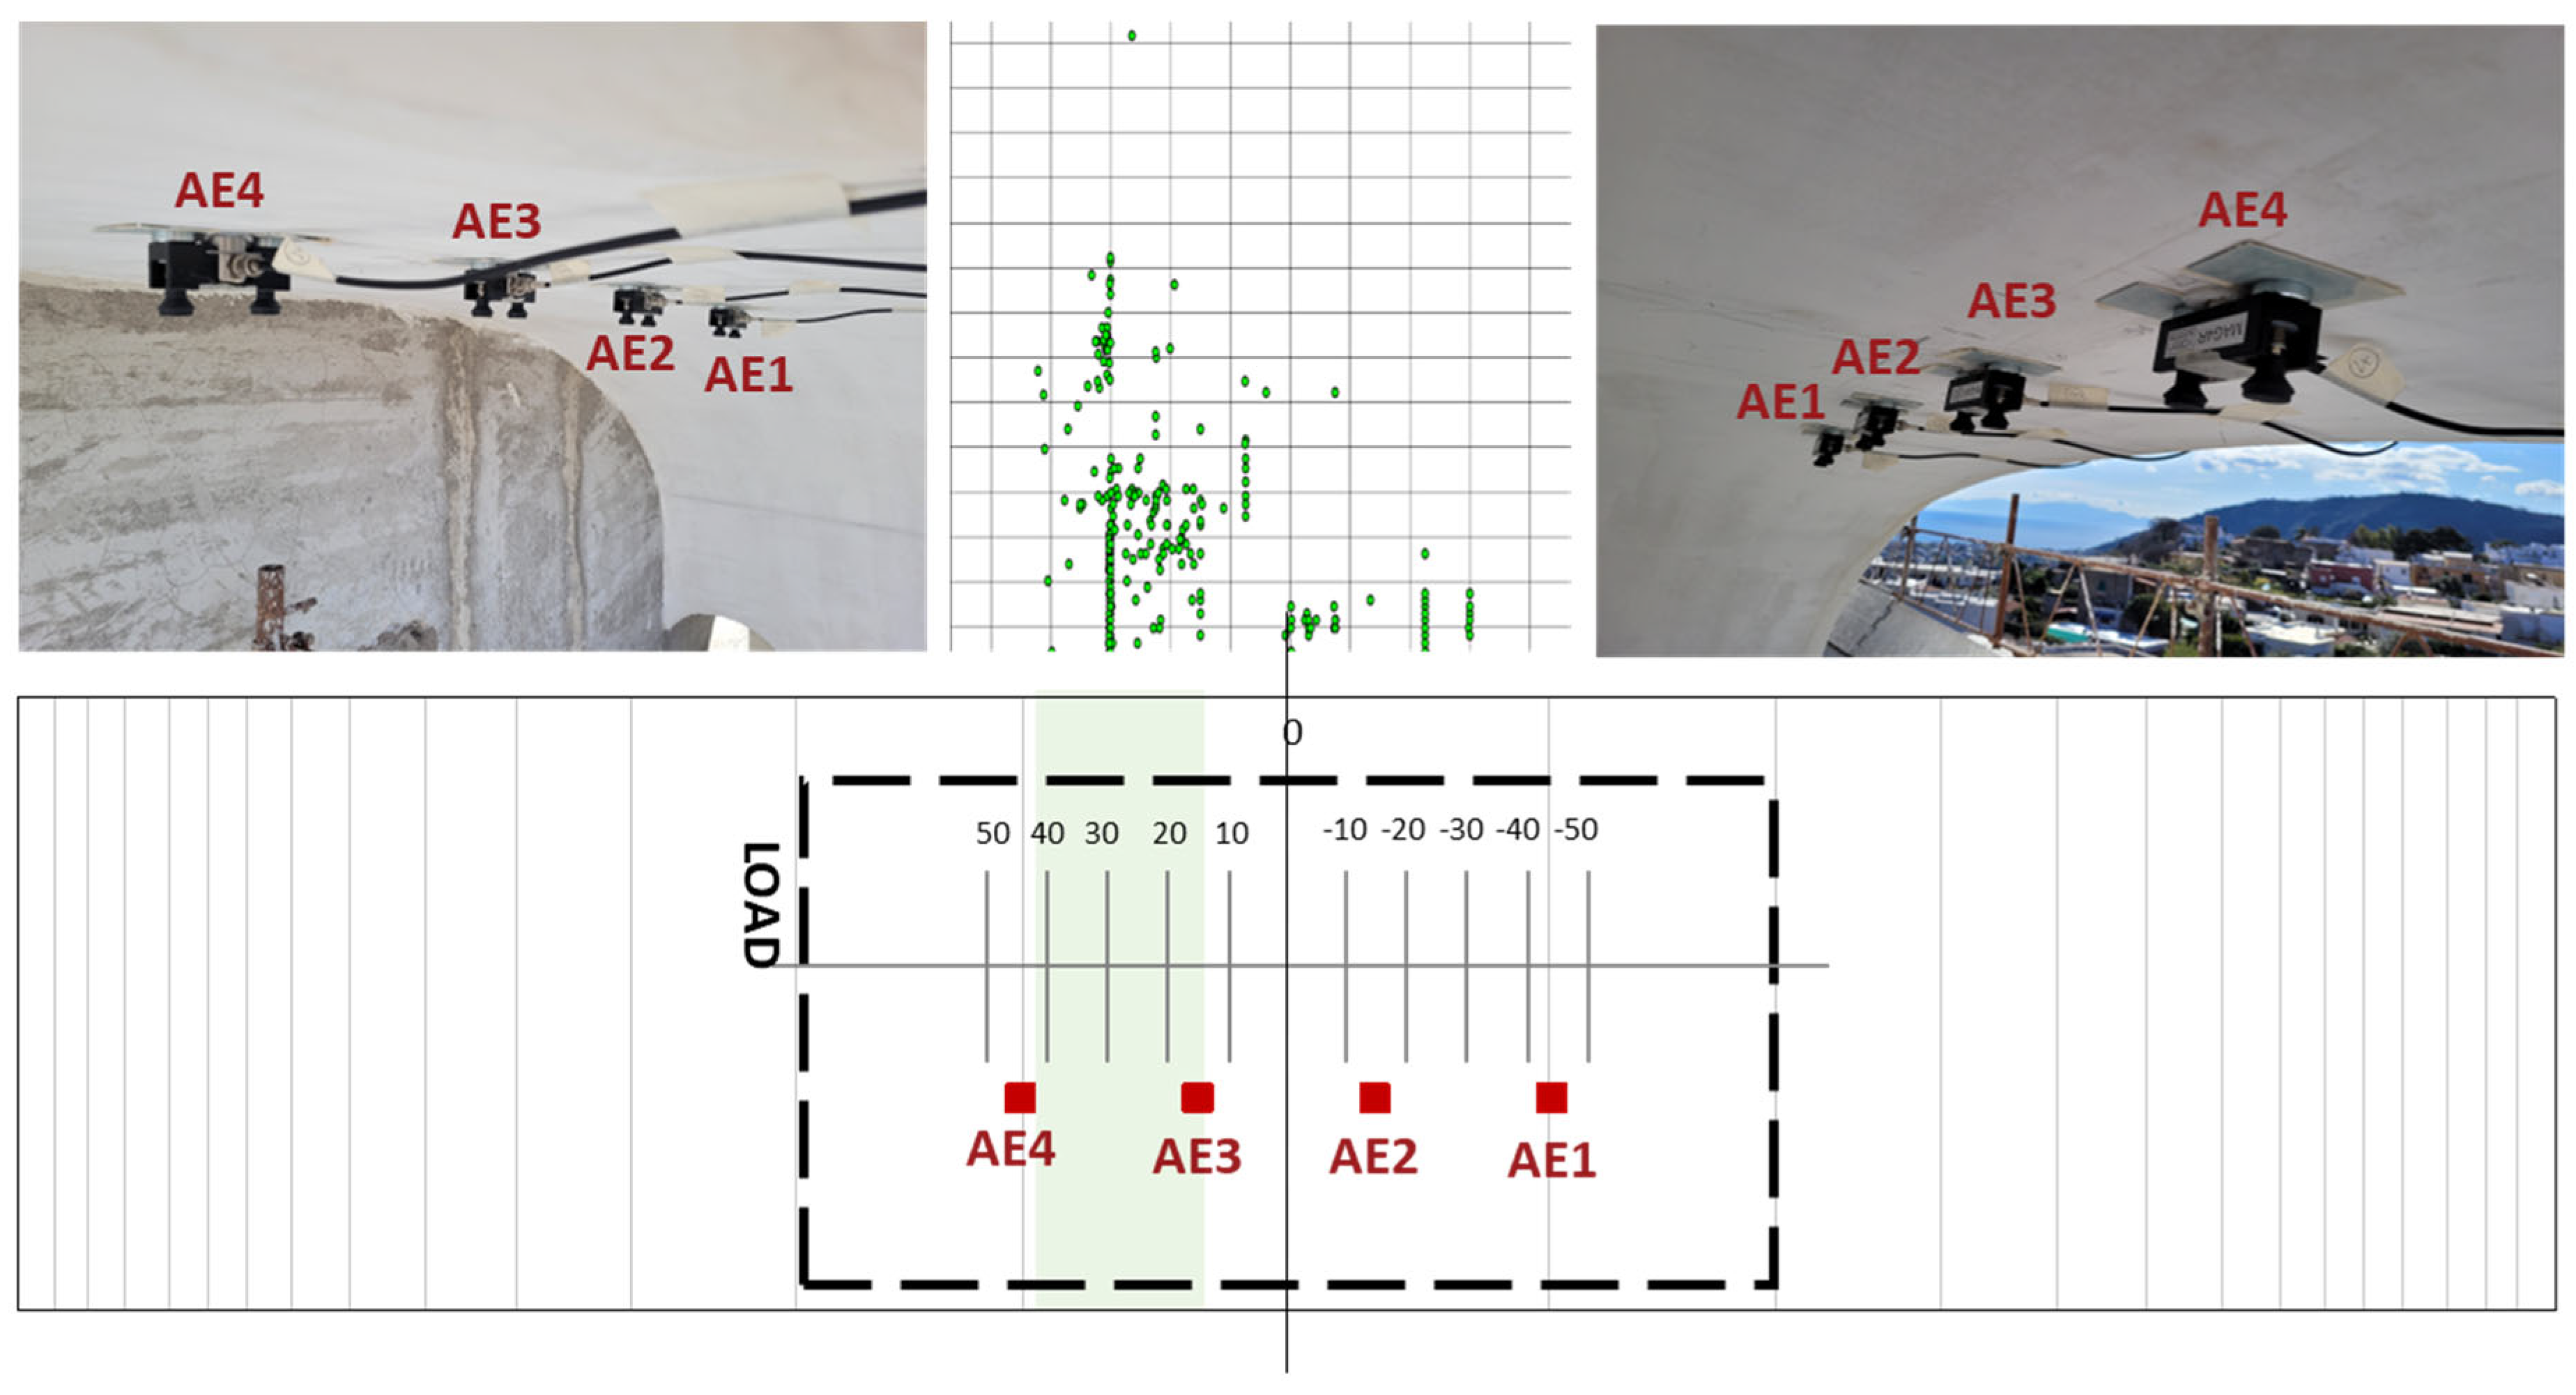
The graph highlights a concentration of phenomena between sensors 3 and 4, accompanied by the presence of lower-intensity sources near the keystone and in proximity to sensor 2. The subsequent image illustrates the area of the arch affected by the most intense sources, highlighted in green (
Figure 10). In other words, while
Figure 9 illustrates the localised AE sources using the Arrival Time Method, mapping each event along the sensor axis based on relative time differentials,
Figure 10 adds to this representation with a simplified plan view of the arch, projecting the most intense AE activity zones onto the architectural layout. This view offers a clearer visual correlation between the identified AE sources and the physical structure, supporting the spatial interpretation of stress concentration areas within the arch.
6. Discussion and Conclusions
The results of the experimental campaign confirm the applicability of Acoustic Emission (AE) monitoring for detecting and interpreting damage mechanisms in historic masonry structures, even under the constraints posed by conservation requirements and complex material heterogeneity. The integration of AE analysis with traditional displacement measurements enabled a comparative analysis of the structural response during three loading cycles performed under semi-static conditions.
Displacement data revealed a predominantly elastic behaviour up to the peak load of 20.00 kN, with minor residual deformations and a tendency toward displacement recovery in the later stages of the test. These trends may be attributed to internal stress redistribution and micro-settling phenomena rather than significant structural degradation.
From the AE perspective, activity was mostly concentrated in the second and third loading cycles. The absence of hits during the first cycle was attributed to an initially overestimated threshold value, later corrected to enable the detection of lower-intensity signals. Once adjusted, the AE system proved effective in capturing signals related to the mechanical response of the arch, including those associated with minor damage progression during loading and unloading phases.
Source localisation via the Arrival Time Method revealed a concentration of events in the area between sensors AE3 and AE4, indicating a zone of relatively greater mechanical stress, in line with expectations based on the geometry and loading configuration of the arch. Isolated low-intensity sources were also recorded near the keystone and around sensor 2. These localisations, though simplified by the adoption of a linear model, offer a useful approximation for evaluating the spatial distribution of AE activity in structures where full three-dimensional sensor networks are unfeasible.
The load test was carried out on a restored historical arch that had not previously experienced significant structural loading. The adopted loading protocol involved the gradual application of weights in increments of 0.5 kN, with the explicit aim of safeguarding the structure’s integrity, given its cultural value and recent rehabilitation. The maximum applied load of 20 kN was deliberately selected to exceed typical service loads, allowing for the observation of structural behaviour under relatively high stress while still remaining within a conservative safety range.
In this context, Acoustic Emission signals recorded during the test were mainly related to first-time loading effects rather than the reactivation of pre-existing damage. Due to the absence of a previous loading history and the irregular nature of the observed AE activity, it was not possible to carry out a meaningful quantitative evaluation of the Kaiser effect or to derive reliable Felicity ratios. The test was also interrupted at the end of the third cycle, as the increasing AE activity suggested that continuing the loading process might have compromised the condition of the structure. While some signals occurred at low load levels or during unloading in the later cycles, these can be reasonably attributed to stress redistributions within the masonry rather than to clear reopening of previously activated sources.
Several limitations must be acknowledged. The heterogeneity of the masonry, the presence of a reinforcement system (FRCM), and the use of linear localisation in place of a 3D array all impose constraints on the precision and interpretability of the AE data. Additionally, the lack of established attenuation models specific to this type of historic material limits the possibility of fully quantitative assessments.
Despite the methodological limitations discussed above, the integration of AE data with displacement measurements offered a more nuanced understanding of the structural behaviour during the load test. While the AE signals alone could not conclusively quantify damage or identify failure mechanisms, their temporal distribution and intensity offered valuable complementary insights, helping to contextualise the observed displacement trends. AE activity recorded in specific load step phases suggested the possible onset of internal stress redistributions or local micro-cracking phenomena not identifiable with displacement data alone. This is particularly relevant for masonry, a stiff and heterogeneous material, for which displacement analysis alone may not capture the full extent of structural behaviour.
Although the test conditions did not allow for a full quantitative evaluation of the Kaiser effect or Felicity ratio, the observed AE patterns nonetheless contributed to a more comprehensive diagnostic framework. In this sense, the results may inform future monitoring strategies, guiding both the placement of sensors and the interpretation of acoustic data in similar historic masonry systems. The integrated approach adopted in this study, combining AE and displacement monitoring, demonstrates the potential of multiparametric diagnostic tools to assist engineers and conservators in assessing the current state of preservation and making informed decisions regarding further interventions or long-term surveillance efforts.
Future developments should focus on expanding the monitoring network, refining attenuation laws for irregular masonry, and integrating AE results more tightly with modelling frameworks. In parallel, efforts to standardise methodologies and instrumentation for heritage structures would enhance reproducibility and foster broader adoption of AE in conservation engineering practice.

 ,
, 


