Article

Study on the Support Pressure of Tunnel Face for the Construction of Pipe-Jacking Across Thin Overburden River Channel Based on Mud-Water Balance

1
Anhui Province Key Laboratory of Building Structure and Underground Engineering, Anhui Jianzhu University, Hefei 230601, China
2
School of Civil Engineering, Southwest Jiaotong University, Chengdu 611756, China
*
Author to whom correspondence should be addressed.
Appl. Sci. 2025, 15(13), 7060; https://doi.org/10.3390/app15137060
Submission received: 1 April 2025 / Revised: 30 May 2025 / Accepted: 18 June 2025 / Published: 23 June 2025

Abstract

Pipe-jacking construction technology is favored in urban construction due to its advantages of high safety and being a non-excavation technique. However, instability of the tunnel face often occurs due to unfavorable conditions, such as pipe jacking across the river channel, shallow soil cover, and improper control of the support pressure. In this study, we made a use of the limit balance method and mud–water balance theory. At this moment of passive damage and active destruction occurring at the pipe-jacking tunnel face, the general mathematical expressions of the tunnel-face support pressure (with lower limit value Pmin and upper limit value Pmax) are derived. In the non-river impact area and river impact area, the optimal value Po of support pressure at the tunnel face is thus derived. Then, based on the Y25-Y26 pipe-jacking project across the Chu River channel in Hefei North District, a numerical simulation method is used to support further discussion. The results indicate that, when the river overburden is 3 m, the ultimate support pressure calculated by means of numerical simulation is 881.786 kN, and the optimal support ratio λ is taken in the interval of 1.0~1.5. Secondly, the upper limit value Pmax, lower limit value Pmin, and optimum value Po calculated using the theoretical equations are 2669.977 kN, 309.910 kN, and 1044.870 kN, respectively. These results leads us to recommend setting the support pressure of the tunnel face in a reasonable range between the upper limit value Pmax and the lower limit value Pmin, to ensure that the tunnel-face support pressure and resistance during pipe jacking always remain in a balanced state. The relevant research results from this study provide an important technical guarantee for the successful implementation of the examined project and, at the same time, can serve as a reference example for similar projects.

1. Introduction

Keeping the tunnel-face support pressure, soil-layer groundwater pressure, and soil pressure in a balanced state is the key to ensuring the smooth construction of mud–water-balanced pipe jacking and reducing the impact of disturbance on the surrounding soil. In a pipe-jacking project, if the tunnel-face support pressure is not properly controlled, tunnel-face instability problems will be caused. When the tunnel-face support pressure is too low, the front soil is unloaded. And there is a large influx of soil into the mud and water silo, causing over-excavation, surface subsidence, and pipe-jacking obstruction. When the support pressure on the tunnel face is too high, the soil in front is compressed due to loading, causing uplift and damage in a certain area on the surface [1]. Therefore, in order to avoid problems such as surface subsidence with too much support pressure or uplift damage with too little support pressure, reasonable and accurate control of the support pressure on the tunnel face is key in mud–water-balanced pipe-jacking construction [2].
Research on the ultimate support pressure currently uses indoor physical model tests, the stability coefficient method, the limit analysis method, the limit equilibrium method, and numerical calculations [3,4]. However, physical model tests are costly and difficult to generalize to complex real-world projects [5,6,7]. The stability coefficient method was first proposed by Broms [8], who, in 1967, established a mathematical relationship between the support force and the surface load, soil gravity, overburden burial depth, and clay undrained strength and defined the ratio of each parameter as the stability coefficient N. Based on a large amount of surface settlement data, Peck [9] proposed that N values of 5 to 7 lead to destabilization of the excavation surface and induce surface collapse, and they explored the relationship between the stability coefficients and the overburden burial depth, the unsupported length, and variations in settlement. However, it was found in practice that the prediction error of the stability coefficient method was large, and it was very easy to misjudge an unstable condition as a stable condition. At the same time, the stabilization coefficient method can only be applied to clay formations (i.e., with cohesion ≠ 0) and cannot be applied to sandy soil formations. Although the stabilization factor method has received a series of improvements to diversify the form of expression, one point that has never been taken into account is that the effect of permeability on the excavated surface is suitable for calculations in groundwater-free construction conditions. In addition, the arc effect overestimates the destructive power. In contrast, the limit analysis [10,11,12,13] method is based on the kinematic permissive velocity field and the static permissive stress field. It establishes the equilibrium conditions and damage conditions in the critical state of the soil body and deduces the excavation surface support force based on the principle of virtual work [14,15].
The limit equilibrium method [16,17] assumes that damage to the soil body in front of the excavation produces a sliding body, and it analyzes the equilibrium of forces in the soil body at the moment of damage to find the solution to the problem. Then, the complex static indeterminate problem of soil damage is transformed into a simpler static deterministic solvable problem. The theory of the limit equilibrium method [18,19,20,21] is rigorous, the mechanical mechanism is clear, and the calculation formula is concise and refined. After decades of improvement and enhancement, it has been developed to a fairly perfect degree and is widely used in practical engineering [22,23]. Based on the two-dimensional limit equilibrium model and silo theory [24], Horn et al. [25] established a three-dimensional wedge-shaped model for the stability of a tunnel face; the model can determine the magnitude of the ultimate support pressure. R. P. Chen [26] considered the effects of the prism height and soil arching. Then, he proposed an improved three-dimensional wedge-shaped prism model and an analytical formula for the lateral stress ratio between the prism and adjacent soil, which reflects the arching effect of the soil. In a comparison of normalized support pressures Slim by Vermeer [27], its tolerance was within ±0.3γD. P. Perazzell [28] introduced the supporting force of a single anchor in a wedge limit equilibrium model and proposed a limit equilibrium method for analyzing the stability of the tunnel faces of reinforced tunnels in purely cohesive soils without draining shear strength. Based on four typical pipe–slurry–soil contact modes, Weizheng Liu [29] proposed a calculation method for the jacking force of each pipe section, considering the jacking resistance at the excavation surface and the lateral friction resistance around the pipe. The reliability of the calculation method was verified by comparing the model test results with engineering example data.
Numerous scholars have carried out research on the stability of the pipe-jacking tunnel face. The results have been fruitful. However, some aspects are yet to be further deepened. Existing tunnel-face support pressure calculations are analyzed based on the plane strain [30], and the front earth pressure is simplified into a rectangular distribution calculation. This differs from the trapezoidal distribution of soil pressure in front of an actual tunnel face [31]. Moreover, the study above only focused on single pipe jacking, but double-row or even triple-row pipe jacking is widely used in engineering practice [32]. In addition, passive damage to the soil in front of the pipe jacking is more common in actual pipe-jacking projects. If the thickness of the overlying soil layer is not large and the construction involves pipe jacking crossing a river channel, active damage to the soil in front of the pipe jacking must be considered. Therefore, in this study, based on the mud–water balance and considering the conditions of pipe jacking through a river channel, the thin overburden of the river, and multi-line construction with small clearances, the support pressures of the tunnel face have been established. This research can provide a theoretical basis and practical guidance for the construction of pipe jacking under similar engineering conditions, which is of great practical significance. The organization of this paper is as follows: this study firstly investigates the mechanisms of different forms of damage occurring at the tunnel face of a pipe-jacking tunnel. And accordingly, the calculation and analysis model of the tunnel-face support pressure are constructed, respectively. Secondly, based on the principle of mud–water balance and combined with the limit equilibrium method, the upper limit (Pmax), lower limit (Pmin), and optimum values (Po) of the support pressure are derived, respectively. Then, the mud–water-balanced pipe-jacking construction is numerically simulated by taking the dependent project as a prototype. Finally, the results of theoretical calculations and engineering measurements are discussed and the main conclusions of this paper are outlined.

2. Theoretical Analysis of Tunnel-Face Support Pressure

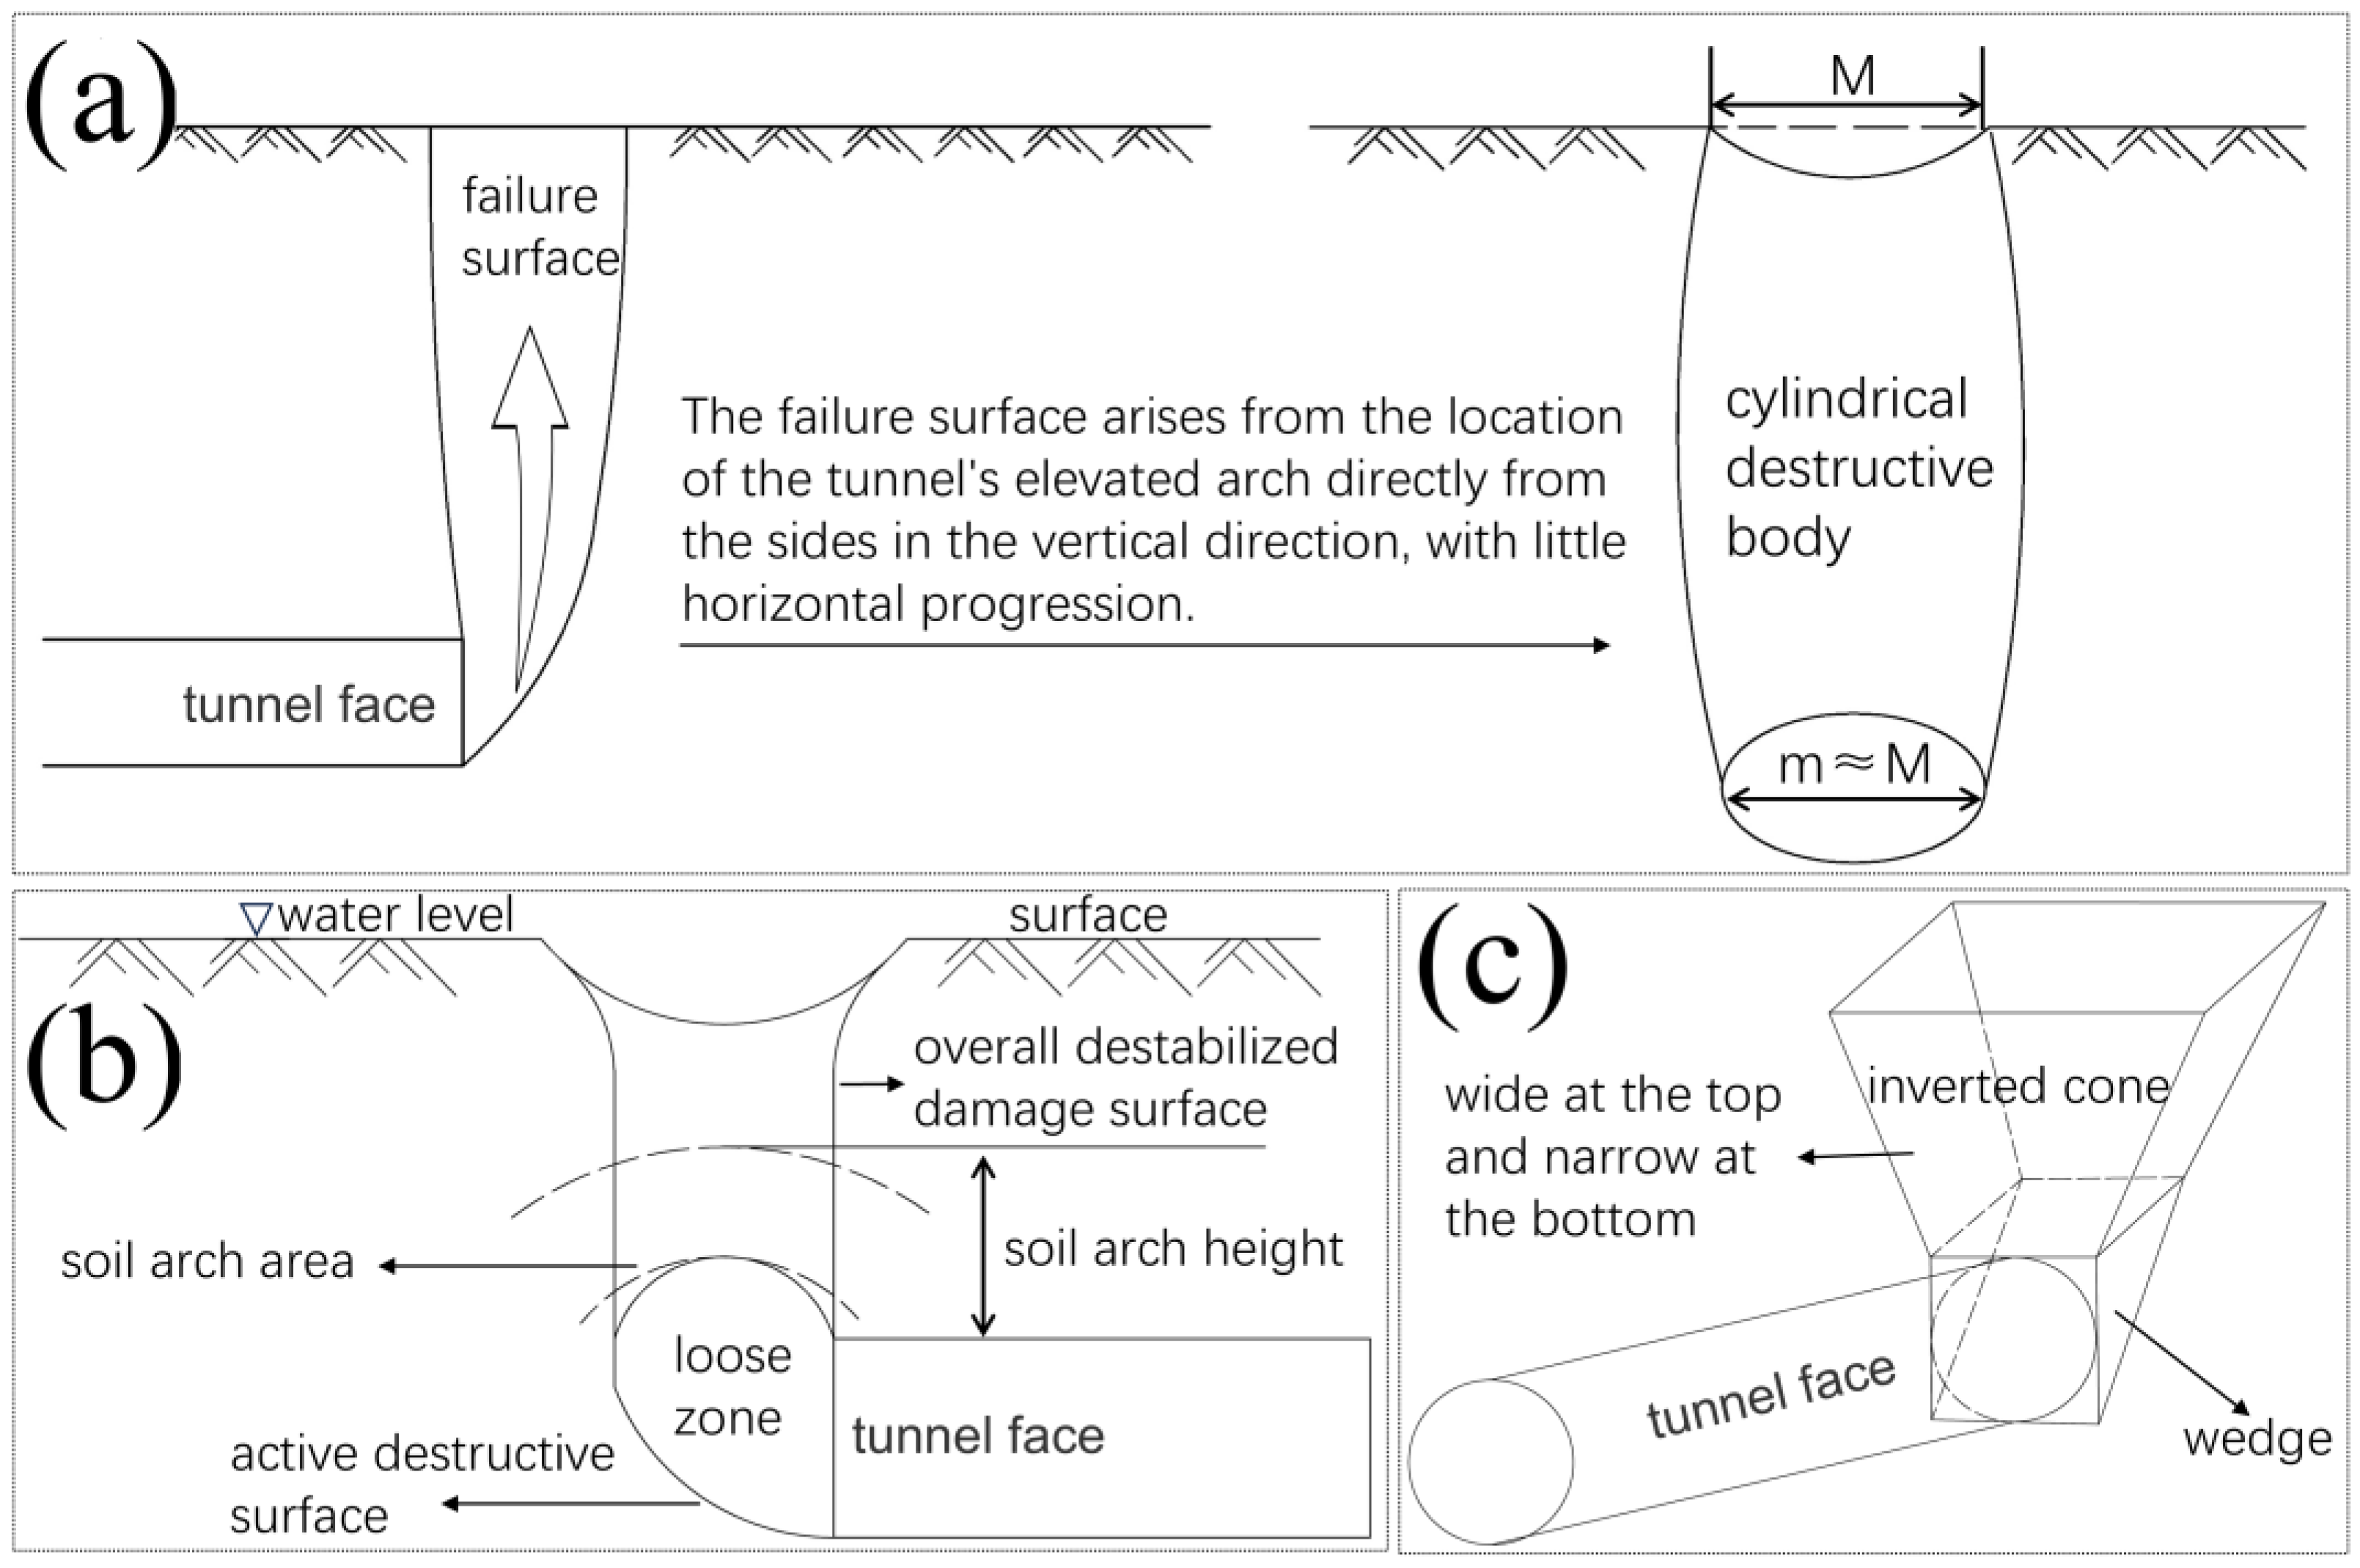
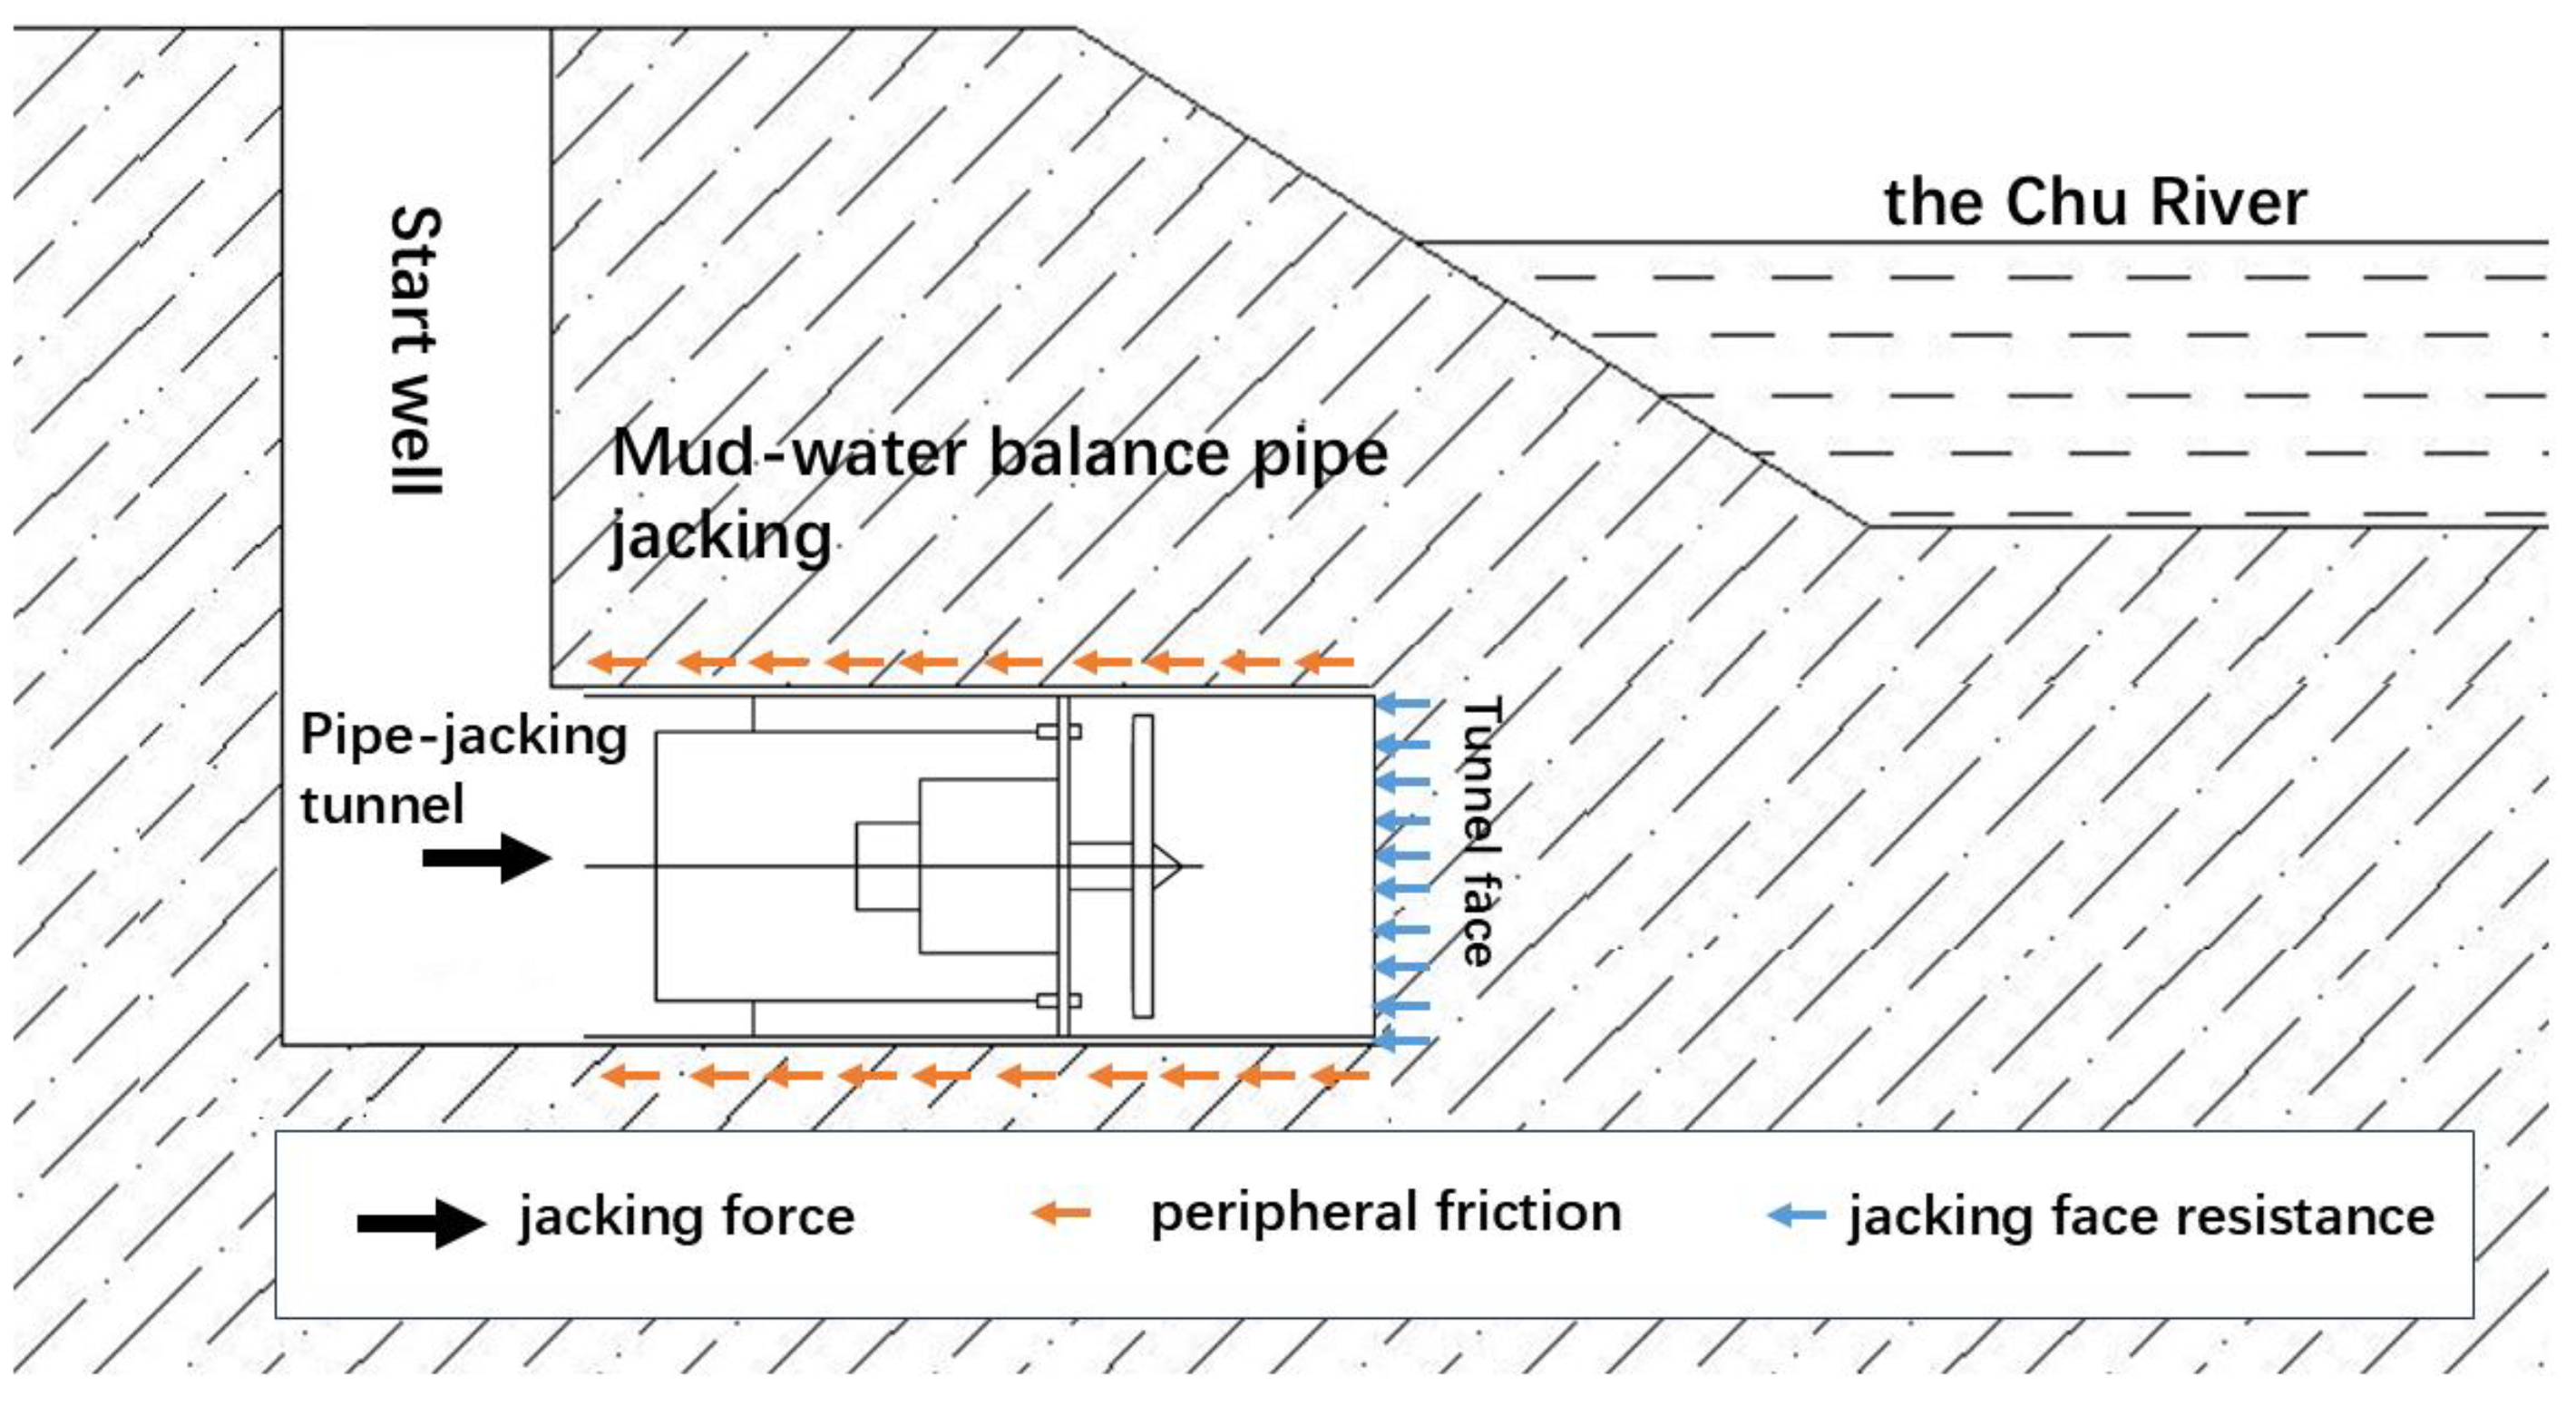
2.1. Mechanism of Support Pressure on Tunnel Face During Pipe Jacking

The mud–water balance theory is a pipe-jacking theory that balances the soil pressure and groundwater pressure in the soil layer where the tunneling machine is located. It does this using the pressure inside the mud compartment of the tunneling machine (i.e., the support pressure on the tunnel face). Theoretically, when the support pressure on the tunnel face is in balance with the soil and water pressure in front of it, the pipe jacking will not lead to deformation of the stratum in front of the tunnel face.
When the support pressure on the tunnel face is less than the soil and water pressure in front of it, the stratum in front of the tunnel face moves towards the tunnel. The interaction between the soils has a tendency to inhibit soil sliding, and the shear resistance increases. When the support force on the tunnel face decreases to a certain critical point, the displacement of the tunnel face suddenly increases sharply, and the tunnel face undergoes active damage. Established research results show that the damage pattern manifests as a chimney-like shear zone [33,34] when active damage occurs on the tunnel surface during shallow buried pipe jacking in sandy soil layers. The damage surface arises from the location of the tunnel’s elevated arch, directly from the sides in the vertical direction, with horizontal movement almost never occurring. The damage body is in the shape of a column with a small difference in width between its top and bottom (as shown in Figure 1a). When the water level is above the surface, the upper stratum in front of the tunnel face undergoes overall damage and slides downward to the surface [35], as depicted in Figure 1b.
When the tunnel-face support pressure is greater than the resistance, the soil body in front of the tunnel face shows an upward sliding displacement tendency. The interactions between soil grains inhibit the sliding tendency of the soil body, and the shear resistance increases. When the support pressure increases to a critical point, the displacement of the tunnel face suddenly increases sharply, and the pipe-jacking tunnel face undergoes passive damage. Existing research results show that when the tunnel surface in shallow buried pipe jacking in a sandy soil layer is passively damaged, the shape of the damaged area of the formation in front is similar to an inverted cone that is wide at the top and narrow at the bottom with a certain angle of inclination [36] (as shown in Figure 1c).

2.2. Theoretical Calculation Principle of Tunnel-Face Support Pressure

After simplifying and making assumptions about the background project, this study constructed a theoretical analysis model of different tunnel-face damage modes. For river-crossing pipe-jacking projects with significant features such as a small overburden thickness and a water level above the surface, the analytical model for calculating the support pressure at the tunnel face makes the following assumptions:
(1)
The project site strata are homogeneous, continuous, and isotropic. Tunnel-face damage is caused by sliding within the stratum soil body. The soil on the sliding surface obeys the Mohr–Coulomb failure criterion.
(2)
The support pressure on the tunnel face is uniformly distributed. Its vertical variation and the effect of seepage from the ground at the tunnel face are not considered.
(3)
The circular pipe-jacking tunnel face is simplified to a retaining wall of equal area and no thickness.
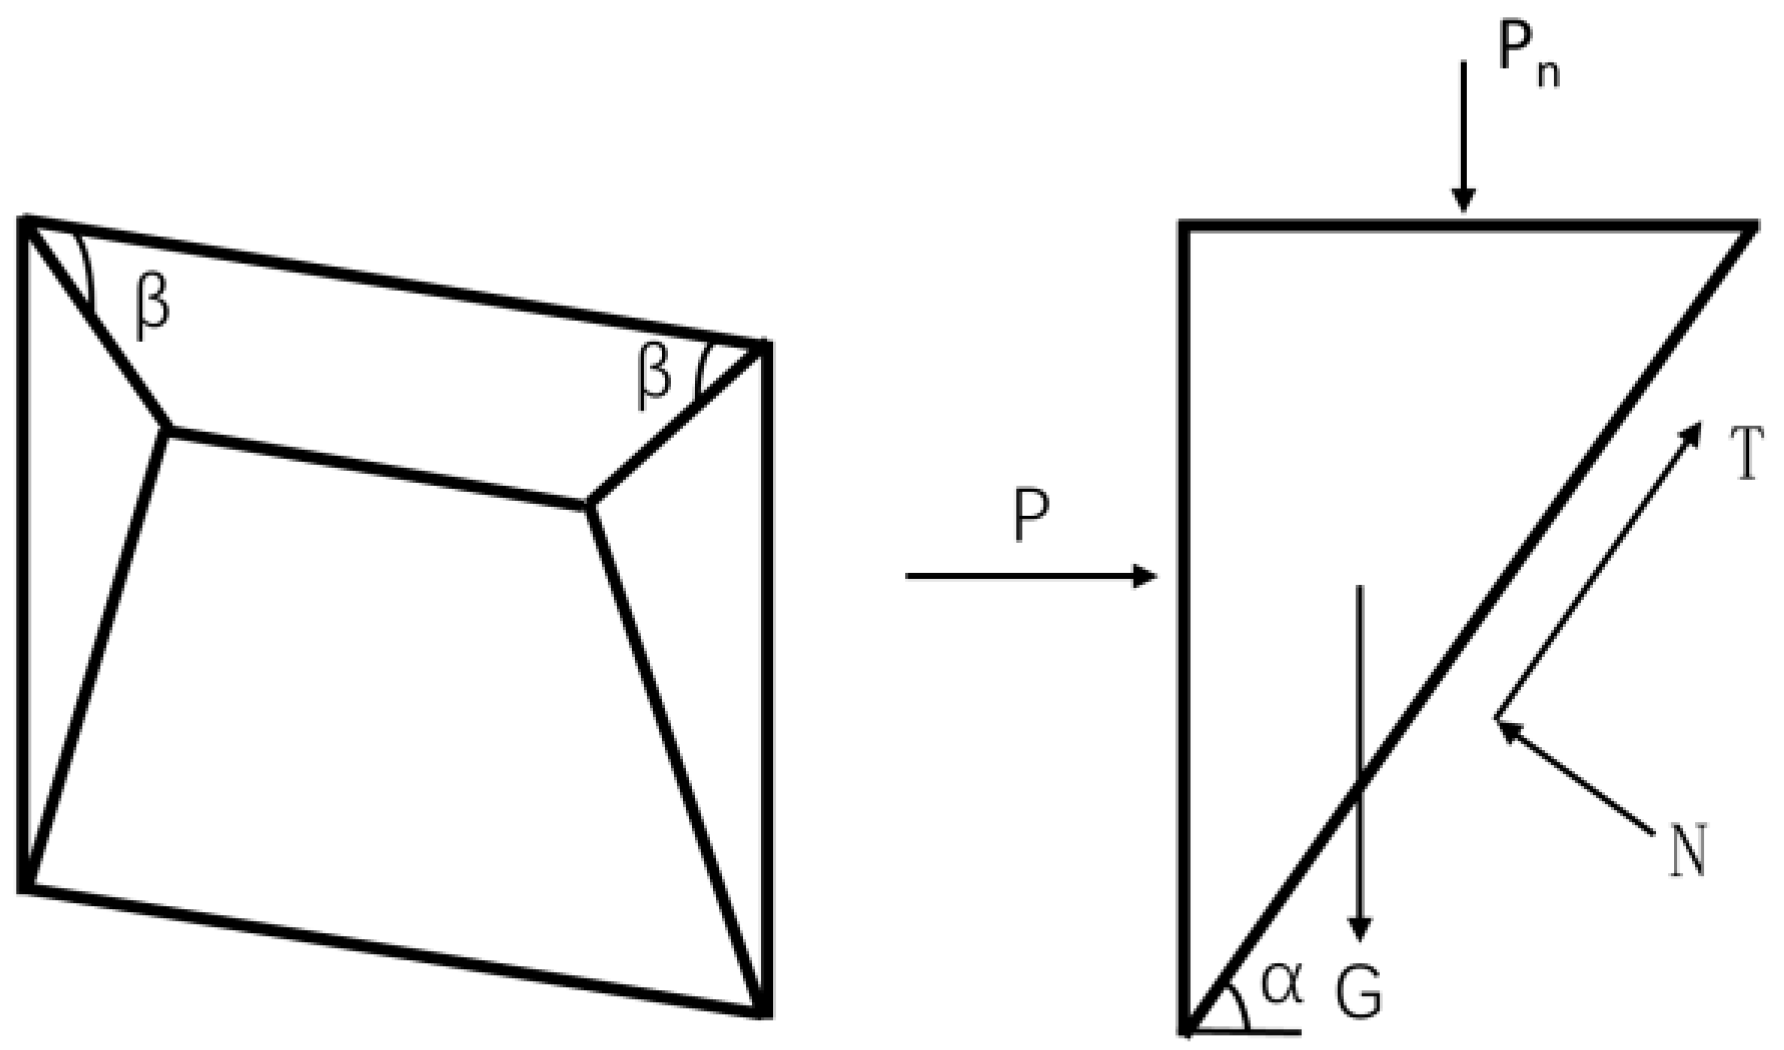
(4)
When the pipe-jacking tunnel face is damaged, there is a wedge-shaped block in front. The effect of friction on the contact surface of the wedge block is neglected, the wedge block does not undergo internal deformation, and the static equilibrium condition is satisfied.
The force on the wedge-shaped block in front of the pipe-jacking tunnel face is as shown in Figure 2a. The meaning of each parameter in the figure is as follows: P is the support pressure on the tunnel face; Pw is the hydrostatic pressure exerted on the tunnel face; Pn is the vertical force acting on the top of the wedge block; G is the self-weight of the wedge block; T and N are the frictional force (upward direction for active damage and downward direction for passive damage) and the normal stress on the diagonal section of the wedge block, respectively; and T′ and N′, respectively, represent the frictional resistance (upward direction for active failure, downward direction for passive failure) and normal force on the sliding surfaces on both sides of the wedge-shaped block.
The force characteristics of the wedge-shaped block were analyzed by taking the example of passive damage occurring on the pipe-jacking tunnel face. Equations (1) and (2) can be obtained from the conditions of an equilibrium of forces in the horizontal and vertical directions, respectively.
P = T cos α + 2 T cot α + N sin α + P W
P n + G = N cos α T sin α + 2 T sin α
Equation (3) can be obtained from the relationship between the friction force T and the normal force N on the sliding surface of the block.
T = c B 2 sin α + N tan φ
Here, c is the soil cohesion, kPa; α is the angle of inclination of the sliding block, °, α = 45 ° + φ 2 ; φ is the angle of internal friction of the soil, °; G is the self-weight of the wedge block, G = B 3 γ s 2 t a n α , kN; γ s is the volumetric weight of soil, kN/m3; and B is the wide of wedge block, m.
Equation (4) can be obtained by combining Equations (1)–(3) and simplifying.
P = sin α tan φ cos α cos α + tan φ sin α P n + G c B 2 s i n α + 2 T s i n α t a n φ c o s α c o s α + t a n φ s i n α sin α + cos α + P W
Here, P w is the hydrostatic pressure, kN, P w = B 2 ( H u + 0.5 D ) γ w ; γ w is the volumetric weight of water, kN/m3; H u is the distance from the top of the pipe jacking to the underground water level, m; D is the outer diameter of the digging machine, m; T is the sliding friction force of the sliding surfaces on both sides of the wedge-shaped block, kN, T = c B 2 2 t a n α + k γ s ( C + D / 3 ) 3 t a n φ ; k is the coefficient of lateral pressure of the soil, k = 1 sin φ ; and C is the length of the wedge block, m.
P n is the vertical force on the top of the wedge block. Soil and water sub-calculations are used here. On the one hand, due to the small thickness of the pipe-jacking overburden, P n is taken as the self-weight of the overlying soil according to the soil column theory. That is to say, P n = B 2 H s γ s c o t α . H s is the thickness of the overburden. On the other hand, P n = B 2 H w γ w c o t α , H w is the distance from the point of soil pressure action to the underground water level.
Each of the above parameters was substituted into Equation (4) and simplified. The general mathematical equation for the tunnel-face support pressure P was then obtained as shown in Equation (5).
P m i n = ε γ s B 2 H s cos α + B 2 tan φ c B 2 1 cos α s i n α + 2 γ s tan φ 1 sin φ C + D 3 3 εsin α + cos α + B 2 H u + 0.5 D γ w
Here, ε = sin α tan φ cos α cos α + tan φ sin α . The other symbols have the same meanings as defined above.
The slider inclination angle α in Equation (5) was considered an unknown quantity. The lowest value of the support pressure on the tunnel face, P , which is the lower limit of the support force P m i n on the pipe-jacking tunnel face, was obtained through an optimization search.
The horizontal unloading arch effect needs to be taken into account when active damage occurs (when the support pressure on the tunnel face is less than the soil and water pressure in front of it). A trapezoidal wedge was adopted in front of the tunnel face, and the angle between the balance arch and the tunnel face was assumed to be 50° [37]. The contact surface between the sliding soil and the horizontal unloading arch (the side of the original wedge model and the trapezoidal wedge) was assumed to be unstressed, as shown in Figure 3.
Based on the above assumptions, we have the following:
P = s i n α t a n φ c o s α c o s α + t a n φ s i n α P n + G c B 2 tan β 1 sin α tan β s i n α t a n φ cos α α cos α + tan φ sin α sin α + cos α + P W
According to the overall force balance of the trapezoidal wedge, the upper limit of the support pressure (maximum support pressure, P m a x ) on the tunnel face can be obtained as follows:
P m a x = ε γ s B 2 H s cot α + B 2 tan φ + B 2 H u + 0.5 D γ w c B 2 tan β 1 s i n α tan β εsin α + cos α

2.3. Pressure Calculation and Analysis of Optimal Support Pressure Value

The method utilized in this study is the limit equilibrium method, which requires high conditions for the prototype. Therefore, the conditions of the model are simplified to be relatively simple. Mud–water-balanced pipe jacking uses a balancing medium, such as mud and water, to obtain a certain pressure in the working silo and thereby balance out the pressure of the underground water and soil layer in front of the tunnel face. The sum of soil and water pressures in the soil above the front of the pipe-jacking machine was assumed to be P 1 . The corresponding tunnel-face support pressure was taken as P 2 , and the sum of soil and water pressures in the bottom soil at the front of the pipe-jacking machine was assumed to be P 3 . The corresponding tunnel-face support pressure was P 4 , as illustrated in Figure 4. Theoretically, P 1 = P 2 and P 3 = P 4 when the mud–water-balanced jacking tunnel face is in equilibrium.
In order to simplify the analysis and to highlight the main contradictions of the problem (in the actual construction process), the following assumptions were made: (1) the tunnel-face support pressure and resistance are trapezoidal in distribution, and the point of action is located at the center of gravity of the trapezoidal area; (2) the stratum in front of the pipe-jacking tunnel face is a semi-infinite body of homogeneous isotropy; and (3) the influence of the top pipe digging speed and friction between the cutter and the tunnel face are not considered.
Based on the above assumptions, the tunnel-face support pressure calculation model is constructed, as shown in Figure 2b. The static soil pressure at the point of action of the ground pressure at the tunnel face is used as a datum. Soil and water sub-calculations are adopted, and Equations (8) and (9) are obtained to calculate the optimal value of the tunnel-face support pressure.
P o 1 = K 0 γ s H a + H w + γ w H w π D 2 / 4
P o 2 = K 0 γ s H b + H c + γ w H r π D 2 / 4
Here, P o 1 is the optimal support pressure for the tunnel face in the area without river water influence, kPa; P o 2 is the optimal support pressure for the tunnel face in the area with river water influence, kPa; K 0 is the static earth pressure coefficient; γ w is the volumetric weight of water, kN/m3; H a is the distance from the underground water level to the ground surface, m; H b is the pipe-jacking burial depth, m; H c is the distance from the point of ground-pressure action on the pipe-jacking tunnel face to the top axis of the digging machine (which took the value of 2/3D), m; H r is the river depth, m; and H w is the distance from the point of soil pressure action to the underground water level, m.

3. Numerical Simulation and Analysis of Support Pressure on Tunnel Face

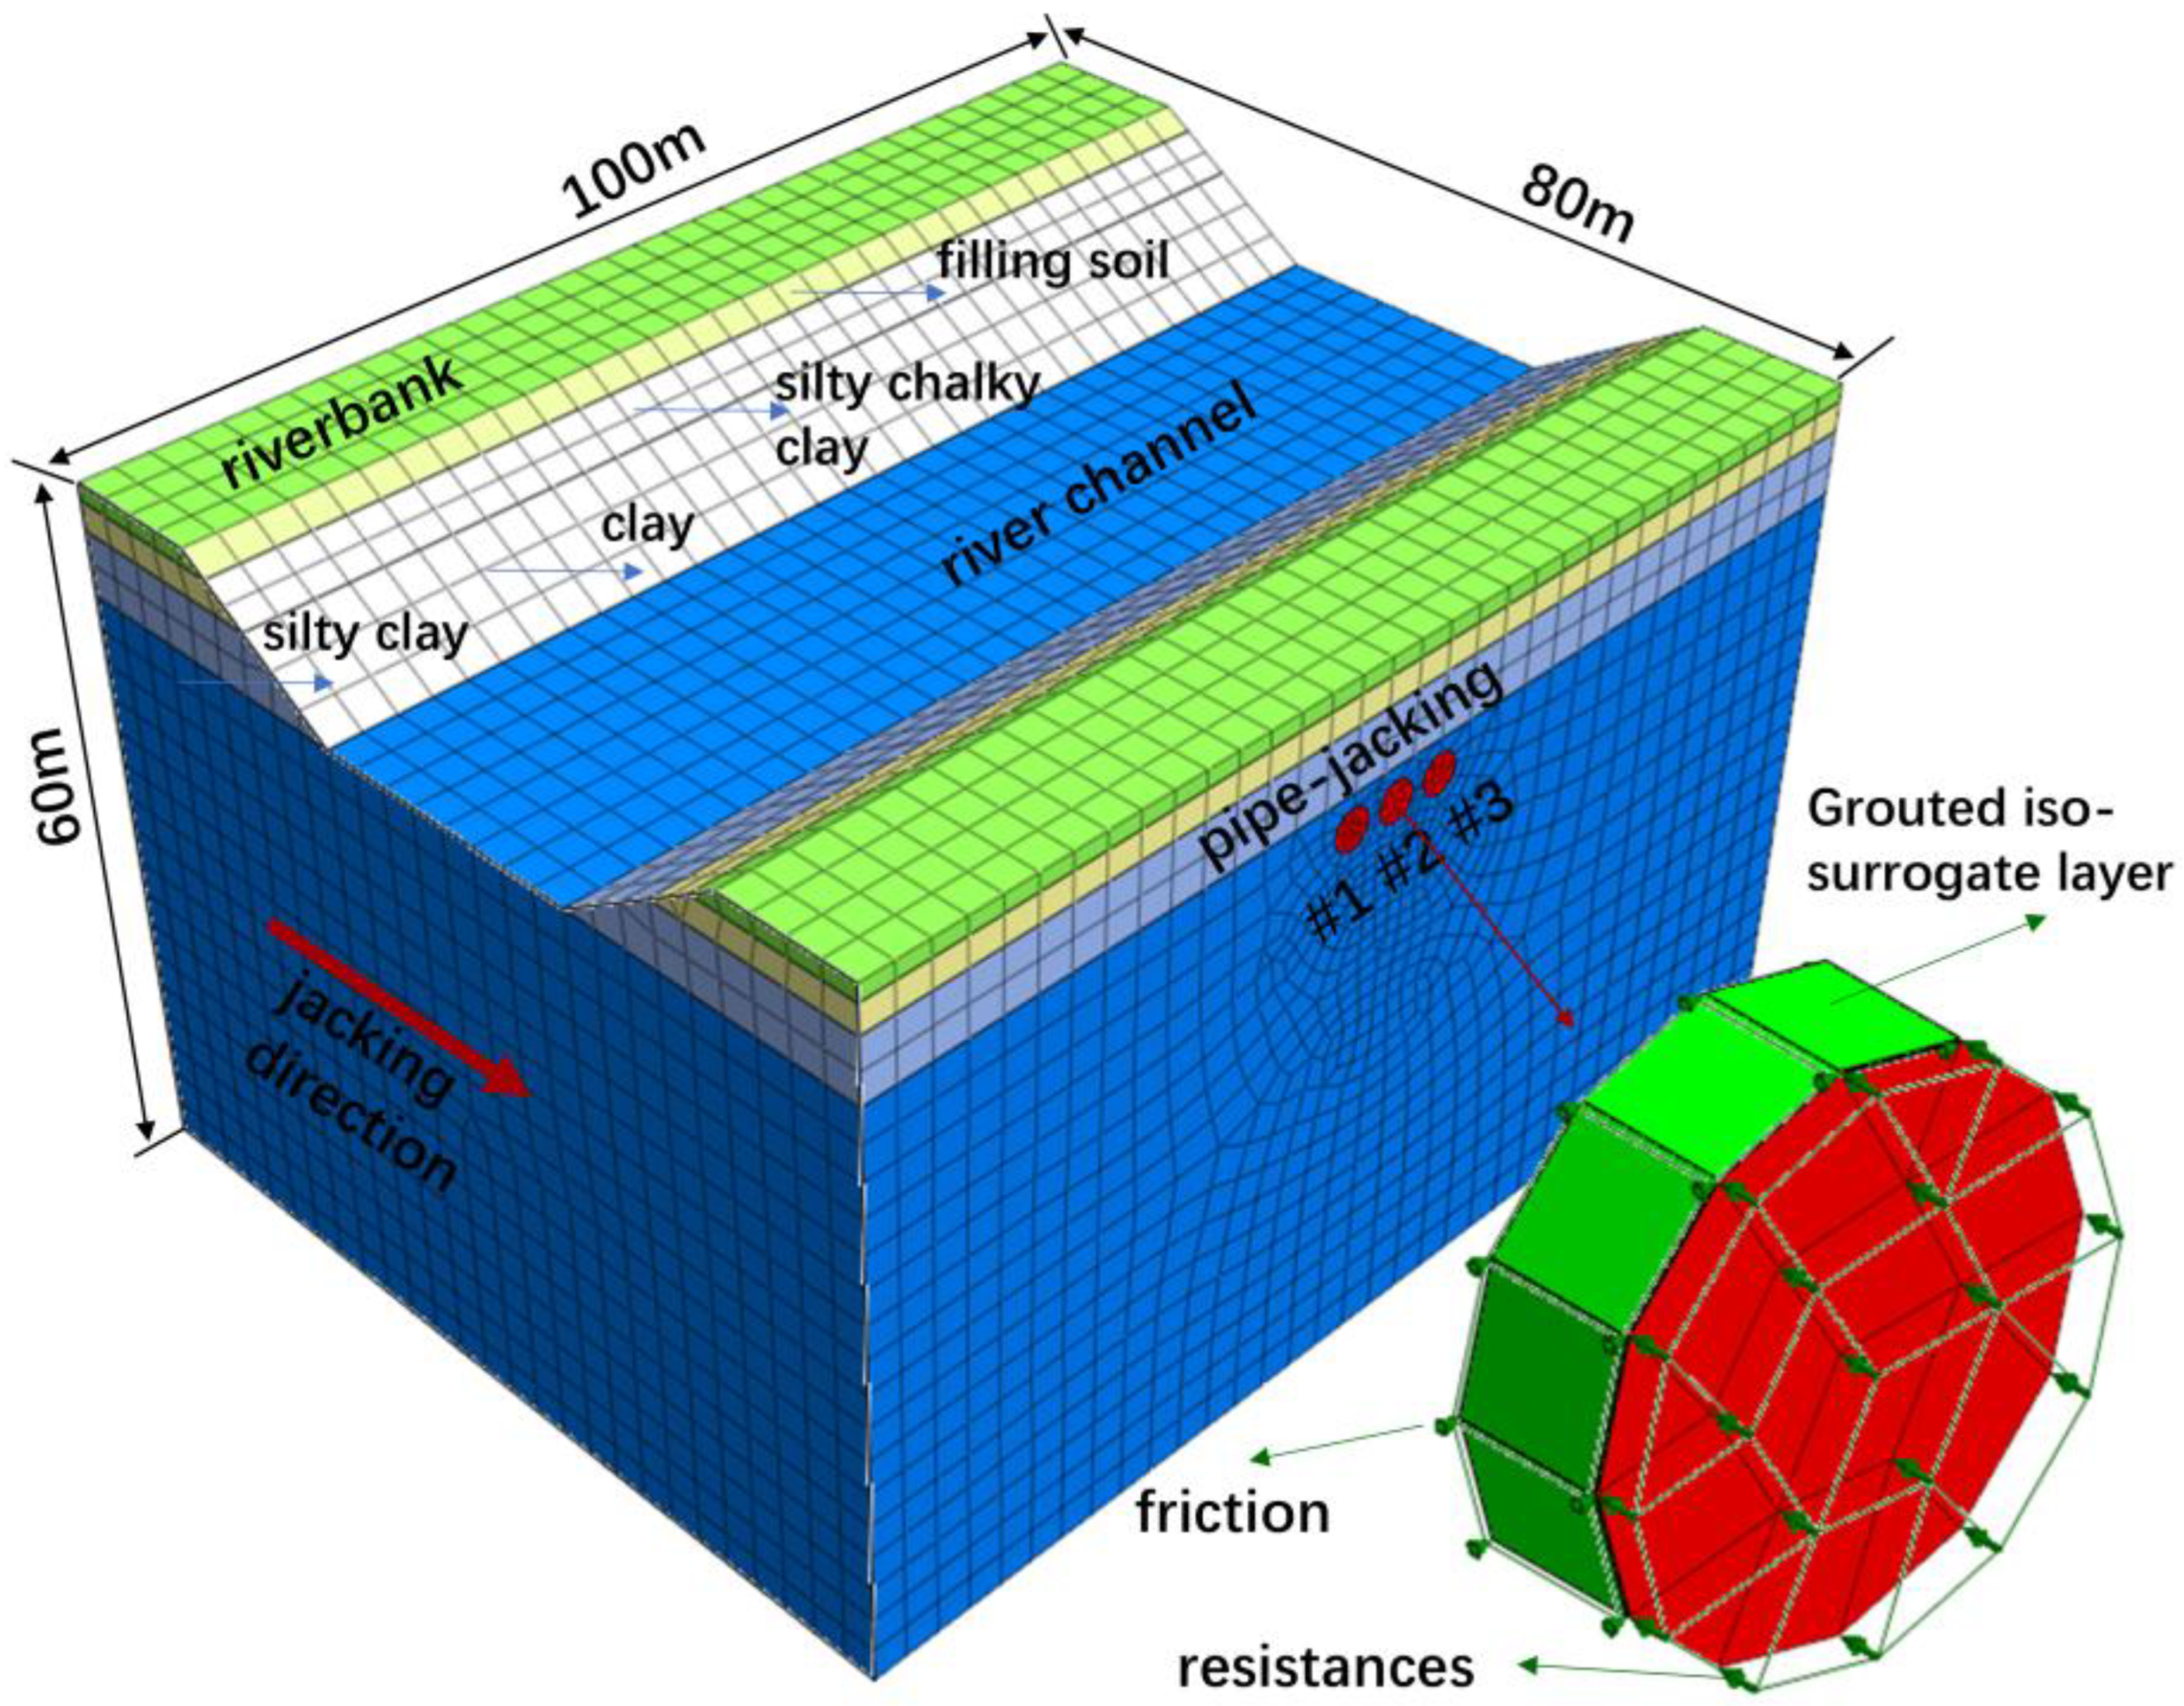
3.1. Simulation Model and Basic Assumptions

The numerical simulations were carried out in close connection with the actual situation of the Y25-Y26 pipe-jacking project. The derivation of mathematical expressions and numerical simulations of tunnel-face support pressures explored in this study were all in the context of the same project. The length, width, and height of the numerical simulation model were taken as 100 m × 80 m × 60 m, as shown in Figure 5. The bottom surface of the model was constrained with vertical and horizontal displacements, while the top surface was free. The pipe jacking was constructed using three circular reinforced concrete pipes with an internal diameter of 3.0 m and an external diameter of 3.6 m. The spacing between neighboring pipes was 2.8 m, and the length of the pipe-jacking excavation was 80 m. The reinforced concrete pipe sheet was considered an elastic material with a thickness of 0.3 m. The pipe-jacking machine casing was made of steel, which was also considered to be an elastic material. The values of the calculated parameters were taken as shown in Table 1. The material properties of the strata and pipe joints were described using 3D cell entities. Partial components were meshed by means of geometric partitioning and then expanded with a 2D mesh. The pipe perimeter grid was 0.5 m. The model boundary calculation cell grid was set to 1.0 m in both the longitudinal and transverse directions. The pipe-jacking machine shield shell was modeled elastically, and its material properties were described using 2D plate cells, which were meshed by analyzing the outer surface of the iso-surrogate layer. The values of the stratigraphic parameters are taken as shown in Table 2, which comes from the survey report of the background project. In the geotechnical laboratory of the survey company, soil tests for the moisture content, liquid–plastic limit, straight shear, compression, and free swell and a uniaxial compression test of rock were completed. The coupling between the soil entities and the jacked tunnel entities was investigated using Boolean operations. The mesh size of the soil body was 5 m and the mesh size of the pipe jacking tunnel was 1 m. The numerical calculation process was divided into four stages, which were initial stress field equilibrium, pipe excavation, pipe jacking advancement, and pipe sheet application. At first, the initial boundary conditions and self-weight of the model were imposed. The initial displacement was zeroed out to start the analysis of the initial stress field. Secondly, a uniform digging force was applied to the tunnel face. The pipe jacking tunnel was passivated to simulate excavated soil. Then, the pipe jacking machine casing was activated and the friction force was activated at the same time. The casing of the pipe-jacking machine was blunted, the pipes were jacked, and the pipe sheets were applied. Finally, the soil of the next pipe section was excavated. The pipe-jacking machine casing was added and the excavation forces and friction forces exerted by the previous pipe section were blunted.
For pipe-jacking projects crossing a river, the grouting pressure, resistance, and friction between the pipe and soil should be considered. In order to highlight the main issues and reduce the amount of tedious work, we chose to simplify the conditions. Pipe jacking forms a boundary inside the formation and changes the original stress field of the formation, which leads to a series of complex physical and mechanical effects in the formation around the construction area. This is closely related not only to the physical properties of the formation but also to the construction method, construction process, and related construction parameters. When using numerical software for three-dimensional calculations of multi-line parallel pipe jacking, it is difficult to take all the factors of pipe jacking into account to completely and realistically reflect the construction process. Therefore, the mechanical behavior related to pipe jacking was appropriately simplified in our numerical simulations. This not only allowed the simulations to meet the requirements of the software for calculation but also led the numerical calculation results to better reflect the construction process and reveal the regularity of the construction’s impact. Based on the actual situation of the examined project, the numerical simulation included the following assumptions:
(1)
Each stratum was assumed to be ideally elasticoplasticity. The numerical simulation model only considered the soil settlement caused by self-weight and the pipe-jacking process and ignored the effects of underground water, as well as consolidation settlement of the soil.
(2)
The soil pressure was considered a circular distributed load acting on the tunnel face. It was assumed that the gap grouting units around the perimeter of the pipe were distributed in equal thicknesses along the radial direction of the pipe sheet (the modulus of elasticity was taken as 1/50 of the in situ stratigraphic unit, and the thickness of the grouted iso-surrogate layer was 2 cm). Friction between the pipe and soil was achieved by setting a coefficient of friction on the contact surface (the friction between the pipe and soil was a certain value and was uniformly distributed along the pipe-jacking direction). The model ignored the effect of grouting pressure on the construction process and the pipe joints. The jacking pressure was taken from the lateral static soil pressure at the center point of the pipe’s tunnel face, as 88.5 kPa. The friction between the pipe and soil was taken as 3.5 kPa.
The previous study [38] by our team used strength reduction and numerical simulation methods. This study analyzed in detail the stability of surrounding strata unloaded by pipe jacking under different water depths, overburden thicknesses, and clearances. The surrounding strata were divided into the mutual-influence non-self-stability zone, the mutual-influence self-stability zone, and the no-mutual-influence self-stability zone. The assumptions for the numerical simulation and the specific simulated construction conditions in this study are consistent with those in [38], so they are not described here in detail.

3.2. Simulation Conditions and Implementation Steps

Numerical simulations were directed at analyzing the river-bottom cross-section. In order to investigate the effect of the overburden thickness on the support pressure, the river-bottom section conditions were categorized into three conditions: an overburden thickness of 3 m was considered in Case Ⅰ, an overburden thickness of 2 m was considered in Case Ⅱ, and an overburden thickness of 1 m was considered in Case Ⅲ. The theoretical values of the tunnel-face support pressures were applied, as shown in Table 3.
To explore the variation characteristics of the support pressure in the tunnel face, the support pressure ratio coefficient λ of the tunnel face was adopted, as demonstrated in Equation (10).
λ = σ s σ 0
Here, λ is the support pressure ratio at the pipe-jacking tunnel face; σ s is the support pressure at the center point of the pipe-jacking tunnel face, kPa; and σ 0 is the soil and water pressure at the center point of the pipe-jacking tunnel face, kPa.
Displacement monitoring points were arranged on the center vertical line of the tunnel face and on the ground surface along lateral and vertical lines, as depicted in Figure 6.
Mud–water-balancing pipe construction is a step-by-step process. To simulate dynamic construction that matches reality, step-by-step excavation was used. The effect of the jacking force on the disturbance of the soil in front of the tunnel face was considered. The numerical simulation calculation process was as follows:
(1)
The basic numerical model was established. Material properties were assigned, and corresponding displacement boundary conditions were imposed. Ground stress equilibrium calculations were performed under initial stress conditions that were designed to simulate the initial ground stress state.
(2)
Support pressure equal to the resistance applied in front of the tunnel face was set. The next step was to simulate the disturbance caused by the jacking to the strata ahead until a steady state was reached.
(3)
In actual construction, pipe jacking excavates to the bottom of the river channel. The soil is removed, and the pipe support structure is activated. At the same time, an excavation process can be completed by setting up a support pressure applied to the tunnel face.
(4)
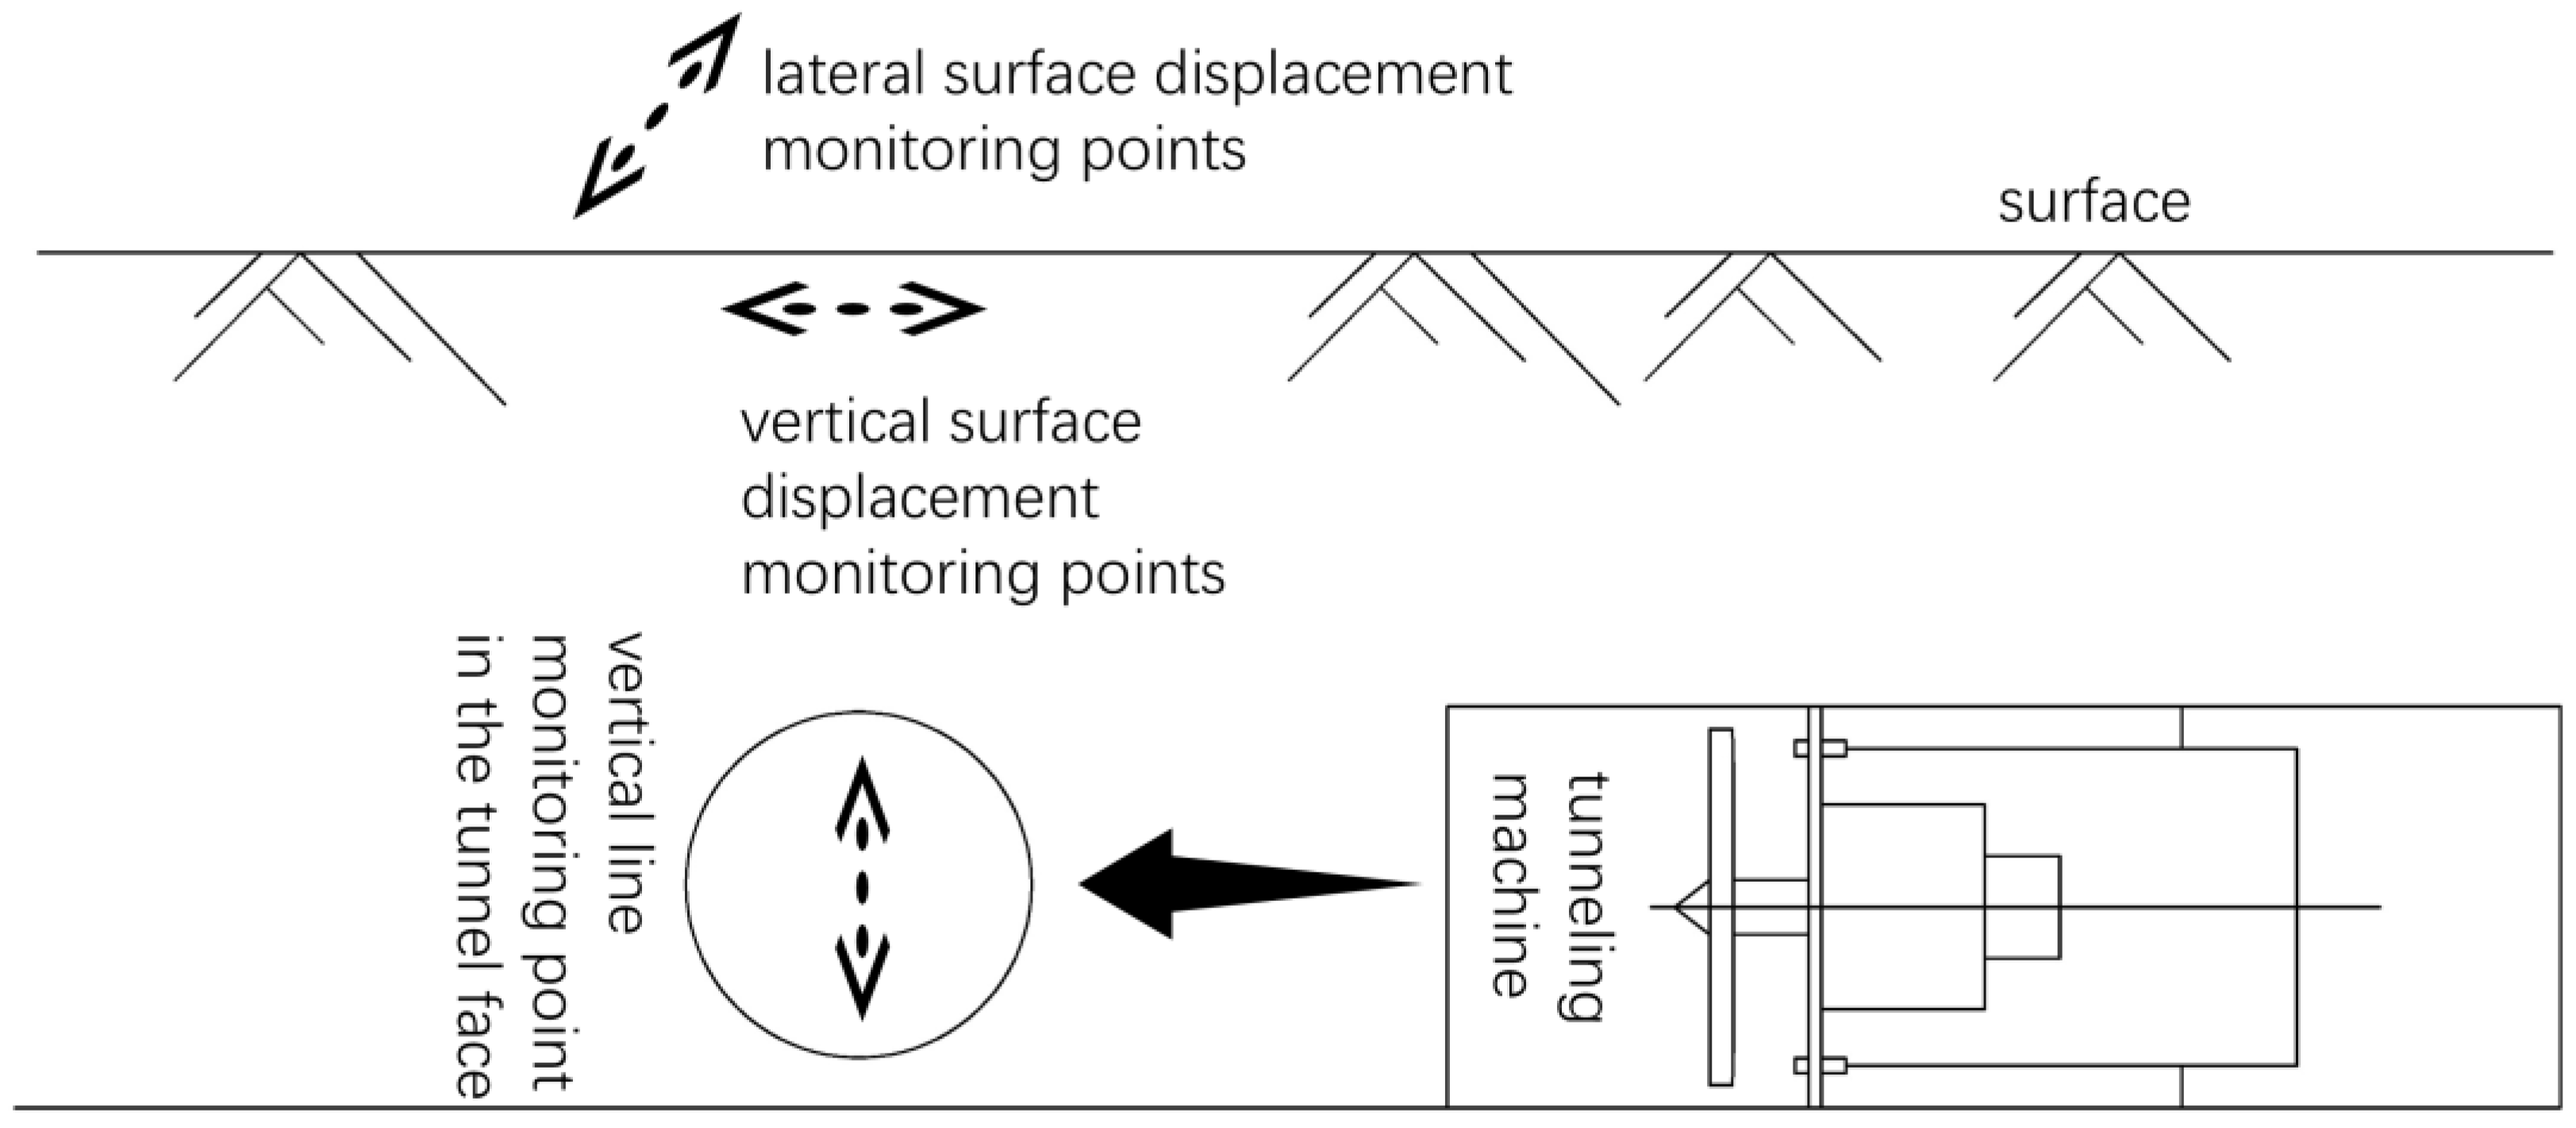
The overall deformation of the tunnel face and the displacement changes at the corresponding monitoring points were observed and recorded.
(5)
According to the support pressure ratio λ , the magnitude of the mud–water pressure applied at the center point of the tunnel face was altered. Re-excavation calculations were carried out, and the overall deformation of the tunnel face, as well as the displacement changes at the corresponding monitoring points, were observed and recorded.

3.3. Analysis of Calculation Results

To investigate the effect of overburden thickness on the tunnel-face support pressure under a river, the support ratio λ was taken as 0.5, 0.6, 0.7 0.8, 0.9, 1.0, 1.5, 2.0, 2.5, 3.0, and 3.5. The 11 working conditions are shown in Table 4.
As shown in Figure 7, when the river overburden is 3 m, the applied pressure obtained from the calculation of the theoretical tunnel-face support pressure decreases, and the normal displacement of the tunnel face gradually increases. When λ = 1.0~0.9, the tunnel face is slightly concave towards the soil. The displacement change is not significant and could be considered to satisfy the equilibrium stabilization requirements. As the support pressure continues to decrease to the active soil pressure (as λ changes from 0.9 to 0.6), the tunnel face displacement shows an approximately linear increasing trend with decreasing support pressure. The tunnel face gradually bulges towards the digging machine, and the surrounding soil slips and fails. When the river channel overburden is 2 m or 1 m, the trend is the same as when the river channel overburden is 3 m. However, as the thickness of the overburden decreases, the displacement of the soil monitoring points caused by the active support pressure continues to increase. When H s = 3 m, the maximum normal displacement of the tunnel face is -8 mm; when H s = 2 m, it is −6.5 mm; and when H s = 1 m, it is −5 mm.
As shown in Figure 8, when the river overburden is 3 m, the support pressure exerted on the tunnel face increases from static soil pressure to passive soil pressure. The trend is the same when the river channel overburden is 2 m or 1 m. The displacement of the tunnel face increases along the soil direction. However, as the thickness of the overburden decreases, the displacement of the soil monitoring points caused by the passive support pressure continues to decrease. When H s = 3 m, the maximum normal displacement of the tunnel face is 56 mm; when H s = 2 m, it is 47 mm; and when H s = 1 m, it is 38 mm.
As illustrated in Figure 9, according to the calculation results, the ultimate support force is 86.63 kPa when the river channel overburden is 3 m (86.63 kPa multiplied by the area of the tunnel surface πD2/4 is 881.786 kN), 83.03 kPa when the river channel overburden is 2 m (83.03 kPa multiplied by the area of the tunnel surface πD2/4 is 845.142 kN), and 50.81 kPa when the river channel overburden is 1 m (50.81 kPa multiplied by the area of the tunnel surface πD2/4 is 517.183 kN). This support force can control the position of the tunnel face to keep it in the best condition. Junfeng Tang [39] concluded that one factor controlling the settlement deformation of shallow buried jacked pipes was the ground loss rate. The ground loss rate has a significant effect on the variation in maximum deformation values. The effect of the ground loss rate becomes smaller as the depth of the jacking pipe increases. This study focuses on the effect of support pressure on the deformation and stability of the pipes. Based on the above results, it can be seen that as the thickness of the channel overburden decreases, the support force of the excavation surface required to reach the optimal stabilization state also decreases. From Figure 9, it can be seen that the optimal support force is in the interval of λ = 1.0~1.5 when H s = 3 m, in the interval of λ = 0.9~1.0 when H s = 2 m, and in the interval of λ = 0.8~0.9 when H s = 1 m. This indicates that when the overburden thickness is small, the support pressure needs to be set at a reduced support ratio; conversely, the support ratio needs to be increased when the overburden thickness is large.

4. Engineering Case Study

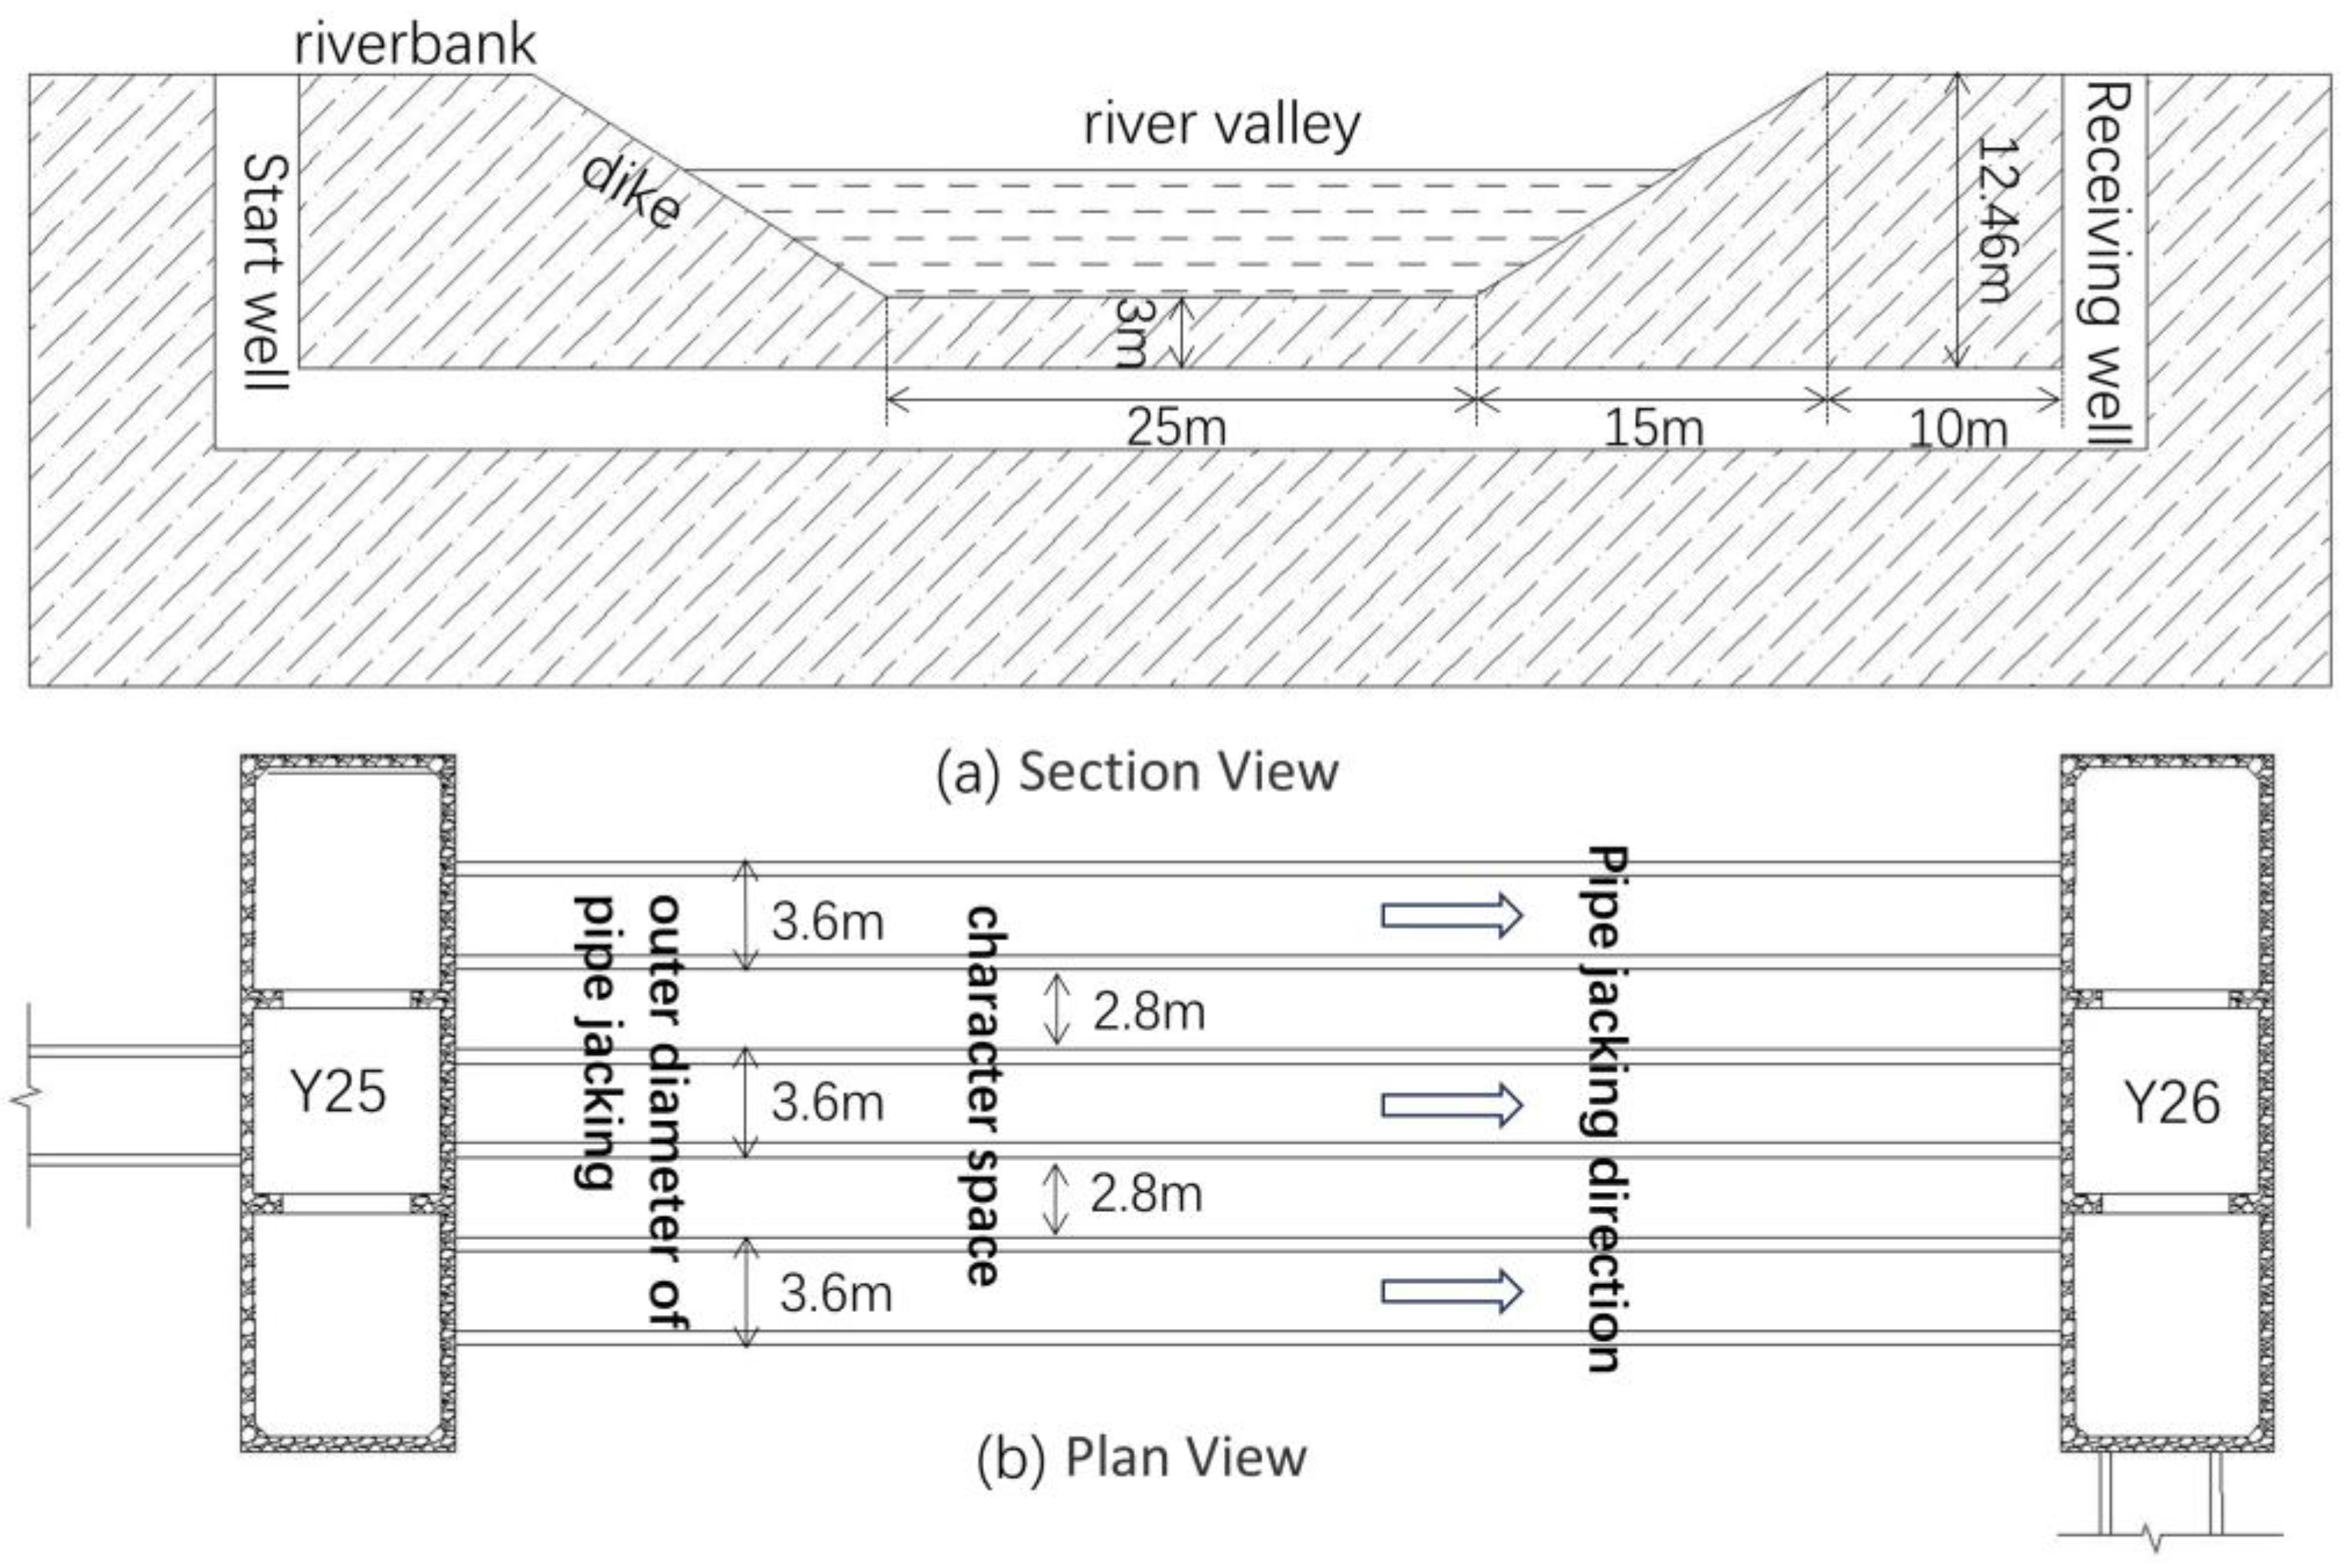
4.1. Engineering Background

The Y25-Y26 pipe-jacking project across the Chu River channel is located in Shuangdun Town, Changfeng County, Hefei City, Anhui Province. The project site belongs to the Jianghuai undulating plain landform, with a micro-landform of hills and valleys. The geotectonic location of the region belongs to the southern edge of the North China Plateau, and the secondary tectonic unit belongs to the Hefei Basin. The stratigraphic distribution from top to bottom is as follows: filling soil, 0.5 to 1.5 m thick; silty chalky clay, 1.2 to 2.7 m thick; clay, 5.9 to 7.5 m thick; silty clay, 4.8 to 6.0 m thick; strongly weathered mudstone, 1.7 to 2.6 m thick. The physical and mechanical parameters of each stratigraphic layer are shown in Table 2.
The Y25-Y26 project crossing the Chu River channel adopted mud–water-balanced mechanical pipe jacking. The pipe jacking crossed the stratum of silty clay, and the thickness of the pipe-jacking cover layer was 3.0 m. The width of the river valley in the section where the pipeline crosses is 55 m, the width of the river bed is 25 m, the height of the river bank is 9.46 m, and the average depth of the river water in the dry season is about 3.0 m. The pipe jacking was composed of three circular reinforced concrete pipes with an internal diameter of 3.0 m and an external diameter of 3.6 m. The sandwich width of adjacent pipes was 2.8 m. The project had remarkable features such as high environmental requirements, a small overburden thickness, and a large pipe diameter. Controlling the stability of the pipe-jacking tunnel surface was the priority of engineering control. Section and plan views of the place where the pipe jacking crosses the river are shown in Figure 10.

4.2. Comparative Analysis and Discussion of Engineering Effects

Considering the Y25-Y26 pipe-jacking project crossing the Chu River channel in Hefei North City, and according to the theoretical formulas (5) and (7)–(9), the upper limit value Pmax, lower limit value Pmin, and optimal value Po of the tunnel-face support pressure at different jacking distances were calculated, as shown in Table 5. Table 6 presents measured values of the tunnel-face support pressure, obtained by means of testing during the project’s jacking process. Since the upper limit, lower limit, and optimal values of support pressure on the tunnel face during pipe jacking for jacking distances from 50 m to 75 m were the same as those for jacking distances from 25 m to 1 m; they are not shown in detail in Table 5. For a more direct and graphic depiction of the variation in the different support pressure values at different jacking distances, we created a simple model of the project to produce diagrams corresponding to Table 5 and Table 6, as shown in Figure 11.
In Figure 11, according to the principle of optimal value calculation, the jacking area was divided into a non-river impact area (0–20.24 m and 54.76–75 m) and a river impact area (20.24–54.76 m). The underground water level was −3 m from the surface of the riverbank. The construction stratum was located in a silty clay layer, and K 0 was the static soil pressure coefficient, taken as 0.7. The heights described by Ha, Hb, Hc, Hr, Hs, Hu, and Hw in the above equation are also given in the upper part of Figure 11. The dimension of the simple model of the project in the upper half of Figure 11 was kept the same as the jacking length in the bottom half of the figure. The bottom half of Figure 11 describes the upper limit value Pmax, the lower limit value Pmin, the optimal value Po, and the measured value P′ of the support pressure on the tunnel face for different jacking distances. A partial enlargement of the optimum value for jacking distances from 20.24 m to 25 m is also given.
The change rules for the upper limit value Pmax, lower limit value Pmin, and optimal value Po of the tunnel-face support pressure were basically the same: At jacking distances from 0 m to 10 m (non-river impact area), the support pressure values were constant at 4868.249 kN, 2230.598 kN, and 3098.977 kN, respectively. The support pressure decreased for jacking distances from 10 m to 25 m. At jacking distances from 25 m to 50 m (river impact area), the support pressure values were also constant, at 2669.977 kN, 309.910 kN, and 1044.870 kN, respectively. However, there were some differences between the three: when the jacking distance exceeded the intersection of the underground water level line and the dike line, the decrease rates for the upper limit value Pmax and lower limit value Pmin increased, while the optimal value Po did not change significantly. When the jacking distance was greater than 20.24 m (moving from the non-river impact area to the river impact area), the optimal value of the tunnel-face support pressure, Po, changed abruptly, decreasing from 2351.527 kN to 1133.573 kN, but there was no significant change in the upper limit value Pmax or the lower limit value Pmin. In the process of pipe jacking at distances from 20.24 m to 25 m, the rate of decrease in the optimal value Po showed a linearly decreasing law. Each decrement was approximately 22.5 kN, which is reflected in the partial enlargement in the upper left corner of the bottom half of the graph in Figure 11. The overburden thickness was 3 m at jacking distances from 25 m to 50 m. In Section 3.3, the numerical simulation allowed us to calculate the ultimate support pressure as 881.786 kN, while the optimal value of support pressure at the tunnel face was 1044.87 kN. These results are relatively similar. It can be seen in Figure 11 that the measured value of the tunnel-face support pressure, P′, fluctuated between 1700 kN and 3600 kN. The measured value P′ basically lay between the upper limit value Pmax and the lower limit value Pmin, and it was most similar to the optimal value Po in the non-river impact area and to the upper limit value Pmax in the river impact area.
In an actual pipe-jacking process, the parameters that need to be considered include the jacking force, peripheral friction, and jacking face resistance, as shown in Figure 12. Firstly, the jacking force exerted by the jacking machine should not be varied frequently over short distances and needs to be kept constant. It is difficult to achieve a continuous change in the applied jacking force over a short period of time. Secondly, if the jacking force is kept constant, the peripheral friction becomes larger and the jacking face resistance becomes smaller as the pipe is jacked (a pair of interacting forces, the jacking face resistance and the support force, which is equal in magnitude and opposite in direction to the jacking face resistance). Finally, as the jacking distance increases, the peripheral friction increases and the jacking speed decreases. When the pipe is jacked a certain distance, the jacking force needs to be increased to restore the jacking speed. In this background project, when the jacking distance is from 4 to 12 m, the jacking force is kept constant at 4000 kN. In this process, the peripheral friction gradually becomes larger, and the jacking face resistance becomes smaller (the support force becomes smaller), its value decreases from 3278 kN to 1834 kN. When the jacking distance is from 24 m to 43 m, the jacking force remains unchanged at 6000 kN, but the peripheral friction becomes larger and the jacking face resistance decreases from 2675 kN to 1819 kN. As a result, the measured value P′ fluctuates up and down.
The focus of this paper is on the study of support pressure in the tunnel face. There is not a lot of research work carried out on the construction of three lines of pipe jacking. Clearance D is a very important parameter in pipe-jacking construction projects. With an increase in clear distance D , the potential failure pattern of the surrounding strata for three-line parallel pipe-jacking construction unloading transited from double pipe-jacking overall collapse to gradual separation collapse, and the final collapse pattern was consistent with that of single pipe jacking [38]. Wang Yazheng [40] superimposed the settlement deformation caused by additional horizontal thrust, friction of the pipe-jacking machine, friction of the pipe jacking, grouting pressure, and soil loss to obtain the total surface vertical displacement mathematical expression. However, this study derived the corresponding support pressure values from the perspective of different damage modes to ensure that the deformation of the soil would not be serious for pipe-jacking construction. The measured value of the support pressure, P′, on the tunnel face was between the upper limit value Pmax and the lower limit value Pmin, which ensured that the pipe jacking did not involve active or passive damage. The process would be more economical and reasonable if the measured value of the tunnel-face support pressure P′ was close to the optimum value Po. During mud–water-balanced pipe jacking, the jacking machine adopts a mud–water balancing device to ensure the balance of water and soil pressure on the tunnel face. Theoretically, if the tunnel-face support pressure and the resistance are kept in equilibrium during the jacking process, the pipe jacking’s frontal propulsion will not cause deformation of the stratum. However, in the actual jacking process, due to the complexity of geological conditions, the limitations of mechanical equipment, and other factors, it is difficult to always maintain a balanced state between the support pressure and resistance of the tunnel face. Therefore, the support pressure at the tunnel face can be set within a reasonable range between the upper limit value Pmax and the lower limit value Pmin.

5. Conclusions

The support pressure at the tunnel face during mud–water-balanced pipe jacking is an important construction control parameter. If the support pressure is not set properly, it can cause stratum displacement or tunnel-face collapse, which causes high safety hazards in the pipe-jacking process. In this study, the support pressure on the tunnel face during pipe jacking under the conditions of a thin overburden, mud–water balance, and construction crossing a river channel was examined in depth, and the performed analyses allowed the formulation of general conclusions:
(1)
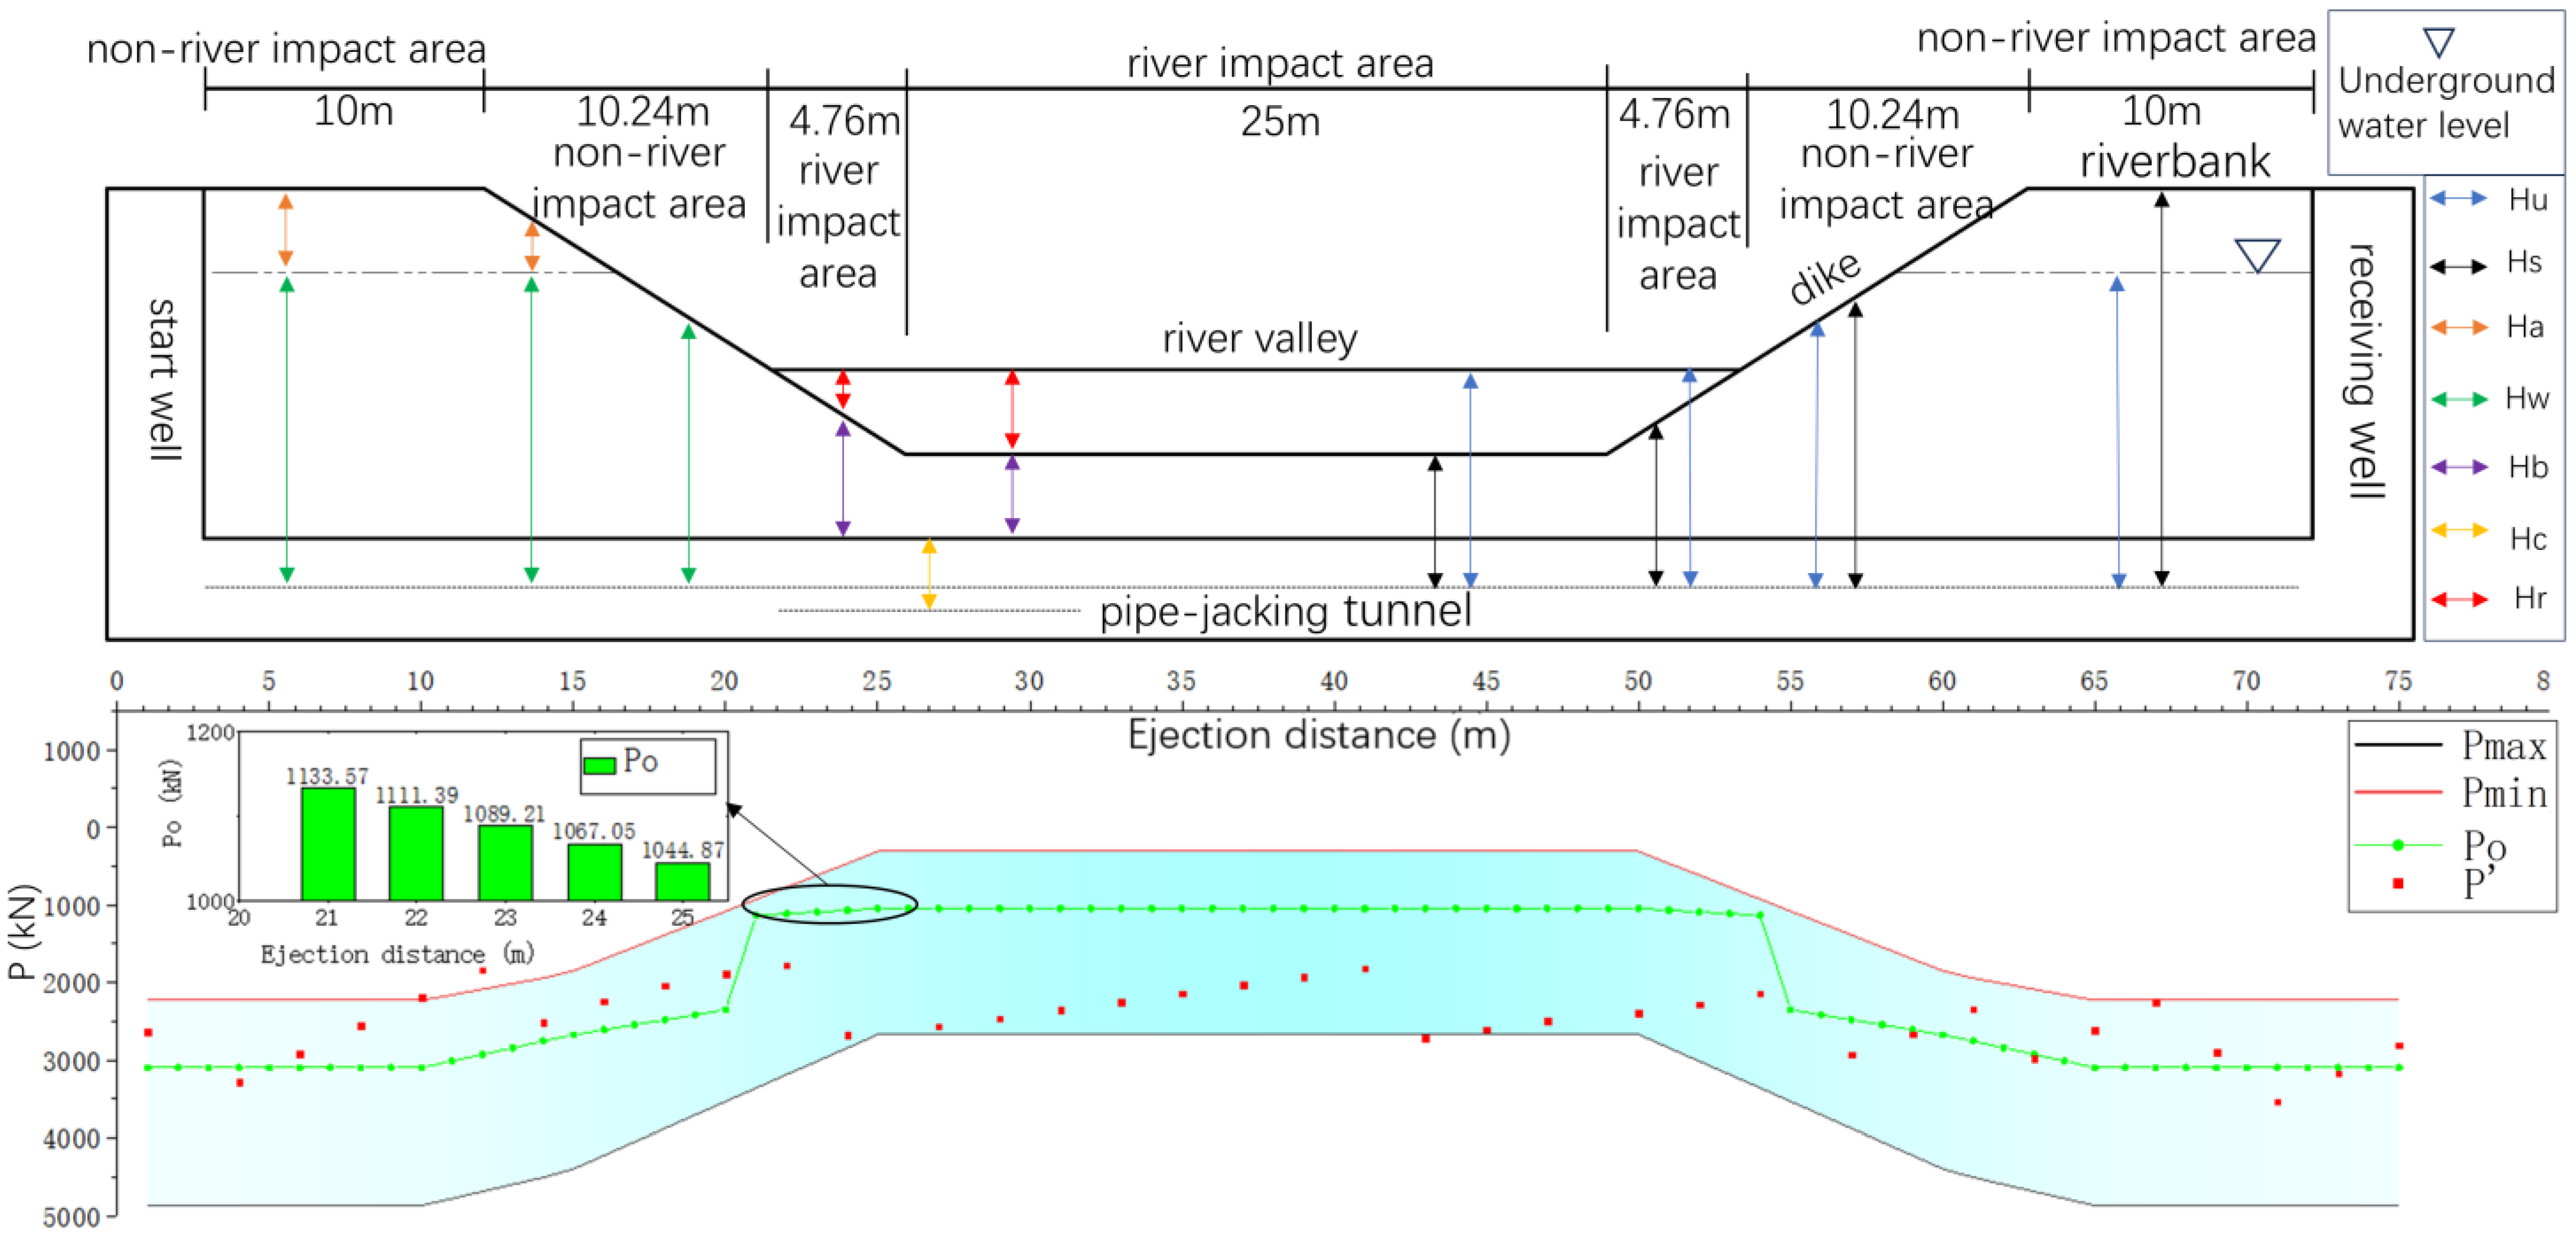
The damage mechanism of the tunnel face during pipe jacking under conditions of a thin overburden, mud–water equilibrium, and construction crossing a river was examined. Mathematical expressions for the lower and upper limit values of the tunnel-face support pressure, Pmin and Pmax, were derived from analyses of the passive and active damage occurring at the tunnel face of the pipe tunnel, in conjunction with the limit equilibrium method. The jacking area was divided into a non-river impact area and a river impact area. Mathematical expressions for the optimal support pressure values, Po1 and Po2, for the two areas were also given separately.
(2)
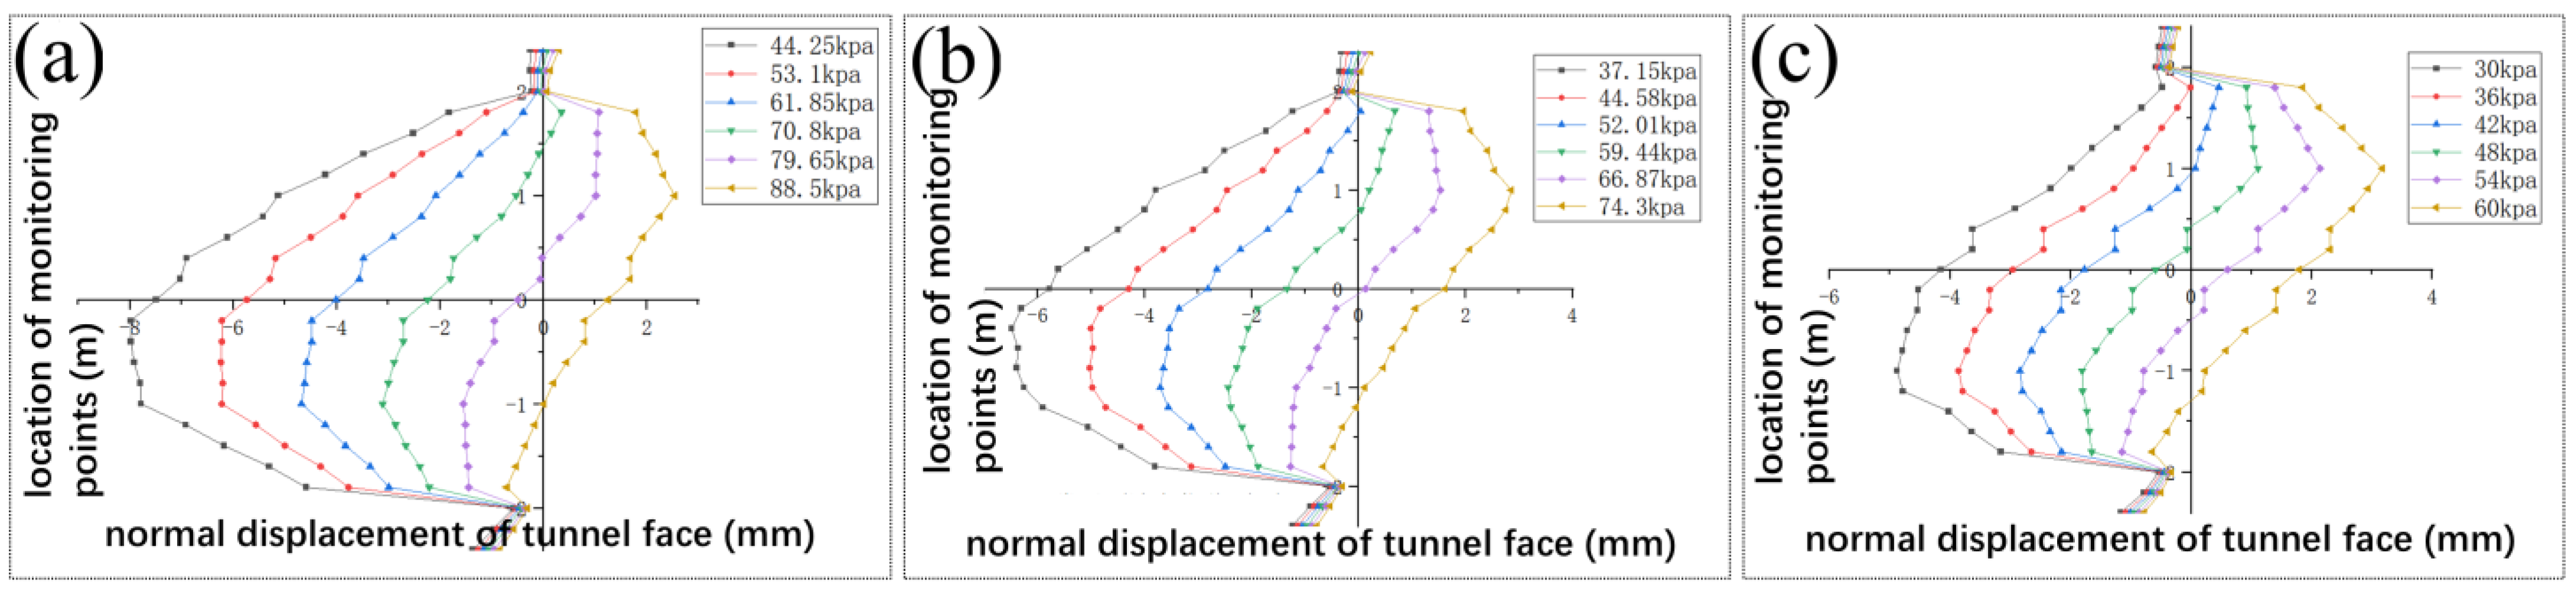
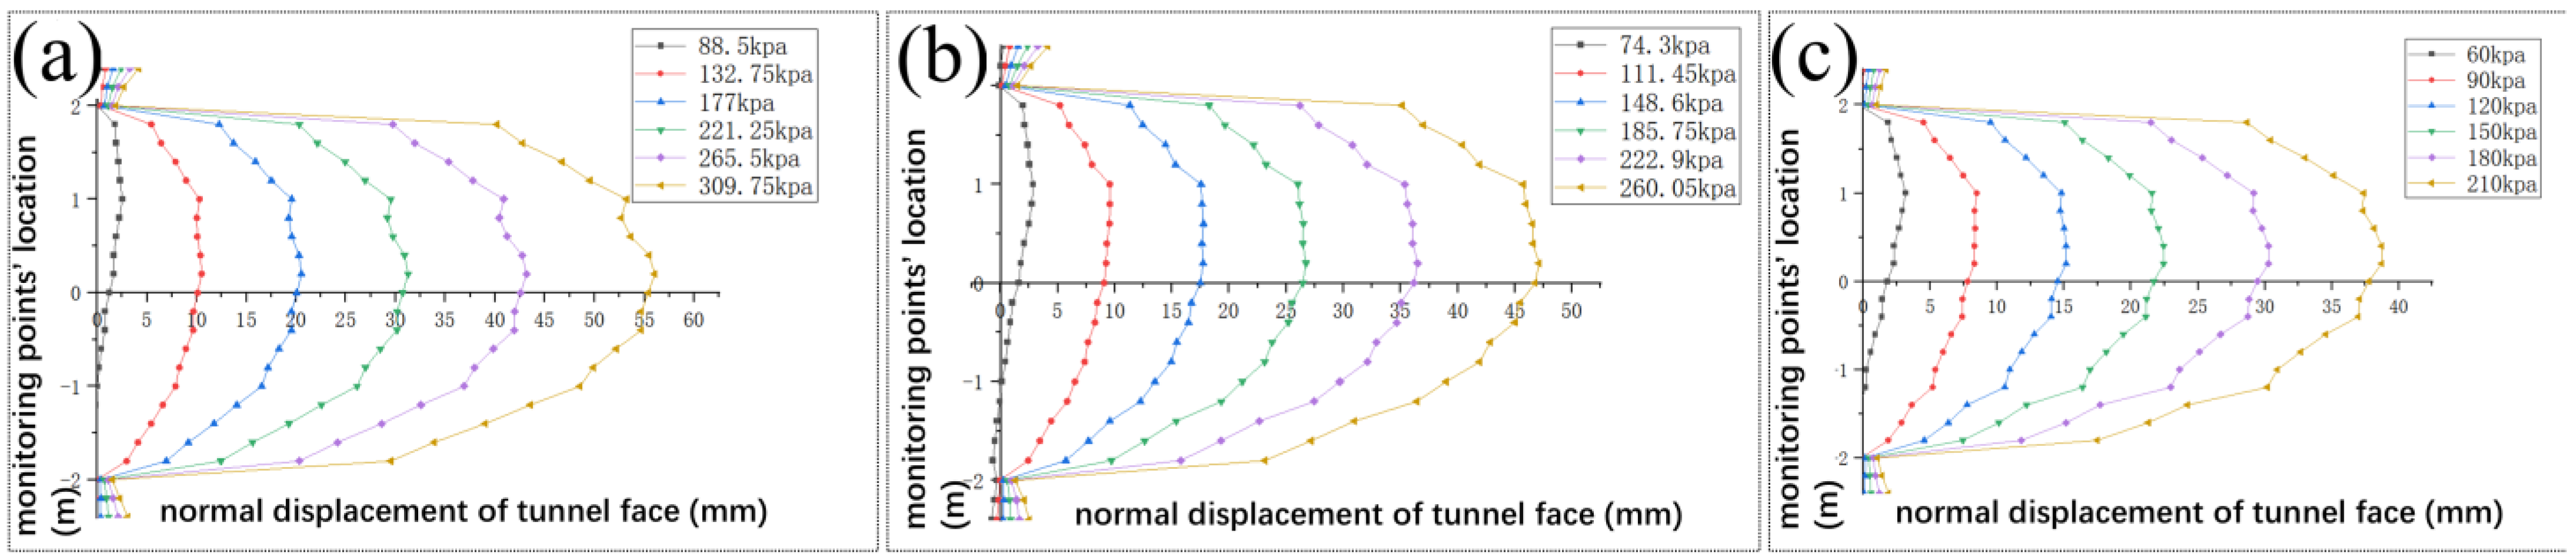
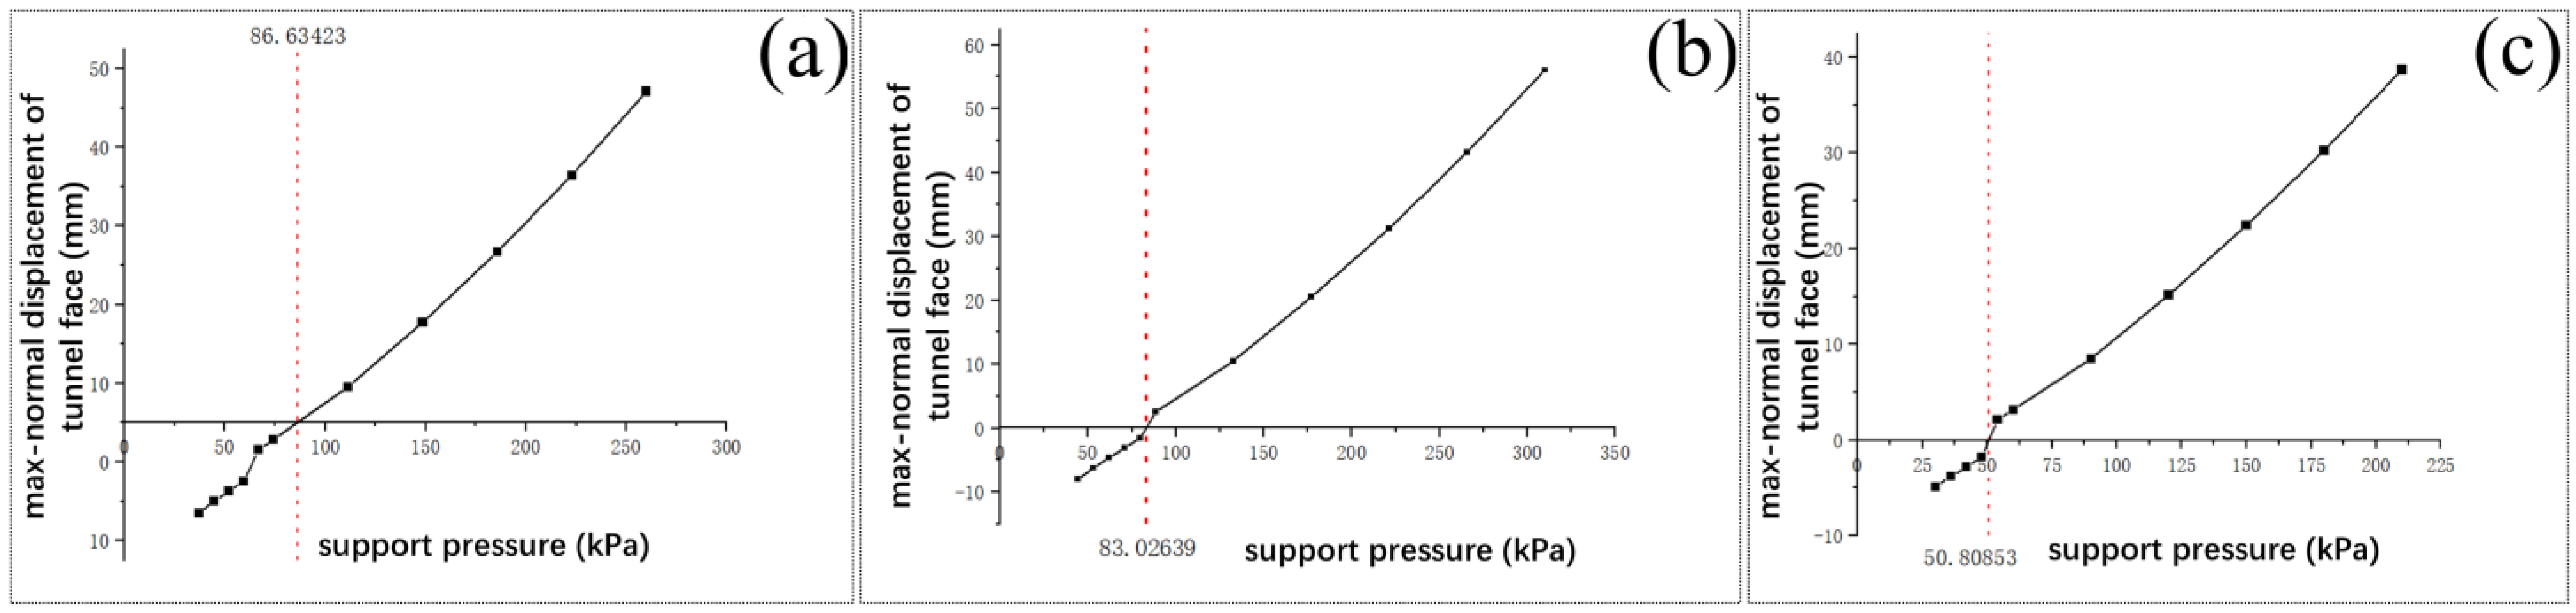
By studying the Y25-Y26 pipe-jacking project crossing the Chu River in Hefei North City, and through numerical simulation, the displacement and ultimate support pressure of the tunnel face under different river overburdens and different support ratios were discussed. As the thickness of the overburden decreased, the soil monitoring point displacement caused by the active support pressure continued to increase, while the displacement caused by the passive support pressure continued to decrease. When large-diameter pipe jacking crosses a river channel, if the overburden thickness is small, the setting of the support pressure requires a reduced support ratio, while the support ratio needs to be increased if the overburden thickness is large. The optimal support force is in the interval of λ = 1.0~1.5 when H s = 3 m, in the interval of λ = 0.9~1.0 when H s = 2 m, and in the interval of λ = 0.8~0.9 when H s = 1 m.
(3)
For pipe jacking crossing a thin-cover river channel, the theoretically calculated upper limit value Pmax, lower limit value Pmin, and optimal value Po and the numerically simulated limit value of the support pressure were 2669.977 kN, 309.910 kN, 1044.870 kN, and 881.786 kN, respectively. The values measured during pipe jacking fluctuated between the upper limit value Pmax and the lower limit value Pmin. They were more similar to the optimal value Po in the non-river impact area and more similar to the upper limit value Pmax in the river impact area. To overcome the complexity of geological conditions, the limitations of mechanical equipment, and other factors to ensure the stability of the tunnel face without damage, it is necessary to set the tunnel-face support pressure within a reasonable range between the upper limit value Pmax and the lower limit value Pmin; we suggest adopting the optimal value Po. The analysis will make it possible in the future to develop longitudinally in pipe-jacking construction. The evolution characteristics of support pressure and damage alarm of a tunnel face under complex conditions should be more greatly explored and tested in practice in combination with artificial intelligence and algorithms.

Author Contributions

Conceptualization, Z.Z. and W.L.; data curation, W.L., J.S. and M.Z.; methodology, Z.Z. and W.L.; formal analysis, Z.Z., W.L., J.S. and M.Z.; investigation. W.L., J.S. and M.Z.; writing—original draft, Z.Z. and W.L.; writing—review and editing, Z.Z. and W.L.; supervision, Z.Z. and B.L.; project administration, Z.Z.; resources, Z.Z.; software, W.L., J.S. and M.Z.; supervision, Z.Z. and B.L.; validation, Z.Z. and B.L.; visualization, W.L., J.S. and M.Z. All authors have read and agreed to the published version of the manuscript.

Funding

This study was funded by the Provincial Natural Science Research Project of colleges and universities in Anhui Province (key project KJ2021A0611), the Science and Technology Plan of Housing and Urban-Rural Construction in Anhui Province (2022-YF096), and a science and technology development project (HYB20240110, HYB20250019).

Institutional Review Board Statement

Not applicable.

Informed Consent Statement

Not applicable.

Data Availability Statement

The data used to support the findings of this study are available from the corresponding author upon request.

Acknowledgments

Thanks go to Hongxing Ma (Pingdingshan Urban Planning and Design Institute, Pingdingshan) and Lin Wei (Chengji Railway Engineering Technology Limited Company, Hefei) for providing the dependent project-specific data and field measurements for this study.

Conflicts of Interest

The authors declare that they have no conflicts of interest.

References

  1. Chen, P.; Liu, X.; Deng, Z.; Liang, N.; Du, L.; Du, H.; Huang, Y.; Deng, L.; Yang, G. Study on the pipe friction resistance in long-distance rock pipe jacking engineering. Undergr. Space 2023, 9, 173–185. [Google Scholar] [CrossRef]
  2. Hsiung, B.-C.B.; Yang, K.-H.; Aila, W.; Ge, L. Evaluation of the wall deflections of a deep excavation in Central Jakarta using three-dimensional modeling. Tunn. Undergr. Space Technol. 2018, 72, 84–96. [Google Scholar] [CrossRef]
  3. Georgiou, D.; Kalos, A.; Kavvadas, M. 3D Numerical Investigation of Face Stability in Tunnels With Unsupported Face. Geotech. Geol. Eng. 2022, 40, 355–366. [Google Scholar] [CrossRef]
  4. Ji, X.; Ni, P.; Barla, M. Analysis of jacking forces during pipe jacking in granular materials using particle methods. Undergr. Space 2019, 4, 277–288. [Google Scholar] [CrossRef]
  5. Chen, R.; Yin, X.; Tang, L.; Chen, Y. Centrifugal model tests on face failure of earth pressure balance shield induced by steady state seepage in saturated sandy silt ground. Tunn. Undergr. Space Technol. 2018, 81, 315–325. [Google Scholar] [CrossRef]
  6. Lu, B.; Jia, P.; Zhao, W.; Zheng, Q.; Du, X.; Tang, X. Longitudinal mechanical force mechanism and structural design of steel tube slab structures. Tunn. Undergr. Space Technol. 2023, 132, 104883. [Google Scholar] [CrossRef]
  7. Chen, R.-p.; Li, J.; Kong, L.-g.; Tang, L.-j. Experimental study on face instability of shield tunnel in sand. Tunn. Undergr. Space Technol. 2013, 33, 12–21. [Google Scholar] [CrossRef]
  8. Bengt, B.B.; Bennermark, H. Stability of Clay at Vertical Openings. J. Soil Mech. Found. Div. 1967, 96, 71–94. [Google Scholar] [CrossRef]
  9. Peck, R.B.; Hendron, A.J.; Mohraz, B. Deep excavations and tunneling in soft ground. In Proceedings of the 7th International Conference on Soil Mechanics and Foundation Engineering, Mexico City, Mexico, 1969; pp. 225–290. Available online: https://trid.trb.org/view/125926 (accessed on 31 March 2025).
  10. Davis, E.H.; Gunn, M.J.; Mair, R.J.; Seneviratine, H.N. The stability of shallow tunnels and underground openings in cohesive material. Géotechnique 1980, 30, 397–416. [Google Scholar] [CrossRef]
  11. Leca, E.; Dormieux, L. Upper and lower bound solutions for the face stability of shallow circular tunnels in frictional material. Géotechnique 1990, 40, 581–606. [Google Scholar] [CrossRef]
  12. Soubra, A.H. Kinematical approach to the face stability analysis of shallow circular tunnels. In Proceedings of the 8th International Symposium on Plasticity, Vancouver, BC, Canada, 17–21 July 2000; Available online: https://hal.science/hal-01008370v1 (accessed on 31 March 2025).
  13. Li, P.; Wang, F.; Zhang, C.; Li, Z. Face stability analysis of a shallow tunnel in the saturated and multilayered soils in short-term condition. Comput. Geotech. 2019, 107, 25–35. [Google Scholar] [CrossRef]
  14. Zhang, Y.; Tao, L.; Zhao, X.; Kong, H.; Guo, F.; Bian, J. An analytical model for face stability of shield tunnel in dry cohesionless soils with different buried depth. Comput. Geotech. 2022, 142, 104565. [Google Scholar] [CrossRef]
  15. Ren, D.-J.; Xu, Y.-S.; Shen, J.S.; Zhou, A.; Arulrajah, A. Prediction of Ground Deformation during Pipe-Jacking Considering Multiple Factors. Appl. Sci. 2018, 8, 1051. [Google Scholar] [CrossRef]
  16. Zhang, X.; Wang, M.; Wang, Z.; Li, J.; Tong, J.; Liu, D. A limit equilibrium model for the reinforced face stability analysis of a shallow tunnel in cohesive-frictional soils. Tunn. Undergr. Space Technol. 2020, 105, 103562. [Google Scholar] [CrossRef]
  17. Cornejo, L. Instability at the face: Its repercussions for tunnelling technology. Tunn. Tunn. 1989, 21, 69–74. Available online: http://worldcat.org/issn/0041414X (accessed on 31 March 2025).
  18. Mollon, G.; Dias, D.; Soubra, A.-H. Rotational failure mechanisms for the face stability analysis of tunnels driven by a pressurized shield. Int. J. Numer. Anal. Methods Geomech. 2011, 35, 1363–1388. [Google Scholar] [CrossRef]
  19. Senent, S.; Mollon, G.; Jimenez, R. Tunnel face stability in heavily fractured rock masses that follow the Hoek–Brown failure criterion. Int. J. Rock Mech. Min. Sci. 2013, 60, 440–451. [Google Scholar] [CrossRef]
  20. Ibrahim, E.; Soubra, A.-H.; Mollon, G.; Raphael, W.; Dias, D.; Reda, A. Three-dimensional face stability analysis of pressurized tunnels driven in a multilayered purely frictional medium. Tunn. Undergr. Space Technol. 2015, 49, 18–34. [Google Scholar] [CrossRef]
  21. Zhang, C.; Han, K.; Zhang, D. Face stability analysis of shallow circular tunnels in cohesive–frictional soils. Tunn. Undergr. Space Technol. 2015, 50, 345–357. [Google Scholar] [CrossRef]
  22. Chen, G.-H.; Zou, J.-F.; Chen, J.-Q. Shallow tunnel face stability considering pore water pressure in non-homogeneous and anisotropic soils. Comput. Geotech. 2019, 116, 103205. [Google Scholar] [CrossRef]
  23. Zou, J.; Chen, G.; Qian, Z. Tunnel face stability in cohesion-frictional soils considering the soil arching effect by improved failure models. Comput. Geotech. 2019, 106, 1–17. [Google Scholar] [CrossRef]
  24. Jancsecz, S.; Steiner, W. Face support for a large Mix-Shield in heterogeneous ground conditions. In Conference Proceeding of Institute of Mining and Metallurgy and British Tunneling Society; Springer: London, UK, 1994. [Google Scholar] [CrossRef]
  25. Horn, N. Horizontal earth pressure on the vertical surfaces of the tunnel tubes. In Proceedings of the National Conference of the Hungarian Civil Engineering Industry, Budapest, Hungary, 7–16 November 1961. (In German). [Google Scholar]
  26. Chen, R.P.; Tang, L.J.; Yin, X.S.; Chen, Y.M.; Bian, X.C. An improved 3D wedge-prism model for the face stability analysis of the shield tunnel in cohesionless soils. Acta Geotech. 2015, 10, 683–692. [Google Scholar] [CrossRef]
  27. Vermeer, P.; Ruse, N.; Dolatimehr, A. Tunnel Heading Stability in Drained Ground. Felsbau 2002, 20. Available online: https://www.uni-stuttgart.de/igs/content/publications/67.pdf (accessed on 31 March 2025).
  28. Perazzelli, P.; Anagnostou, G. Analysis Method and Design Charts for Bolt Reinforcement of the Tunnel Face in Purely Cohesive Soils. J. Geotech. Geoenviron. Eng. 2017, 143, 04017046. [Google Scholar] [CrossRef]
  29. Liu, W.; Tan, J.; Shi, J.; Huang, X.; Chen, W. A Method for calculating jacking force of parallel pipes considering Soil Arching Effect and Pipe-Slurry-Soil Interaction. Comput. Geotech. 2024, 173, 106528. [Google Scholar] [CrossRef]
  30. Molnar, K.M.; Finno, R.J.; Rossow, E.C. Analysis of Effects of Deep Braced Excavations on Adjacent Buried Utilities. 2003. Available online: https://trid.trb.org/view/696546 (accessed on 31 March 2025).
  31. Lee, K.M.; Rowe, R.K. Finite element modelling of the three-dimensional ground deformations due to tunnelling in soft cohesive soils: Part I—Method of analysis. Comput. Geotech. 1990, 10, 87–109. [Google Scholar] [CrossRef]
  32. Beer, G.; Watson, J.O.; Swoboda, G. Three-dimensional analysis of tunnels using infinite boundary elements. Comput. Geotech. 1987, 3, 37–58. [Google Scholar] [CrossRef]
  33. Kirsch, A. Experimental investigation of the face stability of shallow tunnels in sand. Acta Geotech. 2010, 5, 43–62. [Google Scholar] [CrossRef]
  34. Mair, R.J.; Taylor, R.N. Bored Tunnelling in the Urban Environment. In Proceedings of the Fourteenth International Conference on Soil Mechanics and Foundation Engineering, Rotterdam, The Netherlands, 6–12 September 1997. [Google Scholar]
  35. Liu, Q.-W.; Yang, Z.-N. Model test research on excavation face stability of slurry balanced shield in permeable sand layers. Chin. Rock Soil Mech. 2014, 35, 2255–2260. [Google Scholar] [CrossRef]
  36. Cheng, R.; Qi, L.; Tang, L.; Zhou, B. Study of Limit Supporting Force of Excavtion Face’s Passive Failure of Shield Tunnels in Sand Strata. Chin. J. Rock Mech. Eng. 2013, 32, 2877–2882. [Google Scholar]
  37. Wei, G.; He, F. Calculation of Minimal Support Pressure Acting on Shield Faceduring Pipe Jacking in Sand Soil. Chin. J. Undergr. Space Eng. 2007, 3, 903–908. [Google Scholar]
  38. Zhang, Z.; Mao, R.; Zhang, J.; Wang, X.; Zhang, M. Study on the Division of the Affected Zone under Construction Unloading and Its Construction Sequence of the Multiline Parallel River-Crossing Pipe Jacking. Adv. Civ. Eng. 2023, 2023, 1–17. [Google Scholar] [CrossRef]
  39. Tang, J.; Xu, J.; Zhou, D.; Huang, D.; Zeng, K.; Li, Y.; Chen, Z. Ground Surface Deformation Caused by Pipe Jacking Construction in a Soft Soil Area: An Experiment-Based Study. Buildings 2023, 13, 1628. [Google Scholar] [CrossRef]
  40. Wang, Y.; Zhang, D.; Fang, Q.; Liu, X.; Wang, J. Analytical Solution on Ground Deformation Caused by Parallel Construction of Rectangular Pipe Jacking. Appl. Sci. 2022, 12, 3298. [Google Scholar] [CrossRef]
Figure 1. Destructive modes: (a) active damage in chimney-like shear zones; (b) overall downward sliding active destruction; (c) passive destruction.
Applsci 15 07060 g001
Figure 2. Force characteristics of a wedge-shaped block in front of the pipe-jacking tunnel face: (a) passive damage; (b) active destruction.
Applsci 15 07060 g002
Figure 3. The trapezoidal wedge model in front of the pipe-jacking tunnel face.
Applsci 15 07060 g003
Figure 4. Mechanical equilibrium principle and calculation model of mud–water-balanced pipe-jacking tunnel face.
Applsci 15 07060 g004
Figure 5. Numerical model of three-lane parallel pipe jacking.
Applsci 15 07060 g005
Figure 6. Distribution of monitoring points in numerical simulation analysis.
Applsci 15 07060 g006
Figure 7. Plots of active support pressure versus tunnel-face displacement: (a) H s = 3   m ; (b) H s = 2   m ; (c) H s = 1   m .
Applsci 15 07060 g007
Figure 8. Plots of passive support pressure and tunnel-face displacement: (a) H s = 3   m ; (b) H s = 2   m ; (c) H s = 1   m .
Applsci 15 07060 g008
Figure 9. Relationships between different support ratios and the displacement of the tunnel face: (a) H s = 3   m ; (b) H s = 2   m ; (c) H s = 1   m .
Applsci 15 07060 g009
Figure 10. The place where the pipe jacking crosses the river: (a) section view; (b) plan view.
Applsci 15 07060 g010
Figure 11. Support pressure values on tunnel face at different jacking distances.
Applsci 15 07060 g011
Figure 12. Simple force analysis for jacking.
Applsci 15 07060 g012
Table 1. Pipe-jacking sheet parameters.
Material TypeElastic Modulus
E (MPa)
Poisson’s Ratio
μ
Volumetric Weight
γ (kN/m3)
Thickness
(m)
Reinforced concrete28,0000.2230.3
Digging machine housings206,0000.378.50.06
Table 2. Stratigraphic physical and mechanical parameters.
Parameter TypeElastic Modulus
E (MPa)
Poisson’s Ratio
μ
Cohesive Force
c (kPa)
Angle of Internal Friction
φ (°)
Volumetric Weight
γ (kN/m3)
Thickness
(m)
Filling soil8.00.271010.018.000.5~1.5
Silty chalky clay3.20.276.25.817.521.2~2.7
Clay12.00.257016.919.225.9~7.5
Silty clay11.30.254015.519.224.8~6.0
Table 3. Calculation cases.
Case
Thickness of overburden (m)3.002.001.00
Theoretical value of support pressure (kPa)88.574.360.0
Table 4. Support pressure values for different support ratios.
Support Ratio λ0.50.60.70.80.91.01.52.02.53.03.5
Support pressure/kPa H s = 3   m 44.2553.1061.8570.8079.6588.50132.75177.00221.25265.50309.75
H s = 2   m 37.1544.5852.0159.4466.8774.30111.45148.6185.75222.9260.05
H s = 1   m 30364248546090120150180210
Table 5. Calculation of upper limit, lower limit, and optimal values.
Jacking Distances (m)Upper Limit Value Pmax (kN)Lower Limit Value Pmin (kN)Optimal Value Po (kN)
1–104868.2492230.5983098.977
114777.4642158.3283012.564
124686.6792086.0592926.288
134596.0382013.9042839.876
144505.2531941.6342753.463
154394.5091849.4062672.566
164222.2201695.6032608.338
174049.6581541.5552544.110
183877.3681387.7522479.984
193704.8061233.7052415.755
203532.2431079.6582351.527
213359.954925.8551133.573
223187.391771.8071111.388
233014.829617.7601089.204
242842.540463.9571067.055
25–502669.977309.9101044.870
Table 6. Background project measurements.
Jacking Distances (m)Jacking Force (kN)Measured Value P′ (kN)Jacking Distances (m)Jacking Force (kN)Measured Value P′ (kN)
2300026394160001926
4400032784360001819
6400029174570002712
8400025564770002605
10400021954970002498
12400018345170002391
14500025095370002284
16500022425570002137
18500020365780002930
20500018895980002264
22500017826180002338
24600026756390002977
26600025686590002616
28600024616790002255
30600023546910,0002894
32600022477111,0003533
35600021407311,0003172
38600020337510,0002811
Disclaimer/Publisher’s Note: The statements, opinions and data contained in all publications are solely those of the individual author(s) and contributor(s) and not of MDPI and/or the editor(s). MDPI and/or the editor(s) disclaim responsibility for any injury to people or property resulting from any ideas, methods, instructions or products referred to in the content.

