Abstract
To investigate the degradation mechanisms of the surrounding rock in abandoned mine roadways used for oil storage, this study combined uniaxial compression tests with digital image correlation (DIC), scanning electron microscopy (SEM), and other techniques to analyze the evolution of the rock mechanical properties under the coupled effects of oil–water soaking and initial damage. The results indicate that oil–water soaking induces the loss of silicon elements and the deterioration of microstructure, leading to surface peeling, crack propagation, and increased porosity of the sample. The compressive strength decreases linearly with the soaking time. Acoustic emission (AE) monitoring showed that after 24 h of soaking, the maximum ringing count rate and cumulative count decreased by 81.7% and 80.4%, respectively, compared to the dry state. As the liquid saturation increases, the failure mode transitions from tension dominated to shear failure. The synergistic effect of initial damage and oil–water erosion weakens the rock’s energy storage capacity, with the energy storage limit decreasing by 45.6%, leading to reduced resistance to external forces.
1. Introduction
Under the “dual carbon” policy, China’s energy structure is undergoing continuous adjustments, leading to the closure of numerous mines [1,2,3]. Consequently, the development and utilization of abandoned mine spaces have become a research hotspot in China’s mining industry [4,5]. Repurposing deep abandoned mines into underground oil storage facilities promotes resource recycling [6,7]. As shown in Figure 1, an underground water-sealed oil storage is mainly composed of three parts: the oil storage system, the vertical injection and extraction system, and the water curtain system. Among them, the underground oil storage system is the core component and key carrier for underground oil storage [8,9]. The oil storage chambers are typically reinforced and modified from roadways or chambers within abandoned mines, with a water cushion layer established at the lower part of the chamber to implement water-sealed oil storage. The surrounding rock of the oil storage chamber will be soaked in oil–water for a long time [10]. However, before being abandoned, underground roadways experience stress disturbances from mining activities and overburdened loads, which damage the surrounding rock [11]. When subjected to soaking in an oil–water mixture, the stability of the damaged rock becomes difficult to ensure. Therefore, investigating the mechanical behavior of the surrounding rock under different liquid content conditions is of great significance for the construction of underground oil storage facilities in abandoned mines.
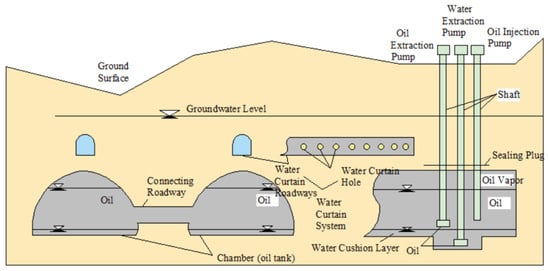
Figure 1.
Schematic diagram of an underground water-sealed oil storage cavern.
Numerous scholars have investigated the weakening characteristics and mechanisms of fluid–rock interactions in coal and rock masses. Zhang et al. [12] conducted a feasibility assessment for the conversion of an abandoned gypsum mine into an oil storage facility. Their tests indicated that the stability and sealing capacity of the hard gypsum strata were not affected by crude oil. However, water infiltration reduced the strength of the gypsum rock, potentially compromising the stability and sealing performance of the water-sealed oil storage cavern. Wang et al. [13] investigated the interaction between water and rock by comparing changes in ion concentration, pH value, and total dissolved solids in water, and mineralogical analysis of rock. Their findings revealed that water–rock interactions could lead to rock dissolution. Hua et al. [14] investigated the fracture mechanics of sandstone under cyclic wetting–drying and prolonged soaking conditions. Their research demonstrated that periodic water–rock interactions significantly affected the crack resistance of the rock, with fracture toughness decreasing notably as the number of cycles increased. Jiang et al. [15] analyzed rock microscopic test results and found that long-term water–rock coupling led to the pronounced development of rock mass cracks, poor cementation between particles, and loose overall structure, which had a negative impact on rock strength. Rabat Á et al. [16] explored the influence of water content on mechanical parameters such as uniaxial compressive strength, Young’s modulus, Brazilian tensile strength, and point load strength index. They established different negative exponential functions to describe the relationship between water content and these mechanical parameters.
A review of previous studies indicates that most research on fluid–rock interactions has focused on analyzing rock structural changes, failure modes, mechanical properties, and damage model establishment under soaking in single liquid (water) or cyclic wetting–drying conditions. However, the effects of oil–water mixtures on rock composition, fundamental mechanical properties, and the damage mechanism of damaged rock have not been systematically analyzed. At present, the research on the interaction between oil–water mixture and rock is mainly found in petroleum engineering. The research content focuses on the oil–water relative permeability curve, oil displacement technology, the oil–water occurrence state inside rock, etc., and the research results have been mostly used to increase reservoir permeability [17,18]. There are few contents related to the influence of oil–water mixture on the structure of rock components, but it is clear that the oil–water mixture will have a series of physical and chemical effects on the rock, such as the exchange of the ions on the surface of minerals and the ions in the mixture. The Ca2+ on the surface of the rock and the Na+ in the mixture can undergo significant ion exchange [19]. In addition, the behavior of expansion, dissolution, and precipitation of sensitive minerals in rocks after interaction with an oil–water mixture will change the internal structure and pore type of the rocks, thus affecting the physical and mechanical properties of the rocks [20]. The internal pores of the pre-damaged rock are more developed, and the contact area between the microstructure of the rock and the oil–water mixture is larger. At the same time, it also provides more active space for oil–water displacement, and ion exchange and rock structure change more frequently [21]. Therefore, the change of rock properties is more difficult to predict than that of single liquid (water) immersion.
To clarify how the combination of oil–water immersion and initial damage changes the mechanical behavior and structural changes of rocks in the oil storage space of abandoned mines, this study comprehensively considers both rock damage and oil–water soaking effects. SEM and energy dispersive X-ray spectroscopy (EDS) are employed to investigate the impact of oil–water soaking on rock composition and structure. Acoustic emission (AE) monitoring and digital image correlation (DIC) are used in uniaxial compression tests on soaking damaged rock samples to analyze their mechanical properties and failure characteristics, to reveal the failure mechanisms of rock under oil–water soaking, to provide a theoretical foundation for the stability control of oil storage chambers in abandoned mines, and also to provide a reference for the stability control of similar underground storages (storage of hydrogen, carbon dioxide, etc.)
2. Sample Preparation and Experimental Scheme
2.1. Preparation of Damaged Rock Samples with Different Liquid Contents
The preparation of rock samples strictly follows the International Society for Rock Mechanics (ISRM) recommendations for rock characterization, testing, and monitoring methods [22]. The end face flatness of the prepared samples is controlled within 0.05 mm, and the diameter accuracy is maintained within 0.1 mm. The rock samples are cylinders with diameter × height = 50 mm× 100 mm.
First, the rock samples were dried in an oven at a temperature of 105–110 °C for 24 h. After the drying process was completed, uniaxial compression tests were conducted to determine the average uniaxial compressive strength of the samples. Subsequently, uniaxial cyclic loading–unloading tests were performed to simulate the stress disturbances experienced by surrounding rock in underground mine roadways, thereby preparing the initially damaged coal samples. The preparation method was as follows: the loading rate of the rock mechanics testing machine was set to 0.5 kN/s, once the target pressure (60% of the peak strength) was reached, the load was unloaded at a rate of 0.5 kN/s; the loading-unloading cycle was repeated eight times (Figure 2).
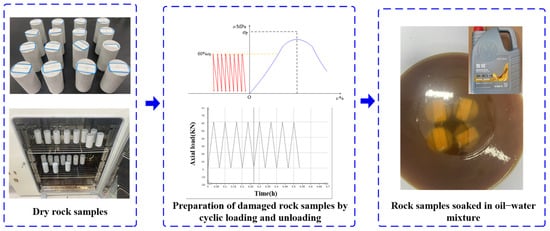
Figure 2.
Preparation of soaking damaged rock samples.
The preparation of damaged rock specimens with different liquid contents was conducted using a soaking method in direct contact with the liquid, which is more in line with the actual working conditions of underground oil storage caverns. However, during the soaking process, certain mineral components of the rock may dissolve into the liquid, which will affect the calculation of the rock’s liquid content [23]. Therefore, the liquid content of the specimens was subsequently categorized based on soaking time. In the experiment, 0W-20 automotive engine oil was used as a substitute for petroleum to prepare the oil–water mixture. Due to the difference in density between oil and water, stratification occurs when the mixture is left undisturbed. To better simulate real conditions, the oil–water mixture was allowed to settle for a period before placing the dried damaged rock specimens into the liquid for complete soaking. The soaking times were set at 8 h, 16 h, and 24 h, respectively.
2.2. Test Equipment and Test Scheme
The uniaxial compression tests were conducted using a TYJ-1500M static hydraulic testing system, which features a servo-controlled hydraulic system with a rated load capacity of 1500 kN, a stress accuracy of 0.5% of the applied force, and a strain accuracy of 0.5% (Figure 3). The displacement loading mode was selected in the uniaxial compressive strength test, the displacement rate was set to 0.002 mm/s, the preload was set to 0.05 kN, and the displacement was cleared to zero after the sample was in complete contact with the pressure plate.
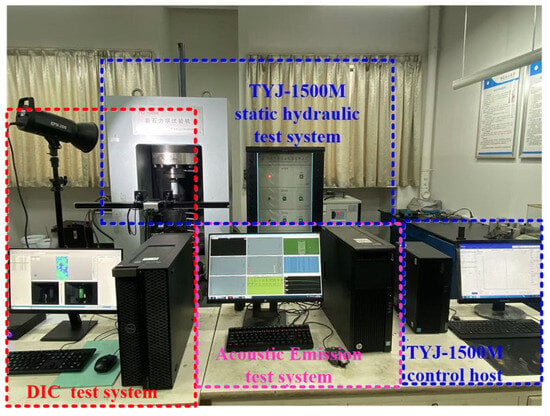
Figure 3.
Test system.
To capture the AE characteristics and full-field surface displacement distribution during the loading and failure process, a DS5 AE system and a DIC testing system were used in conjunction. AE sensors were installed on the prepared sample surfaces, and petroleum jelly was applied between the sensors and the rock surface to enhance signal accuracy. The DIC testing system employed an XTDIC setup, which consisted of two BASLER industrial cameras, a light source, and an image acquisition and processing software. During the tests, the DIC image acquisition rate was set to 10 frames per second. The accompanying software provided displacement and strain resolution at the micrometer level, ensuring high precision in monitoring the evolution of various parameters throughout the testing process.
3. The Effect of Oil–Water Infiltration on the Component Structure of Cumulative Damage Rock
To investigate the compositional and structural changes in damaged rock samples after different soaking times, EDS analysis and SEM observations were conducted using a ZEISS-sigma 300 instrument from Germany, with a magnification range of 10–200,000 times. Prior to testing, the rock samples were sprayed with gold. The EDS analysis was performed using a surface scanning method, and the results were expressed in atomic percentage. SEM observations were conducted at magnifications of 30 times and 100 times.
Figure 4 presents the EDS analysis results of damaged rock samples after different soaking times. The rock samples mainly contain elements such as carbon, oxygen, aluminum, silicon, and potassium, with oxygen being the most abundant and potassium the least. As the oil–water soaking time increases, the content of these elements changes. Silicon, as a non-metallic element, is highly abundant in the Earth’s crust. The variation in silicon content is a key indicator of rock structural changes. In nature, silicon primarily exists in the form of silicon oxides, which are widely present in various minerals. Silicon oxides influence structural characteristics by controlling mineral compositions. Since rocks contain multiple oxides, the variation in silicon content within silicon oxides was analyzed. Table 1 presents the compositional statistics of damaged rock samples after different soaking times, in which silicon content has a significant negative correlation with oil–water soaking time. As the soaking time increases, the silicon content decreases from 19.9% to 10.3%, representing a reduction of 48.2%. The decrease in silicon content indicates that with the increase of soaking time, the erosion degree of oil and water on the rock structure increases, the silicon oxide decreases, and the internal structure of the rock changes.
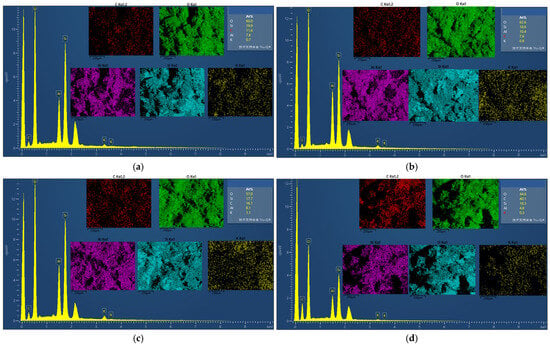
Figure 4.
EDS analysis results: (a) 0 h, (b) 8 h, (c) 16 h, (d) 24 h.

Table 1.
Statistics of rock sample components damaged with different soaking times.
Figure 5 presents SEM images of damaged rock samples after different soaking times. The surface of the dried damaged rock sample appears smooth, with distinct particle characteristics. However, due to the effects of loading and unloading, microcracks are present within the structure. After 8 h of soaking, the rock surface remains relatively smooth. Due to oil–water soaking, pits begin to appear on the surface, and the particle size significantly decreases, exhibiting a flocculent structure. This indicates that the hydrophilic substances within the sample interact with the oil–water mixture, initiating structural changes in the rock. After 16 h of soaking, microcracks and holes can be seen on the surface of the rock samples under a low magnification microscope, while deep cracks and block spalling appear under a high magnification microscope. After 24 h of soaking, the number and depth of holes on the surface of the rock sample increase further under the low magnification microscope. Under the high magnification microscope, holes left after the spalling of the block appear, more microcracks are distributed around the holes, and the characteristics of flocs below and on the right side of the holes are obvious.
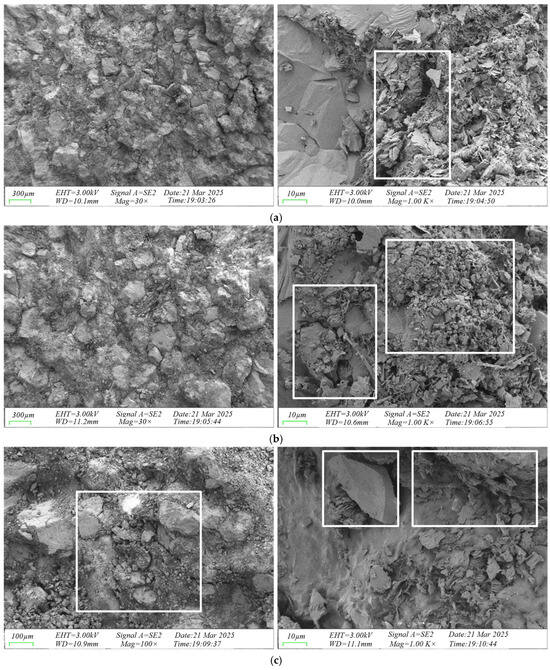
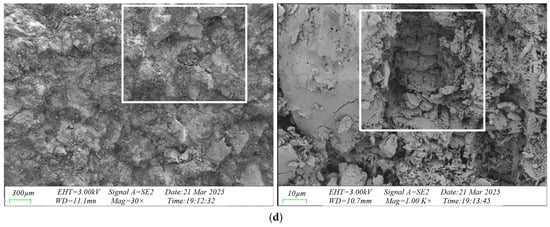
Figure 5.
SEM images of damaged rock samples at different soaking times: (a) 0 h, (b) 8 h, (c) 16 h, (d) 24 h.
By integrating the EDS spectral analysis and SEM observations of damaged rock samples subjected to different soaking times, it can be concluded that oil–water soaking reduces the content of rock components and alters the internal rock structure. First, the oil–water mixture reacts with hydrophilic substances in the rock, modifying the surface morphology and facilitating subsequent surface block spalling. Then, the oil–water mixture decomposes silicon oxides in the rock, reducing silicon content and altering the internal rock structure. Ultimately, due to the combined effects of surface morphology changes and internal structural transformations, the rock undergoes block spalling, crack propagation, and an increase in pore development, leading to significant structural changes.
Based on the aforementioned SEM results, a combined approach using fractal dimension analysis and MATLAB (Version 2016) was employed to calculate the fractal dimensions of SEM images at different soaking times, as shown in Figure 6.
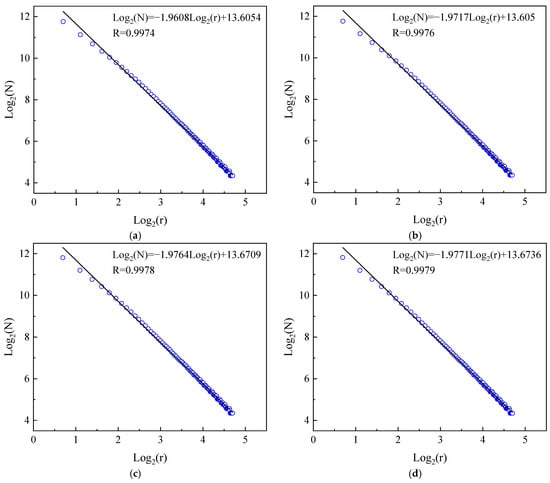
Figure 6.
Fractal dimensions of SEM images at different soaking times: (a) 0 h, (b) 8 h, (c) 16 h, (d) 24 h.
The box-counting method was used to plot the fitting curves of ln(N) versus ln(r) for SEM images of samples subjected to various soaking times. All fitting curves exhibited correlation coefficients R > 0.99, indicating that the box-counting method provides a reliable estimation of the fractal dimension.
As illustrated in Figure 7, both the fractal dimension and porosity of the damaged rock samples increased with prolonged soaking time.
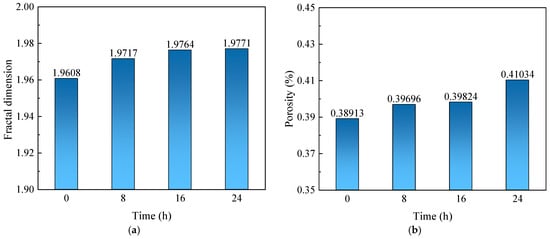
Figure 7.
Variation in specimen properties with soaking time: (a) fractal dimension, (b) porosity.
The fractal dimensions corresponding to soaking times of 0 h, 8 h, 16 h, and 24 h were 1.9608, 1.9717, 1.9764, and 1.9771, respectively.
The porosities corresponding to soaking times of 0 h, 8 h, 16 h, and 24 h were 0.38913, 0.39696, 0.39824, and 0.41034, respectively.
4. Effect of Oil–Water Infiltration on Rock Mechanical Properties
Cyclic loading and unloading tests are required to prepare initial damaged coal samples. In order to provide a stress calibration basis for the cyclic loading and unloading test, the uniaxial compressive strength of the dried intact rock sample was tested. Three intact specimens were selected for uniaxial compression testing, with the results shown in Figure 8. The stress–strain curves of the three specimens exhibit similar trends, with peak strengths of 57.1 MPa, 53.2 MPa, and 53.1 MPa, respectively, yielding an average compressive strength of 54.5 MPa. A stress level of 60% of the average compressive strength (32.7 MPa) was set as the upper limit for cyclic loading and unloading, and the specimens were subjected to eight cycles to induce damage.
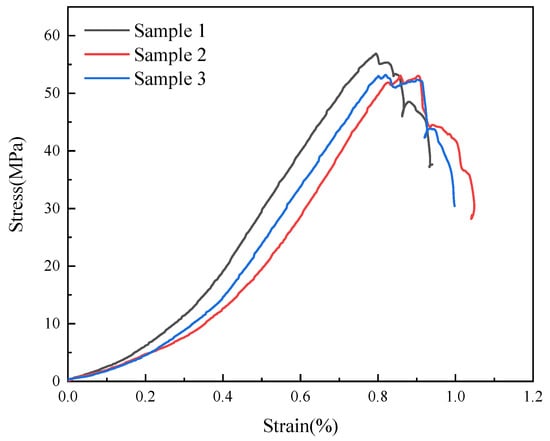
Figure 8.
Uniaxial compressive strength of complete rock sample.
4.1. Stress–Strain Curves of Damaged Specimens with Different Liquid Contents
The uniaxial compression stress–strain curves of damaged specimens with different soaking times are shown in Figure 9, with the stress–strain curve of the intact dried specimen (black) included for comparison. First, the mechanical differences between the intact dried specimen and the damaged dried specimen were analyzed. The red curve in the figure represents the uniaxial compression curve of the damaged dried specimen. Compared to the intact dried specimen, the strain required during the compression phase before the peak is noticeably higher. The intact dried specimen ends the compaction phase at a strain of 0.37%, whereas the damaged dried specimen ends at 0.49%. The peak strength also decreases from 53.1 MPa to 50.4 MPa, a reduction of 5.1%. The post-peak stress curves of both specimens drop nearly vertically, but the damaged dried specimen exhibits more pronounced plastic characteristics, with a residual strength of 35.8 MPa, lower than the 43.6 MPa of the intact dried specimen. These results indicate that the loading and unloading cycles alter the internal structure of the rock and weaken its mechanical properties. Under stress, new fractures develop inside the intact rock, and the presence of these cracks reduces the compressive strength, residual strength, and other mechanical properties, which is unfavorable for the stability of oil storage spaces.
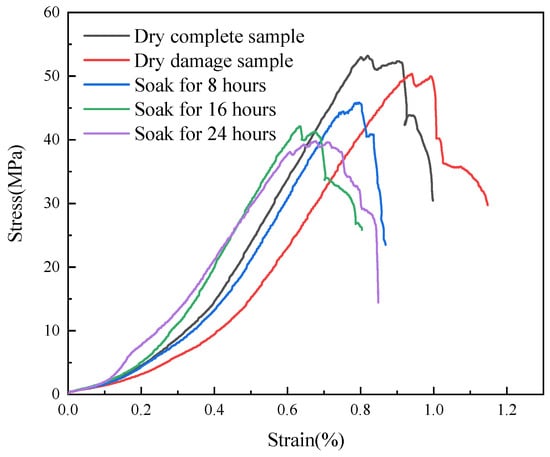
Figure 9.
Uniaxial compressive stress–strain curves of damaged specimens with different soaking times.
Regarding the impact of soaking time on the mechanical properties of damaged rock, Figure 9 shows that before failure, the stress–strain curves of all specimens exhibit similar trends. The curves of the samples were different after failure. Specimens soaked for less than 8 h exhibit a nearly vertical stress drop upon failure, indicating a distinct brittle failure mode. Specimens soaked for 16 h and 24 h show a gradual post-peak stress decline and exhibit significant residual strength, reflecting pronounced plastic characteristics. This indicates that an increase in soaking time enhances the plastic behavior of the rock specimens.
Each group of tests was carried out three times, and the analysis diagram with an error bar was drawn. The following analysis is based on the error bar base point data. As depicted in Figure 10a, the compressive strength of damaged specimens decreases with increasing soaking time, exhibiting a negative correlation. From the dry state to a soaking time of 24 h, the compressive strength of damaged specimens decreases from 50.4 MPa to 39.8 MPa, representing a reduction of 21%. This indicates that oil–water soaking significantly weakens the strength of the specimens. Figure 10b illustrates that the peak strain of the compressive strength follows a parabolic trend, initially decreasing and then increasing. According to the fitted curve, the peak strain of the compressive strength reaches its minimum at approximately 16 h of soaking. As the soaking time continues to increase, the peak strain gradually rises. From the dry state to 24 h of soaking, the peak strain decreases from 0.94 to 0.63, before increasing to 0.7, showing a downward trend with a decrease of 25.5%.
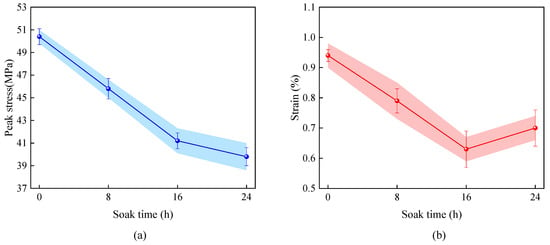
Figure 10.
(a) Relationship between compressive strength and soaking time, (b) relationship between peak strain and soaking time.
4.2. AE Characteristics of Damaged Rock Samples with Different Liquid Contents
During the uniaxial compression test, various internal events occur within the rock specimens, including the compaction of pre-existing cracks, frictional slip between cracks, and the initiation and propagation of new cracks. Each of these events generates AE signals. The variations in stress, AE ringing count rate, and cumulative ringing count over time for damaged rock specimens subjected to different soaking times in uniaxial compression tests are shown in Figure 11.
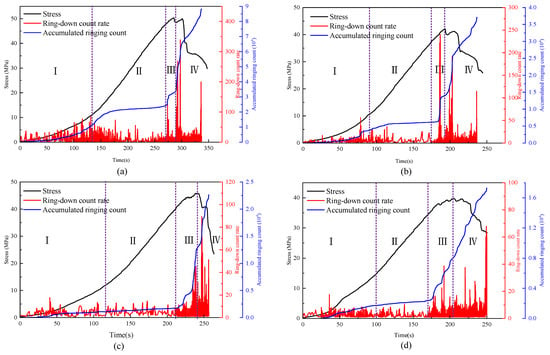
Figure 11.
Stress, AE ringing count rate, and cumulative ringing count variation curves over time for damaged rock specimens subjected to different soaking times: (a) 0 h, (b) 8 h, (c) 16 h, (d) 24 h.
From the stress–time curves in Figure 11, it can be observed that the stress change of each rock sample can be divided into four stages: compaction stage (I), elastic stage (II), yielding stage (III), and failure stage (IV). These stages are consistent with the conventional classification of uniaxial compression curves for rocks. However, due to the varying soaking times of the damaged rock samples, the AE characteristics observed during each stage are different. The following is a comprehensive analysis of the AE characteristics of the rock samples at each stage, based on the evolution of stress, AE ringing count rate, and cumulative ringing count.
- (1)
- Compaction stage (I): In this stage, the stress–time curve exhibits a concave shape, with the growth rate increasing progressively. Under the stress, the pre-existing microcracks in the damaged rock specimens become compacted. The AE ringing count rate and cumulative ringing count in dry specimens are significantly higher than those in soaked specimens. Additionally, as the oil–water soaking time increases, the proportion of time spent in this stage increases to 26%, 32%, 43%, and 40%, respectively, with a maximum increase of 65.4%. This shows that under the erosive effects of oil–water soaking, the number of cracks and pores in damaged rock specimens increases, requiring more time to compact the internal voids. Due to the presence of extensive cracks and pores, its ability to resist external forces is weakened, so the internal structure is more likely to be damaged and compacted without obvious acoustic emission signals.
- (2)
- Elastic stage (II): In this stage, stress increases linearly over time, while the AE ringing count rate remains stable and the cumulative ringing count grows linearly. As the oil–water soaking time increases, both the frequency and amplitude of the AE ringing count rate gradually decrease, and the proportion of time spent in this stage also decreases, with values of 57%, 39%, 43%, and 29%, respectively. In dry specimens and those soaked for 8 h, a slight increase in the AE ringing count rate is observed upon transitioning from the compaction to the elastic stage, accompanied by a distinct inflection point in the cumulative ringing count curve. However, this phenomenon is absent in specimens soaked for 16 and 24 h. These characteristics indicate that the crack propagation in rock specimens during the elastic stage is relatively stable, but the elastic properties of the rock gradually weaken under the erosive effects of oil–water soaking.
- (3)
- Yield stage (III): In this stage, the growth rate of the stress curve decreases, while the cumulative ringing count curve exhibits an accelerated increase, indicating a significant rise in both the number and propagation rate of internal cracks. As the soaking time increases, the duration of the yield stage also extends, suggesting that the specimens increasingly exhibit plastic deformation characteristics.
- (4)
- Failure stage (IV): At the moment of failure, the cumulative ringing count curve exhibits an almost 90° increase, while the AE ringing count rate surges sharply near the stress peak. This indicates that, upon entering the failure stage, crack development in the rock specimen undergoes a sudden transformation, and the drastic internal structural changes generate a large number of intensive AE signals.
Figure 12 shows the relationship between the maximum AE ringing count rate and the cumulative ringing count at failure with soaking time. As the soaking time increases, both the maximum AE ringing count rate and the cumulative AE ringing count at failure decrease. For the dry sample, the maximum AE ringing count rate reaches 378 counts, and the cumulative count is 88,279 counts. For the sample soaked for 8 h, the maximum AE ringing count rate is 282 counts, and the cumulative count is 37,109 counts. For the sample soaked for 16 h, the maximum AE ringing count rate is 94 counts, and the cumulative count is 22,614 counts. For the sample soaked for 24 h, the maximum AE ringing count rate is 69 counts, and the cumulative count is 17,288 counts. Compared to the dry sample, these parameters are reduced by 81.7% and 80.4%, respectively. This indicates that the “water–rock interaction” weakens the mechanical strength of the rock, and the oil–water mixture has a significant impact on the AE characteristics during the uniaxial compression process.
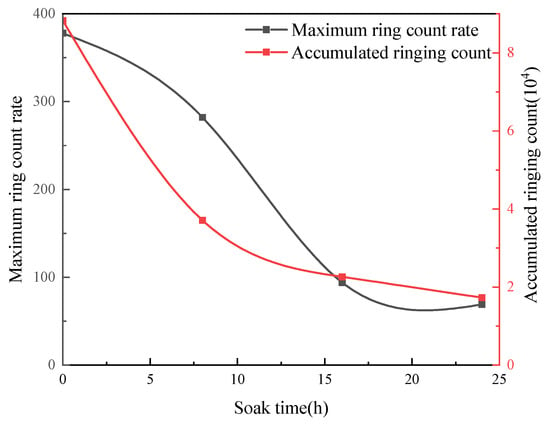
Figure 12.
Maximum AE ringing count rate and cumulative ringing count during destruction as a function of soaking time curve.
AE signals can not only characterize the time and frequency of internal rock structural damage but also reflect the types of cracks and failure modes inside the rock. This phenomenon can be used for crack characteristic analysis during the rock failure process [24]. The microcracks in the rock during loading mainly include tensile cracks and shear cracks. By analyzing the RA and AF values from the AE monitoring data, the types of internal cracks can be identified. RA (ms/v) is the ratio of rise time to amplitude, and AF (kHz) is the ratio of ringing count to duration. Research has shown that low AF and high RA values typically represent the occurrence or development of shear cracks, while high AF and low RA values indicate the occurrence or development of tensile cracks [25]. Due to the clear distinction in damage and AE characteristics of water-soaked specimens, this study used the traditional proportional clustering method to plot an AF–RA graph. The selection of K value is based on the measured maximum values of AF value and RA value of the acoustic emission signal during the experimental process, in order to determine the maximum scale values of AF value and RA value, and then determine the K value for experimental data analysis [26]. The calculated K value is 30, which meets the requirements of the general rock K value range of 1–200. Based on AE monitoring results from the experiment, the RA–AF scatter plots for rock samples in different liquid-soaked conditions are shown in Figure 13. In Figure 13, the scatter plot is divided into a tensile crack zone on the upper left and a shear crack zone on the lower right, with the coordinate axis at 45° as the boundary. Data points near the boundary line represent a mixed zone of tensile and shear cracks inside the rock sample. In the diagram, the crack sketches are shown, with red representing tensile cracks and green representing shear cracks.
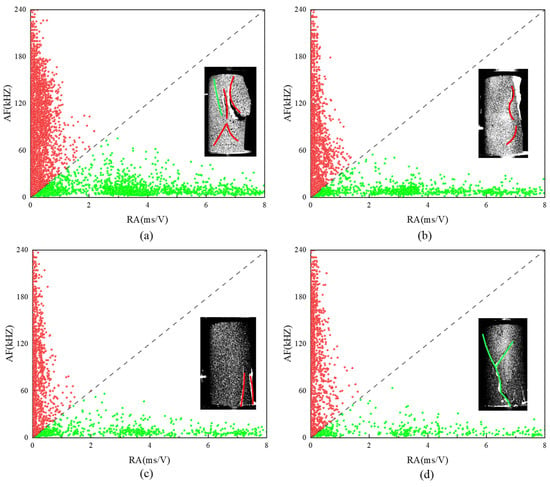
Figure 13.
RA–AF images of rock samples with different soaking times: (a) 0 h, (b) 8 h, (c) 16 h, (d) 24 h.
It can be observed from Figure 13 that under uniaxial loading, the AF values of the damaged rock samples range from 0 to 240 kHz, and the RA values range from 0 to 6 ms/v. The highest data density is near the origin, and the density gradually decreases as it moves away from the origin. In the dry state, the AF values of the damaged rock samples are mostly distributed between 0 and 180 kHz, and the RA values are mostly between 0 and 6 ms/v. The RA–AF parameters are distributed on both sides of the tensile and shear crack regions, with a wide and dense distribution of data points, indicating that the crack development inside the sample is complex, and the failure mode of the rock is a composite failure primarily caused by tensile damage. After 8 h of oil–water soaking, the AF values mostly range from 0 to 120 kHz, and the RA values from 0 to 4 ms/v. Compared to the dry rock samples, the distribution range and density of the RA–AF parameters decrease. The data points in both regions begin to shift toward the origin, indicating that the failure mode of the rock samples shifts from a mixed mode of tensile and shear failure to tensile failure. After 16 h of oil–water soaking, the AF values mostly range from 0 to 120 kHz, and the RA values from 0 to 4 ms/v. The density of the RA–AF parameters further decreases, and the failure mode of the rock sample is tensile failure. After 24 h of oil–water soaking, the AF values mostly range from 0 to 60 kHz, and the RA values from 0 to 4 ms/v. The data points near the AF axis show a decreased density, while those in the 2–4 ms/v section of the RA axis still have many data points. The rock RA–AF parameters show a typical “low AF, high RA” characteristic, indicating that the macroscopic failure mode of the rock sample is shear failure. Throughout the entire evolution process, as the soaking time increases, the data density in the shear crack region and tensile crack region gradually decreases. This is because the dry rock has a relatively complete internal structure and higher cohesion, leading to a large number of AE events during loading, which results in high RA and AF data density and a broad distribution range. However, as the soaking time increases, the number of various types of cracks inside the specimen decreases, and their distribution range becomes more concentrated towards the horizontal axis. This reduces the AE signals from the specimen, which in turn promotes the formation and expansion of shear cracks.
Generally, as the soaking time increases, the rock failure mode transitions along the path of “tensile failure → tensile-shear failure → shear failure”. However, in this experiment, the rocks had already undergone unloading and reloading damage before the oil–water soaking, so the failure mode transition path for the rock samples was “tensile dominated tensile–shear failure → shear failure”. Due to the prominent plastic characteristics of the damaged rock after oil–water soaking and the development of original cracks and voids, shear slip failure is more likely to occur.
4.3. Displacement Field Characteristics of Damaged Rock with Different Liquid Contents
The DIC 3D full-field deformation and measurement system captures the speckle patterns, and by observing the speckle measurement points arranged on the rock sample, combined with the open-source speckle processing software Matlab-Ncorr (Version 2016), the displacement field evolution on the surface of the sample during uniaxial compression can be obtained. The vertical displacement field at typical moments during the loading phase is shown in Figure 14.
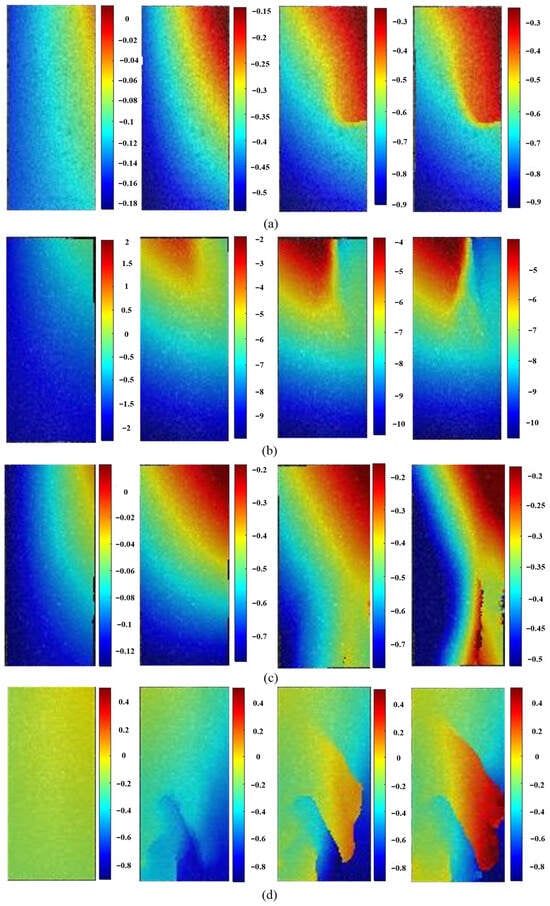
Figure 14.
Vertical displacement field cloud maps of rocks with different soaking times: (a) 0 h, (b) 8 h, (c) 16 h, (d) 24 h.
At the beginning of the loading process, all groups of rock samples are in the compaction phase, where internal microcracks, pores, and other defects are compressed and consolidated. The displacement field is uniformly distributed, and the displacement changes slightly. As the test machine continues to load, the surface displacement field of samples with soaking times less than 16 h shows a distinct boundary, where the vertical displacement from top to bottom gradually increases. The small displacement region usually appears near the top surface or in the upper-right region. However, the rock sample soaked for 24 h does not show an obvious displacement boundary, and the displacement field changes without a clear pattern. This suggests that as the soaking time increases, the internal microcracks, pores and other defects within the rock sample become more developed, making the displacement field more active. Under axial stress, the continuous change in the internal structure of the rock leads to further evolution of the macroscopic displacement field on the rock surface. The surface displacement damage characteristics begin to appear, as seen in the sample soaked for 16 h, where the displacement boundary shifts from an inclined direction to a vertical direction. The displacement increases in the lower-left corner, and the displacement is smaller in the upper-right corner. Two displacement boundary lines emerge. In the sample soaked for 24 h, displacement intrusion occurs, with varying displacement amounts in the intrusion area, leading to the subsequent appearance of macroscopic shear cracks. The final vertical displacement field distribution of each sample corresponds closely to the rock failure mode. For soaking times of 16 h or less, the rock exhibits tensile or tensile–shear failure, and displacement changes appear at the corresponding failure locations. The edge of the displacement change cloud map corresponds to the morphology and location of the macroscopic cracks. For example, the dry rock sample shows a splitting crack in the upper-right corner, and the displacement changes in the vertical displacement field cloud map in the upper-right corner are distinctly different from other areas. The sample soaked for 16 h shows a displacement shear line in the lower-right corner.
4.4. Energy Evolution Characteristics of Damaged Rock Samples with Different Liquid Contents
Material fracture failure is essentially an instability process triggered by energy. The intrinsic mechanism of rock deformation and failure is the continuous dissipation of energy, which reflects the ongoing accumulation of internal microdamage and the gradual reduction in the material’s load-bearing capacity. According to the basic laws of thermodynamics, under adiabatic conditions, the external energy input is mainly divided into two parts: one is the irreversible dissipative energy that drives plastic deformation and crack evolution, and the other is the recoverable elastic energy stored in the load-bearing structure. This energy distribution mechanism determines the development path of the rock from microscopic damage to macroscopic rupture [27,28,29,30]. The previous section’s analysis of AE is essentially a form of dissipative energy. To comprehensively explore the energy evolution characteristics of damaged rock samples with different soaking times, energy calculations were carried out based on the rock’s stress–strain curve.
As shown in Figure 15, four energy values are involved in the energy analysis of uniaxial compression: the work done by the servo testing machine (W), the elastic strain energy stored in the rock sample (Ue), the dissipative energy used for the plastic deformation of the sample and crack propagation (Ud), and the energy consumed per unit volume during deformation and failure after the peak point (Up). Therefore, the entire stress–strain curve needs to be split into the pre-peak and post-peak stages, and the energy values for each section calculated. The formulas for each energy value are as follows:
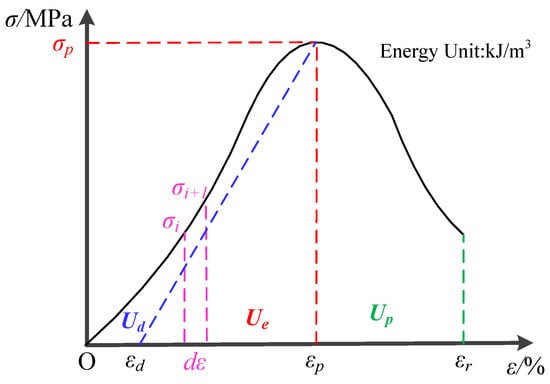
Figure 15.
Energy evolution diagram during uniaxial compression.
In the formula, σi is the stress at any point between axial stress and axial strain, MPa; σp is the peak stress, MPa; εp is the peak strain, %; E is the elastic modulus of the sample, MPa; εr is the maximum strain of the axial stress–strain curve, %.
Based on Formulas (1) to (4), the energy data for different soaking times during the uniaxial loading process of damaged rock samples were calculated, and the energy evolution trend graphs were plotted.
As shown in Figure 16, the energy evolution characteristics of damaged rock samples with different soaking times also conform to the general energy mechanism of rock failure processes. Based on the energy variation laws and their correspondence with the stress–strain relationship curve, the rock failure process is divided into the four stages below.
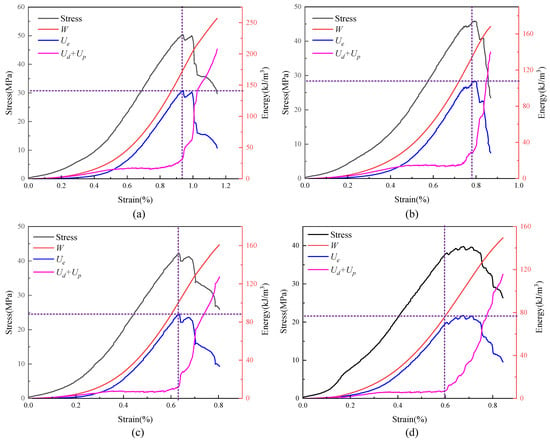
Figure 16.
Energy evolution characteristics of damaged rock with different soaking times: (a) 0 h, (b) 8 h, (c) 16 h, (d) 24 h.
- (1)
- Compaction stage: In this stage, the original cracks inside the rock sample are continuously compacted and closed under external load. The energy input from the servo testing machine is mainly stored as elastic energy within the rock, with a small amount of dissipative energy used to close the internal cracks and overcome the frictional sliding between structural planes.
- (2)
- Elastic stage: In this stage, the original cracks inside the rock are completely compacted, and the entire rock sample can be viewed as a dense elastic body. At this time, the energy input from the servo testing machine is stored entirely as elastic energy within the rock, and the dissipative energy curve is close to the horizontal line, with almost no energy dissipation.
- (3)
- Plastic stage: In this stage, new cracks begin to form inside the rock, though the number of cracks is small and the overall state remains stable. The energy input from the servo testing machine is still primarily converted into elastic energy, with a small amount converted into dissipative energy for crack formation and expansion. However, the amount of dissipative energy gradually increases.
- (4)
- Post-peak softening stage: In this stage, internal cracks begin to expand significantly, and under the influence of external loads, these cracks extend in different directions. Dissipative energy increases significantly, while elastic energy starts to decrease.
Apart from the common patterns mentioned above, there are differences in the energy evolution characteristics among the rock samples. The total energy input by the servo testing machine and the elastic energy storage limit decrease as the soaking time increases. The total energy input and the elastic energy storage limit for dry rock are 257 kJ/m3 and 141.2 kJ/m3, respectively. After the rock sample is soaked for 24 h, these two parameters decrease to 149.5 kJ/m3 and 76.9 kJ/m3, a reduction of 41.8% and 45.6%, respectively. For the dry rock sample, as well as samples soaked for 8 and 16 h, the peak stress, peak elastic energy, and the inflection point for dissipative energy growth correspond closely at the same strain value. However, for the sample soaked for 24 h, the inflection point for dissipative energy growth shifts to the yield stage of stress, indicating that oil–water soaking weakens the rock’s load-bearing structure and the ability to resist external forces. Rock is more sensitive to external energy disturbance, and smaller energy input will lead to the initiation and expansion of internal cracks in the rock.
Figure 17 shows the relationship curve between the main characteristic points in energy evolution and soaking time. It can be seen from the figure that the energy input from the external load is primarily stored as elastic energy within the rock, while most of the dissipative energy is used for rock plastic deformation, with a small amount used for rock instability and failure. As the soaking time increases, both the elastic energy storage and the dissipative energy used for rock failure decrease. The dissipative energy used for plastic deformation increases slightly before 16 h of soaking, but significantly increases when the soaking time reaches 24 h. This indicates that as the soaking time increases, the plastic characteristics of the rock become more prominent. This is because water films tend to form between crack surfaces, reducing the friction coefficient and altering the microstructure and the connection state of the mineral particles. This reduces the cohesion between the particles, making the rock more susceptible to plastic shear behavior. After entering the post-peak stage, a smaller energy input is enough to trigger the instability and failure of the rock.
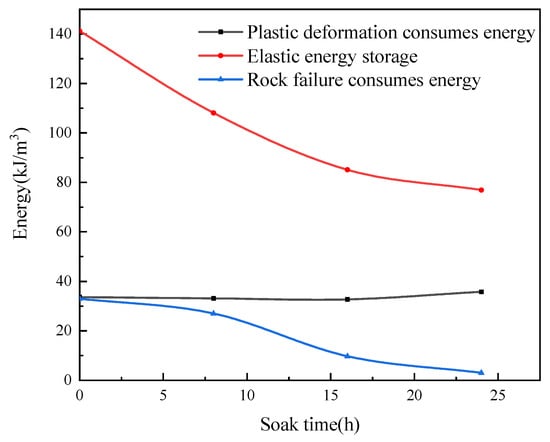
Figure 17.
Relationship curve between main characteristic points in energy evolution and soaking time.
5. Conclusions
The transformation of abandoned mine roadways into underground water-sealed oil depots has broad application prospects. Through the investigation of damaged rock samples after immersion in an oil–water mixture, the acoustic emission characteristics, surface displacement field, and energy evolution law of rocks with different immersion times were tested and analyzed; the damage characteristics of the damaged rocks under the influence of immersion time was observed from multiple perspectives. The main conclusions are as follows:
- (1)
- Long-term oil–water immersion changes the structure of rock components, which is mainly manifested in the reduction of internal silicon oxide content, crack development, and increase of pores. Furthermore, the compressive strength of the rock is reduced, and after soaking for 24 h, the compressive strength of the rock decreased by 21% compared to dry rock.
- (2)
- With increased soaking time, both the maximum ringing count rate and cumulative count at failure for AE decreased. The dry sample exhibited a maximum ringing count rate of 378 counts, with a cumulative count of 88,279. After 24 h of soaking, the maximum ringing count rate was reduced to 69 counts, and the cumulative count was reduced to 17,288, representing reductions of 81.7% and 80.4%, respectively, compared to the dry sample. The oil–water mixed liquid soaking weakened the mechanical strength of the rock samples. The RA–AF values indicated a decreasing trend in the data density of shear and tensile crack areas as the soaking time increased. The failure mode shifted from tensile dominated tensile–shear failure to shear failure.
- (3)
- With external force loading, the surface displacement field of the sample with immersion time less than 16 h appeared to be divided, the surface displacement failure characteristics of the sample began to appear gradually, and the displacement boundary changed from an inclined to a vertical direction. The rock sample with a soaking time of 24 h had a displacement intrusion phenomenon, and different displacements in the intrusion area leading to the occurrence of subsequent macroscopic shear cracks. However, the vertical displacement field distribution of each specimen at the final moment basically corresponds to the macroscopic failure mode of rock.
- (4)
- The combined effects of initial damage and oil–water soaking led to a reduction in the rock’s structural energy storage capacity. More external energy was used for plastic deformation and the development and expansion of the pores and cracks. As the soaking time increased, the ability of the rock to resist external forces weakened, and the rock became more sensitive to external energy disturbances. Even small amounts of input energy could lead to the initiation and propagation of internal cracks.
The research results of this manuscript show that soaking in an oil–water mixture has an obvious weakening effect on the mechanical properties of damaged rock. Therefore, it is necessary to reinforce damaged rock before the reconstruction of underground oil storage, such as by grouting the rock to reduce the internal cracks and increase the self-bearing capacity of the rock. In practical application, an oil–water mixture has an osmotic pressure effect on rock. This manuscript did not consider this factor, and the application of the research results may have certain limitations.
Author Contributions
Conceptualization, B.W.; methodology, B.W. and J.B.; software, B.W. and D.C.; data curation, J.C., C.Q. and D.C.; writing—original draft preparation, B.W. and C.Q.; writing—review and editing, J.B. and J.C.; funding acquisition, B.W. and J.C. All authors have read and agreed to the published version of the manuscript.
Funding
This research was funded by National Natural Science Foundation of China, grant number 52204079, the Research Fund of The State Key Laboratory for Fine Exploration and Intelligent Development of Coal Resources, CUMT, grant number SKLCRSM24KF017, Scientific Research Foundation for High-level Talents of Anhui University of Science and Technology, grant number 2024yjrc48, and Anhui Province Excellent Research and Innovation Team, grant number 2023AH010023.
Institutional Review Board Statement
Not applicable.
Informed Consent Statement
Not applicable.
Data Availability Statement
The data used to support the findings of this study are included within the article.
Conflicts of Interest
The authors declared that they have no conflicts of interest to this work.
References
- Grace, O.T.; Tomomewo, O.S.; Oni, B.A. A comprehensive review of underground hydrogen storage: Insight into geological sites (mechanisms), economics, barriers, and future outlook. J. Energy Storage 2024, 90, 111844. [Google Scholar]
- Liu, Q.J.; Wang, J.J.; Yang, K.; Di, S.J.; Dong, Z.Y. Research on the model of accurate exploitation and utilization of underground space resources in closed/abandoned mines. Coal Geol. Explor. 2021, 49, 71–78. [Google Scholar]
- Hao, X.J.; Chen, Z.Y.; Zhang, T.; Wang, Z.Y.; Ren, B.; Wu, Z.D.; Chen, K.; Zhan, R.C.; Huang, R.L. Environmental stability guarantee of underground storage in closed/abandoned mines in China: Current situation, evaluation and transformation. Sci. Technol. Rev. 2021, 39, 29–35. [Google Scholar]
- Dai, J.S.; Xia, M.Q.; Pan, L.; Guo, F.J. Analysis of comprehensive treatment of typical abandoned mines. Coal Technol. 2020, 39, 97–99. [Google Scholar]
- Xie, H.P.; Gao, M.Z.; Gao, F.; Zhang, R.; Ju, Y.; Xu, H.; Wang, Y.W. Strategic conceptualization and key technology for the transformation and upgrading of shut-down coal mines. J. China Coal Soc. 2017, 42, 1355–1365. [Google Scholar]
- Qin, Z.Y.; Gao, X.M. Research Status and Thinking about Underground Oil Storage in Rock Caverns in China. J. Chang. River Sci. Res. Inst. 2019, 36, 141–148. [Google Scholar]
- Li, Q.D. The development of underground water-sealed oil depot technology and its application prospect in China. Chem. Enterprise Mngmnt. 2017, 2017, 16–17. [Google Scholar]
- Mortazavi, A.; Nasab, H. Analysis of the behavior of large underground oil storage caverns in salt rock. J. Numer. Anal. Methods Geomech. 2017, 41, 602–624. [Google Scholar] [CrossRef]
- Chimmani, K.V.; Lokhande, R.D. Study the behaviour of underground oil cavern under static loading condition. Geotech. Geol. Eng. 2022, 40, 995–1007. [Google Scholar] [CrossRef]
- Han, G.W.; Guo, S.T.; Zhou, R. Analysis of key technology of oil storage in coal mine roadway. Hazard. Ctrl Tunn. Undergr. Eng. 2024, 6, 54–63. [Google Scholar]
- Yuan, Y.; Wang, W.J.; Yuan, C.; Yu, W.J.; Wu, H.; Peng, W.Q. Large deformation failure mechanism of surrounding rock for gateroad under dynamic pressure in deep coal mine. J. China Coal Soc. 2016, 41, 2940–2950. [Google Scholar]
- Wei, X.X.; Shi, X.L.; Li, Y.P.; Li, P.; Xu, M.N.; Huang, Y.S.; Yang, H. A review of enhanced methods for oil recovery from sediment void oil storage in underground salt caverns. Energies 2025, 18, 360. [Google Scholar] [CrossRef]
- Wang, Z.C.; Glais, Y.; Qiao, L.P.; Huang, A.D.; Liu, J. Hydro-geochemical analysis of the interplay between the groundwater, host rock and water curtain system for an underground oil storage facility. Tunn. Undergr. Space Technol. 2018, 71, 466–477. [Google Scholar] [CrossRef]
- Hua, W.; Li, J.; Dong, S.; Pan, X. Experimental study on mixed mode fracture behavior of sandstone under water–rock interactions. Processes 2019, 7, 70. [Google Scholar] [CrossRef]
- Jiang, J.; Hou, Z.M.; Hou, K.P.; Lu, Y.F.; Sun, H.F.; Niu, X.D. The damage constitutive model of sandstone under water-rock coupling. Geofluids 2022, 2022, 1731254. [Google Scholar] [CrossRef]
- Rabat, Á.; Tomás, R.; Cano, M. Advances in the understanding of the role of degree of saturation and water distribution in mechanical behaviour of calcarenites using magnetic resonance imaging technique. Constr. Build. Mater. 2021, 303, 124420. [Google Scholar] [CrossRef]
- Liu, H.; Xiong, Q.S.; Li, C.L.; Wu, S.; Yang, J.W. Study on occurrence state of oil and water in low permeability reservoir. China Energy Environ. Prot. 2021, 43, 114–120. [Google Scholar]
- He, Y.X.; Zhang, K.; Kong, D.B.; Zhang, Y.; Li, A. Study on relative permeability of oil/water/hydrocarbon gas three-phase flow under near-mixed-phase condition. J. Shaanxi Univ. Sci. 2022, 40, 101–107. [Google Scholar]
- Wu, J.Z.; Han, H.S.; Wang, B.H.; Chen, X.L. Interaction of reservoir oil/water/rock and EOR method of ion matching in low permeability reservoir. J. China Univ. Pet. 2023, 47, 116–124. [Google Scholar]
- Zhang, S.P.; Li, H.Y.; Zhang, C.Y.; Xu, F.S.; Xie, H.Z. Technical method and application for reservoir damaged identification by micro examinating rock construction. Acta Pet. Sin. 2000, 21, 52–57. [Google Scholar]
- Du, Y.S.; Yang, Y.; Guo, Y.C.; Fang, H.C.; Hu, G.; Tian, X.H. Impact of formation pressure maintenance on oil-water seepage characteristics in low permeability reservoirs. Pet. Geol. Recovery Effic. 2015, 22, 72–76. [Google Scholar]
- Hatheway, A.W. The complete isrm suggested methods for rock characterization, testing and monitoring: 1974–2006. Environ. Eng. Geosci. 2009, 15, 47–48. [Google Scholar] [CrossRef]
- Zhang, C.; Wang, L.; Wang, X.J.; Liu, J.B.; Cui, S.C.; Chen, J.X. Brazilian splitting characteristics and weakening mechanism of coal under the influence of water content. J. Min. Safety Eng. 2024, 41, 362–371. [Google Scholar]
- Shiotani, T.; Ohtsu, M.; Ikeda, K. Detection and evaluation of AE waves due to rock deformation. Constr. Build. Mater. 2001, 15, 235–246. [Google Scholar] [CrossRef]
- Aggelis, D.G. Classification of cracking mode in concrete by acoustic emission parameters. Mech. Res. Commun. 2011, 38, 153–157. [Google Scholar] [CrossRef]
- Hu, J. Precursor Evolution of Blocky Jointed Rock Mass Failure and Monitoring and Early Warning Method of Block Collapse Disasters in Tunnel Engineering. Ph.D. Thesis, Shandong University, Jinan, China, 2021. [Google Scholar]
- Walsh, J.B. Energy changes due to mining. Inter. J. Rock. Mech. Min. Sci. Geomech. Abstr. 1977, 14, 25–33. [Google Scholar] [CrossRef]
- Salamon, M.D.G. Energy considerations in rock mechanics: Fundamental results. J. S. Afr. Inst. Min. Metall. 1984, 84, 233–246. [Google Scholar]
- Napier, J.A.L. Energy changes in a rockmass containing multiple discontinuities. J. S. Afr. Inst. Min. Metall. 1991, 91, 145–157. [Google Scholar]
- Onur, V.; Zhang, C.G.; Ismet, C.; Bruce, H. Numerical modelling of strength and energy release characteristics of pillar-scale coal mass. J. Rock Mech. Geotech. Eng. 2019, 11, 935–943. [Google Scholar]
Disclaimer/Publisher’s Note: The statements, opinions and data contained in all publications are solely those of the individual author(s) and contributor(s) and not of MDPI and/or the editor(s). MDPI and/or the editor(s) disclaim responsibility for any injury to people or property resulting from any ideas, methods, instructions or products referred to in the content. |
© 2025 by the authors. Licensee MDPI, Basel, Switzerland. This article is an open access article distributed under the terms and conditions of the Creative Commons Attribution (CC BY) license (https://creativecommons.org/licenses/by/4.0/).