1. Introduction
Due to the growing number of residential buildings and ongoing urbanization, the current number of these devices is undoubtedly greater. Elevators today serve not only as vertical transportation systems but also as a critical factor in enhancing building accessibility for people with disabilities. Furthermore, in multi-story buildings, elevators become an indispensable part of the infrastructure. These devices are also one of the fundamental tools for enabling the mobility of elderly individuals, a factor of increasing importance in the context of Europe’s aging population.
As the significance of elevators for modern life increases, so do the demands imposed on these systems. Key considerations include technical parameters such as load capacity, travel speed, lifting height, and energy efficiency. Ensuring user comfort also requires an appropriate control algorithm and an optimized speed curve. Another crucial factor is the reliability of these systems, and the downtime associated with potential failures.
Although elevators are now commonplace in many buildings, they continue to be complex electromechanical systems. Failures can result not only in material losses but also pose safety risks to passengers and their property. This also ties into psychological aspects, as the enclosed space of an elevator cabin can induce stress and severe psychological discomfort during extended periods of entrapment caused by malfunctions. For these reasons, planning an appropriate maintenance strategy for elevator systems and implementing methods for rapid fault detection and identification become critically important challenges.
According to the data in [
1], cabin door failures account for a significant percentage of all defects occurring in elevators, especially those related to improper use or maintenance. The authors in both [
2] and [
3], indicate that elevator cabin door system failures can account for up to 80% of all elevator system failures. Elevators are now common in many buildings and are complex electromechanical systems, whose failures can lead not only to property damage but also put traveling passengers at risk. Due to the complex structure of elevator systems and bearing in mind their important role in the life of modern man, many attempts have been made to develop solutions to diagnose failures of their components. Failure analysis is possible on the basis of the measurement data of equipment operating parameters and historical information about failures. In order to call the obtained results authoritative, it is necessary to collect a sufficient amount of data representing each case of failure and the accompanying conditions. This is crucial for finding potential causes of failure and its symptoms, therefore, building systems that allow data acquisition and storage has become an important direction of development for elevators. The dispersed nature of the location of the manufacturer’s elevators indicates that data acquisition from various devices must be performed remotely. An example of such a system can be found in [
4]. The increase in popularity of remote data acquisition and monitoring systems for elevators has also led to the development of fault detection systems. In the publication from [
5], the authors developed a system that collects elevator operational data, such as door opening signals, door closing signals, internal control signals, and the elevator stop signal through an IoT module. The data was then analyzed to verify whether the current elevator stop is caused by power loss and to monitor the presence of trapped passengers in the cabin. In addition, authors in [
6] presented attempts to develop a system for measuring vibration levels and acoustic signals using a smartphone, which then sent data to a central server. I. Skog in [
7] modeled elevator traffic intensity as an inhomogeneous Poisson process and then used a generalized linear model to describe how the intensity of the process changes over time. Furthermore, he used statistical tests to determine whether an elevator is stationary for an unusually long time. The application of the proposed method was illustrated by an example in which detected faults were compared with the elevator’s service log.
One of the best known ways to analyze the state of electromechanical systems for proper functioning is spectral analysis using vibration signals [
8]. For this analysis, it is necessary to measure the vibration level in three axes of the device in question. In the case of an elevator, spectral analysis makes it possible to extract the frequencies characteristic of the movement under normal conditions, as well as emergency conditions. Frequency analysis of vibration signals can suppress noise created during measurements, preserve phase information, and describe non-linear couplings between signals [
9]. The authors in [
10,
11] additionally used a bi-spectrum autoregressive model for their analysis. They emphasize that the shapes and distributions of AR spectrum peaks are clearly different for normal and damaged elevators. Spectral analysis using acoustic or vibration signals; however, requires measurements to be made at high sampling rates so that spectral changes at different frequencies can be captured.
Machine learning is one of the most modern methods used in diagnostics and fault detection of many devices, including elevators. Due to the wide choice of algorithms and the ability to operate on data extracted from functioning equipment, machine learning has gained popularity in the scientific and business world. Mishra and Huhtala employed a feature extraction structure based on autoencoders, followed by fault detection, using random forests in three of their studies. In [
12], together with Krogerus, they used accelerometer signals for fault detection. Subsequently, in [
13], they proposed the extraction of elevator ride profiles and incorporated additional magnetic signals for detection. In [
14], they improved detection accuracy by omitting both the ride profiling and magnetic signals, and presented results obtained from a larger dataset collected over nine months from three elevators, validating the method on entirely new data. Based on the collected data, the researchers applied a feature extraction method using a deep autoencoder. The algorithm is an example of an unsupervised artificial neural network [
15], whose task is to efficiently encode data into a form with fewer dimensions. This approach allows extraction of the most characteristic features of a given set. The features created by the autoencoder that characterize the moving elevator were used for binary classification using a random forest algorithm. The same authors also attempted to use other classifiers, such as multilayer perceptron [
16]. The authors in [
17] used accelerometer measurements and a convolutional neural network with one-dimensional convolution layers for fault diagnosis, whose parameters were selected using particle swarm optimization. A different approach to fault diagnosis of the elevator main drive was presented by the authors in [
18], who used elevator vibration signals and then subjected them to noise reduction using wavelet functions. The authors also proposed feature extraction related to the signal envelope and classification, using a stochastically constructed neural network. The idea behind this model is to configure the network randomly with limited need for human intervention. Instead of training a model with a fixed architecture, the process of constructing a neural network starts with a structure of small size and then incrementally adds hidden nodes until acceptable results are achieved. This approach does not require any prior knowledge of the network complexity for a given task [
19]. Raia et al. [
20] used machine learning to monitor the state of a sheave–rope transmission.
The literature also includes ways to diagnose elevator failures using methods that combine signal processing theory and machine learning algorithms. Xu and Huang [
21] used the autoregressive coefficient of signals as an input value to a support vector machine. Vibration signals in elevator fault diagnosis are also used as input features to algorithms, such as neural networks [
22] in traditional and fuzzy versions [
23], as well as convolutional neural networks [
24].
Another way to diagnose the elevator main drive was presented by Flores et al. [
25] using an induction electric motor that is the elevator’s main drive component for analysis. The authors noted that faults in shaft guides are associated with an increase in friction in vertical motion, which is perceived by the motor as an increase in load torque. They used current signature analysis to detect such faults. To do this, they measured the current signal at a sampling rate of 1 kHz and then calculated the root mean square for every 20 samples of the signal. Then, by comparing the signals of a normally functioning and damaged elevator, it was possible to determine where the guides had degraded.
The literature also shows interest in more challenging methods such as image analysis and transfer learning. The authors in [
26] used images of ropes in an elevator shaft and an autocorrelation model to analyze their damage. In contrast, researchers in [
27] estimated the remaining useful life of an elevator based on acoustic measurements of various elevators, using transfer learning and algorithms, such as Graph Neural Network and Long Short-Term Memory Network.
Among the most sensitive points of the elevator system is certainly the brake, which provides additional protection for the elevator in the event of power loss. The authors in [
28] used an Ishikawa diagram, also known as a fish diagram, which is used for cause-and-effect analysis, to study elevator brake failure. It provides a visual representation of the various events’ causes and suggests solutions to problems. The authors describe the method in two steps. The first is a problem cause analysis, including their hierarchical division and the selection of relevant factors. Then a fish diagram is drawn, in which the most important causes of errors are written on the main bones, and then following down the hierarchy, smaller and smaller bones are drawn. The presented method, of course, requires expertise in the construction and operation of lifting equipment. An in-depth analysis of the phenomena occurring in these systems makes it possible to correctly develop the diagram, taking into account the effects and causes. In addition, it is worth noting that, depending on the type of damage, it may be necessary to build multiple diagrams, since failures differ not only in their potential effects, but also in their level of harm to the entire system.
Failure diagnosis methods that require expert knowledge include fault trees. Trees are built for individual failures, with each tree designed to identify and prioritize potential causes of failures. Primary incidents represent the causes of failures or other events and can be directly related to a particular piece of equipment. Incidents are then grouped into so-called cut sets, which arise when several basic events occur and cause another phenomenon. Such a cause-and-effect relationship between events leads to the localization of system weak spots. In addition, in this way, it is possible to determine what is the minimum path that leads to the occurrence of failure. Fault diagnosis using fault trees also implies estimating the probability of individual events, which leads to the development of a procedure for searching for a faulty component. The authors in [
29] emphasize that such searches can be very costly, as checking for individual events often involves tests that are time-consuming (resulting in downtime costs) but also require activities such as entering the elevator shaft. Therefore, researchers are trying to develop trees in such a way that the troubleshooting procedure is as efficient as possible. Reliability analysis is sometimes not feasible when there are difficulties in obtaining the exact probability of base events for an elevator system. In such cases, it may be reasonable to use fault trees built using fuzzy logic [
30].
The high complexity of elevator systems makes the identification of potential failures and their causes a complicated issue, although of course this is highly dependent on the manufacturer and design of a particular device. Researchers in [
31] study the effect of the pressure difference caused by the stack effect on the occurrence of the cabin doors re-opening problem. The problem stems from the fact that the increased pressure difference between the corridor and the elevator shaft causes an increase in motion resistance when the door closes, which can be interpreted by the control system as blocking the door and trigger re-opening. Zhang and Zubair [
32] identified a total of 17 different elevator system faults, four of which were related to the cabin door drive and four to the corridor-side access door. The authors listed the following fault categories for both of these systems: mechanism failure, instrumentation defect, blockage, and other. As noted in the introduction to this paper, wide-ranging defects in the cabin doors of passenger elevators are among the most common elevator failures [
33]. Therefore, in the scientific world, one can also find many attempts to diagnose passenger elevator cabin door failures, which are expected to contribute to increasing the reliability of these devices and improving maintenance efficiency. One such attempt using multi-agent systems is presented in [
34].
Due to its high efficiency, machine learning was also used to diagnose the failures of elevator cabin door drive systems. In [
35], the authors developed a model to diagnose mechanical faults associated with different types of door blocking. Among them, they distinguished—normal operation of the drive, using hand to block the door, blocking object in the door gap, object directly blocking the door. The authors used the electrical and mechanical parameters of the device’s operation and past maintenance data sampled every 40 ms and then, using the sliding window technique, they calculated and added statistical features for a window length from 1 to 12 s. The authors compared the performance of four machine learning methods, with the best results obtained by the XGBoost algorithm (more than 90% classification accuracy with an F1 score of about 90%). However, the paper did not address the problem of strong class imbalance in the dataset, which is always present in real fault databases. Diagnostics of faults related to mechanical drive-blocking and caused by human factors are presented in [
36]. The authors used operational and maintenance data of the elevator sampled at 100 Hz and then applied a convolutional neural network for feature extraction, which was then used to train a random forest cascade model. The final model contained 4 layers, each of which generated 201 random forests. The authors obtained high classification efficiency, but the article lacks information regarding the feasibility of implementing the developed method, which may have to do with its high level of complexity. In addition, the researchers also did not take into account the uneven distribution of classes in the dataset. The researchers in [
37] developed a model for elevator door fault detection by focusing only on the door’s locking mechanism. For this purpose, they used neural networks optimized using an MPGA (multi-population genetic algorithm). Failure identification of the elevator cabin door drive divided into normal driving with completion, normal interrupted by the user, and abnormal driving (with failure) is presented in [
38]. The researchers used 17 different quantities characterizing the operation of a passenger elevator cabin door sampled at a frequency of 8 Hz. Then, they used an autoencoder for feature extraction and a support vector machine for classification. The selection of the model’s hyperparameter values was performed using Bayesian optimization and k-fold cross-validation. It is worth mentioning that the authors obtained high efficiency (average F1 above 0.99) despite the inclusion of class imbalance.
The above review of the world literature in the field of passenger elevator malfunction diagnostics shows the lack of a comprehensive study of the most frequently failing system, which is the cabin doors. Although this topic has been known in principle since the early days of passenger elevators, only recently have attempts been made in the world literature to use modern diagnostic tools to improve the reliability of these devices and streamline the maintenance process. Among the studies reviewed, the vast majority focus attention on a single component of the system (for example, the locking mechanism) or carry out detection, distinguishing only failures related to door blocking. Other articles present a classification with a distinction between normal and emergency operations. Such an approach, however, does not allow the development of a system that would inform the elevator maintainer which component has most likely failed. In addition, not all researchers have taken into account in their studies the problem of class imbalance associated with the fact that under the conditions of normal operation of any system, faults occur occasionally and are a minority among the operating data of equipment. It is also worth mentioning that methods such as fault trees, despite the fact that they provide information about the potential causes of each component’s failure, are not based on the actual measurement data of the device and require verification tests to be performed. Another problem of some of the methods outlined above is the need to perform measurements at high frequency, which in the case of remote acquisition can be very costly since such a large amount of data collected for many devices would require huge disk spaces or cloud storage. An additional consideration in the case of a large number of measurements is the necessity to transmit them over an internal elevator bus, which has a limited throughput. The flow of data on this bus must not be disrupted, as the most important information on the operation of the device is transmitted there. Any problems caused by excessive load on the transmission can result in malfunctions.
Key contributions and novel aspects of this article are as follows:
Inclusion of a comprehensive dataset encompassing 10 distinct types of elevator door failures to ensure robust and diverse failure modeling and development of a data preprocessing method to reduce the amount of data transmitted, ensuring that diagnostic data transmission does not overload the CAN bus, which is shared with other critical elevator components.
Comparison of fault identification effectiveness across different machine learning algorithms, including logistic regression, decision trees, support vector machines, stochastic gradient descent (SGD) classifiers, random forests, and gradient boosting. Additionally, hyperparameter tuning and validation of results were performed.
Proposal of a practical implementation strategy for deploying the developed data preprocessing method directly on the elevator door drive controller for real-time diagnostic applications.
Figure 1 presents the chronological diagram of the proposed method. Initially, a test stand was built with a prototype elevator door drive system. Next, the most common failures in such systems were identified, and measurements were taken for normal operation and various types of faults. The data was then preprocessed and prepared for modeling using machine learning methods. Different data reduction techniques were also compared, including a custom method that reduced data volume by aggregating statistical features such as the mean and standard deviation. In the next stage, the effectiveness of seven machine learning algorithms was tested, hyperparameter tuning was performed, and the results were evaluated. Finally, the developed data reduction method was implemented on the cabin door drive controller. A detailed description of each stage of the work is provided in the following sections of the article.
The structure of the remaining part of the paper is as follows:
Section 2 presents the data acquisition process, preprocessing methods, and the performance metrics used to assess fault diagnosis effectiveness.
Section 3 provides a comparison of the fault detection performance of seven different machine learning algorithms.
Section 4 describes the implementation of the original method for reducing the amount of data transmitted by the elevator cabin door drive controller.
Section 5 contains the summary, and
Section 6 outlines the limitations of the proposed method and the planned future work.
2. Data Collection and Preprocessing
2.1. Data Collection
In properly designed equipment, failures should be incidental events. For this reason, collecting a sufficiently comprehensive database of elevator cabin door faults can be a long-term process. In addition, most faults depend on the machine’s depletion rate and intensity of use. This means that the implementation of the measurement system should first be carried out on older equipment, thus interfering with the already existing system, which is a significant complication. On the other hand, deliberately triggering elevator failures to record their symptoms can lead to accelerated aging of the device’s components, as well as cause downtime in normal operation. Therefore, it was decided to build a test stand with the prototype cabin door drive system shown in
Figure 2.
At this stage, the question of distinguishing between two types of doors found in elevators needs clarification. The first is the shaft door, which is installed on each floor and is an external element visible to the user. Their main function is to prevent unwanted access to the shaft, mainly in situations when the cabin is in motion or on another floor. Shaft doors do not have their own propulsion system, but only a mechanism that allows them to produce a closing moment when the cabin is outside the landing. This system takes the form of a spring or weight attached in such a way as to cause the door to close automatically. It is worth mentioning that the mechanism also places an additional load on the cabin door drive system (stretching the spring or lifting the weight). Reflecting this system on the test stand is the element marked with the number 6. Access to the inside of the elevator cabin is provided by the cabin door, the only pair which moves along with the elevator cabin and has its own drive using an electric motor. The mechanical coupling between the two types of doors is carried out by a special mechanism 2. This system has guides that move away from each other when the doors are fully closed and locked. When the elevator reaches the corresponding floor, a roller, which is part of the shaft door, enters between the guides. Then, when the door opens, the guides close, tightening the roller and coupling the two mechanisms together. This allows for coordinated movement of the doors and also prevents them from opening at the wrong moment. As already mentioned, simply closing the doors is not sufficient enough to ensure the safety of passengers in a moving cabin. An additional form of protection is provided by locking the door to prevent it from opening. The locking system 3 is also coupled with the guide mechanism of the shaft door connection. The main drive of the cabin door consists of a permanent magnet synchronous motor 5 equipped with an absolute encoder and a controller 8 that simultaneously performs other functions related to the operation of the drive system, such as communication with the main lift module. A toothed pulley has been placed on the shaft of the motor. On the other side of the door mechanism, there is a second pulley on a bearing-supported axle, which during the tests was replaced by a PMSM motor 1 from PERFOPOL, Starachowice, Poland used to simulate bearing failure by introducing an additional load torque depending on the angle of rotation and controlled by controller 10. The actuator that enables the door to move is a toothed drive belt 4. The test bench is also equipped with a measurement system, which consists of temperature sensors LM35 from Texas Instruments, Dallas, TX, USA placed inside the drive motor and under the mount of its controller, a triaxial accelerometer 7 ADXL345 from Analog Devices, Cambridge, MA, USA that allows measurement of vibrations on the door beam, and a microcontroller STM32F302 from ST Microelectronics, Geneva, Switzerland, equipped with 12-bit analog-to-digital converters, for acquisition of measurement data. In order for the drive system to work properly the cabin door drive controller measures phase currents, supply voltage, speed and motor shaft position. It was decided to use the existing measurement part of the drive controller and modify its software so that the measured values could be sent via the CAN bus to the controller collecting the data.
The system described above made it possible to trigger different types of faults and make measurements of the most important diagnostic parameters. In contrast to diagnostic methods based on the measurement of motor phase currents, it was decided to use the available information on the d-axis and q-axis components of motor current. These values, unlike the motor phase currents, are not alternating values, which makes it possible to reduce their sampling frequency.
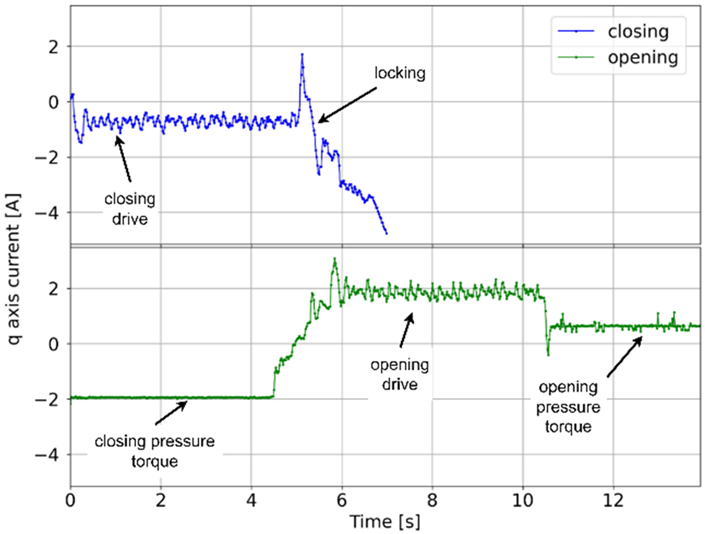
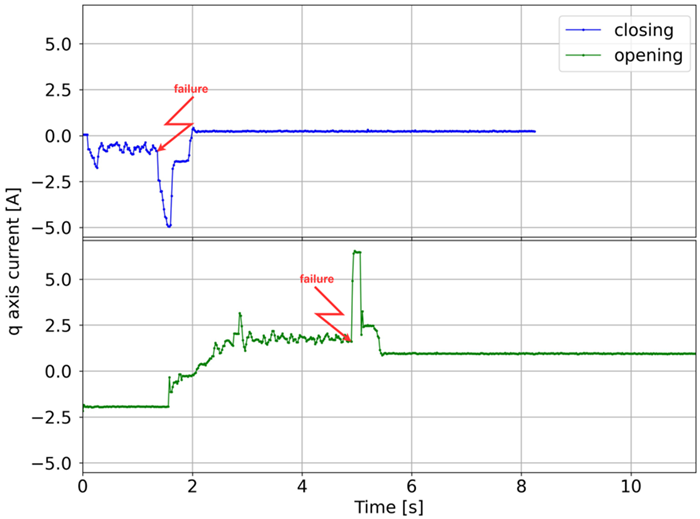
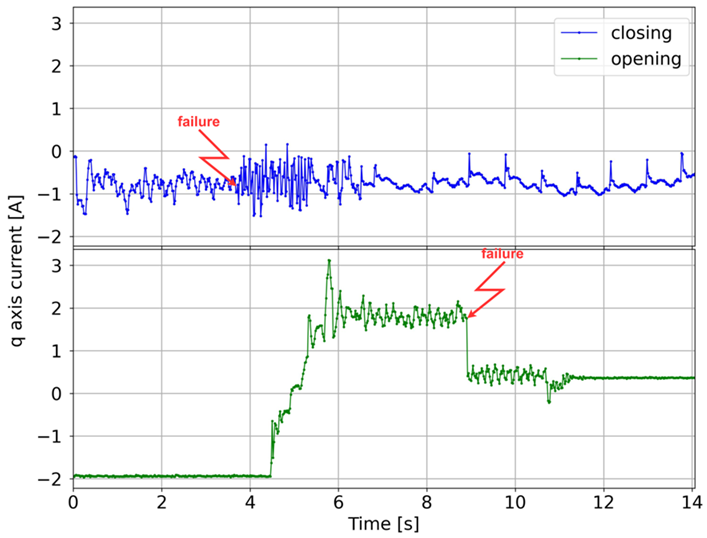
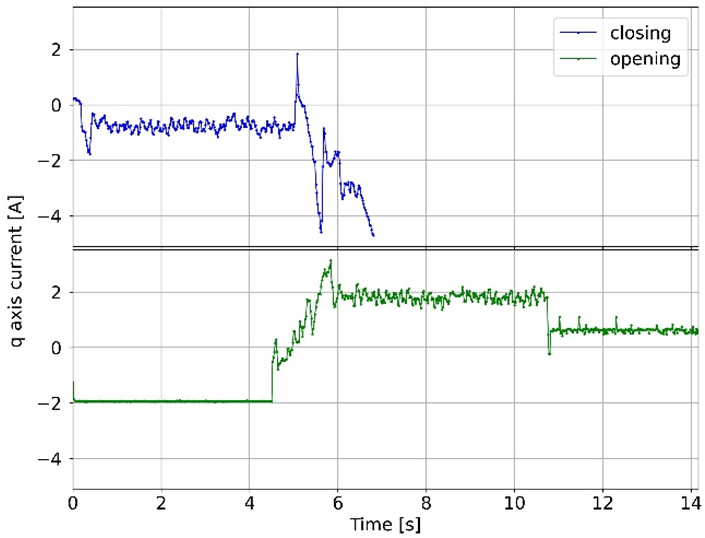
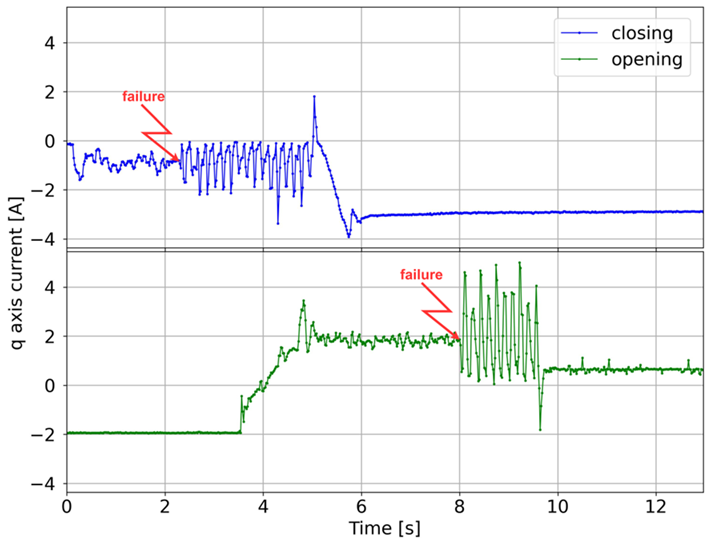
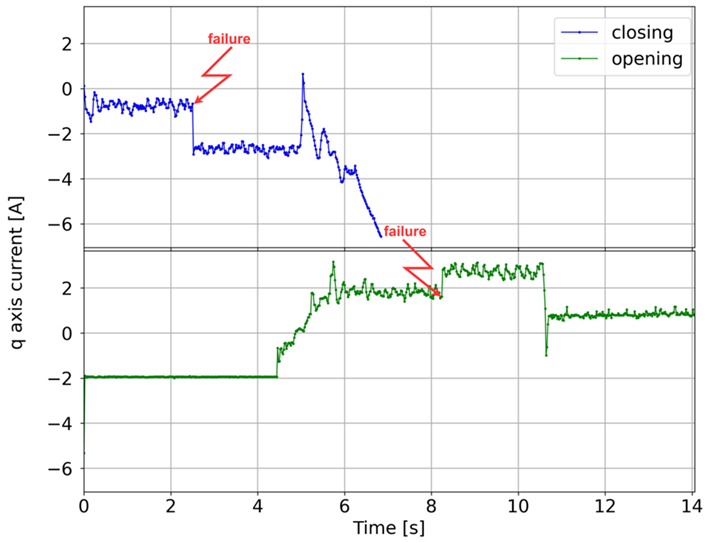
The analyzed failures, along with their frequency of occurrence and graphs of the q-axis current component for opening and closing, are shown in
Table 1. For malfunctions that have the character of sudden events, the red line indicates the moment of occurrence. In other cases, the graphs show faults that are the result of progressive degradation of individual components of the elevator door drive, the symptoms of which occur during the entire door cycle, i.e., closing or opening. Additionally, the characteristic fragments related to the door drive operation are marked on the normal operation charts (without damage).
One of the most important diagnostic parameters in the failure analysis of drive systems is the q-axis current component, since it reflects the torque developed by the motor. During the study, the phase currents of the PMSM motor were measured, and the d- and q-axis current components were calculated using the Clarke and Park transformations ([
39]), which was necessary in the FOC (field oriented control) process. Additional diagnostic parameters were the output signals of the PI controllers, the voltage measured by the control system, as well as quantities related to the movement of the cabin door, such as speed, position, and direction of rotation. Based on the previously conducted analyses presented in [
40] it can be concluded that a significant proportion of drive system failures result in excessive temperature rise in their most important components, such as the motor and the controller. For this reason, the measurement system was equipped with analog sensors for the temperature inside the motor and the control converter. The sensors were connected to the inputs of the analog-to-digital converter of the measurement microcontroller. In addition, a literature review concluded that a signal of the system’s vibrations could be an important parameter in terms of the possibility of identifying faults. The stand was therefore supplemented with a three-axis accelerometer located on the mechanism’s beam, sending information about accelerations in three axes via the SPI bus. Data acquisition was carried out using STM Studio v3.6.0 software, dedicated to viewing and logging data to a text file. Measurements were taken in normal operation and for the cabin door faults described earlier, resulting in a total of more than 3.9 million data records, which were given labels related to the operating states of the drive system.
In the first stage of data processing, records containing missing measurements that may have occurred under the influence of a malfunctioning measurement system were removed. These records accounted for 0.008% of the total measurement data. Due to the lack of a sensor providing information about the reference (ambient) temperature, it was decided to convert the temperature measurement results into their derivative after time. This made it possible to make the measurements independent of changes in ambient temperature between measurement series while retaining information about rapid temperature changes occurring during faults. In addition, taking into account the sensitivity of the acceleration measurement system to factors from the environment, acceleration measurements were made with the drive turned off before the actual tests. This made it possible to determine the level of vibration caused by the surroundings, that is, nearby traffic routes and other equipment operating in the building.
Fault identification models using machine learning methods require the collection of a sufficiently large dataset that contains representative examples of all considered types of device faults. Due to the nature of the signals associated with the occurrence of some faults, it is necessary to obtain measurements at a frequency sufficient to capture all the necessary information. The maximum measurements sampling frequency was 50 Hz, due to the limitations of the measurement system in terms of data transmission capabilities, but this value is similar to those used in the literature. In addition, based on an analysis of the cabin door control software, 11 of the diagnostic quantities available in the module were selected, which could have a significant impact on the ability to identify faults. In the normal operation of a passenger elevator, data from individual modules (such as the main module, cabin door controller, and cabin and floor modules) are transmitted via an internal CAN bus, the speed of which is 125 kbps due to length limitations (the bus connects multiple modules located throughout the whole elevator shaft). The elevator’s internal bus is the place where all information on the functioning of the elevator and its most important components is exchanged, so its operation must not be disturbed by an excessive amount of transmitted diagnostic data, as this could lead to delays or errors in the transmission of data crucial to the proper operation of the entire system. Transmission of the selected diagnostic data via the internal elevator bus would require transmission of 32 kb per second (11 4-byte variables plus overhead due to the CAN frame structure, every 20 ms), which is more than 25% of the throughput of the internal CAN bus. Obviously, such a high load on the bus by only one function of a single module is unacceptable and could overload the transmission. The collection of the device’s operational data at high frequency leads to the need for frequent uploads and the collection of significant amounts of information on the main server, which contains a constantly updated fault database. Taking into account the above values, it can be determined that transferring data from such an elevator to the central server would require about 10 GB of transfer per month over the GPRS network for just one device. In addition to the required transfer, it would be necessary to provide adequate disk space necessary for data storage. For one elevator, this would be about 124 GB per year, which, with an estimated production of 700 units, results in about 87 TB of memory to be filled. Given the ever-increasing number of devices being produced, the number of resources needed to store this data would be enormous and very expensive. Therefore, there is a need to reduce the amount of diagnostic data sent via the elevator bus and stored on a central server. This task became the basis for the study of methods for preprocessing information from the cabin door drive system of an elevator.
2.2. Metrics and Validation
The selection of an appropriate data preprocessing method, as well as the machine learning algorithm and its hyperparameters, is possible after a series of trials testing the performance of the model for different settings. In order to analyze effectiveness, it is required to determine performance metrics that most reliably reflect the actual behavior of the model in the face of new data. In properly functioning systems, faults are sporadic events, the frequency of which depends on the depletion of the device, the maintenance performed, and the intensity of use. It follows that among the operating data of the drive system, failures will be a significant minority of the normal operation samples. In such a case, the algorithm can be trained to obtain a very good percentage of correct classifications (it will correctly classify most samples), but not actually detect a single failure (samples marked as normal operation will be correctly classified). Therefore, verification of the model’s performance cannot be obtained only on the basis of accuracy, i.e., the percentage of correctly classified samples. Developing an effective fault identification model requires finding the right compromise between precision and sensitivity. It is essential that the model detects as many faults as possible while generating few false alarms. A measure that reflects the ratio between sensitivity and precision is the F1 score. The F1 score calculated for each label, and finding unweighted mean, was used to analyze the performance of each classifier model.
Data preprocessing method tests that allow reducing the amount of data used for modeling were carried out using simple machine learning algorithms, such as linear regression, logistic regression, and decision tree. The selected algorithms form the basis of more advanced methods, which improve them while allowing them to reduce the overfitting and underfitting. It was assumed that if improvements in the performance of simple algorithms are obtained, better results would be obtainable by the methods that constitute their improved versions. In addition, the algorithms used, due to their simplicity, also provided fast learning, which allowed many trials to be carried out in a relatively short time.
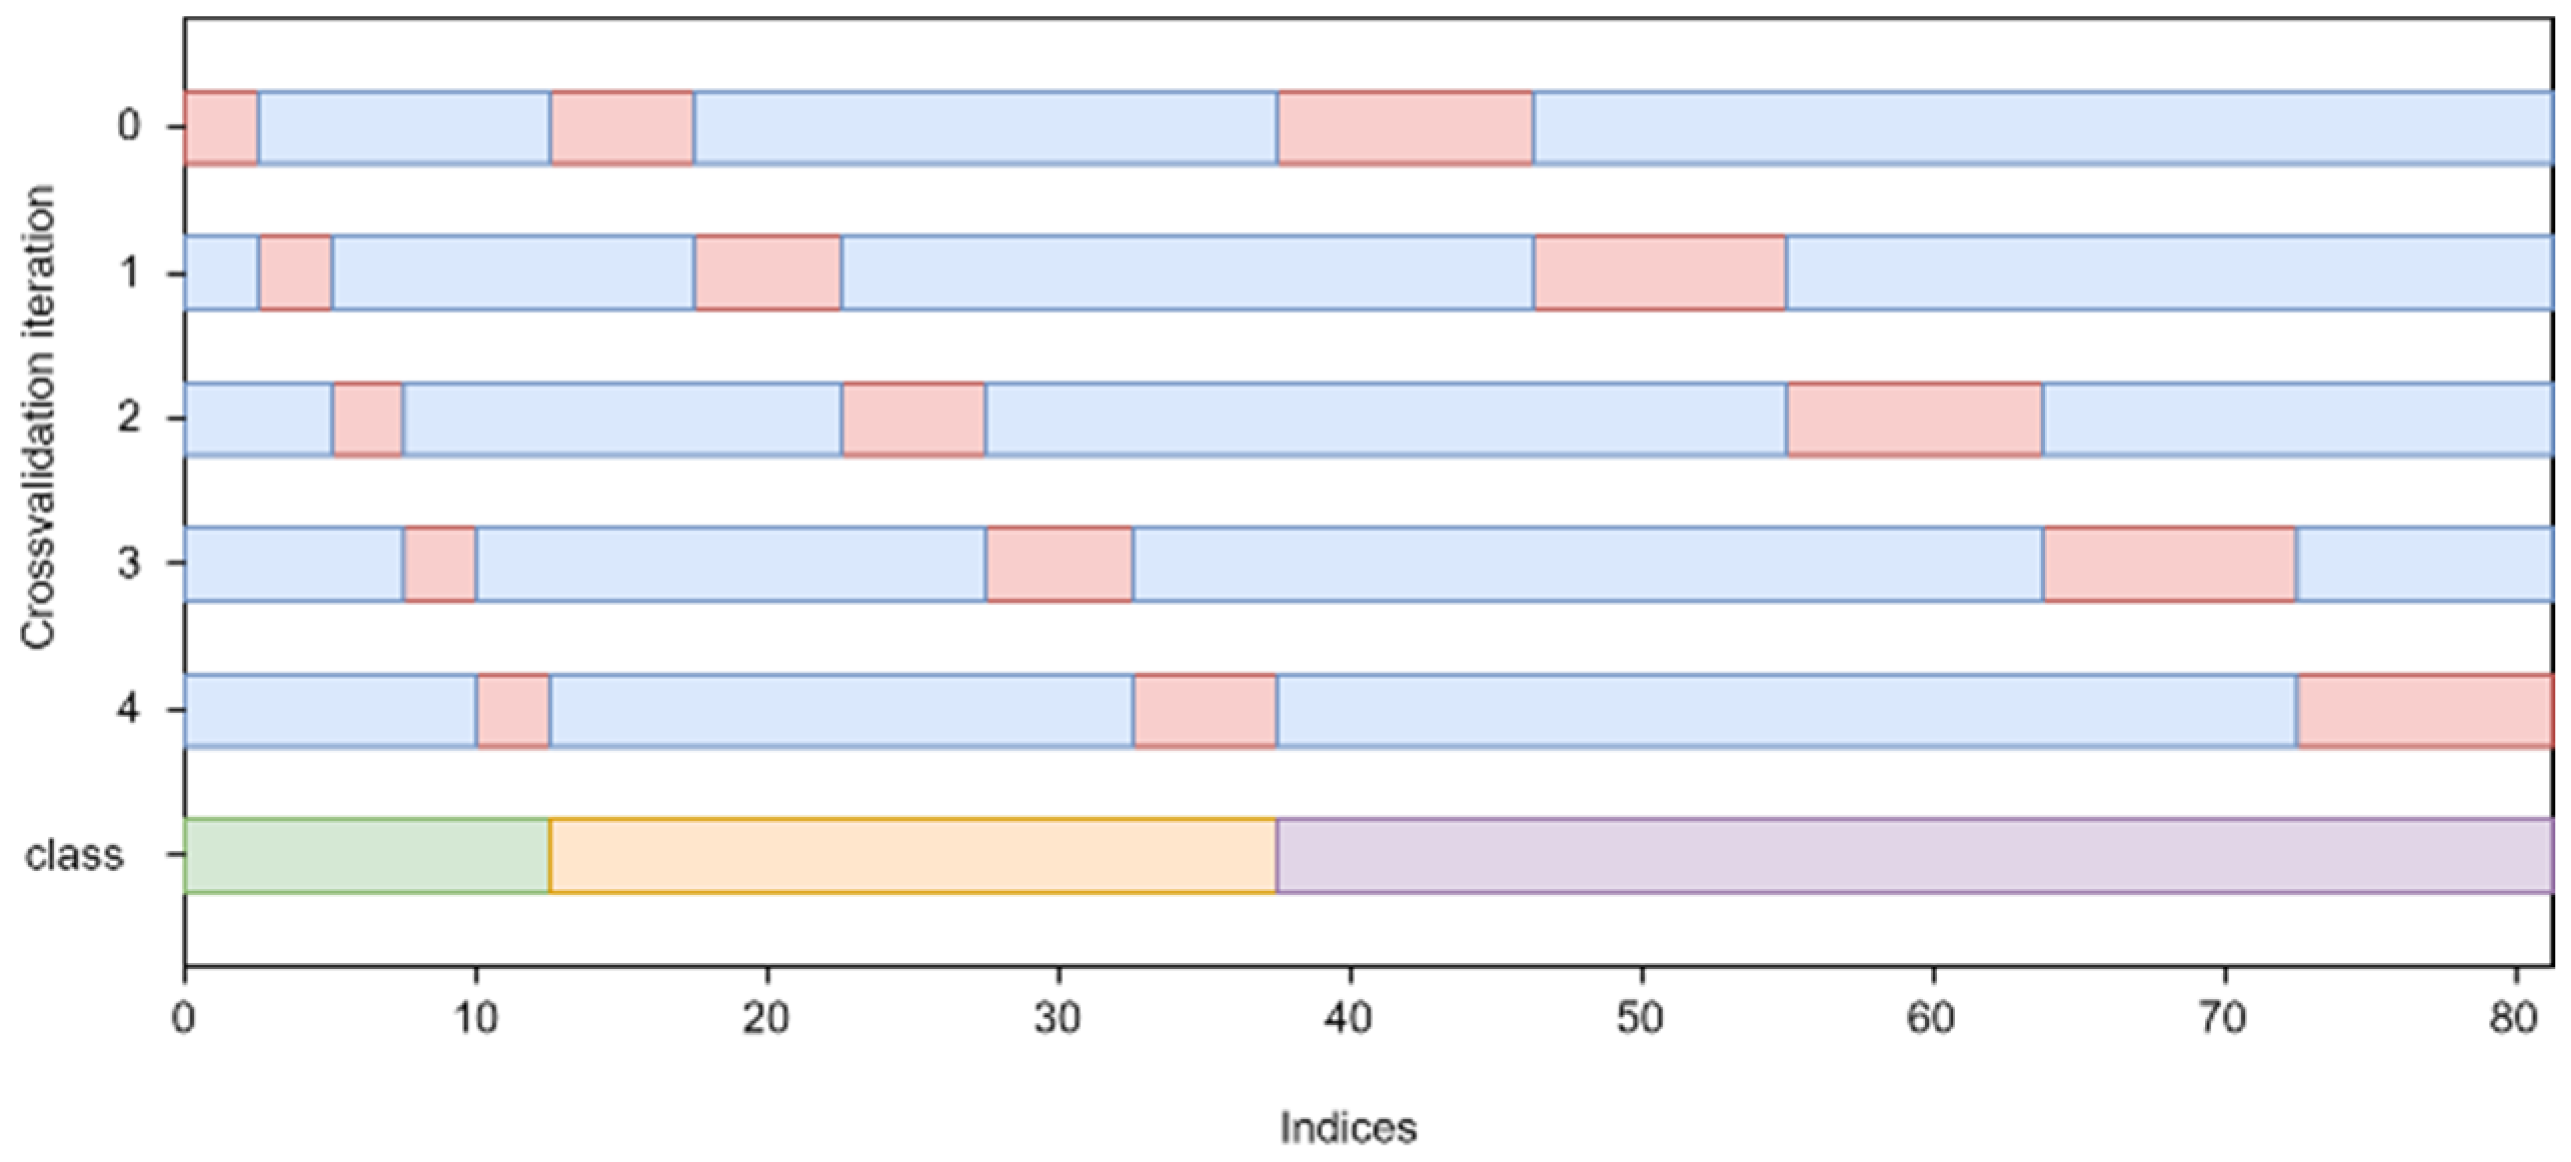
In order to develop an effective model for identifying faults in cabin door drive systems, it is necessary to carry out a number of trials to identify the data preparation method and the set of hyperparameters of the machine learning algorithm for which the fault detection error will be the smallest. However, it should be borne in mind that if during each trial, the performance of the algorithms will be checked on the same test set, then, as a result, the selected model will become the best but only for this particular set and may prove to be inadequate for predicting new samples. The test set has a certain limited size and will never be able to reflect all the relationships that were present in the training data. Therefore, it can be concluded that the model’s ability to generalize will be poor when it is prepared for a specific case of the test set. This means that the model will be biased, and its effectiveness for new test samples will be low. One solution to this problem may be to use a division into three subsets: training, validation (used to select hyperparameter values), and testing. However, the use of this method requires a significant number of samples, and in addition, the accuracy of the predictions may still depend on some random selection of the dataset split points. In practice, cross-validation is the most commonly used and extremely effective method to avoid problems with generalization accuracy. Stratified k-fold cross-validation was used to determine the performance of the model during the conducted tests. This method involves dividing a dataset into k equal parts and then teaching and testing the algorithm k times, with each iteration training the algorithm on k-1 subsets while the remaining subset is used for validation. The chosen stratified variant of cross-validation allows the set to be partitioned in such a way that in each of the k subsets the distribution of classes is similar. This allows the class distribution to be more accurately reflected during testing in cases where the original dataset is class imbalanced. The principle of data splitting based on used 5-fold cross-validation is illustrated in
Figure 3. Preprocessing also included encoding class labels associated with system faults and normal operation. In addition, the data has been standardized to ensure the correct operation of machine learning algorithms.
2.3. Preprocessing Methods
The first of the data reduction preprocessing methods studied was the sampling rate reduction. To do this, sampling was performed from the original dataset. Then, the performance of simple machine learning algorithms was tested for each of the newly created datasets (sampled with different frequency). Independence from the method of data partitioning was obtained by using stratified five-fold cross-validation. The results of the experiment are shown in
Figure 4.
Another of the proposed processing methods involved averaging the measurements over a period of time. Analogous values of the period to the previous method were carried over so that it would be possible to compare the effectiveness of classification at a certain level of data reduction. It can be seen in
Figure 5 that the use of a simple statistic such as the average makes it possible to improve the performance of error identification especially in the lower sampling frequency range, which is desirable from the point of view of the designed system, as it allows for a reduction in data used for modeling.
Considering the improvement in the results obtained by using averaging, the authors proposed a method of preprocessing the measurement data, which involved calculating the moving mean and standard deviation of each measurement for a period defined as the width of the time window, and then adding these values as additional features to the dataset. The schematic of the described processing method is presented in
Figure 6. With this method, new features were introduced to define the so-called short-term history of the device. For this purpose, it was necessary to choose one value of the sampling frequency for which the trials would be carried out. Therefore, it was decided to analyze the performance of fault classification for sampling frequencies in the range for which the F1 score during previous tests was the highest. Based on the results of the experiment, it was decided to choose a sampling frequency of 2.3 Hz. During further analysis, the effect of the time window width on the failure classification effectiveness was examined.
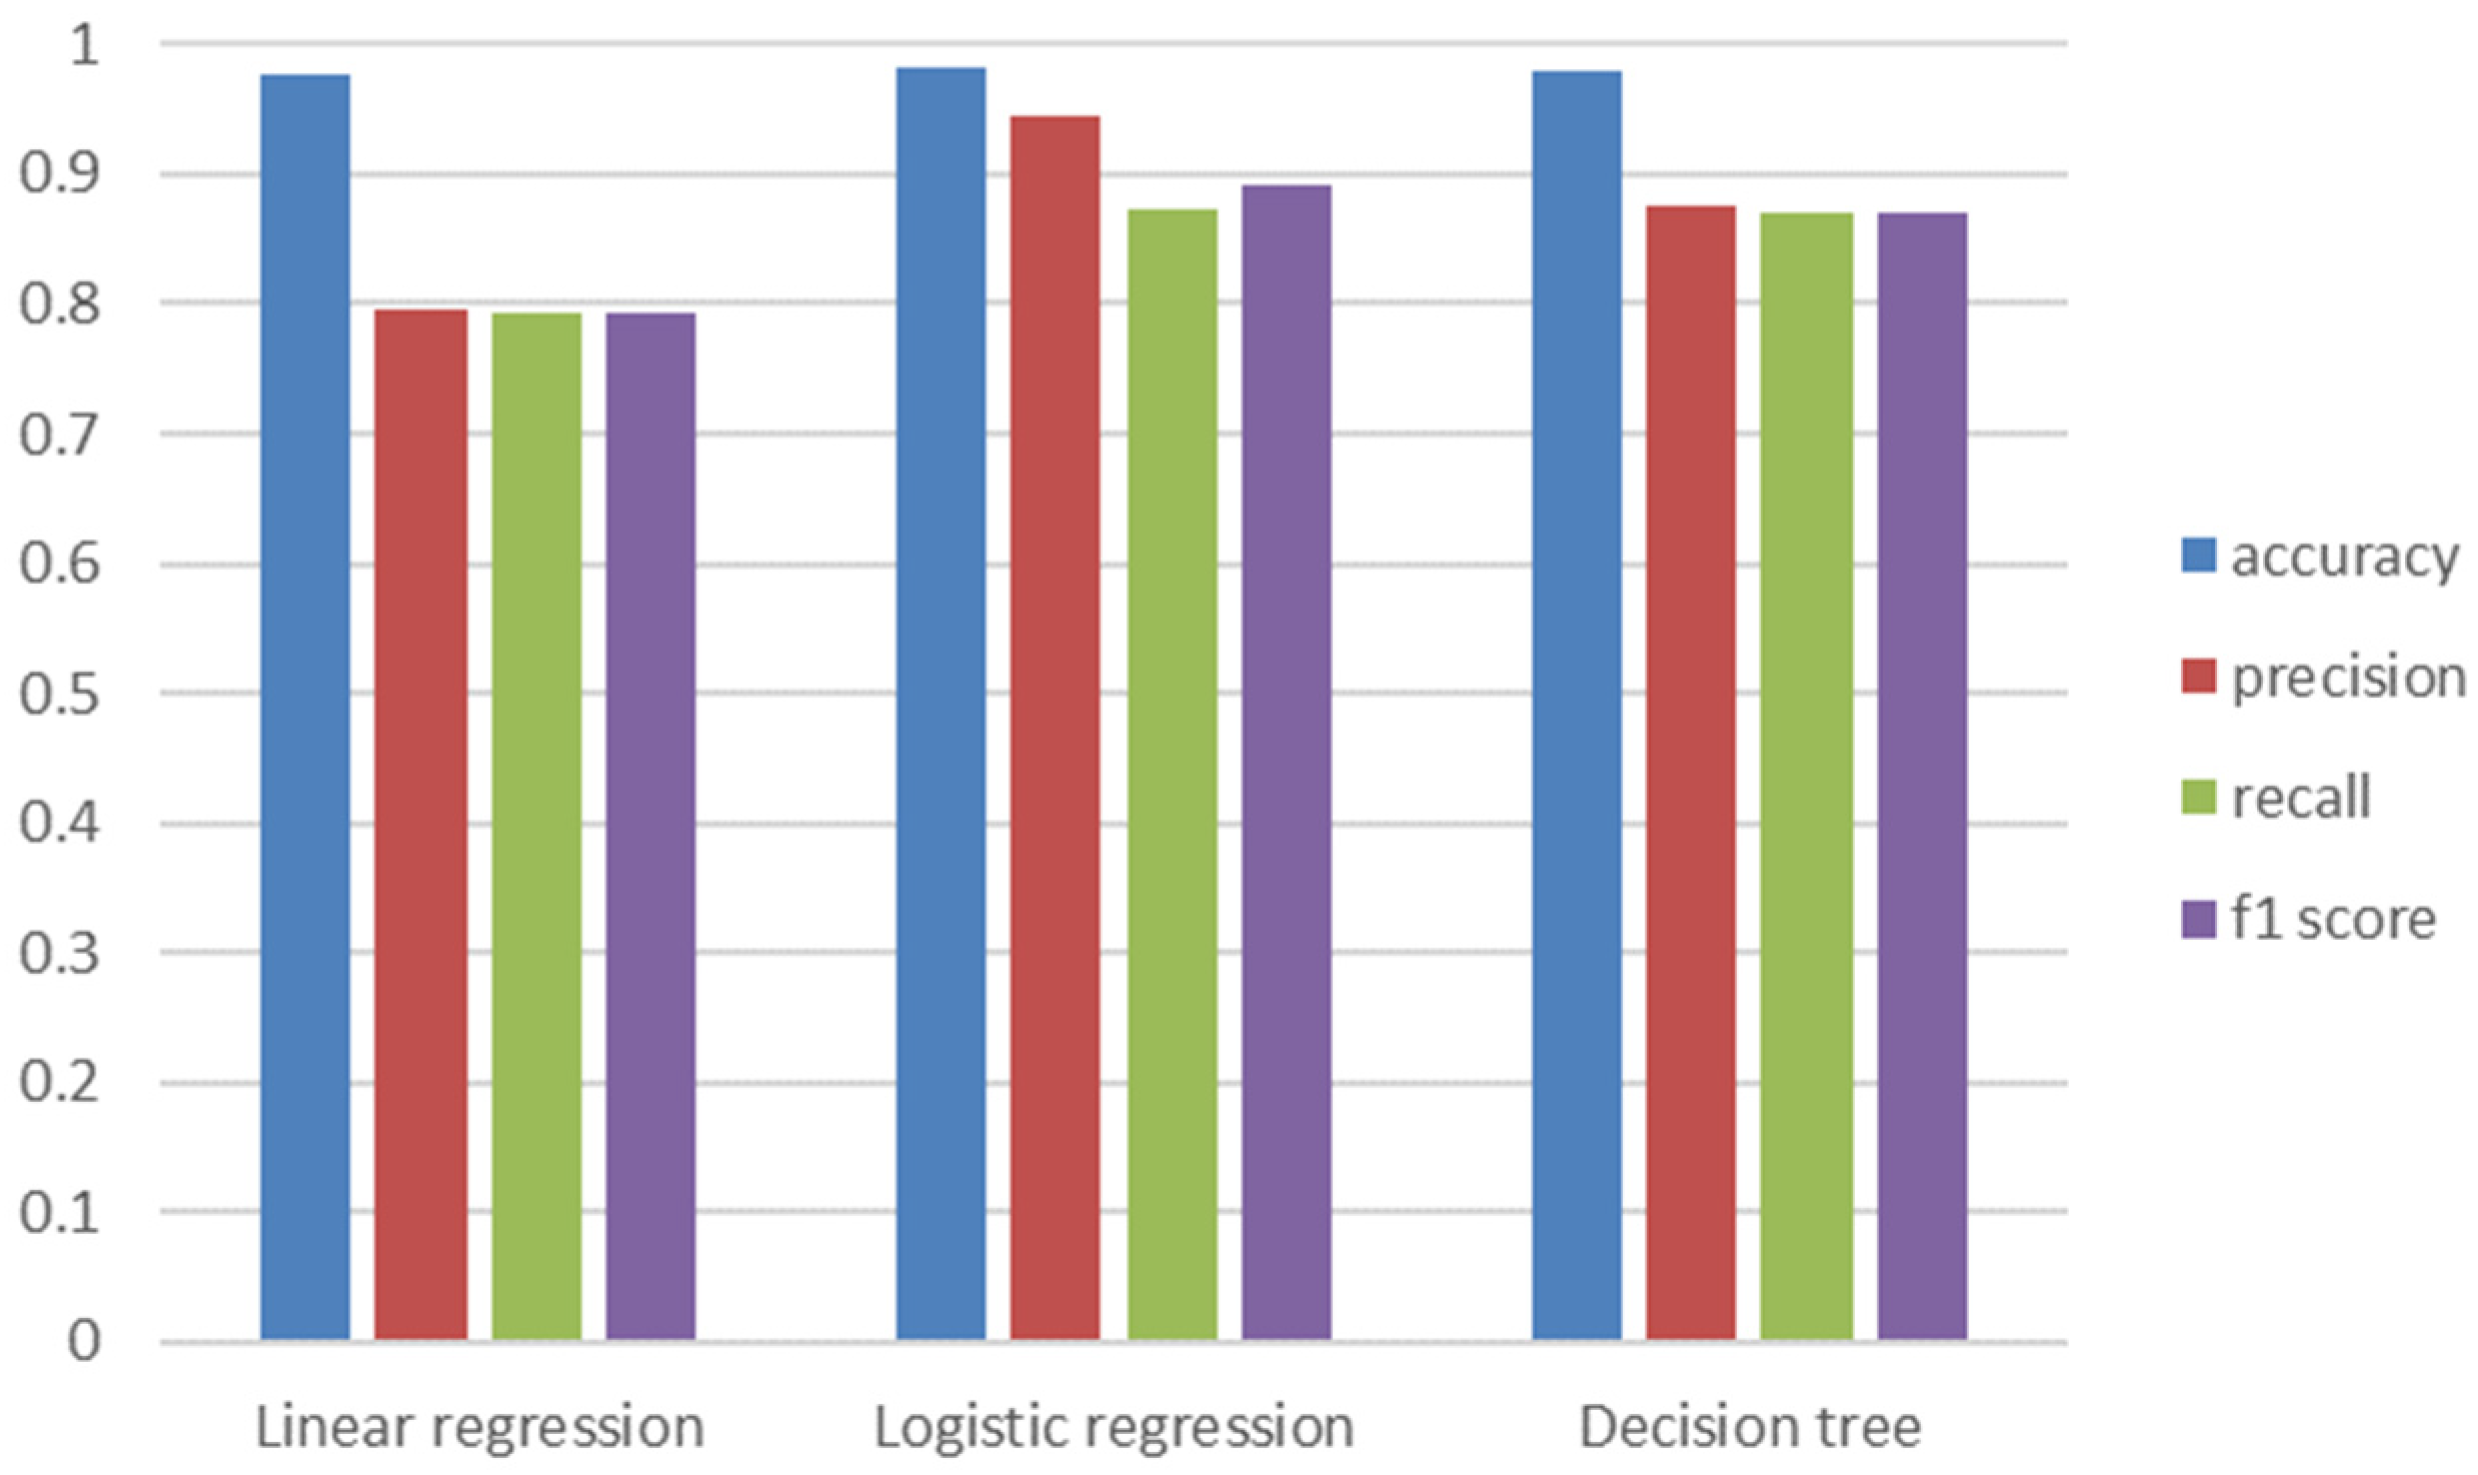
Figure 7 shows a comparison of the F1 score of fault classification by linear regression, logistic regression, and decision tree algorithms using the proposed processing method involving the addition of new variables representing the mean and standard deviation, calculated for different time window widths and a sampling frequency of 2.3 Hz. In the graph, one can notice the different impact of the window width for the linear methods (linear and logistic regression) and the decision tree. This may be due to the instability of the tree generation even with small changes in the input data (visible especially in the range of the time window width from 7 to 8.4 s). Introducing calculated statistics as new features in the dataset increased the number of features three times. However, given that the new features result in a significant improvement in performance for low sampling rates, it is possible to send three times larger portions of data but at much longer intervals.
On the basis of the conducted research on the impact of the data preparation method on the effectiveness of the diagnostics of the elevator cabin door drive system faults, it can be concluded that the method proposed by the authors, which assumes the use of mean values and standard deviations during the analysis, makes it possible to reduce the number of samples needed for modeling while retaining much of the useful information regarding the operation of the device in certain time intervals, of which a time window length of 7.4 s can be considered a good compromise between linear algorithms and a decision tree. It is worth noting that the operation of the elevator’s cabin door is cyclic in nature, related to opening and closing. The above observations led to the development of a new method of data preparation to reduce the amount of transmitted data.
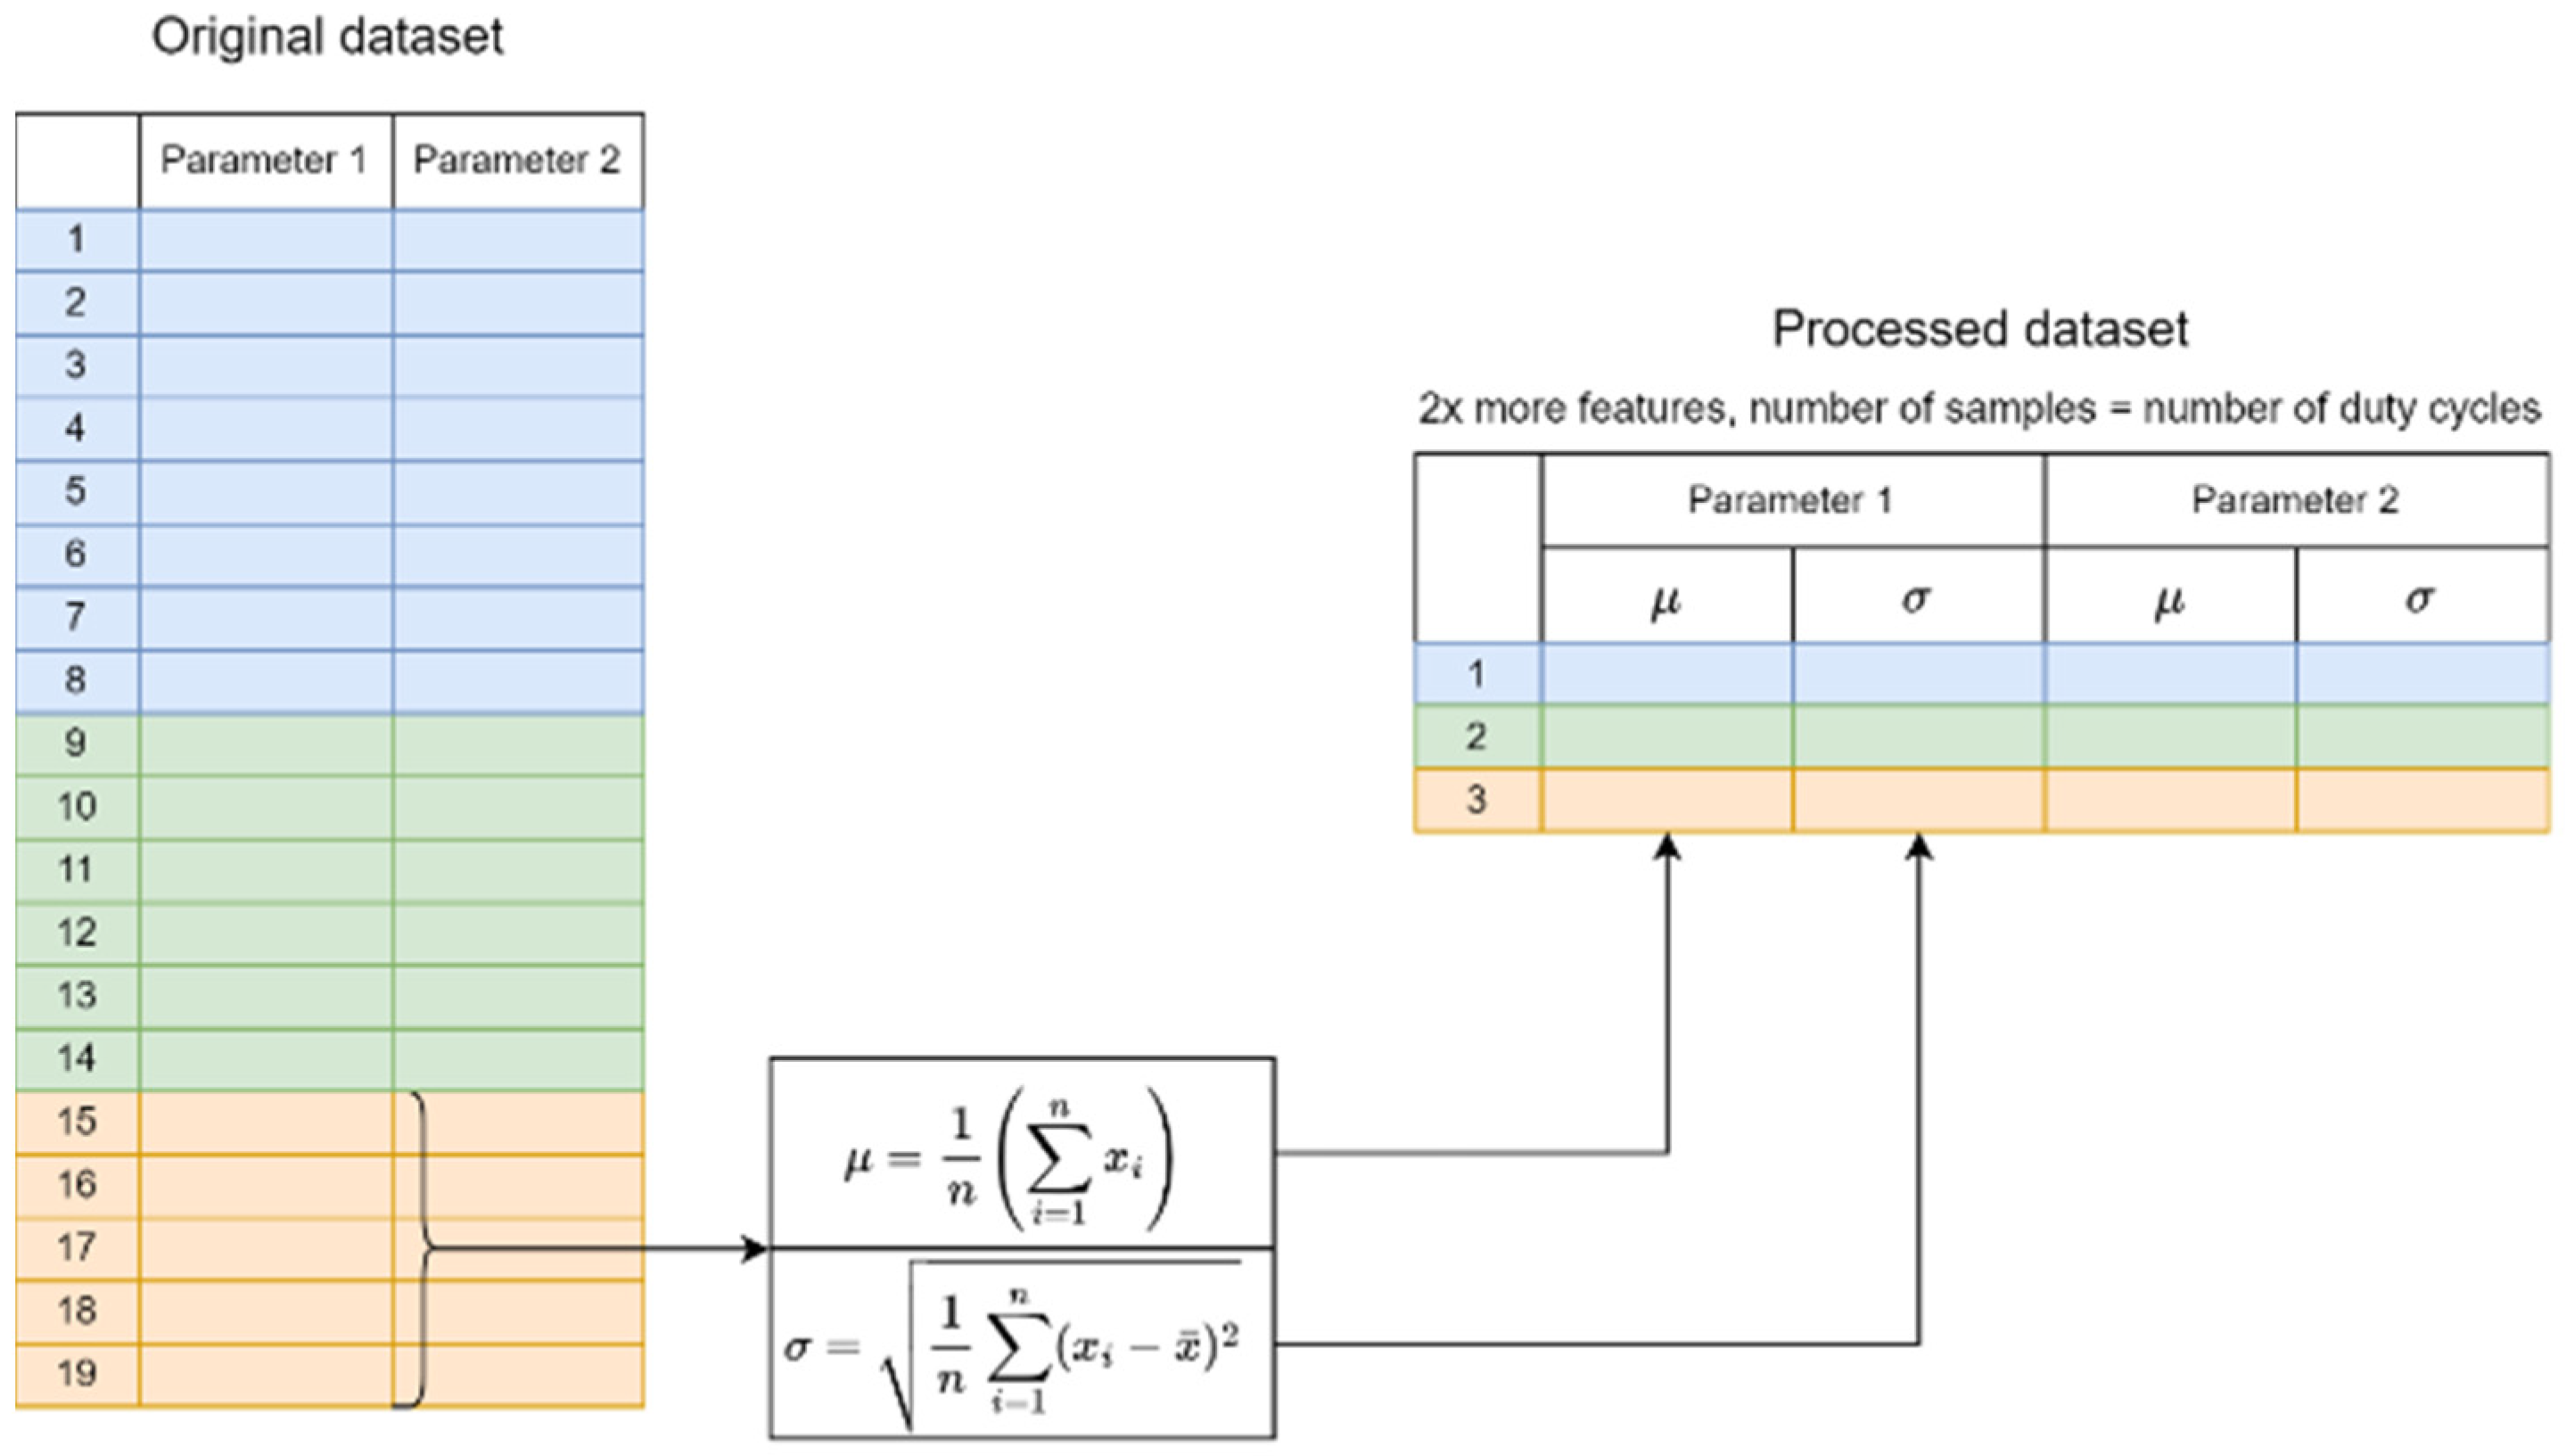
Another of the processing methods developed involves aggregating a given cabin door cycle into a single record containing information about the mean and standard deviation of all diagnostic parameters. This means that the number of samples in the dataset is reduced to the number of cabin door operating cycles, while retaining useful information regarding the values of diagnostic parameters in the form of statistics. The method involves dividing the dataset into the operating cycles of the drive system and then replacing the diagnostic quantities of each cycle with their averages and standard deviations, as presented in
Figure 8. In addition, a new parameter related to the length of the operating cycle was introduced. To ensure that the classification results are independent of the cycle order, the processed dataset was randomly shuffled. The results obtained for the described method are presented in
Figure 9.
It can be seen that the proposed processing method produces much better fault classification results while reducing the amount of data from more than 3.9 million records to about 6700 (the number of cycles). Thus, it can be concluded that despite doubling the number of features, it was possible to reduce the amount of data by more than 300 times, and the required data transfer rate has been reduced to just 105 b/s (22 4-byte variables plus CAN overhead, every 11.7 s—the average cycle time), which is 0.08% of the available throughput of the elevator internal bus, which translates into about 34 MB of transfer per month and just over 0.4 GB of required disk space per year for one elevator. The proposed method significantly reduces the amount of diagnostic data transferred, which is beneficial, especially given the need to use the communication infrastructure of the elevator control system to transfer data between components and the device sending data to the central server.
3. Classification with Machine Learning
In the next step, after preprocessing the data, machine learning methods were selected for elevator cabin door drive failure classification. In the research, it was decided to compare the performance of the most popular classification algorithms available in the scikit-learn library of the Python 3.8 language, such as Logistic Regression (LR), Decision Tree (DT), Support vector machine (SVM), Stochastic Gradient Descent (SGD), K-Nearest Neighbors (KNN), Random Forest (RF), and Gradient Boosting (GB). The first comparison criterion was effectiveness in handling complex data (the ability to model intricate decision boundaries). In this regard, logistic regression performed the worst, as it is limited to modeling linear functions. When it comes to generalization capability and resistance to overfitting, these aspects largely depend on the appropriate selection of model parameters. Almost all of the algorithms include built-in regularization mechanisms, but the strength of regularization must be properly tuned. Performance on imbalanced datasets is particularly relevant in the context of fault detection. The k-nearest neighbors (KNN) algorithm is especially vulnerable to issues caused by data imbalance, as it makes decisions based solely on the local neighborhood of a sample. SVM and SGD algorithms are also sensitive to class imbalance; however, they can be adapted by incorporating class weighting mechanisms based on class quantities. Model complexity and possibility of implementation on embedded devices also pose challenges for KNN since the algorithm requires storing the entire dataset in memory. Ensemble algorithms are similarly problematic for embedded environments due to their computational complexity, which is heavily influenced by the number of weak estimators used in classification. In industrial applications related to fault diagnostics, interpretability is also a crucial factor, as these algorithms are intended to support operators and maintenance personnel. While the principles behind algorithms such as support vector machines (SVM) and KNN are relatively straightforward, interpreting their decision boundaries is significantly more difficult compared to, for instance, decision trees, which can be visualized. An additional advantage of tree-based algorithms is their ability to assess feature importance, which can serve as a valuable diagnostic tool. The final comparison criterion is scalability, which becomes increasingly important when collecting data from multiple devices. For large datasets, the training time of KNN and SVM algorithms is considerably longer compared to other models. A summary of the algorithm comparison is presented in
Table 2.
An important aspect of fault detection modeling is the careful fine-tuning of the model to achieve the best possible performance. To this end, a process of hyperparameter tuning of the algorithms was carried out using random search with cross-validation. It requires defining a continuous or discrete distribution for each of the algorithm’s hyperparameters and then randomly sampling from this distribution to create a model, which is then trained and evaluated using stratified cross-validation. Parameter values and results for the tested algorithm configurations are recorded to then select the best settings. A diagram of how the random search method works is shown in
Figure 10. It is worth noting that the method used allows the number of iterations to be adjusted to check the performance of the model regardless of the number of existing combinations of parameter values. In addition, the random search method makes it possible to analyze parameters that do not significantly affect the complexity of the model without sacrificing performance—in the case of the frequently used grid search method, adding a new attribute will significantly increase the number of combinations as it searches through all possible sets. In this work, it was decided to perform 100 search iterations for each algorithm. A summary of the best hyperparameters for each model obtained after tuning is shown in
Table 3.
The values of precision, recall, and F1 score for all analyzed models with the best selected parameters are shown in
Figure 11. It should be noted that for each of the algorithms, an improvement was obtained compared to fault identification with default hyperparameters. In most cases, the increase in efficiency was a few percent, but for algorithms such as logistic regression and SGD, the differences were much greater (up to several percent higher sensitivity). In addition, it can be seen from the presented results that each of the algorithms achieved an accuracy above 95%, but in many cases the values of the other metrics are much lower.
The development of an effective system for diagnosing elevator cabin door drive system failures requires the selection of the most effective algorithm to be implemented on the central server. In
Figure 11, it can be seen that the best results in terms of sensitivity and F1 score are obtained by the random forest algorithm. Therefore, it was decided to check a confusion matrix for this method based on the last split of the cross-validation dataset (
Figure 12). It can be seen that the algorithm has the biggest difficulty in classification of the faults associated with the automatic door closing system breakage. This is probably due to the fact that during the fault, the drive operates exactly the same as in normal operation, with the only difference being a slight increase in current when opening the door and a decrease when closing it. In addition, a few incorrect classifications for different types of faults are visible. Of particular interest is the triple confusion between bearing damage and drive belt stretch of 1 tooth. Thus, it seems that in some respect these two types of failure cycles are similar, and the investigation of this can be the subject of further research. On the other hand, it is worth noting that the use of a properly prepared fault diagnosis model makes it possible to distinguish failures of different types effectively. It is even possible to determine which motor controller transistor has failed.
6. Limitations and Future Work
The conducted research is, of course, not free from limitations resulting from the adopted methodology. First and foremost, it was not possible to obtain data on malfunctions from operational elevators, as this would have been very time-consuming—properly designed systems experience malfunctions very rarely. Additionally, deliberately inducing malfunctions in a functioning device could lead to a reduction in its service life. However, it is worth emphasizing that the developed model of the elevator cabin door drive system is a faithful replica of real devices manufactured by a company specializing in elevator production, with which the authors have collaborated. The prototype system was built using components provided through this collaboration.
Moreover, the methods for simulating faults developed for research purposes were consulted with specialists in the field of cabin door drives. It should also be noted that although the exact values of diagnostic parameters, such as motor current or torque, may vary depending on the specific design of the device, for failures such as mechanical drive blockage, the symptoms will be nearly identical to those in a functioning system. In the case of failures such as a broken drive belt, the signals at the exact moment of the fault were not captured; however, the general symptoms of a broken belt are the same and enable easy detection of the malfunction and quick notification of the device maintenance personnel. From the perspective of rapid notification, it does not matter whether the maintenance department receives information about the malfunction one second or one minute after it occurs. It should also be kept in mind that the mechanical design of cabin door drives itself protects users and personnel from injury in the event of any of these failures. The primary objective of the research was to enable quick diagnosis and notification to restore the device to normal operation as soon as possible.
As part of future work, broader analyses of the system’s vibration measurements are planned. It will also be possible to examine the impact of the accelerometer’s placement and the method of processing measurement data (e.g., Fourier transform) on the effectiveness of the diagnostic model. Additionally, feature importance studies for the dataset will be conducted. It is likely that some diagnostic parameters can be discarded due to their minimal impact on the model’s performance, thereby reducing the number of required measurement sensors.
Work is currently underway to implement a monitoring and data collection system for malfunctions in operational elevators. In the future, this system will be used for research focused on predicting malfunctions in advance, enabling predictive maintenance.


