1. Introduction
Against the backdrop of accelerating urbanization, a surge in sustainable transportation modes like cycling is placing unprecedented demands on road infrastructure quality and safety [
1]. However, pavement defects such as cracks and potholes remain a prevalent and critical issue worldwide. These defects act as significant safety hazards, contributing to thousands of fatal accidents annually in countries like India, and incur substantial economic costs, with annual road maintenance expenditures in the United States alone surpassing USD 17 billion [
2,
3,
4]. Therefore, developing efficient and accurate automated road defect detection technology is crucial for enhancing urban management and ensuring public safety.
From human visual inspection to sophisticated automated and intelligent techniques, road fault identification technology has improved. The original manual visual inspection entirely relied on technicians walking along the roads, observing the road surface with the naked eye, and looking for cracks and other defects. Once cracks were found, technicians might use tools such as rulers to measure the width and length of the cracks and record data for further analysis. This traditional method still has some limitations, such as strong subjectivity, poor data consistency, and susceptibility to environmental and personnel experience influences. At the same time, when inspecting roads that allow high-speed driving, there is also a significant safety hazard for inspectors. Later, acoustic, displacement, pressure, and other sensors were introduced for auxiliary detection. However, data from different types of sensors may be difficult to integrate and compare, affecting comprehensive assessment and full automation. Moreover, high-quality sensors and detection equipment may be costly, which is not conducive to widespread application. Therefore, enhancing the efficiency of low-cost methods based on computer vision has become the preferred approach.
Modern detection algorithms, driven by deep learning, have seen significant advancements, with research primarily focusing on two key directions: enhancing multi-scale feature representation and optimizing overall performance. To improve the detection of varied defect sizes, many approaches have incorporated sophisticated feature fusion modules, such as the PSA and LCFI modules in YPLNet [
5] or the BiFPN concept [
6]. Concurrently, other works have aimed to boost accuracy and efficiency by optimizing existing frameworks [
7,
8], developing specialized networks for challenging conditions like noisy environments [
9], or exploring advanced network backbones and attention mechanisms [
10,
11]. However, while these methods yield performance improvements, they often introduce a significant computational burden or risk the loss of critical information during down-sampling. Consequently, a fundamental challenge in the current research lies in the trade-off between model lightweighting and detection accuracy. The field currently lacks an optimized solution that can effectively balance these two competing demands: significantly reducing computational cost while simultaneously preventing the loss of critical feature information, particularly when detecting small and varied road defects.
To address this trade-off, this study builds upon the YOLOv8s framework. While the YOLO series continues to evolve with models like YOLOv10 [
12], we selected YOLOv8s as our baseline due to its excellent and proven balance of performance, speed, and stability, which provides a mature foundation for lightweighting optimizations [
13].
This study introduces a new model called ACD-YOLOv8, composed of ADown, CCFM, DyHead, and YOLO [
14] version 8 (YOLOv8s). The key contributions can be outlined as follows:
- (1)
This study incorporates the lightweight cross-scale feature fusion module (CCFM) from RT-DETR into YOLOv8s to improve detection performance for scale variations and small targets. This enhancement enables the model to achieve high accuracy and performance on complex tasks, while significantly reducing parameters and the size of the trained model.
- (2)
This study presents the ADown module and incorporates it into the backbone and neck of the new architecture, alongside the introduction of CCFM. ADown is a lightweight down-sampling operation, addressing the information bottleneck issue. It ensures accuracy while further improving lightweighting.
- (3)
Finally, a new model of architecture ACD-YOLO is proposed that ensures both accuracy and significant lightweighting. It combines the ADown module, CCFM module, dynamic detection head DyHead, and YOLOv8s as the basic framework.
2. Materials and Methods
2.1. YOLOv8 Network Architecture
The YOLOv8 algorithm is a significant update released by Ultralytics in 2023, building upon previous versions of YOLOv5, and further enhancing flexibility and performance. The YOLOv8 can be divided into YOLOv8n, YOLOv8s, YOLOv8m, YOLOv8l, and YOLOv8x, depending on the network depth and width. This study employs the RDD2022 [
15] China dataset, which is of moderate size. The backbone and neck design are inspired by the ELAN architecture concept introduced in YOLOv7 [
16], improving the C3 module from YOLOv5 and introducing the C2f structure for feature extraction at different scales, a modification that significantly enhances gradient flow. In addition, the model architecture has been finely optimized for models of different sizes, with the number of channels meticulously adjusted.
Figure 1 illustrates the architecture of the baseline YOLOv8s model, which serves as the foundation for our proposed improvements. The neck layer adopts an FPN (Feature Pyramid Network) [
17] + PAN (Path Aggregation Network) [
18] structure, enhancing the fusion capability of features and optimizing the integration of semantic and spatial features through up-sampling and down-sampling techniques. The detection head has been updated from the original coupled structure to the widely adopted decoupled head, separating the classification and detection tasks. Additionally, the design shifts from the Anchor-Based approach of YOLOv5 to an Anchor-Free design. The YOLOv8 algorithm uses a dynamic allocation strategy, referencing TOOD’s TaskAlignedAssigner [
19]. For loss computation, the classification branch utilizes Binary Cross-Entropy (BCE) loss, while the regression branch applies Distribution Focal Loss (DFL) and the CIoU loss function. These loss functions collectively act on the prediction of classification scores and regression coordinates.
2.2. Feature Fusion Network Lightweight Improvement
In road defects, apart from larger-scale defects, there are a vast number of small defects, which are often a challenge in road defect detection. Therefore, the focus of model improvement should be directed towards this challenge. Due to the insufficient detailed information of small-scale road defects in images, it is difficult to capture enough features for accurate identification, especially under complex background conditions. Moreover, the scale variation of small-scale targets is significant under different distances and viewpoints, requiring a higher adaptability to scale changes.
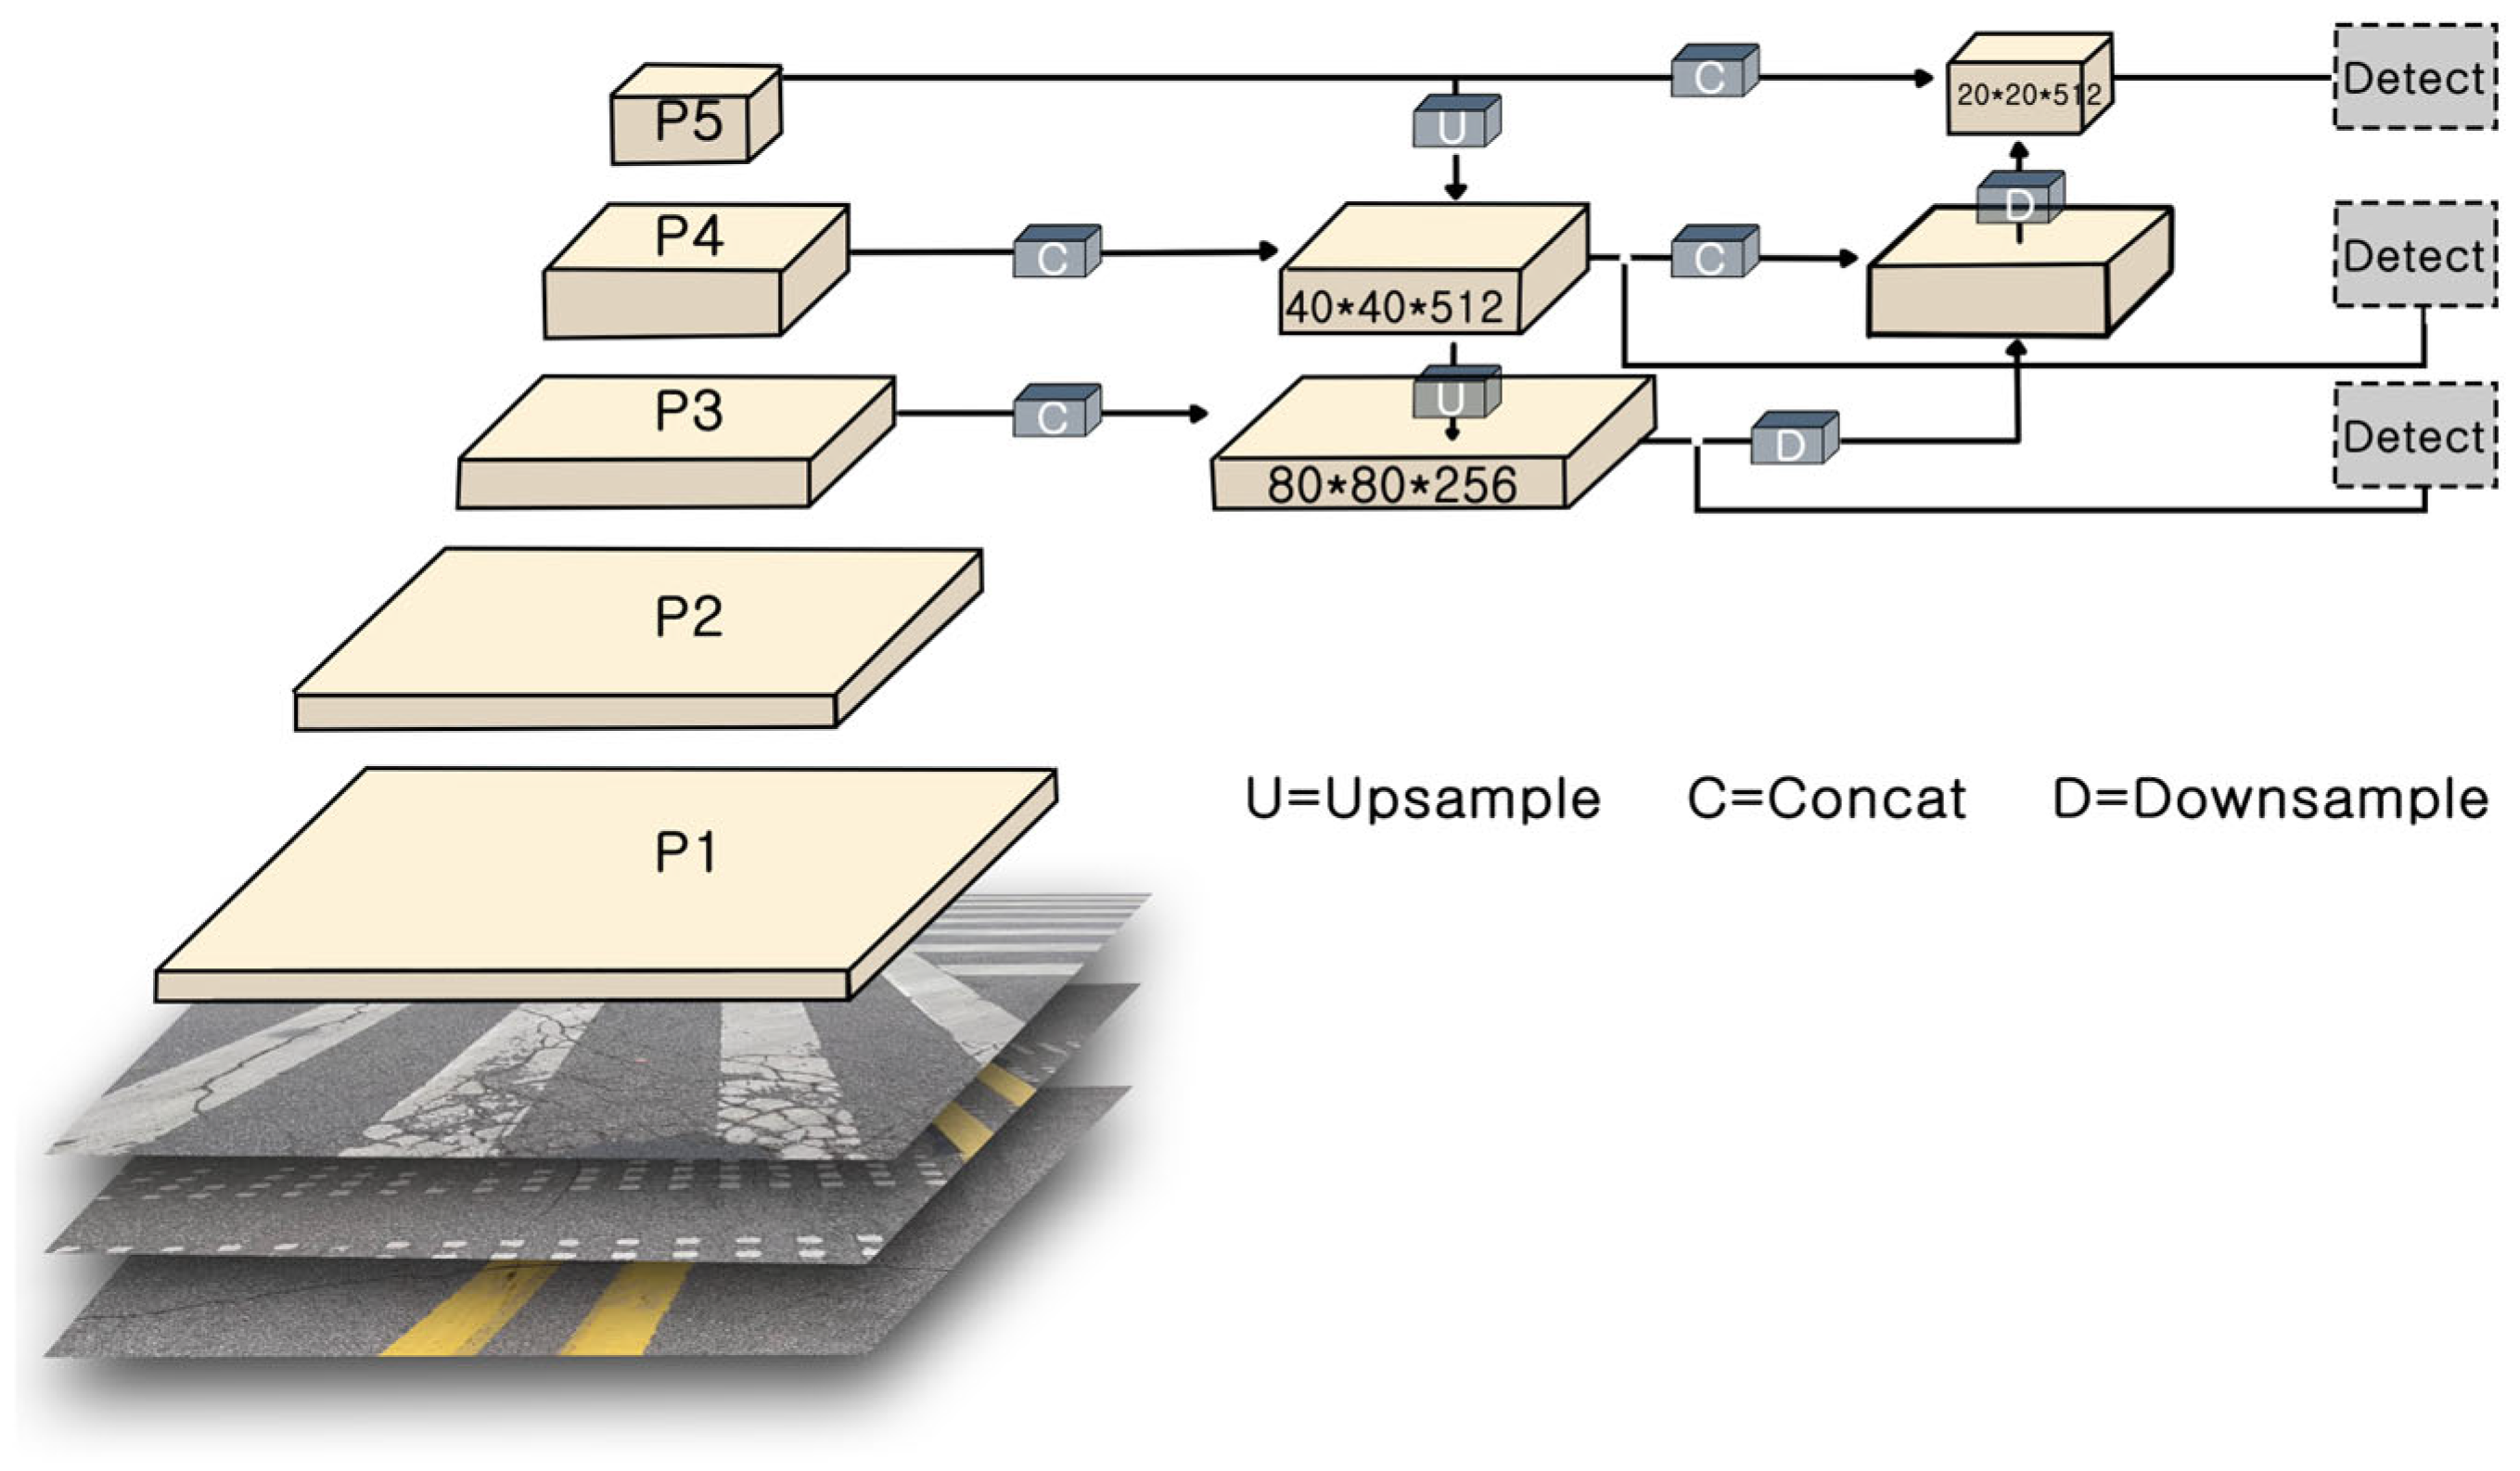
In YOLOv8, the PAN-FPN is introduced as its feature pyramid network.
Figure 2 illustrates schematic representation of the PAN-FPN. The P1-P5 layers shown in the figure constitute a feature pyramid designed for multi-scale detection. Specifically, the pyramid levels P3, P4, and P5 are constructed by the neck network using feature maps from the C3, C4, and C5 stages of the backbone. These three levels possess progressively coarser resolution but richer semantic information and are subsequently fed to the detection heads. The highest-resolution feature maps, P1 and P2, while representing the earliest feature stages, are not utilized in the fusion process for the final detection task, out of consideration for balancing performance and computational cost. Furthermore, building on the FPN, a bottom-up path from PAN is introduced to pass low-level features to high-level features layer-by-layer, further enriching the multi-scale features.
Despite enriching multi-scale features, the PAN-FPN structure still has potential for further optimization. Firstly, its feature fusion process relies heavily on repeated convolutions and channel concatenations, which introduces significant computational and parameter overhead. Secondly, this simple ‘concatenation-and-convolution’ fusion method may not be the optimal solution for exchange of information between different scales, potentially leading to inefficient information flow or feature redundancy. These limitations highlight the necessity of developing a more efficient and lightweight feature fusion paradigm, which serves as the motivation for our subsequent improvements.
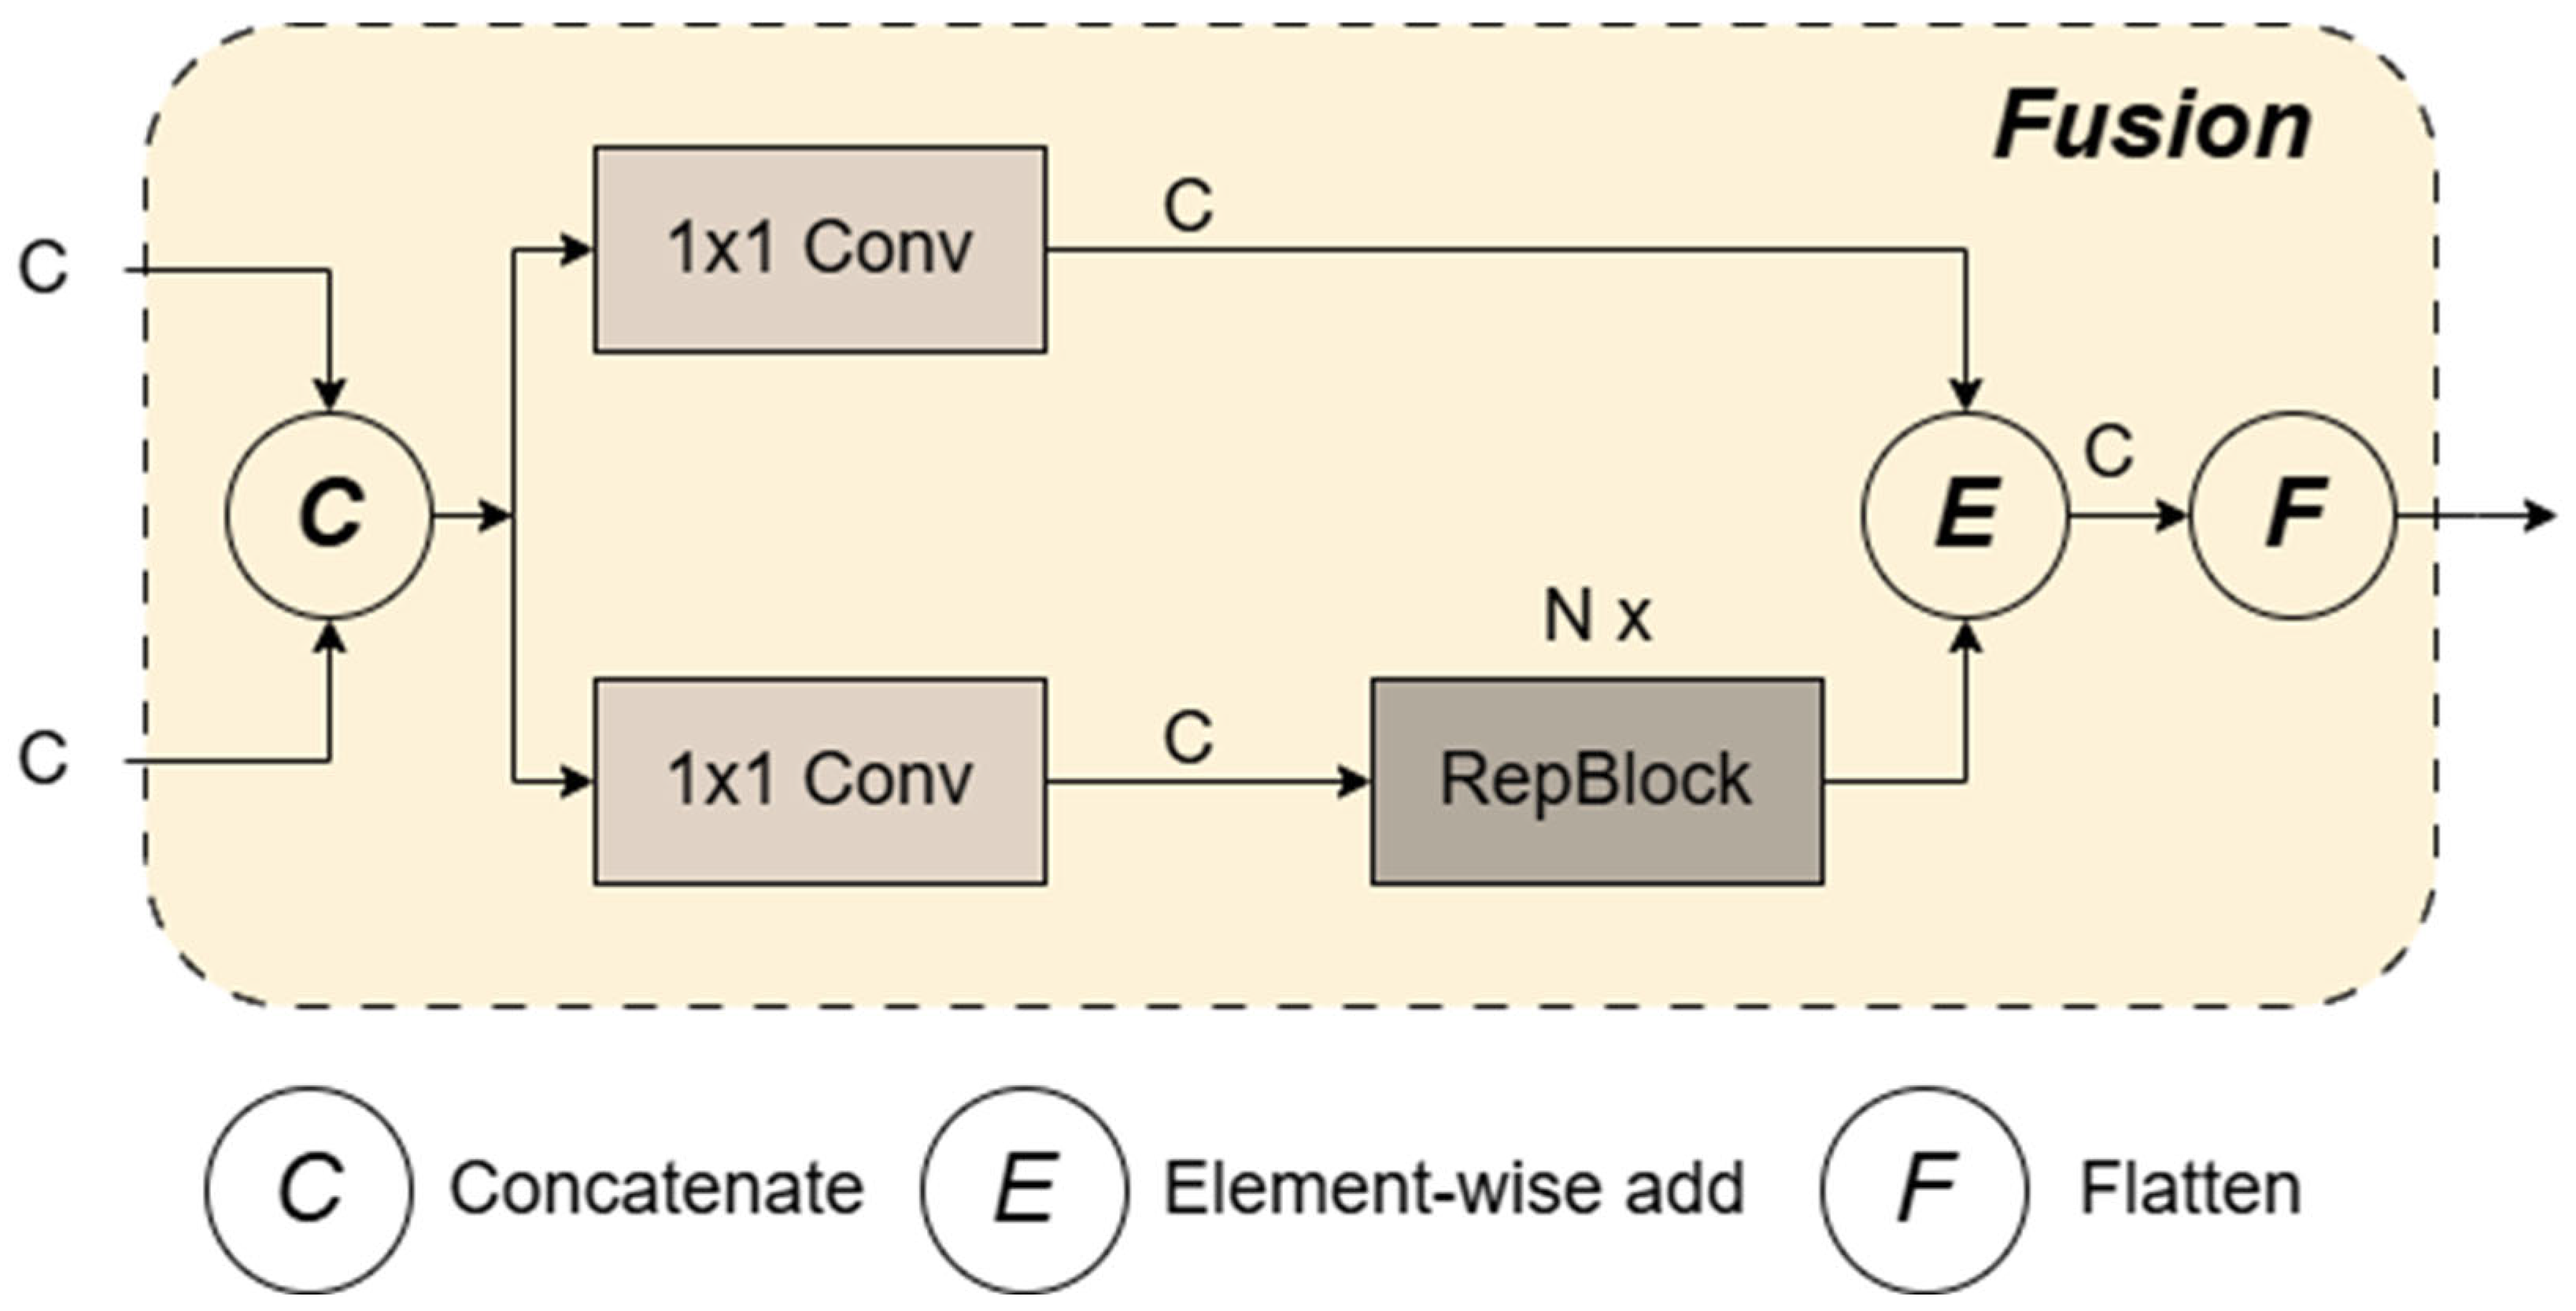
The Cross-Scale Feature Fusion Module (CCFM) was originally proposed by Baidu in RT-DETR [
20]. This study incorporates the module back into the feature fusion component of the YOLOv8 object detection model. Before up-sampling the feature map, CCFM (as shown in
Figure 3) fuses the extracted feature map through a lightweight lateral convolution operation, which uses a 1 × 1 convolution kernel to mix channels of the feature map, preparing for the channel count of subsequent layers. An additional convolutional layer is used before Concatenation to further refine features before feature fusion. The fused feature map is passed through a sequence of 1 × 1 convolutional layers utilized to enhance the feature representation capability further. The indices and processing order of the feature maps are adjusted, optimizing the feature processing workflow to adapt to different feature fusion and down-sampling operations. Compared with the traditional FPN, CCFM emphasizes inter-stage communication more. It allows features from deeper layers of the network to interact more directly with shallower features, which helps to pass richer information between feature maps of different resolutions. After a series of lightweight convolutional kernels are used, CCFM can achieve effective feature fusion with less computational cost without sacrificing detection accuracy, optimizing it for lightweight and real-time application scenarios.
2.3. ADown Module: Lightweight Down-Sampling Operation
To maintain the algorithm model’s lightweight design and ensure its detection efficiency, this paper introduces the ADown module for down-sampling operations, integrated with the CCFM structure. ADown is a lightweight convolutional technique proposed by Wang et al. [
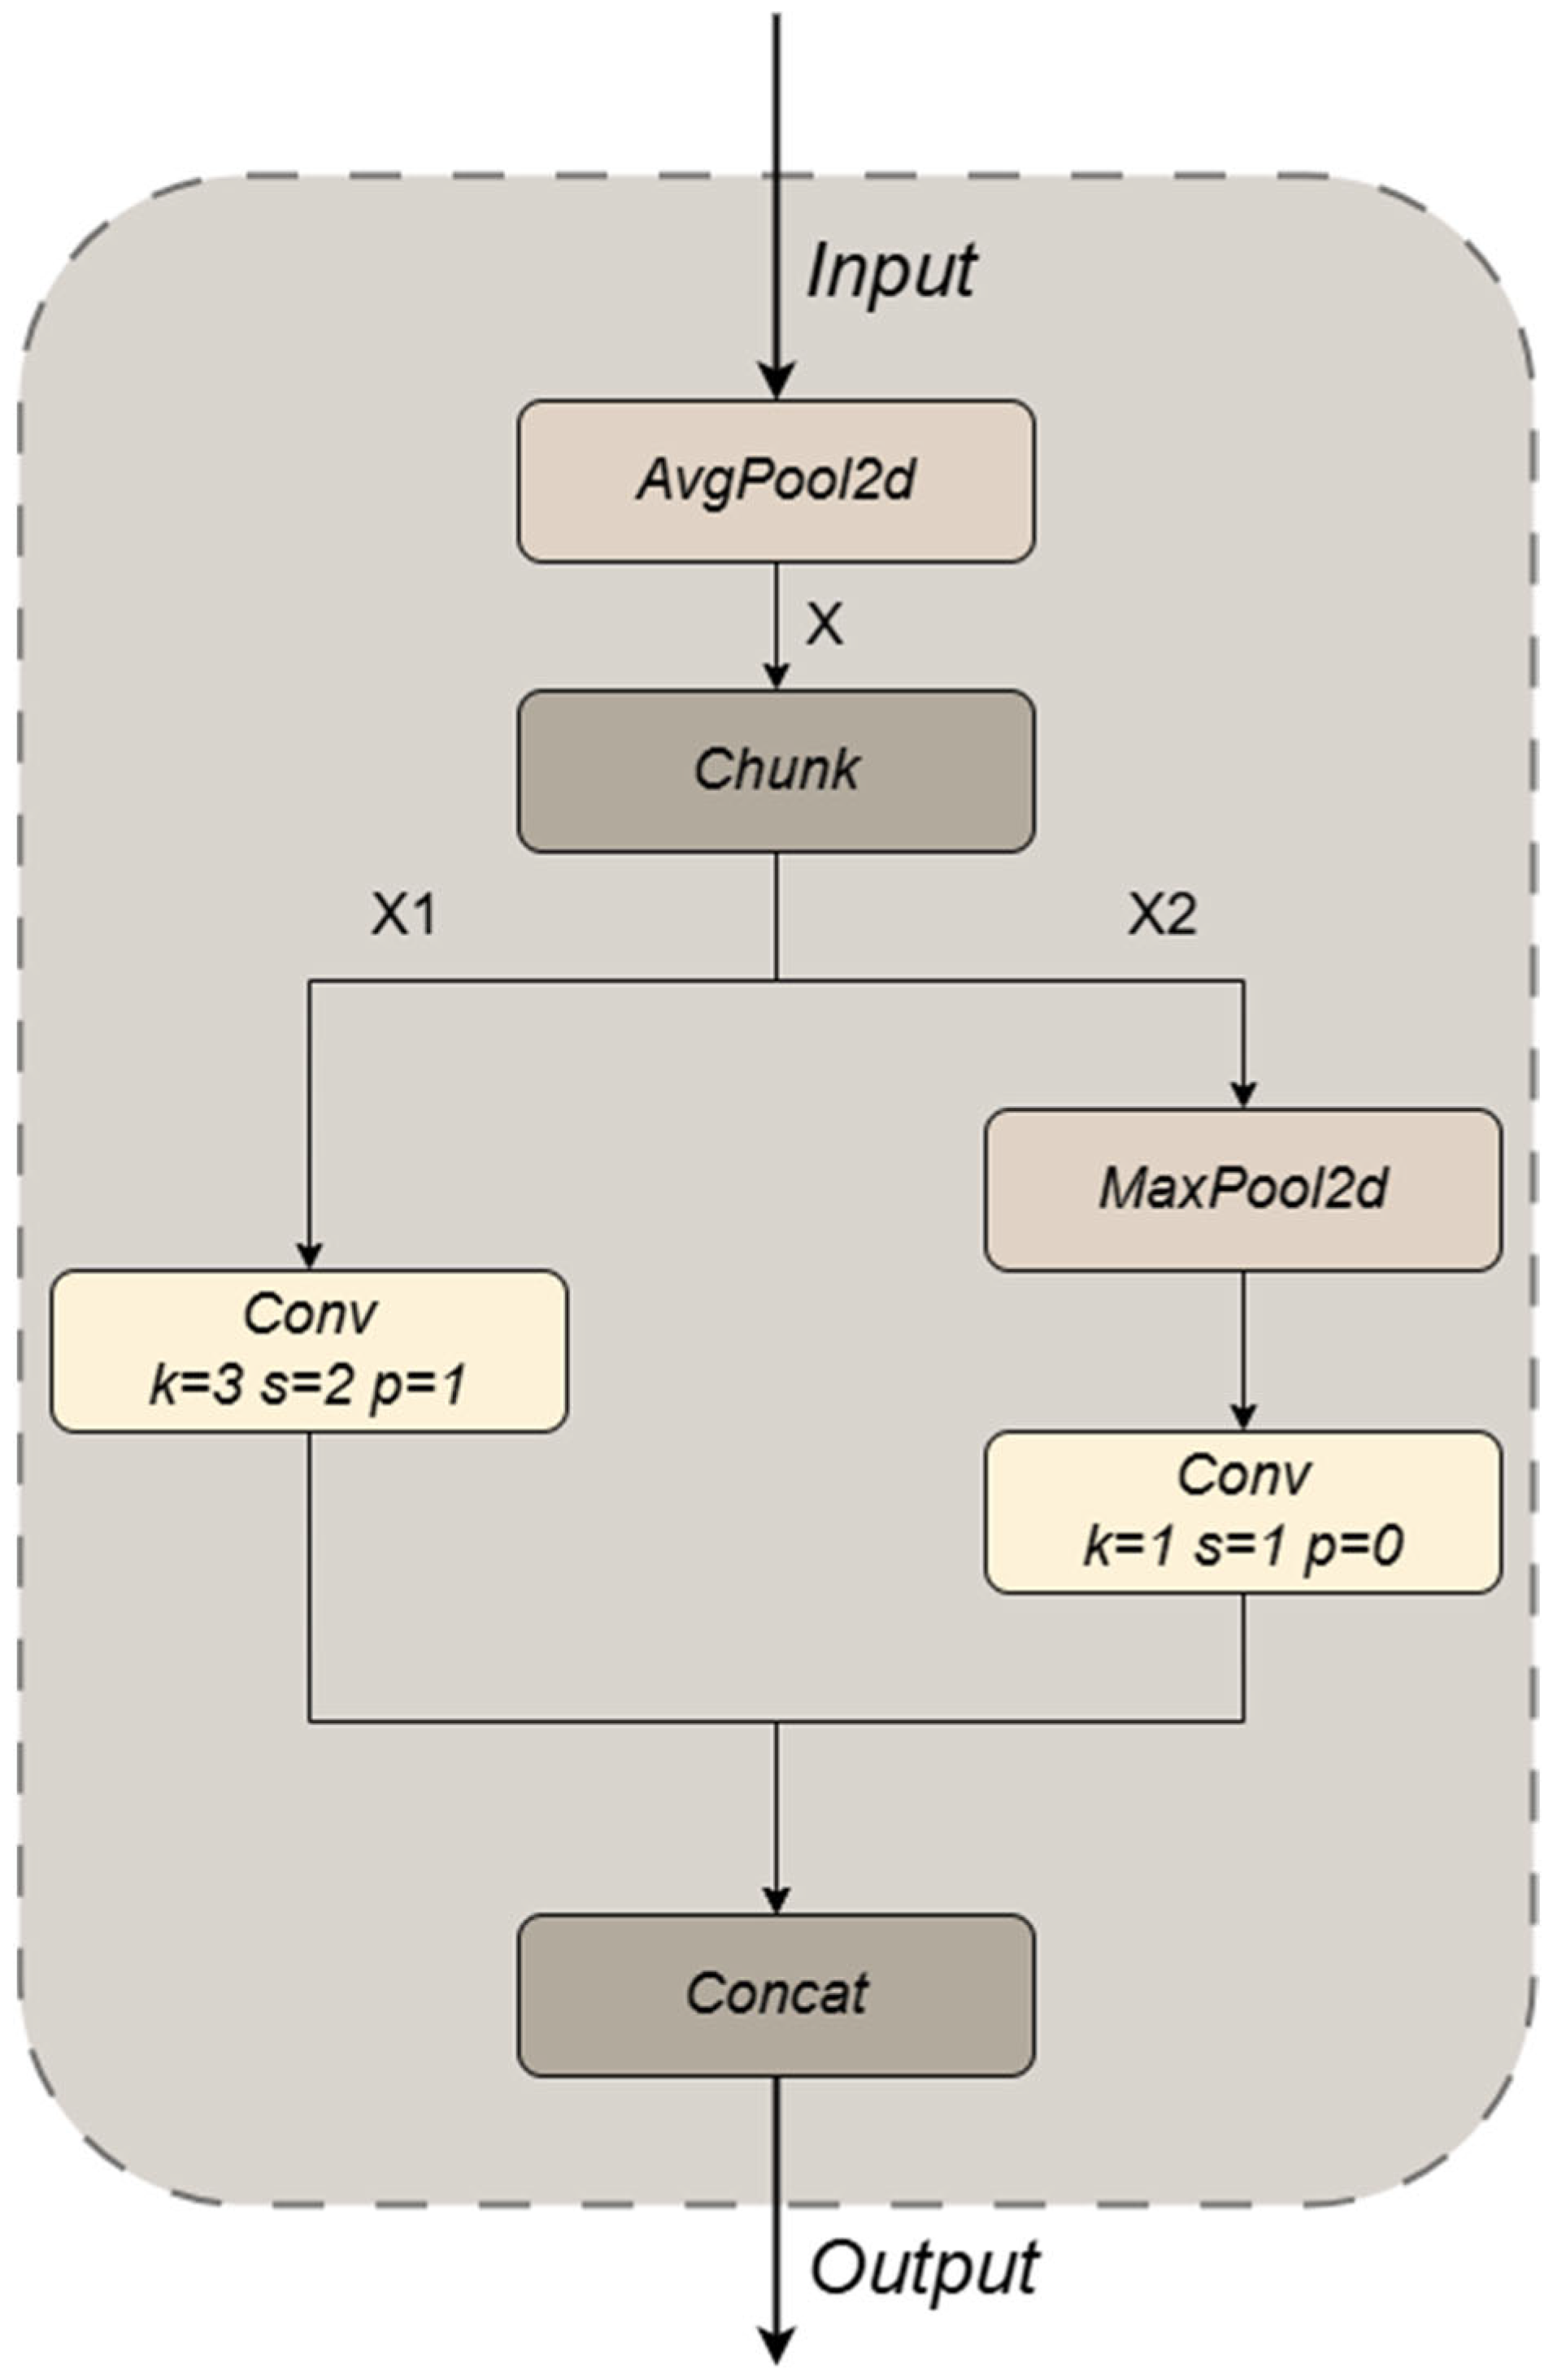
21] that significantly reduces the parameter count while improving accuracy. The ADown module performs down-sampling using convolution, average pooling, and max pooling. The input feature map undergoes down-sampling via an average pooling layer, which reduces its width and height using a defined kernel size and stride. After average pooling, the feature map is divided into two parts using a chunk operation, and the divided feature maps are further processed through separate convolutional layers to extract and refine features. For the second part of the feature split, it first goes through a max pooling layer for further down-sampling to enhance robustness to spatial features. The feature map obtained from max pooling is subsequently passed through a convolutional layer to refine and extract features (as shown in
Figure 4). The model concatenates the processed feature maps along the channel dimension and outputs them.
The ADown module can be employed in YOLOv8 to replace traditional down-sampling operations, such as the Conv module. After integrating the CCFM to improve the conventional PAN-FPN structure of YOLOv8, the ADown module can be seamlessly integrated into the backbone and head sections of YOLOv8, further reducing the number of parameters to achieve a lightweight algorithm model. Within the backbone, it can be utilized for down-sampling between different layers of the feature map, while in the head section, it can assist in further refining the resolution of the feature map for more precise object detection. In this study’s improvement of YOLOv8s, the ADown module is incorporated into both the backbone and head sections. The ADown module replaces all four Conv modules in the backbone section. Similarly, the Conv modules in two down-sampling operations are also replaced by it, in the head section.
2.4. Attention Mechanism Module
Incorporating context from various scales is crucial for detecting targets that vary in size. By integrating context data across scales, the detection performance can be significantly enhanced [
22]. Han et al. [
23] proposed a module for multi-scale feature acquisition, designated as LM-fem. Additionally, they developed the S-ECA module, which leverages multi-scale contextual data. To further improve the model’s ability to detect small-scale features and multi-scale defects [
24,
25], and to improve the expressive power of the detection head, the detection head of YOLOv8 was replaced with DyHead [
26], in the optimization of the aforementioned model. DyHead utilizes self-attention mechanisms to operate on the feature hierarchy (L), spatial (S), and channel (C) dimensions. By employing multi-attention to combine three dimensions, with each attention mechanism focusing on a single dimension, the principal computational equations are as follows:
Here, πL(·), πS(·), and πC(·) represent three distinct attention functions applied to dimensions L, S, and C, respectively, as follows:
Scale-aware Attention π
L:
Spatial-aware Attention π
S:
By performing self-attention operations between feature hierarchies, DyHead can capture features of different scales and effectively fuse them.
The spatial awareness attention module includes offset learning and a 3 × 3 convolution, focusing on every spatial position on the feature map. By learning the offsets and sparse sampling, the model can prioritize discriminative regions within the image, enhancing its spatial location awareness. Task-aware attention adjusts to various tasks, including classification and bounding box regression, by dynamically enabling or disabling feature channels, improving the model’s adaptability to various tasks. DyHead serializes and stacks the three attention modules mentioned above, allowing each module to independently operate on a dimension of the feature tensor, enhancing the expressive power of the features.
2.5. Network Structure and Parameters
Table 1 illustrates the architecture of the ACD-YOLO model. To enhance the efficiency and speed of object detection, we integrated multiple strategies into the new framework. First, a lightweight Cross-scale Feature Fusion Module (CCFM) was introduced to optimize the neck structure of YOLOv8s. Second, the ADown module was used to reconstruct both the backbone and neck, further reducing the model complexity. Finally, in the detection head, the model adopts Microsoft’s dynamic head framework and leverages attention mechanisms to improve both efficiency and performance. Collectively, these enhancements result in a final model that reduces the parameter count by 3.72 million (33.3%) compared to the baseline YOLOv8s.
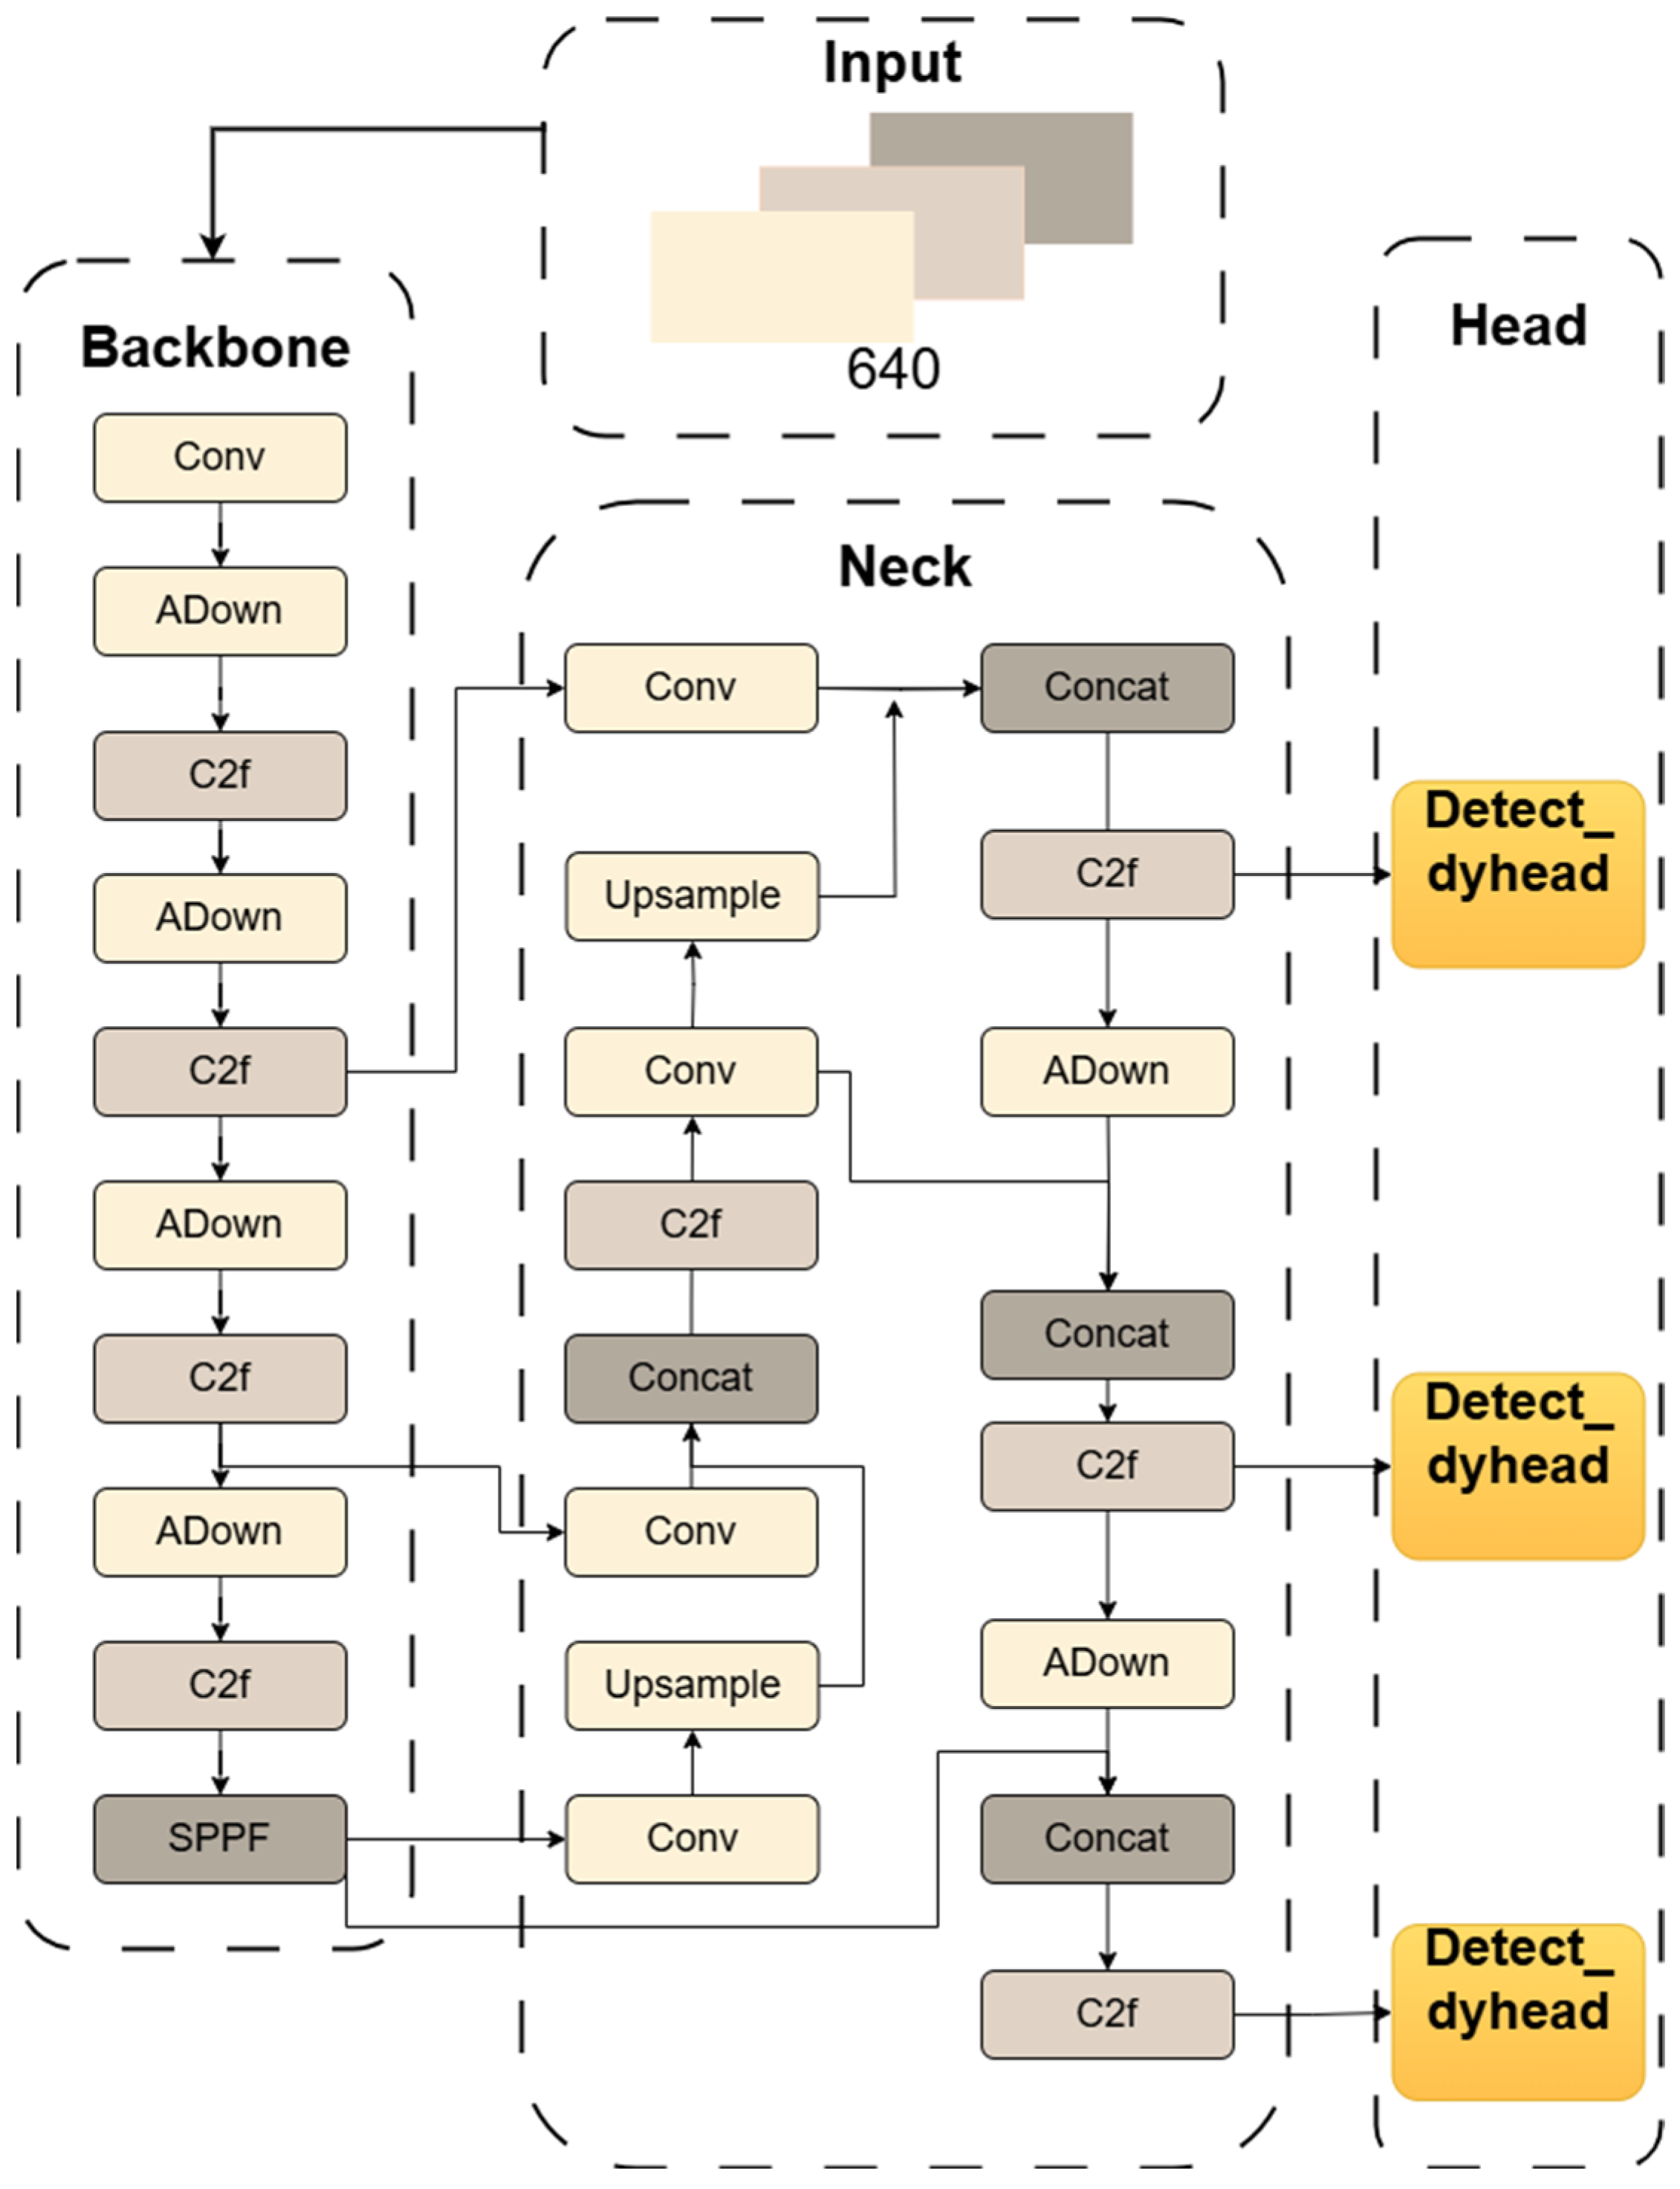
Figure 5 presents the final architecture of our proposed ACD-YOLOv8 model, clearly illustrating the structural differences from the baseline YOLOv8s model shown in
Figure 1. In the backbone, all four Conv modules responsible for down-sampling have been replaced by the lightweight ADown module. Similarly, in the neck, two Conv modules in the down-sampling path are also substituted with the ADown module. Finally, the standard Detect heads are replaced with the more powerful Detect_dyhead, which incorporates a dynamic attention mechanism. These modifications collectively contribute to the model’s lightweight characteristics and enhanced performance.
3. Results and Analysis
3.1. Experimental Environment
To verify the effectiveness of the proposed method, an experimental platform was established with Ubuntu 22.04 as the operating system and PyTorch v1.7.1 as the deep learning framework, using YOLOv8s as the baseline network model. The detailed configuration of the experimental environment and the same hyperparameters are presented in
Table 2 and
Table 3.
3.2. Dataset and Evaluation Metrics
This study employed the open-source dataset RDD2022 [
27], which is composed of road images collected from multiple countries. For experimental validation [
28], a total of 4378 road images from China were selected. The dataset comprises 2401 images captured by drones and 1977 images taken using vehicle-mounted cameras. This research considered five types of road defects: longitudinal cracks (D00), transverse cracks (D10), mesh cracks (D20), potholes (D40), and road repairs (Repair). As certain photos in the training set lack the five types of road defects analyzed in this study, the dataset must be processed and filtered to exclude images unrelated to the detection targets. After processing, the dataset contains 4373 images, with 2396 images in China Drone and 1977 images in China MotorBike.
Table 4 illustrates the distribution of road defect types within the dataset. The dataset was split into training, validation, and testing sets with a ratio of 7:2:1.
This paper employs the mean Average Precision at 50% overlap (mAP50) and the mean Average Precision at 50–95% overlap (mAP50:95) as metrics to measure detection accuracy. The parameter count (Params) and frames per second (FPS) are used as key metrics for evaluating efficiency and real-time performance. Moreover, the F1-score is utilized to assess the model’s overall performance and stability; The F1-score represents a combination that balances precision and recall rates, with higher values indicating stronger performance and robustness of the model. The calculation formula for the F1-score is shown in Equation (5). Furthermore, model size is used to assess the suitability for deployment on edge devices.
Precision (P) represents the proportion of correctly predicted positive samples out of all predicted positive samples, while Recall (R) denotes the proportion of accurately identified positive samples relative to all actual positive samples. True Positives (TP) are positive samples correctly classified, False Positives (FP) are negative cases incorrectly classified as positive, and False Negatives (FN) are positive cases that the model fails to detect. The formulas for precision and recall are provided below:
mAP (mean Average Precision) indicates the average precision across multiple classes. mAP@0.5 represents the average precision at a threshold of 0.5. mAP@0.5:0.95 is a more stringent evaluation metric, which calculates the mAP values across the 50–95% IoU threshold range and averages the results. This provides a more accurate assessment of the model’s performance at different IoU thresholds. The F1-score illustrates how precision indicates the model’s ability to distinguish between negative samples. The higher the precision value, the more effective the discrimination between negative samples. Recall reflects the model’s ability to correctly identify positive samples. A higher recall value indicates better accuracy in identifying positive samples.
3.3. Feature Fusion Network Lightweight Improvement Experiment
To assess the effectiveness of the lightweight design in the improved feature fusion network, independent experiments were performed and compared against the original baseline. Additionally, the lightweighting effect was compared with the BiFPN [
29] module, which demonstrates excellent model performance. The BiFPN module improves model performance by leveraging bidirectional feature fusion and weighted fusion mechanisms, simplifying the network structure to achieve lightweight effects.
Table 5 presents the detailed experimental results.
As illustrated in
Table 5, compared to the original YOLOv8s algorithm model, the model that introduced BiFPN not only showed a decrease in accuracy, but also had a very limited optimization in terms of parameter count and model size. However, the model that introduced CCFM, although also experiencing a slight decrease in mAP@0.5 and mAP@0.5:0.95, was able to significantly reduce the parameter count and model size, with reductions of approximately 3.8 M and 7.7 m, respectively.
The results demonstrate that the proposed methods successfully simplify the network structure, achieving the goal of lightweighting the feature fusion network. It enables the model to deliver excellent performance and accuracy when handling complex tasks, enhances YOLOv8s’ detection capabilities for scale variations and small targets, significantly reduces the parameter count, and substantially decreases the size of the trained model.
3.4. Comparison of Different Lightweight Down-Sampling Effects
This work introduces the SCDown module [
8], which also exhibits excellent down-sampling performance, into the YOLOv8s algorithm, to carry out comparison studies in order to more accurately assess the effectiveness of the lightweight down-sampling ADown module in improving accuracy of the YOLOv8s. By using pointwise and depthwise convolution, the SCDown, which is discussed in YOLOv10, increases efficiency via lowering computing costs and the total amount of parameters. The validated experimental findings are shown in
Table 6.
As can be observed from
Table 6, introducing the SCDown module into the YOLOv8s algorithm does indeed alleviate the network structure and reduce the model size. However, this simplification also leads to a decline in the algorithm’s detection performance. The results of the ADown module indicate that although the total amount of parameters is slightly increased compared to the introduction of SCDown, in addition to somewhat increasing the model’s detection accuracy, it nevertheless lowers the parameter count by 1.5 million when compared to the baseline model. The greatest substantial rise was shown in mAP@0.5:0.95, which rose by around 0.5%. The results demonstrate that the introduction of ADown achieves a balance between model lightweighting and detection accuracy; the lightweighting achieved by ADown is effective and does not simply trade off detection accuracy for lightweighting.
3.5. Attention Mechanism Module Experiment
In the YOLOv8s model, we replaced the original module with the DyHead module, which is based on a multi-attention mechanism, and compared its performance with the original network. The DyHead module effectively employs an integrated attention mechanism, resulting in clearer and more focused feature maps; each application of attention optimizes the feature representation, enhancing detection performance and efficiency.
Table 7 displays the experimental data, which indicate a 0.6% rise in mAP@0.5 and a 1.7% increase in mAP@0.5:0.95.
Furthermore, the model’s parameters, computational complexity, and weights have all been reduced. The outcomes demonstrate that the DyHead module enhances the original model’s feature extraction potential, which boosts the algorithm’s detection power even more, as shown in
Table 7.
3.6. Ablation Experiment
Data from
Table 8 shows that by reconstructing the neck portion of YOLOv8s using the CCFM concept, 34% fewer parameters were used, and the overall model size was significantly reduced, achieving a lighter model. However, there was a 1.5% decrease in model accuracy (mAP@0.5). Replacing standard convolution in YOLOv8 with ADown had minimal impact on precision and F1-score, but it optimized the model’s parameter count and size. Experimental results further demonstrate that using the ADown module in combination with the CCFM structure produced more notable improvements, optimizing both model size and parameter count while maintaining precision and F1-score. We replaced the original YOLOv8 detection head with the DyHead head to significantly improve detection precision as well as effectiveness. This greatly improves accuracy even if it somewhat increased the number of parameters and computing complexity.
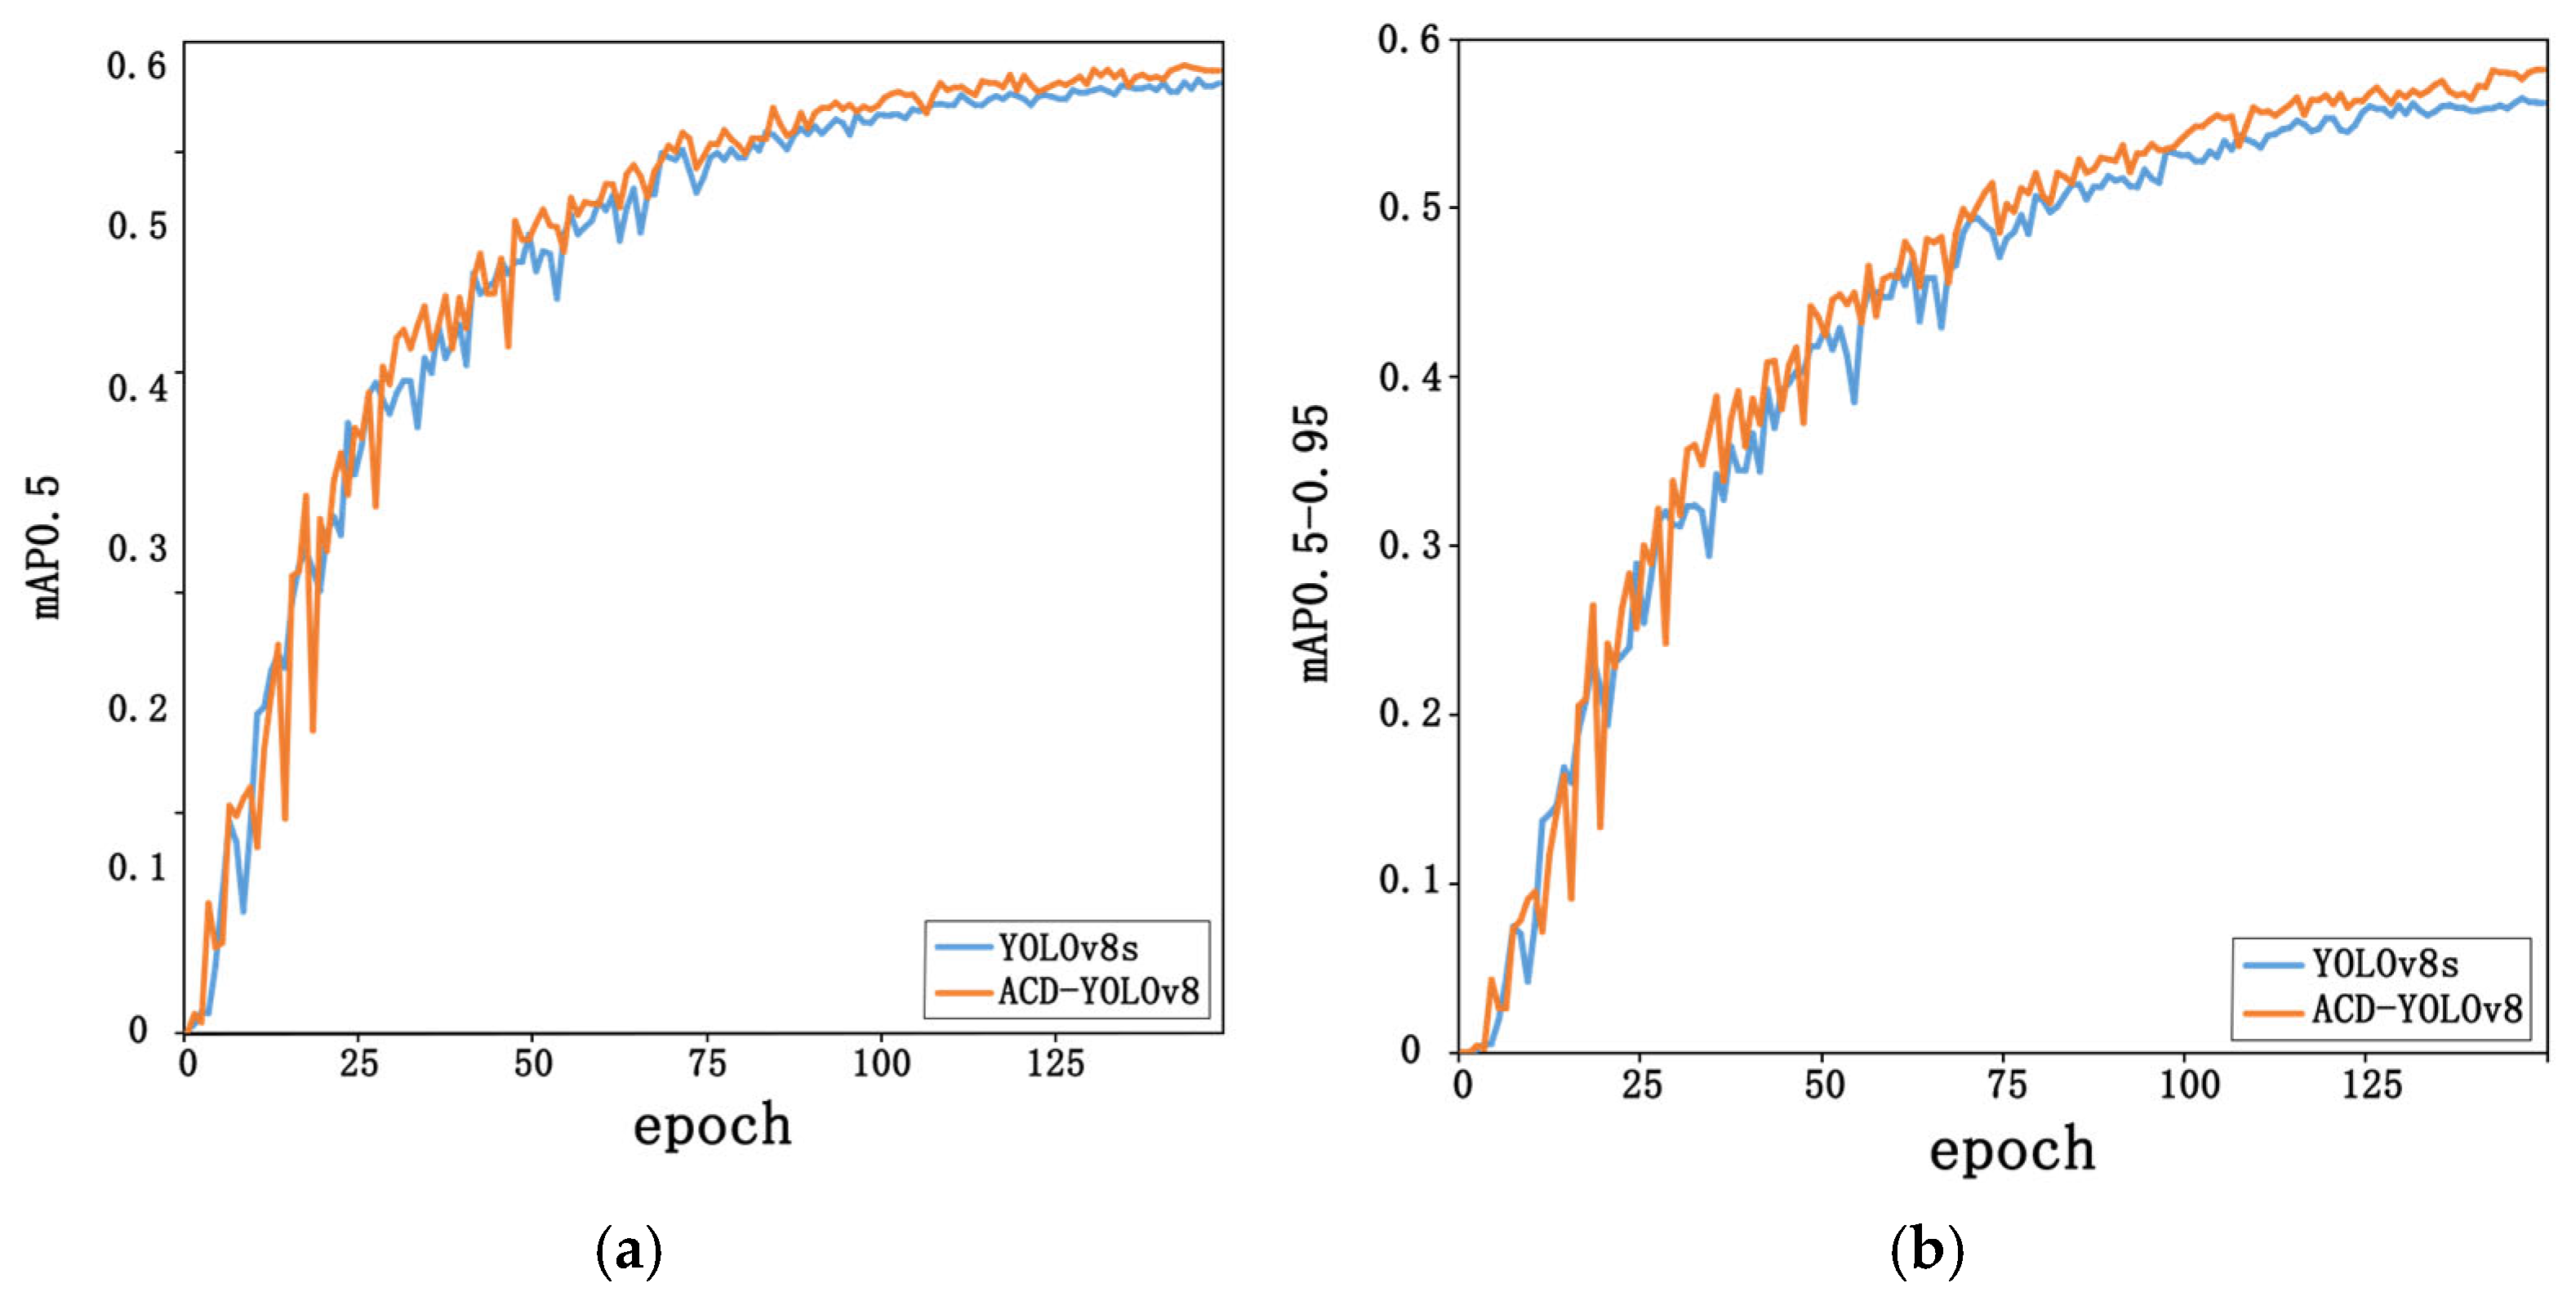
Overall, in terms of detection accuracy, parameter count, model size, and F1-score, the upgraded YOLOv8s model—which integrates the CCFM, ADown, and DyHead modules—has outperformed the original YOLOv8 model. Using the same dataset, the improved YOLOv8 model improved mAP@0.5 by 0.9% and mAP@0.5:0.95 by 1.6%, with a reduction of 3.7 million parameters and a 34% decrease in model size, effectively meeting the requirements for model lightweighting. The detailed accuracy comparisons between the original and upgraded models are presented in
Table 8 and
Figure 6.
3.7. Interpretability Experiment
Deep learning models are sometimes referred to as “black-box” models because, despite their exceptional performance on a variety of tasks, it is challenging to understand how they make decisions and reason. Developing an intuitive knowledge of deep learning models’ performance requires a thorough understanding of their interpretability. For validation purposes, we chose the ACD-YOLOv8 and the YOLOv8s for this investigation.
We conducted a detailed evaluation of the two models’ performance by analyzing their confusion matrices, as shown in
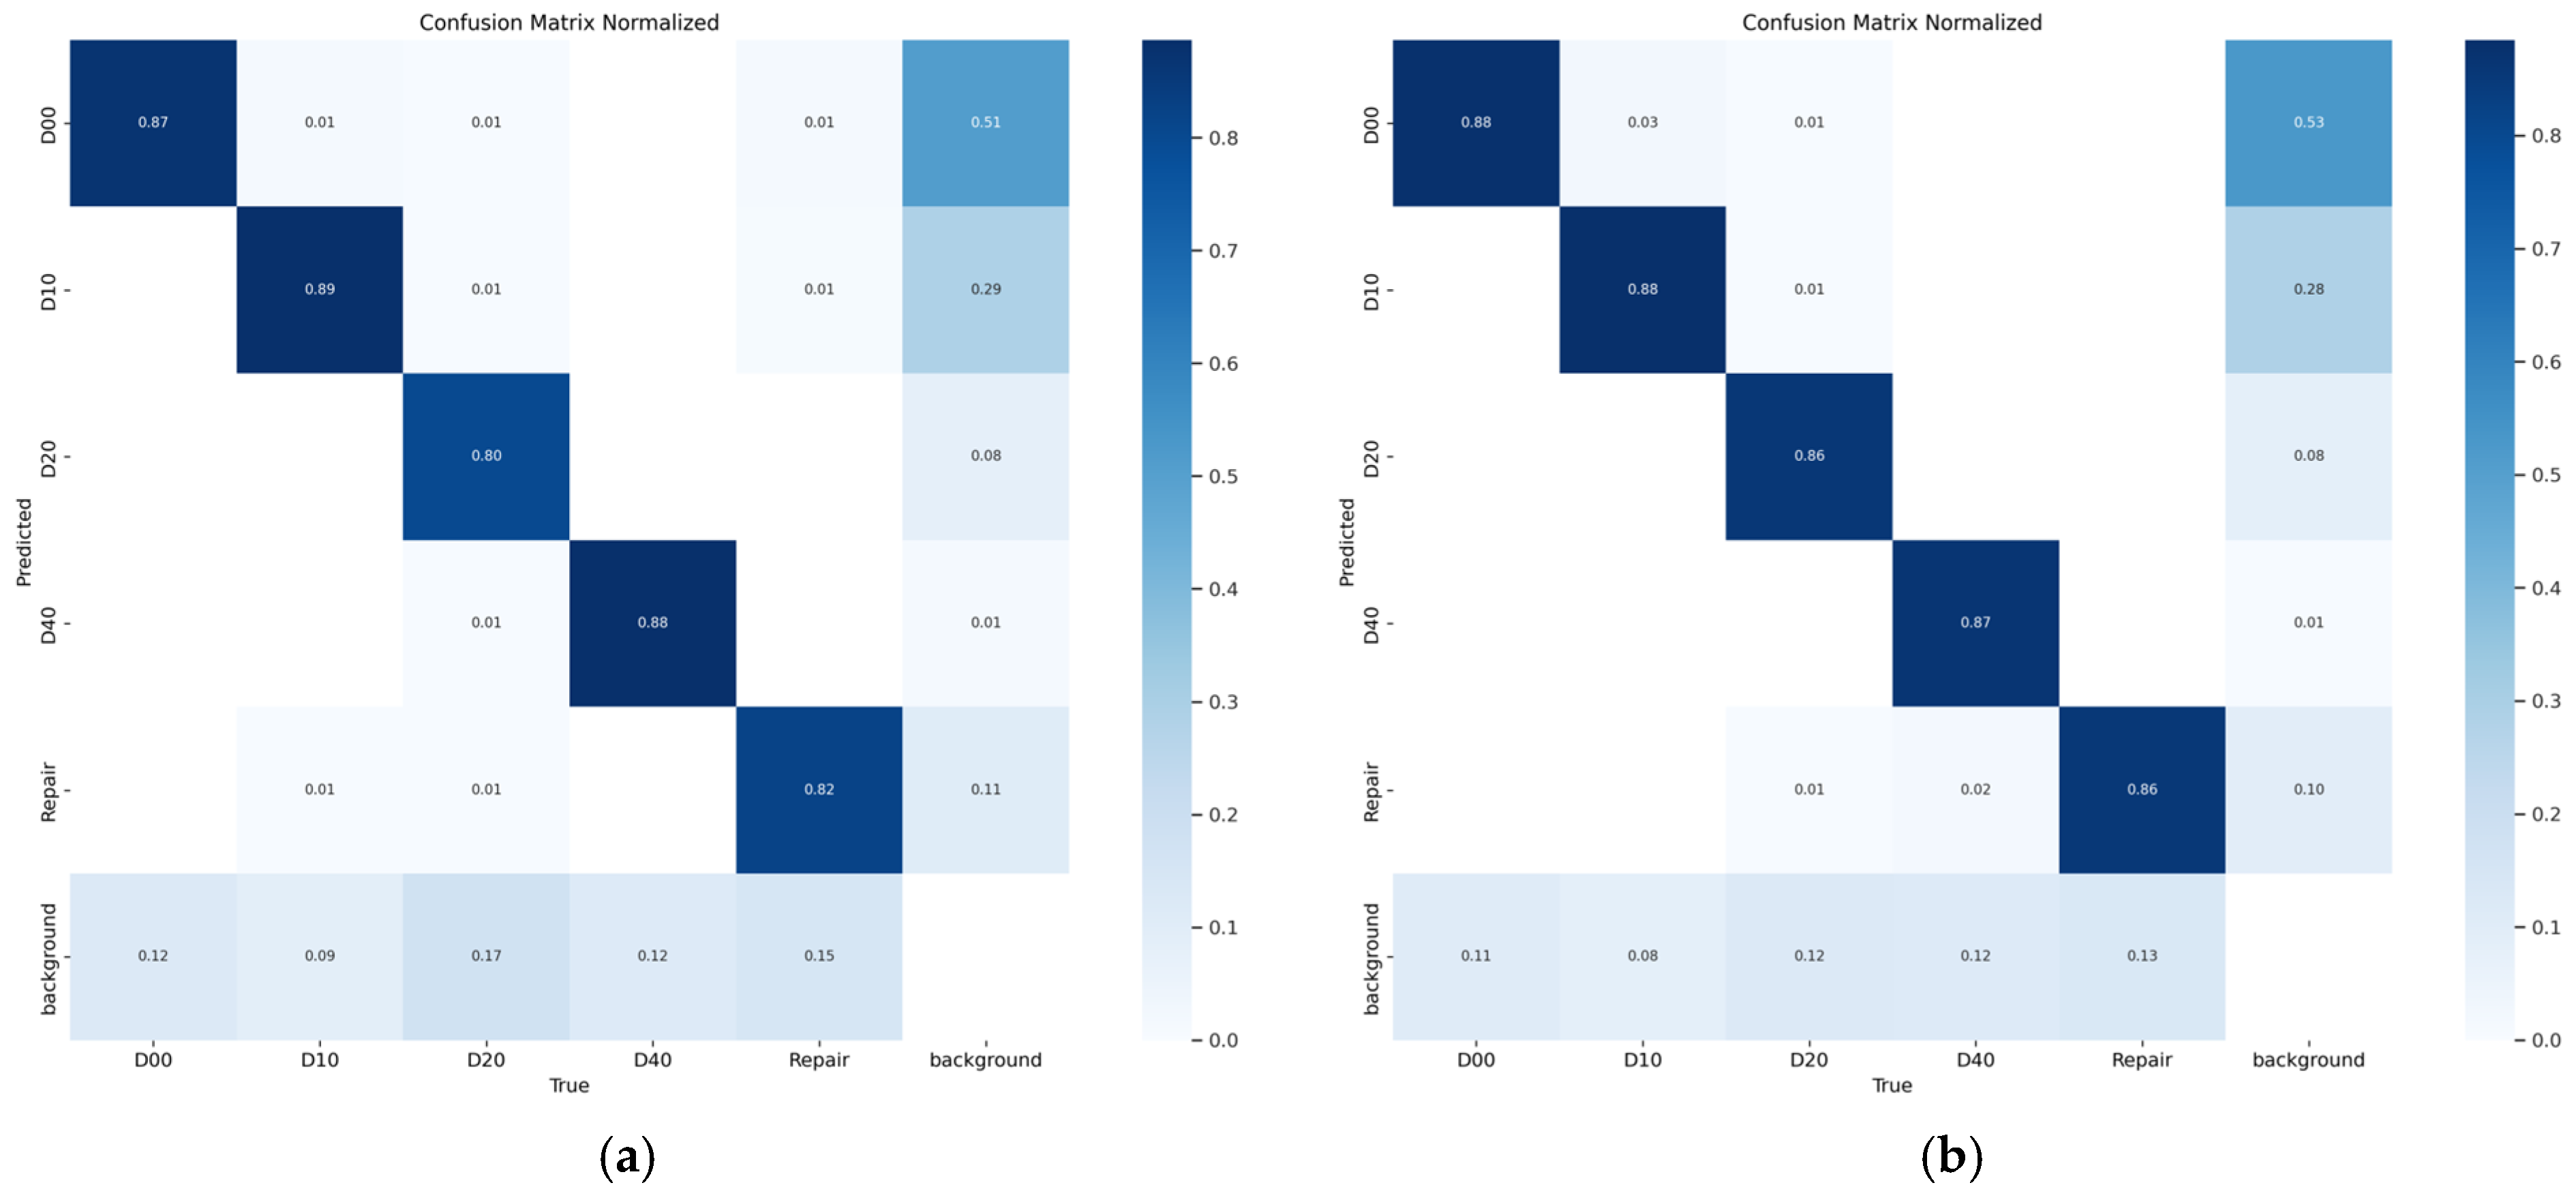
Figure 7. The results reveal that both models demonstrate notable limitations, including high false negative rates and elevated false positive rates. Both models perform well in detecting D10 (transverse fractures) and D40 (potholes), according to a thorough investigation. At 80% and 82% accuracy rates, respectively, the initial YOLOv8s model did not do well in identifying D20 (mesh cracks) or Repair (road repairs).
In comparison, the ACD-YOLOv8 introduced in this study achieved a notable enhancement in recognition accuracy for D20 and Repair, with improvements of 6% and 4% respectively, as shown in
Figure 7.
3.8. Comparison of Performance of Different Models
This study performed comparison trials using many popular object identification algorithms to assess the improved model’s performance [
30]. The selected models include not only the mainstream YOLO series target detectors based on CNNs, such as the earlier YOLOv5, YOLOv6 [
31], and YOLOv7, and the latest YOLOv9 and YOLOv10, but also multiple versions of Transformer-based target detectors, such as RT-DETR-l [
32] and RT-DETR-resnet50. The same dataset was used in the studies, and the same experimental setup was used. For comparison, one image from a vehicle-mounted camera and two drone-captured road condition photos from the RDD2022 dataset were chosen for identification and detection. The detection results are shown in the picture, where different defect types are indicated by annotations and different defect categories are represented by colored detection boxes. For instance, D00 denotes longitudinal cracks, D10 transverse cracks, D20 mesh cracks, D40 potholes, and Repair denotes road repairs.
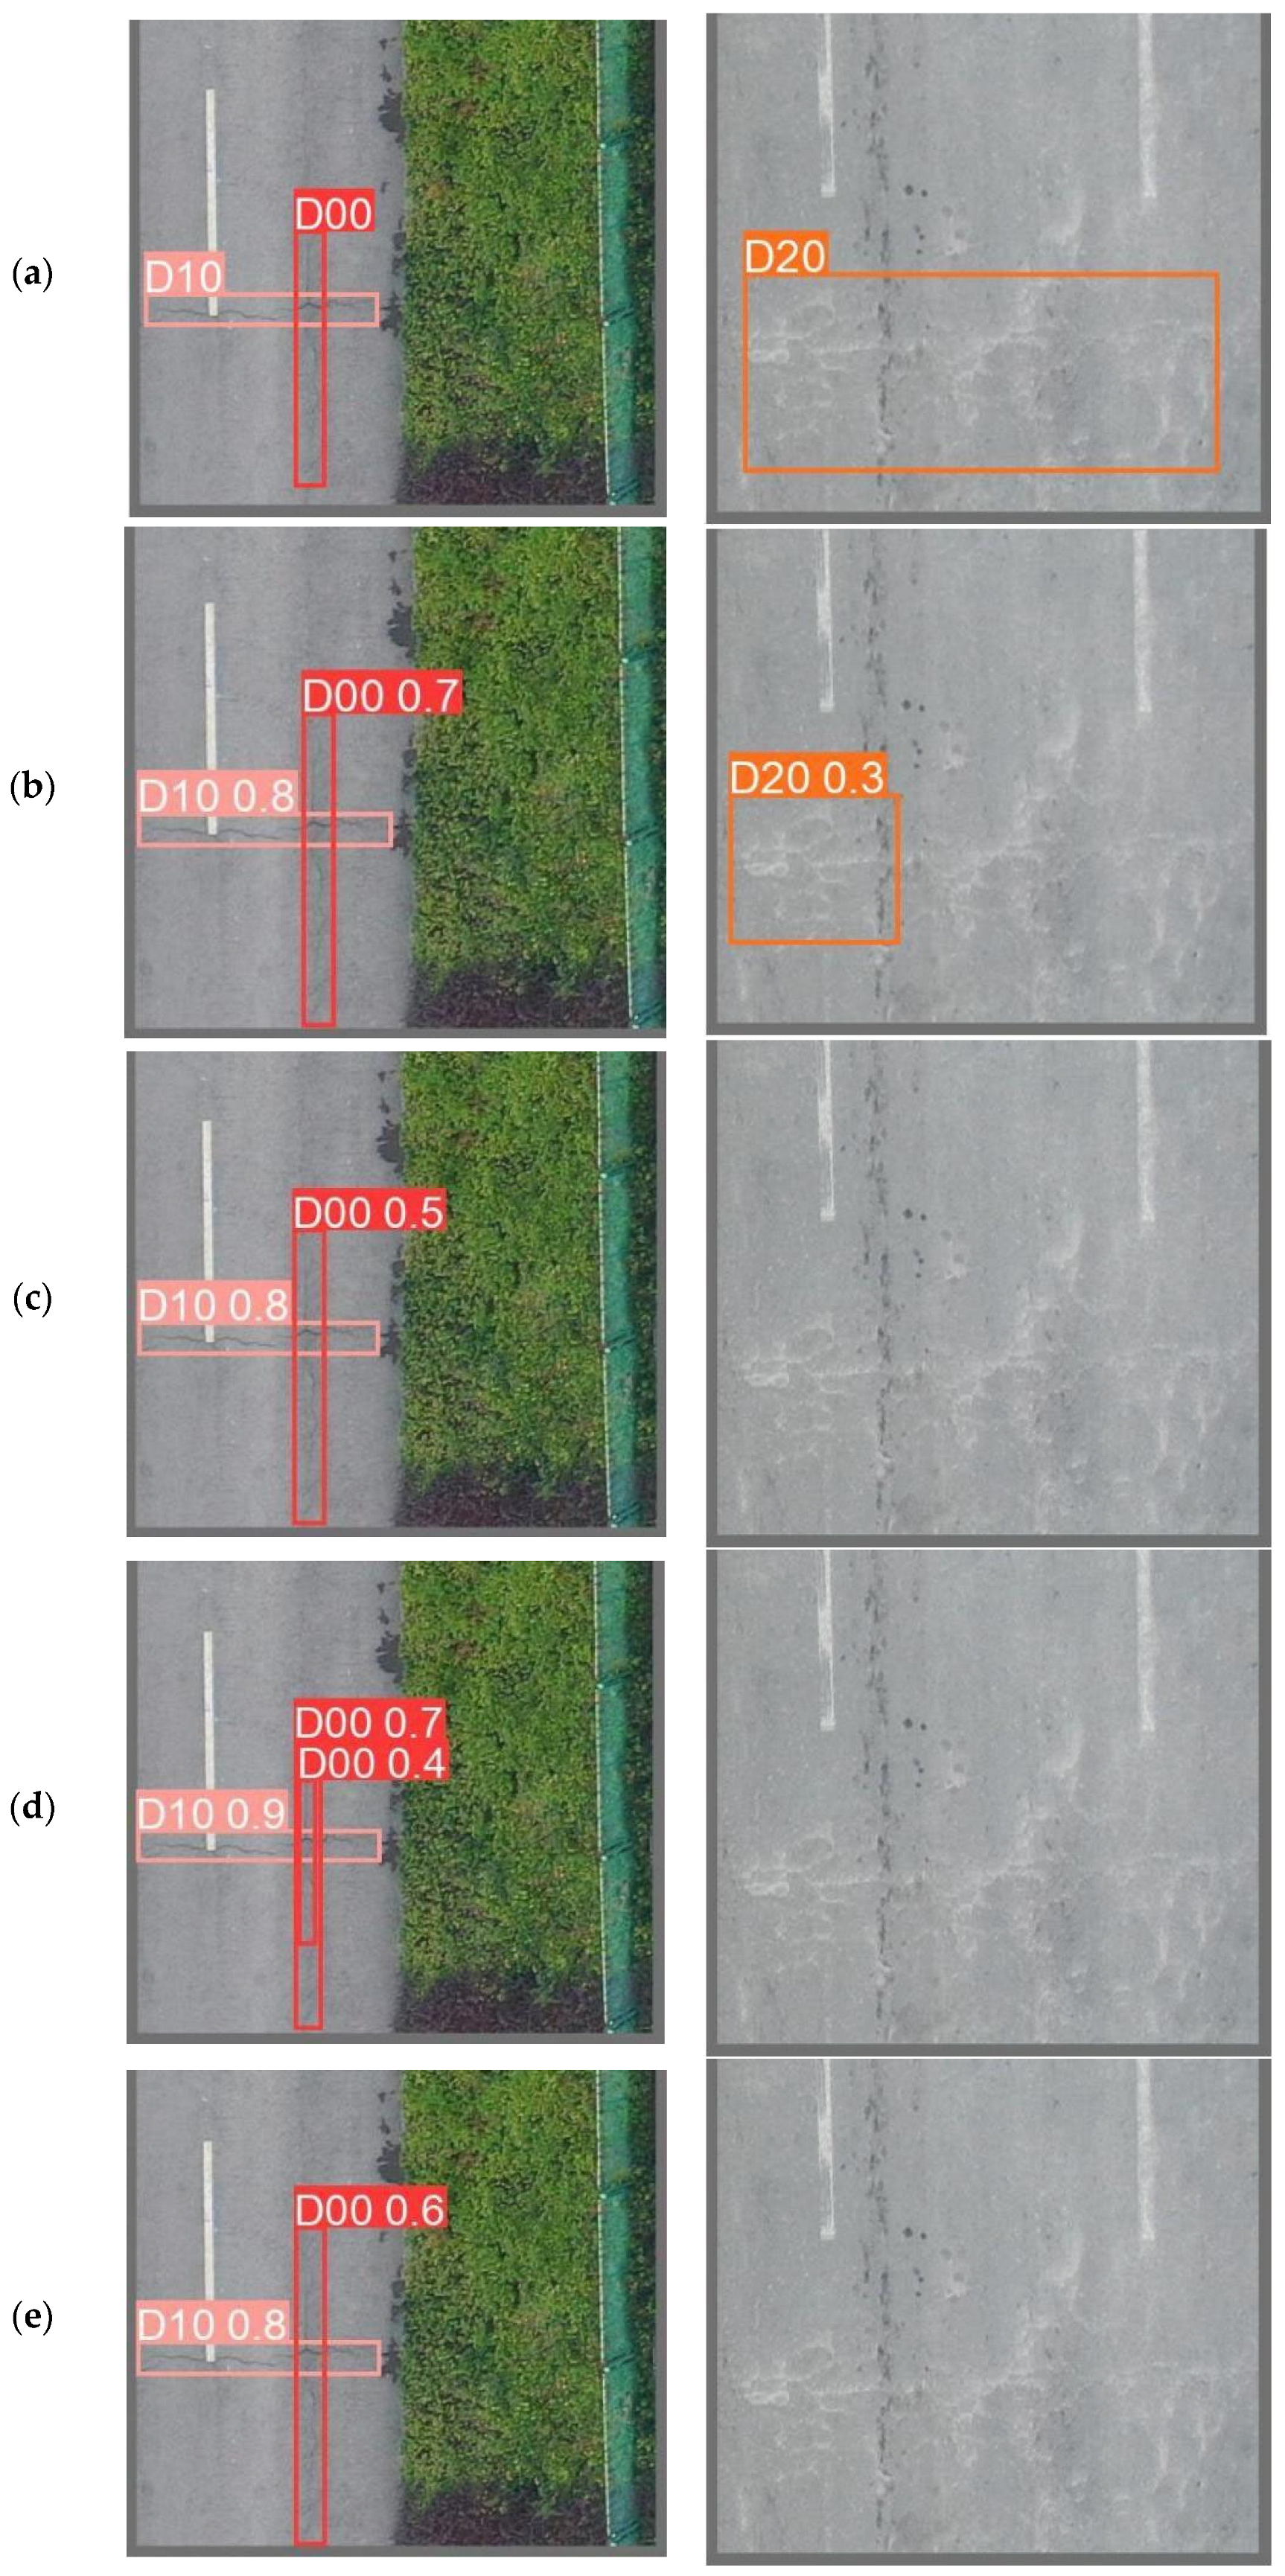
Drone-captured photos were used in two sets of studies, and
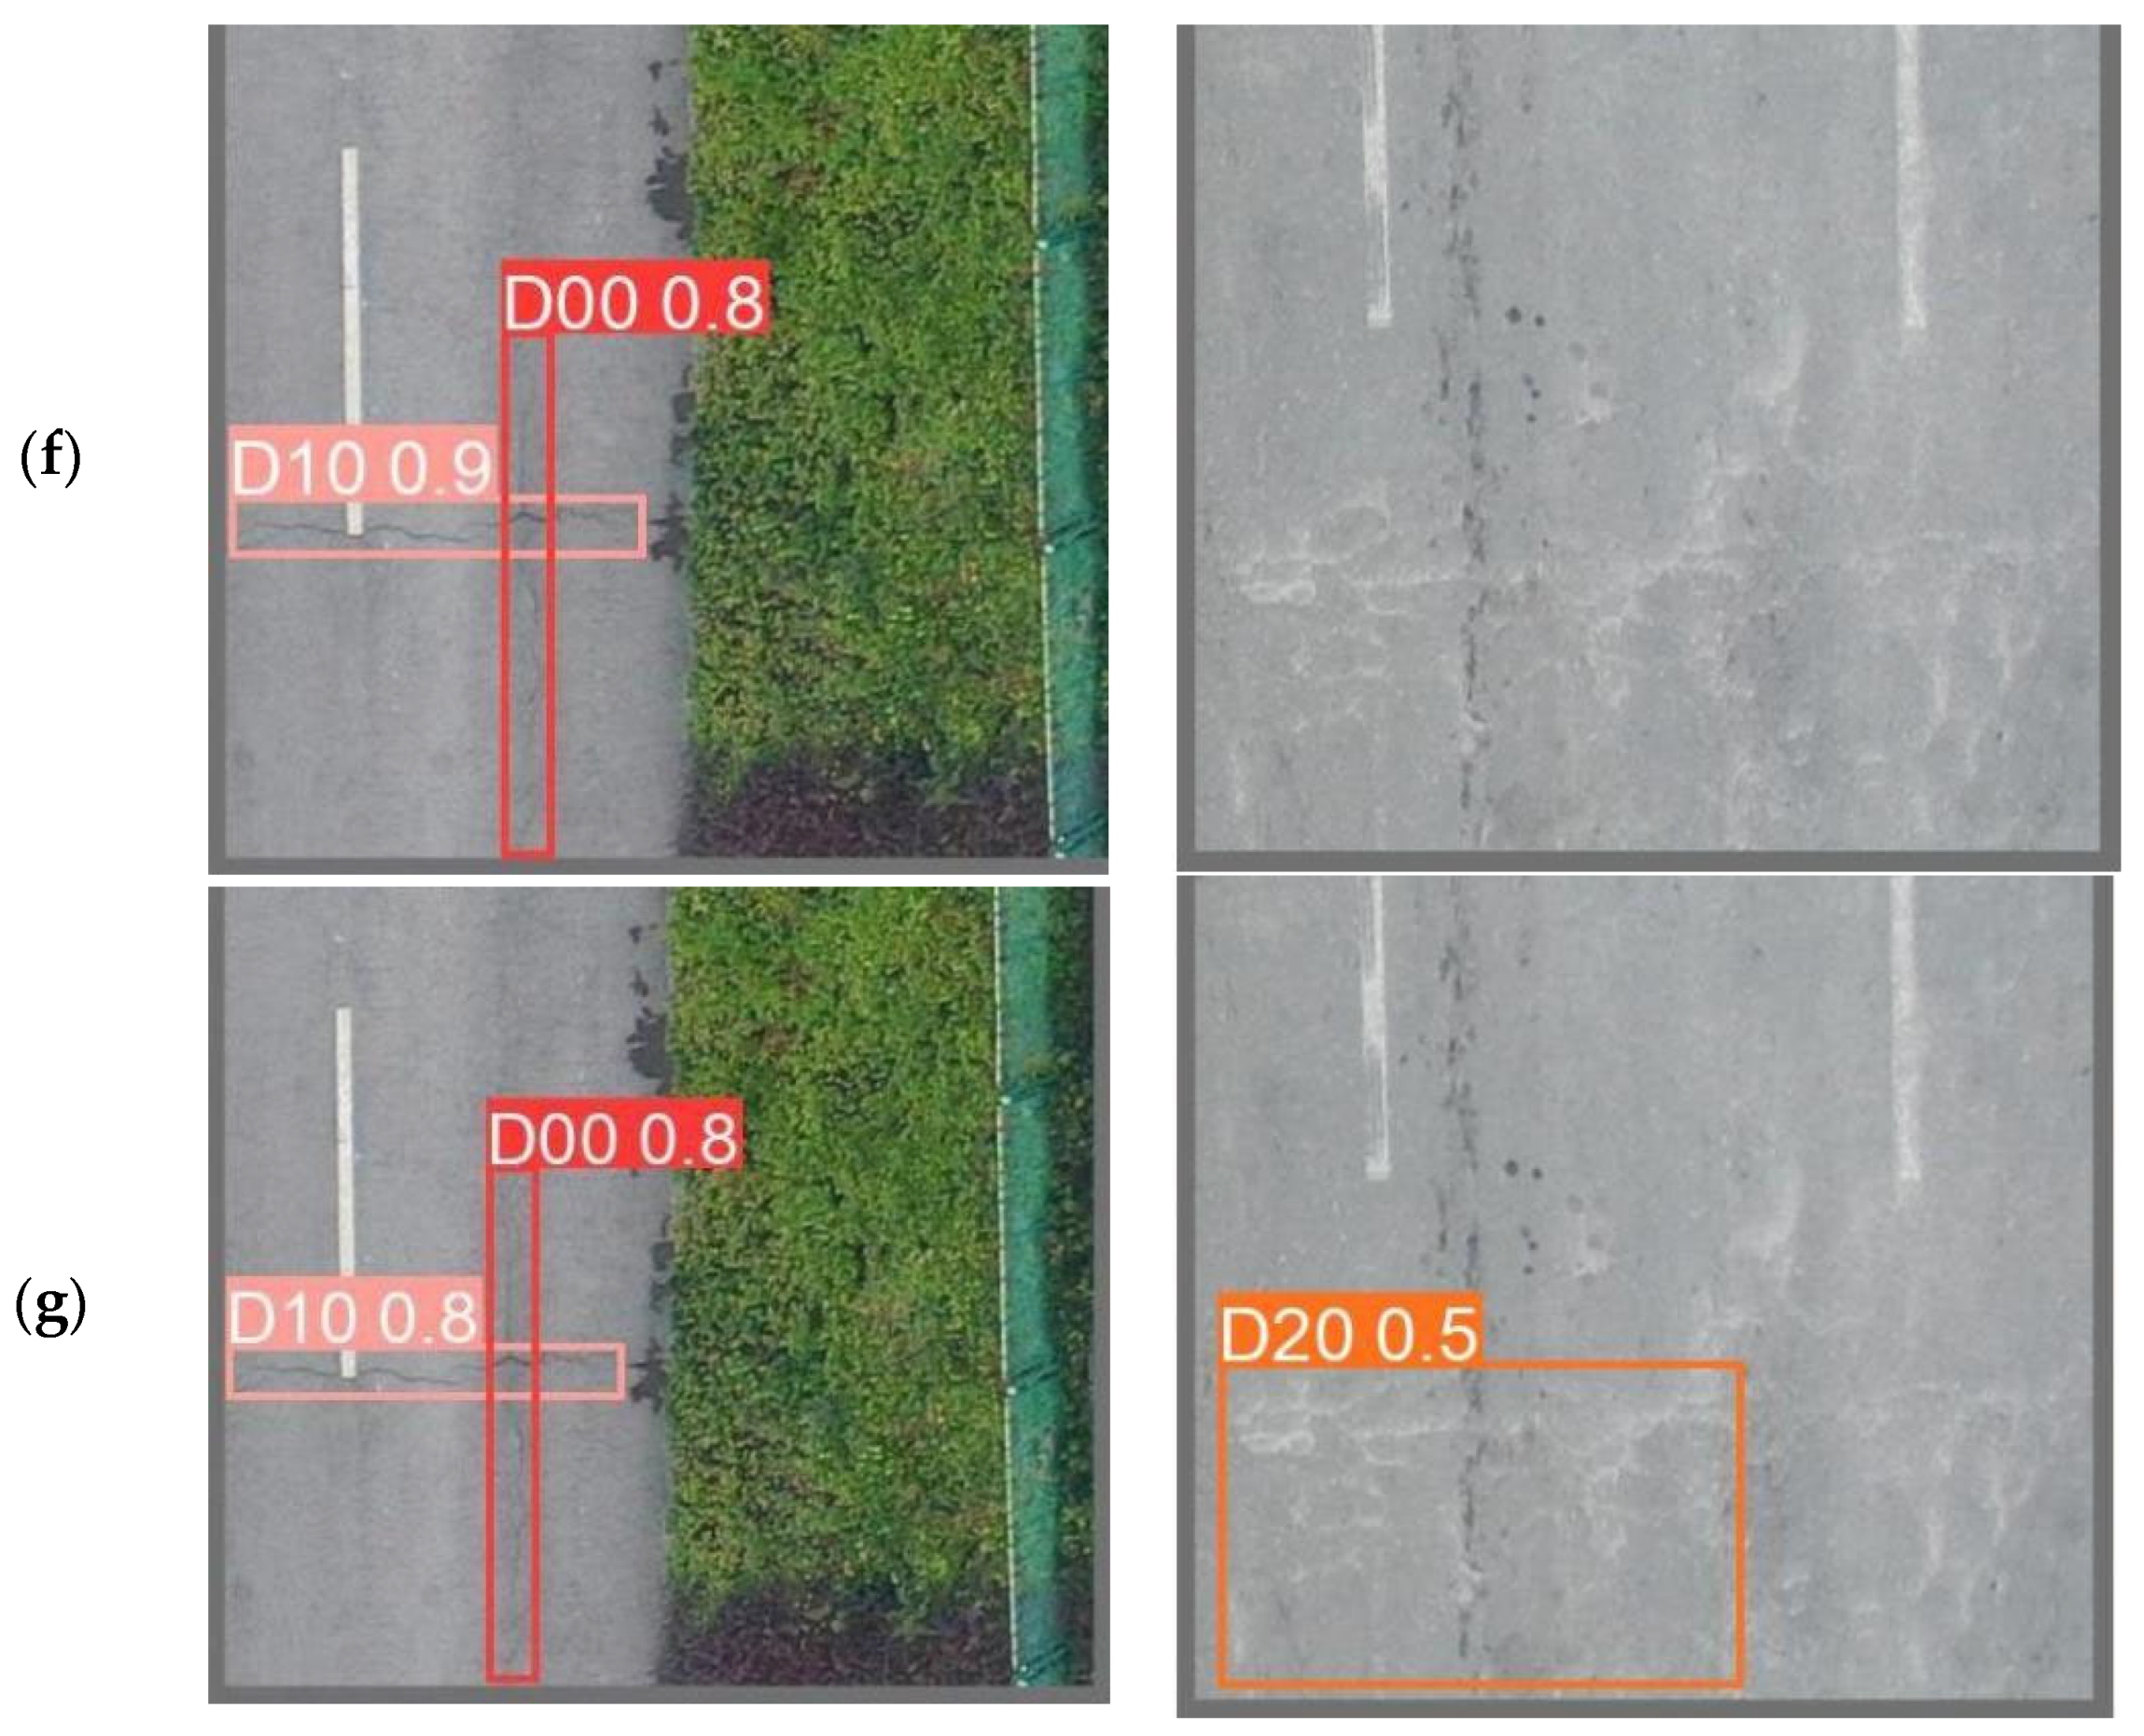
Figure 8 displays the detection outcomes of several models. In the first experiment, none of the models exhibited any missed or false detection, and all models demonstrated good recognition capabilities for the D10 class of defects. Although all targets were successfully detected for the D00 class, there was a significant variation in defective detection effects, with the YOLOv6s model being the most affected. Due to the slightly poorer detection performance of YOLOv8s for the D20 class, the second scenario was an experiment targeting the detection of D20 class defects. The results showed that only the YOLOv5s and ACD-YOLOv8 detected the presence of D20 road defects, but although the YOLOv5s model could detect defects in this experiment, its IoU value was very low at 0.3, indicating that the predicted bounding box was highly inaccurate. On the other hand, ACD-YOLOv8 was successfully detected in this experiment at an IoU threshold of 0.5. With fewer misses and more precise projected bounding boxes than previous models, the ACD-YOLOv8 model put forward in this study performed exceptionally well in both trials.
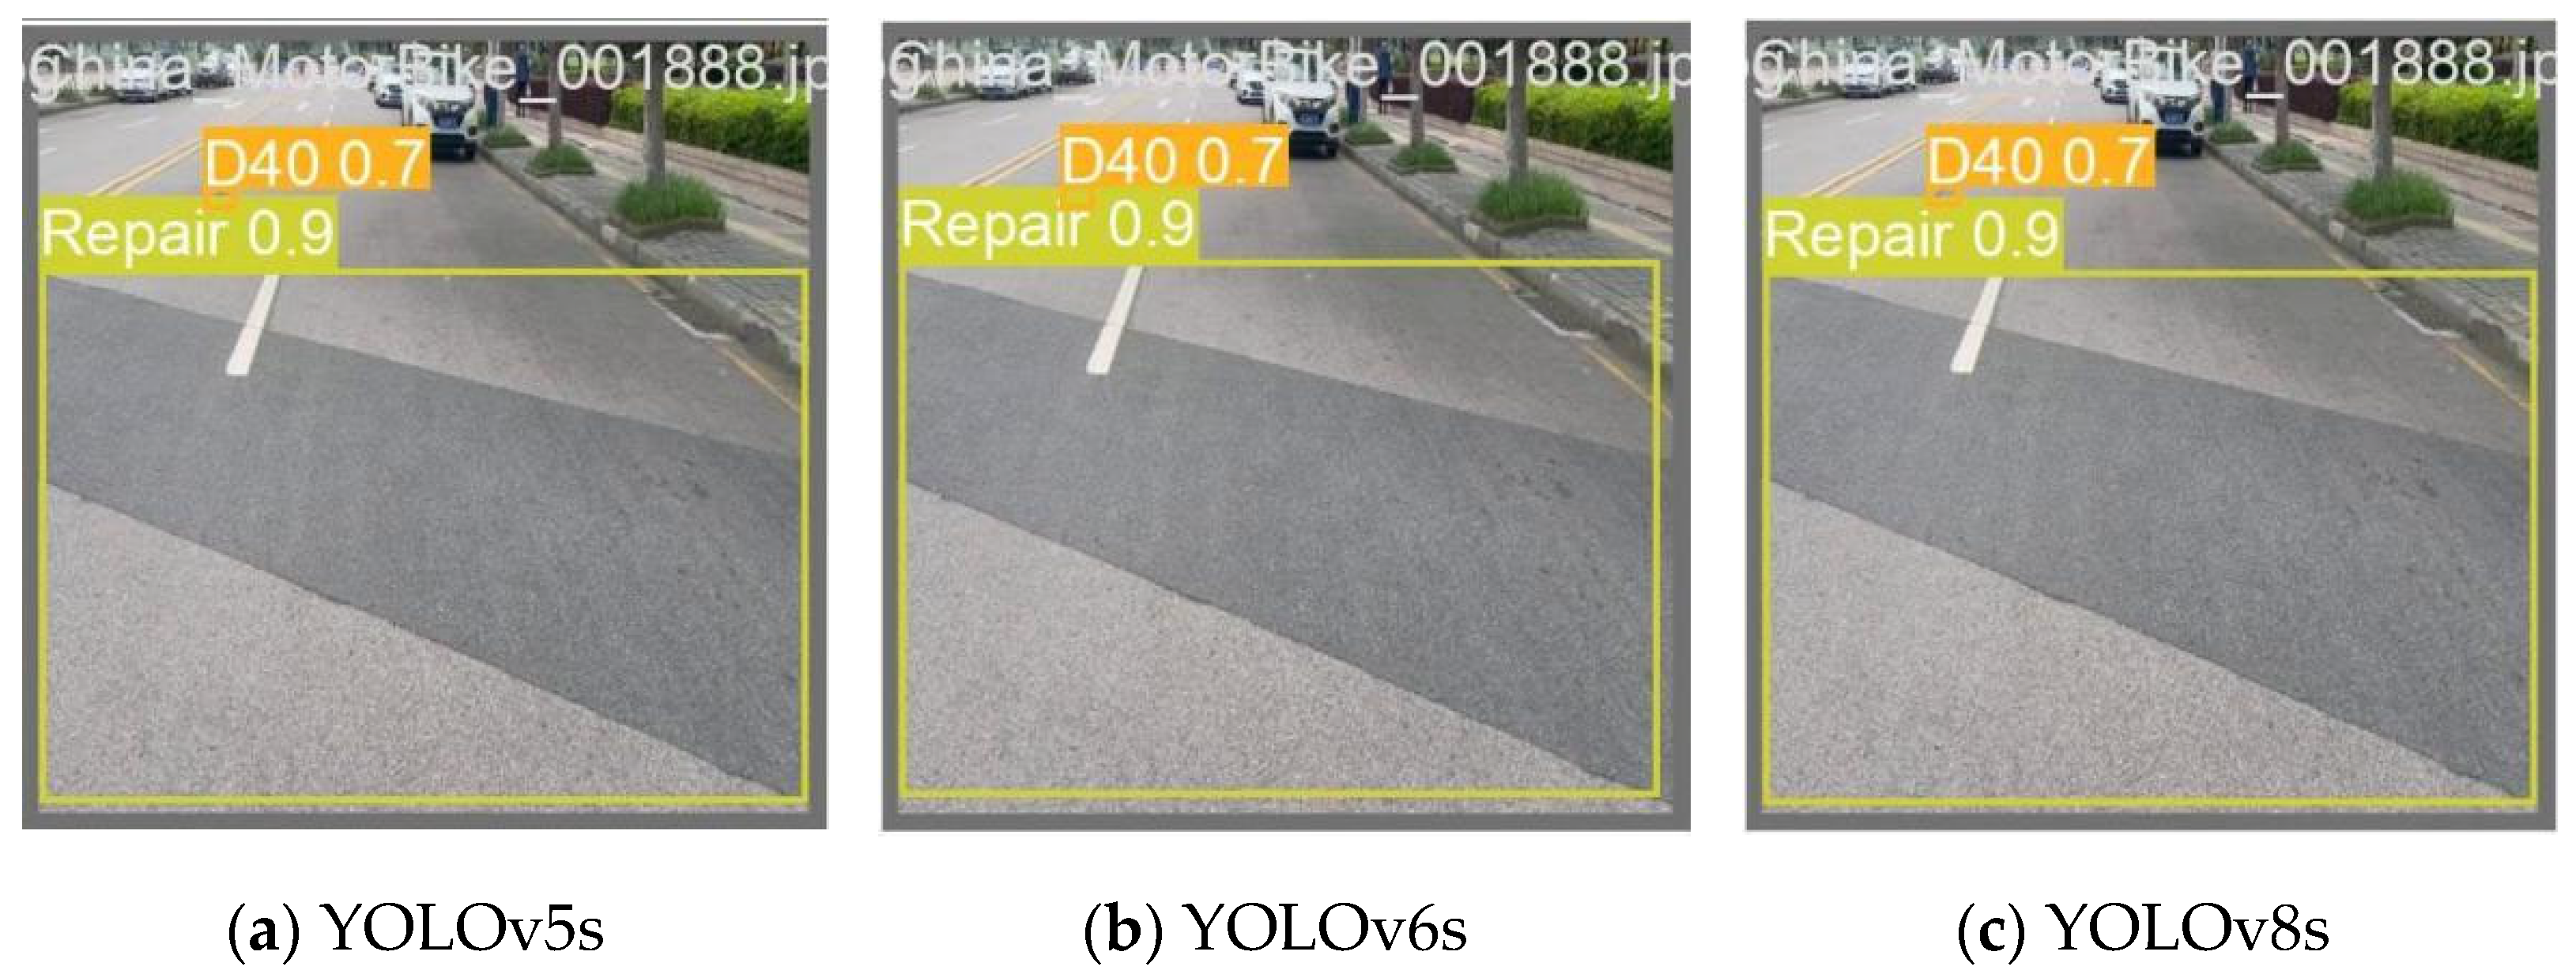
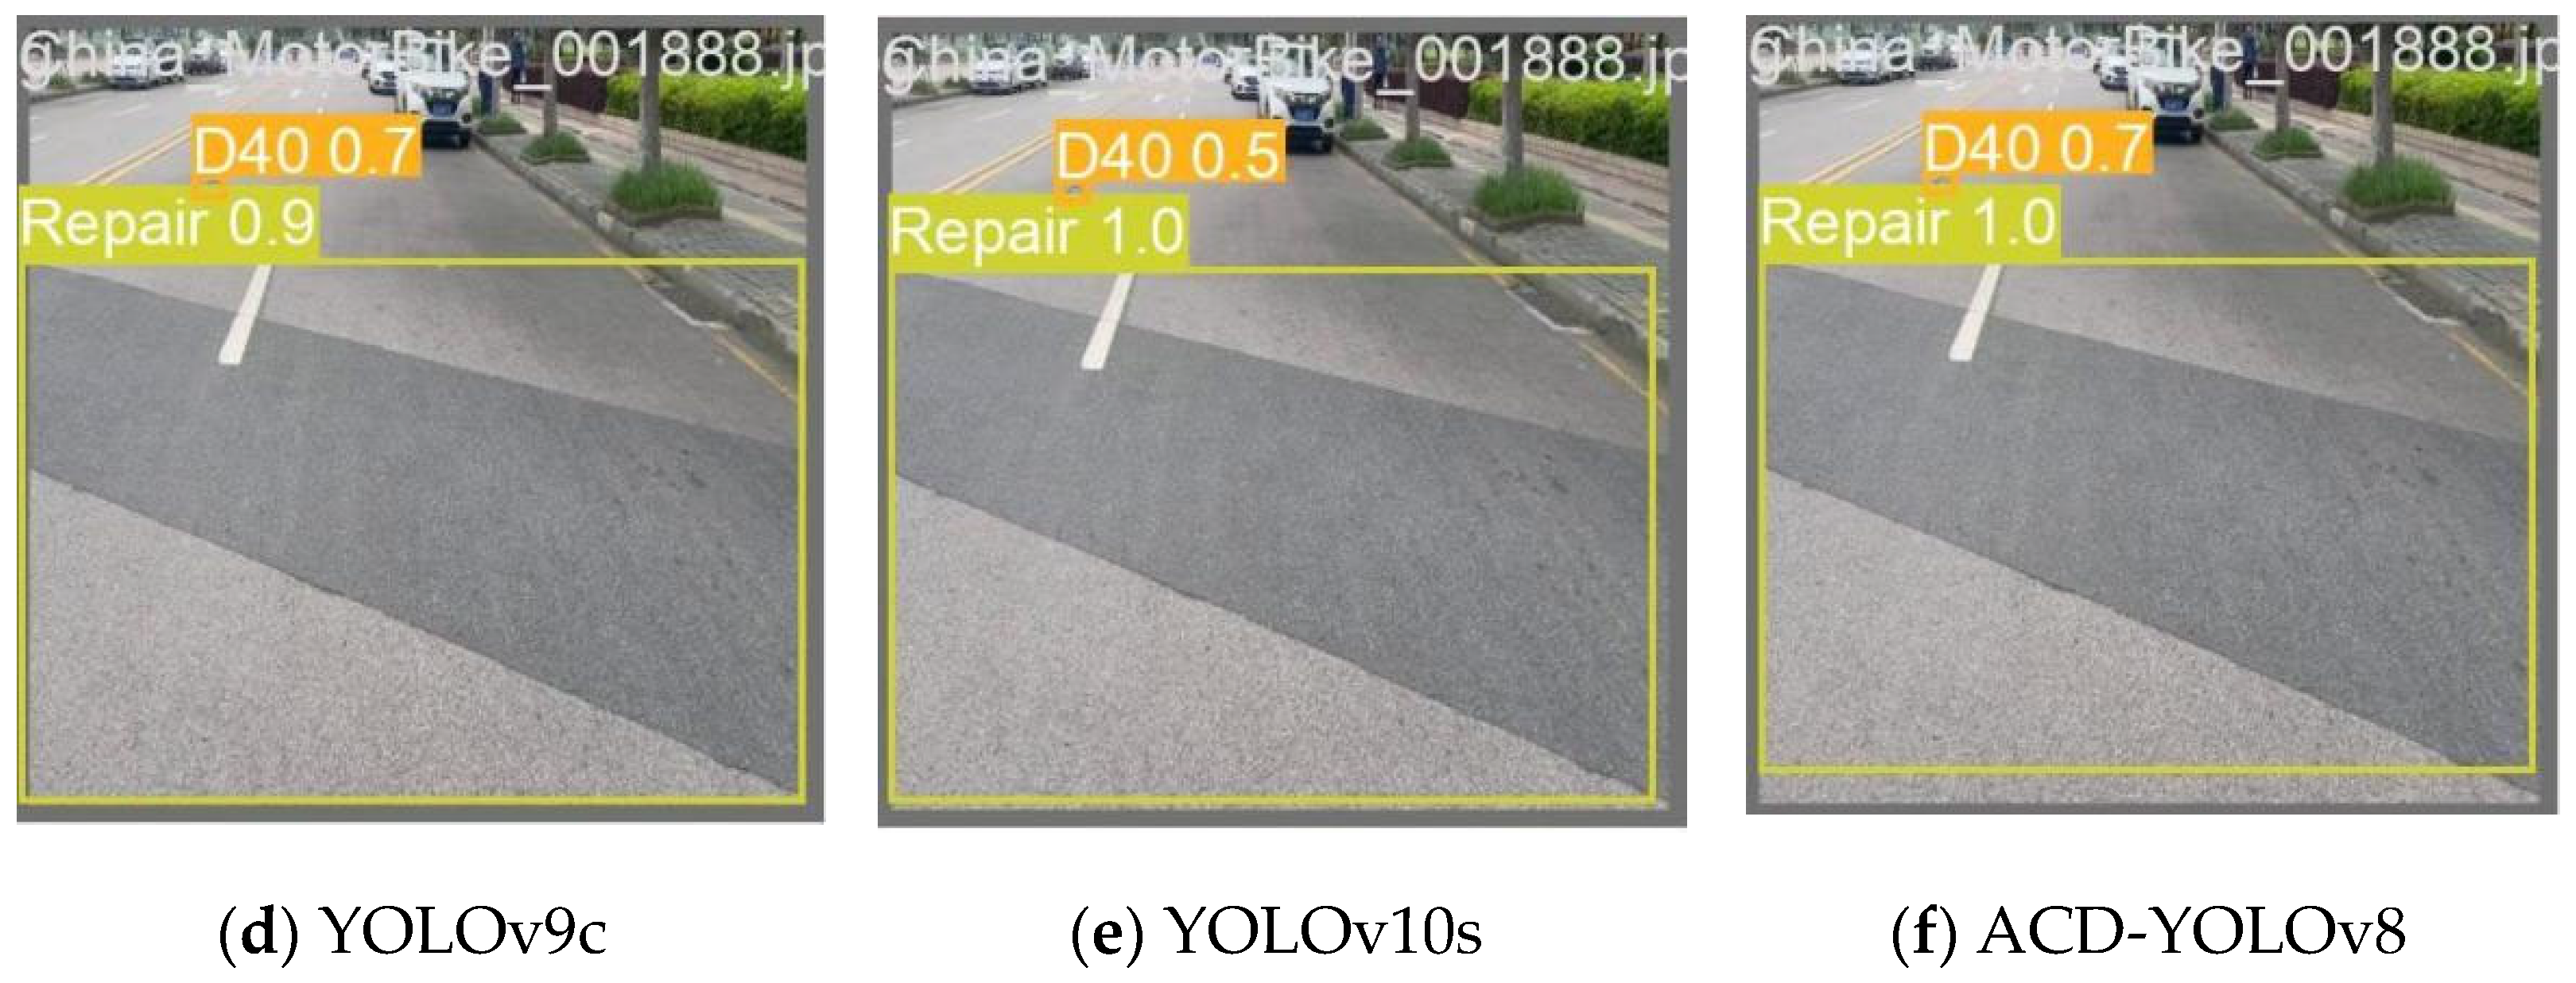
Figure 9 displays the detection outcomes of several models (gathering vehicle camera pictures) from Experiment 2. All models were able to successfully recognize the targets, with YOLOv5s, YOLOv6s, and the YOLOv8s, YOLOv9c models showing the same detection results, while YOLOv10s showed an increase in performance in detecting the Repair type of defect but a significant decrease in detection capability for D40 defects. Outperforming the prior models, our suggested ACD-YOLOv8s model successfully identified both targets and generated more accurate bounding boxes throughout the target identification phase. The combined results of the two experiments indicate that in various scenarios, in comparison to previous models, the ACD-YOLOv8s model exhibits reduced miss rates, lower false detection rates, and greater detection accuracy. These findings provide evidence of our model’s outstanding performance in different scenarios, significantly enhancing target detection.
As presented in
Table 9, with an F1-score of 0.83 and a mAP@0.5 accuracy of 87.4%, the ACD-YOLOv8 model significantly outperformed other object identification models. These findings demonstrate the enhanced performance and stability of the ACD-YOLOv8 model. Furthermore, in addition to improving mAP@0.5 and F1-score, the enhancements made by ACD-YOLOv8 in terms of lightweighting are even more pronounced, with the model reducing its parameter count by 33.33% compared to the original YOLOv8s.
4. Discussion
Road defect detection is an essential consideration in urban planning. Deep learning methods have been used by certain researchers [
34,
35] to address issues such poor multi-scale object perception, high missed detection rates for obstructed objects, and difficult model deployment. To facilitate the application of intelligent maintenance equipment by road maintenance personnel in urban roads, this study introduces the ACD-YOLOv8 model, which outperforms mainstream models in terms of lightweight performance. The ACD-YOLOv8 significantly reduces the computational complexity and quantity of parameters, providing more possibilities for its implementation on mobile or affordable embedded devices.
Furthermore, the suggested ACD-YOLOv8 model shows notable improvements in accuracy, mAP@0.5, parameter count, and computational efficiency when compared to the original YOLOv8 model. However, to make the model lighter and use fewer parameters, although the model adopting the CCFM structure significantly reduces the parameter count and model size, by approximately 3.8 M and 7.7 MB respectively, performance in mAP@0.5 and mAP@0.5-0.95 has somewhat declined. The ADown module, which may assist in further refining the resolution of feature maps for more accurate target identification and improving the model’s detection accuracy, is introduced in both the head and backbone parts of this study to solve this problem. The outcomes demonstrate that the aforementioned methods can effectively simplify the network structure, achieving the goal of lightweight feature fusion networks. It makes it possible for the model to do complicated jobs with exceptional precision and performance, enhances YOLOv8s’ detection capabilities for scale variations and small targets, and lowers the size of the trained model and the number of parameters by a significant amount. Meanwhile, this study adopts the DyHead head structure, aimed at optimizing the localization and classification functions in the target detection process. This structure integrates a variety of self-attention techniques, achieving sensitivity to different scales, spatial locations, and task requirements, thus promoting efficient learning of feature representation at different semantic levels, spatial areas, and task requirements.
Despite the promising results, this study has several limitations that open avenues for future research. First, while the model performed well on the RDD2022 dataset, its generalization capability across datasets with different geographical locations, environmental conditions (e.g., adverse weather, poor illumination), and defect characteristics remains to be validated. Second, the performance on highly imbalanced or rare defect classes could be further improved. Therefore, future work should focus on three primary directions: (1) Enhancing the model’s robustness and generalization by training on more diverse, multi-source datasets and employing advanced data augmentation techniques. (2) Investigating few-shot learning or transfer learning methods to improve detection performance for underrepresented defect categories. (3) Extending the current image-based detection framework to a video-based system to leverage temporal information for more consistent and reliable continuous road monitoring.
5. Conclusions
In this study, we proposed and validated ACD-YOLOv8, an improved lightweight object detection model that successfully addresses the challenge of balancing accuracy and efficiency in road defect identification. Our core contributions are the novel integration of three architectural enhancements into the YOLOv8s framework: a lightweight cross-scale feature fusion module (CCFM), an efficient down-sampling operation (ADown), and a dynamic attention head (DyHead). Experimental results on the RDD2022 dataset demonstrated the superiority of our approach. Compared to the baseline YOLOv8s, ACD-YOLOv8 achieved a 0.9% increase in mAP@0.5 while simultaneously reducing the parameter count by 33.33%.
The significance of these findings lies in providing a practical and scalable solution for real-world infrastructure maintenance. The reduced computational requirements of ACD-YOLOv8 facilitate its deployment on resource-constrained platforms, such as drones and mobile devices, enabling cost-effective and real-time road condition monitoring. This capability is poised to transform traditional road inspection workflows, leading to more timely repairs, reduced maintenance costs, and a significant enhancement in traffic safety. Future efforts will build upon this work to further improve the model’s robustness for diverse operational environments.
Author Contributions
Conceptualization, X.J.; methodology, X.J. and Z.C.; software, X.J. and Z.C.; validation, X.J. and Z.C.; formal analysis, Z.C.; investigation, X.J. and Z.C.; resources, Z.C.; data curation, X.J. and Z.C.; writing—original draft preparation, X.J. and Z.C.; writing—review and editing, Z.C., Y.X. and Y.L.; visualization, Z.C.; supervision, Y.X.; project administration, Z.C. All authors have read and agreed to the published version of the manuscript.
Funding
This research was funded by the National Natural Science Foundation of China under the project “Research on Structural Equation Model of ‘CVD Pathogenic Indicator—Spatial Quantitative Element in Neighborhood’ for Healthy Urban Design” (Grant number. 52178002) and the National Natural Science Foundation of China (Grant number. 52378003), and was sponsored by the Beijing Nova Program (20230484271).
Institutional Review Board Statement
Not applicable.
Informed Consent Statement
Not applicable.
Data Availability Statement
Conflicts of Interest
The authors declare no conflicts of interest.
References
- World Bicycle Day | Road Bicycle Sales Soar by 200%! Outdoor Cycling Category Sees 40% Increase in Sales. 2023. Available online: https://baijiahao.baidu.com/s?id=1767670936258805255 (accessed on 3 August 2024).
- Wang, P.; Rau, P.L.P.; Salvendy, G. Road safety research in China: Review and appraisal. Traffic Inj. Prev. 2010, 11, 425–432. [Google Scholar] [CrossRef] [PubMed]
- Palani, R.; Puviarasan, N.; Rama Prasath, A. Literature Review of Road Damage Detection with Repairing Cost Estimation. Int. J. Mech. Eng. 2022, 7, 1437–1442. [Google Scholar]
- Sari, Y.; Prakoso, P.B.; Baskara, A.R. Road Crack Detection using Support Vector Machine (SVM) and OTSU Algorithm. In Proceedings of the 2019 6th International Conference on Electric Vehicular Technology (ICEVT), Bali, Indonesia, 18–21 November 2019; pp. 349–354. [Google Scholar]
- Arya, D.; Maeda, H.; Sekimoto, Y. From global challenges to local solutions: A review of cross-country collaborations and winning strategies in road damage detection. Adv. Eng. Inform. 2024, 60, 102388. [Google Scholar] [CrossRef]
- Wang, X.; Gao, H.; Jia, Z.; Li, Z. BL-YOLOv8: An Improved Road Defect Detection Model Based on YOLOv8. Sensors 2023, 23, 8361. [Google Scholar] [CrossRef] [PubMed]
- Zou, C.L.; He, P.L.; Wang, S.H.; Chen, W.; Wang, H.X. Pavement Defect Detection Algorithm Based on Improved YOLOv7 Complex Background. IEEE Access 2024, 12, 32870–32880. [Google Scholar]
- Liu, Y.; Duan, M.; Ding, G.; Ding, H.; Hu, P.; Zhao, H. HE-YOLOv5s: Efficient Road Defect Detection Network. Entropy 2023, 25, 1280. [Google Scholar] [CrossRef]
- Wan, B.; Zhou, X.; Sun, Y.; Wang, T.; Wang, S.; Yin, H.; Yan, C. ADNet: Anti-noise Dual-Branch Network for Road Defect Detection. Eng. Appl. Artif. Intell. 2024, 132, 107963. [Google Scholar] [CrossRef]
- Jiang, Y.; Yan, H.; Zhang, Y.; Wu, K.; Liu, R.; Lin, C. Rdd-YOLOv5: Road Defect Detection Algorithm with Self-Attention Based on Unmanned Aerial Vehicle Inspection. Sensors 2023, 23, 8241. [Google Scholar] [CrossRef] [PubMed]
- Zhou, Z.; Zhao, W.; Li, J.; Song, K. SPCNet: A Strip Pyramid ConvNeXt Network for Detection of Road Surface Defects. Signal Image Video Process. 2024, 18, 37–45. [Google Scholar] [CrossRef]
- Wang, A.; Chen, H.; Liu, L.; Chen, K.; Lin, Z.; Han, J.; Ding, G. YOLOv10: Real-time End-to-End Object Detection. arXiv 2024, arXiv:2405.14458. [Google Scholar]
- Shao, Y.; Zhang, D.; Chu, H.; Zhang, X.; Rao, Y. A review of YOLO object detection based on deep learning. J. Electron. Inf. Technol. 2022, 44, 3697–3708. [Google Scholar]
- Redmon, J.; Divvala, S.; Girshick, R.; Farhadi, A. You Only Look Once: Unified, Real-Time Object Detection. In Proceedings of the 2016 IEEE Conference on Computer Vision and Pattern Recognition (CVPR), Las Vegas, NV, USA, 27–30 June 2016; pp. 779–788. [Google Scholar]
- Arya, D.; Maeda, H.; Ghosh, S.K.; Toshniwal, D.; Omata, H.; Kashiyama, T.; Sekimoto, Y. Crowdsensing-Based Road Damage Detection Challenge (CRDDC’2022). In Proceedings of the 2022 IEEE International Conference on Big Data (Big Data), Osaka, Japan, 17–20 December 2022; pp. 6378–6386. [Google Scholar]
- Wang, C.-Y.; Bochkovskiy, A.; Liao, H.-Y.M. YOLOv7: Trainable bag-of-freebies sets new state-of-the-art for real-time object detectors. In Proceedings of the IEEE/CVF Conference on Computer Vision and Pattern Recognition, Vancouver, BC, Canada, 17–24 June 2023; pp. 7464–7475. [Google Scholar]
- Lin, T.-Y.; Dollár, P.; Girshick, R.; He, K.; Hariharan, B.; Belongie, S. Feature pyramid networks for object detection. In Proceedings of the IEEE Conference on Computer Vision and Pattern Recognition, Honolulu, HI, USA, 21–26 July 2017; pp. 2117–2125. [Google Scholar]
- Li, H.; Xiong, P.; An, J.; Wang, L. Pyramid attention network for semantic segmentation. arXiv 2018, arXiv:1805.10180. [Google Scholar]
- Feng, C.; Zhong, Y.; Gao, Y.; Scott, M.R.; Huang, W. Tood: Task-aligned one-stage object detection. In Proceedings of the 2021 IEEE/CVF International Conference on Computer Vision (ICCV), Montreal, QC, Canada, 10–17 October 2021; pp. 3490–3499. [Google Scholar]
- Zhao, Y.; Lv, W.; Xu, S.; Wei, J.; Wang, G.; Dang, Q.; Chen, J. DETRs Beat YOLOs on Real-Time Object Detection. In Proceedings of the IEEE/CVF Conference on Computer Vision and Pattern Recognition, Seattle, WA, USA, 17–21 June 2024; pp. 16965–16974. [Google Scholar]
- Wang, C.Y.; Yeh, I.H.; Liao, H.Y.M. YOLOv9: Learning What You Want to Learn Using Programmable Gradient Information. arXiv 2024, arXiv:2402.13616. [Google Scholar]
- Liu, R.; Huang, M.; Wang, L.; Bi, C.; Tao, Y. PDT-YOLO: A Roadside Object-Detection Algorithm for Multiscale and Occluded Targets. Sensors 2024, 24, 2302. [Google Scholar] [CrossRef]
- Han, J.; Yuan, X.; Wang, Z.; Chen, Y. UAV dense small target detection algorithm based on YOLOv5s. J. Zhejiang Univ. 2023, 57, 1224–1233. [Google Scholar]
- Simonyan, K.; Zisserman, A. Very Deep Convolutional Networks for Large-Scale Image Recognition. arXiv 2014, arXiv:1409.1556. [Google Scholar]
- Qi, M.; Tang, R.; Liu, Z.; Fu, S. AYOLOv8: Improved Detector Based on YOLOv8 to Focus More on Small and Medium Objects. In Advanced Intelligent Computing Technology and Applications; ICIC 2024; Lecture Notes in Computer Science; Huang, D.S., Zhang, X., Guo, J., Eds.; Springer: Singapore, 2024; Volume 14866. [Google Scholar] [CrossRef]
- Dai, X.; Chen, Y.; Xiao, B.; Chen, D.; Liu, M.; Yuan, L.; Zhang, L. Dynamic Head: Unifying Object Detection Heads with Attentions. In Proceedings of the IEEE/CVF Conference on Computer Vision and Pattern Recognition, Nashville, TN, USA, 20–25 June 2021; pp. 7373–7382. [Google Scholar]
- Zhang, Y.; Su, X.; Ma, M. MA-YOLOv8 Algorithm for Mining Area Object Detection Based on High-Resolution Remote Sensing Images; Springer Nature: Singapore, 2024; pp. 323–335. [Google Scholar]
- Wang, J.; Meng, R.; Huang, Y.; Zhou, L.; Huo, L.; Qiao, Z.; Niu, C. Road defect detection based on improved YOLOv8s model. Sci. Rep. 2024, 14, 16758. [Google Scholar] [CrossRef]
- Arya, D.; Maeda, H.; Ghosh, S.K.; Toshniwal, D.; Sekimoto, Y. RDD2022: A multi-national image dataset for automatic road damage detection. Geosci. Data J. 2022, 11, 846–862. [Google Scholar] [CrossRef]
- Tan, M.; Pang, R.; Le, Q.V. EfficientDet: Scalable and Efficient Object Detection. In Proceedings of the IEEE/CVF Conference on Computer Vision and Pattern Recognition, Seattle, WA, USA, 13–19 June 2020; pp. 10781–10790. [Google Scholar]
- Li, C.; Li, L.; Jiang, H.; Weng, K.; Geng, Y.; Li, L.; Ke, Z.; Li, Q.; Cheng, M.; Nie, W.; et al. YOLOv6: A Single-Stage Object Detection Framework for Industrial Applications. arXiv 2022, arXiv:2209.02976. [Google Scholar]
- Ouyang, H. DEYOv3: DETR with YOLO for Real-time Object Detection. arXiv 2023, arXiv:2309.11851. [Google Scholar]
- Redmon, J.; Farhadi, A. Yolov3: An incremental improvement. arXiv 2018, arXiv:1804.02767. [Google Scholar]
- Zhang, Y.; Sun, Y.; Wang, Z.; Jiang, Y. YOLOv7-RAR for Urban Vehicle Detection. Sensors 2023, 23, 1801. [Google Scholar] [CrossRef] [PubMed]
- Huang, L.; Huang, W. RD-YOLO: An Effective and Efficient Object Detector for Roadside Perception System. Sensors 2022, 22, 8097. [Google Scholar] [CrossRef] [PubMed]
Figure 1.
Schematic representation of the structure in YOLOv8. This figure illustrates the standard components, including the C2f modules in the backbone and neck, and the conventional Conv blocks for down-sampling.
Figure 1.
Schematic representation of the structure in YOLOv8. This figure illustrates the standard components, including the C2f modules in the backbone and neck, and the conventional Conv blocks for down-sampling.
Figure 2.
Schematic representation of the PAN-FPN (Path Aggregation Network–Feature Pyramid Network) structure in YOLOv8.
Figure 2.
Schematic representation of the PAN-FPN (Path Aggregation Network–Feature Pyramid Network) structure in YOLOv8.
Figure 3.
The fusion block in the CCFM module.
Figure 3.
The fusion block in the CCFM module.
Figure 4.
Structure of ADown module.
Figure 4.
Structure of ADown module.
Figure 5.
The final structure of ACD-YOLOv8 is shown in
Figure 5. This figure highlights the key modifications compared to the baseline model in
Figure 1, specifically the integration of the CCFM in the neck, the replacement of standard Conv down-sampling blocks with our ADown modules, and the integration of the Detect_dyhead in the detection head.
Figure 6.
A comparison was performed to assess the mAP values of the ACD-YOLOv8 model in relation to the original model. (a) Comparison of mAP@0.5, and (b) comparison of mAP@0.5-0.95.
Figure 6.
A comparison was performed to assess the mAP values of the ACD-YOLOv8 model in relation to the original model. (a) Comparison of mAP@0.5, and (b) comparison of mAP@0.5-0.95.
Figure 7.
The ACD-YOLOv8 model and the YOLOv8 model’s confusion matrix. (a) YOLOv8′s confusion matrix. (b) ACD-YOLOv8’s confusion matrix.
Figure 7.
The ACD-YOLOv8 model and the YOLOv8 model’s confusion matrix. (a) YOLOv8′s confusion matrix. (b) ACD-YOLOv8’s confusion matrix.
Figure 8.
Visualization outcomes of comparative experiments for seven models in drone-acquired scenes: (a) YOLOv3; (b) YOLOv5s; (c) YOLOv6s; (d) YOLOv8s; (e) YOLOv9c; (f) YOLOv10s; (g) ACD-YOLOv8.
Figure 8.
Visualization outcomes of comparative experiments for seven models in drone-acquired scenes: (a) YOLOv3; (b) YOLOv5s; (c) YOLOv6s; (d) YOLOv8s; (e) YOLOv9c; (f) YOLOv10s; (g) ACD-YOLOv8.
Figure 9.
The following are the visualization results of the comparison tests conducted for seven models in drone-captured scenarios: (a) YOLOv5s; (b) YOLOv6s; (c) YOLOv8s; (d) YOLOv9c; (e) YOLOv10s; (f) ACD-YOLOv8.
Figure 9.
The following are the visualization results of the comparison tests conducted for seven models in drone-captured scenarios: (a) YOLOv5s; (b) YOLOv6s; (c) YOLOv8s; (d) YOLOv9c; (e) YOLOv10s; (f) ACD-YOLOv8.
Table 1.
Network structure and parameters of ACD-YOLOv8.
Table 1.
Network structure and parameters of ACD-YOLOv8.
| Layers | From | N | Params | Module | Arguments |
|---|
| 0 | −1 | 1 | 928 | Conv | (3, 32, 3, 2) |
| 1 | −1 | 1 | 5248 | ADown | (32, 64) |
| 2 | −1 | 1 | 29,056 | C2f | (64, 64, 1, True) |
| 3 | −1 | 1 | 20,736 | ADown | (64, 128) |
| 4 | −1 | 2 | 197,632 | C2f | (128, 128, 2, True) |
| 5 | −1 | 1 | 82,432 | ADown | (128, 256) |
| 6 | −1 | 2 | 788,480 | C2f | (256, 256, 2, True) |
| 7 | −1 | 1 | 328,704 | ADown | (256, 512) |
| 8 | −1 | 1 | 1,838,080 | C2f | (512, 512, 1, True) |
| 9 | −1 | 1 | 656,896 | SPPF | (512, 512, 5) |
| 10 | −1 | 1 | 65,792 | Conv | (512, 128, 1, 1) |
| 11 | 4 | 1 | 0 | Upsample | (None, 2, ‘nearest’) |
| 12 | 6 | 1 | 33,024 | Conv | (256, 128, 1, 1, None, 1, 1, False) |
| 13 | [−2, −1] | 1 | 0 | Concat | (1) |
| 14 | −1 | 1 | 131,840 | C2f | (256, 128, 1) |
| 15 | −1 | 1 | 16,640 | Conv | (128, 128, 1, 1) |
| 16 | −1 | 1 | 0 | Upsample | (None, 2, ‘nearest’) |
| 17 | 4 | 1 | 16,640 | Conv | (128, 128, 1, 1, None, 1, 1, False) |
| 18 | [−2, −1] | 1 | 0 | Concat | (1) |
| 19 | −1 | 1 | 131,840 | C2f | (256, 128, 1) |
| 20 | −1 | 1 | 41,216 | ADown | (128, 128) |
| 21 | [−1, −15] | 1 | 0 | Concat | (1) |
| 22 | −1 | 1 | 131,840 | C2f | (256, 128, 1) |
| 23 | −1 | 1 | 41,216 | ADown | (128, 128) |
| 24 | [−1, −10] | 1 | 0 | Concat | (1) |
| 25 | −1 | 1 | 131,840 | C2f | (256, 128, 1) |
| 26 | [19, −22, −25] | 1 | 2,720,659 | Detect_dyhead | (5, (128, 128, 128)) |
Table 2.
Configuration and training environment.
Table 2.
Configuration and training environment.
| Environmental Parameter | Value |
|---|
| Operating system | Ubuntu22.04 |
| Deep learning framework | Pytorch1.7.1 |
| Programming language | Python3.9.7 |
| CPU | Intel(R) Xeon(R) Platinum 8255C |
| GPU | Quadro RTX 8000 (48568MiB) |
| RAM | 1.0TiB |
Table 3.
The same hyperparameters were applied across all experiments during the training process. The specific hyperparameters used are provided in
Table 3.
Table 3.
The same hyperparameters were applied across all experiments during the training process. The specific hyperparameters used are provided in
Table 3.
| Hyperparameters | Value |
|---|
| Learning Rate | 0.01 |
| Image Size | 640 × 640 |
| Momentum | 0.937 |
| Batch Size | 16 |
| Epoch | 150 |
| Weight Decay | 0.0005 |
Table 4.
Defect types and their corresponding quantities in the dataset.
Table 4.
Defect types and their corresponding quantities in the dataset.
| Pavement Distress | Distress Class | Quantity |
|---|
| longitudinal cracks | D00 | 4104 |
| transverse cracks | D10 | 2359 |
| alligator cracks | D20 | 934 |
| potholes | D40 | 321 |
| road repairs | Repair | 1046 |
Table 5.
Feature fusion network Lightweight experiment verification.
Table 5.
Feature fusion network Lightweight experiment verification.
| Method | Params
(M) | Size
(m) | mAP@0.5
(%) | mAP@0.5-0.95
(%) | F1 | FPS |
|---|
| YOLOv8s | 11.1 | 22.5 | 86.5 | 56.5 | 0.820 | 357 |
| v8s + BiFPN | 10.2 | 20.8 | 85.7 | 56.6 | 0.816 | 333 |
| v8s + CCFM | 7.3 | 14.8 | 85.0 | 56.3 | 0.812 | 357 |
Table 6.
ADown module experiment verification.
Table 6.
ADown module experiment verification.
| Method | Params
(M) | Size
(m) | mAP@0.5
(%) | mAP@0.5-0.95
(%) | F1 | FPS |
|---|
| YOLOv8s | 11.1 | 22.5 | 86.5 | 56.5 | 0.82 | 357 |
| v8s + SCDown | 9.3 | 18.9 | 85.5 | 56.7 | 0.80 | 344.8 |
| v8s + ADown | 9.5 | 19.2 | 86.3 | 57.0 | 0.82 | 312.5 |
Table 7.
DyHead module experiment verification.
Table 7.
DyHead module experiment verification.
| Method | Params
(M) | Size
(m) | mAP@0.5
(%) | mAP@0.5-0.95
(%) | F1 | FPS |
|---|
| YOLOv8s | 11.1 | 22.5 | 86.5 | 56.5 | 0.82 | 357 |
| v8s + DyHead | 9.3 | 18.9 | 87.1 | 58.2 | 0.830 | 196 |
Table 8.
Comparison of ablation experiments.
Table 8.
Comparison of ablation experiments.
| CCFM | ADown | DyHead | Params (M) | Size (MB) | mAP@0.5
(%) | mAP@0.5-0.95 (%) | F1 | FPS |
|---|
| - | - | - | 11.1 | 22.5 | 86.5 | 56.5 | 0.820 | 357 |
| √ | | | 7.3 | 14.8 | 85.0 | 56.3 | 0.812 | 357 |
| | √ | | 9.5 | 19.2 | 86.3 | 57.0 | 0.82 | 313 |
| √ | √ | | 5.9 | 12.1 | 86.5 | 56.7 | 0.818 | 323 |
| √ | | √ | 17.2 | 14.8 | 87.2 | 57.6 | 0.824 | 128 |
| | √ | √ | 7.4 | 15.1 | 86.8 | 57.5 | 0.826 | 185 |
| √ | √ | √ | 7.4 | 15.1 | 87.4 | 58.1 | 0.830 | 196 |
Table 9.
Comparison of algorithm model performance on the RDD2022 dataset.
Table 9.
Comparison of algorithm model performance on the RDD2022 dataset.
| Method | Params
(M) | Size
(m) | mAP@0.5 (%) | mAP@0.5-0.95
(%) | F1 | FPS |
|---|
| YOLOv3 [33] | 10.3 | 207.8 | 85.6 | 58.7 | 0.818 | 104 |
| YOLOv5s | 9.1 | 18.5 | 85.2 | 54.9 | 0.806 | 370 |
| YOLOv6s | 16.3 | 32.8 | 78.0 | 49.1 | 0.738 | 357 |
| YOLOv7 | 37.2 | 74.9 | 86.1 | 56.7 | 0.822 | 357 |
| YOLOv8s | 11.1 | 22.5 | 86.5 | 56.5 | 0.820 | 357 |
| RT-DETR-l | 32.8 | 66.1 | 74.9 | 47.9 | 0.708 | 154 |
| RT-DETR-resnet50 | 41.9 | 86.0 | 79.9 | 51.2 | 0.766 | 131 |
| YOLOv9c | 25.5 | 51.6 | 86.4 | 57.8 | 0.818 | 152 |
| YOLOv10s | 8.0 | 16.5 | 84.8 | 57.1 | 0.806 | 238 |
| ACD-YOLOv8 | 7.4 | 15.1 | 87.4 | 58.1 | 0.830 | 196 |
| Disclaimer/Publisher’s Note: The statements, opinions and data contained in all publications are solely those of the individual author(s) and contributor(s) and not of MDPI and/or the editor(s). MDPI and/or the editor(s) disclaim responsibility for any injury to people or property resulting from any ideas, methods, instructions or products referred to in the content. |
© 2025 by the authors. Licensee MDPI, Basel, Switzerland. This article is an open access article distributed under the terms and conditions of the Creative Commons Attribution (CC BY) license (https://creativecommons.org/licenses/by/4.0/).


