
An Experimental Investigation on the Microscopic Damage and Mechanical Properties of Coal Under Hygrothermal Conditions


 ,
,  , ,
, ,
Abstract
1. Introduction
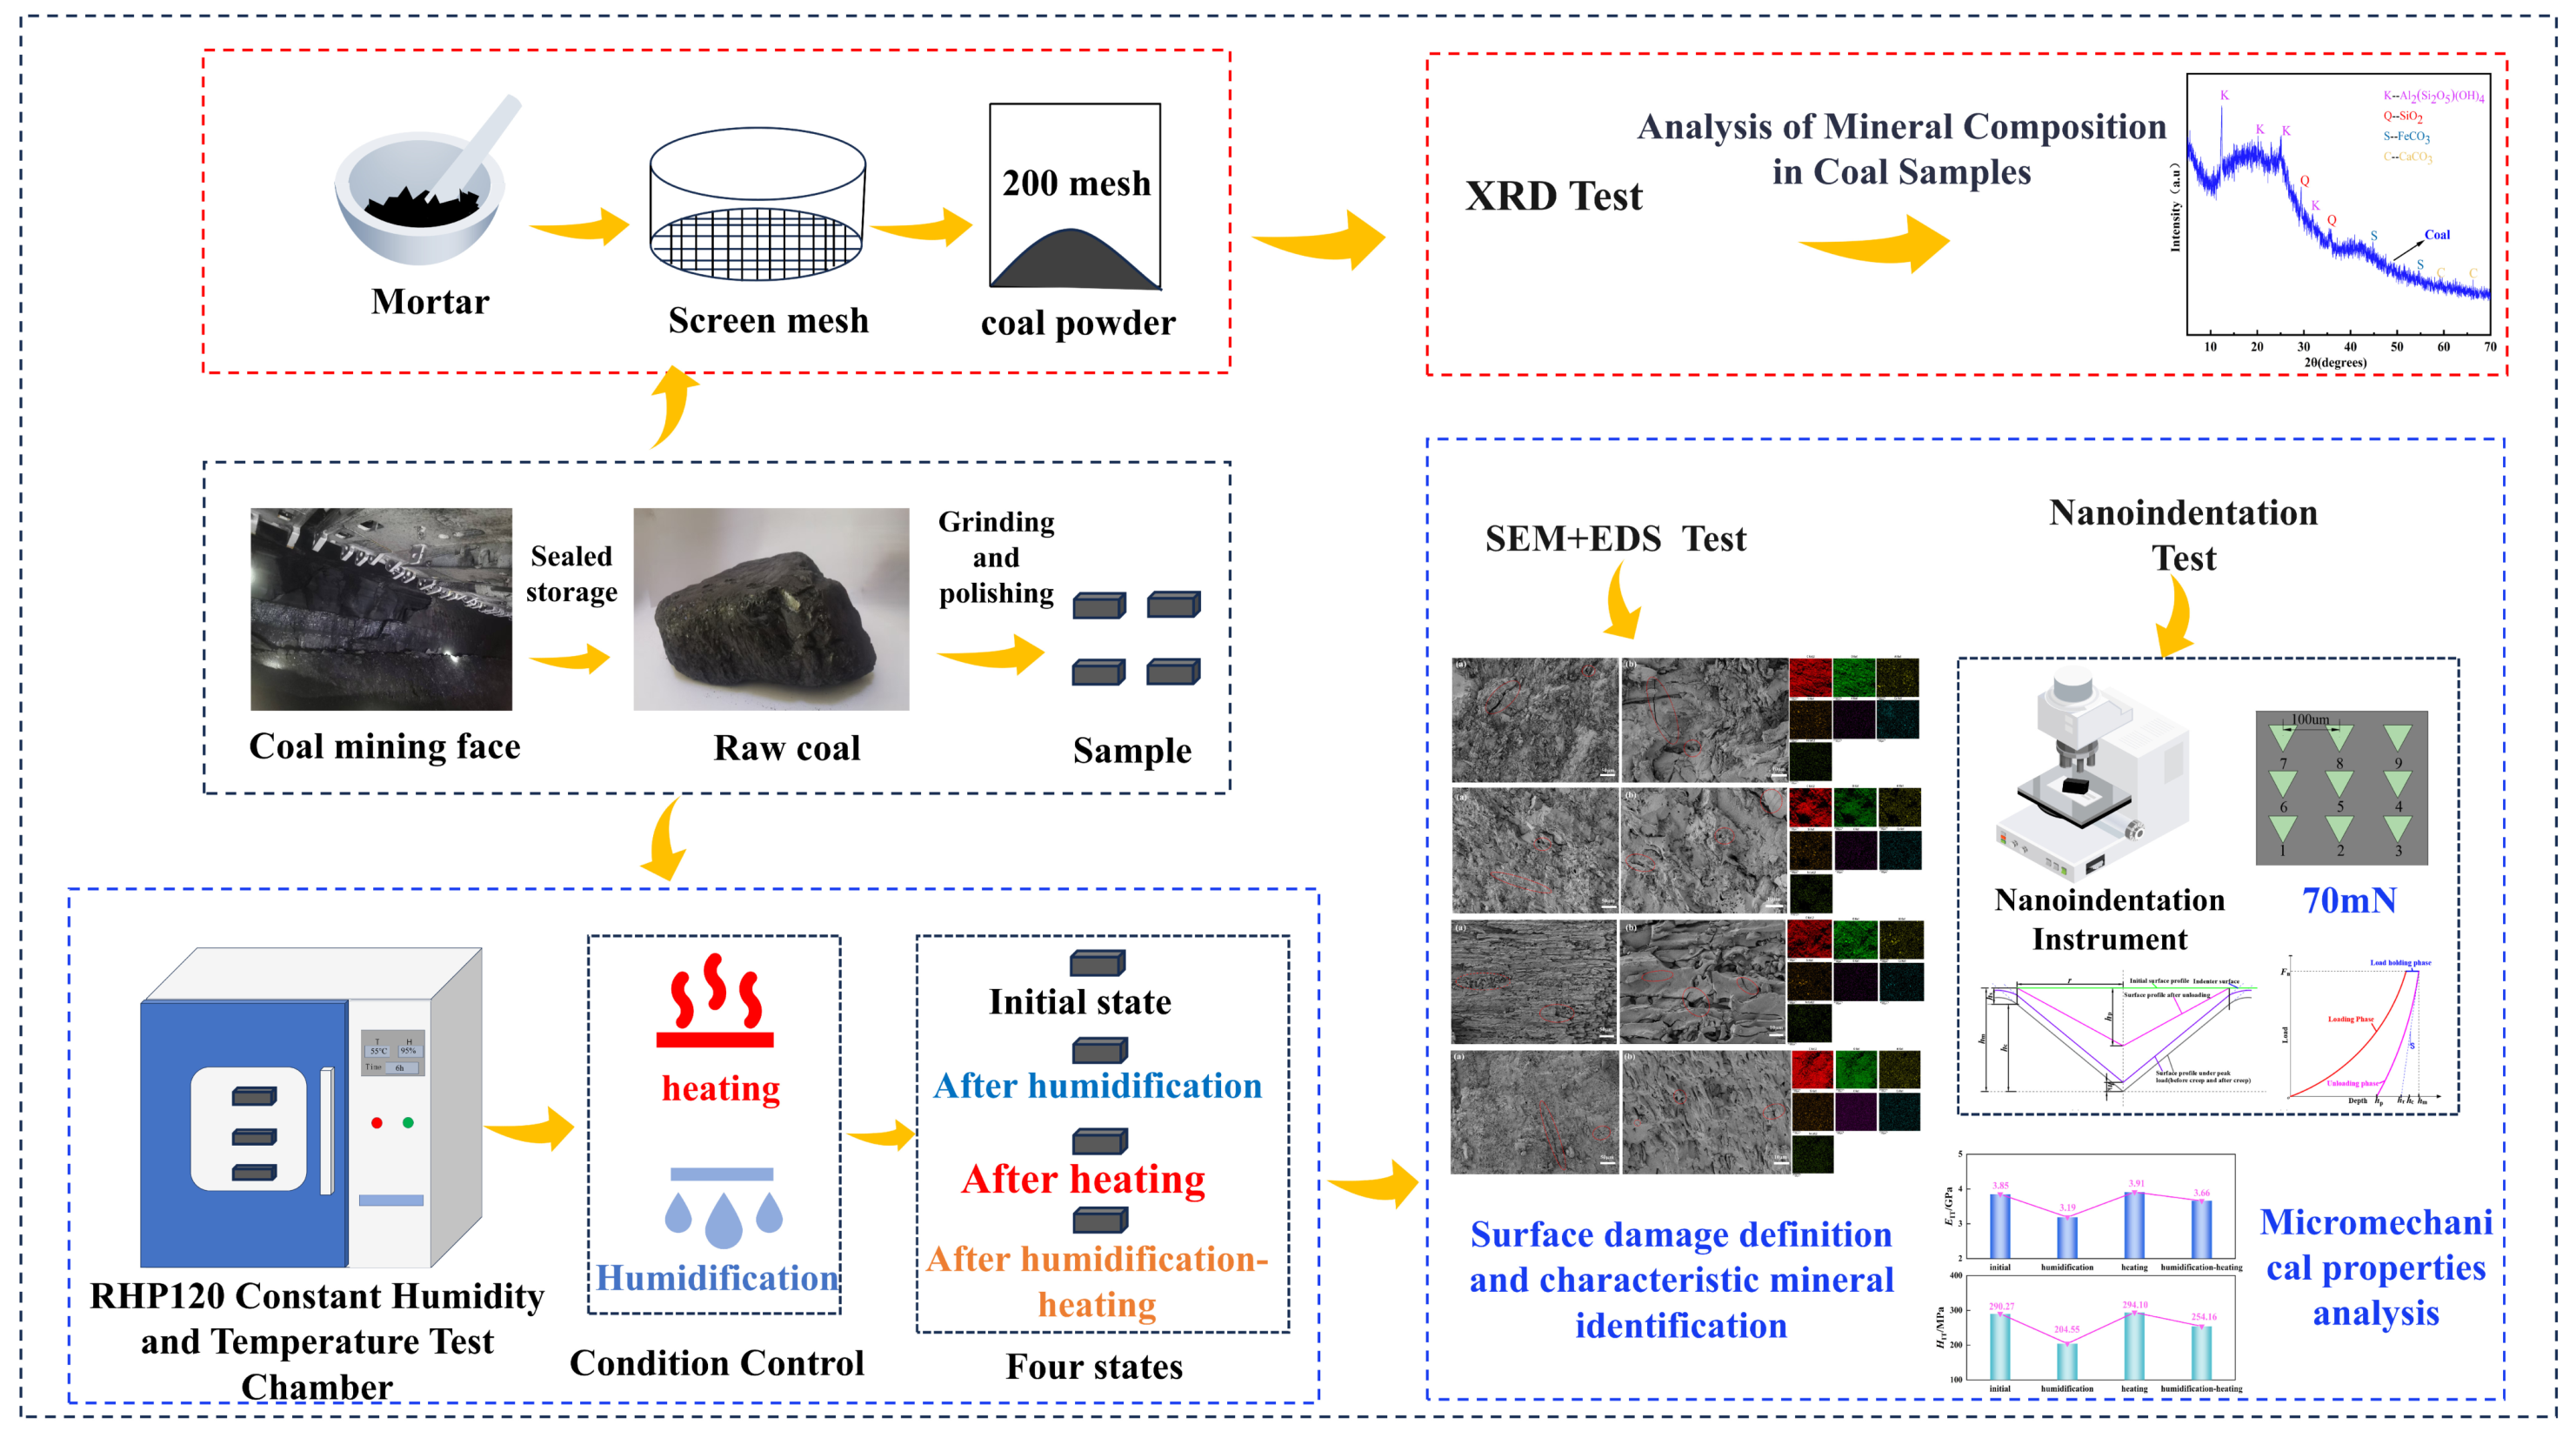
2. Materials and Methods
2.1. Sample Collection and Preparation
2.2. Test Process
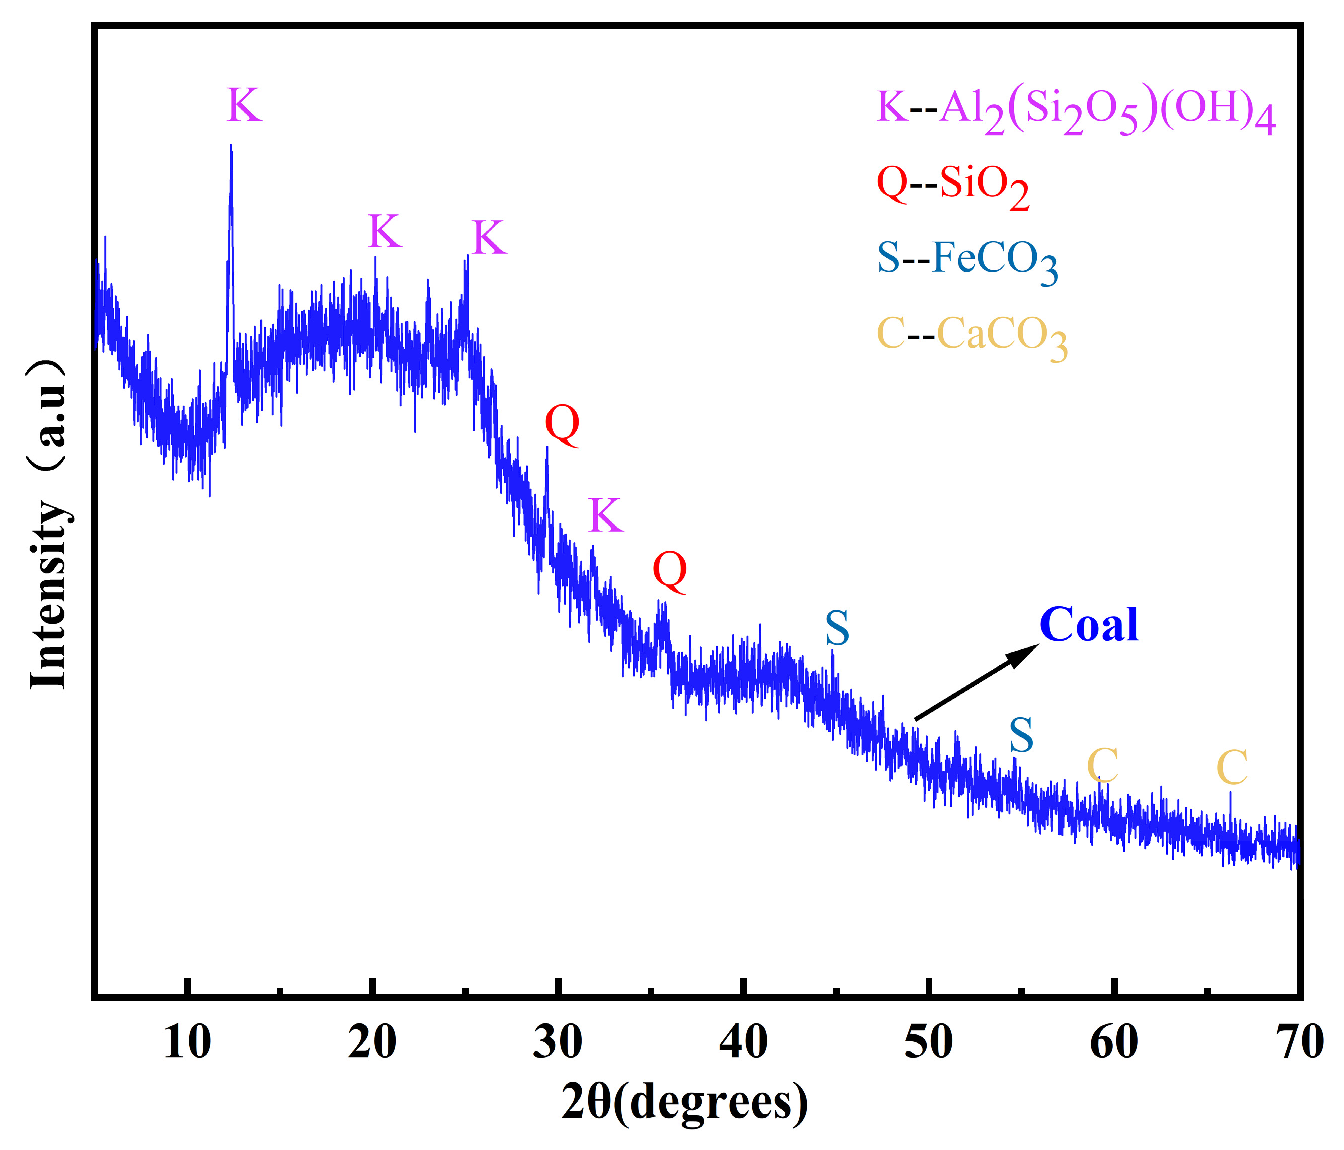
2.2.1. XRD Test
2.2.2. Coal Sample Condition Control
2.2.3. SEM and EDS Test
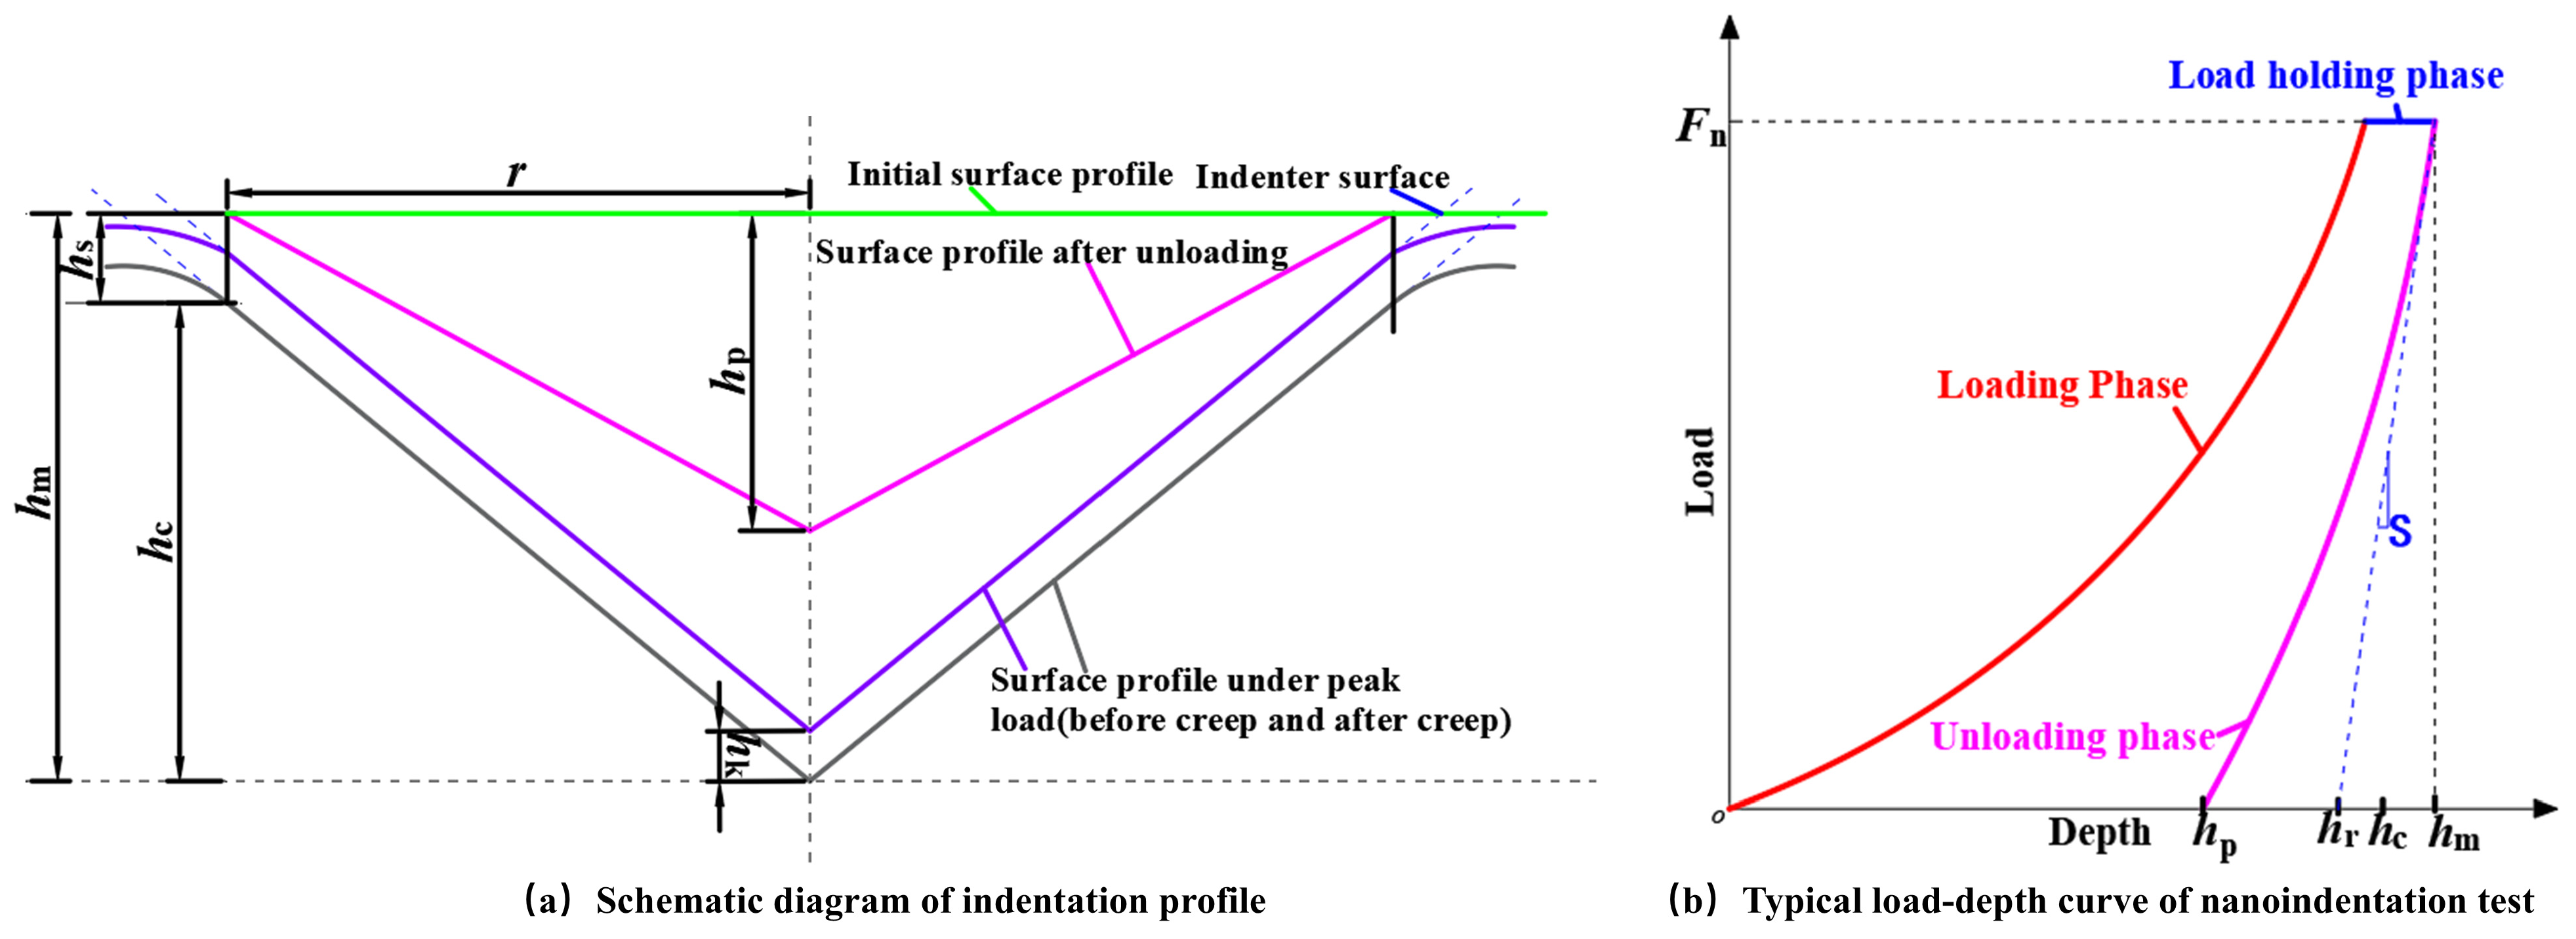
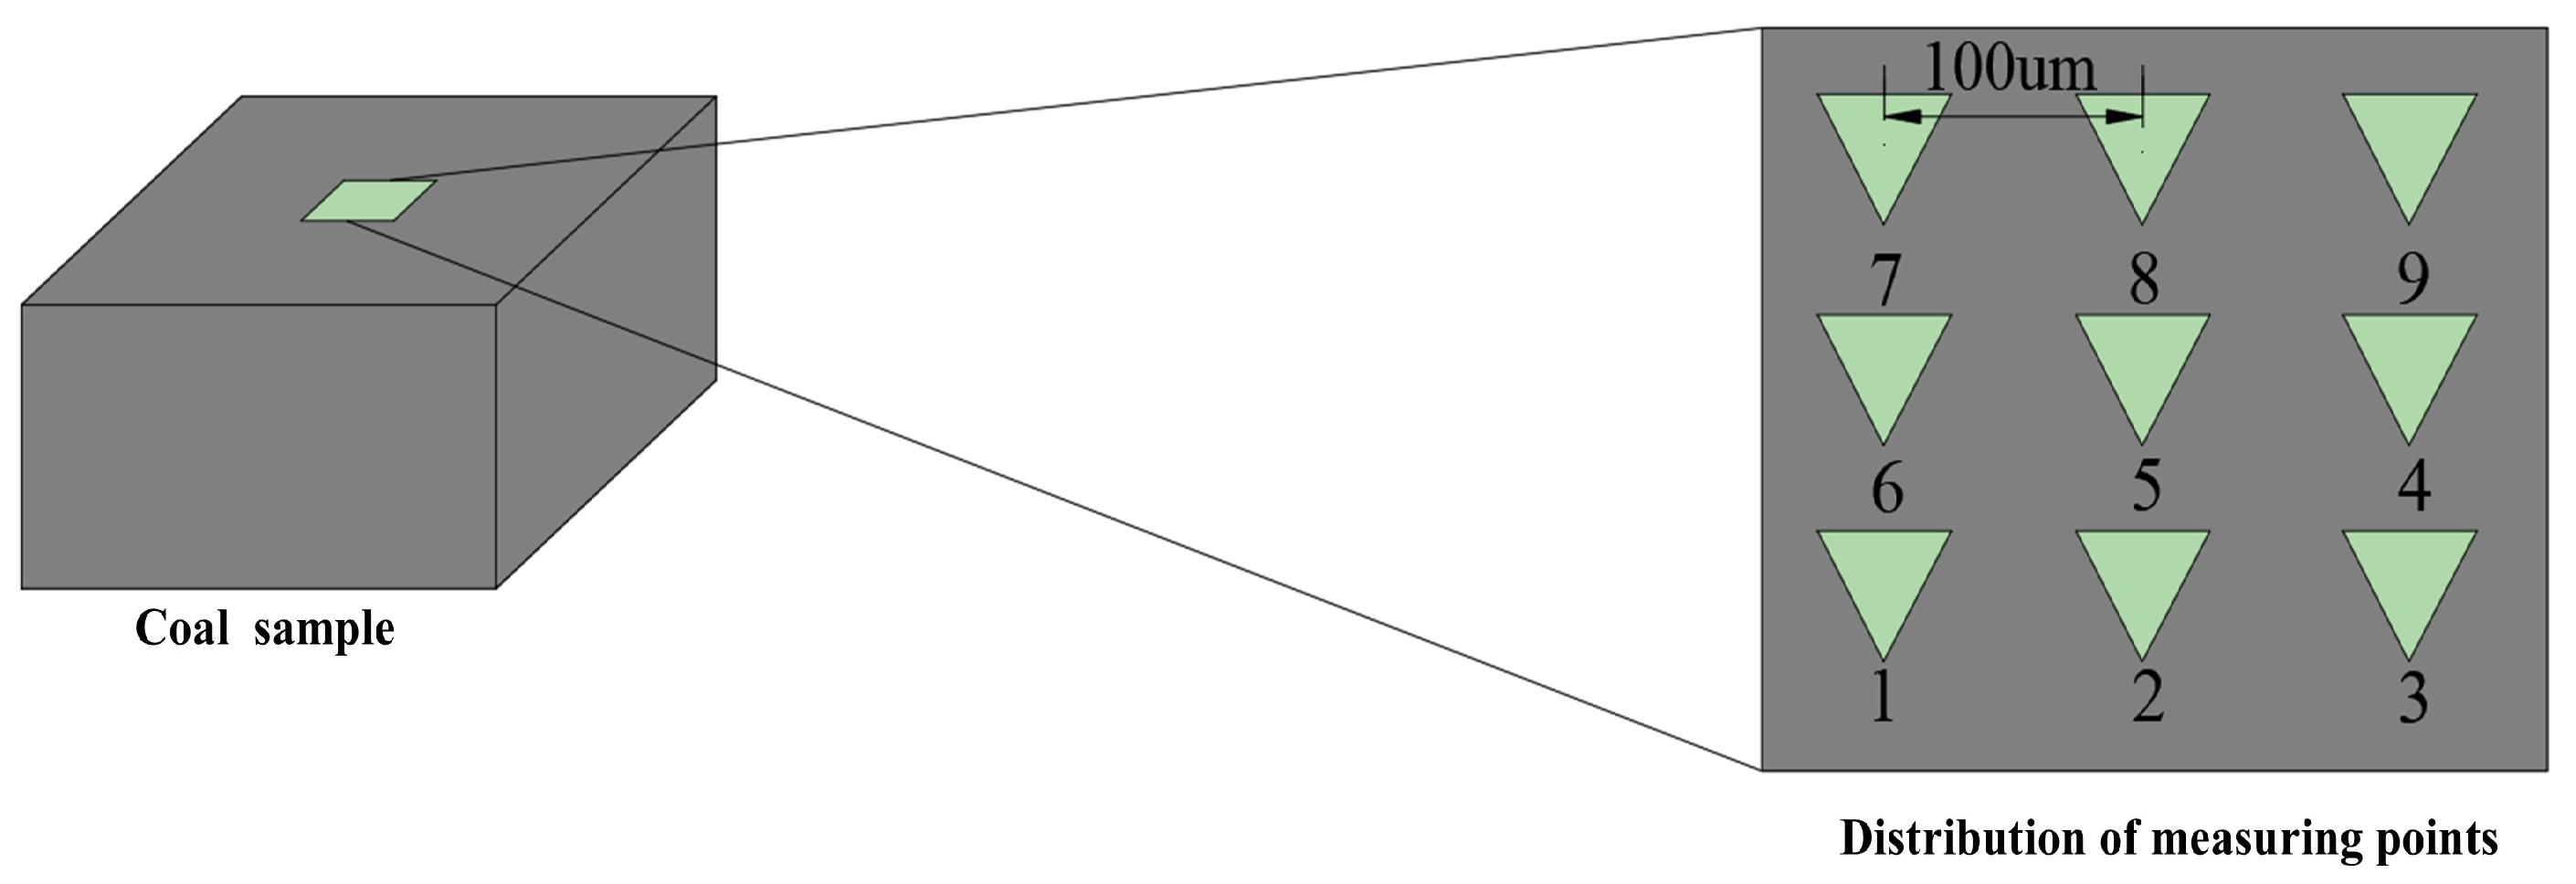
2.2.4. Nanoindentation Test
- (1)
- Test Principle
- (2)
- Test scheme
3. Results and Discussion
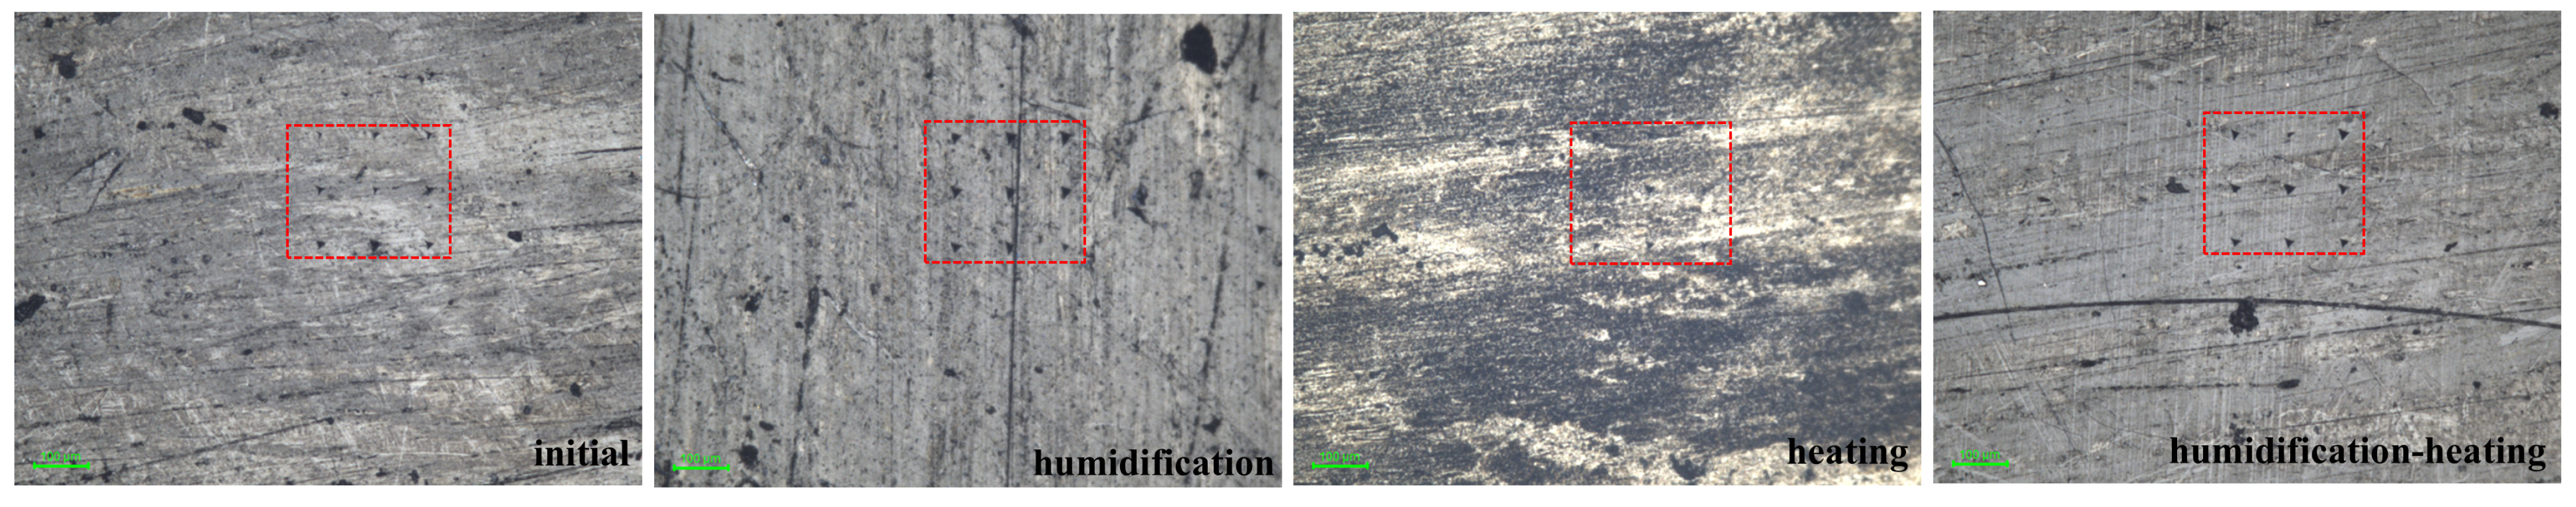
3.1. Analysis of Microscopic Morphology Characteristics of Coal Samples
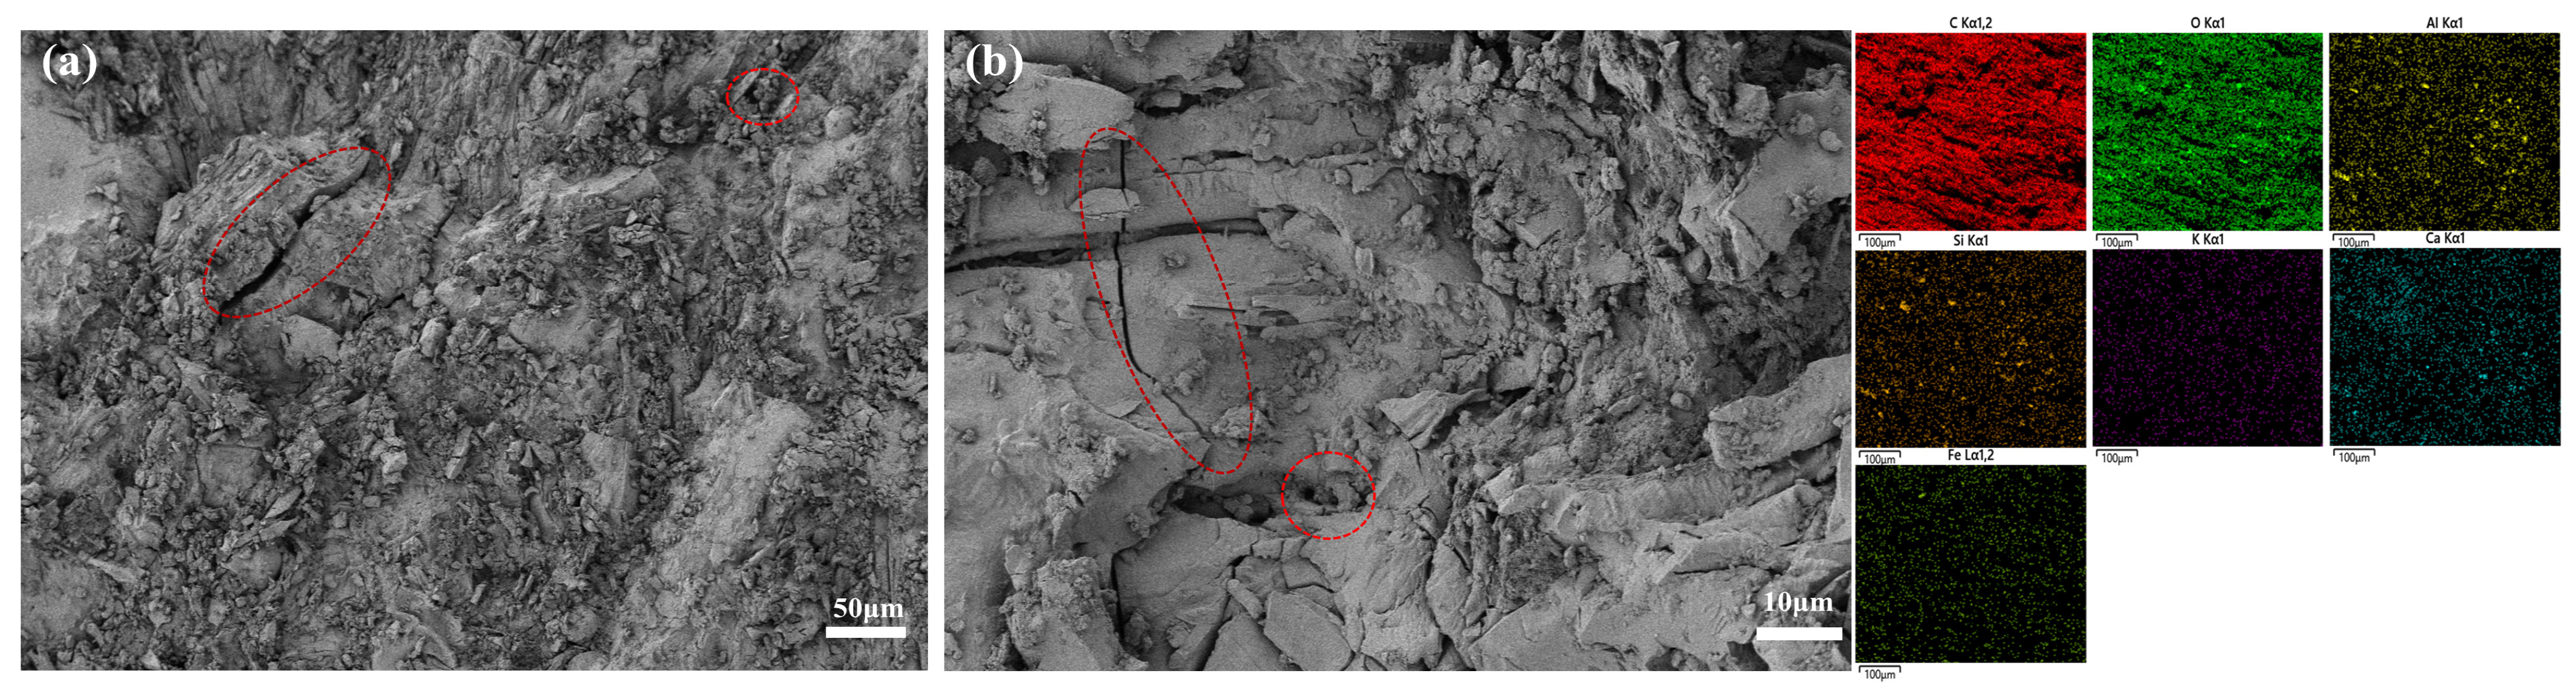
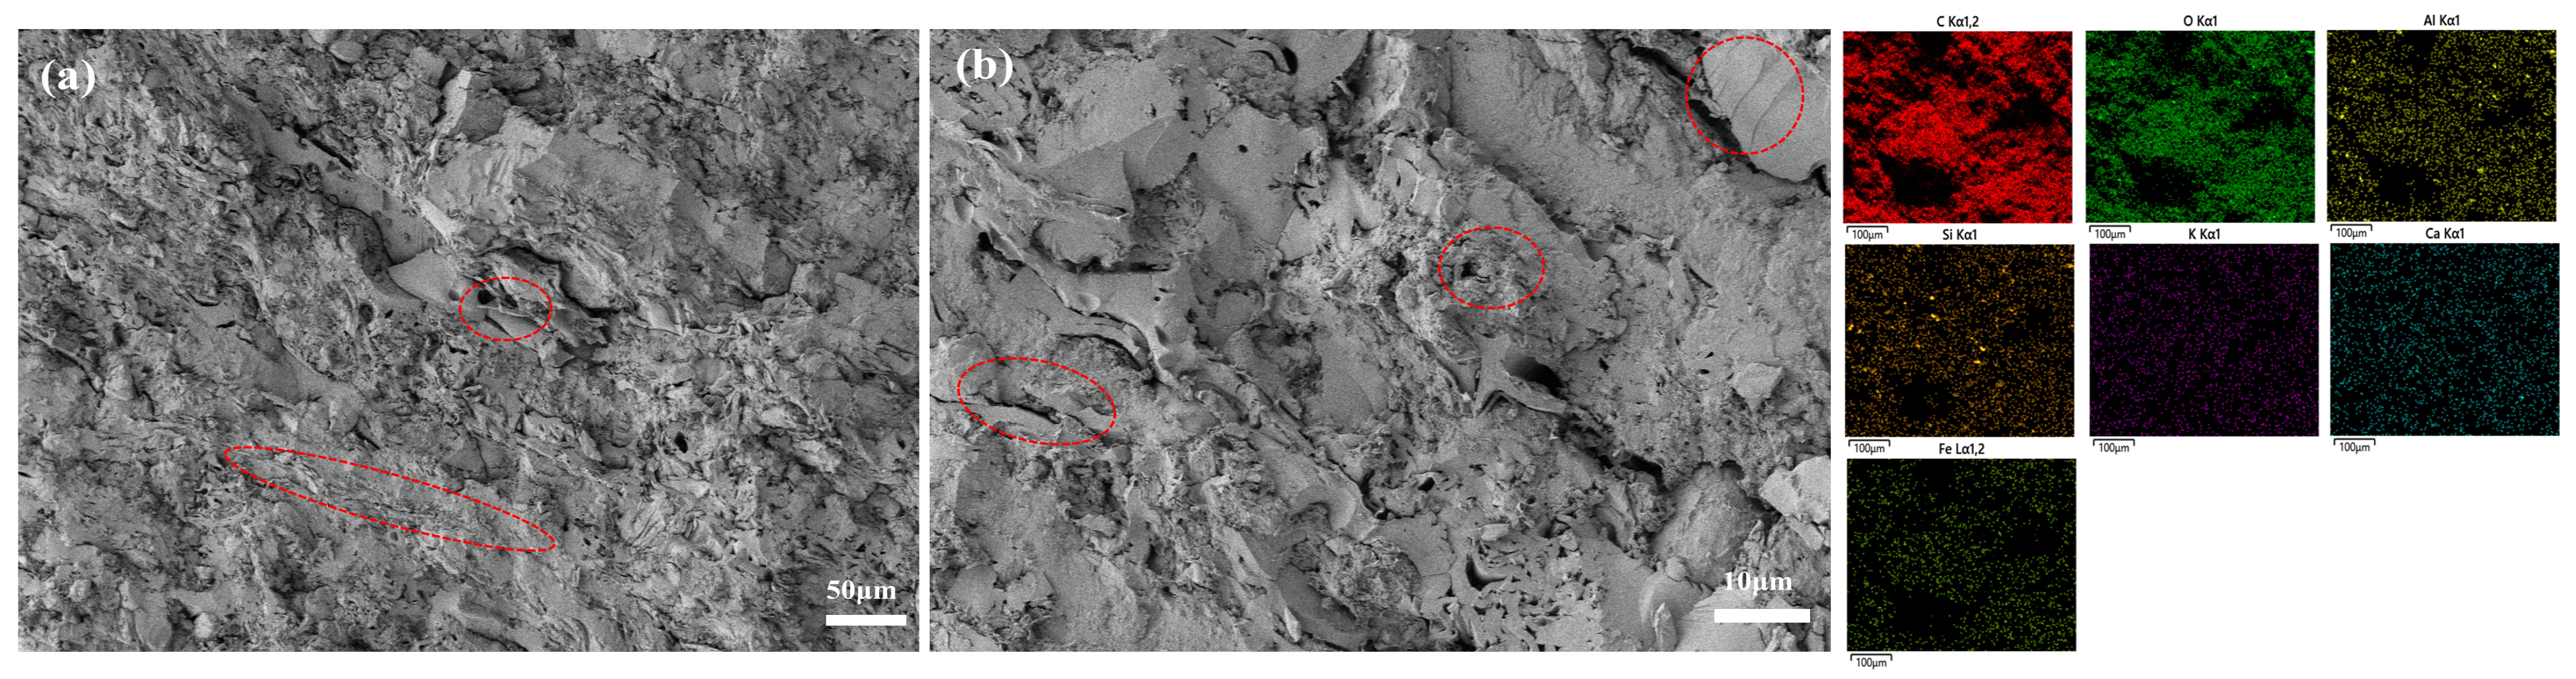
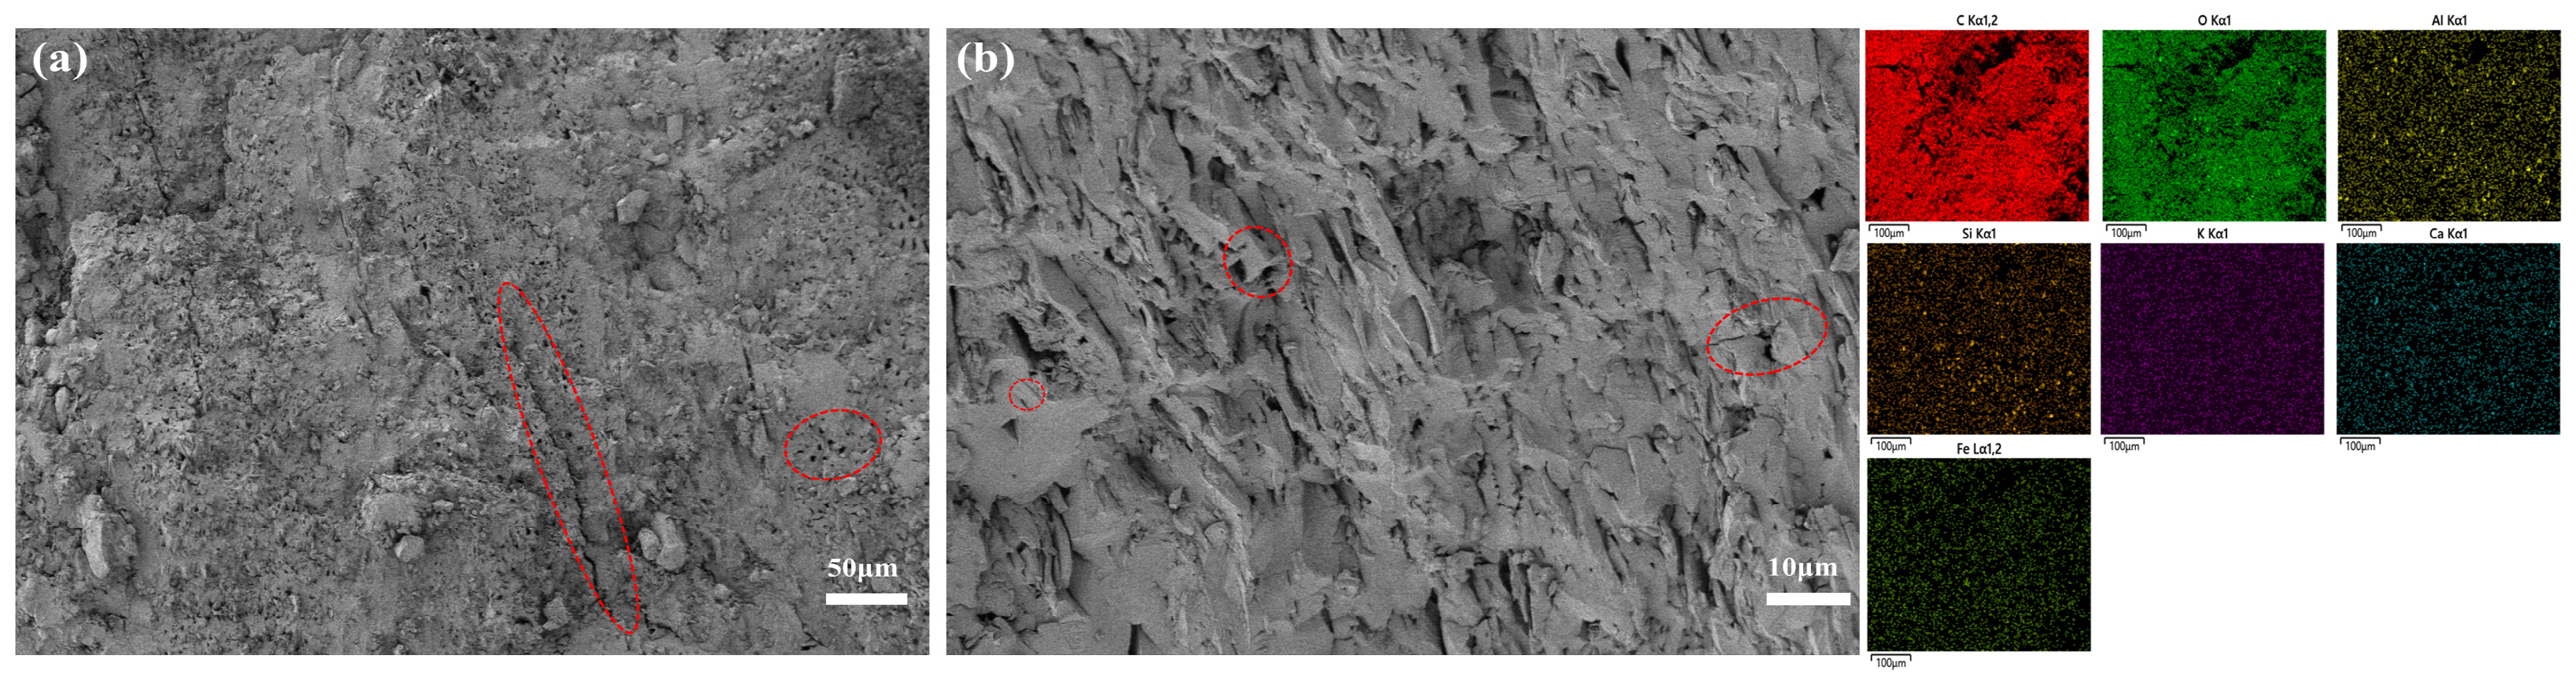
SEM and EDS Results Analysis
3.2. Analysis of Micromechanical Properties of Coal Samples
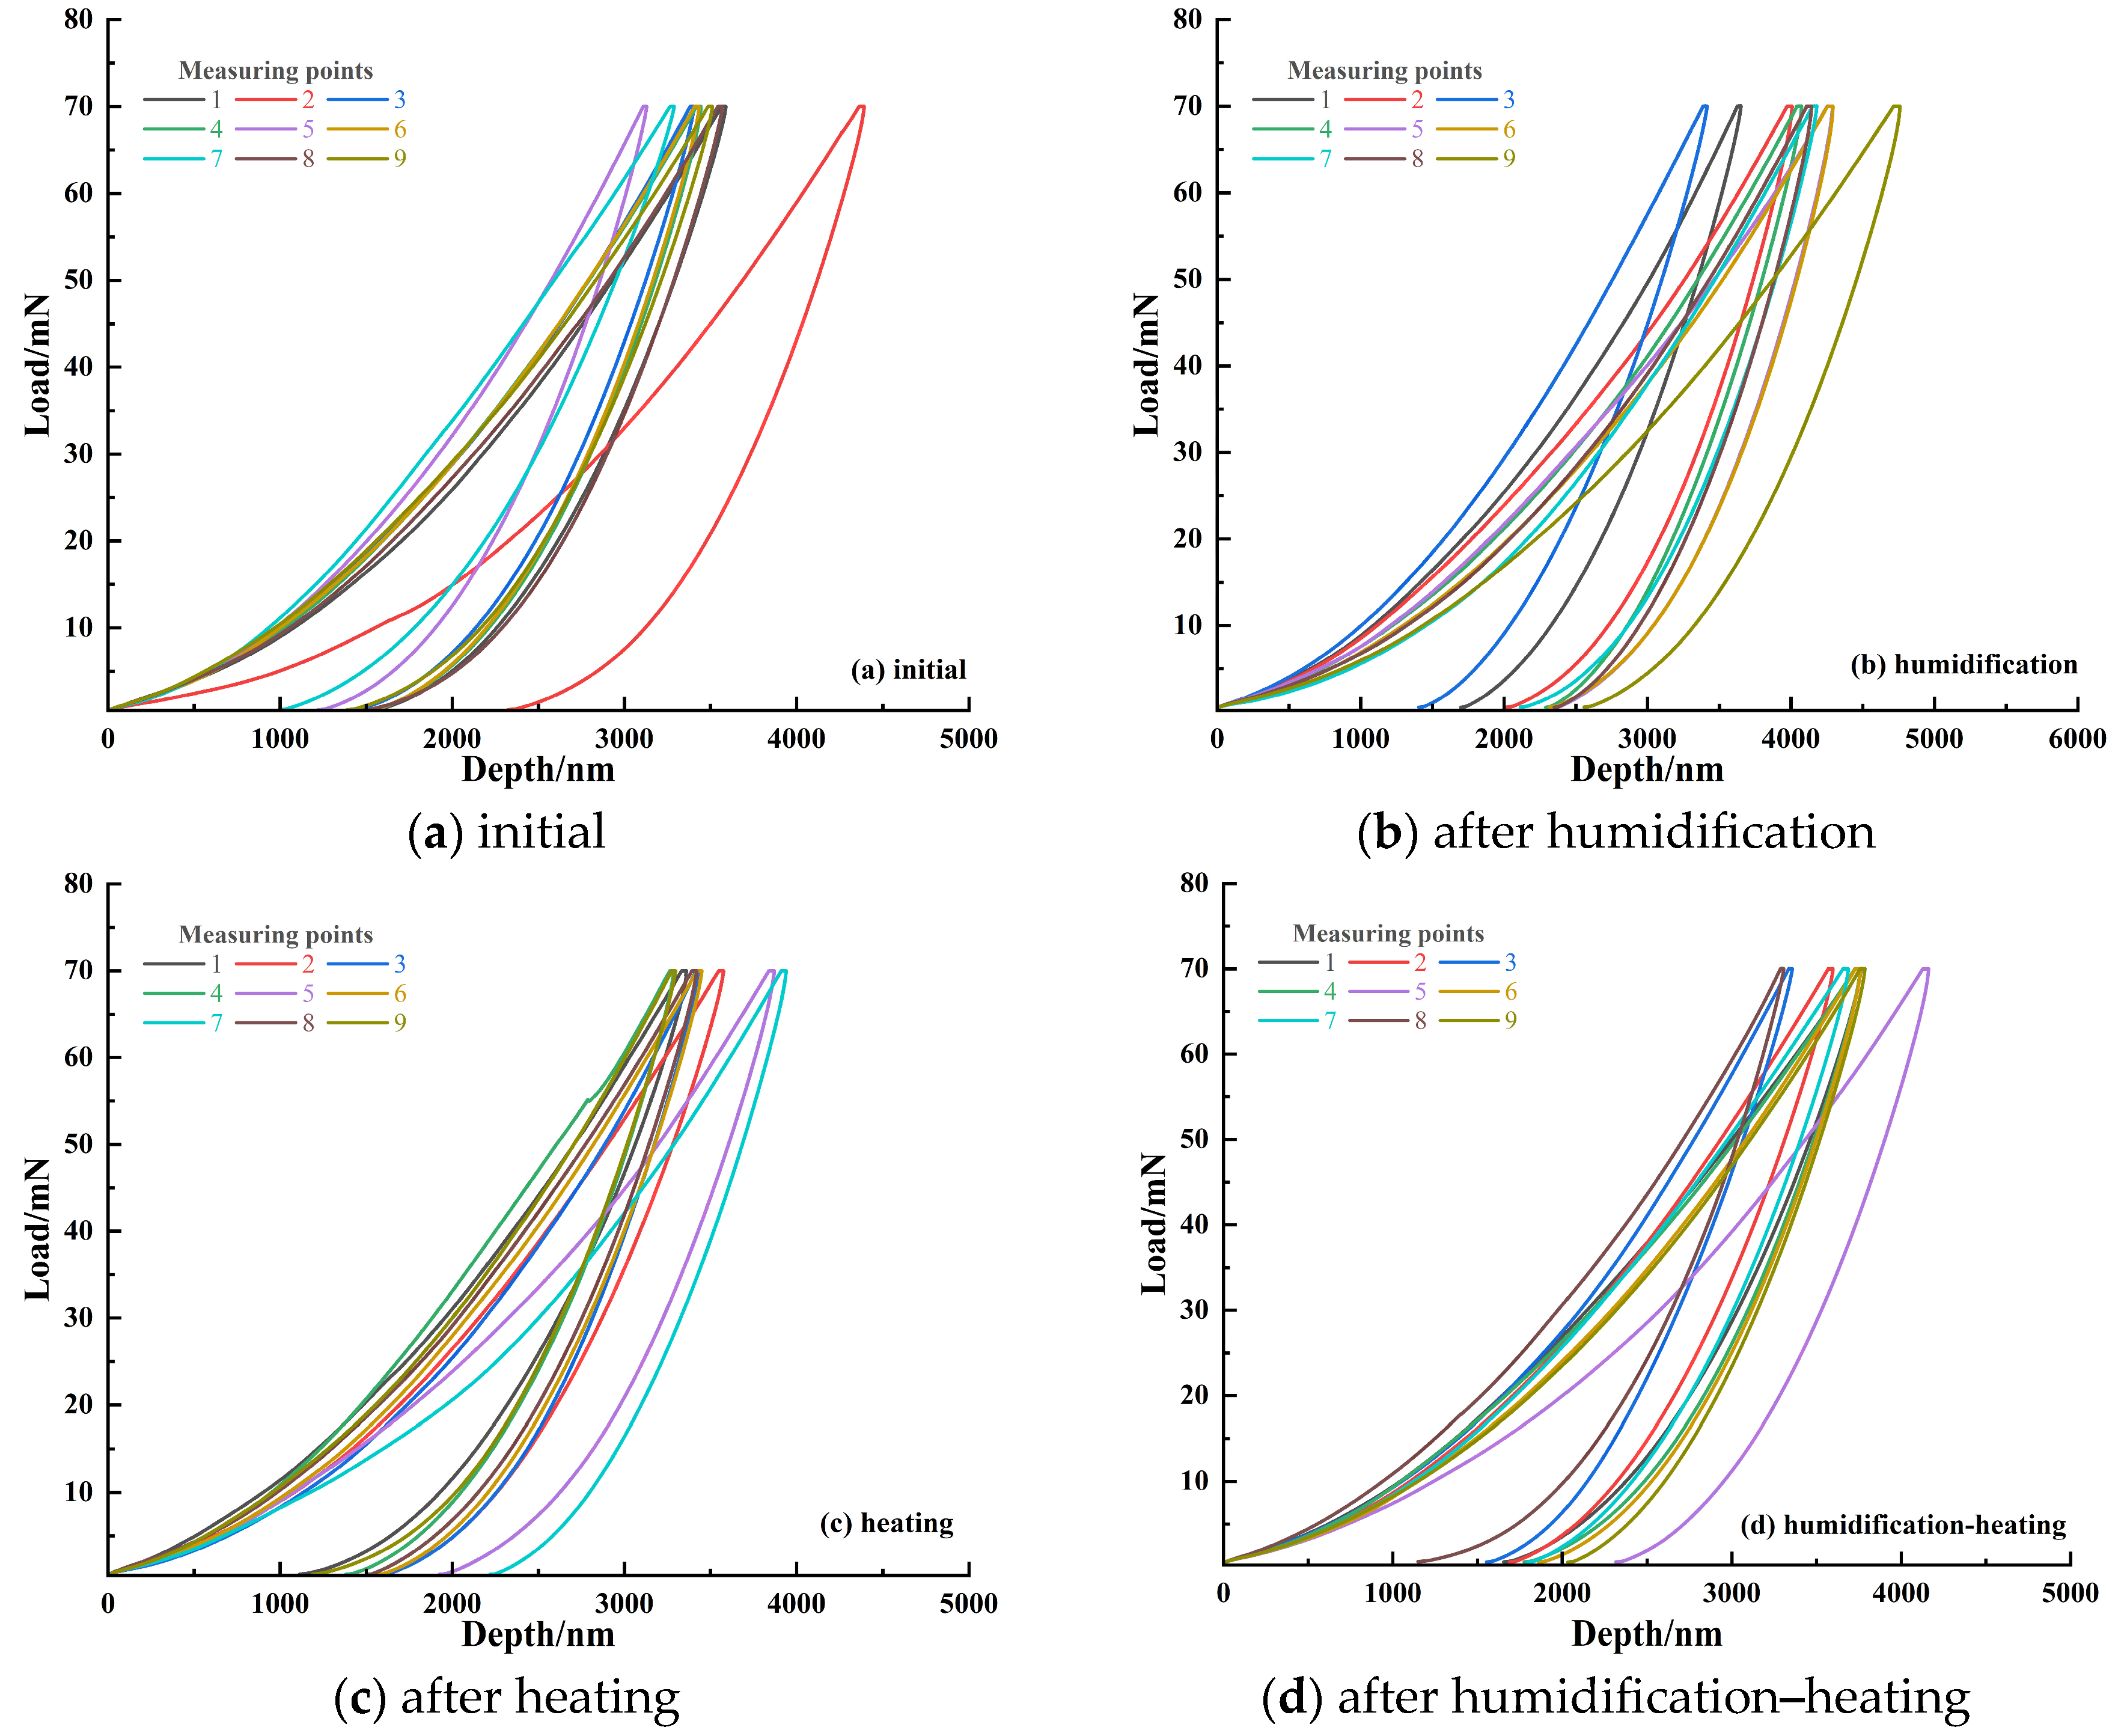
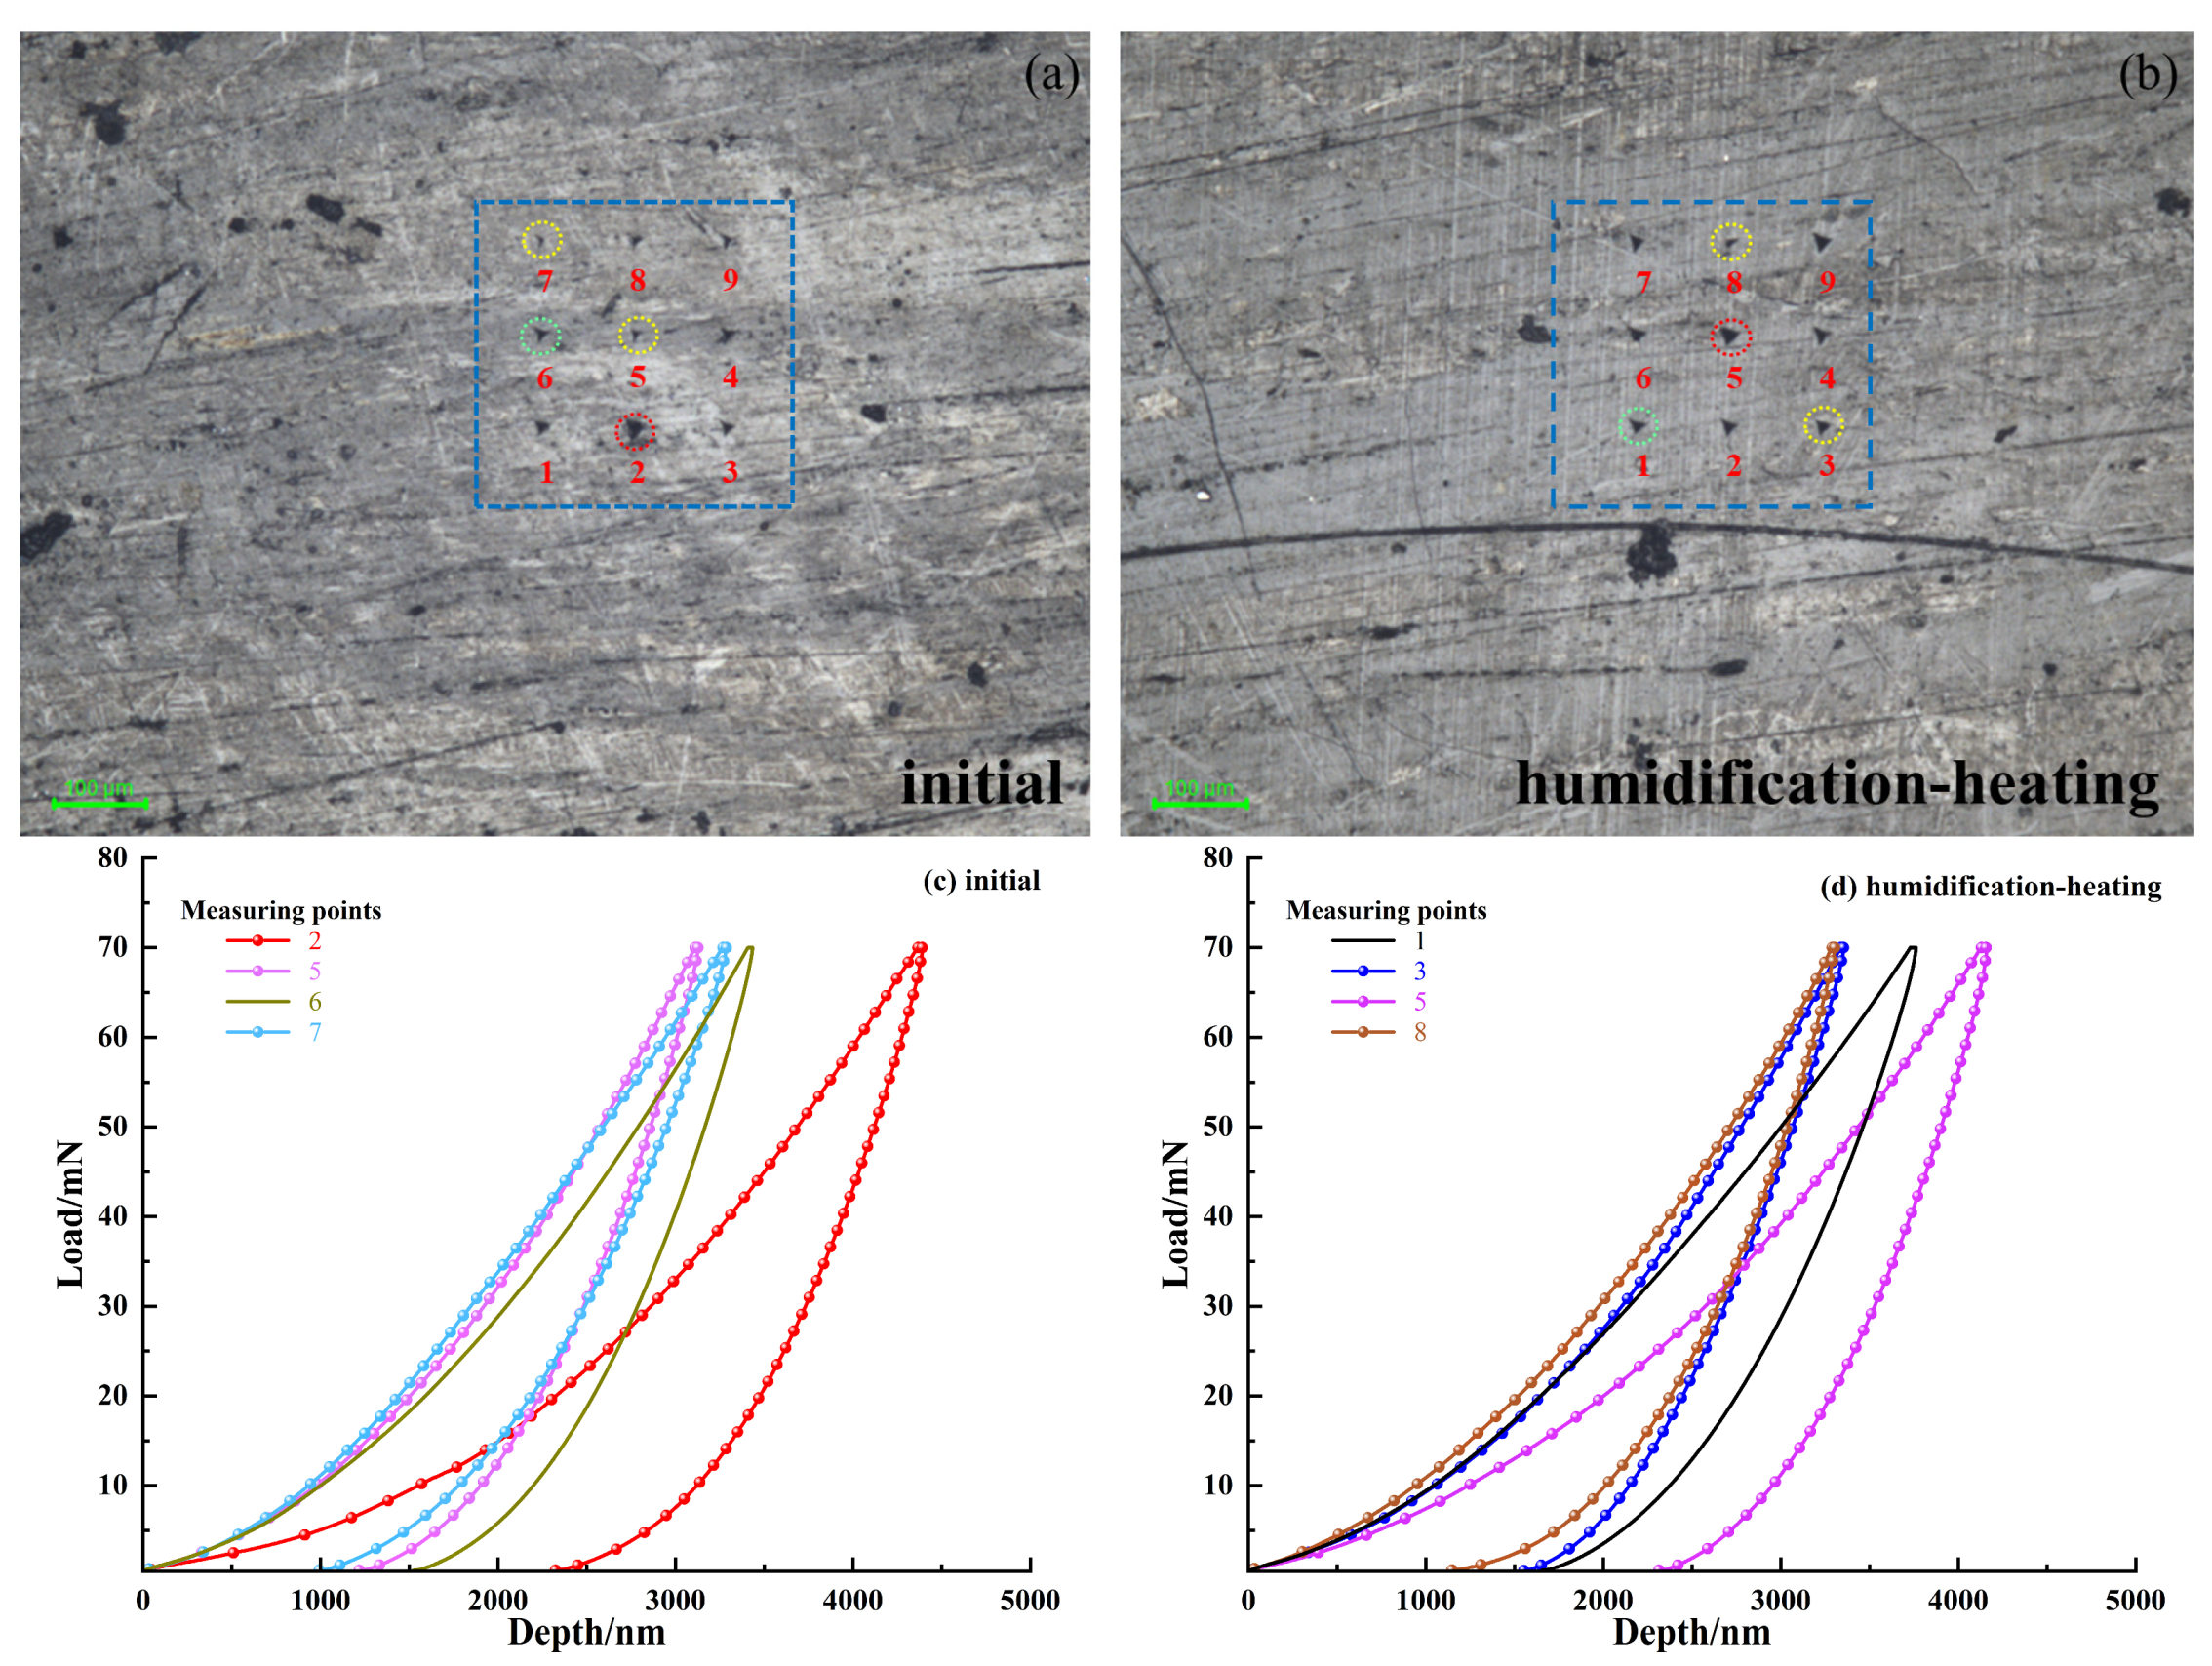
3.2.1. Load–Depth Curve Characteristics
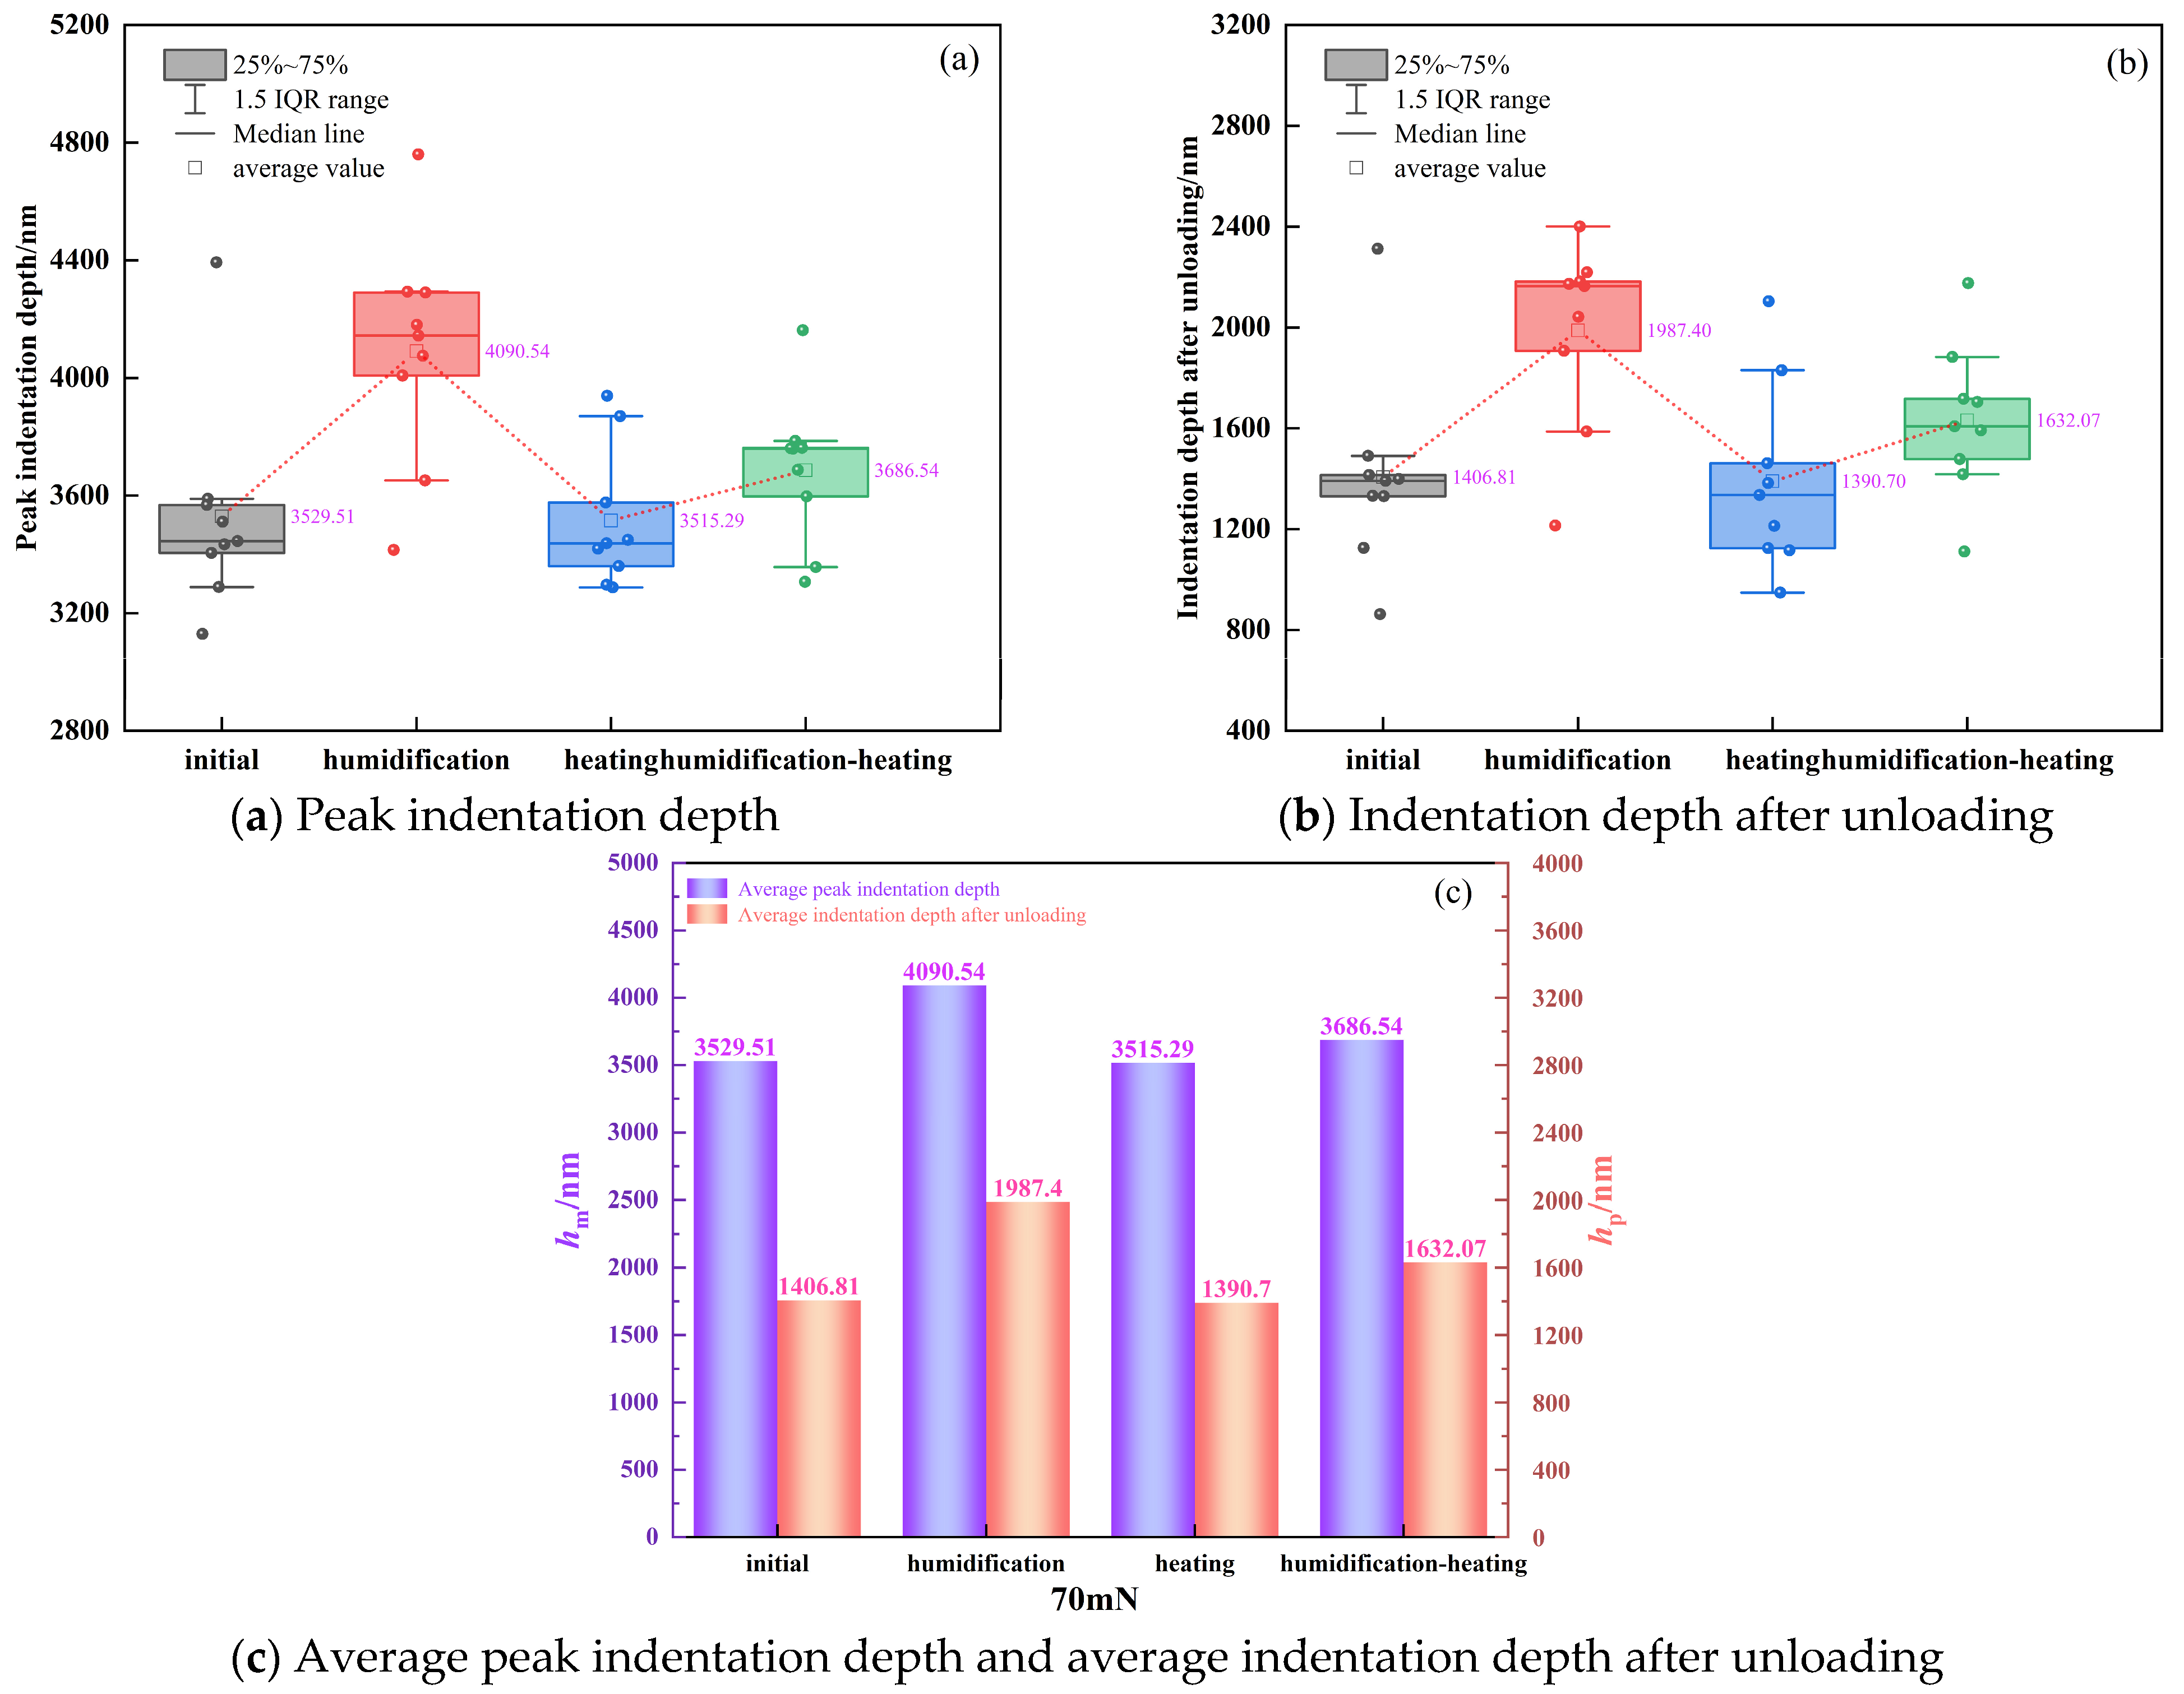
3.2.2. Indentation Depth Characteristics
3.3. Analysis of Hardness and Elastic Modulus Results
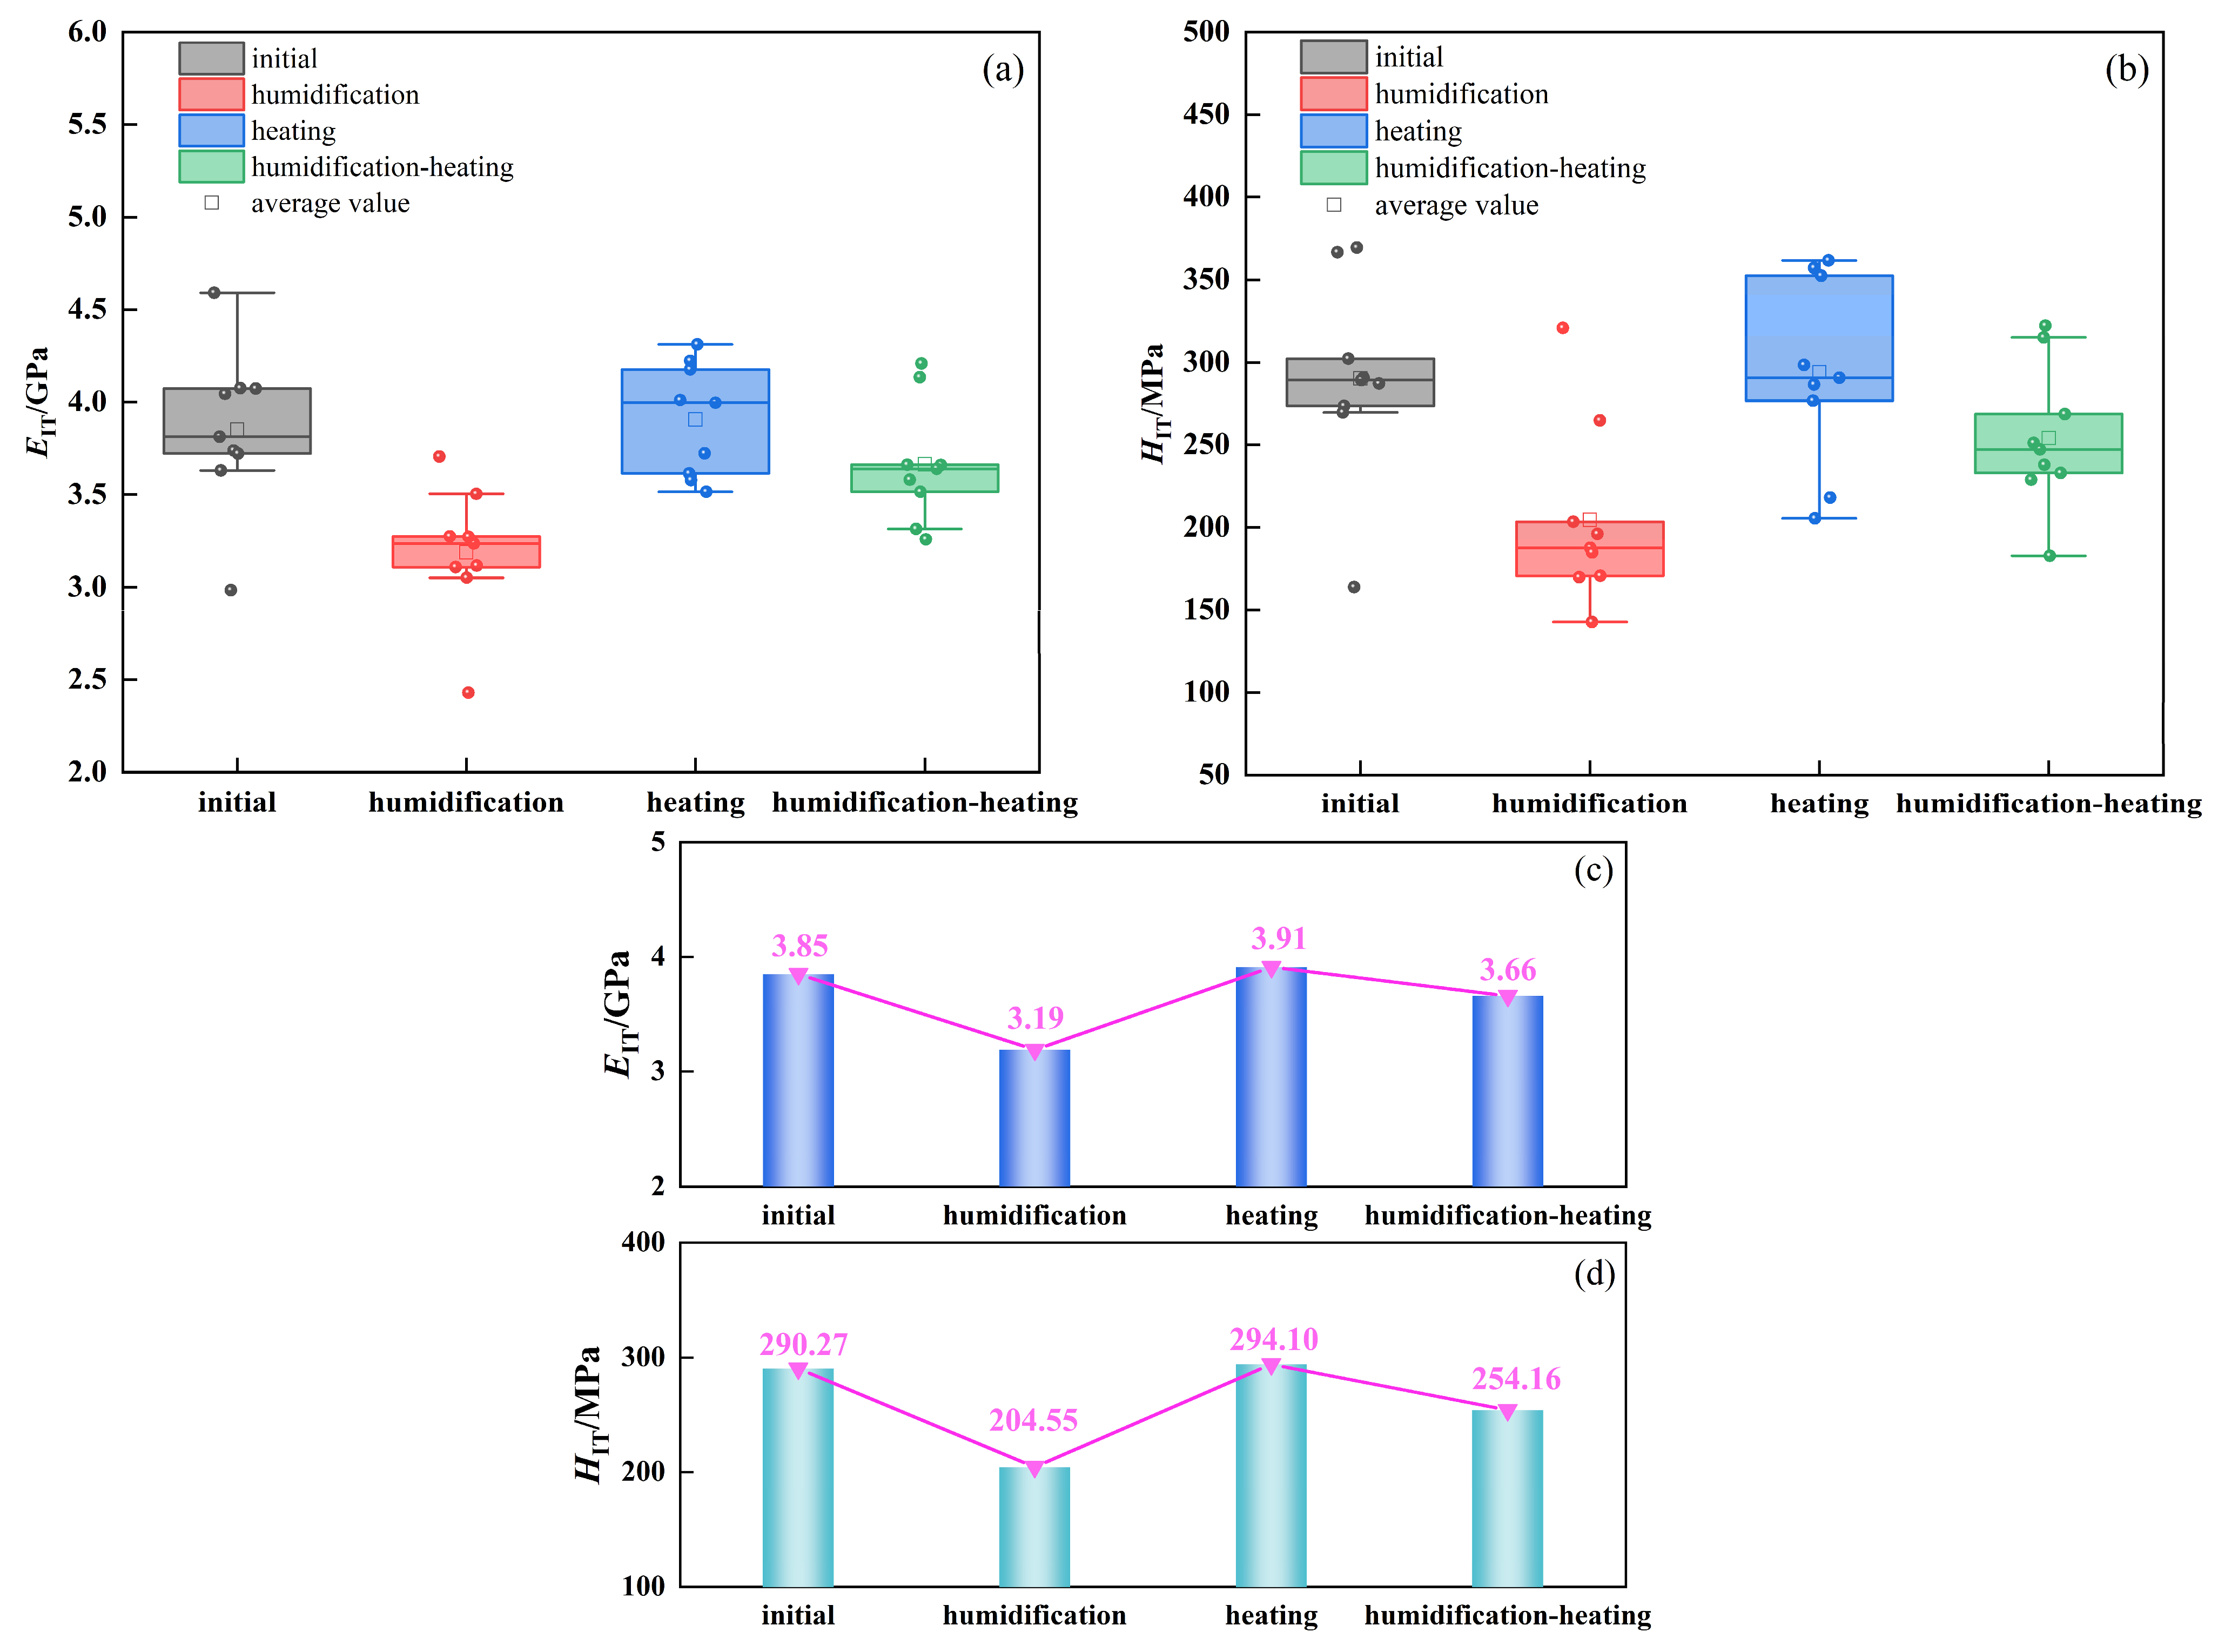
3.3.1. Comparative Analysis of Hardness and Elastic Modulus Under Different Treatments
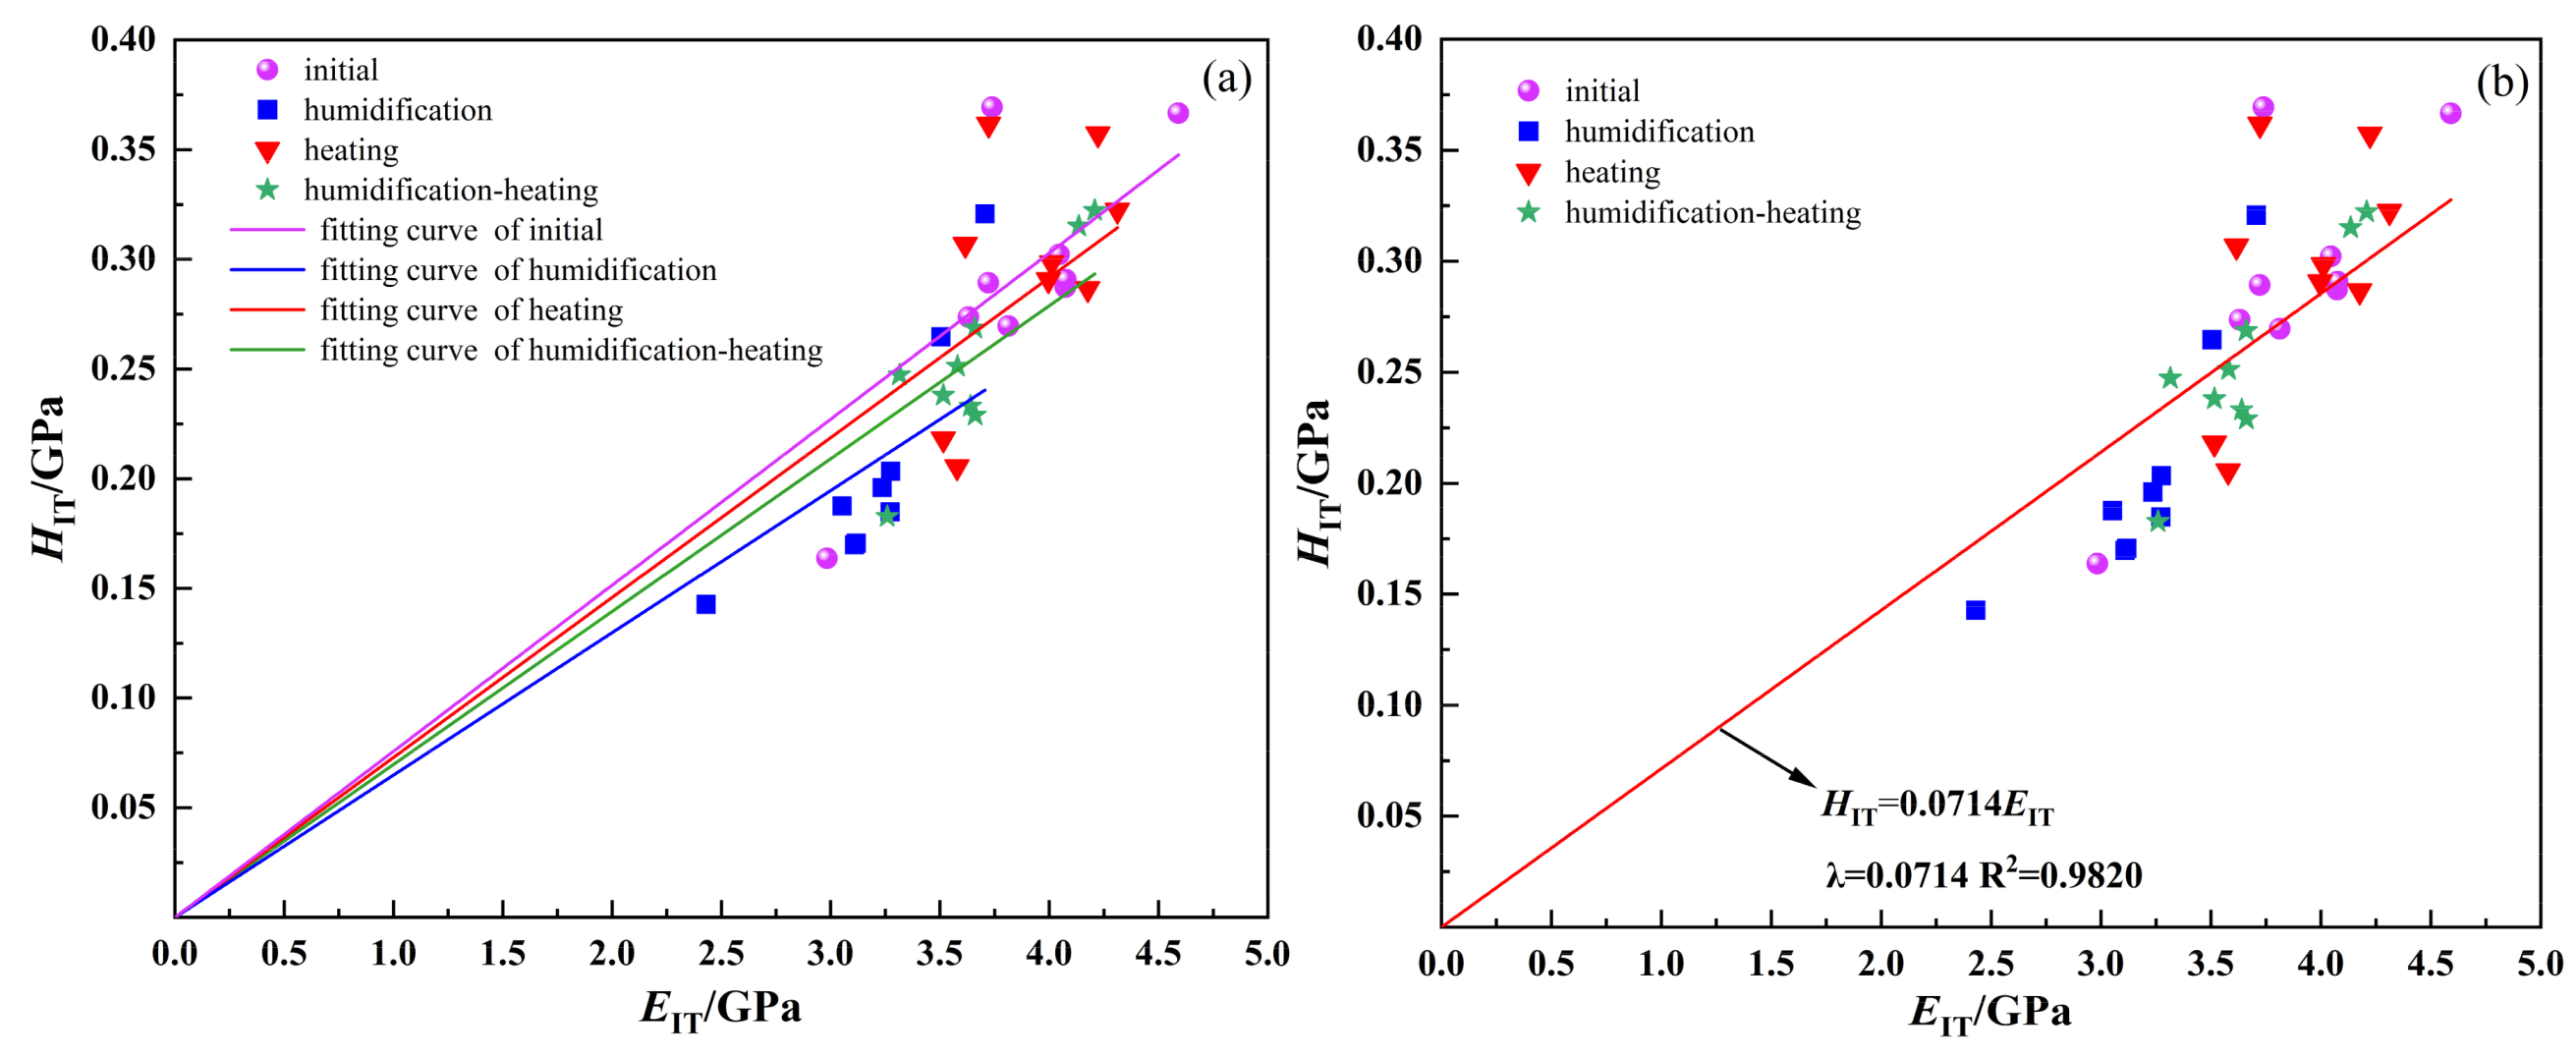
3.3.2. Relationship Between Hardness and Elastic Modulus
3.4. Effect of Mineral Composition on Micromechanical Properties
4. Conclusions
- (1)
- Under initial conditions, the coal surface is relatively dense and intact, exhibiting fewer cracks and pores. After humidification, dissolution pores appear in certain surface regions, resulting in a smoother transition between particles and the matrix. Following heating, the surface roughness of certain areas on the coal sample increased, accompanied by a localized disintegration and collapse. After the hygrothermal coupled treatment, the number of fine dissolution pores and microcracks on the coal surface increased markedly.
- (2)
- Compared with the initial state, humidification leads to the softening of the coal surface, with average values of and increasing by 15.9% and 41.27%, respectively, while values of and decrease by 17.14% and 29.53%. Heating induces surface hardening, leading to slight decreases in and , by 0.4% and 1.15%, and corresponding increases in and , by 1.56% and 1.32%. Under coupled hygrothermal conditions, and increase by 4.45% and 16.01%, respectively, while and decrease by 4.94% and 12.45%. The extent of the surface damage under hygrothermal coupling falls between that observed under humidification and heating alone.
- (3)
- A linear model passing through the origin provides an excellent fit for the relationship between the hardness and elastic modulus under different conditions. The hardness of coal exhibits a positive correlation with its elastic modulus, and this relationship is independent of the coal’s condition.
- (4)
- The mineral composition on the coal surface has a significant influence on its micromechanical properties. Hard minerals such as quartz tend to result in lower peak indentation depths and higher hardness values, whereas softer minerals like kaolinite lead to higher peak indentation depths and lower hardness values.
Author Contributions
Funding
Institutional Review Board Statement
Informed Consent Statement
Data Availability Statement
Acknowledgments
Conflicts of Interest
References
- He, M. Research progress of deep shaft construction mechanics. J. China Coal Soc. 2021, 46, 726–746. [Google Scholar]
- Xie, H. Research review of the state key research development program of China: Deep rock mechanics and mining theory. J. China Coal Soc. 2019, 44, 1283–1305. [Google Scholar]
- Cai, Y.; Jia, D.; Qiu, F.; Liu, D.; Yan, X.; Zhou, Y.; An, K. Micromechanical properties of coal and its influencing factors based on nanoindentation. J. China Coal Soc. 2023, 48, 879–890. [Google Scholar]
- Liu, P.; Zhao, Y.; Nie, B.; Liu, X.; Deng, B.; He, H.; Cao, M. Study on nano-mechanical behavior of coal using nanoindentation tests. J. China Coal Soc. 2024, 49, 3453–3467. [Google Scholar]
- Meng, J.; Niu, J.; Xia, J.; Kan, L. Study on mechanical properties and failure mechanisms of coal at the nanometer scale. Chin. J. Rock Mech. Eng. 2020, 39, 84–92. [Google Scholar]
- Sun, C.; Li, G.; Xu, J.; Rong, H.; Sun, Y. Rheological characteristics of mineral components in sandstone based on nanoindentation. Chin. J. Rock Mech. Eng. 2021, 40, 77–87. [Google Scholar]
- Kalei, G. Some results of microhardness test using the depth of impression. Mashinovedenie 1968, 4, 105–107. [Google Scholar]
- Borodich, F.M.; Bull, S.; Epshtein, S. Nanoindentation in studying mechanical properties of heterogeneous materials. J. Min. Sci. 2015, 51, 470–476. [Google Scholar] [CrossRef]
- Sun, C.; Li, G.; Gomah, M.E.; Xu, J.; Sun, Y. Creep characteristics of coal and rock investigated by nanoindentation. Int. J. Min. Sci. Technol. 2020, 30, 769–776. [Google Scholar] [CrossRef]
- Sun, C.; Li, G.; Zhang, S.; Xu, J.; Yang, H. Mechanical and heterogeneous properties of coal and rock quantified and mapped at the microscale. Appl. Sci. 2020, 10, 342. [Google Scholar] [CrossRef]
- Ma, Z.; Pathegama Gamage, R.; Zhang, C. Application of nanoindentation technology in rocks: A review. Geomech. Geophys. Geo-Energ. Geo-resour 2020, 6, 60. [Google Scholar] [CrossRef]
- Liu, K.; Jin, Z.; Zakharova, N.; Zeng, L.; Haghshenas, M.; Adeyilola, A.; Saurabh, S. Comparison of shale fracture toughness obtained from scratch test and nanoindentation test. Int. J. Rock Mech. Min. Sci. 2023, 162, 105282. [Google Scholar] [CrossRef]
- Chen, P.; Han, Q.; Ma, T.; Lin, D. The mechanical properties of shale based on micro-indentation test. Pet. Explor. Dev. 2015, 42, 662–670. [Google Scholar] [CrossRef]
- Bennett, K.C.; Berla, L.A.; Nix, W.D.; Borja, R.I. Instrumented nanoindentation and 3D mechanistic modeling of a shale at multiple scales. Acta Geotech. 2015, 10, 1–14. [Google Scholar] [CrossRef]
- Eliyahu, M.; Emmanuel, S.; Day-Stirrat, R.J.; Macaulay, C.I. Mechanical properties of organic matter in shales mapped at the nanometer scale. Mar. Pet. Geol. 2015, 59, 294–304. [Google Scholar] [CrossRef]
- Dou, Z.; Zhao, Z.; Gao, T.; Li, J.; Yang, Q. Evolution law of water–rock interaction on the shear behavior of granite fractures. J. Tsinghua Univ. (Sci. Technol.) 2021, 61, 792–798. [Google Scholar]
- Nie, B.; He, H.; Liu, P.; Liu, X.; Deng, B.; Zhao, Y.; Zhang, H.; Cao, M. Nanomechanical behavior of coal with heterogeneous minerals and pores using nanoindentation. Environ. Sci. Pollut. Res. 2024, 31, 28007–28024. [Google Scholar] [CrossRef]
- Sun, C.; Li, G.; Gomah, M.E.; Xu, J.; Rong, H. Experimental investigation on the mechanical properties of crushed coal samples based on the nanoindentation technique. J. China Coal Soc. 2020, 45, 682–691. [Google Scholar]
- Liu, A.; Liu, S.; Liu, Y.; Liu, B.; Liu, T. Characterizing mechanical heterogeneity of coal at nano-to-micro scale using combined nanoindentation and FESEM-EDS. Int. J. Coal Geol. 2022, 261, 104081. [Google Scholar] [CrossRef]
- Jia, P.; Nadimi, S.; Jia, J. Quantitative micro mechanical and pore structural characterisation of coal before and after freezing. Fuel 2022, 316, 123421. [Google Scholar] [CrossRef]
- Kossovich, E.; Epshtein, S.; Dobryakova, N.; Minin, M.; Gavrilova, D. Mechanical Properties of Thin Films of Coals by Nanoindentation. In Physical and Mathematical Modeling of Earth and Environment Processes, Proceedings of the Conference on Physical and Mathematical Modeling of Earth and Environment Processes, Moscow, Russia, 1–3 November 2017; Springer International Publishing: Cham, Switzerland, 2018. [Google Scholar]
- Epshtein, S.A.; Borodich, F.M.; Bull, S.J. Evaluation of elastic modulus and hardness of highly inhomogeneous materials by nanoindentation. Appl. Phys. A 2015, 119, 325–335. [Google Scholar] [CrossRef]
- Wang, C. Study on the Methods of Nanoindentation Testing. Master’s Thesis, China Academy of Mechanical Science, Beijing, China, 2008. [Google Scholar]
- Oliver, W.C.; Pharr, G.M. An improved technique for determining hardness and elastic modulus using load and displacement sensing indentation experiments. J. Mater. Res. 1992, 7, 1564–1583. [Google Scholar] [CrossRef]
- Xian, S.; Jiang, S.; Shuangfang, L.; Zhiliang, H.; Dongjie, L.; Zhixuan, W.; Dianshi, X. Investigation of mechanical properties of bedded shale by nanoindentation tests: A case study on Lower Silurian Longmaxi Formation of Youyang area in southeast Chongqing, China. Pet. Explor. Dev. 2019, 46, 163–172. [Google Scholar]
- Yao, Q.; Wang, W.; Zhu, L.; Xia, Z.; Tang, C.; Wang, X. Effects of moisture conditions on mechanical properties and AE and IR characteristics in coal–rock combinations. Arab. J. Geosci. 2020, 13, 615. [Google Scholar] [CrossRef]


| Mineral Composition | Amorphous | Kaolinite | Quartz | Carbonate |
| Mass fraction/% | 84.28 | 10.44 | 4.12 | 1.16 |
| Number | N | N-H | N-T | N-H-T | ||||
|---|---|---|---|---|---|---|---|---|
| EIT/GPa | HIT/MPa | EIT/GPa | HIT/MPa | EIT/GPa | HIT/MPa | EIT/GPa | HIT/MPa | |
| N-1 | 3.631 | 273.642 | 3.504 | 264.762 | 3.723 | 361.57 | 3.316 | 247.273 |
| N-2 | 2.983 | 163.812 | 3.274 | 203.468 | 3.615 | 306.747 | 3.660 | 268.625 |
| N-3 | 4.045 | 302.211 | 3.706 | 320.786 | 4.176 | 286.536 | 4.135 | 315.138 |
| N-4 | 4.073 | 287.213 | 3.236 | 196.081 | 4.312 | 322.364 | 3.516 | 237.975 |
| N-5 | 4.591 | 366.602 | 3.117 | 170.684 | 3.515 | 218.072 | 3.259 | 182.788 |
| N-6 | 4.076 | 290.772 | 3.109 | 169.848 | 3.996 | 290.677 | 3.640 | 233.024 |
| N-7 | 3.739 | 369.306 | 3.052 | 187.673 | 3.579 | 205.483 | 3.581 | 251.219 |
| N-8 | 3.813 | 269.595 | 3.272 | 184.892 | 4.011 | 298.376 | 4.208 | 322.248 |
| N-9 | 3.721 | 289.314 | 2.430 | 142.743 | 4.223 | 357.081 | 3.662 | 228.935 |
| Coal Sample Status | Slope (λ) | Goodness of Fit (R2) |
|---|---|---|
| initial | 0.07571 | 0.9837 |
| humidification | 0.06488 | 0.9720 |
| heating | 0.07291 | 0.9877 |
| Humidification–heating | 0.06971 | 0.9914 |
| summary | 0.07140 | 0.9820 |
Disclaimer/Publisher’s Note: The statements, opinions and data contained in all publications are solely those of the individual author(s) and contributor(s) and not of MDPI and/or the editor(s). MDPI and/or the editor(s) disclaim responsibility for any injury to people or property resulting from any ideas, methods, instructions or products referred to in the content. |
© 2025 by the authors. Licensee MDPI, Basel, Switzerland. This article is an open access article distributed under the terms and conditions of the Creative Commons Attribution (CC BY) license (https://creativecommons.org/licenses/by/4.0/).
Share and Cite
Zhao, H.; Li, G.; Xu, J.; Sun, Y.; He, F.; Hao, H.; Han, M.; Tian, B. An Experimental Investigation on the Microscopic Damage and Mechanical Properties of Coal Under Hygrothermal Conditions. Appl. Sci. 2025, 15, 7013. https://doi.org/10.3390/app15137013
Zhao H, Li G, Xu J, Sun Y, He F, Hao H, Han M, Tian B. An Experimental Investigation on the Microscopic Damage and Mechanical Properties of Coal Under Hygrothermal Conditions. Applied Sciences. 2025; 15(13):7013. https://doi.org/10.3390/app15137013
Chicago/Turabian StyleZhao, Haisen, Guichen Li, Jiahui Xu, Yuantian Sun, Fengzhen He, Haoran Hao, Mengzhuo Han, and Bowen Tian. 2025. "An Experimental Investigation on the Microscopic Damage and Mechanical Properties of Coal Under Hygrothermal Conditions" Applied Sciences 15, no. 13: 7013. https://doi.org/10.3390/app15137013
APA StyleZhao, H., Li, G., Xu, J., Sun, Y., He, F., Hao, H., Han, M., & Tian, B. (2025). An Experimental Investigation on the Microscopic Damage and Mechanical Properties of Coal Under Hygrothermal Conditions. Applied Sciences, 15(13), 7013. https://doi.org/10.3390/app15137013