1. Introduction
Casting production is one of the oldest and most essential manufacturing processes in the metallurgical industry. In fact, it enables the production of large-scale and complex metallic components by pouring molten metal into molds, where, later, it solidifies into predetermined geometries. This process remains indispensable across multiple sectors, including automotive, energy, construction, and aerospace, due to its flexibility, cost-effectiveness, and capacity for producing both high-volume and high-performance parts [
1]. According to the World Foundry Organization (WFO), global casting production exceeded 112 million metric tons in 2022, which corroborates its central role in the global manufacturing ecosystem [
2].
The relevance of the foundry process goes beyond its industrial ubiquity. In fact, a considerable proportion of cast components is integrated into larger and more sophisticated mechanical systems, serving not only to create their basic structural elements but also to improve their functional behavior. In sectors such as aerospace, railways, or automotive, a single faulty cast part can compromise entire systems, leading to failures with severe safety, operational, and economic consequences [
3]. In this way, this fact makes the mechanical reliability and metallurgical integrity of a casting the main objective in ensuring its behavior.
Ensuring the quality of cast parts depends heavily on their internal microstructure, which is influenced by alloy composition, the cooling rate, and the presence of undesirable phases or inclusions. For this reason, metallographic analysis has become a fundamental tool in casting quality control. Working with metallographic images extracted by microscopy allows for the characterization of metallic microstructures. In fact, this analysis provides information on key features such as the ferrite/perlite matrix, graphite morphology, and the presence of carbides. It is particularly critical in nodular cast iron, where mechanical properties are directly linked to the nodularity, size, and distribution of graphite particles.
Metallographic evaluation is traditionally based on standards such as UNE-EN-ISO 945-1, 945-2, and 945-4 [
4,
5,
6], which guide the classification of microstructural features through comparison with reference charts and micrographs. However, this procedure is largely manual and depends on expert interpretation, which introduces significant variability and limits reproducibility [
7]. Furthermore, factors such as evaluator fatigue, perceptual bias, and subjective judgment often lead to inconsistencies, reducing the reliability of the analysis and increasing the risk of ignoring defects.
Attempting to avoid these limitations, software tools such as ImageJ [
8], AmGuss [
9], and microscope-integrated systems [
10] have been developed to assist users in quantitative image analysis. Although these systems automate certain aspects of image measurement, they are still based on rule-based algorithms and thresholding methods that lack adaptability and do not incorporate contextual understanding. In addition, they are often inadequate in complex or heterogeneous microstructures and still require significant human oversight.
In recent years, deep learning (DL) has emerged as an innovative approach in the field of computer vision (CV). In contrast to classical image processing methods, DL models learn hierarchical and abstract representations from data, enabling robust recognition of patterns even in noisy or complex environments. DL applications in microscopy have shown notable successes in fields such as oncology [
11], wood anatomy [
12], and metallurgical imaging [
7,
13,
14]. In the context of cast iron, DL has been applied to segment microstructural phases [
15], estimating nodularity percentages, and even correlating graphite morphology with mechanical properties [
16]. These approaches offer a promising alternative to traditional methods, improving precision, reproducibility, and scalability.
Against this background, we propose HawkEye, an artificial intelligence (AI)-based software platform designed to optimize the metallographic analysis of nodular cast iron. Our system integrates advanced CV techniques and DL models to automate graphite morphology classification, microstructural phase segmentation, carbide detection, and metallurgical quality assessment. HawkEye software v2024.12 includes a dynamic image type classification module that adapts the workflow depending on the image. This way of working improves processing accuracy and resource efficiency. All components are unified via a user-centric interface, which is suitable for laboratory use and also compatible with automated inspection pipelines.
The main contributions of this work are as follows:
A complete and adaptive analysis pipeline for both etched and non-etched images, enabling robust image type classification and workflow adaptation.
Integration of DL models for accurate segmentation and classification of graphite nodules and microstructural phases such as ferrite, perlite, and carbides.
A modular and user-friendly software interface supporting both manual operation and integration with automated metallographic analysis systems.
A quality evaluation framework that translates image features into metallurgical classifications aligned with international standards.
The remainder of this paper is organized as follows.
Section 2 describes the work and the steps undertaken to achieve the proposed solution. Additionally, this section discusses data generation, the methodology, and the development of the software system.
Section 3 presents the results achieved with the proposed approach. Here, we introduce the achieved results for several configurations, as well as the final solution created. Finally,
Section 4 concludes this paper and the research, providing a discussion of the solution and suggesting future work and potential improvements to our proposal.
2. Materials and Methods
Due to the large number of challenges faced by researchers, as listed in
Section 1, it is necessary to determine a robust research methodology to help address these challenges. Specifically, to achieve a successful outcome, researchers have determined that the working methodology that could help is the well-known “divide-and-conquer” methodology. The main objective of this methodology is to simplify the resolution of the original problem. To achieve this, the general problem, defined as
P, is decomposed into smaller and more manageable subproblems where
. Once each subproblem has been individually addressed and its specific solution obtained, defined as
, the partial results are systematically combined to construct the complete solution to the original problem, giving a
, where
C is the function that combines those partial solutions. This
divide-and-conquer strategy allows for a reduction in computational complexity and facilitates a structured and efficient problem-solving approach. Historically, this methodology is widely used to manage several kinds of challenges, for instance, to deal with legal challenges [
17], mathematical calculations [
18], and computational problems (accurately in parallel processing) [
19].
Consequently, taking this idea into account, the steps defined in this work are detailed as follows (additional information is shown in
Figure 1):
Identification of the problem and challenges to overcome. The aim of this initial step is to establish the background and context of the problem to be solved. In other words, we work to understand what we are trying to solve.
Acquisition of knowledge. The second step involves acquiring high-level knowledge to provide the necessary overview for initiating the research. Then, when working on a more specific challenge, that topic will be studied in greater detail.
Challenge division. Based on the main idea of this methodology, the overall work is divided into several smaller challenges. In our case, the following challenges were detected: (i) Image typology classification to identify specific workflow. (ii) Automation of feature inference and extraction from non-etched metallographic microstructures. (iii) Enhanced feature extraction from chemically etched metallographic specimens, and (iv) functional integration and a user-centric interface for AI-driven metallographic analysis. For each of these, the following sub-phases will be performed:
- (a)
Acquisition of specific knowledge. Once the topic is defined, it is time to expand the knowledge needed to solve the problem.
- (b)
Definition of the experiment and the techniques to be used. The specific research and experiments are outlined for each of the challenges faced.
- (c)
Evaluation. The defined experiment is carried out, and results are obtained for the approximation that has been defined.
- (d)
Analysis. A specific process is performed on the data collected during the designed experiment.
- (e)
Interpretation of the results. When each solution has been determined for all identified challenges, they will be combined.
To support the current defined methodology and deal with the aforementioned detected challenges, a comprehensive dataset of metallographic images was compiled and processed. All metallographic images were extracted from several reports generated by the Azterlan Metallographic Department. More accurately, the dataset consists of a total of 2230 metallographic images, including various graphite morphologies and preparation conditions representative of real-world foundry scenarios.
More specifically, the dataset was grouped into three primary graphite types, as follows: (i) lamellar (approximately 9.2% of images), (ii) vermicular (3.3%), and (iii) nodular (87.5%). Regarding the nodular subset, which is the main focus of this work due to its industrial relevance, the samples were further divided based on different characteristics. Firstly, 1240 samples were non-etched and 711 were etched. Among the etched ones, 15.2% of them exhibited visible carbide formations. Some of them were marked as unclassifiable due to limitations such as low contrast or unclear features.
In order to improve the generalization and robustness of models, extensive data augmentation (DA) was applied before training. On the one hand, we carried out some manual transformations, managing the raw images and generating grayscale versions and thresholded, binarized representations. Moreover, in our DA strategy, we introduced mosaic augmentation (a combination of four images to simulate complex contextual arrangements) [
20], random affine transformations (including small rotations, translations, scaling, and shear distortions) [
21], hue, saturation, and value adjustments, also known as HSV adjustments (to generate variations in lighting and color conditions) [
22], horizontal flipping, Gaussian blur, additive noise, and CutOut (to simulate occlusions) [
23].
Thanks to the use of this technique in a default augmentation pipeline, the training data increased approximately 11-fold. Therefore, the final augmented training set reached an estimated size of about 24,500 synthetic image variants. This expanded dataset significantly improved the models’ ability to generalize across sample types and imaging conditions.
From these images, specifically, metallographic images, we selected the ones required for each specific task based on the identified challenges. Then, we defined and explained the precise method carried out, along with the specific data concretely employed in our research.
2.1. Image Typology Classification to Identify Specific Workflow
The first challenge addressed in this work focuses on the classification of metallographic images. This kind of categorization is essential, as many of the subsequent analytical and processing operations depend on correct classification. The assigned class directly influences the selection of an appropriate processing pipeline with its specific analysis algorithms. Consequently, the classification stage serves as a critical decision-making layer, guiding the system toward specific procedures tailored to the features extracted from each image.
The image classification process is a well-established field, extensively documented in a broad range of scientific literature. For instance, Lu et al. [
24] provide a comprehensive overview of traditional and modern classification techniques, highlighting their applicability to diverse domains. In recent years, the emergence of DL has significantly enhanced classification performance, particularly through the use of lightweight and efficient neural network architectures. One notable example is MobileNetV3, which has demonstrated strong accuracy–efficiency trade-offs in various image classification tasks, as reported by Qian et al. [
25].
Image classification techniques have been applied across a variety of domains. In the context of social media, the growing ubiquity of user-generated content has caused studies on human behavior and user interaction patterns. For instance, Alam et al. [
26] use image classification for disaster response, enabling the rapid identification of relevant visual content during emergencies. In the medical field, DL-based image classification has proven effective in diagnostic support systems, as demonstrated by Song et al. [
27].
In addition, the industrial sector has also benefited significantly from the integration of AI in visual inspection and classification tasks. For example, Medus et al. [
28] applied hyperspectral image classification for quality control in food packaging processes. Similarly, Kazi et al. [
29] explored its use in analyzing the freshness of fruits, while Wu et al. [
30] demonstrated its effectiveness in detecting defects in manufactured components. These studies collectively highlight the versatility and impact of image classification.
In our research, specifically in the first challenge, we identified that the image classification tasks must focus on the following:
Identification of the material type. This classification allows the selection of appropriate analysis protocols tailored to the specific morphology of graphite (i.e., nodular, vermicular, or lamellar).
Detection of etching status. This classification task is generated to distinguish between etched and non-etched metallographic images, which significantly influences the type of image processing and segmentation techniques to be applied.
Assessment of usability of the image. It is possible to obtain and process a low-quality image that will not yield accurate results for the AI models. Therefore, this classification task ensures that only images of sufficient quality and clarity are used. In addition, the system will alert users that the calculated measurements could be distorted and their accuracy may not meet expectations.
Acceleration of the overall pipeline. By identifying the potential presence of specific events or features in the metallographic image, such as the existence of carbides, the system can make early decisions that optimize resource allocation and avoid unnecessary computation.
2.1.1. Identification of the Material Type
Before conducting any analysis on our metallographic images, it is essential to identify the type of graphite morphology present in the specimen. Depending on this classification, the appropriate analytical method for the specific image will be selected. As defined previously, there are three different types, that is, (i) nodular, (ii) lamellar, and (iii) vermicular. These three types of images can be seen in
Figure 2. Each type demands tailored quantitative techniques, as explained in [
31]. Although in our work we consider these three main types, for us, vermicular graphite is treated as a subtype of the nodular form due to similarities in processing and measurement procedures. The only difference is that vermicular ‘metallographies’ present lower nodularity values [
32].
In order to develop this classification task, we implemented and compared multiple artificial neural network (ANN) architectures. Specifically, two fully connected (dense) networks were designed—the first with three hidden layers, and the second with five. These models operate directly on flattened image features and serve as baselines due to their simplicity and interpretability. In addition, we implemented two deep convolutional neural networks (CNNs), that is, a ResNet18 and a VGG11. On one hand, ResNet18 is a residual network that utilizes skip connections to mitigate vanishing gradient issues and enable deeper learning without degradation in accuracy [
33]. On the other hand, VGG11 is a simpler but effective CNN architecture based on sequential 3 × 3 convolutions followed by ReLU (rectified linear unit) activations [
34] and pooling layers, originally designed for image classification in the ImageNet challenge [
35].
For both models, we employed the same dataset for the learning steps of all models. Accurately, the dataset consisted of 388 manually labeled images, distributed as follows: 205 lamellar, 74 vermicular, and 109 nodular.
In this small classification challenge, the evaluation was performed using standard metrics. Specifically, accuracy and categorical cross-entropy loss, which respectively measure classification correctness and prediction confidence. These metrics are widely used in image recognition tasks and provide a comprehensive assessment of model performance [
36].
2.1.2. Detection of Etching Status
As detailed in
Section 1, the preparation of metallographic samples depends on the specific objective of the analysis. This study considers two distinct types of specimens (
Figure 3 illustrates these two types of images). The first type comprises non-etched ones. These are polished samples where microstructural evaluation is conducted directly on the polished surface, without the application of chemical reagents. In this case, key morphological features, such as nodularity, graphite distribution, and element shape, are reviewed under optical microscopy. The second type involves etched specimens, in which a chemical etchant is applied to the surface in order to reveal internal microstructural characteristics. This process includes the identification of metallurgical phases (for instance, ferrite and perlite), grain boundaries, and potential segregation, which are essential for more detailed material characterization.
Regarding the distinct analytical procedures required for each image type, it is essential to accurately classify the images in order to apply the appropriate feature extraction methods. For that purpose, the classification task was carried out. The model learning phase was conducted by creating a subset of the previously described dataset (for more information, please see the description at the beginning of this section). Specifically, we used 1240 non-etched and 603 etched images. Then, for the classification between both types of specimens, we evaluated several DL learning architectures, as detailed below.
DenseNet121 [
37]. This is a deep CNN architecture known for its dense connections between layers. Instead of traditional CNNs, where each layer connects only to the next, DenseNet connects each layer to every other layer in a feed-forward manner. This architecture has demonstrated strong performance in medical image classification [
38].
InceptionV3 [
39]. This is a deep CNN architecture designed for image classification using Inception modules with factorized convolutions to reduce computational costs while maintaining accuracy. This type of network is widely applied in large-scale image classification tasks [
40].
MobileNetV2 [
41]. This is a lightweight network designed for efficient mobile and embedded vision applications, employing inverted residuals and linear bottlenecks. MobileNetV2 is effectively used in resource-constrained environments [
42].
ResNet50 [
33]. This is a CNN with 50 layers that uses skip connections to mitigate vanishing gradients, enabling the training of very deep networks. It has been successfully applied in numerous classification domains, including materials science imaging [
43].
With the aim of evaluating the performance of the applied classification models, this process focuses on distinguishing between etched and non-etched samples. For each category, the models were measured in terms of classification errors, confusion between classes, and prediction confidence.
In addition, to enhance the reliability of the classification outputs, a probability-based thresholding strategy was implemented. Specifically, predictions with a softmax confidence score below 85% were labeled as low confidence and treated as ambiguous. This threshold is motivated by prior research that emphasizes the degradation in classification reliability for predictions with confidence scores under this value [
44,
45].
2.1.3. Assessment of Image Usability
In metallographic analysis, the quality of the etching process is critical to the success of microstructural characterization. An etched specimen is considered "usable” when the chemical attack properly reveals the relevant structural features, enabling accurate visual interpretation. More accurately, the image must fulfill the following aspects:
Clear microstructural details: The etched surface must display distinct and discernible features such as grain boundaries, phases, inclusions, or precipitates, depending on the material and the purpose of the analysis.
Uniform etching: The etching should be consistent across the specimen without over-etched or under-etched areas.
Absence of artifacts: The surface should be free from scratches, smearing, or any preparation artifacts that may obscure the microstructure.
Reproducibility: The etching should be repeatable, producing consistent results in similar samples.
Contrast and clarity: The contrast between different phases or microstructural components must be sufficient for accurate interpretation under the microscope.
Since etching is a delicate procedure, if it is improperly conducted, it can compromise the usability of the gathered image. Some known issues, such as over-etching or under-etching, incorrect reagent concentration, or inadequate polishing, can obscure or distort the microstructure, rendering, in this case, the specimen as
“non-usable” (
Figure 4 illustrates the types of non-usable images). According to Vander Voort [
46], such defects, usually caused by poor preparation or contamination, can significantly affect the interpretability of metallographic images. In addition, Buehler [
47] emphasized that even slight surface deformation or residue can introduce artifacts that mask key features, especially under high magnification. For this reason, our methodology incorporates a verification step to assess the quality of etched images before proceeding with the final analysis of the image, helping ensure the robustness of downstream processes.
Again, in attempting to address the challenge of "usable” and "non-usable”, we created a subset from the overall image dataset used in this research, in which the images were manually labeled for this purpose. Specifically, the number of images extracted was 55 for the "usable” class and 16 for the "non-usable” class. As it was a small and imbalanced dataset for the learning phase of a machine learning (ML) classifier, we conducted a DA process, as previously defined in this section.
For this work, we designed a custom CNN architecture inspired by common lightweight CNN models [
48], which we refer to as
CNN98. The network consists of five convolutional blocks with batch normalization and ReLU activations [
34], each one followed by max-pooling layers to progressively reduce spatial dimensions while increasing feature abstraction. The output of convolutional layers is a feature map of 128 channels by 4 × 4 spatial dimensions, which are flattened and passed through three fully connected layers with dropout regularization to prevent overfitting. Then, the final output layer corresponds to the number of target classes, adapted here to our two categories after loading pre-trained weights. This architecture balances depth and complexity, enabling effective feature extraction while maintaining computational efficiency, similar to common approaches in image classification tasks [
35,
49]. Please note that the CNN model was tested using a percentage split (PS) of
.
In this specific case, the DA techniques developed included rotations by 90°, 180°, and 270°, as well as deterministic horizontal and vertical flips, expanding the effective size of the training dataset and enforcing rotational and reflectional invariance in the model.
The model evaluation for this “usable”/“non-usable” classification was primarily conducted using the following two key metrics: (i) loss and (ii) accuracy. Firstly, as explained before, the loss function quantifies how well the model fits the training data by penalizing incorrect predictions and guiding the optimization of the network’s weights. Secondly, accuracy represents the percentage of correct predictions made by the model on the validation or test dataset, reflecting its effectiveness in correctly classifying the images. These metrics all together provide a comprehensive assessment of the carried-out performance and the model’s general capability.
2.1.4. Acceleration of the Overall Pipeline
Several image processing tasks, such as carbide analysis and extraction, involve complex and computationally intensive work. To avoid unnecessary executions, a preliminary model is used to determine if the heavy computational process must be carried out. Hence, the more demanding segmentation pipeline runs only when there is sufficient evidence. Specifically, the aforementioned process is the one that focuses on carbide detection, extraction, and segmentation (this evaluation will be further explained in
Section 2.3.1).
For the detection step, each image is evaluated under three different conditions: raw RGB (red, green, and blue) channels, grayscale (8-bit), and binary thresholded versions. These variants allow us to check whether basic pre-processing improves classification performance. Following the approach used for etched/non-etched classification, we selected DenseNet121, InceptionV3, MobileNetV2, and ResNet50 as CNN possibilities for image classification.
The models were evaluated using standard metrics—specifically, accuracy and categorical cross-entropy—to capture both correctness and confidence. Images with a predicted probability below 80% were conservatively labeled as non-determinable, and carbide segmentation was, consequently, skipped. For this process, again, the confidence threshold is selected taking into account some research works, such as [
44,
45], where authors discuss that value. In addition, considering some previous developments carried out at our research center, experts in metallurgical analysis have also confirmed that the score is fully functional and sufficient to discriminate undesired images. After selecting the best-performing model, a detailed error analysis was performed, focusing on measuring false positives (i.e., incorrectly predicting carbide presence) and false negatives (i.e., missing existing carbides). These insights are essential for optimizing downstream computational efficiency.
2.2. Automated Feature Inference and Extraction from Non-Etched Metallographic Microstructures
The second challenge tackled in this study involves the reliable extraction of graphite nodules from non-etched metallographic images, which is a prerequisite for any automated analysis of ductile iron microstructures. The more accurate the nodule segmentation, the better the performance of later stages, such as morphological classification, dimensional measurement, and quality grading. In fact, mechanical properties strongly depend on nodule count, size, and shape; therefore, their accurate measurement allows for a more accurate interpretation.
When there is low contrast in non-etched samples, the segmentation process becomes more difficult. In response to this challenge, several authors have reported effective solutions. Lin et al. [
50] introduced a robust algorithm that outperforms classical thresholding, while Hidalgo et al. [
15] released open-source Python 3.11 code that detects nodules and calculates nodularity. Sarrionandia et al. [
7] combined pre-processing, segmentation, and classification in a single framework to reduce operator bias. Level-set techniques proposed by Rebouças et al. [
51] further improve boundary definition and geometric accuracy, and Jayashree et al. [
52] showed that carefully tuning the edge detection still yields reliable masks when guided by metallurgical expertise.
Once the nodules are segmented, they must be categorized by shape, size, and integrity to reflect solidification conditions and inoculation efficiency. Manual grading under ISO 945-1 (International Organization for Standardization) or ASTM A247 (American Society for Testing and Materials) is inconsistent, so ML alternatives have emerged. Di Cocco et al. [
53] trained support vector machines (SVMs) on circularity, roundness, and aspect ratio (AR) to meet ASTM criteria, whereas ANNs have predicted nodule size distributions and nodularity indices from similar descriptors [
52]. More recently, Friess et al. [
54] proposed a tiered taxonomy aligned with UNE-EN ISO 945-4 [
6], underscoring the need for harmonized standards in image-based graphite classification.
The third phase includes measuring a group of morphometric characteristics for every categorized nodule. These attributes are essential for evaluating nodular quality, determining nodularity indices, and analyzing the metallurgical background of the material. The key measurements are as follows:
Circularity, which is a classic standard in particle analysis and is widely used in the literature to characterize the shape of graphite nodules. According to UNE EN ISO 945-4 [
6], circularity is one of the accepted parameters for determining whether a nodule is spheroidal or not. In addition, it is used in multiple studies to discriminate between round and irregular particles [
50,
53].
AR is key to identifying elongated or deformed nodules, which have important implications for fatigue and fracture toughness. Although not all formal standards (such as ISO 945-4) include it directly, many industrial implementations and scientific publications consider it as a parameter to support roundness and circularity. Sarrionandia et al. [
7] use AR thresholds to enforce automatic sorting decisions. In addition, Lin et al. [
50] integrated AR as a key feature in CNNs applied to nodular castings.
Roundness indicates the degree of smoothness of the edges and the general regularity of the form. It is explicitly used in standards and technical literature to classify the shape of nodules. UNE EN ISO 945-4 [
6] defines ranges of roundness to classify morphologies; for instance, spheroidal nodules typically have a roundness ≥ 0.6. This is also widely used in scientific works, like in the previously cited Sarrioandia et al. [
7].
Feret’s diameter is a standard particle size measurement in image analysis and is used in standards such as ASTM A247 [
55] and ISO 945-1 [
4] to measure the diameter of nodules. Hidalgo et al. [
15] and Lin et al. [
50] used it to calculate the average size and size distribution of nodules.
Nodularity, which represents the percentage of spheroidal nodules, is one of the most critical parameters for the certification of nodular cast iron. This characteristic is crucial because the mechanical properties of ductile iron, such as tensile strength, ductility, and fatigue resistance, are highly dependent on the shape of the graphite inclusions. Spheroidal graphite causes less stress concentration compared to flake shapes or irregular shapes, resulting in improved performance. According to UNE EN ISO 16112 [
56], nodularity should be calculated on the basis of the proportion of particles meeting specific morphological criteria. It is a metric used in industry for quality control, and appears in most scientific papers on nodular graphite, such as those by Sarrionandia et al. [
7] and Friess et al. [
54].
The last phase of the pipeline implies the categorization of the microstructural quality. This task is frequently performed manually in every foundry. In this study, we develop a quality grading system that uses rule-based methods and ML assistance to incorporate all the morphometric data acquired in the earlier phase. Quality levels are determined based on combinations of average nodularity, the proportion of spheroidal vs. non-spheroidal nodules, the distribution of Feret’s diameter, and statistical variation in circularity and AR. According to Friess et al. [
54], the summarization of descriptors can be used to categorize classes like “high quality” (in other words, high nodularity and consistent size distribution), “medium quality” (accurately, moderate nodularity and presence of irregular particles), and “low quality” (that is, low nodularity and predominance of vermicular/irregular shapes) [
54]. This classification aligns with industry acceptance standards and supports decision-making for optimizing casting and certifying materials.
2.2.1. Nodule Extraction
Regarding work with graphite nodules, the first stage is their segmentation from the background matrix. As previously described, accurate segmentation is critical because several additional tasks depend on the results achieved in this key stage [
46]. This work was carried out employing non-etched microstructures. This selection was made because of the fact that the contrast between graphite and matrix is low in this type of image. Moreover, it is possible to outperform traditional thresholding and contour-based methods in materials science contexts by applying new DL and ML techniques [
57,
58].
In our case, we selected and adopted strategies to perform a fully automated nodule extraction work from non-etched images. Our method combines adaptive contrast enhancement, noise filtering, and contour-based segmentation, all calibrated through expert-validated masks and compliant with UNE EN ISO 945-1 [
4]. The goal is to ensure high precision in the detection of graphite nodules, even under suboptimal imaging conditions, and to provide reliable inputs for downstream classification and analysis. Later, several advanced methods are performed with the aim of improving the final classifications and measurements (all explained in further sections).
2.2.2. Classification of Nodules
Once the nodules are segmented, they must be classified. The designation of the microstructure is a valuable characteristic, providing a basis for classifying the shape, distribution, and size of graphite in castings. Graphite classification through visual analysis during the casting process is a common method for categorizing the graphite microstructure in castings using comparative visual analyses. The structure of the metallic matrix (e.g., ferrite, perlite) has a significant effect on the material’s properties.
Graphite can be classified as UNE EN ISO 945-1 [
4] and described by the following:
Its shape (numbers I to VI, shown in
Figure 5). The graphite size is determined by measuring the graphite and comparing it with the dimensions and reference numbers given in Table 1 of UNE EN ISO 945-2 [
5]. Types III, V, and VI will be considered in the study, and IV and V are considered together as type V.
Its distribution, uniform or clustered, represents the homogeneity with which it distributes the graphite throughout the metal matrix. It affects properties like thermal conductivity and wear resistance. A homogeneous distribution is essential to avoid stress concentrations.
Its size. It is classified according to standards (grades 1 to 8), where a lower grade indicates coarse graphite (specifically, gray cast iron with low strength), and a higher grade corresponds to fine graphite (in other words, superior mechanical properties).
For the purpose of this study, the classification of graphite will be carried out based on its shape, as described in criterion (a).
2.2.3. Extraction of Various Measurements
The third stage of nodule-related work focuses on quantifying the five key morphological descriptors. These descriptors are (i) circularity, (ii) roundness, (iii) AR, (iv) Feret’s diameter, and (v) nodularity. In this research work, we carried out the measurement extraction through two complementary strategies; firstly, applying classic CV methods, and, secondly, learning ML-based models.
On the one hand, when CV methods are employed, each image is converted to grayscale, binarized by thresholding, and then analyzed with contour detection. Contours that touch the image border or the pixel-to-length reference rectangle are discarded. In the same way, although it can be configured, regions smaller than 25 μm2 are also discarded. The main reason is that their size is not significant for the study.
On the other hand, using ML methods, every nodule mask is cropped and passes through a three-stage DL pipeline—two sequential VGG16 networks followed by a final custom-trained network. All the aforementioned models are tuned and optimized for our specific objective, thanks to the dataset previously explained.
More precisely, after finding the contours, a small image file is extracted for each contour. The specific image contains the rectangle that encloses the calculated contour. Then, the resulting image is processed in the ML pipeline for its classification. The pipeline was created to improve the classification accuracy between types III, V, and VI. The first model checks whether the extracted contour is type III or type V. If it is identified as type V, the second model is launched to verify whether it is type V or type VI. If the result indicates type VI, the third model is executed to determine whether it is type III or type VI. This last model is just to ensure the final classification, trying to avoid image misclassifications that escape the first detection.
After segmentation, it is necessary to extract features from each nodule. Hence, the contour measurements are evaluated by a rule-based model that assigns the final graphite morphology class in accordance with ISO 945-4 descriptors [
7,
60]. There are custom models developed for specific companies, each with its own parameterization based on ISO standards, that is, roundness (ISO and Company 2), circularity (Company 1 and Azterlan), and AR (Azterlan). Due to confidentiality, company names cannot be disclosed. They are referred to as Company 1 and Company 2. We based our approach on the Azterlan method due to its greater completeness and specificity.
The following parameters are computed during the metallographic analysis of nodular cast iron:
Circularity is calculated as follows:
where a value of 1.0 indicates a perfect circle. Between
and
, nodules are considered spheroidal. In other cases, when the circularity value approaches 0.0, it reflects an increasingly elongated or irregular shape. Note that circularity values may not be reliable for very small particles, where measurement noise or resolution limitations can significantly affect the accuracy [
6].
The AR is defined as the ratio of the major axis to the minor axis of the ellipse fitted to the particle. If the fit ellipse is selected, both the major and minor axes of the fitted ellipse will be displayed. A higher AR indicates a more elongated shape, while a value close to 1.0 suggests a shape closer to a circle [
6].
A roundness value of 1.0 indicates a perfect circle, while lower values reflect more elongated shapes. In particular, <0.3 is clearly vermicular, and <0.6 is irregular [
6].
Feret’s diameter:
where
and
are points on the boundary of the object.
Feret’s diameter, also known as the maximum caliper, is defined as the longest distance between any two points along the boundary of the selection. It represents the maximum projected length of the particle, regardless of orientation, and is commonly used in particle size analysis. It is used to characterize its size and shape. According to UNE EN ISO 945-1 [
4], 20–80 μm is the typical size of well-formed nodules. Higher or lower values may indicate nucleation problems or over-inoculation.
Nodularity:
where
is the number of nodules per unit area of the sample surface,
N is the total number of nodules counted,
A is the magnified area of the sample (in mm
2), and
F is the linear magnification factor.
The nodularity, also known as nodule count, refers to the proportion of graphite present in spheroidal (nodular) form relative to the total amount of graphite in the microstructure. It is usually expressed as a percentage and is calculated based on image analysis of the polished and etched sample. Higher nodularity values (for instance, typically above 90%) are associated with good-quality castings, while lower values indicate the presence of irregular or vermicular graphite, which degrade mechanical performance [
55,
56].
2.2.4. Quality Classification
The quality of metallography based on nodule types and their distribution in the area is essential, especially in cast iron analysis. It focuses on [
54]:
Nodule shape: Spheroidal (ideal for ductile iron) vs. irregular or vermicular (undesirable).
Nodule size: Uniform size indicates consistent processing, while varied sizes may indicate cooling inconsistencies. The size distribution impacts mechanical properties like tensile strength, elongation, and fatigue resistance.
Nodule count (nodularity): A high number of uniformly distributed nodules improves mechanical properties.
Distribution: Evenly distributed nodules prevent stress concentrations and improve the strength of the material.
Nodule integrity: Absence of defects like cracks or porosity within nodules.
Metallography from a high-quality metal reveals well-formed, uniformly sized, and evenly distributed nodules, indicating good metallurgical control. As briefly cited before, if nodularity is below a certain margin, 90% (this threshold value has been established by metallographic chemistry experts at Azterlan), the quality of the metallography is poor. Nevertheless, it is also needed to perform this calculation in an objective way. In our work, we propose to make this classification based on the distribution of the nodule sizes. In fact, the calculation is developed using the calculated nodule size distribution and its categorization into specific size ranges. These ranges, created under a division on the possible values of Feret’s diameter and measures in μm, are as follows:
In our research, different methods have been employed. The first one is based on a curve slope function computation, and the other uses ANN to make the final classification.
In Azterlan, metallurgical experts assess quality by analyzing the curve generated by the nodule size distribution in the specified ranges. The ideal curve exhibits the following characteristics:
High values on the left side: From 1 to 2, this indicates a large number of small nodules, reflecting good nodulization and consistent cooling:
Steep downward slope: From 3 to 4, a rapid decrease in frequency as the size of the nodule increases, showing that the larger nodules are minimized.
Linear and stable towards the end: From 5 to the end, the curve flattens, indicating that very large nodules are rare or absent.
For example, and taking into account the curve shown in
Figure 6, its shape suggests a well-controlled metallurgical process, where most of the nodules are small and well distributed, minimizing structural weaknesses and improving the mechanical properties of the material. However, if the histogram is totally directed to the higher ranges, the quality of the metal is going to be classified as the worst one.
The calculation was performed programmatically by analyzing the distribution and the slope of the curve between three intervals. An acceptance variation percentage (15%) is applied to each interval. The slope of each section is then analyzed to indicate the quality level, with steeper or flatter trends corresponding to different classifications.
The other solution involves using a multilayer perceptron (MLP) model. This model was trained on a dataset of 1072 records. In our case, each record contains the number of nodules per range based on their Feret diameter. It is a range divided into 12 parts, and the category (“very good”, “good”, “bad”, “regular”, and “very bad”) indicates the quality according to that distribution.
Apart from particle size, the spatial distribution across the area must also be considered to accurately assess quality. The particle distribution is analyzed by dividing the image into equal-sized subregions (or grids). Within each subregion, the number of particles is counted. The coefficient of variation is then calculated across all subregions to quantify the degree of uniformity in the spatial distribution. A lower coefficient indicates a more homogeneous distribution of particles, whereas a higher coefficient reflects clustering or irregular dispersion. Although this analysis is performed, it is not currently included in the overall quality assessment calculation.
2.3. Enhanced Feature Extraction from Chemically Etched Metallographic Specimens
Etched metallography uses chemical etchants to reveal the microstructure of the metal by highlighting grains, phases, and carbides, whose distribution provides insight into mechanical behavior and thermal history.
In optical micrographs, like in
Figure 7, ferrite appears as a bright region due to its low etching response and smooth morphology. In contrast, perlite appears in a mid-gray tone, with its characteristic lamellar pattern of alternating ferrite and cementite (
). Finally, carbides, particularly cementite, form the darkest regions owing to their high hardness and strong etch resistance. Their morphology varies with the alloy composition and thermal treatment, which are key indicators of wear resistance, toughness, and high-temperature stability [
61,
62].
Once again, accurate phase identification is crucial, as morphology directly influences key properties such as hardness, ductility, and fatigue resistance [
63]. AI-assisted CV tools make this analysis faster, more reproducible, and less prone to operator bias [
64,
65].
The next sections detail our approach; on the one hand, ferrite–perlite segmentation based on contrast and texture; on the other hand, carbide detection using dedicated localization and segmentation models.
2.3.1. Carbide Detection and Segmentation
Carbides are key secondary phases in many metallic alloys [
66], so they must be detected and measured consistently in metallographic images. Carbide segmentation refers to the isolation of carbide regions from the surrounding matrix (i.e., ferrite, austenite, or other phases). Quantifying the size, shape, distribution, and volume fraction of carbides is essential for understanding their impact on material performance.
However, the automated identification of carbides in metallographic images remains a challenging task due to the following factors [
67]:
Low contrast with matrix phases: In optical microscopy (OM) or SEM (scanning electron microscopy), carbides often share gray levels or backscatter intensity with martensite or bainite.
Irregular shapes and sizes: Carbides can appear as globular, lamellar, or network-like structures depending on heat treatment and alloy composition.
Overlapping or agglomerated structures: In some cases, carbides cluster together or overlap, leading to under-segmentation when using traditional image processing techniques.
Variability among alloys and imaging conditions: Differences in alloy chemistry and imaging parameters (resolution, magnification, illumination) introduce variability that hinders the generalization of rule-based systems.
With the aim of solving this challenge, a reliable identification approach must leverage the distinct visual properties of carbides in etched metallographic images. Carbides typically appear as the darkest regions due to their high resistance to chemical etching, which causes them to reflect minimal light under optical microscopy. Their morphology varies depending on the alloy composition and thermal history, but they consistently stand out against the brighter ferritic matrix. This contrast serves as the basis for their initial segmentation through thresholding methods.
In our work, we designed a hybrid pipeline for an accurate and efficient carbide detection task in metallographic images. Specifically, we combined object detection using YOLO (You Only Look Once) [
68] with a high-precision segmentation model like SAM (Segment Anything Model) [
69]). This pipeline is similar to the one that is presented in [
70]. This approach combines the speed of YOLO for object detection with the segmentation accuracy of SAM, providing a robust solution for automated carbide identification and characterization in metallurgical quality control workflows.
SAM is a powerful foundational model for image segmentation based on a Vision Transformer (ViT) architecture. SAM uses self-attention mechanisms to analyze spatial relationships and boundaries in the image, generating precise segmentation masks for the prompted regions. These masks often align very well with the actual boundaries of carbides, even in noisy or complex images.
Our identification and segmentation pipeline is described below:
Detection: YOLOv11 is used to rapidly localize potential carbide regions by generating bounding boxes around high-probability areas. Then, we apply a region extraction (RE). In other words, each detected bounding box is used to crop a region of interest (ROI) from the original image, isolating a carbide candidate.
Segmentation: The ROI and its bounding box are passed as prompts to the SAM model, which performs precise instance segmentation and returns a binary mask or polygonal contour outlining the carbide.
Post-processing: Finally, the resulting segmentation masks are converted into contours, which are then used to compute the black-and-white areas of each carbide. These areas correspond to the carbide core and surrounding matrix, respectively, as derived from the thresholded (binarized) image.
In this work, we used the YOLOv11n (nano variant) due to its efficiency and low computational footprint. The model was trained on a dataset comprising 600 images, which were manually labeled to ensure accurate annotations. While the nano variant offers fast inference and is a good choice for resource-constrained environments, its limited capacity results in moderate detection performance, particularly in scenarios requiring fine-grained localization, such as our case. Hence, given the uncertainty of the expected outcome, this version was chosen as our initial approach. Although the YOLO tutorial recommends starting with 300 epochs, it also suggests increasing the number to between 600 and 1200 to enhance performance. In addition, the tutorial notes that if overfitting occurs, the number of epochs should be reduced. Finally, it also indicates that—for evaluation purposes—the appropriate epoch value could be 200 [
71]. Therefore, since we are evaluating the feasibility of the method, we decided to use that number.
2.3.2. Ferrite/Perlite Analysis
Once carbide quantification is complete, the workflow proceeds to ferrite–perlite analysis. Phase discrimination relies on their distinct optical signatures, which differ in brightness, texture, and etching response [
72].
Ferrite
- -
Appearance: Light or bright areas in OM or SEM images. Low contrast compared to other phases. Morphology, smooth, featureless regions with no specific structure.
- -
Identification: Ferrite is the softest phase in iron and appears as the brightest area in etched samples because it is less affected by the etchant. It often forms the matrix in low-carbon irons.
Perlite
- -
Appearance: Intermediate gray tones in optical microscopy. Higher contrast than ferrite but lower than carbides. Morphology, lamellar (layered) structure consisting of alternating layers of ferrite and cementite ().
- -
Identification: Perlite appears as striped or banded regions due to its alternating ferrite–cementite layers. The spacing between the lamellae depends on the cooling rate. Finer lamellae indicate faster cooling.
In the current work, phase fractions are obtained by measuring dark (perlite) and bright (ferrite) areas in the etched micrograph. As graphite nodules and perlite share the same low gray level after etching, thresholding operations alone cannot separate them. We therefore subtract the graphite fraction (previously quantified in the corresponding non-etched image) from the total dark area. The remainder represents cementite, from which the perlite content is inferred.
Ferrite–perlite segmentation is performed by simple grayscale thresholding (see
Figure 8 where the process is shown). The 8-bit histogram shows two peaks separated by a valley, that is, dark (for perlite + graphite) and bright (ferrite). The threshold is set at the valley midpoint, and the image is binarized by assigning pixels below the threshold to the dark phase and those above the bright phase. This enables a reliable quantification of the total dark and bright areas, which are subsequently used to estimate phase fractions in the microstructure, after applying the nodule-correction step described earlier.
2.4. Functional Integration and User-Centric Interface for AI-Driven Metallographic Analysis
The many steps involved in classifying, segmenting, detecting, and measuring features in metallographic images require an orchestration layer that runs the whole pipeline in the right order and with the right parameters. Robust, reproducible, and meaningful results in an industrial setting demand a framework that is both intuitive and maintainable (an approach widely recommended in applied AI deployments [
73]).
To deal with this tool integration challenge, all processing stages were introduced and sorted into a unified software solution named HawkEye. This software is specifically designed to execute the entire analysis pipeline in a user-friendly and accessible way. This software encapsulates all previously described CV and ML methods, organizing them into a structured and automated workflow, as shown in
Figure 9. Each step in this pipeline needs the output of the previous one. This strategy enables a modular and interdependent execution plan that reflects the operational logic of metallographic analysis.
The system was designed using an object-oriented design paradigm. Each component, such as classifiers, feature extractors, or segmentation modules, is encapsulated within dedicated classes (see
Figure 10, where a small part of the software is presented as a UML (unified modeling language) class diagram), enabling clean abstraction, improved maintainability, and future extensibility. This modularity reflects current best practices in software engineering for scientific applications [
74], and allows developers to easily introduce updated models or alternative algorithms without altering the core architecture.
From a usability point of view, HawkEye has been designed with non-expert users in mind, particularly foundry technicians and quality control personnel who may not have training in ML. This user-centric design is consistent with recommendations in human–computer interaction research, where AI tools must balance complexity and interpretability to support informed decision-making without overwhelming the end-user [
75].
The software has been evaluated in comparison with both earlier standalone scripts and manual expert assessments. The software will be evaluated to measure if it is able to achieve high accuracy in non-etched nodular samples, particularly in nodularity assessment, quality classification, and particle detection. In addition, the behavior of the software is evaluated for etched images regarding topics as ferrite, perlite, and carbide percentages. This part was done with an expert-level judgment strategy due to the difficulty of fully automating it.
3. Results
After completing the research workflow described in
Section 2 and solving the defined technical challenges, this section presents the resulting outcomes. Each challenge is discussed in detail in its corresponding subsection. Overall, the four challenges have been successfully resolved, demonstrating the effectiveness and validity of the proposed methodology being integrated into a software system.
3.1. Image Analysis for Classification Challenge
This subsection presents the results related to the classification tasks described previously in
Section 2.1. The main goal is to evaluate the performance of the different models developed to, first, determine the type of material; then, detect whether the image has been chemically etched; next, assess the suitability of the etched image for further analysis; and finally, identify the presence of carbides
3.1.1. Identification of the Material Type
As previously explained, the identification of graphite morphology in cast iron is a critical step in the metallographic analysis, as it determines the subsequent tasks to be performed. In this section, we present the performance of several ML models applied to classify graphite structures into nodular, lamellar, or vermicular types using microstructural images. The results demonstrate the effectiveness of the proposed image analysis approach, which combines CV and ML techniques.
The achieved results demonstrate that the proposed approach effectively processes microstructural images to extract relevant features for accurate material classification. In our case, the simple dense ANN, composed solely of fully connected layers, showed strong performance. With a three-layer configuration, it achieved an accuracy close to 95% and a loss of 0.22. Increasing the depth to five dense layers, the performance was improved. This model achieved the highest accuracy in our experiment, approximately 97%, with a minimal loss of 0.08, demonstrating the benefit of adding depth to the architecture for improved feature learning.
On the other hand, the VGG11 model, a CNN architecture with 11 layers and small 3 × 3 convolutions, also performed well, obtaining an accuracy of 96.12% and a low loss of 0.12. This validates the effectiveness of convolutional layers for extracting spatial patterns in microstructural textures. In contrast, the ResNet18 architecture, despite its popularity for DL tasks, performed the lowest among the tested models.
A summary of the results is presented in
Table 1, showing that simpler architectures with careful design outperform deeper models for this specific application.
3.1.2. Detection of Etching Status
Regarding this second task in the image classification challenge, determining whether a metallographic image has undergone chemical etching is necessary. The main reason is that when the image is an etched metallographic sample, the features to be extracted are completely different from those in non-etched images. Thus, in the defined workflow, this detection step is required to determine the subsequent tasks to run.
In our work, although all tested models reached perfect classification accuracy (100%), their internal confidence levels and prediction consistency varied between them. This fact is especially relevant in practical deployment. A detailed comparative analysis reveals that MobileNetV2 not only achieved perfect accuracy but also exhibited the lowest loss (0.002) and zero false negatives in the etched class. Furthermore, it produced only 18 low-confidence predictions (i.e., probabilities below 85%), making it the most balanced and reliable model for this task.
In contrast, ResNet50, despite also achieving 100% accuracy, showed the highest number of low-confidence predictions, that is, 41 images with less than 85% confidence, and a greater number of misclassifications within each class. Its elevated loss, specifically 0.02, suggests lower model certainty. These results possibly reflect overfitting or suboptimal feature extraction in this binary classification setting.
Similarly, InceptionV3 produced a moderate number of misclassifications and low-confidence outputs, only 35, despite its high nominal accuracy. These borderline predictions imply weaker confidence calibration and reduced reliability in deployment scenarios.
Finally, DenseNet121 offered a competitive performance, particularly in identifying etched samples with zero errors in that class and only 28 low-confidence predictions overall. Its low loss (0.004) and stable behavior make it a strong alternative.
Given these insights, MobileNetV2 was selected as the preferred model due to its robust classification confidence, minimal prediction ambiguity, and overall consistency. A summary of the performance and evaluation results for all models is presented in
Table 2.
3.1.3. Assessment of Image Usability
Chemical etching, which is necessary to reveal certain microstructural features, can sometimes degrade image quality to the point of transforming the sample into an unusable image for quantitative analysis. To avoid this limitation, a model was developed to automatically determine the usability grade of etched images before further processing, thereby minimizing analysis errors and unnecessary computation.
The classification of the usability of etched metallographic images was tested by training a five-layer CNN, referred to as “CNN98”. The model achieved an accuracy of 97.65% and a loss of 0.07. These results confirm that the model achieves a strong performance discriminating between images that are suitable or unsuitable for further metallographic analysis.
Despite the high accuracy, the relatively small dataset limits the ability of the model to be more general and manage unseen images. Therefore, future work should focus on expanding the training set to improve robustness and prevent potential overfitting. Accurately,
Figure 11 shows the loss and accuracy curves across training epochs. The “Loss vs. Epochs” plot indicates effective learning, with a clear downward trend suggesting successful minimization of the error function. The “Accuracy vs. Epochs” plot demonstrates consistent improvement in both training and validation accuracy, indicating that the model not only learns from the data but also generalizes reasonably well to new examples.
3.1.4. Acceleration of the Overall Pipeline
In metallographic analysis, as explained before, certain operations, such as carbide detection and segmentation, are computationally intensive and time-consuming. Executing these tasks when it is not needed, particularly when carbides are absent, can result in unnecessary resource consumption. To mitigate this inefficiency, a lightweight classification model was developed and tested to avoid consumption when there is an absence of carbides. This enables the pipeline to bypass heavy segmentation and analysis steps when they are not required, optimizing computational efficiency without compromising result quality.
The classification models were tested across three types of image inputs, as follows: raw (RGB), grayscale, and thresholded. Interestingly, thresholded images obtained slightly higher accuracy for all architectures. This is likely because thresholding improves contrast, making feature extraction easier. Nevertheless, the marginal gain did not justify the pre-processing cost for achieving a thresholded image. Consequently, raw images were selected as the standard input to preserve speed and avoid extra computation.
The detailed results are shown in
Table 3, while
Table 4 breaks down model confidence and prediction errors on raw image data only. Although DenseNet121 does not achieve the highest accuracy, its low error rate, low number of low-confidence predictions, and other factors, make it the most practical and balanced model for real-time integration into the pipeline.
Explaining the results in more detail, among the evaluated models, DenseNet121 consistently demonstrated the most balanced and robust performance across all image types. It achieved its highest accuracy of 97% when using thresholded images. Nevertheless, the difference in performance with raw images was minimal (95% accuracy and 0.04 loss). Combined with its low number of low-confidence predictions (only 30 instances below 80% confidence) and minimal error rate (18 misclassifications on carbide-positive samples, none on negative), this justified its selection for integration in the real-time pipeline.
ResNet50 performed well, reaching a 97% accuracy and the lowest loss (0.03) when working with thresholded images. In contrast, its performance on raw data revealed a substantial number of low-confidence predictions (108 below 80%), and an extremely unbalanced error distribution, misclassifying all 489 carbide-negative samples. This indicates a potential issue that may compromise its reliability for confident decision-making in practical applications.
MobileNetV2 also achieved good overall results. Nonetheless, when evaluated on raw images, the accuracy dropped to 89% with an increase in misclassifications (56 errors in the carbide class) and a moderate number of low-confidence predictions (32 below 80%). These findings suggest that while MobileNetV2 is competitive, its robustness and confidence on unprocessed images are inferior to those of the DenseNet121 model.
Finally, InceptionV3 presented the weakest results among all tested architectures. With an accuracy remaining around 82% and loss values between 0.07 and 0.08. Furthermore, it produced a large number of low-confidence predictions (152 for raw images) and demonstrated a high misclassification rate (108 errors in the carbide-positive class). These results imply a poor alignment between the InceptionV3 architecture and the specific characteristics of the dataset, limiting its effectiveness for this task.
Taking into account all these observations, this reinforces the decision to adopt DenseNet121 with raw images for operational deployment. This combination delivers reliable accuracy and confidence while maintaining low computational overhead, thereby ensuring both efficiency and robustness in our pipeline execution.
3.2. Feature Inference and Extraction from Non-Etched Metallographic Microstructures
3.2.1. Nodule Extraction
The extraction of nodules from metallographic images is a fundamental step in the comprehensive characterization of nodular cast iron. Accurate identification and segmentation of individual nodules are crucial for further morphological feature extraction and overall quality assessment. In this research work, a CV pipeline was implemented for nodule extraction. The process incorporates several pre-processing steps, including noise reduction, contrast enhancement, and adaptive thresholding, followed by segmentation algorithms specifically designed to delineate nodules within complex microstructural backgrounds. This approach was validated on a representative dataset of metallographic images, demonstrating high accuracy in nodule detection.
Among the challenges encountered, the merging of closely spaced nodules proved to be the primary source of segmentation errors, alongside variability in image quality and the presence of artifacts. In order to avoid these issues, the segmentation parameters were carefully tuned to reduce both false positives and false negatives, achieving an overall detection accuracy exceeding 98%. Nodules below a certain size threshold were excluded from the analysis, based on expert criteria, to eliminate noise and irrelevant particles.
An illustrative example of the nodule extraction results is provided in
Figure 12, showing the effectiveness of the segmentation pipeline in isolating individual nodules despite the presence of adjacent particles and other inconsistencies.
3.2.2. Classification of Nodules
The classification of graphite nodules is essential for evaluating the mechanical properties and overall quality of nodular cast iron. Solid classifications facilitate process control and performance prediction. Specifically, this classification traditionally relies on manual assessment by metallography experts, which can be subjective and time-consuming. In contrast, trying to make this process easier, Sarrionandia et al. [
7] proposed an automated classification framework based on CV and ML, which standardizes and accelerates the process. The method extracts key morphological features such as roundness, circularity, and AR from segmented nodules, which are used to distinguish between types (e.g., Type III, V, VI). Specifically, we included in our research the same calculation method that was explained in that paper.
Table 5 summarizes the classification performance on a dataset of 4608 nodules, showing the counts and error percentages for both CV and ML approaches.
The CV method achieves an overall error rate of approximately 1%, demonstrating strong reliability in morphological classification. The ML method, while slightly less accurate (2.5% error), shows a promising way of working for handling larger datasets and learning more complex classification boundaries.
3.2.3. Extraction of Various Measurements
Correct extraction of dimensional and morphological measurements from metallographic images is complementary to the continuous characterization of nodular cast iron. These measurements, including nodule size, shape descriptors (for instance, roundness and circularity), and spatial distribution, provide essential inputs for quality assessment and process control.
The methodology described by Sarrionandia et al. [
7] is also applied to feature extraction from the segmented nodules. Their approach includes preprocessing steps such as noise reduction, contrast enhancement, and adaptive thresholding to ensure robust segmentation under varying image conditions. From the segmented nodules, key morphological features are computed as explained in the aforementioned paper.
The results reported in [
7] demonstrate high accuracy in feature extraction, with mean absolute errors close to 1% when compared against expert manual measurements. For instance, the extracted nodule counts and size distributions showed a strong correlation with expert annotations, validating the reliability of the automated approach.
Table 6 summarizes the accuracy metrics for the main features, evidencing that shape descriptors such as roundness and circularity provide effective differentiation of nodule types, which is critical for subsequent classification.
3.2.4. Classification of Quality
Prior to [
7], quality evaluations were performed by a metallography expert. Then, they were refined using computational techniques that combine CV and ML. Specifically, thanks to the curve analysis, which is a method that employs the slope of characteristic curves derived from morphological features, samples were classified into quality category ranges (see
Section 2.3 for more information).
Table 7 illustrates the classification results obtained by both the curve analysis method and the ML approach, alongside the corresponding error percentages relative to expert evaluations. The data reveal that the curve analysis method achieves an error rate of approximately 1% for the “very good” and “good” categories, indicating a high degree of concordance with expert assessments in these top-tier classifications. Notably, for the “regular”, “bad,” and “very bad” categories, the curve method exhibits perfect agreement with expert classification, with zero error reported.
In contrast, the ML method shows slightly higher error percentages in the upper quality classes, that is, 4.2% for “very good” and 3.7% for “good”, suggesting that while machine learning captures broader classification trends effectively, it is somewhat less precise near category boundaries. However, for the middle- and lower-quality classes, ML performance is comparable to that of the curve-based method.
This result indicates that the curve analysis method provides a robust and interpretable tool for quality classification. The ML approach, despite its obtained accuracy, may benefit from further training or feature engineering to reduce misclassifications in the higher-quality range. Importantly, both methods maintain high fidelity in identifying lower-quality samples, where microstructural deviations are typically more pronounced.
3.3. Feature Extraction from Chemically Etched Metallographic Specimens
As explained in
Section 2.3, the specific tasks researchers face in this challenge for etched metallographic images are, first, the extraction of features related to ferrite and perlite measurements and, subsequently, the detection and evaluation of carbides.
3.3.1. Ferrite/Perlite Evaluation
The selected method for extracting ferrite and perlite values from an etched metallography is totally based on classical CV techniques. As detailed in
Section 2.3, the process begins by converting the original images to grayscale using an 8-bit color transformation. Then, the images are binarized by applying a thresholding operation, where the threshold value is defined and extracted as the midpoint between the main peaks in the grayscale histogram. This approach, similar to that used in software tools like ImageJ [
8], yields comparable levels of precision, as shown in
Figure 13.
During this research, a manual analysis of the images showed that the variation in threshold values between our calculation and the given value by the ImageJ method only fluctuates within the range of
units (see
Figure 14). According to metallurgical experts from our research center, these kinds of variations are not considered significant due to their negligible effect on the black-and-white segmentation of the binarized image. Consequently, the computed area percentages of ferrite and perlite present a deviation of no more than 2–3%, supporting the reliability of the proposed methodology.
Nevertheless, it is important to note that some of the black values that are extracted from the image come from the nodules of the image. Hence, trying to adjust it, the average value of the nodules extracted from non-etched metallographic images of the same specimen is employed as a correction factor. This method introduces fluctuations. Although these fluctuations remain within acceptable limits, they may affect the consistency of the achieved results. This issue is already known by the researchers, but its resolution lies beyond the scope of this work.
3.3.2. Carbide Detection and Segmentation
Then, to avoid potential issues in the final castings, it is time to focus on carbide detection and its measurement. As explained in
Section 1, carbides are hard, brittle compounds typically formed by carbon combining with metals during solidification. Their uncontrolled presence can severely compromise the mechanical properties and machinability of the final component. Thus, it is very important to detect and locate carbides, as well as to measure their presence, specifically, the relative percentage of carbides in relation to the full image size.
Due to the computational complexity of the image analysis process for carbide extraction, we aimed to avoid unnecessary calculations by using the classification model previously explained in
Section 2.1 and evaluated in
Section 3.1. Notwithstanding, if the possibility of carbide apparition is feasible, the detection and segmentation models are launched. In this way, the current section also presents the outcomes of training the YOLOv11 model for carbide detection on the evaluated dataset. The dataset, with the augmentation process defined in
Section 2.3 was used.
Figure 15 provides an example of how those images were employed during the training and testing phase of the algorithm.
To measure the performance of the trained model and its ability to accurately detect and classify the objects, both performance metrics and training losses were analyzed. The evaluation includes an analysis of training and validation behaviors across key indicators such as precision, recall, and mean average precision (mAP) at different intersection over union (IoU) thresholds. Additionally, the classification, localization, and distribution focal losses were reviewed to gauge learning stability and model generalization on unseen data (see all data plotted in
Figure 16).
Specifically, the model achieved a precision of 0.453, which indicates a moderate performance with a reduced number of false positives. However, the recall was relatively low at 0.384, meaning the model is still missing a significant number of true objects in the images. The mAP at IoU 0.5 (mAP@0.5) reached 0.372 (close to acceptable values), although it clearly indicates room for improvement. On the other hand, the mAP across IoU thresholds from 0.5 to 0.95 (mAP@0.5:0.95) was only 0.142, suggesting that the model struggles with precise localization and consistent bounding box quality. The low recall, below 0.4, further emphasizes the presence of undetected objects.
Figure 17 illustrates example results from carbide detection, where it is evident that several carbides remain undetected.
After the detection process, and with the aim of refining the carbide detection results, we applied SAM to the bounding boxes initially extracted by our YOLOv11 detector. As we described previously, while YOLO provides approximate object localization through rectangular regions, SAM enables high-precision pixel-level segmentation. Therefore, the accuracy of the segmentation process is not solely dependent on the quality of the mask extracted by SAM, but rather on the recall or precision of the bounding boxes. Even though SAM provides highly accurate pixel-level segmentation within given regions, it relies entirely on the bounding boxes proposed by the YOLO detector. Therefore, if YOLO fails to detect the region of interest, SAM cannot segment it. Nevertheless, the method is promising, as shown in
Figure 18.
3.4. Functional Integration
Taking into account the complexity of the workflow defined and explained in the Materials and Methods section—which involves several DL classifiers, CV-based feature extractors, and other elements for image detection and segmentation—the subjective approach to metallographic image analysis is not easily accessible to the average foundry user. Thus, one of the identified challenges involves the integration of all these tools into a disruptive system that consolidates their operations. This system, called HawkEye (in
Figure 19), is a specific software for objective nodular metallography analysis supported by our designed AI-driven pipeline.
After executing the workflow on the images loaded into the HawkEye software, information regarding the type of metallography, quality assessment, and the distribution and typology of particles is displayed. An image of the detected particles, color-coded by type, is also shown, along with a list of the particles and their properties (see
Figure 20).
The output generated by the system is considered suitable for formal reporting purposes. Every report must list the following: sample ID and extraction location; the number of samples and areas evaluated; graphite morphology, distribution, and size; magnification level; relevant applicable standard; report date; responsible organization; and the name and signature of the author.
If required, the report may also include additional details, such as the graphite nodule count; material designation; details of the metallographic preparation procedure; dimensions of the extracted sample or the wall thickness in cases where the sample is taken from a casting; and an additional graphite size assessment where applicable.
Similarly, as the system is also configured to analyze etched metallographic samples, it is fully capable of processing and interpreting this type of image.
Figure 21 illustrates the analysis of an etched microstructure, where the segmentation and quantification of ferrite, perlite, and carbide are visualized. As with the previous non-etched samples, the corresponding information can be automatically compiled into a standardized report format, ensuring consistency in documentation and full traceability across evaluations.
An additional feature of the system is its ability to log all historical data, store it in a dedicated database, and correlate these analytical results with other variables from the production process. This functionality enables the creation of high-value datasets suitable for machine learning and artificial intelligence models, while also supporting the enrichment of digital material passports with detailed microstructural information and the related metadata.
Once all AI- and VC-based tools were integrated into our pipeline and the HawkEye software was created, we proceeded to evaluate its performance. Specifically, we compared it with other initial scripts developed by Azterlan researchers, as well as manual categorizations and classifications performed by metallography experts. Hence, we can conclude the following.
The software demonstrates a good level of accuracy in the analysis of metallographic images, particularly in identifying globular structures and homogeneous phases such as ferrite. However, there are notable discrepancies when analyzing more complex microstructural features.
In non-etched (nodular) images, the deviation is minimal, with 0% deviation in nodularity, 1% in nodule-type identification for the CV method, 5% in ML, 4% in quality assessment in ML, and 1% in the curve-based analysis, indicating a high degree of reliability in basic morphological classification.
In contrast, for etched images, deviations increase significantly, as follows: 15% for carbides, 5% for ferrite, and 10% for perlite. This suggests that the software has limitations in distinguishing fine structural details where visual context and subtle contrast differences play a key role—aspects that an expert evaluator can interpret more accurately. It should be noted that nodules, which remain unidentified in etched images, are often mistaken for perlite due to their similar dark appearance, further contributing to the deviation in phase quantification. To compensate for this issue, the nodule area from the previously analyzed image of the same sample is taken into account.
These findings highlight the importance of combining automated image analysis with expert validation, especially in complex microstructures, to ensure accurate and reliable metallurgical characterization.
4. Discussion and Conclusions
This research work presents HawkEye, an integrated software system for the automatic metallographic analysis of nodular cast iron. The tool enables full automation of the characterization process by combining CV and ML techniques in a user-oriented interface. The pipeline begins with the classification of image typology—determining the material type, etching status, and usability. These classifications allow us to start with the selection of the appropriate workflow. Prior to processing, various models evaluate the image confidence to predict the efficacy of the outcomes. This proactive assessment significantly enhances the trustworthiness of the results.
We compare HawkEye’s performance with ImageJ, which utilizes a macro developed by Azterlan technicians for particle identification. Due to differences in the threshold value (a discrepancy of 0 to 10 units), particles may exhibit minor variations in size and shape. This can lead to differing classifications between the two systems. When the same threshold value is used, the differences between the systems evidently disappear.
Figure 22 illustrates these discrepancies, highlighted by red arrows. Furthermore, the handling of particles touching the image border also affects the results. The HawkEye system discards particles that touch the image border, and it also excludes particles touching the scale bar, a feature not present in ImageJ. These differences in particle exclusion criteria contribute to the observed variations between the two analytical approaches.
For non-etched samples, graphite nodules are automatically segmented, classified according to standard graphite types, and measured for key morphological descriptors such as size, circularity, and spatial distribution. Later, the quality classification, previously performed manually, has been refined using a slope-based curve analysis and supervised ML models. The comparative results presented in this research work demonstrate strong alignment with expert judgment, with an error margin of only 1–4% in the worst cases. This confirms the consistency and reliability of the approach.
Nonetheless, there are still several challenges and limitations to manage. One of the most relevant issues arises during the segmentation of graphite nodules, particularly when nodules are in contact. In such cases, nodules of type V or VI can be misclassified as type III due to their merged contours and reduced circularity. As shown in
Figure 23, these misclassifications compromise both morphological analysis and final quality grading.
In order to solve this problem, segmentation refinement is required. A proposed solution involves the use of watershed-based segmentation, which has been shown to be effective in separating overlapping objects by identifying contours [
51]. However, the watershed method can lead to over-segmentation, particularly in cases with noise or irregular shapes. As an alternative, the concave point algorithm [
76] has been identified as a more geometry-preserving method. Detecting inward curvatures on the particle boundary enables targeted separation without significantly altering the original object shape. This technique helps preserve critical descriptors like roundness and area, avoiding artifacts introduced by over-segmentation.
Before applying these corrections, it is necessary to identify whether a detected object corresponds to a single or a fused nodule. This is possible by analyzing Hu moments, which provide shape descriptors invariant to rotation, scale, and translation. As proposed in [
77], deviations from the expected Hu moment signature of an isolated spheroidal nodule can illustrate the presence of merged particles. Comparing these descriptors with reference patterns of type V or VI nodules enables selective application of segmentation techniques, improving classification accuracy without unnecessary computational overhead.
Regarding the use of YOLOv11 for chemically etched sample analysis and with the final objective of detecting and quantifying carbides, we employed the YOLOv11-nano variant, trained for 200 epochs, as a proof of concept to evaluate the feasibility and gain preliminary insights under limited computational resources. Carbide segmentation is particularly more complex than the other tasks performed in this research due to the variability in morphology and contrast, as well as spectral similarity with adjacent microstructural phases. Although the model did not fully converge within these 200 epochs, as evidenced in
Section 3.3.2 and shown in
Figure 16, the overall training dynamics and detection performance were promising. This suggests that the chosen training duration provides a reasonable balance between computational cost and model learning. In addition, the observed volatility in validation loss also reflects limitations in dataset size and complexity, although the DA process has been developed.
In this way, and considering these encouraging results, further work must involve the development of a larger training phase for our YOLOv11. Firstly, the number of images can be improved by extracting more information from new reports generated by the specific department of our research center. Moreover, the performance of the detection task must also be enhanced when other variants are employed (for instance, YOLOv11 small or base) and the number of epochs is extended (creating the new experiment using 300 or 500). Similarly, the new research work must incorporate the newest YOLO version, YOLOv12, which introduces architectural innovations and refined segmentation heads. All these changes in the carbide detection model generation must improve the convergence, robustness, and detection accuracy of this method.
In addition, the inclusion of EfficientNetV2-S is proposed to retrain the classification components of the system. As shown in [
78], EfficientNetV2 offers an improvement in learning efficiency and accuracy for microscopy particle analysis. Its integration into HawkEye would benefit both the graphite classification and the analysis of the matrix structure.
Another feasible improvement involves quality classification and grading, where the coefficient of variation of particle spatial distribution is already computed but has not yet been integrated into the final classification logic. Including this parameter would contribute to a more comprehensive quality evaluation by accounting for the uniformity of particle dispersion, which is known to affect mechanical performance and failure modes. This enhancement aligns with the objectives of this study and should be prioritized in future research.
To ensure trustworthiness in systems like HawkEye, it will be crucial to implement provisions for a manual override capability. While automated processes and confidence scores offer significant efficiency and accuracy, there will always be situations where human intervention is necessary. This capability allows operators to review, adjust, or even completely disregard automated decisions based on their expertise, contextual understanding, or external information not available to the system. The ability to manually override the system’s output acts as a critical safeguard, enhancing the overall reliability and accountability of the system by placing the ultimate decision-making power in the hands of a human operator when required.
In conclusion, HawkEye offers a reliable, efficient, and objective framework for the metallographic analysis of nodular cast iron. It automates complex tasks that traditionally require expert intervention, minimizing human variability and significantly improving reproducibility. Its modular architecture supports the integration of advanced models and segmentation techniques. With future improvements, HawkEye will become a scalable solution for high-throughput, real-time metallographic quality control in industrial environments.


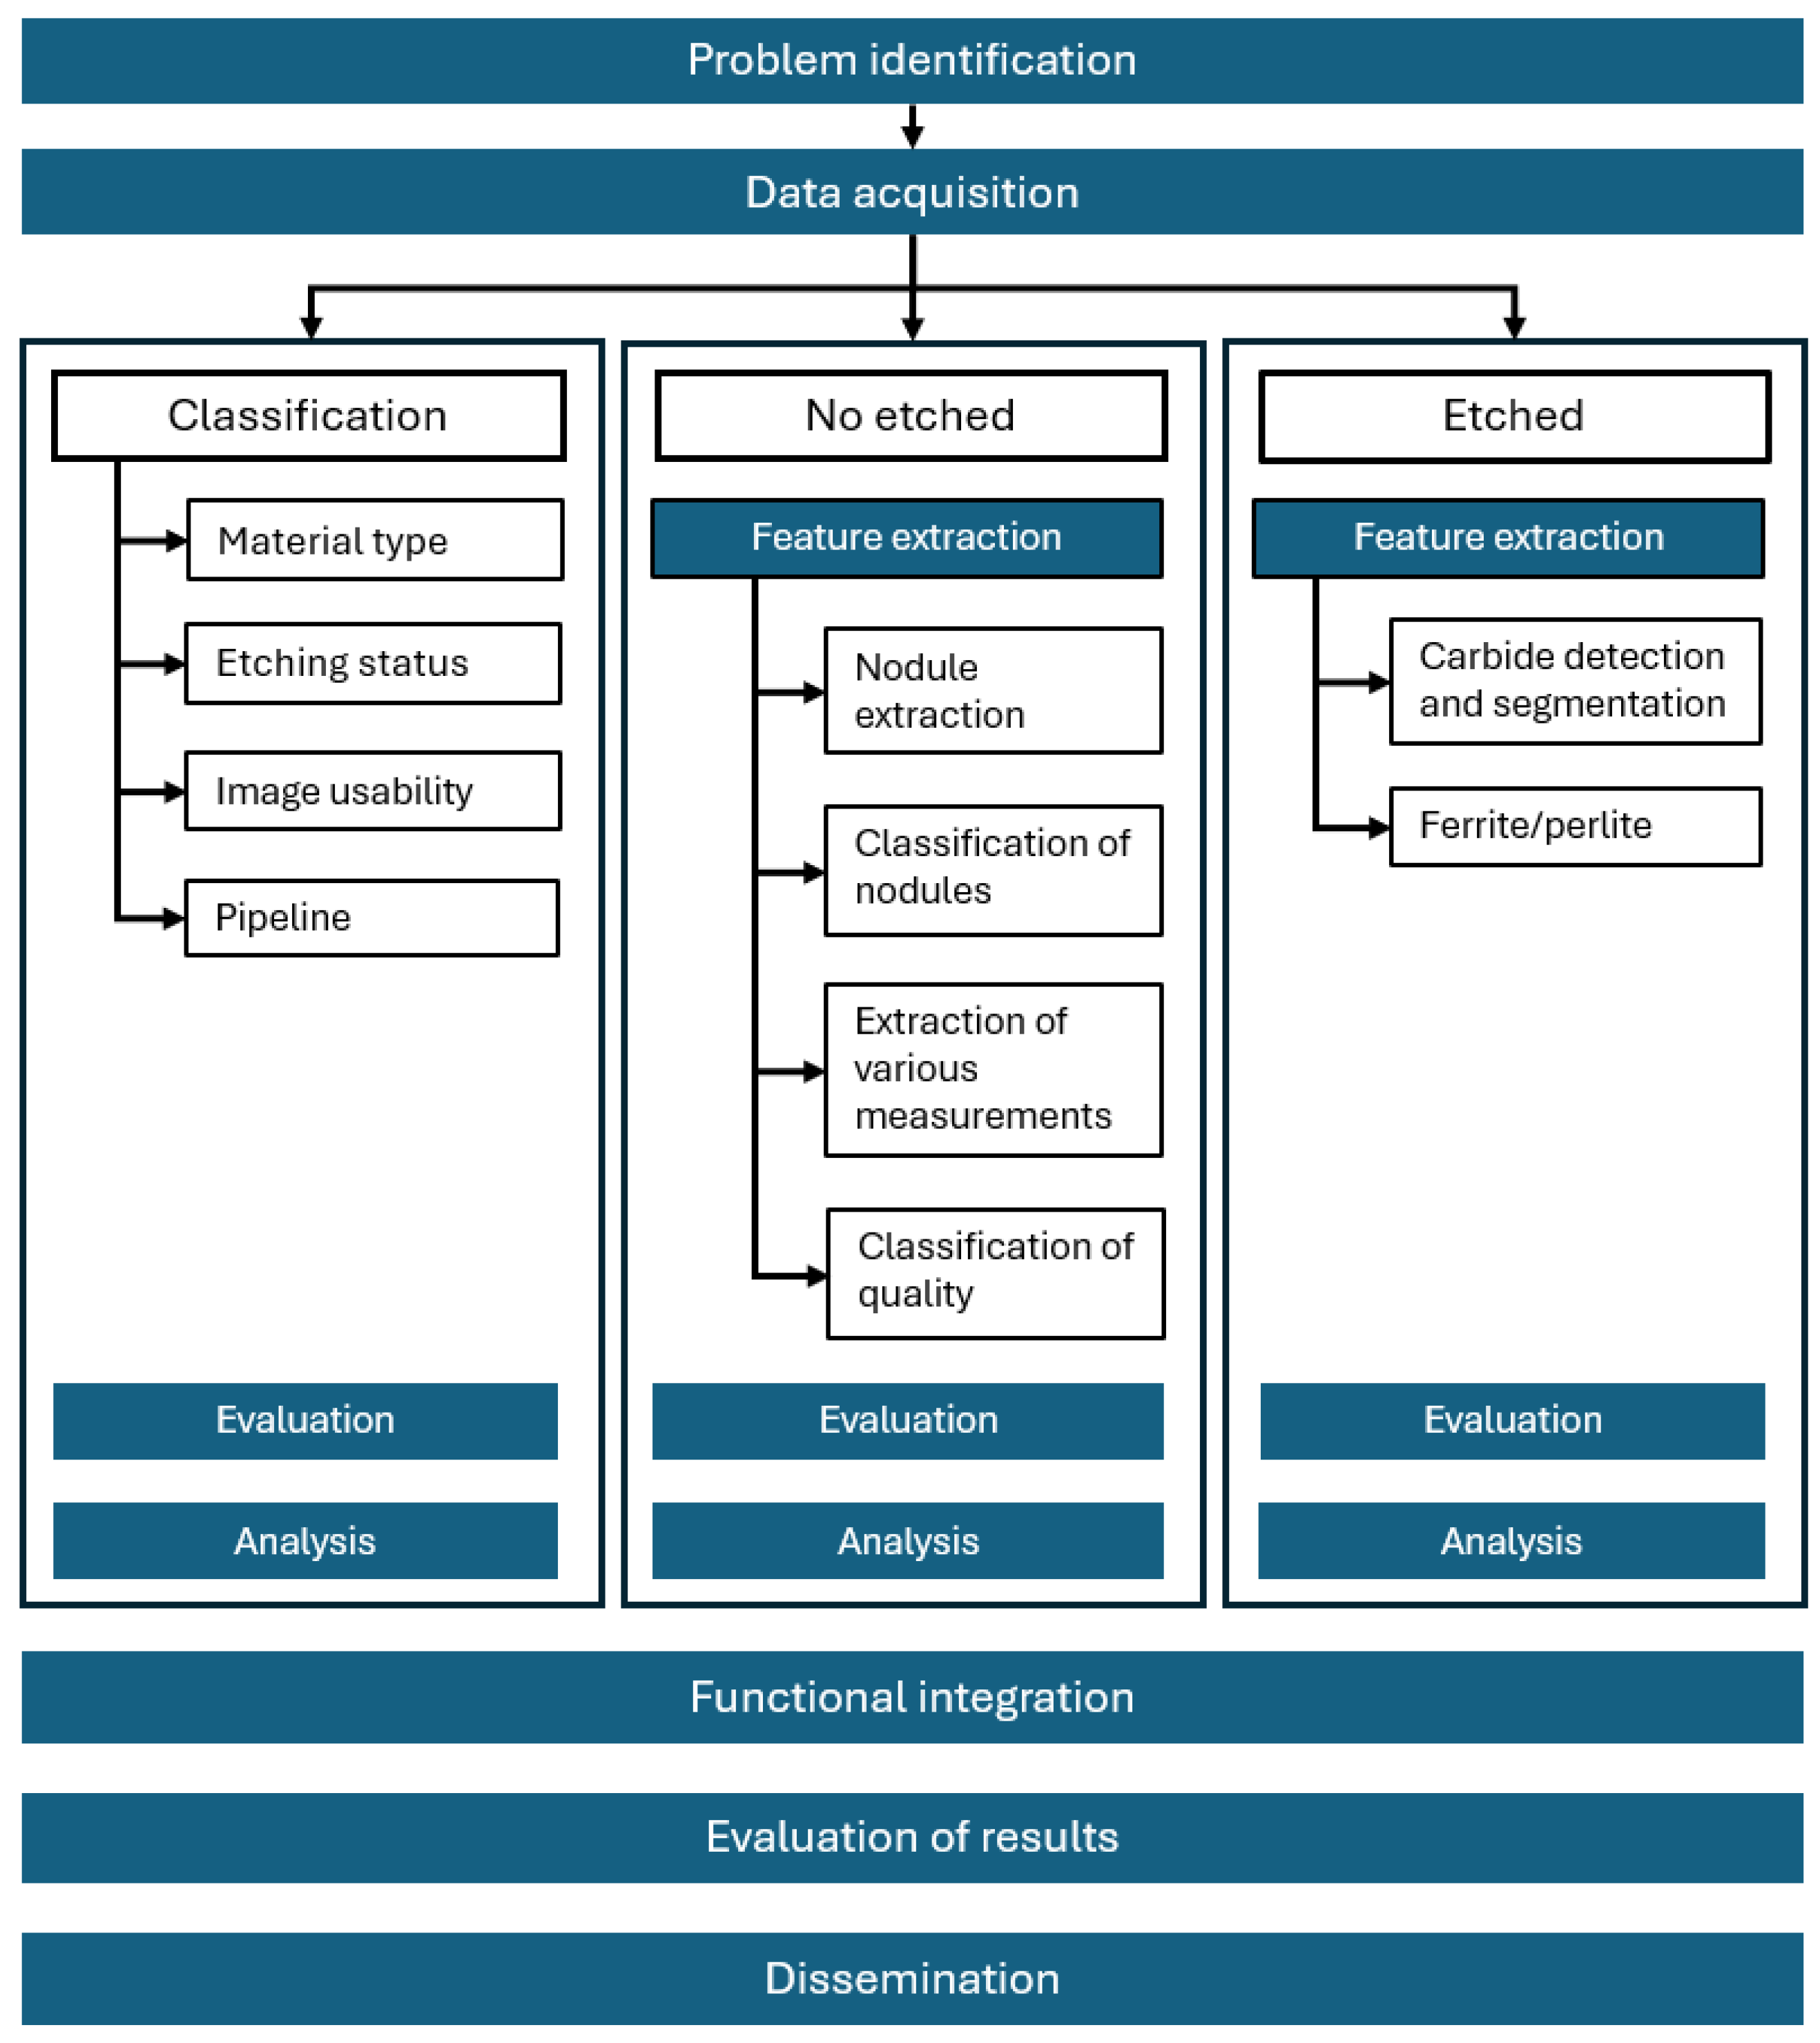
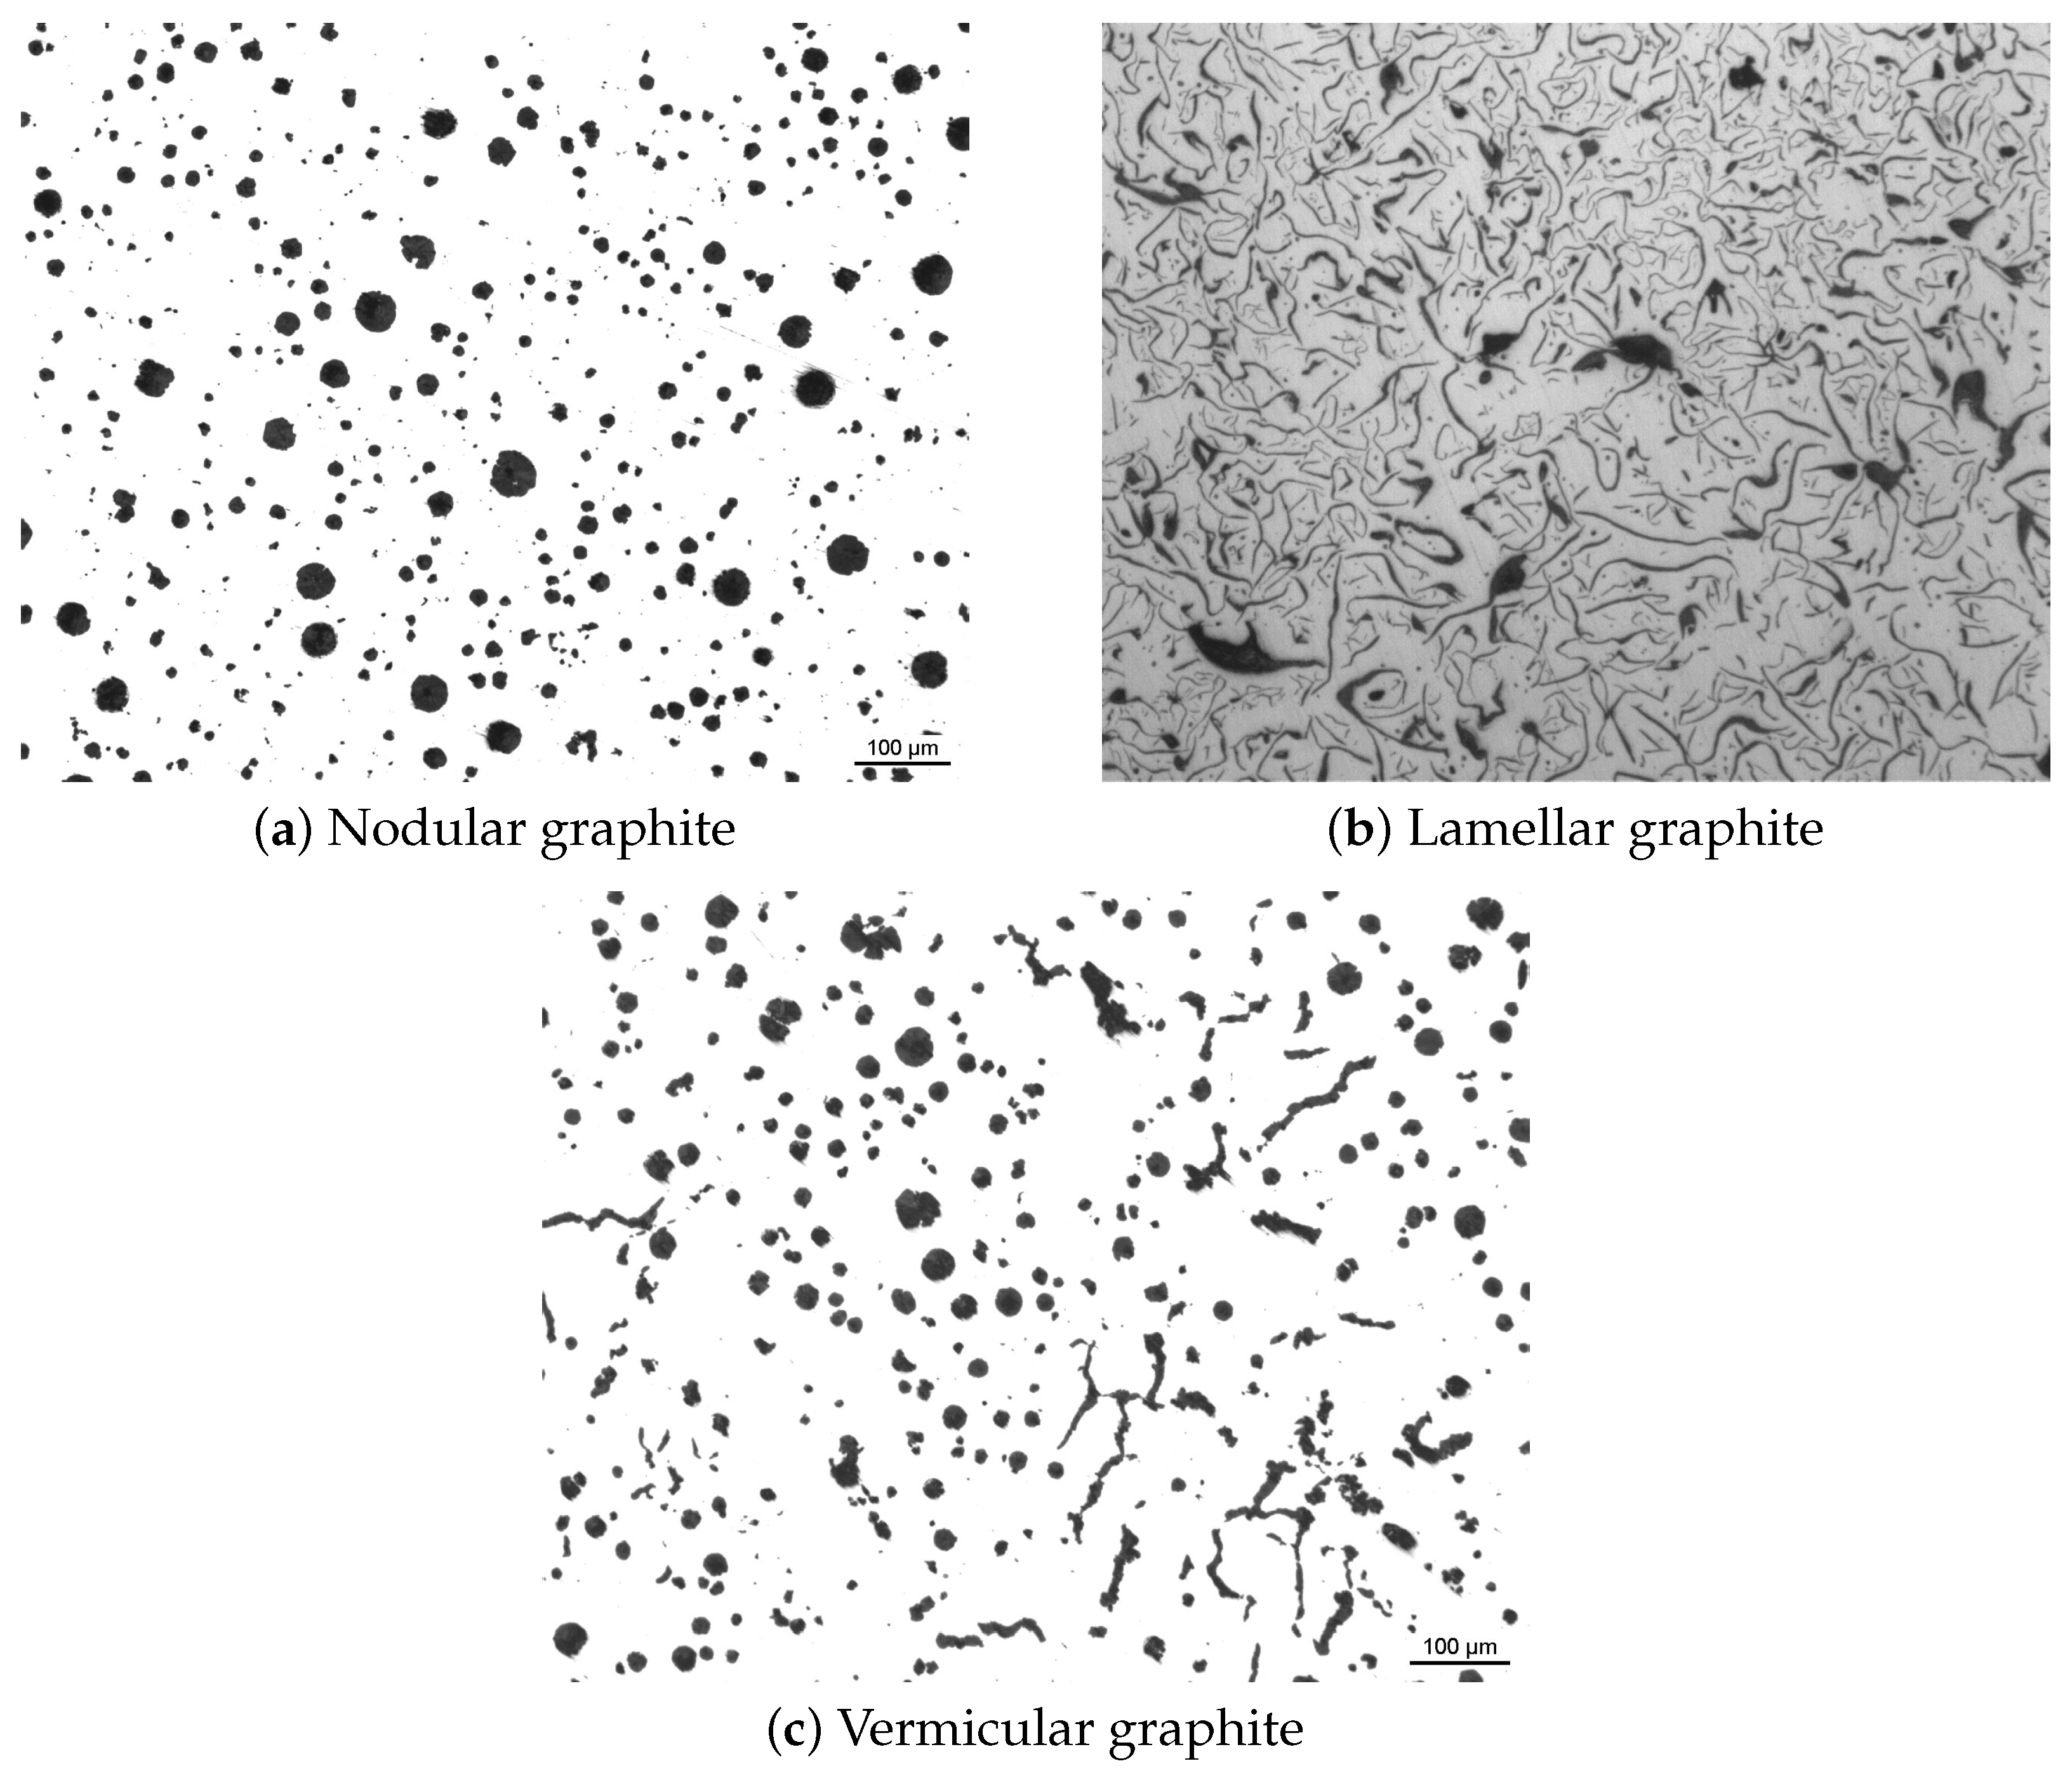
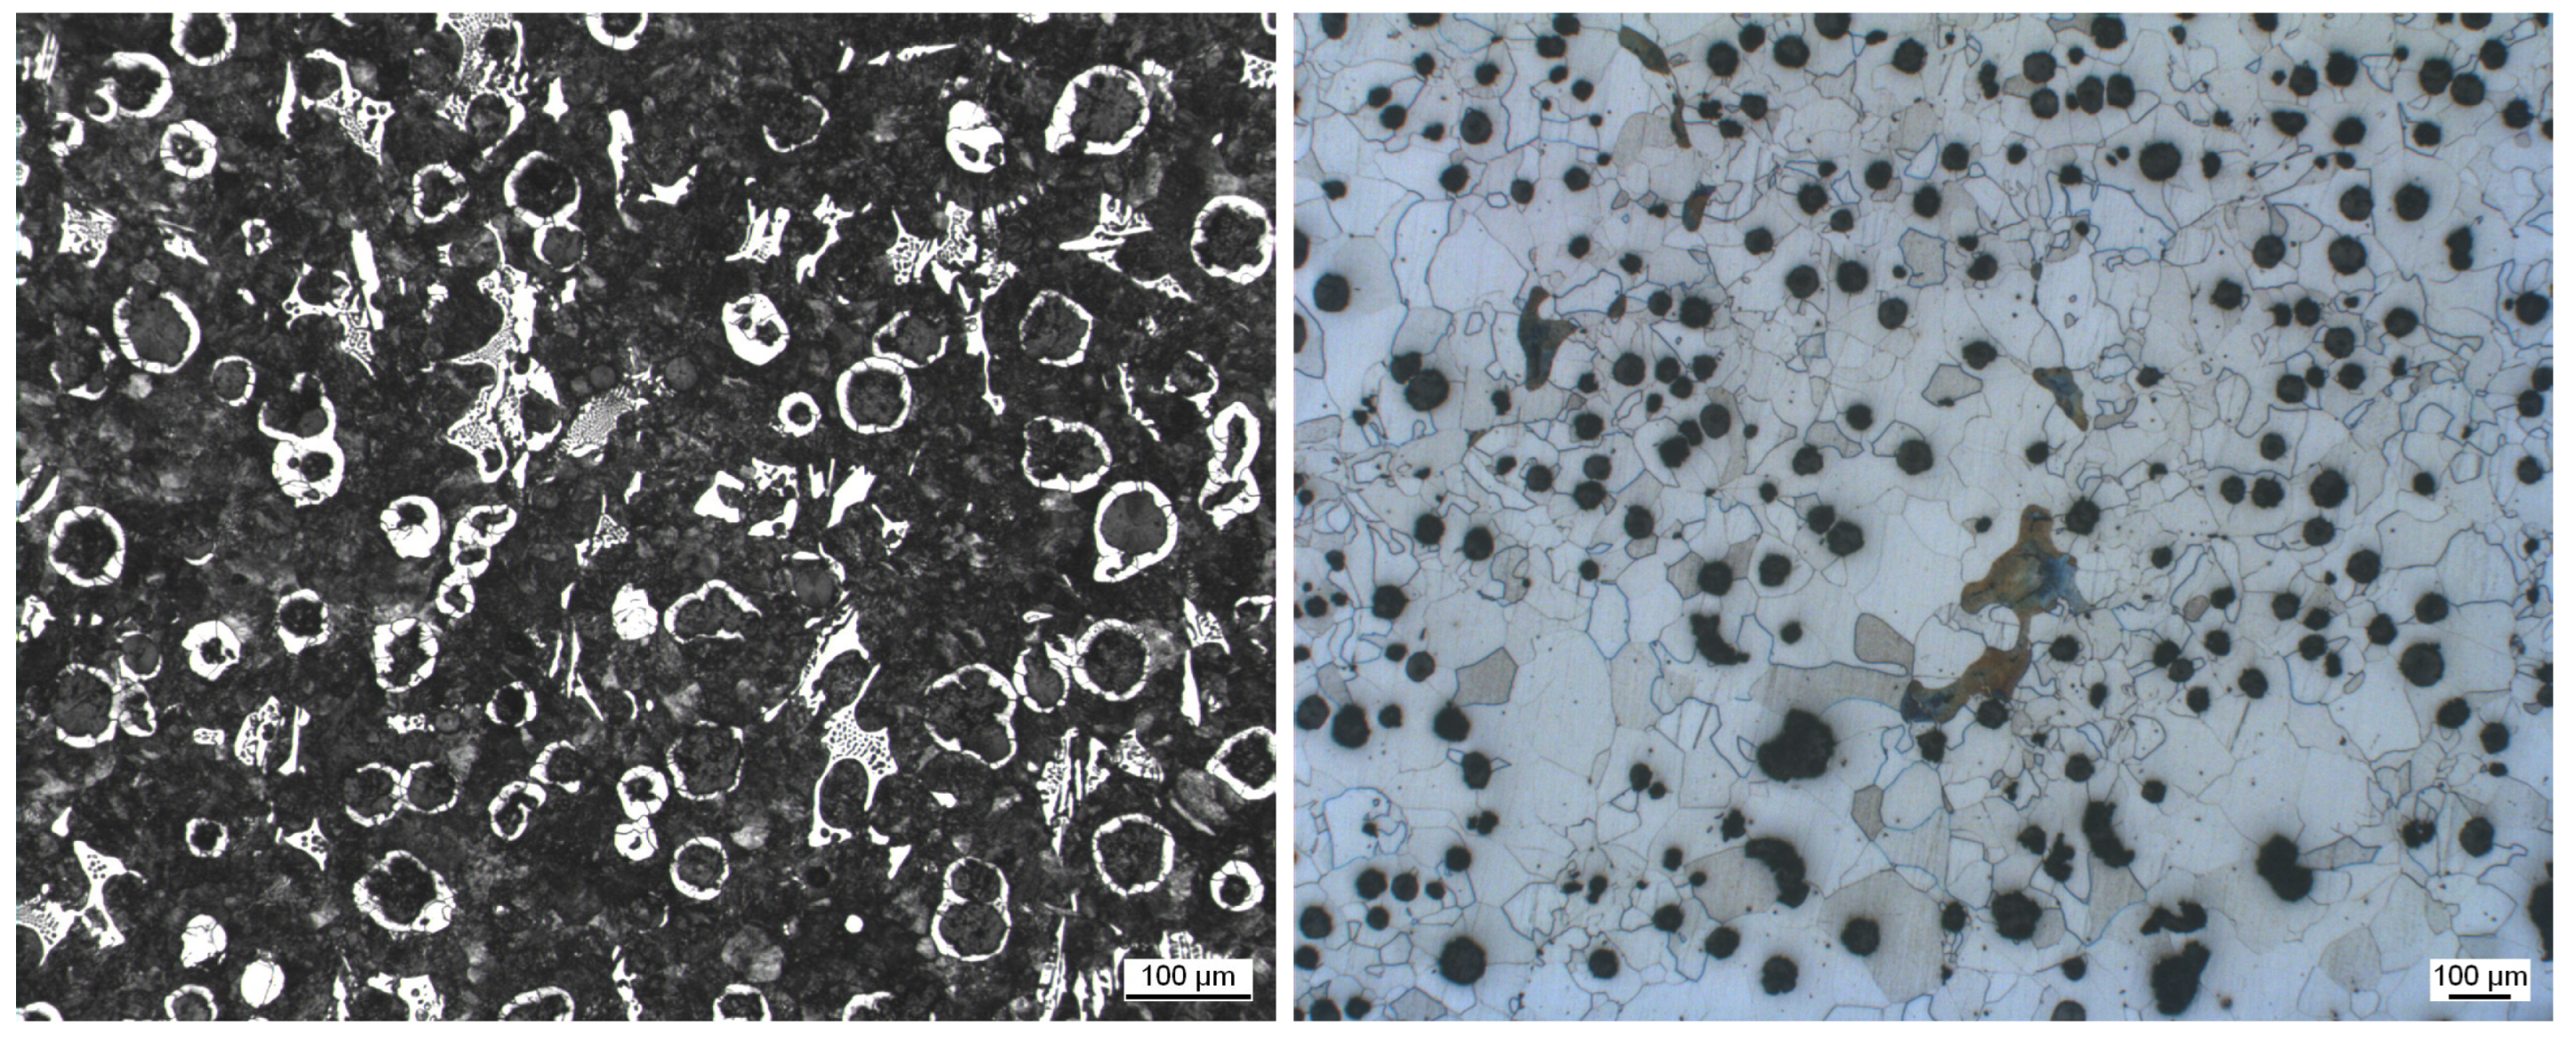


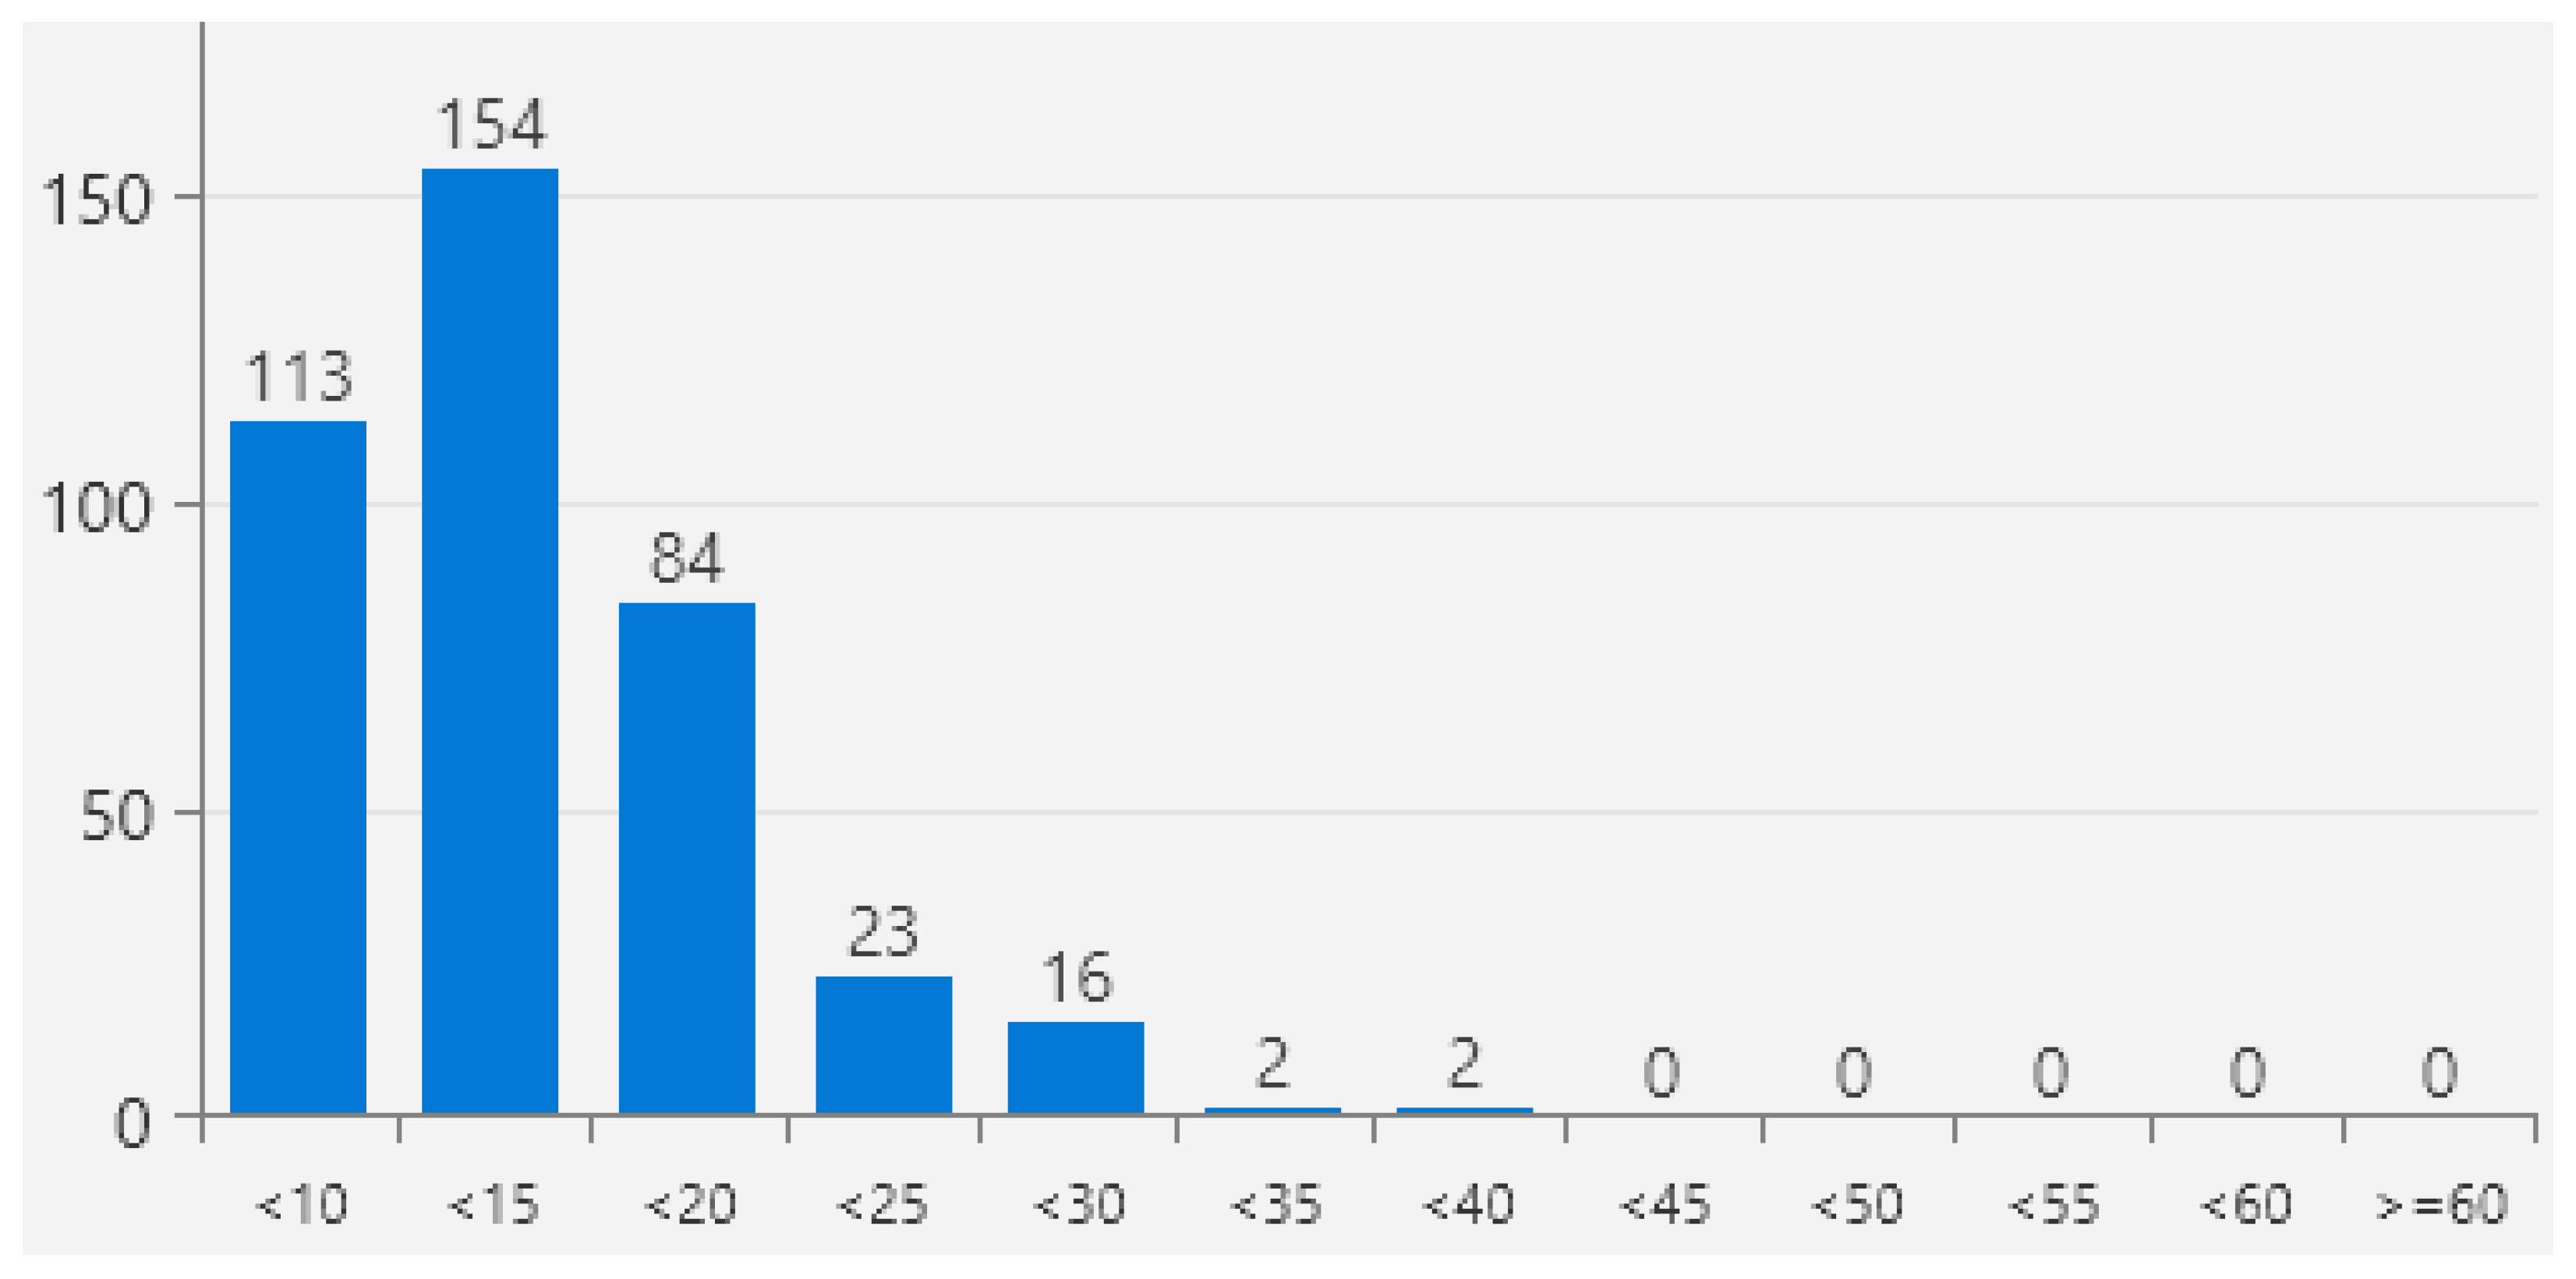
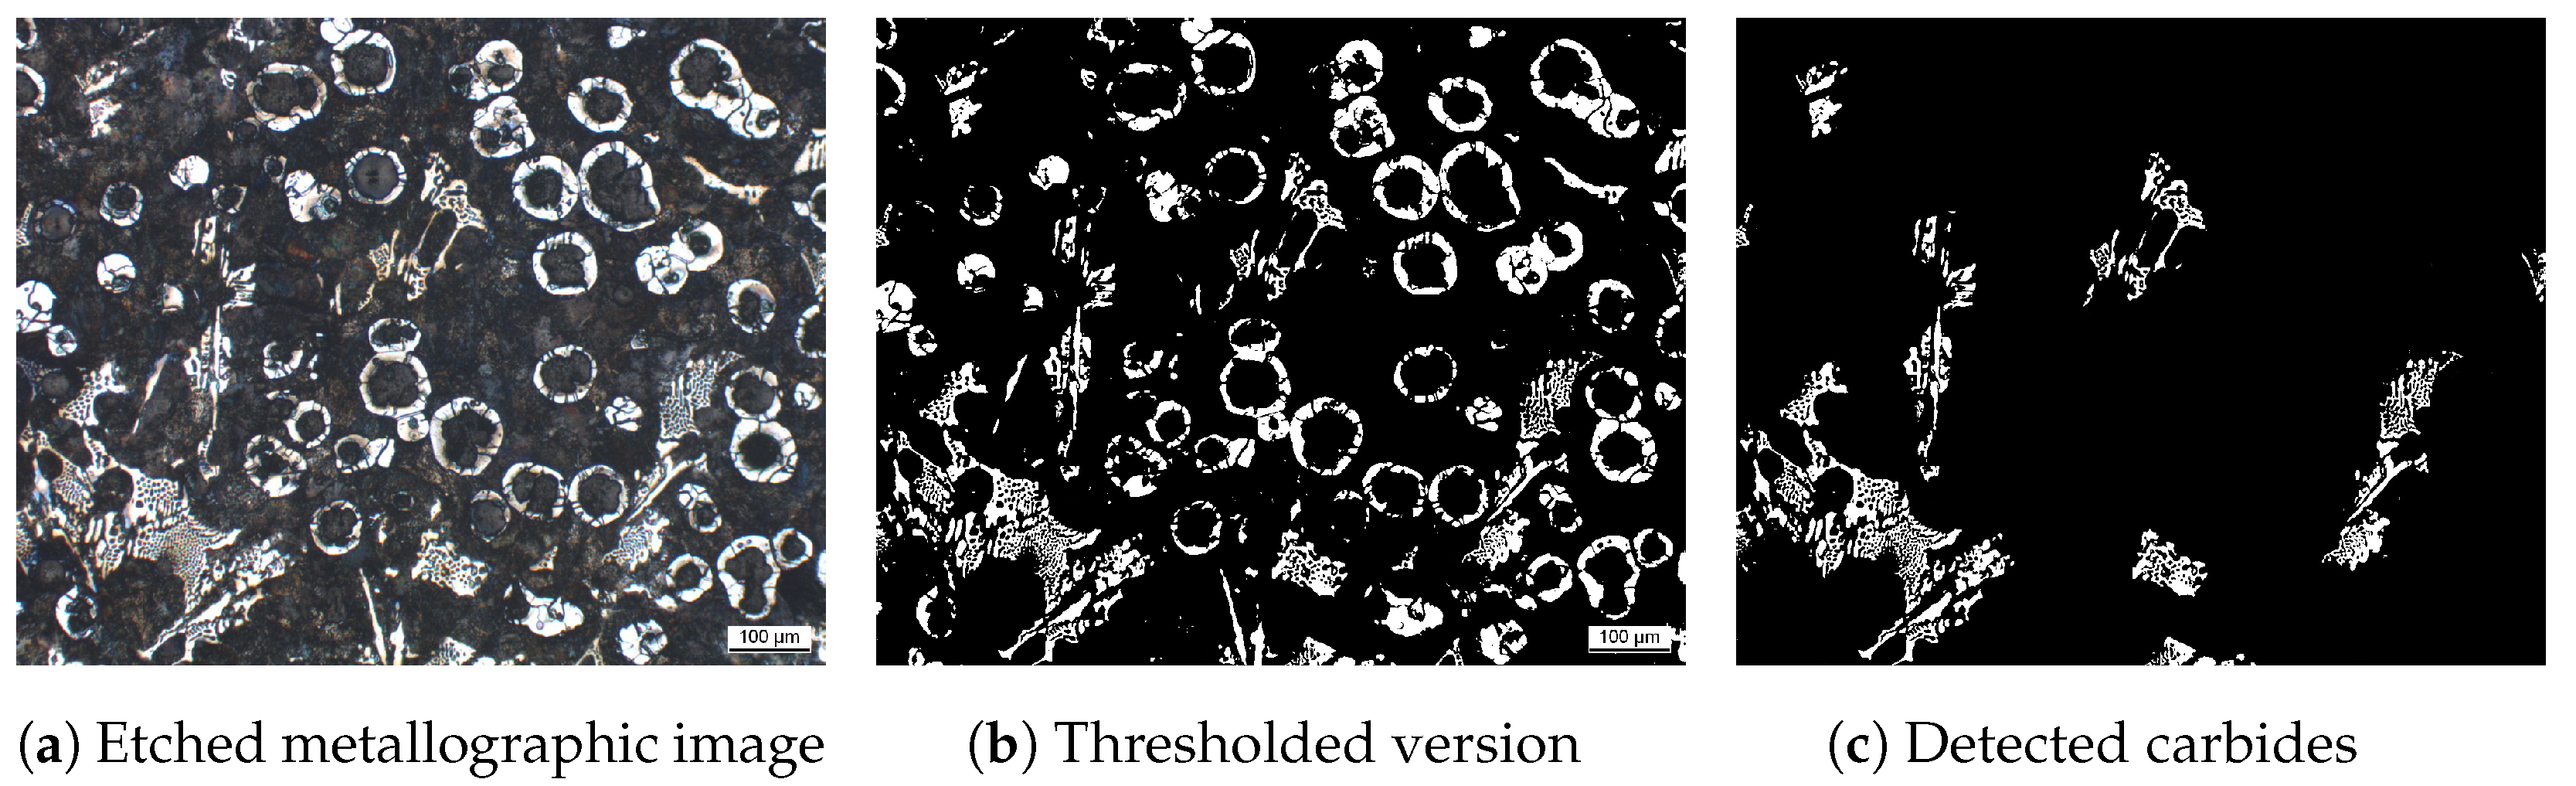
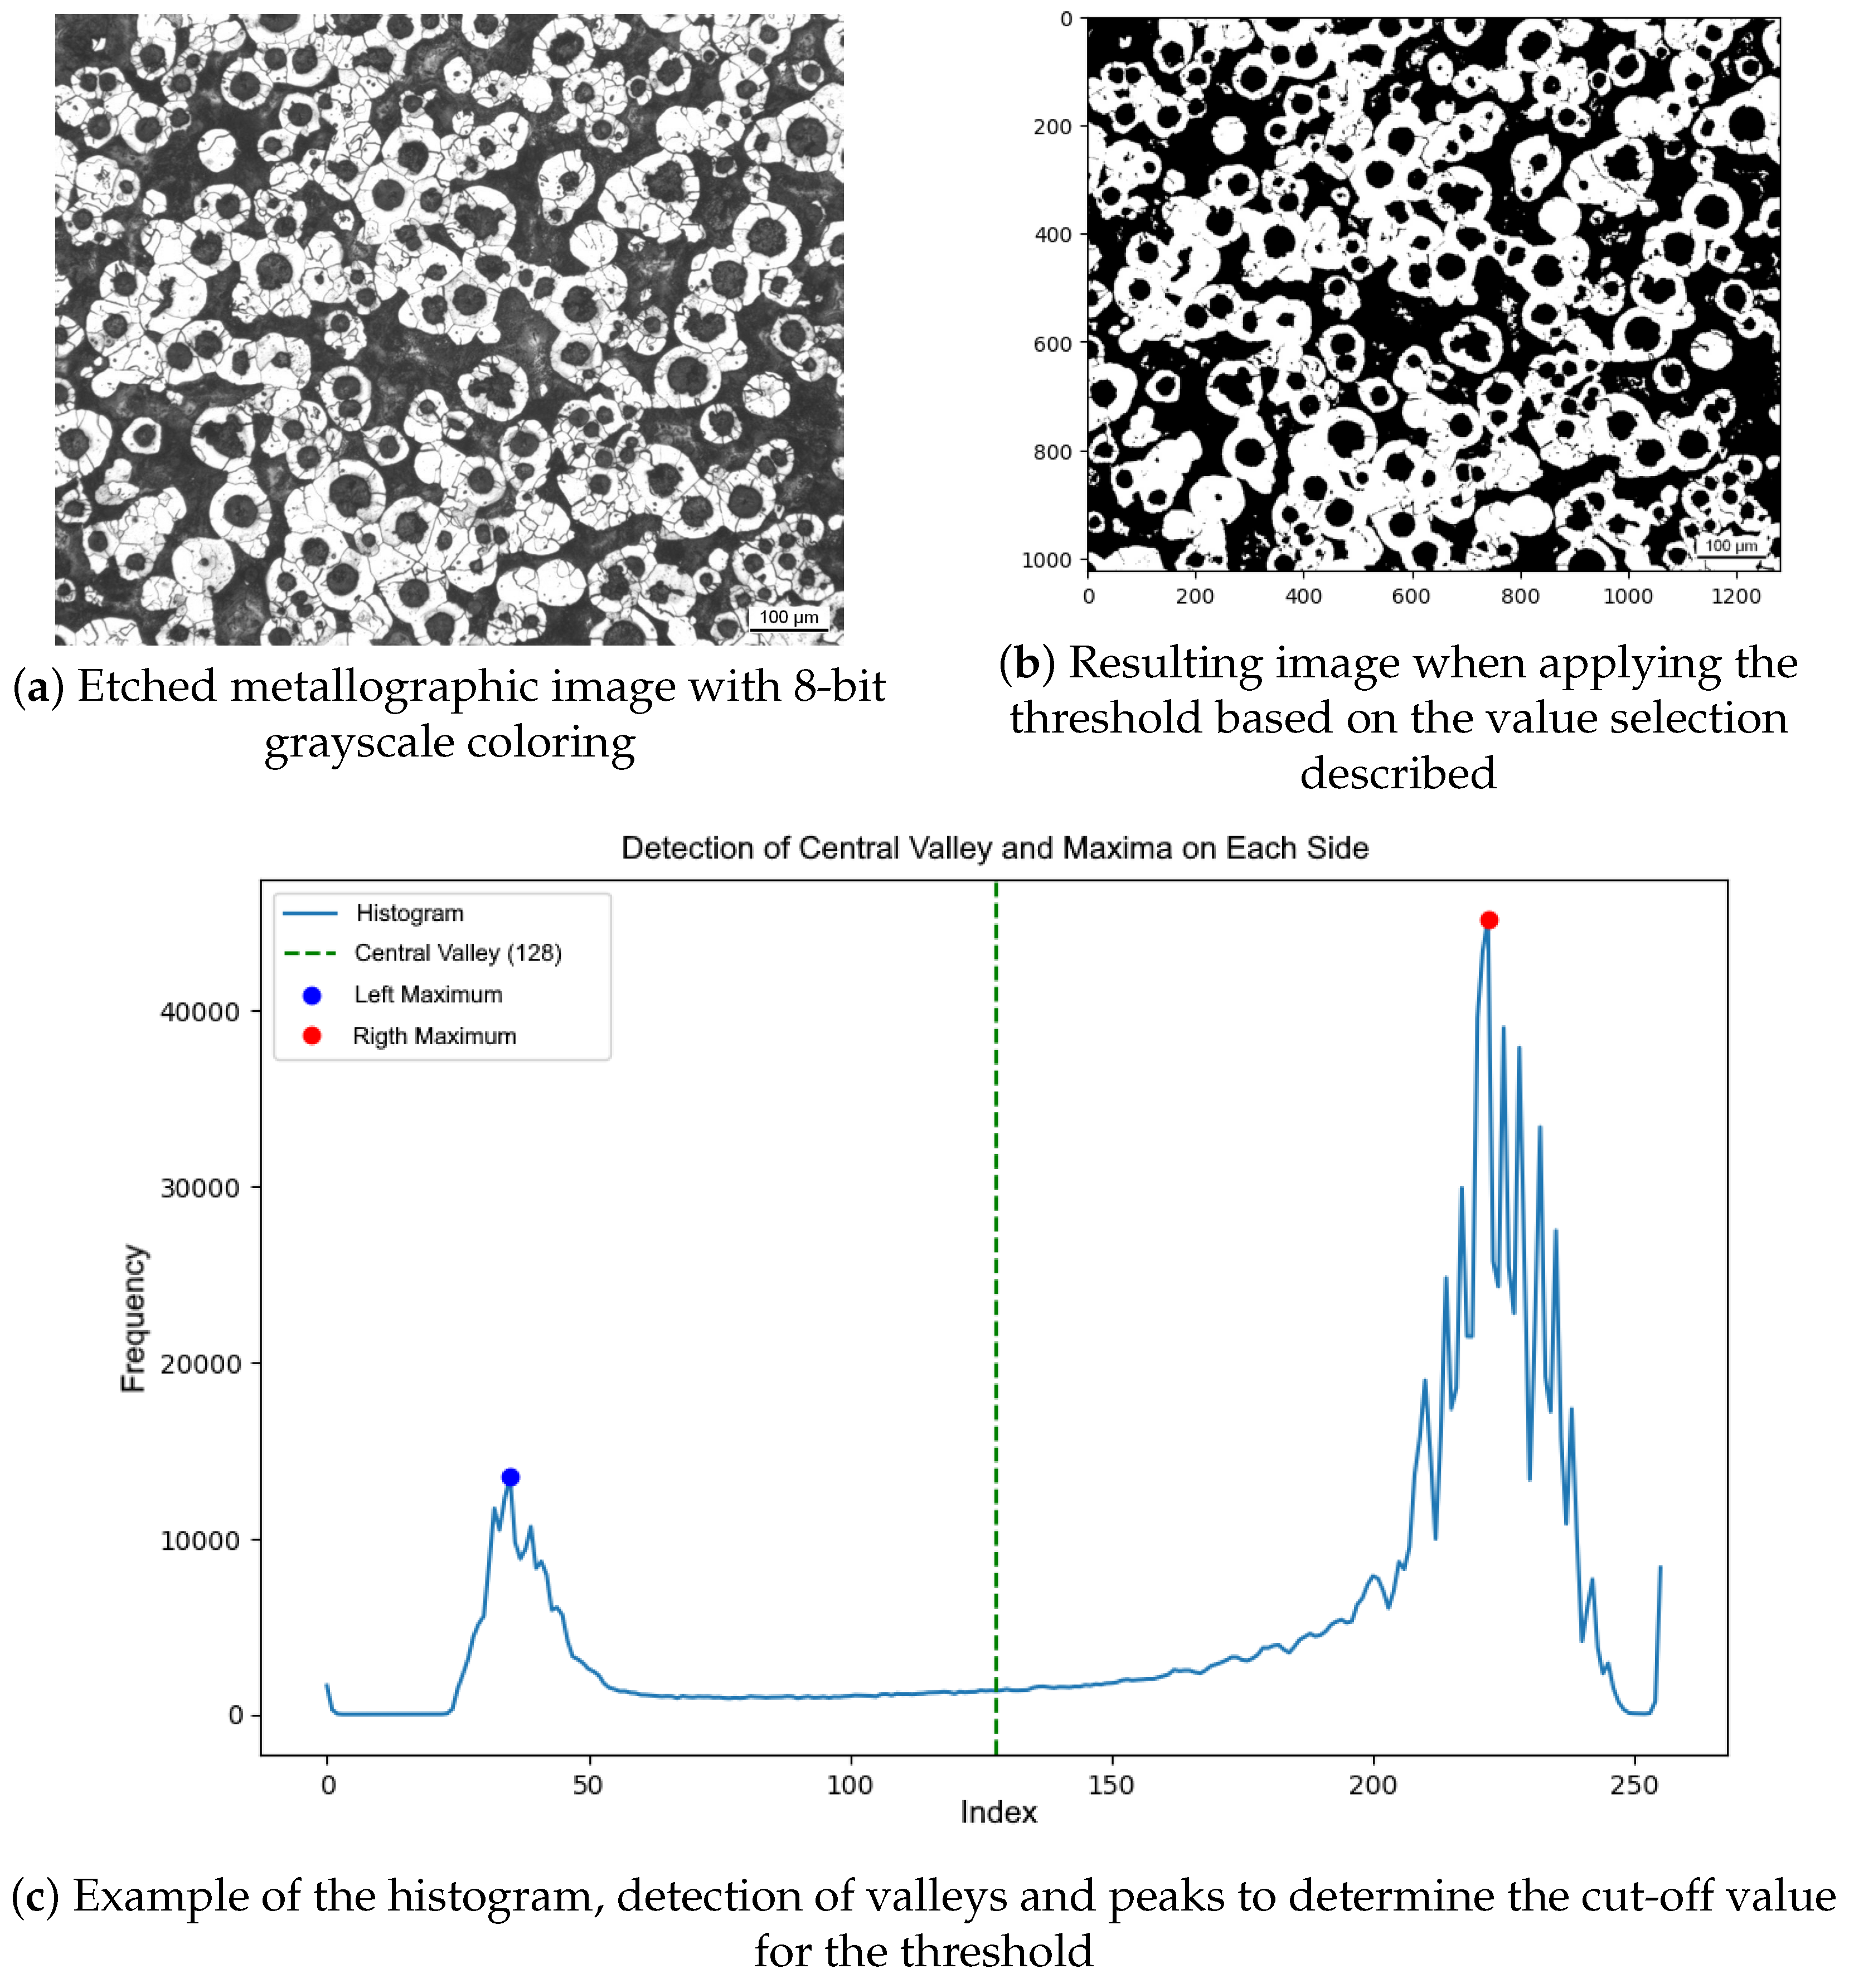

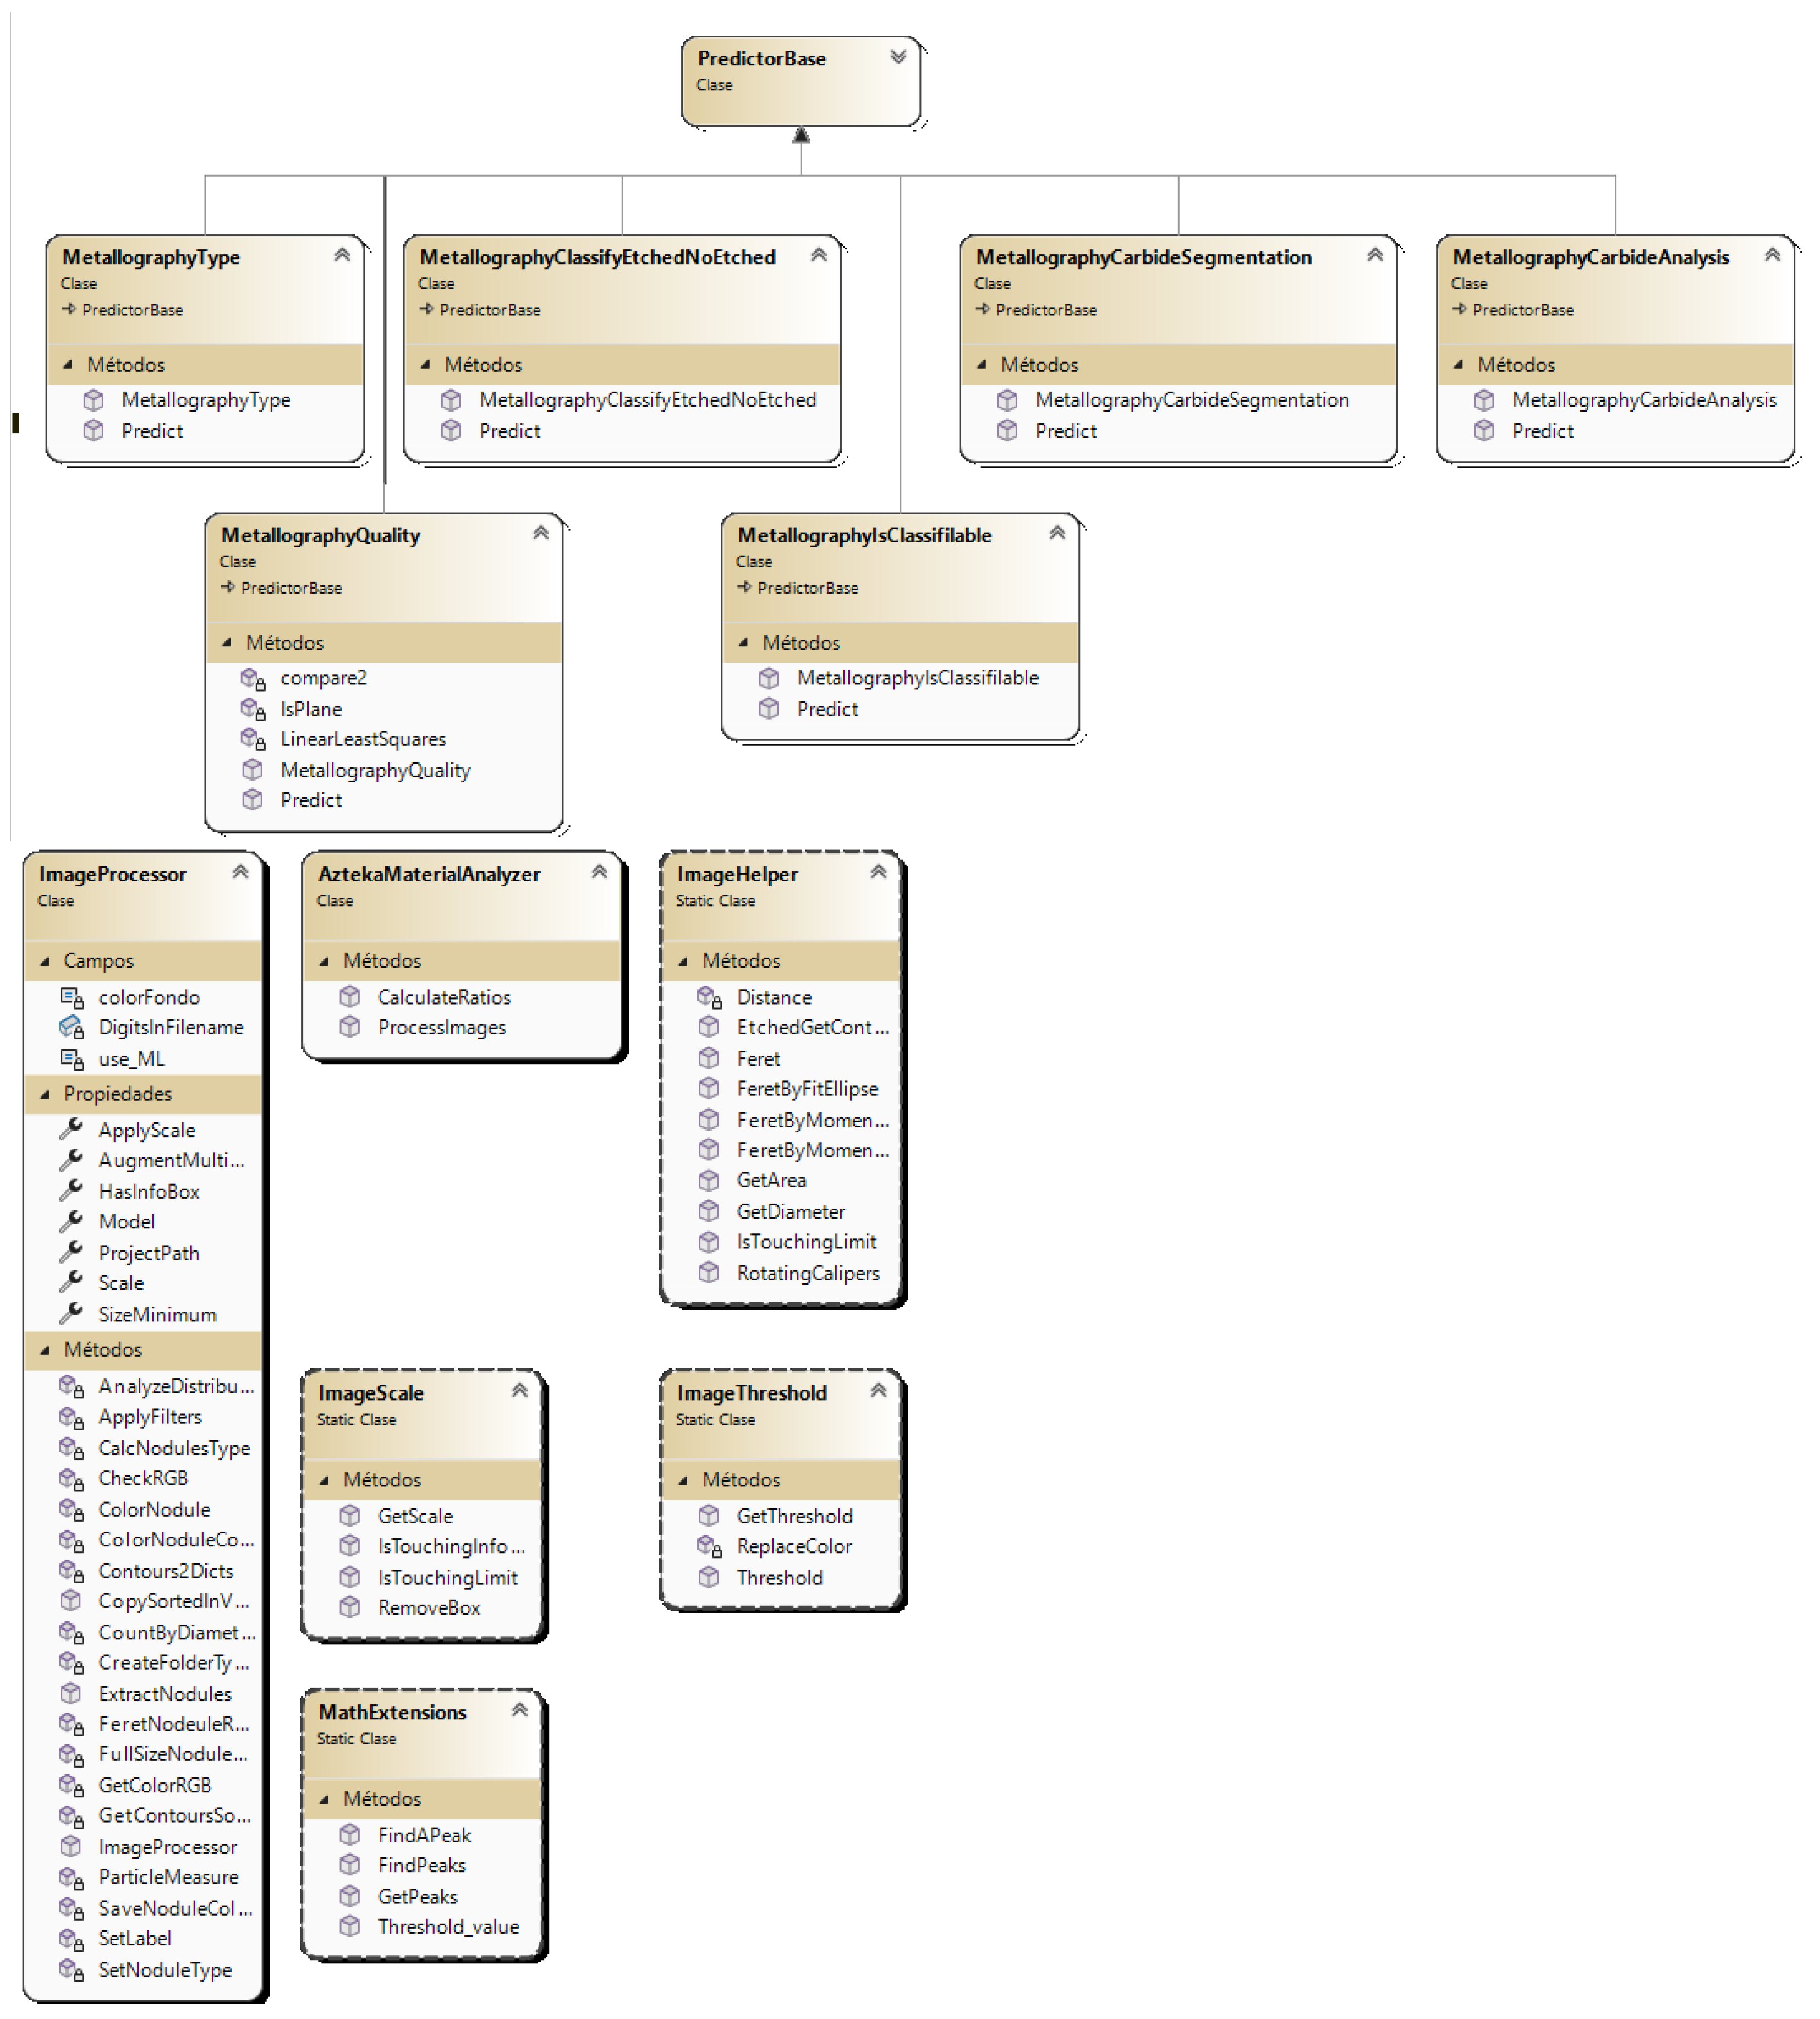
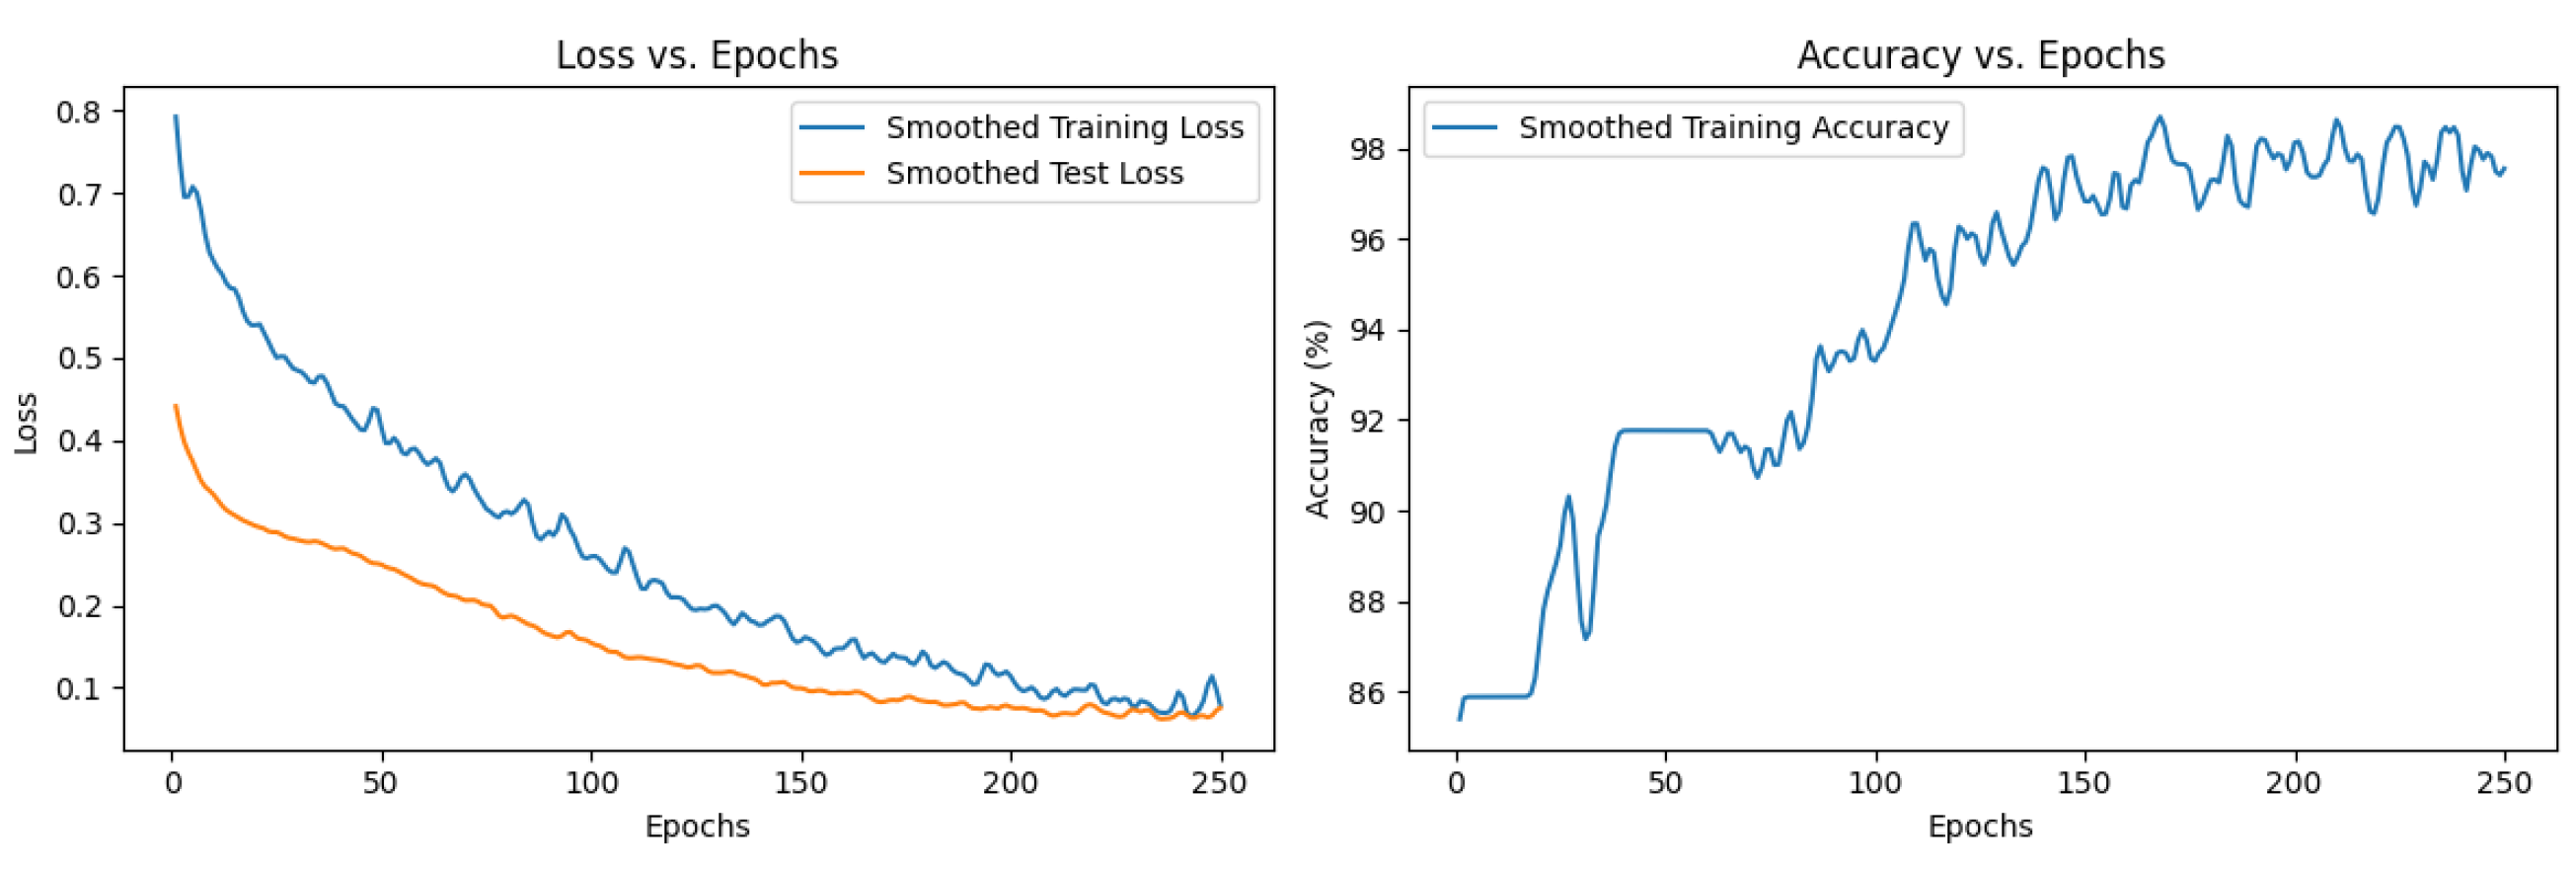
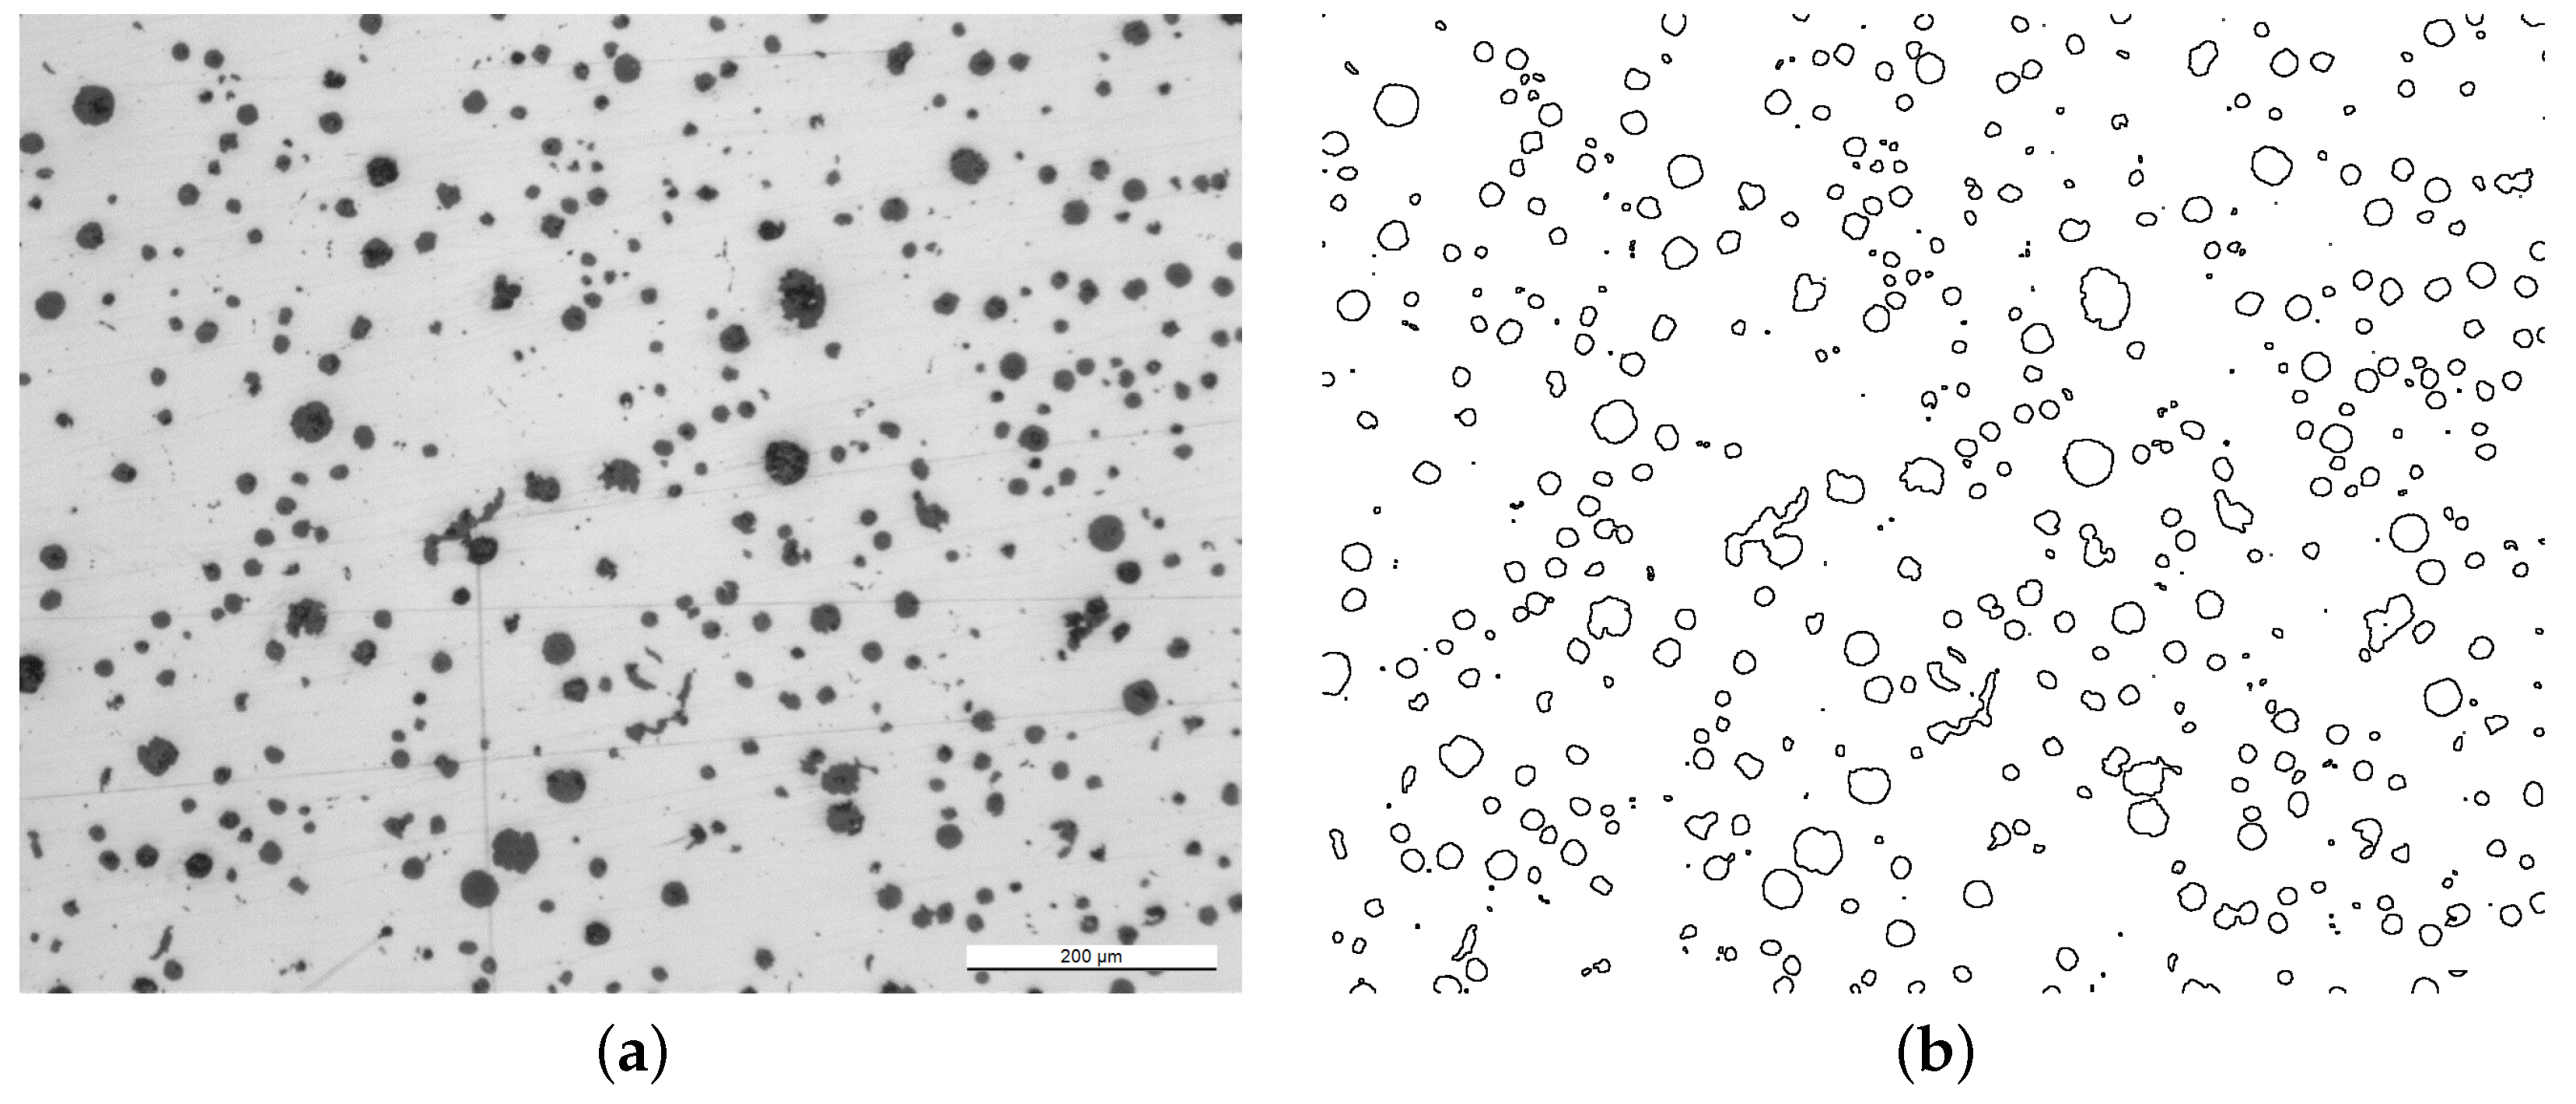
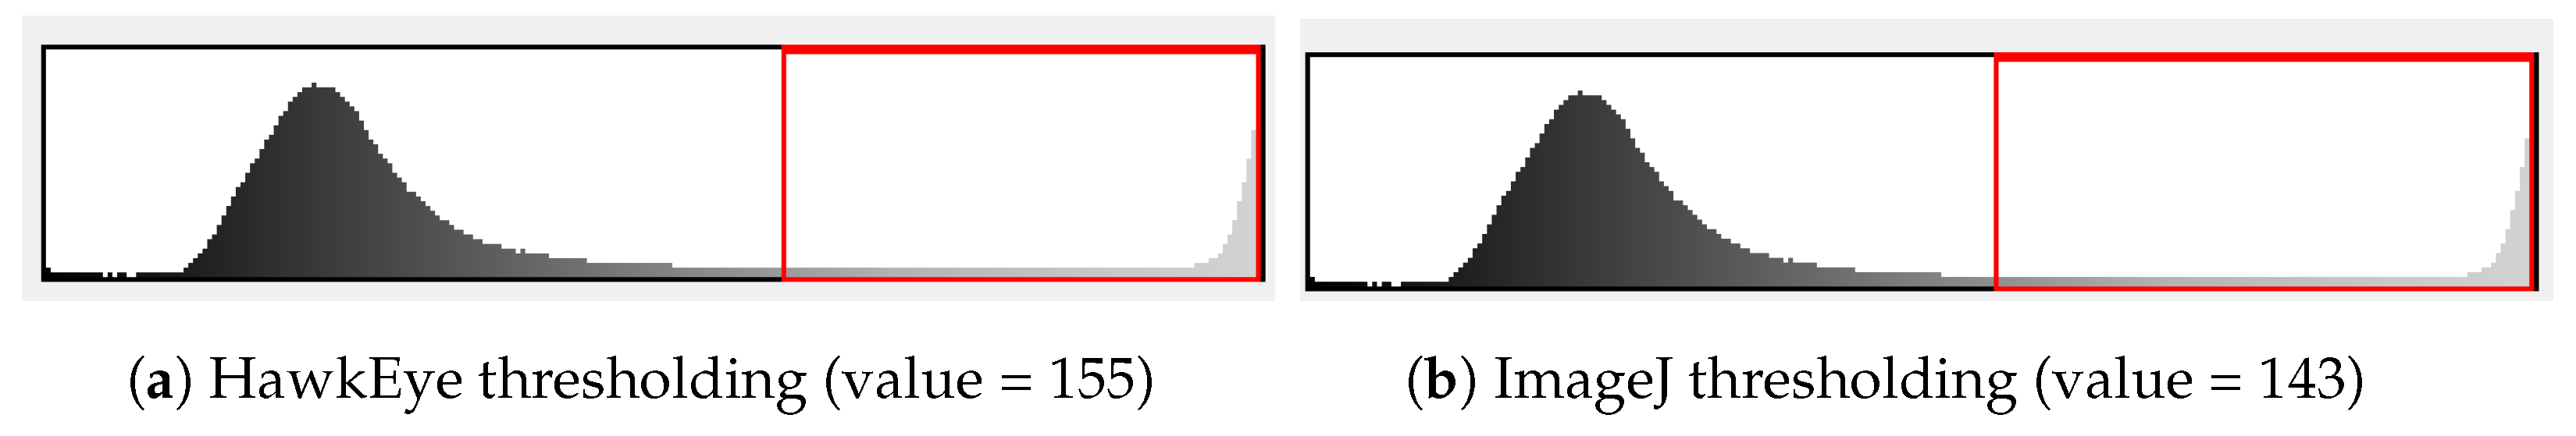
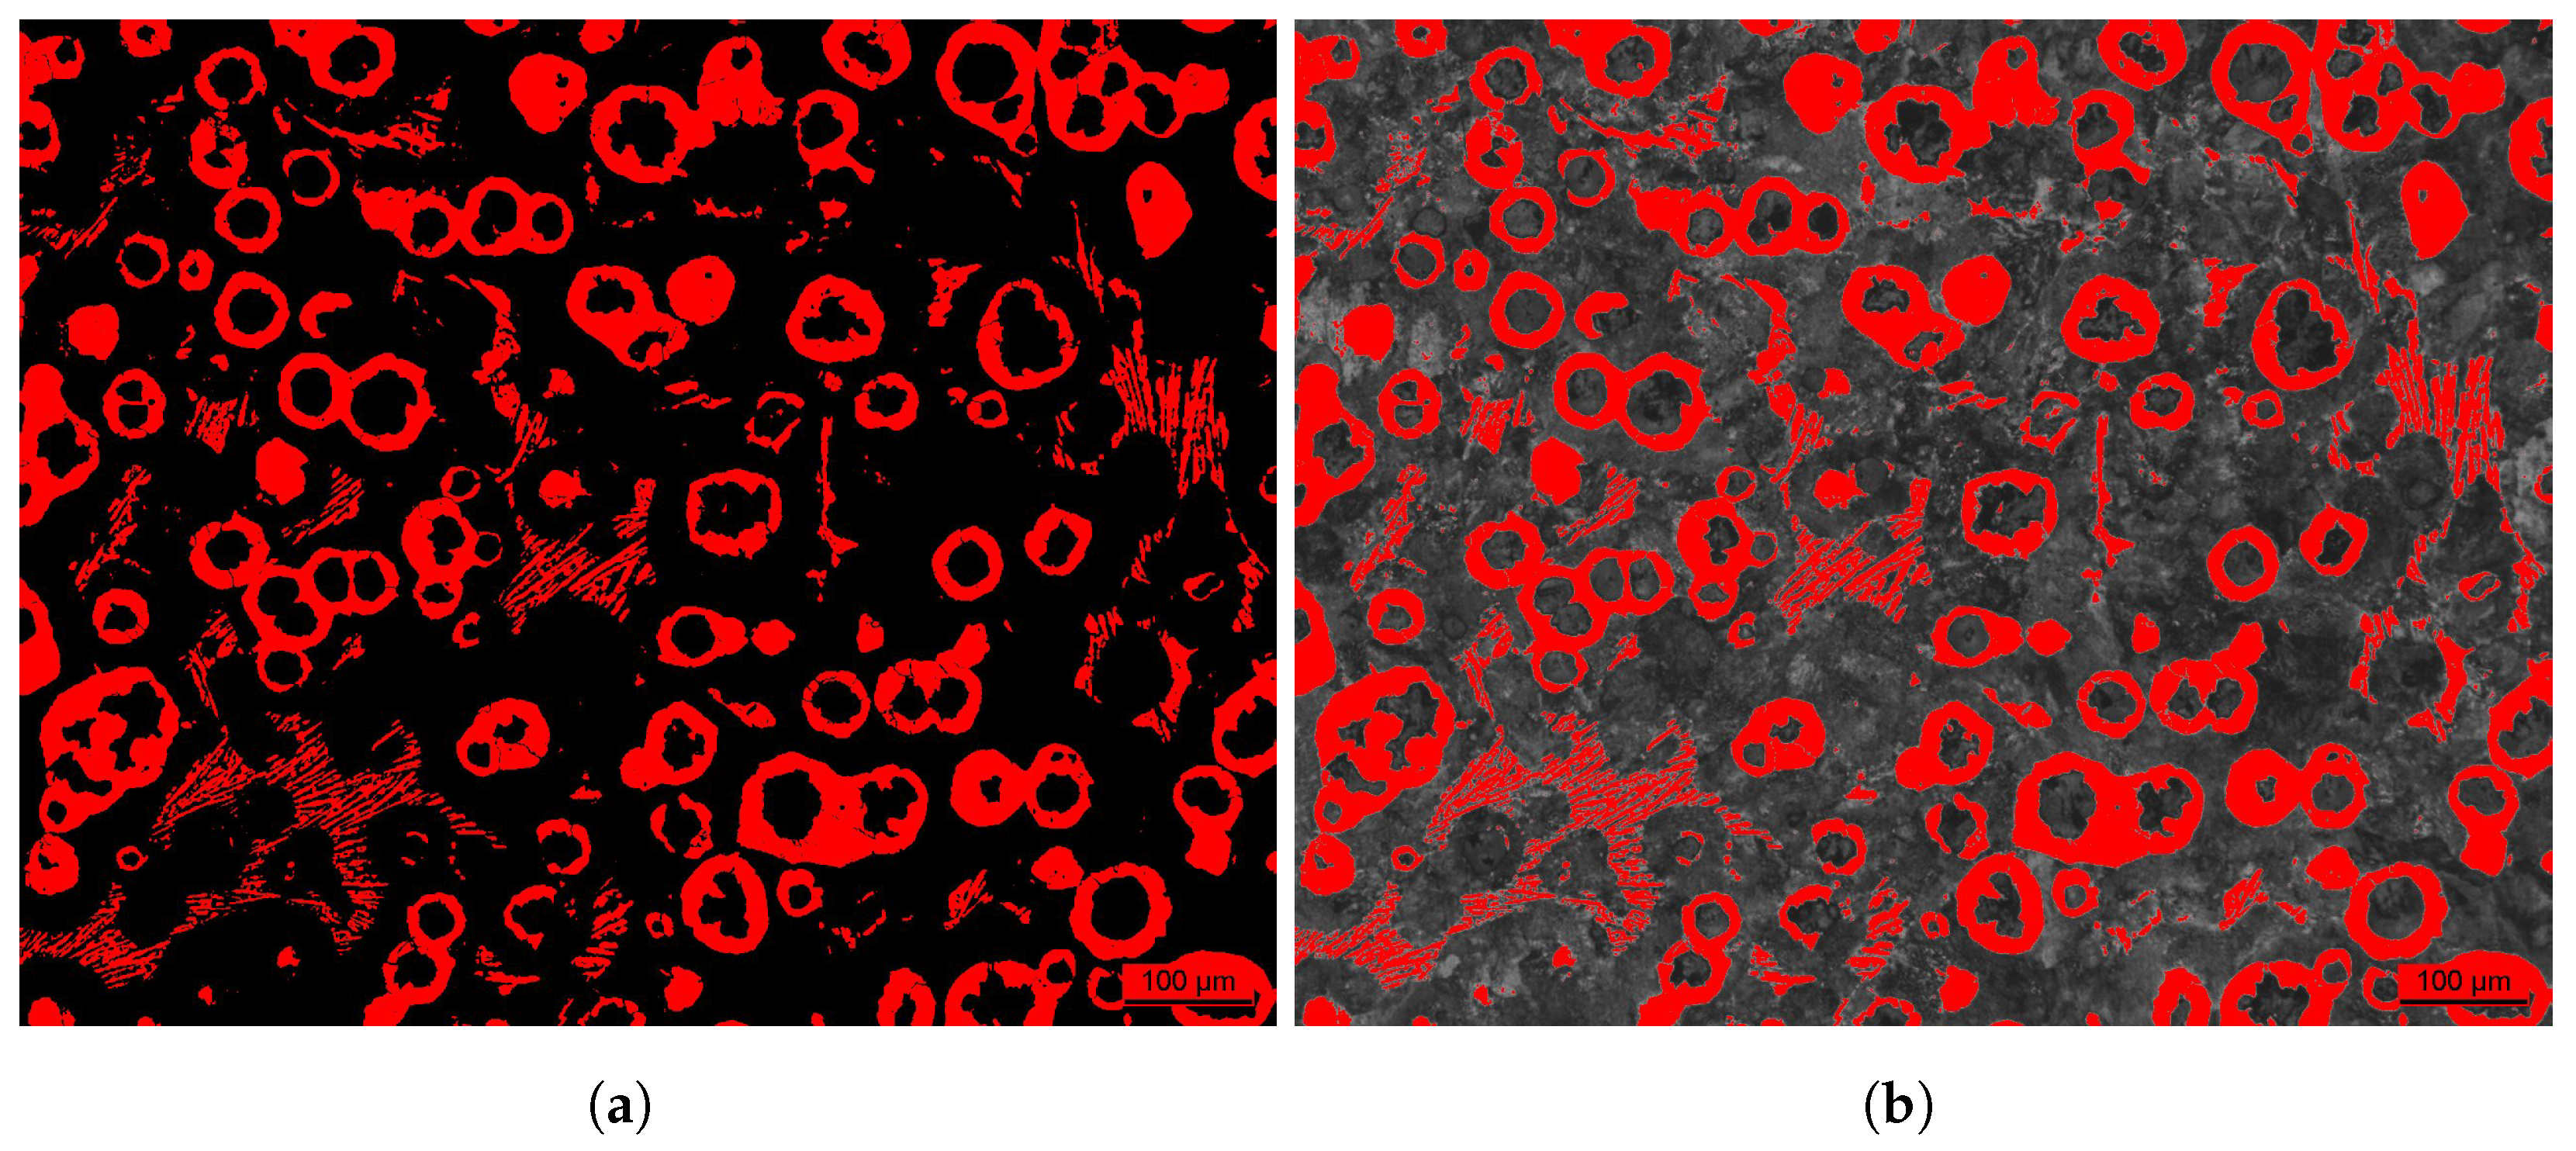

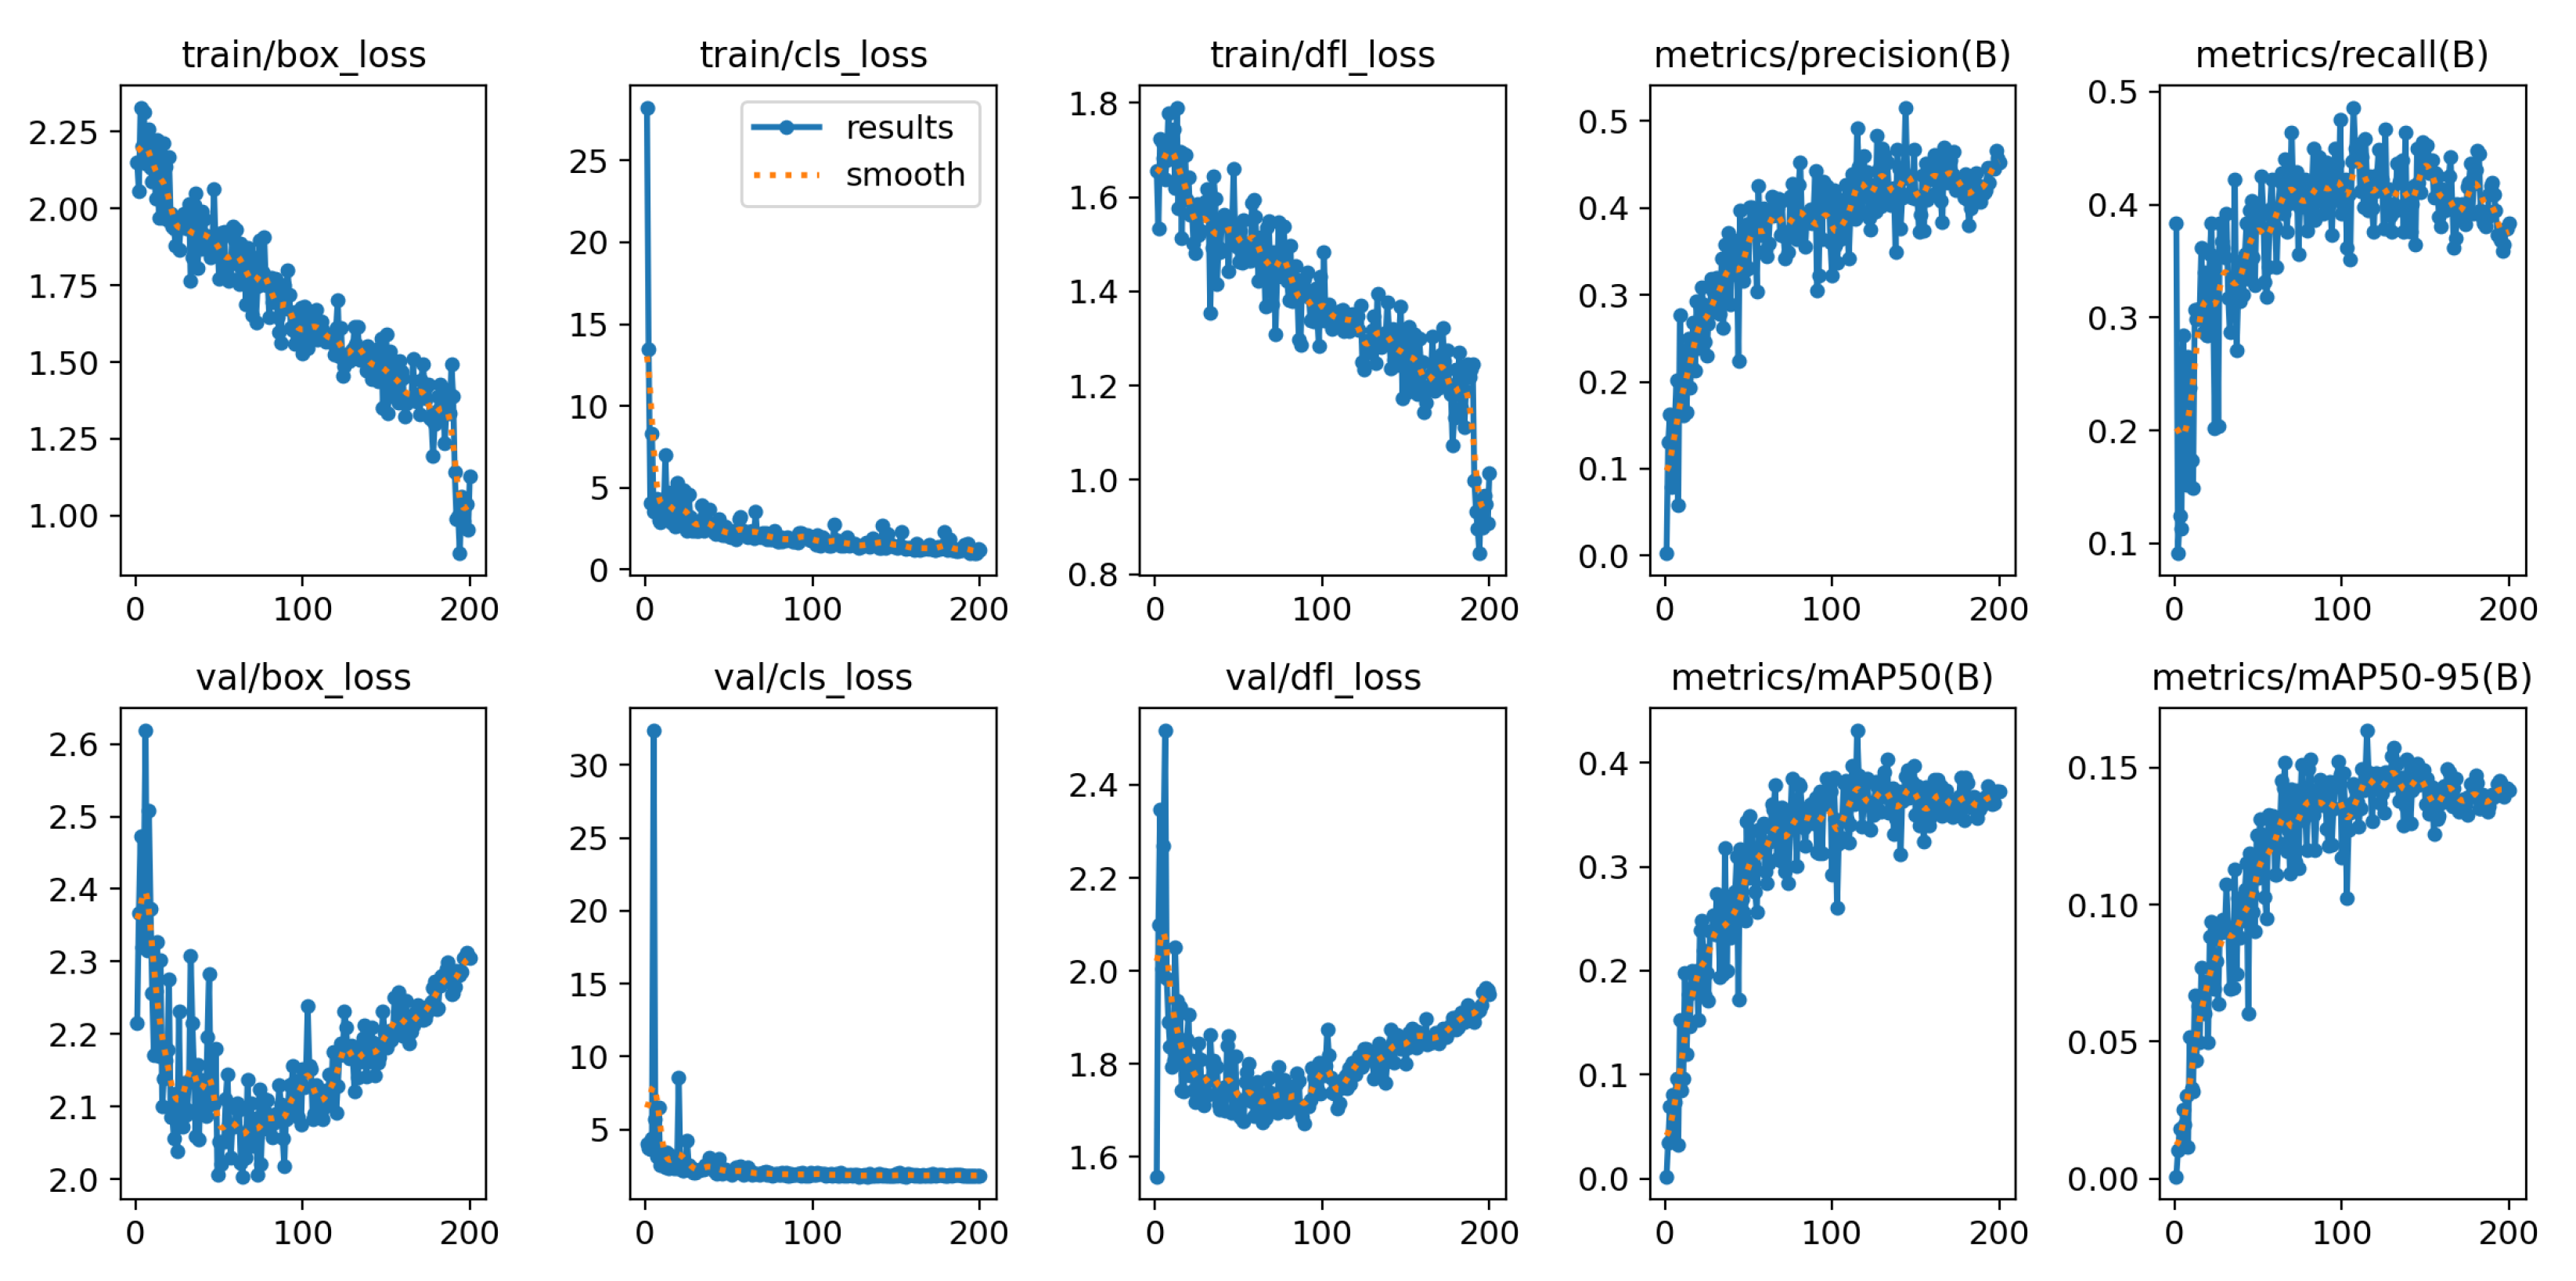
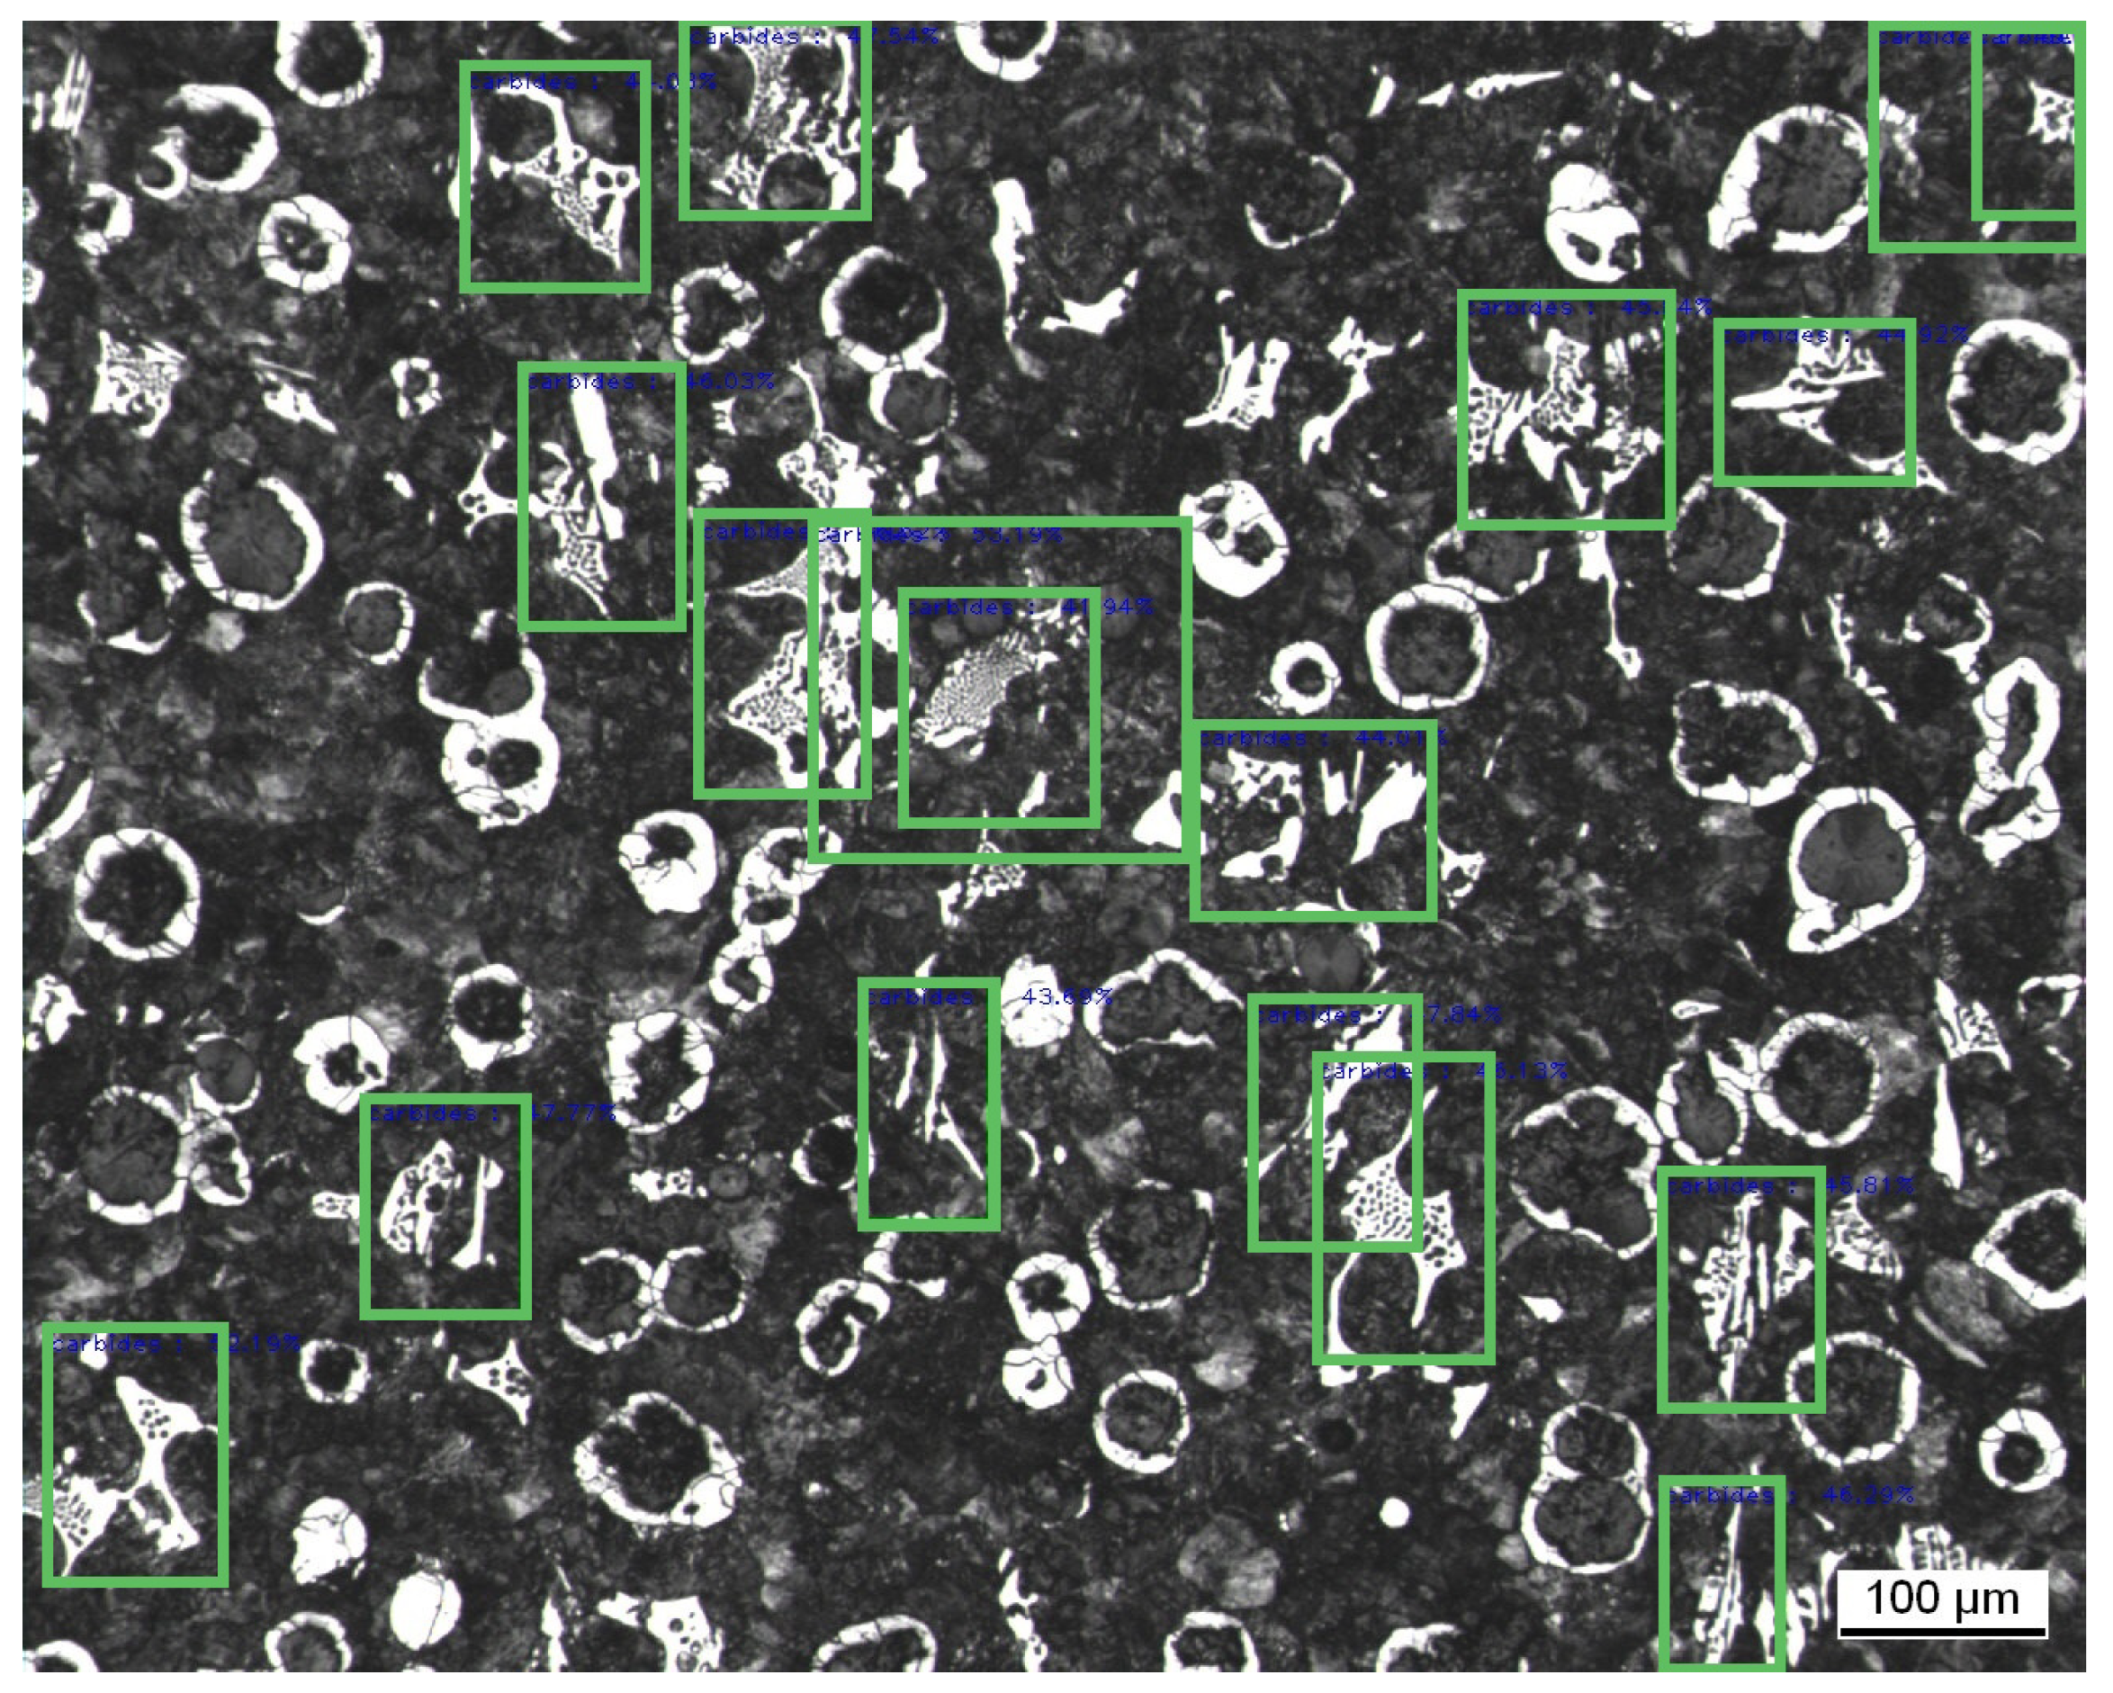
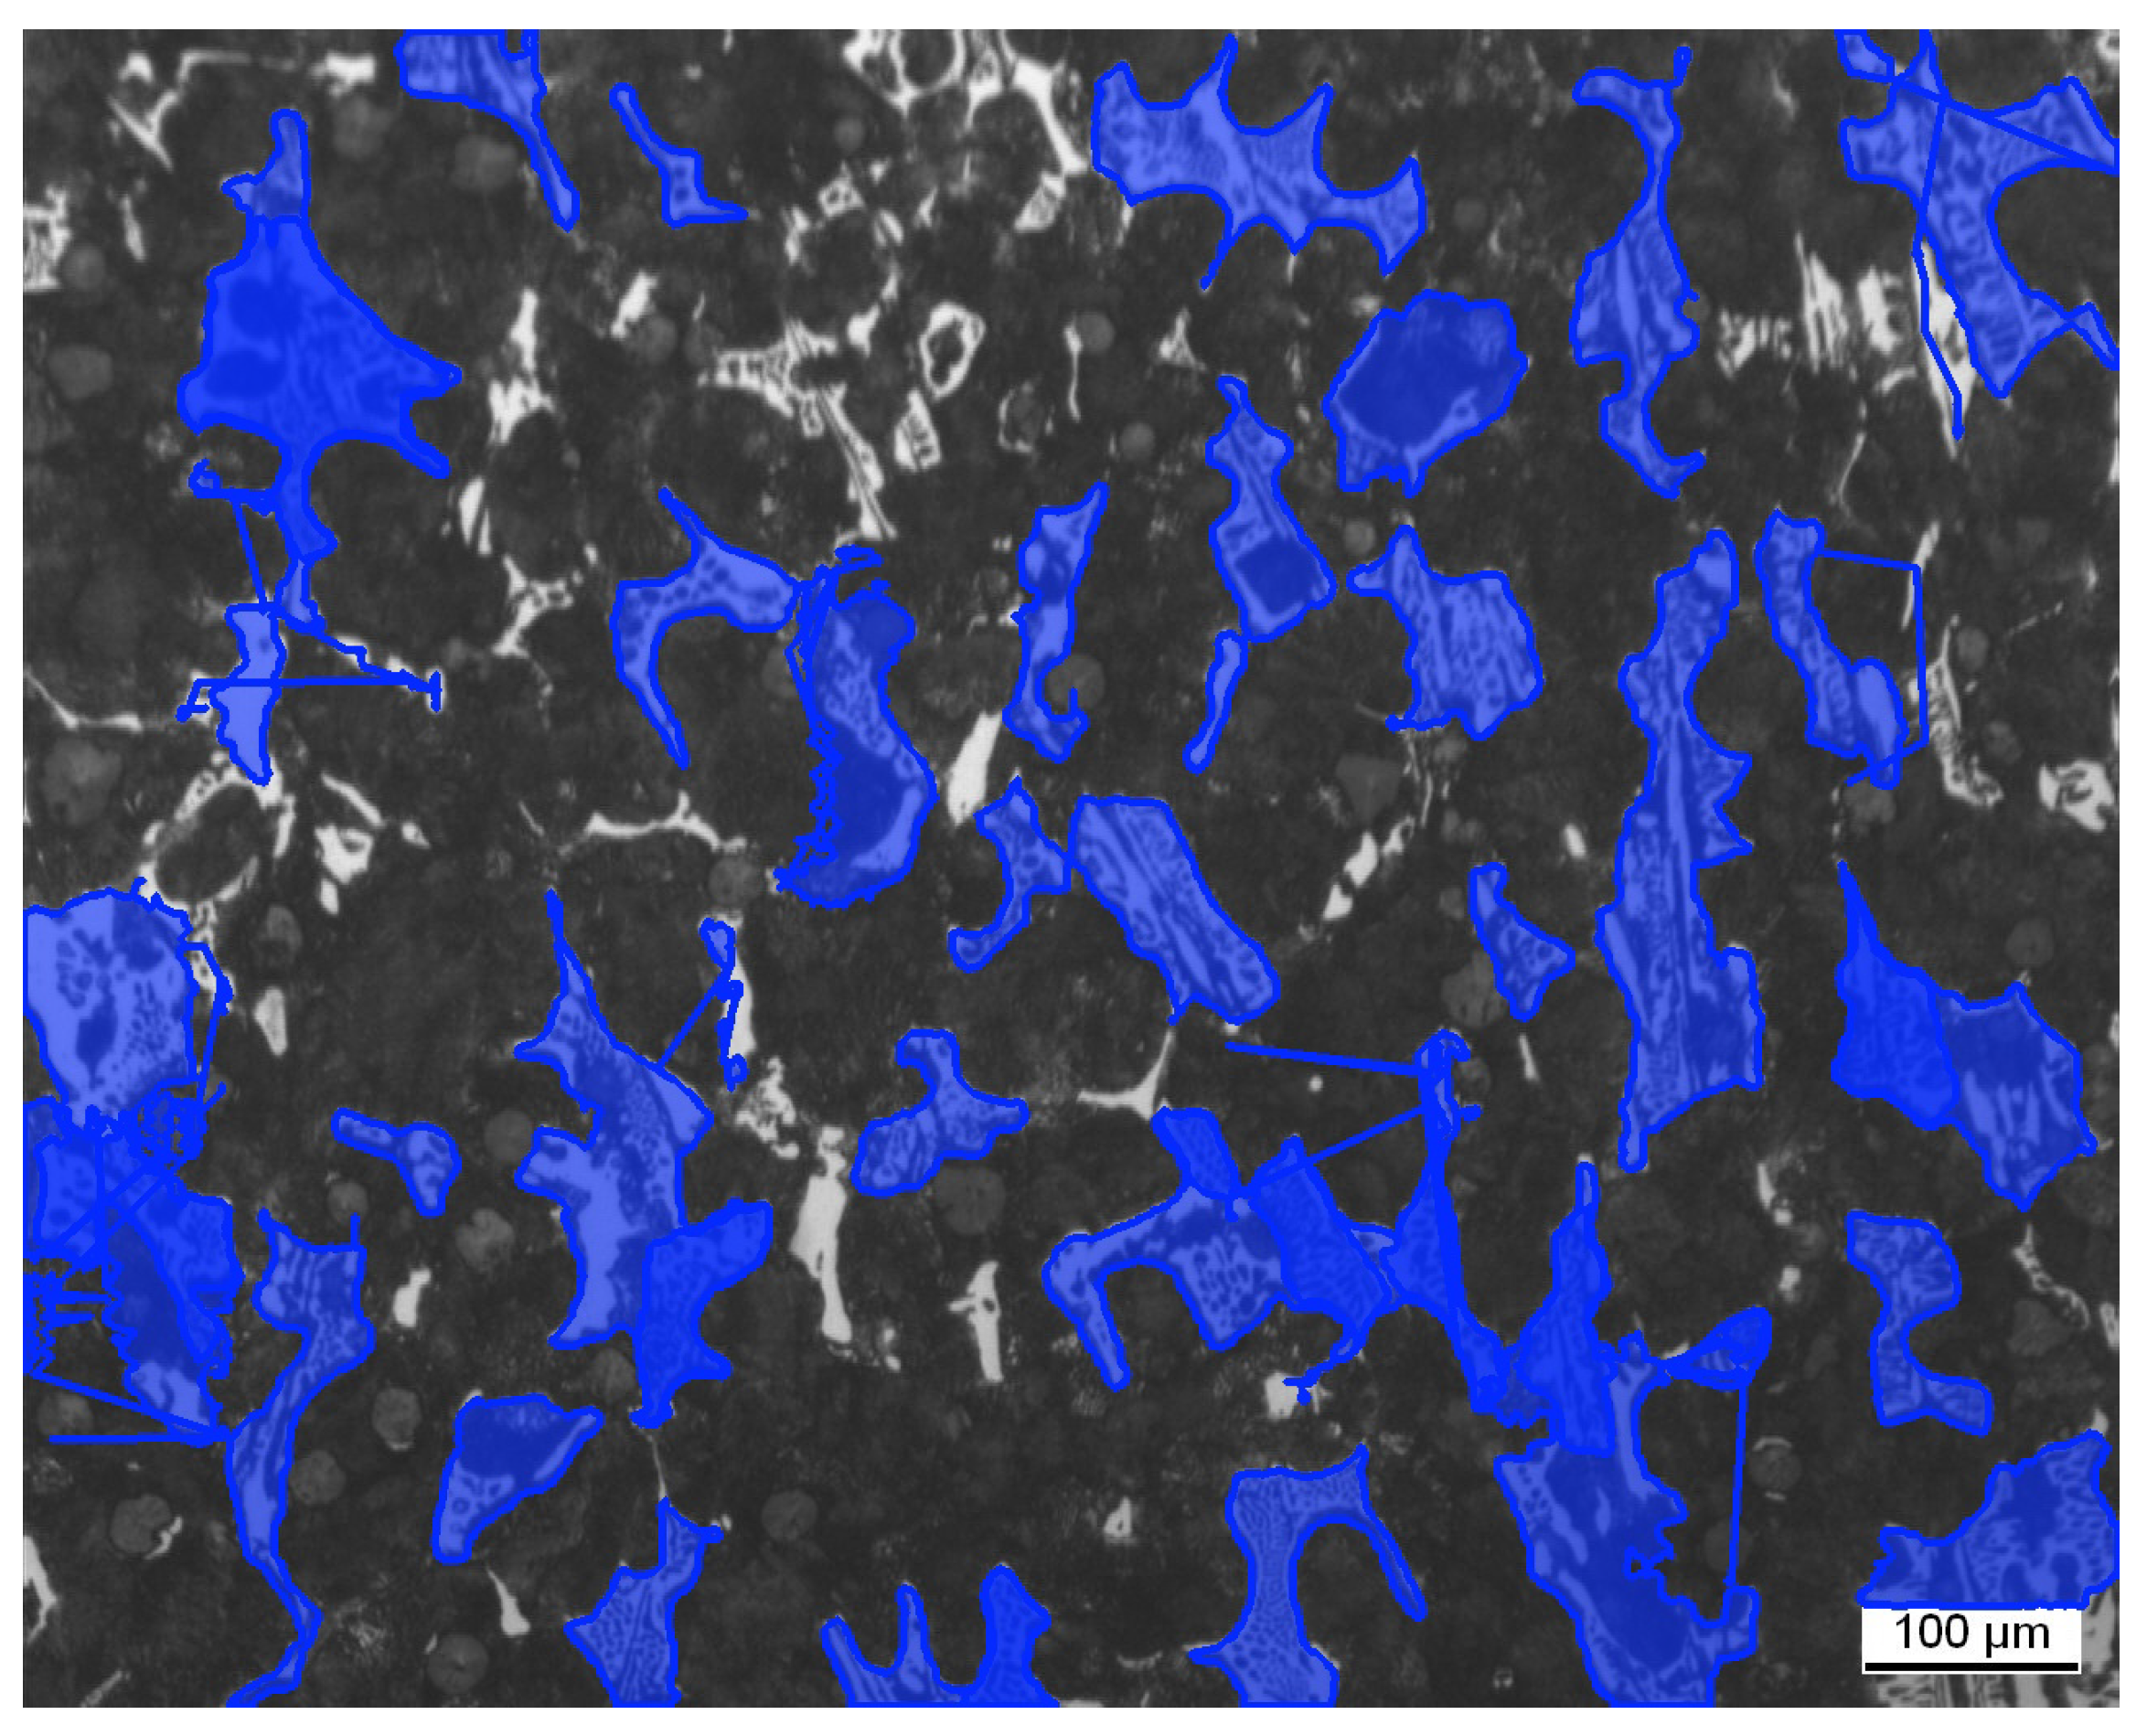

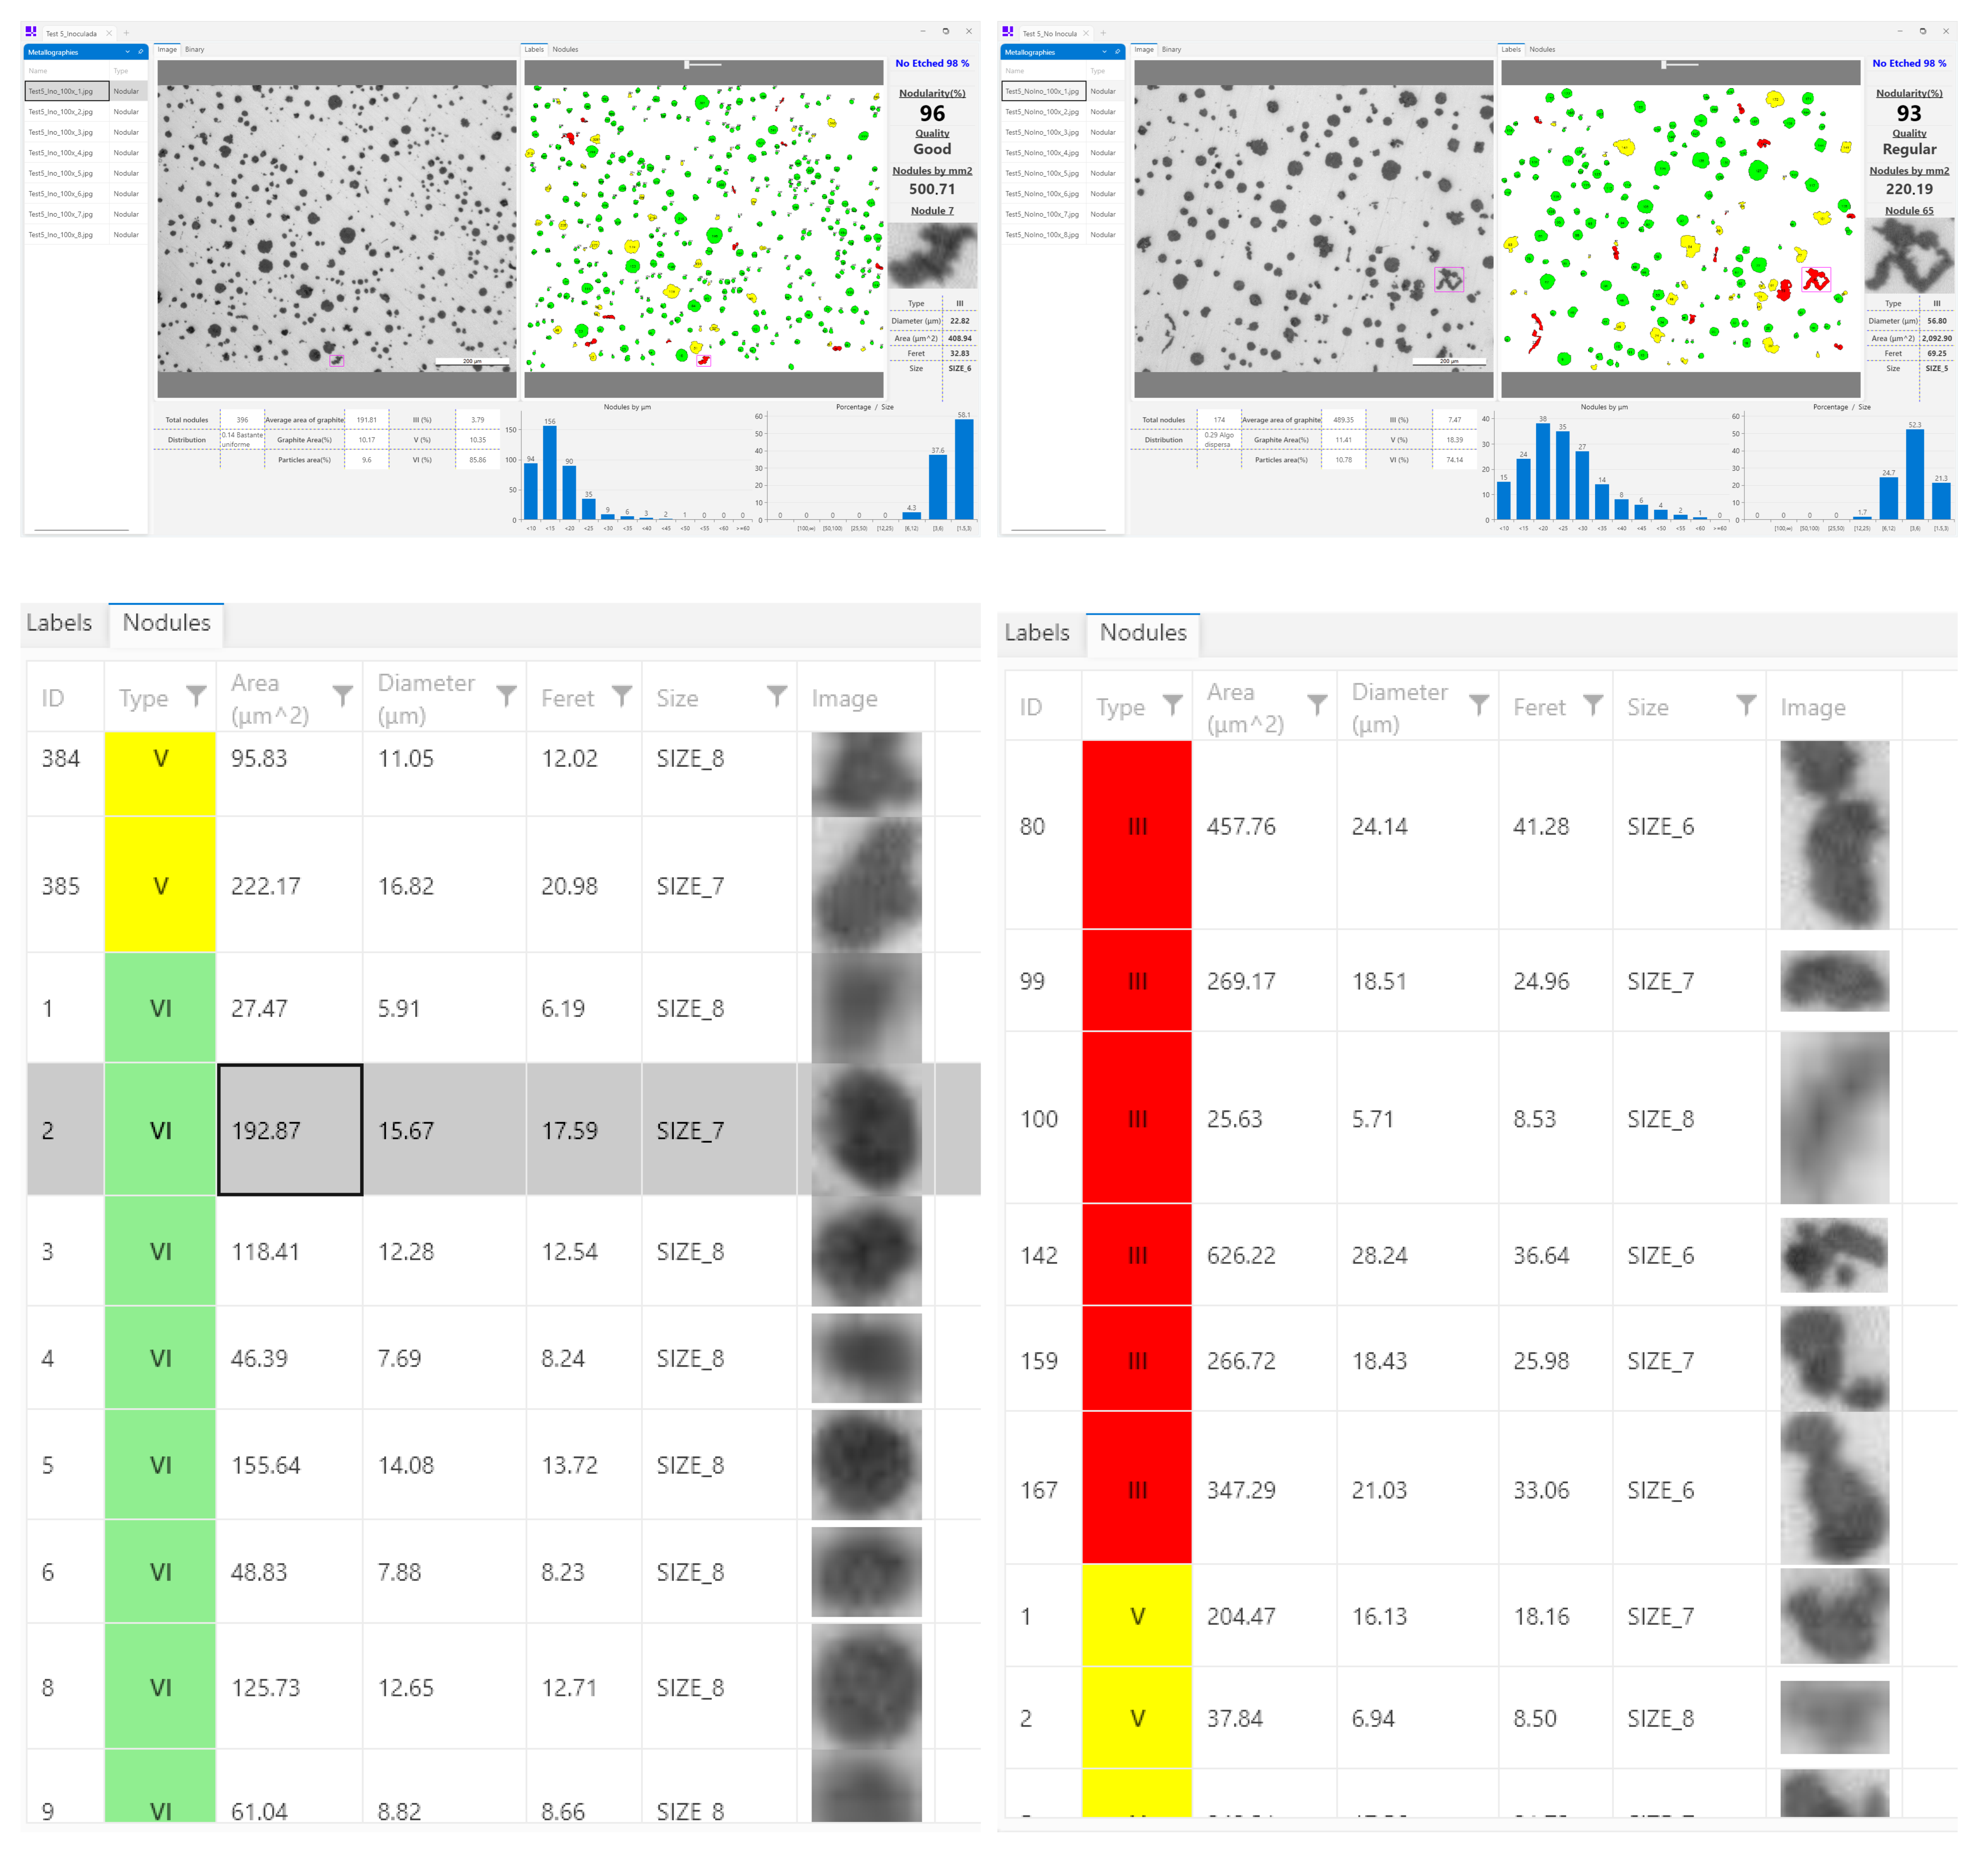

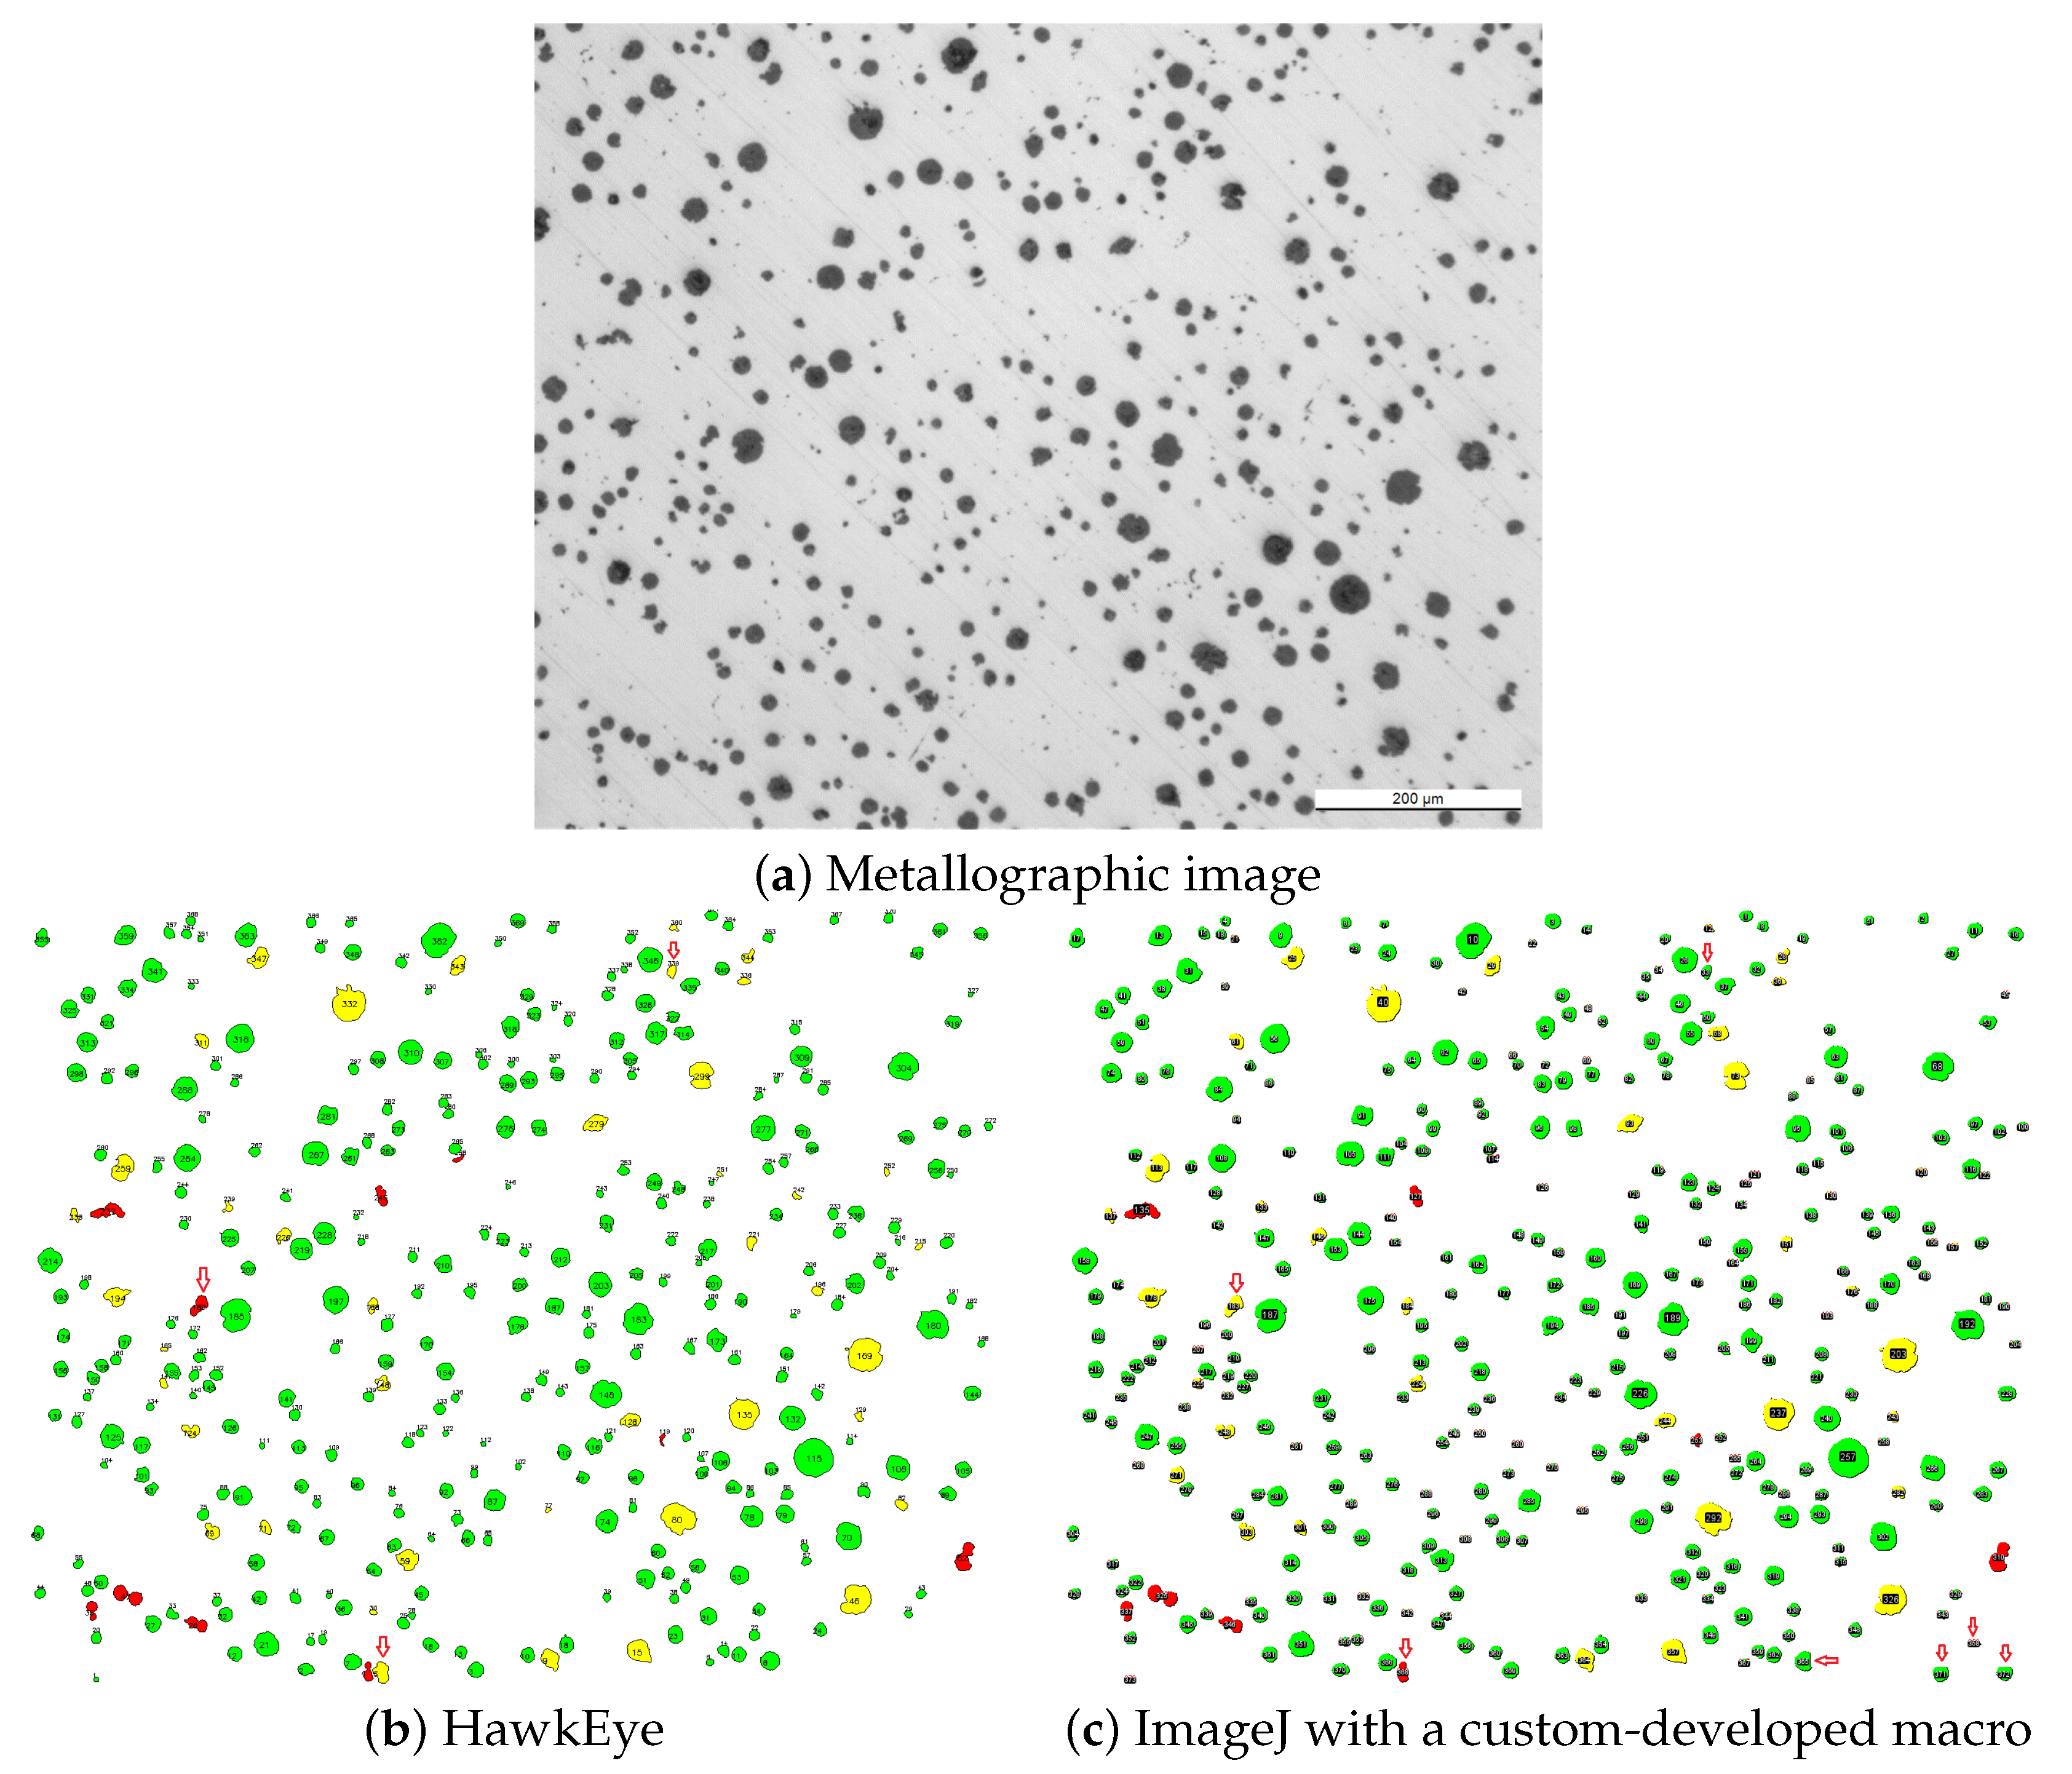
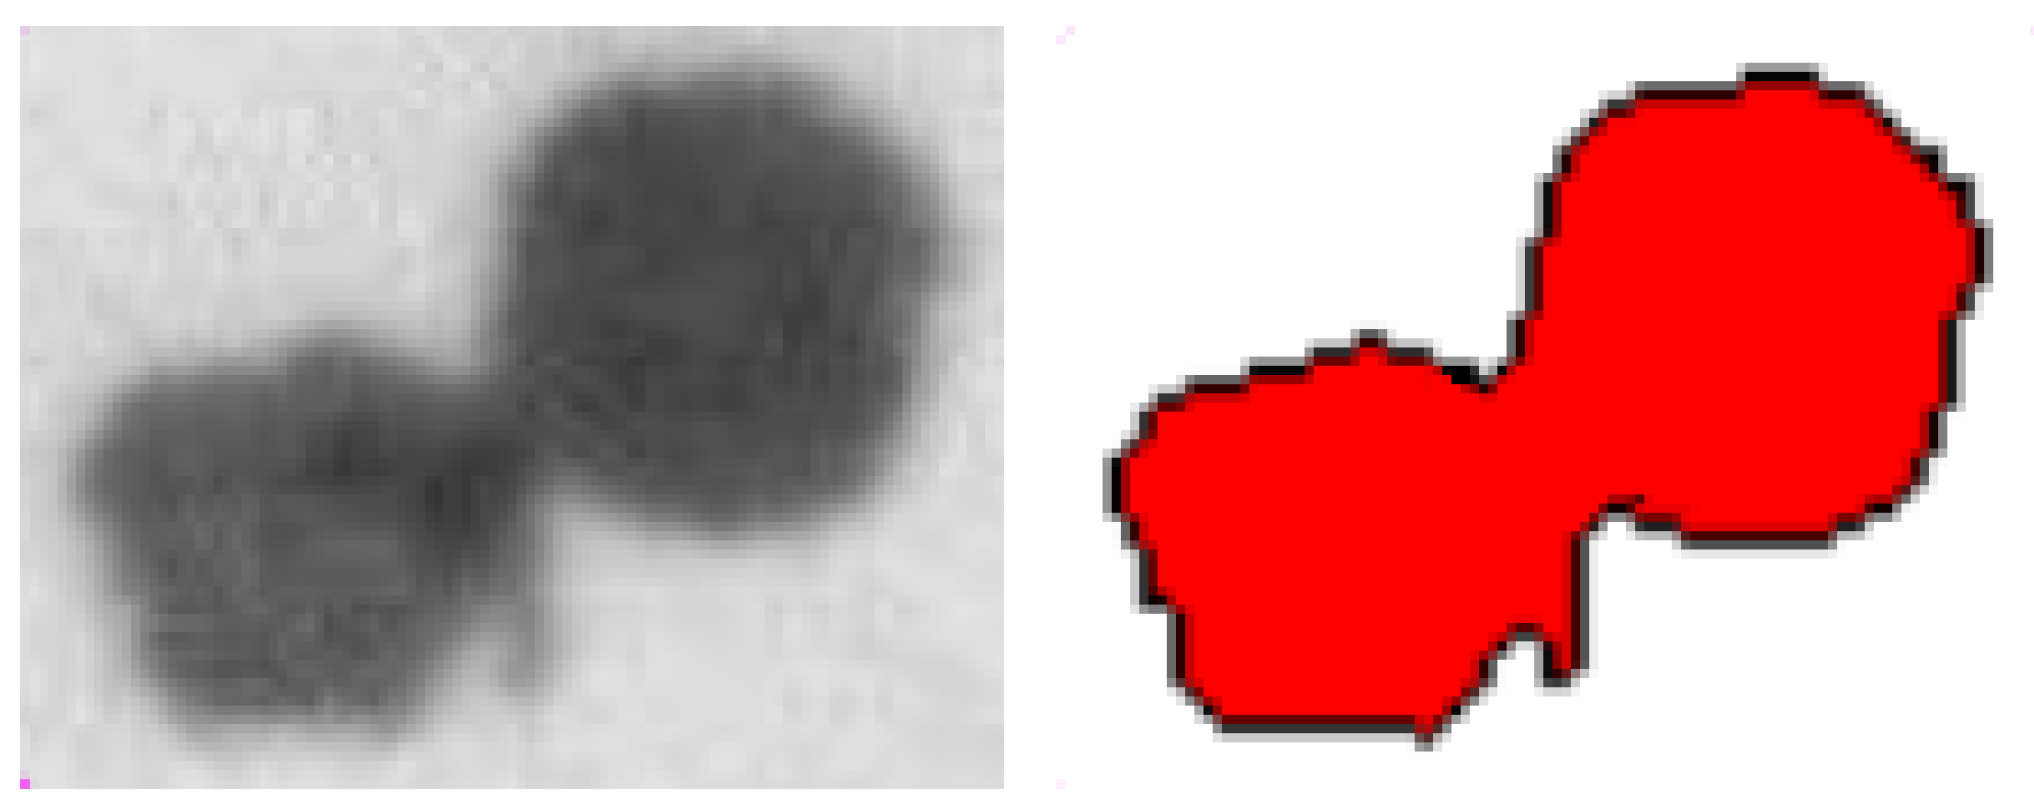
