Featured Application
The results of the presented research are directly applicable to enhancing the maintenance strategies of transmission system operator (TSO) assets, particularly high-voltage switchyard equipment, and are extendable to other TSO systems. Furthermore, the proposed methodology lays the groundwork for the implementation of predictive maintenance. This paper introduces a novel methodology for assessing the technical condition of high-voltage switchyard devices—specifically, circuit breakers, disconnectors, and instrument transformers—within a high-voltage switching bay. The proposed model integrates multiplicative criteria, which reflect maintenance actions, and additive criteria, which capture the operational and maintenance history of individual devices. Supported by a newly developed data model, the methodology enables an automated assessment process that generates a c-curve representing the condition trajectory of each device or device type. Leveraging real-time data from the maintenance information system, this automated approach allows for the timely evaluation of a device’s technical state prior to scheduled maintenance. The resulting c-curve analysis supports strategic maintenance planning and prioritization. The proposed solutions have been implemented experimentally by TSO ELES.
Abstract
This paper presents a novel method for assessing the technical condition of devices in the high-voltage (HV) switching bay of a substation, focusing on circuit breakers, disconnectors, and instrument transformers. These devices are typically maintained using a condition-based maintenance approach. The proposed method integrates data from individual maintenance tasks into a comprehensive assessment of each device’s technical condition. Traditionally, the technical condition and health index assessments rely solely on additive criteria. This study introduces an advanced assessment method that incorporates both additive and multiplicative criteria to enhance the prioritization of maintenance tasks. A data model is developed to extract the maintenance task data from device maintenance databases, enabling an automated assessment process. The proposed approach facilitates the generation of a c-curve throughout a device’s operational life. A comparison using real transmission system operator maintenance data demonstrates that the proposed method, which assesses device conditions using both additive and multiplicative criteria, outperforms the conventional approach that relies solely on additive criteria.
1. Introduction
A transmission system operator (TSO) is tasked with ensuring the efficient and reliable transmission of electrical energy across a power grid. To achieve this objective, the TSO must implement structured and effective maintenance strategies for equipment located within high-voltage (HV) substations. Proper maintenance is essential not only for preserving the reliability and availability of power system operations but also for extending the service life of substation components. This study focuses specifically on the maintenance of equipment within HV switchyards, which are organized systematically into HV switching bays (SBs). Each SB comprises primary components such as circuit breakers (CBs), disconnectors (Ds), and instrument transformers (ITs) [1]. Surge arresters may also be installed within SBs; however, their maintenance is beyond the scope of this investigation.
TSOs typically employ condition-based maintenance (CBM) strategies for HV switching bay equipment. Modern CBM practices rely on condition-monitoring systems to schedule maintenance activities based on the actual status of the devices [2]. Maintenance can be carried out either while the equipment remains in operation (online) or when it is de-energized and disconnected from the power system (offline). All primary devices within an HV SB—CBs, Ds, and ITs—are considered collectively in offline condition monitoring, as this approach requires isolating the entire bay, thereby enabling the simultaneous maintenance of all components. In cases of failure or malfunction, the system unit associated with the affected HV SB is disconnected, and corrective maintenance is carried out without delay. Within a TSO, CBM activities are executed strictly in accordance with the procedures specified in the Maintenance Code [3].
The Maintenance Code [3] establishes the framework for implementing maintenance actions based on manufacturers’ recommendations and the TSO’s accumulated operational experience. Any deficiencies or internal defects identified during inspections are addressed through corrective interventions in line with this protocol. This study concentrates on the maintenance of circuit breakers, disconnectors, and instrument transformers as the primary devices within HV switching bays.
The authors of [4,5,6,7,8,9,10,11,12,13,14,15] explore CBM strategies for circuit breaker maintenance. These authors discuss various partial monitoring tasks for circuit breakers and analyze measures for assessing the condition of these devices. However, none of these studies cover the entire scope of condition-monitoring tasks for circuit breakers comprehensively. The authors of [8] only address failure mode analysis for circuit breakers (CBs) and do not cover condition-monitoring tasks. They conducted a risk assessment based on failure mode analysis with failure probabilities. Moreover, the authors of [9] provide a general overview of asset management, including condition monitoring and health assessment. In the remaining studies, condition or risk assessment analyses for CBs were conducted based on individual maintenance tasks. The authors of [16] addressed the determination of failure rates for disconnectors, while the authors of [17] analyzed measures for assessing the state of transient resistances in HV disconnectors. The authors of [18,19] analyzed the condition monitoring of the disconnector mechanical operating mechanism. Finally, the authors of [20,21,22] examined the condition states of instrument transformers through condition-monitoring activities.
The primary objective of this study is to introduce a novel framework for assessing the technical condition of devices in an HV SB, specifically, CBs, Ds, and ITs. The conceptual basis for evaluating the technical condition of 400 kV substation equipment was first presented by the authors of [23], wherein the condition was calculated as a normalized sum of weighted additive criteria. This methodology was subsequently applied in practice by the authors of [24] to assess the condition of substation equipment. Furthermore, the authors of [6,9,12,14] proposed methodologies for determining the health index (HI) of CBs. These studies suggested that a device’s technical condition can be treated as an equivalent indicator of its HI. In particular, the HI assessment approach described in [9] aligns closely with the methodology outlined in [23]. Finally, condition-based maintenance strategies have also been extended to other components, such as power transformers and wind turbines, as explored by the authors of [25,26].
The main contribution of this study is the enhancement of the existing condition assessment concept for CBs, Ds, and ITs by integrating multiplicative criteria alongside additive ones. This new approach encompasses all condition-monitoring tasks. While prior studies [1,2,3,4,5,6,7,8,9,10,11,12,13,14,15,16,17,18,19,20,21] focused primarily on individual maintenance tasks, this study addresses the operating principles, failure modes, practical monitoring tasks, and comprehensive calculation of the technical condition. The technical condition forms the basis for broader health assessments. The implementation of optimized maintenance strategies lies beyond the scope of this research study.
According to the new assessment approach proposed in this study, the calculated condition value follows the maintenance priorities with the condition of the devices directly, emphasizing the detected deficiencies and penalizing the technical condition. Devices in poorer conditions are assigned higher urgency for intervention. Within the examined TSO, IBM Maximo serves as the central information system (IS) supporting condition-based preventive maintenance. This system manages and automates maintenance workflows, enabling the computerized evaluation of the technical condition. Consequently, this study presents a fully automated assessment of the device’s conditions based on the calculated technical condition of devices in the HV SB.
The primary innovations introduced in this study can be summarized as follows:
- A novel methodology for classifying deficiencies and internal defects (failure modes) in CBs, Ds, and ITs by severity levels.
- An enhanced device data model for calculating the technical condition that integrates multiplicative criteria—linked to failure mode severity and maintenance priorities—with additive criteria reflecting the operational history of the device.
- Integration of the new HV SB device data model with databases containing historical and operational data (related maintenance processes, the nature of device operation, and external influences on its operation) sourced from IBM Maximo, facilitating fully automated assessment across a device’s operational lifetime.
- Capability to track the progression of technical conditions over time dynamically, generating a time-series profile that highlights the effects of maintenance priorities and the current device state.
- A comparative analysis between the proposed data model and the existing model [23].
- A validation of the new model through a comparative evaluation of the technical condition results for the assessed devices, using both the newly proposed and existing models [23].
This manuscript consists of six sections. Section 2 describes the physical maintenance activities based on the device condition in the HV switchyards, which serves as input for the technical condition assessment using the new model. General information is also provided about the operation of the devices in the HV SB. Section 3 details the development of a new model for calculating the technical condition of the devices in the HV SB using multiplicative and additive criteria. The procedure for determining failure mode analysis as a result of the performed maintenance processes is presented, along with descriptions of the multiplicative and additive criteria. Section 4 introduces an upgrade to the developed general model for calculating the technical state. Based on the introduced data model, a general assessment procedure is developed that enables an automated and objectively independent process for calculating the technical condition of HV SB devices. Section 5 presents the results based on real-world data, including calculations of the technical condition for CBs, Ds, and ITs, along with a comparative analysis between the new and existing models. Section 6 concludes this manuscript and outlines directions for future research.
2. Current Status of the Preventive Condition-Based Maintenance of Devices in an HV Switching Bay
An HV SB device can operate in several states. Most of the time, it operates normally, serving the purpose for which it was installed. It can also be in a non-operational state. According to IEEE 859-2018 [27], the device state is defined as follows: “The component or unit state is a particular condition or status of a component or a unit, which is important for outage reporting statuses”. The state of a device depends on the state of its components. The operation of the device, including maintenance, according to its state in an HV SB is illustrated in Figure 1. The state of a device, as determined by condition assessment, can be either satisfactory or, at least, deficient. In a satisfactory state, no deficiencies or internal defects are detected. In a deficient state, either deficiencies or internal defects are identified. A deficiency indicates that the device can still operate with full or reduced functionality, albeit with a moderate risk of fault or failure. On the other hand, an internal defect signifies that a part of the device is not in perfect condition. Still, the device remains at least partially capable of performing its intended functions. The risk of fault or failure in this state is significant. The state of a device is influenced by internal (such as aging) and external factors (such as operational conditions). The following sections will discuss the deficiencies and internal defects in a deficient state, where variable DID (deficiency and/or internal defect) will be used in subsequent discussions.

Figure 1.
Illustration of device states in an HV switching bay.
If no deficiencies or internal defects are present, the device operates normally (normal operation). Even with detected deficiencies or internal damage, a device may remain in service if its performance remains acceptable. This is referred to as the operating state. During the device’s operation, the TSO can conduct planned events to assess the device’s condition or implement appropriate (repairing) corrective measures. However, detected or undetected deficiencies or internal defects may result in the failure of the device or its components. As defined by the authors of [28], failure is the loss of the ability to perform as required. Failure is an event that results in a fault, which is the resulting state. A fault occurs when a device transitions from a functional to a non-functional state, potentially due to an internal issue—such as an insulator breakdown resulting in a short circuit. Faults are categorized as technical, operational, and system faults. In the case of a fault, protection mechanisms are triggered, and the primary system unit containing the faulty device is disconnected. In the event of a failure, the system unit becomes unusable and is excluded from the power system, resulting in an unplanned event. In this case, according to the TSO protocol, an intervention follows where the state of the switched-off device is verified as a non-operational state. A device’s failure also necessitates maintenance, as the device is not performing its required function as planned.
The maintenance procedures in HV SBs include a standardized process for assessing the condition of HV SB devices, as illustrated in the flow chart in Figure 2. Since maintenance activities are performed uniformly across all device types (CBs, Ds, and ITs), the same procedure applies to each of them. The maintenance processes are categorized into substation inspections (SIs) (performed without shutdown); comprehensive inspections, also referred to as global checks (GCs) (performed with shutdown); and measurements (Ms) and tests (Ts). The following is a detailed explanation of the maintenance tasks for monitoring the condition of HV SBs. Determining a device’s condition requires the performance of tasks for assessing the condition of devices in an HV switching bay, as illustrated in the flow chart in Figure 2. Since the maintenance processes are carried out uniformly for all devices in the HV switching bay, the procedure shown in the diagram applies to all devices (circuit breakers, disconnectors, and instrument transformers). The maintenance processes are divided into inspections (without shutdown), comprehensive inspections (with shutdown), and measurements and tests.
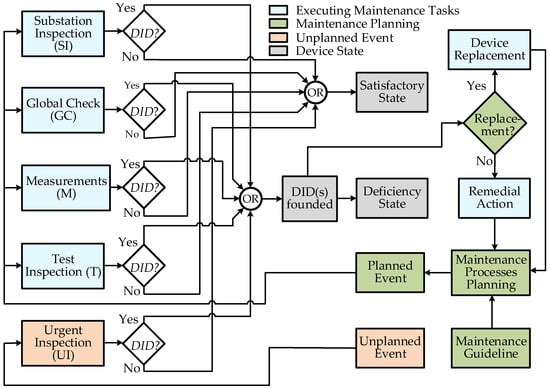
Figure 2.
Procedure for determining the status of devices in an HV switching bay for a TSO.
The devices in the substation and all HV SBs are inspected when inspecting the substation without shutting down the SB. The tasks during the inspection involve primarily determining the condition of the device or its components visually. These tasks include assessing the cleanliness of the components (mainly insulators); checking for mechanical deformation; identifying defects; and examining the condition of connections, screws, and connector joints. The specific tasks may vary between different devices. If no deficiencies or visible defects are detected, the current condition of the devices is considered satisfactory. When a comprehensive inspection (global check) involving the shutdown of the switching bay is planned according to the Maintenance Code [3] (Internal Maintenance Act), all scheduled tasks are carried out to determine the condition of the devices in the HV switching bay. These tasks include inspections and measurements/tests per the maintenance guidelines. The set tasks for a global check involve primarily assessing the device’s or its components’ condition when it is switched off. These tasks focus mainly on the condition of the terminals, HV connections, screws, connector joints, and supporting structures and the adequacy of the insulators and flanges.
For CBs, the condition of the drive mechanism components, the operation of the heaters and ventilation within the drive box, and the SF6 gas pressure are also inspected. In addition to the general tasks, an inspection of the drive mechanism components, contact blades, and jaws is conducted for Ds. The operation of the heaters in the drive box is also checked, similarly to CBs. In addition to general tasks such as sealing, the condition of the primary and secondary connections and the position of the membrane are inspected for ITs. A device’s current condition is deemed satisfactory if no deficiencies are found during these inspections. An overhaul and careful, comprehensive inspection are performed for both CDs and Ds.
Regular diagnostics must be performed to monitor and determine the condition of the devices. This process is based on the magnitude of the typical parameters or the trend in the changes in the parameters of individual HV devices. These parameters are captured through measurements, which are usually performed in the switch-off state, i.e., during a global check. For devices in the HV SB, an extensive set of measurements is conducted: transient resistances of HV current paths and connection terminals (Ds); inherent times and simultaneity of contact switching (CBs); grounding resistances; electrical properties of the insulation system; and the electrical, chemical, and physical properties of the transformer oil. All measurements are performed according to the specified tasks outlined in the maintenance guidelines. A special measurement type, not attributed to any specific device in the HV SB, is the diagnostic measurement with a thermographic camera for thermal imaging. If the measurements indicate that the parameters are within the predefined tolerance limits, the device’s current condition is considered satisfactory.
In addition to measurements, tests are an essential component of diagnostics in determining the condition of the devices. A comprehensive set of tests is performed for devices in the HV SB, including tests of the functional operation of switching manipulations (Ds and CBs); tests of the operation of control, protection, alarm, and position signaling systems; and interlocks. The same procedure is also followed for the measurements and tests, which must meet predetermined criteria. If the devices meet these criteria, their current condition is considered satisfactory. If an unplanned event occurs in the power system involving a device in the HV SB, an urgent inspection (UI) is conducted immediately after the event. However, the unplanned event can also be caused by a device in the HV SB. This issue is addressed through corrective maintenance. Corrective (repair) maintenance is performed after a fault is detected to restore the device to a state in which it can perform its required function. The operation is carried out with the device or line switched off, and it can be categorized as immediate corrective maintenance—performed as soon as the fault occurs—and deferred corrective maintenance—carried out when feasible. If these condition assessment tasks reveal a deficiency or internal defect, a deadline is set for rectifying the defect (immediately, within one week, within three months, or within a year). Then, the device’s condition is considered deficient, and the deficiency or internal defect must be addressed within the specified deadline. A device replacement procedure must be initiated if any condition assessment task reveals internal damage that renders the device inoperable.
3. New Concept for Assessing the Technical Condition of HV Switching Bay Devices
The groundwork for the new concept is proposed by the authors of [23]. The procedure for determining the technical condition of devices in a 400 kV switchyard is discussed by the authors of [23]. The device’s condition is defined as a state indicator. The technical condition of the device, denoted as c, is calculated using the internal script in MS Access, which is connected to the technical database in IBM Maximo IS. This database contains a set of criteria with corresponding weighting factors u (ranging from 1 to 10) and evaluation factors o (ranging from 1, indicating good, to 10, indicating bad). The weighting factor uj is determined based on the role and importance of criterion j for the type of device installed in the transmission system. The evaluation factors oj for each criterion are determined by the engineer responsible for supervising the individual transmission substation. The condition of the device c is calculated using (1), which represents the sum of the normalized weighting units of the criteria.
Equation (1) provides an overview of the condition of devices for each HV device in the substation. A lower value of c indicates a better condition of the device, while a higher value of c indicates a worse condition. The total value of condition c is normalized on a scale from 1 (good) to 100 (bad). A manual grade input is required to assess the device’s technical condition, making the evaluation inherently subjective. The criteria are developed most thoroughly for calculating the technical condition of CBs. The model in Equation (1) was developed for the RCM diagram, where a smaller creation percent means a better partial condition, and vice versa. The better partial condition of the criteria is reflected in lower grades, and vice versa.
Based on Equation (1), which represents the existing concept, a new approach for calculating the technical condition of devices in an HV SB is introduced using (2). This new concept primarily targets the key components in an HV SB, such as CBs, Ds, and ITs. The maintenance tasks used to monitor and evaluate the condition of these devices are reviewed in Section 2. For each device, these tasks determine whether the condition is satisfactory (i.e., no deficiencies or internal defects (DIDs) are detected) or deficient (DIDs are detected). All the maintenance activities described in Section 2 are integrated into the new concept for assessing a device’s technical condition, as outlined using (2).
The new concept for calculating device condition (2) is designed such that a higher value indicates a better overall condition, and vice versa. The value of assessment is the same as for the health index. In this manner, a better particular criterion grade reflects a better partial condition for the partial criterion CRj. This is the exact opposite of the existing concept (1), where a lower value signifies a better technical condition. The inversion in the new approach stems from the mathematical use of a limit sequence involving powers of 1/2. This sequence is used to reflect maintenance prioritization, where lower numerical values correspond to a poorer technical condition and, consequently, a higher maintenance priority. More details are provided later in this manuscript. In Equation (2), the first term (in parentheses) represents the multiplicative criteria, with a maximum value of 0.5, while the second term (also in parentheses) represents the additive criteria, with a maximum value of 2.
In Equation (2), the counter i is assumed to be a negative integer i = −1, −2,…, −N. The product of N terms represents the combined effect of the multiplicative grades of N multiplicative criteria. GCRi denotes the selected grade of the ith multiplicative criterion CRi. These multiplicative criteria are entirely dependent on the presence of detected DIDs. The lowest grade among them is used if multiple DIDs are identified during the maintenance process. These multiplicative criteria reflect the current state of the device associated with the detected DIDs.
On the other hand, the additive criteria grading GCR1 through GCRM represent the device’s operational history. GCRj represents the selected grade of the jth additive criterion CRj, where j = 1, 2, …, M, and M is the total number of selected additive criteria. Each selected additive grade GCRj is multiplied by the corresponding weight wj for criterion CRj. This structure corresponds to the algorithm in Equation (2). The grades of all the additive criteria are normalized by the sum of the maximum possible grades for those criteria, each multiplied by their associated weight wj. The multiplicative criterion estimates (represented by the first term in parentheses in (2)) contribute 50% to the overall condition estimate, while the additive criteria (the second term in parentheses in (2)) contribute the remaining 50%. The result of evaluating the technical condition of the selected HV SB is a scalar value c, with the highest value of 1 representing the best possible condition and the lowest value of 0 representing the worst condition. A uniform estimate of GCRi and GCRj is selected for each selected criterion CRi and CRj. The new concept for the condition assessment of the HV SB is designed to function as a fully automated process, updating after each maintenance task to reflect the current condition. This enables the creation of a condition database for each device, supporting visualizations such as time-based condition trends or sequence diagrams (c-curve). It is evident that the maximum possible value of (2) is 1 and the minimum is 0.
A new faultless device can have a calculated value of 1, while a value of 0 indicates that the device’s condition is in such a state that its operation is no longer possible, necessitating replacement. The multiplicative factor enhances the linear concept, which was previously solely determined using additive criteria. The following sections introduce the concept of classifying the DIDs of HV SB components (CBs, Ds, and ITs). In the new concept, the detected DIDs are directly used to calculate the estimates of the multiplicative criteria. In contrast, the existing concept described using (1) incorporates the results of maintenance activities indirectly within certain additive criteria.
3.1. Data Preprocessing: Methodology for Classifying DIDs in HV Switching Bay Devices
Section 2 discusses the maintenance tasks (SI, GC, M, T, and UI, as shown in Figure 2) for devices in the HV SB (CB, D, and IT) aimed at detecting possible DIDs. All maintenance activities, including the identification of DIDs, are recorded in the IBM Maximo IS. Over the years, an extensive set of DIDs has been compiled in TSO ELES, which are of such a nature that the device could continue to operate without failure or faults. A detailed analysis was conducted of these DIDs. Based on the research carried out by the authors of [8], a suitable and meaningful classification of DIDs into groups was developed for each element of the HV SB (CB, D, and IT). A detected DID can affect the potential occurrence of a future failure or fault in the device’s primary circuit parts (electrical subsystem—E), mechanical parts (mechanical subsystem—M), the dielectric properties of the devices (insulation subsystem—I), and the auxiliary parts of the devices (auxiliary subsystem—A). Based on detailed analyses, the general form of the defect and internal damage of the HV SB device can be expressed as , where el ∈ {CB, D, IT}, i, j ∈ ℕ, and k ∈ {E, M, I, A}.
The first group of DIDs pertains to deficiencies or internal defects occurring in parts of the primary circuit, which could result in the failure or internal fault of the primary circuit (k = E). These include poor connections relative to HV connections and primary contacts. The second group of DIDs relates to deficiencies or internal defects in the mechanics of the drives, which could result in mechanical failure or mechanical faults (k = M). These include internal defects associated with the actuating system, drive, and drive/control box. This group also includes the mechanical defects of post-insulators. The third group of DIDs pertains to defects in the dielectric properties of the insulating medium (k = I). This group includes primarily insulator damage and the deteriorated dielectric properties of the insulating medium (SF6 or oil). The fourth group of DIDs relates to deficiencies in the auxiliary systems of the devices (k = A). These include grounding systems, supporting structures, and devices related to control and signaling.
Each deficiency or internal defect in the database is described briefly using an indicator. Based on the analysis, tasks are assigned for each DID, specifying the type of DID discovered (SI, GC, M, and T) and identifying a probable initial cause (IC) for its occurrence. Remedial action is also determined to eliminate the DID. The most critical aspect of the DID classification is the rate of deficiency or internal defect (RDID). Each DID is categorized into one of three levels, . Minor deficiencies are assigned an RDID level of 1. Significant deficiencies and minor internal defects are assigned an RDID level of 2. Major internal defects are assigned an RDID level of 3. The levels for each individual are defined based on the Maintenance Code rules for the maximum period of time for remedial action and the analyses of DIDs. The maximum deadline for eliminating deficiencies or internal defects is closely related to their assigned level. For RDID = 1, the maximum agreed deadline for dispatch (DFD) is 1 year, expressed as DFD (RDID = 1) = 1 year. For RDID = 2, the maximum agreed deadline for dispatch is 3 months, expressed as DFD (RDID = 2) = 3 months. For RDID = 3, the maximum agreed deadline for dispatch is 1 week, often requiring immediate action, and it is expressed as DFD (RDID = 3) = 1 week.
This comprehensive methodological approach for classifying deficiencies and internal defects facilitates the creation of a database of the deficiencies and internal defects within a TSO. It enables the statistical analysis of DID occurrences. For the new concept of calculating the technical condition, the basic data for the multiplicative criteria are the rates of deficiencies and internal defects. The following sections present the classification concept for CBs, Ds, and ITs.
3.1.1. Classification of the Deficiencies and Internal Defects of a Circuit Breaker
Table 1 contains a comprehensive list of all the deficiencies and internal defects recorded over the past 20 years within TSO ELES. Electrical measurements are conducted under the assumptions of the standard [29]. The voltage level and the type of circuit breaker determine the measurement limits. For DIDs related to dielectric properties, issues are considered associated with the insulation medium (SF6 or oil). Each circuit breaker utilizes only one type of insulation medium. For deficiencies related to auxiliary systems, a series of tests and measurements are performed, focusing on signaling, functional operation, control, and protection (trip coils).

Table 1.
Methodology for classifying the deficiencies and internal defects of a circuit breaker.
3.1.2. Classification of the Deficiencies and Internal Defects of a Disconnector
The deficiencies and internal defects of the disconnector were collected and classified similarly to the circuit breaker. Table 2 presents a comprehensive set of deficiencies and internal defects for the disconnector. The grounding blades (DID3E) are considered a unique feature for deficiencies and internal defects related to the primary circuit. For faults associated with the disconnector mechanics, the distinctive feature is the treatment of internal damage to the disconnector arm (DID4M).
Table 2.
Methodology for classifying the deficiencies and internal defects of disconnectors.
3.1.3. Classification of the Deficiencies and Internal Defects of an Instrument Transformer
The deficiencies and internal defects of the instrument transformer were collected and classified similarly to the circuit breaker and disconnector. Table 3 provides a comprehensive overview of all identified deficiencies and internal defects associated with instrument transformers.
Table 3.
Methodology for classifying the deficiencies and internal defects of an instrument transformer.
The membrane (oil level indicator) and its associated internal defects (DID2I) are considered for DIDs related to the dielectric properties of the instrument transformer’s insulators. A column for the requirements of the immediate replacement of the instrument transformer (RPL) is added to Table 3. This column is used in conjunction with the DID level to determine the multiplicative criterion grade.
3.2. A New Concept for Calculating the Technical Condition of a Circuit Breaker
The criteria for calculating the technical condition c for the CB were defined based on (2). One multiplicative criterion, CR−1 (with N = 1 and i ∈ {−1}), was selected, and nine additive criteria (with M = 9 and j ∈ {1,2,…,9}) were used. The set of additive criteria is denoted as CRad = {CR1, CR2, …, CR9}.
3.2.1. The Multiplicative Criterion for Circuit Breaker CR−1
The multiplicative criterion CR−1 is considered, which depends entirely on the detected current deficiencies and internal defects. The calculation of the technical condition of the circuit breaker is influenced by the GCR−1 rating. The number of detected deficiencies and internal defects (NDID) is defined to determine the partial multiplicative grade. The size of detected deficiencies and internal defects (SDID) is also specified. Let us assume that this variable has four values, SDID ∈ {1,2,3,4}. If multiple deficiencies or internal defects of the circuit breaker are detected simultaneously, a set of deficiencies and internal defects (SETDID) is defined, with a range of NDID. The content of the set that includes any level of RDID from Table 1 is defined using . If no deficiencies or internal defects are detected, SETDID is an empty set, SETDID = {}, and the set range is NDID = 0.
The SDID value is set to 4 (SDID = 4), and the final rating is determined uniformly as GCR−1 = 0.5. If one or more deficiencies or internal defects are detected, the SDID is defined as the maximum rate of RDID within the set SETDID, which is expressed as SDID = max(SETDID). The rating is then determined using Equation (3).
A circuit breaker replacement is required if the circuit breaker experiences failure related to a fault, if an unplanned event and urgent inspection are identified to be a fault of such severity that operation is no longer possible, or if the inspections determine that the level of internal defects is such that operation is no longer feasible or economically justified. In this case, the attribute RPL = 1 is set, SDID = 0 is set, and the final grade is determined uniformly as GCR−1 = 0. There is no direct requirement to replace circuit breakers to classify deficiencies and internal defects in the measures. Figure 3 shows a flow chart that outlines the general procedure for determining the grade of the multiplicative criterion GCR−1.
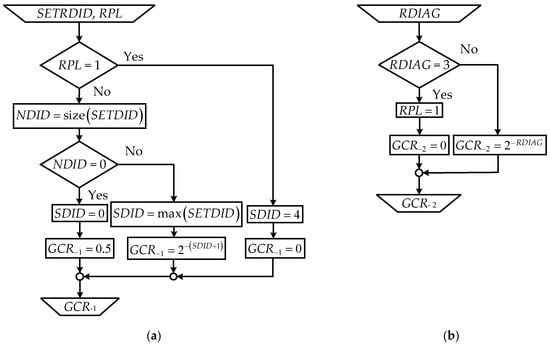
Figure 3.
(a) General flow chart for calculating the multiplicative criterion grade GCR−1 for a circuit breaker, disconnector, and instrument transformer; (b) general flow chart for calculating the grade (GCR−2) for multiplicative criterion CR−2 for an instrument transformer.
3.2.2. Additive Criteria for Calculating the Technical Condition of a Circuit Breaker
Table 4 presents the concept of nine additive criteria encompassing a CB’s operating history. Criterion CR1 is related to the total number of all deficiencies and internal defects detected in the CB throughout its entire operating period. The cumulative number includes all types and levels of defects, except those that render the CB inoperable. It is understood that the state returns to its previous value after remedial action. However, in the new concept, as the deficiencies and internal defects are eliminated, the state is no longer the same as prior to the remedial action. The weight of this criterion is medium, with w1 = 4. The grades are distributed discretely. Criterion CR2 is related to the total number of detected DIDs on the CB throughout its entire service lifetime. Sometimes, a specific type of DID may be detected more than once during the CB’s service lifetime. This criterion penalizes such occurrences. The criterion is divided into four categories, with increasing repetitions of the same type of DIDs resulting in a decrease in grades. The weight of this criterion is medium, at w2 = 4. Criterion CR3 is related to the total number of DIDs detected in the CB throughout its entire operating period. DIDs detected and eliminated in the distant past have a smaller impact on the condition of the CB than those detected more recently. The criterion is divided into four categories, with older detected DIDs receiving a higher grade for this criterion. The weight of this criterion is medium, w3 = 4. Criterion CR4 is related to weather and environmental influences. The effects of wind (such as pollen deposition on the CB insulators) and the contamination of the insulators are not necessarily covered by detected deficiencies, which affects the subsequent cleaning of the insulators. The probability of wind and contamination influences can be determined in advance for each substation location by classifying the location into one of four categories (each substation has a different grade). This classification determines the category grade of the criterion, which does not change. The influence on the final grade is small; the agreed weight is w4 = 2. The grade of this criterion is determined, and it aligns with expert judgment.
Table 4.
The concept of determining the grades of additive criteria for a circuit breaker, disconnector, and instrument transformer.
Criterion CR5 is the most essential criterion among the set of criteria from CR1 to CR9. The in-service time of a CB is known and tied to its location. A partial grade can be determined from these data. This grade may indicate undetected hidden deficiencies and internal defects that are indirectly related to age (e.g., mechanical fatigue of the material). The grade value of a CB at an age within this range is calculated using linear interpolation with fixed discrete grades. The weight of this criterion is the highest at w5 = 8, indicating that age will have the most significant relative influence on the final grade of the additive criterion for the CB condition, as undetected DIDs are included in the aging process. Criterion CR6 considers the influence of the short-circuit (SC) current during switching operations on the system unit to which the CB belongs in the overall assessment of the BC’s condition. If the system unit is an overhead line unit, the number of such events can be represented by the number of automatic reconnections. The input data for this criterion are the total number of these events in the previous year. The criterion is divided into three categories. An increase in the number of these events can deteriorate the condition of the HV chamber significantly. This partial assessment thus monitors data on the condition of the HV chamber. These switching operations are included in the CB’s total quota of switching operations. Successful and unsuccessful automatic reconnections relative to the phase are counted in the number of switching operations. The weight of this criterion is medium, at w6 = 4. Criterion CR7 depends on the number of switching manipulations performed under normal operating conditions during the last year under consideration. This criterion is related to the switching manipulations of the CB during planned events, and is divided into three categories. The evaluation of this criterion is associated with the condition of the HV chamber. According to the standard [27], a CB’s switching manipulations can reach up to 1000 during its service lifetime (the manufacturer provides the actual number). However, this number also has a specific influence on the condition of the HV chamber. The weight of this criterion is low at w7 = 2.
Criterion CR8 is related to the number of switching manipulations of the circuit breaker during tests, measurements, and protection testing in a de-energized state. The number of these switching manipulations in the past year can be obtained indirectly via the status of the switching manipulation counter, from which the input data for criteria CR6 and CR7 are subtracted. This criterion (CR8) is divided into three categories, as shown in Table 4. The partial grade for this criterion is related to the condition of the CB drive. The weight of this criterion is low, with an agreed weight of w8 = 2. Criterion CR9 is also related to planning remedial actions for deficiencies and internal defects. By assessing this criterion, the overall grade of the CB’s condition can be reduced slightly. Each circuit breaker manufacturer has a predefined category for this criterion and the associated assessment. The weight of this criterion is medium, at w9 = 4. The grade of this criterion is determined, and it aligns with expert judgment. Manual entry is possible; however, this study demonstrates the automated calculation procedure below.
3.3. A New Concept for Calculating the Technical Condition of a Disconnector
The criteria for calculating the technical condition c of the D were introduced based on Equation (2). A single multiplicative criterion, CR−1, was defined, identical to that used for the CB. Additionally, seven additive criteria were selected (with M = 7 and j ∈ {1, 2, …, 7}). The additive criteria set is CRad = {CR1, CR2, …, CR7}. The urgency of remedial action for the D, as evaluated using criterion CR−1, is in the same manner as the grade GCR−1 for the CB. The levels of potential DIDs in the D are detailed in Table 2. The flow chart for determining the partial GCR−1 rating follows the procedure outlined in Figure 3. The concept of the seven additive criteria covering the operating history of the D is shown in Table 4. Criteria CR1 to CR4 are determined using the same procedure as described for the CB. Criterion CR5—the operating time in years—is the most critical additive criterion for the disconnector. Its grade GCR5 is determined using a procedure similar to that used for the CB, with the main difference being that this criterion is divided into more categories for the D than for the CB. Criterion CR6—a disconnector function—addresses the function or role of the disconnector in the switchyard. The criterion is divided into busbar Ds and other types of Ds (transmission and earthing). Busbar Ds have many more close–open operations than Ds for other purposes, resulting in a lower grade. The function of the D is predetermined and does not change during its operation. The weight of this criterion is w6 = 4. Criterion CR7 addresses whether spare parts are available from a specific manufacturer in the warehouse for a particular D. If they are unavailable, it is necessary to determine whether spare parts will be available in less or more than 14 days. The criterion is divided into three categories, with corresponding decreasing grades. These category grade values are predetermined and related to spare parts supplied to emergency storage facilities. The impact on the final grade is medium: w7 = 4. The grade of this criterion is determined, and it aligns with expert judgment.
3.4. A New Concept for Calculating the Technical Condition of an Instrument Transformer
The criteria for calculating the technical condition c for the IT were introduced based on Equation (2). Two multiplicative criteria were selected (with N = 2 and i ∈ {−1, −2}), forming the set of multiplicative criteria CRmul = {CR−1, CR−2}. Similarly, five additive criteria were introduced with M = 5 and j ∈ {1, 2, …, 5}, forming the set CRad = {CR1, CR2, …, CR5}. This procedure applies equally to voltage, current, and combined ITs.
Multiplicative Criteria for Instrument Transformers
Criterion CR−1 was evaluated using the same approach as for determining the GCR−1 rating of a CB. The levels of possible deficiencies and internal defects (DIDs) in ITs are listed in Table 3. The flow chart for determining the partial grade GCR−1 follows the procedure outlined in Figure 3b. The assessment of the multiplicative criterion CR−2 was determined according to the procedure presented in Figure 4. This criterion evaluates the results of the current diagnostics of the IT, which includes electrical measurements of insulation resistances, measurements of electrical properties (insulation resistance and polarization factor), and tests of the transformer oil (electrical withstand tests of oil and dielectric losses), as shown in Table 3. The electrical measurements are performed based on the standard [30]. Thus, we capture the defects and . These two types of DIDs are excluded from the analysis for criterion CR−1. The diagnostic results of the IT are divided into four categories. The variable-rate diagnostic, RDIAG ∈ {0, 1, 2, 3}, was created, which also comprised the input data for calculating the GCR−2 assessment for the multiplicative criterion CR−2.
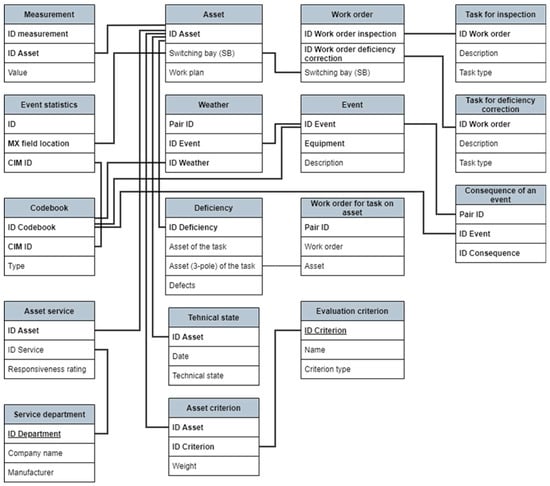
Figure 4.
Entity diagram of the data used in calculating the technical condition of assets.
All measurements and tests must be rated on a scale from 1 to 5. When all grades are the highest (5), RDIAG = 0 is set, and the diagnostic results are within acceptable limits. If ratings of 3 or 4 appear, RDIAG = 1 is set. The IT should be monitored, the diagnostic interval should be shortened, and repeated measurements should be conducted. If a grade of 2 appears, RDIAG = 2 is set. The IT should be replaced within a specified period. Any rating of 1 necessitates the immediate replacement of the IT. In this case, the replacement is set as RPL = 1, and the final rating is set as GCR−2 = 0. Figure 3b shows the general process flow for determining the GCR−2 rating for the IT, and it illustrates the general process flow for determining the GCR−2 rating for the IT. Table 4 presents the calculations of the grades for additive criteria from GCR1 to GCR5. The procedure for all five criteria is equivalent to the process used for calculating the grades for the additive criteria for the D.
4. Automated Process for Calculating the Technical Conditions of Devices in an HV Switching Bay
The new model, presented as a flow chart in Figure 3a,b for multiplicative criteria and in Table 4 for additive criteria, covers CBs, Ds, and ITs. It yields a specific value representing the condition indicator. This section outlines a procedure for calculating the technical condition of a device over its lifetime. The use of an IS to manage the maintenance process of HV SB devices is essential to introduce an automated process for assessing technical conditions. To support this, a data model was developed that integrates databases from the comprehensive maintenance process, facilitating the calculation of the technical condition for individual HV SB devices, as well as for specific groups of devices. A generalized procedure for classifying related devices is provided, along with a method for calculating the technical condition of a group of devices over their operational lifetime. These procedures form the foundation for condition evaluation and subsequent analysis. Accurate information on the maintenance processes within the IS is essential for implementing reliable health assessments fully. In this study, IBM Maximo is employed as the IS platform.
4.1. Data Model for Calculating the Technical Conditions of Devices in an HV SB
The data model connects all IS databases that are populated during maintenance processes. Each database represents a specific entity. The entities in Figure 4 calculate the technical conditions based on the previously presented criteria. The entities are described according to their usage for the criteria’s evaluation. All mentioned criteria utilize the following entities: the evaluation criterion, the asset criterion, and the technical state. The evaluation criterion stores information about the criteria used to calculate the technical state. The asset criterion contains the weight of a specific criterion used for a particular asset. The technical state stores the calculated value of the technical state of an asset using all its asset criteria. Criteria CR-1, CR1, CR2, and CR3 utilize the Asset and Deficiency entities. The Asset is the central entity of the data model, and it collects various data regarding assets, such as their description, type, production year, manufacturer, voltage level, location, etc. The Deficiency refers to a maintenance task for condition assessment defined in IBM Maximo IS. The set of values for the deficiency or internal defect (problem), cause, and resolution is predefined, and it has a finite number of unique values.
Criterion C-2, which is used exclusively for ITs, utilizes the entity Measurements. This entity provides data on the diagnostic measurements of the transformer oil properties in measuring transformers and the electrical measurements of the insulating system properties of ITs. Criterion C4 uses the entity Weather to link events with weather conditions, indicating the weather during unplanned events. As described previously, the other entity used is Asset. Criterion C5 uses only the entity Asset for all devices. Criterion C6 for CBs uses the entity Event, which records information about unplanned events in the power grid, and Event statistics, which connect events with the affected assets. The consequence of an event stores the potential failure modes of a device affected by the event that are relevant to the technical state. Another entity used is the Codebook, which links codes with the corresponding codebooks. It contains unique identifiers for the types of codebooks and their entries, allowing access to data on the actual values of the codes. The final entity used is Asset. Criterion C7, for CBs, uses the entity Work Order, which contains data about work orders intended for equipment inspections and deficiency remediation. It has two primary keys to connect with entities. The Work Order for the Task on an asset connects the affected assets with the work order and the tasks that can be implemented on the assets within this workforce. The next entity is the Inspection task, which contains data about tasks that must be performed during an inspection without disconnecting the HV SB. Weather links provide information about the weather conditions during unplanned events. The following entity is Task for Deficiency Correction, which contains data about the tasks performed when remediating deficiencies. The last entity used is Event and its related entities, as described previously. Criterion C8 uses the entity Work Order for Tasks on assets, as described previously. Criterion C7 for Ds and C9 for CBs use the entity Asset’s service, a logbook of services performed on an asset. When a service is completed on equipment, the Asset receives a responsiveness rating, indicating its condition. The other entity is the Service Department, which contains data about companies that perform services on specific assets and the previously described Asset. The quality analysis of the input data was implemented, but a detailed explanation is beyond the scope of this study. A quality analysis was implemented of the input data. The limitation of the data model is the data collection period for devices older than 20 years. Older work orders need to be digitized in order to be used in the model.
4.2. Classification of HV Switching Bay Devices
A TSO maintains and operates numerous CBs, Ds, and ITs. These devices are organized into HV SBs within substations. A set of elements (devices) in the SBs is defined as SELSB. The set SELSB includes CBs, Ds, and ITs: SELSB = {SCB, SD, SIT}. The Maintenance Code [3] specifies the scope of identical maintenance tasks for each type of CB. A subset of NCB CBs was formerly known as SCBl; l = 1, …, NCB. It is assumed that each subset is SCBl ⊂ SCB. The Maintenance Code [3] only defines one type of D. However, this study categorizes Ds into two subtypes: busbar Ds (SC1) and other CBs (SC2). Busbar Ds undergo significantly more close–open operations than other types. For ITs, three subtypes were created: voltage IT (SITV), current IT (SITC), and combined IT (SITCOMB). Based on these assumptions, the set of devices in the HV SB can be defined as SELSB = {SCB1, …, SCBl, …, SCBNCB, SD1, SD2, SITV, SITC, SITCOMB} = {SELSBj}, where j = 1, …, NSB. NSB represents the set of all subtypes of devices in the SB, and it is determined by the TSO policy.
4.3. General Calculation of the Technical Condition of HV SB Devices
Section 3 presents the proposed comprehensive model for assessing the technical condition of three primary HV SB devices in the switchyard: CBs, Ds, and ITs. This model employs both multiplicative and additive criteria. The general model, as expressed in (2), provides a scalar solution representing the condition of a specific device. Section 4 introduces a data model designed to retrieve data for the multiplicative and additive criteria from any HV SB device’s operation and maintenance records throughout its operational lifetime. This methodology enables the assessment of the technical condition at any point during the device’s operating lifetime. The resulting curve, termed the c-curve, illustrates the technical condition from the installation date to the present. Using the data model, the procedure for assessing the technical condition can be extended to encompass all devices of a particular subtype. Figure 5 depicts a flow chart outlining the process for determining the technical condition of HV SB devices of a selected type over their entire operating lifetime.
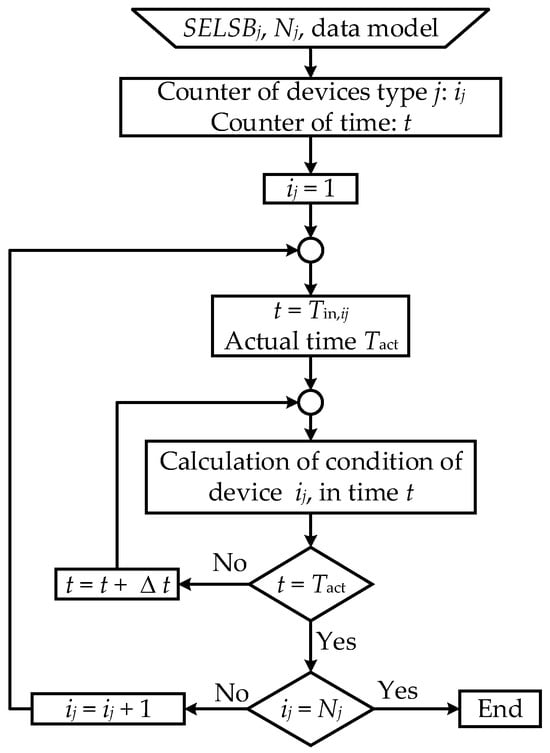
Figure 5.
Flow chart for assessing the technical condition of HV SB devices of a specific subtype.
4.4. Comparison of the Technical Condition Calculations Using Different Models
A comparison with the existing model was conducted to evaluate the advantages of the new model for assessing the technical condition of HV SB devices. The existing additive-only model estimates the technical condition for CBs with nine additive criteria, with grades and weights from Table 4 in Equation (4). The same data was used to assess the technical condition as for the multiplicative model via the data model. In contrast, the new model, based on (2), incorporates both the multiplicative and additive criteria from Table 4. For both models, the input data for a population of the selected type of CBs is retrieved through the data model. The technical condition determined by the new model is referred to as the multiplicative technical condition, while the condition computed using the existing model is referred to as the additive technical condition. The conventional health index models in [6,9,12] and the additive-only model from [23] do not have criteria related to DIDs.
5. Case Study
This section presents practical examples of assessing the technical condition of devices using both the existing and newly developed models. The input data for these assessments are based on actual SB device records from the TSO ELES database. The technical condition estimated by the new model, which integrates both multiplicative and additive criteria, was compared to that obtained from the existing model, which relies solely on additive criteria. To ensure fair comparison conditions, the additive criteria were applied consistently in both models.
5.1. Input Data for Calculations
A comprehensive model for calculating the technical condition of HV SB devices was developed and supported by a newly designed data model, enabling automated condition assessment. Using this computerized procedure, practical evaluations were conducted based on extensive input data for HV SB devices, including CBs, Ds, and ITs, installed in switchyards operated by TSO ELES. The calculations were based on data from the device population listed in Table 5, which were collected over an extended period through IBM Maximo IS.
Table 5.
Population of devices in HV SB for the calculation of the technical state.
5.2. Calculation Results for the Circuit Breaker and Comparison of the Technical Condition Calculations
Figure 6a presents the progression of the c-curves calculated using the new model, which incorporates a multiplicative criterion in combination with the additive criteria from Table 4, aligning with the actual maintenance outcomes. In contrast, Figure 6b illustrates the procedure based solely on additive criteria, representing the existing model for assessing the technical condition of devices defined in Table 4. The procedure is designed such that year 0 represents the year of the device’s installation, with the current year marking the end of the calculation period. This approach allows for a direct comparison of CBs of a particular type. The blue curve represents the c-curve for a selected CB from the subset SCB1, which is detailed further in Figure 7 for both models. In Figure 6a, the state declines for CBs with detected DIDs are shown for the entire selected subset of CBs. The depth of the decline depends on the RDID level. The density of the technical state decline indicates the trend of detected DIDs during a specific period of operation for the CB type under consideration. The upper band reflects the impact of multiplicative criteria on the state of decline. Conversely, the density of these declines offers insight into the effectiveness of TSO’s maintenance implementation. In comparison, Figure 6b shows the condition progression using only additive criteria for the same CB subset. In this case, it is not possible to determine the severity of detected DIDs directly. The decline is influenced solely by the cumulative number of DIDs rather than the RDID rate. As a result, the additive state does not reflect improvements, and it offers limited sensitivity to maintenance effectiveness.
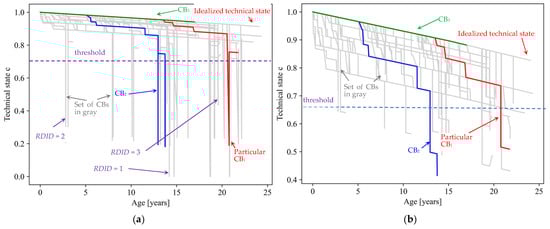
Figure 6.
(a) Longitudinal technical state plot of circuit breakers assessed using multiplicative criteria; (b) longitudinal technical state plot of circuit breakers assessed using additive criteria.

Figure 7.
Comparison of the longitudinal technical state plot estimated with multiplicative (orange) and purely additive assessment criteria (blue).
Figure 6a presents a longitudinal chart of the multiplicative technical state c for 122 breakers of subtype SCB1. The red line illustrates the idealized technical state of a device that has experienced no defects, with its only decline in the technical state due to aging. For most devices, the aging trend similarly dominates their condition curves, as defect data were not collected during the early years following installation. However, data on deficiencies and internal defects (DIDs) have been collected systematically for the past 10 years. This more recent period is reflected in deviations from the red aging curve, where the technical condition declines corresponding to the recorded defects.
Figure 7 illustrates the longitudinal technical state of a circuit breaker over a 21.75-year period leading up to the date of analysis. At the time of assessment, the CB’s multiplicative technical condition was 0.7917, while its additive condition was 0.5092. In the following descriptions, the multiplicative technical condition is listed first, with the corresponding additive value in parentheses.
The observed device exhibited aging and was classified as such until it reached an operational age of 13.31 years, at which point its technical state was 0.9542 (0.9084). Shortly after, at an age of 13.74, a second regular revision increased the number of operations under nominal loads to two. This triggered a reduction in the relevant criterion, resulting in a technical state drop to 0.9398 (0.8797). A subsequent planned revision at an age of 14.69 introduced two switching operations, reducing the value of criterion CR7 to 0, further resulting in a decline in the technical state to 0.9172 (0.8344). Due to accessibility constraints in servicing, the grade for the criterion is GCR9 = 10.
Planned maintenance events involving shutdown at ages 15.06, 15.21, 15.72, 16.01, 16.11, 16.14, 16.23, 16.28, 16.31, 16.70, and 16.81 no longer affect the evaluation criteria, resulting in a technical condition decrease driven solely by aging. At an age of 16.92, a nearby lightning strike occurred (grid disturbance), which caused an unplanned overvoltage event with a backflashover, triggering the short-circuit operation of the CBs in the overhead line system unit, followed by automatic reconnection. This incident reduced the value of criterion CR6 to 6, resulting in a technical condition of 0.8829 (0.7658). No subsequent planned maintenance events impacted the condition criteria until the age of 20.77, when the first DIDs were identified and logged. This caused the technical state to drop sharply from the aging-based value of 0.8689 (0.7377) to 0.1896 (0.5166), reflecting the presence of multiple DIDs. The detected deficiencies were DID3,2M, DID3,3M, and DID1,1I from Table 1. In this case, the number of DIDs is NDID = 3 and SETDID = max {1, 2, 1} = 2, resulting in a calculated grade of GCR−1 = 0.125. Remedial action was performed the same day, restoring the multiplicative technical state to 0.7583. However, the additive model did not reflect this improvement and retained the prior value. From that point until the end of the observation period, only a single planned maintenance event was recorded. The final technical state, determined at the age of 21.73, was 0.7545 (0.5092), with the last change attributable solely to aging.
The new model reflects the current state of the CB, with DIDs detected using maintenance processes (multiplicative criteria). The degree of DIDs is included in the calculation results, reflecting the priorities for eliminating the detected DIDs. In the additive-criteria-only model, the progression of the c-curve between maintenance interventions is governed solely by the additive criteria, ensuring continuity in the device’s state curve. The operation of the CB indicates an impact on the decline of the device’s state, but this is only a penalty and an indication of possible hidden defects. However, the main impact is exerted by the detected DIDs. After their elimination, the multiplicative model’s assessed state improved. In contrast, when using the additive-only model, the technical state of CB declined monotonically and remained unchanged after defect resolution. This is because DIDs are counted cumulatively, without regard for severity or whether corrective actions have been taken. As a result, the c-curve lacks clarity in depicting the impact of DIDs, and the decline in the technical state is generally more severe than in the multiplicative model. In the old model, the CB’s technical state cannot reach zero, whereas the new model allows it to drop to zero when the device requires replacement. For additive-only models, the detected DIDs only represent statistical discrete data. Each DID is cumulatively added to previous DIDs for the selected criteria. The decline in the calculated technical condition is permanent. For these reasons, the technical condition of a normally operating device with several DIDs that were fixed could be the lowest compared to a device that has just experienced its first defect, and it needs to be urgently addressed as the device is not functioning. Therefore, the additive formula for technical conditions does not reflect the priority of action for the device. On the other hand, the multiplicative model directly follows the implementation of the work order and accounts for the priority of action. The decline’s depth depends on the detected DID rate, which is equivalent to the maximum delay until the deadline for remedial action (real maintenance decision). The details of the multiplicative criterion are set so that the resulting value reflects the maintenance action’s priority, and the additive criteria reflecting the other details of the device’s technical condition are only prioritized within devices with the same determined maintenance action deadline. The detected DIDs, therefore, determine the prioritization of the maintenance that is completely reflected in the multiplicative criteria and, therefore, the value returned by the model.
A comparative analysis of the condition values calculated using both the conventional and proposed approaches was carried out for three selected circuit breakers (represented by the red, blue, and green curves), as shown in Figure 6a,b, at characteristic ages corresponding to changes in the device condition. The numeric values in the c-curves of the three selected CBs are given in Table 6.
Table 6.
Explicit quantitative benchmarking between the multiplicative model and conventional approach as an additive-only model for three selected CBs.
The presented values are the values on the c-curve when the technical state has been changed (breakpoint) at a certain age [year]. cmm represents the values of the technical state from the multiplicative method, while caom represents the values from the additive-only model. CB1 in red in Table 6 is already explained in detail in this subsection. In the second case, two DIDs with RDID = 3 and RDID = 2 in a short period are found on CB2 in blue at age 12.97 years with maintenance tasks, and another DID with RDID = 2 at age 13.73 years. After the remedial actions were taken, the device condition improved to c = 0.7076 according to the multiplicative model (Figure 6a) but dropped even further to c = 0.4151 (red in Table 6) according to the additive-only model (Figure 6b). The decline of the device condition c for the additive-only model is too significant (almost 43%). In contrast, the decline from the multiplicative model is 14% in two years, and three DIDs were discovered. The discovered DIDs have a significant influence on the additive-only model. In the third case, CB3 is green, where no DIDs were found, and the c values were only affected by the operation and aging of the device, and the trends in the c values are comparable. Each multiplicative criteria reflects the priority of the maintenance activities of the given device. On the other hand, the additive criteria do not possess this characteristic at each time stamp. The reason being that, after the DID was detected, the multiplicative criteria dropped significantly, and rose to a level slightly below the technical state before the DID was discovered. The additive criteria, on the other hand, dropped significantly after the DID was discovered and remained at a low level.
The device condition c, obtained by both approaches, can be utilized to adjust the intervals of selected maintenance tasks within maintenance planning. For this purpose, the TSO must define a threshold for the technical condition (Figure 6a,b). The threshold is basically different for both methods. Whether it is constant or not depends on the experience in the TSO. If the assessed technical state falls below this threshold, the maintenance interval should be shortened. In the multiplicative model, the decline in c before and after maintenance tasks, where DIDs are identified and remedial actions are taken, is minor for all three selected CBs. In contrast, the additive-only model shows a significant decline in c for CB1 and CB2 where DIDs were detected. This indicates that, under the additive-only model, the maintenance interval should be shortened in future to account for the greater degradation observed.
5.3. Calculation Results for the Disconnector
Figure 8a displays the c-curves for the entire population of bus Ds. This subset is characterized by the highest density of detected deficiencies and internal defects occurring between 10 and 20 years of operation. Significant internal defects are relatively rare for this type of D. Most DIDs are resolved within a working day in the global check (GC).

Figure 8.
(a) Longitudinal technical state plot of bus (system) disconnectors assessed using multiplicative criteria; (b) longitudinal technical state plot of a specific disconnector assessed using additive criteria.
Figure 8b presents the longitudinal technical state of a specific bus D installed 19.87 years before the date of the analysis. At the time of assessment, its multiplicative technical state was 0.6900. Similarly to the CB example, the multiplicative technical state of the D is reported at each relevant event throughout its operational timeline. The observed device exhibited no events, and ages were normally registered as an aging unit until they reached an operational age of 13.90 years, at which point the technical state was 0.9164. Then, the device underwent a GC. However, unlike CBs, which are switched off under normal operational currents, no parameter of the D changed during such operations. Consequently, the c-curve of the D only exhibited aging until an operational age of 19.04, when five different deficiencies and defects were detected (DID4,1E, DID1,1I, DID1,4M, DID3,2M, and DID1,3M). Here, NDID = 5 and SETDID = 2. These DIDs reduced the technical state to 0.1955. However, since remedial action on the DIDs was carried out on the same day, the technical state was restored to 0.7613. The criterion handicapping the previous aging grade reflects the recently repaired defects and deficiencies and has improved gradually over time without further incidents. However, before this recovery progressed, at an age of 19.87, several new defects and deficiencies (DID3,2M, DID4,1E, DID1,1I, and DID1,4M) were discovered, reducing the technical state to 0.1725. After the repairs were completed on the same day, the state improved to 0.6900, which represents the last log entry before the date of analysis.
5.4. Calculation Results for the Instrument Transformer
Figure 9a shows two c-curves for ITs: The red curve represents the idealized technical state of the IT influenced only by aging, while the blue curve corresponds to the specific IT detailed in Figure 9b. Figure 9b illustrates that the declining course of the c-curve for IT is no longer clearly explainable due to the use of two multiplicative criteria. The rapid declines and subsequent rises in the multiplicative technical state are characteristic of criterion CR−1, whereas a decline followed by a prolonged period in a low state typically results from the poorer diagnostic assessments associated with criterion CR−2. Figure 9a also indicates that DIDs are identified throughout the entire operating life of combined ITs.
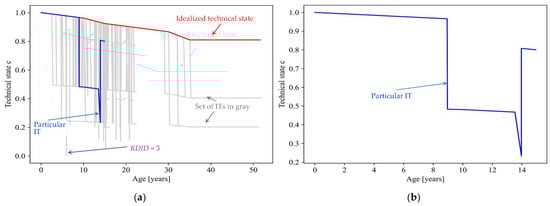
Figure 9.
(a) Longitudinal technical state plot of all the combined instrumental transformers assessed using multiplicative criteria; (b) longitudinal technical state plot of a specific combined instrumental transformer assessed using additive criteria.
Figure 9b presents the longitudinal technical state of an IT installed 14.94 years prior to the analysis date, with a multiplicative technical state of 0.8004 at the time of assessment. Initially, the technical state declined solely due to aging until the device reached 6.97 years of operation, when the state was 0.9735. A revision occurred at this point, but, as with Ds, it did not impact the technical state. Aging continued until the age of 8.96, when the diagnostic results halved the value of the corresponding multiplicative criterion, dropping the technical state sharply to 0.4829. It remained at this level (with a consistent value of the diagnostics criterion) until the age of 13.96, when an urgent diagnostic measure was scheduled and logged for the transformer (DID2,1E). After the defect revealed through diagnostics was repaired, the diagnostics grade returned to its best attainable value, and the transformer’s technical state returned to 0.8079, reflecting only aging and recently resolved defects as suboptimal criteria grades. From this point onward, the transformer remained in optimal condition, and it was only affected by aging until the operational age of 14.94, when its technical state reached 0.8004.
6. Conclusions
This study introduced a novel methodology for assessing the technical condition of HV switchyard devices—specifically, CBs, Ds, and ITs—in HV substations. The existing models in the literature for determining the technical condition or health index often do not account for the direct outcomes of condition-based maintenance processes, and their application to large populations of devices is typically difficult to automate. To address these limitations, this study proposed an enhanced model that integrates both multiplicative and additive criteria for calculating a device’s technical condition. The multiplicative criteria reflect the outcomes of maintenance activities on HV switchyard devices directly, using the outcomes of maintenance processes in the form of detected deficiencies and internal defects (DIDs) as the primary input. A comprehensive failure mode analysis was developed for CBs, Ds, and ITs, allowing each DID to be assigned a corresponding RDID severity level. The additive criteria, which form the second core component of the model, are designed to account for operational history, previous maintenance actions, and external influences over the device’s service life. Together, these criteria yield a scalar index that quantifies the overall technical condition of each device.
The proposed methodology is supported by an information system that consolidates all the relevant maintenance, operational, and environmental data into a unified database. A generalized data model was developed to enable the extraction and transformation of these data into partial estimates of the additive and multiplicative criteria. This allows the assessment of the technical condition throughout the entire operational life of a device, and it enables the generation of continuous condition curves (c-curves). The multiplicative criteria respond to recent maintenance actions by tracking DID levels, while the additive criteria capture longer-term degradation due to usage and external stressors between the maintenance intervals. The multiplicative model serves as the foundational tool for developing new platforms for maintenance task planning, including the adjustment of intervals between the selected tasks. Maintenance planning managers can perform ad hoc analyses using subsets of c-curves for specific device types, filtered by various attributes, such as the location, voltage level, manufacturer, maintenance task, or combinations thereof.
The model was validated using a dataset representing a large population of CBs, Ds, and ITs. The proposed solution was implemented in TSO ELES as Technology Readiness Level 6 (full prototype implementation in the relevant environment). For the system to actually be used in TSO processes, changing the internal guidelines for maintenance planning for CBs, Ds, and ITs needs to be finalized. A comparative analysis between the newly proposed model (which includes both multiplicative and additive criteria) and a conventional additive-criteria-only model demonstrated the superiority of the new approach. The results of the performed comparative analysis clearly show that the new multiplicative criteria-enhanced model reflects real-time maintenance impacts better. Specifically, it demonstrates condition degradation corresponding to the severity of the detected DIDs and improvements following remediation. In contrast, the existing additive-criteria-only model, which is more aligned with traditional health index approaches in the literature, does not capture the effects of recent maintenance activities adequately, resulting in less responsive and less interpretable c-curves.
This research study lays the foundation for the advanced asset management of HV switchyard devices by combining failure mode analysis with dynamic health assessment. The proposed methodology not only improves the accuracy of current state evaluations but also enables the future development of predictive maintenance strategies and cost-saving and reliability analyses of selected devices. While the approach is demonstrated for CBs, Ds, and ITs, it is generalizable and may be adapted for other types of power system assets.
Author Contributions
Conceptualization, J.R., D.B. and P.K.; methodology, J.R., D.B., M.B. and P.K.; software, D.B., A.Š. and J.R.; validation, J.R., D.B., A.Š., U.K., P.K. and G.Š.; formal analysis, J.R., D.B., U.K., P.K. and G.Š.; investigation, J.R., P.K., M.V., D.B. and A.Š.; resources, J.R., U.K., M.B. and D.B.; data curation, M.B., D.B., A.Š., U.K. and J.R.; writing—original draft preparation, J.R.; writing—review and editing, J.R., D.B., P.K., G.Š. U.K., M.V. and A.Š.; visualization, J.R., P.K., D.B. and A.Š.; supervision, J.R., D.B. and G.Š.; project administration, J.R., U.K. and D.B.; funding acquisition, G.Š. All authors have read and agreed to the published version of the manuscript.
Funding
This research was partly funded by the Slovenian Research and Innovation Agency, grant number P2-0115, and the APC was funded by the Slovenian Research and Innovation Agency.
Institutional Review Board Statement
Not applicable.
Informed Consent Statement
Not applicable.
Data Availability Statement
The data presented in this study are available in this manuscript and from the corresponding author upon request. The data are not publicly available due to their use in IBM Maximo for maintenance purposes in TSO ELES.
Acknowledgments
The authors acknowledge the financial support from the Slovenian Research and Innovation Agency Research Core Funding No. P2-0115. Moreover, the authors would like to express their sincere gratitude to TSO ELES (the combined transmission and distribution system operator of the Republic of Slovenia) for sharing information on the maintenance processes, their support, and their provision of data. The data were used strictly for the analysis of the developed method.
Conflicts of Interest
Authors Uroš Kerin and Miha Bečan were employed by the company ELES, Combined Transmission and Distribution System Operator of the Republic of Slovenia. Authors Anja Šketa and Drago Bokal were employed by the DataBitLab d.o.o. The remaining authors declare that the research was conducted in the absence of any commercial or financial relationships that could be construed as a potential conflict of interest.
References
- McDonald, J.D. Electric Power Substations Engineering, 2nd ed.; CRC Press: Boca Raton, FL, USA, 2007. [Google Scholar]
- Rosmaini, A.; Shahrul, K. An overview of time-based and condition-based maintenance in industrial application. Comput. Ind. Eng. 2012, 63, 135–149. [Google Scholar]
- Ferlic, R. Maintenances Guideline for Power Engineering Transmission Devices; ELES: Ljubljana, Slovenia, 2021. [Google Scholar]
- Thompson, C.C.; Barriga, C.I. Relationship Between Historical Trends, Equipment Age, Maintenance, and Circuit Breaker Failure Rates. IEEE Trans. Ind. Appl. 2019, 55, 5699–5707. [Google Scholar] [CrossRef]
- Asghar, A.R.; Niayesh, K. Condition Monitoring of High Voltage Circuit Breakers: Past to Future. IEEE Trans. Power Del. 2021, 36, 740–750. [Google Scholar] [CrossRef]
- Khoddam, M.; Sadeh, J.; Pourmohamadiyan, P. Performance Evaluation of Circuit Breaker Electrical Contact Based on Dynamic Resistance Signature and Using Health Index. IEEE Trans. Compon. Packag. Manuf. Technol. 2016, 6, 1505–1512. [Google Scholar] [CrossRef]
- Dehghanian, P.; Guan, Y.; Kezunovic, M. Real-Time Life-Cycle Assessment of High-Voltage Circuit Breakers for Maintenance Using Online Condition Monitoring Data. IEEE Trans. Ind. Appl. 2019, 55, 1135–1146. [Google Scholar] [CrossRef]
- Zhou, N.; Xu, Y. A Prioritization Method for Switchgear Maintenance Based on Equipment Failure Mode Analysis and Integrated Risk Assessment. IEEE Trans. Power Del. 2024, 39, 728–739. [Google Scholar] [CrossRef]
- Zhou, N.; Xu, Y.; Cho, S.; Wee, C.T. A Systematic Review for Switchgear Asset Management in Power Grids: Condition Monitoring, Health Assessment, and Maintenance Strategy. IEEE Trans. Power Del. 2023, 38, 3296–3311. [Google Scholar] [CrossRef]
- Razi-Kazemi, A.A.; Vakilian, M.; Niayesh, K.; Lehtonen, M. Data Mining of Online Diagnosed Waveforms for Probabilistic Condition Assessment of SF6 Circuit Breakers. IEEE Trans. Power Del. 2015, 30, 1354–1362. [Google Scholar] [CrossRef]
- Zhong, J.; Li, W.; Wang, C.; Yu, J. A RankBoost-Based Data-Driven Method to Determine Maintenance Priority of Circuit Breakers. IEEE Trans. Power Del. 2018, 33, 1044–1053. [Google Scholar] [CrossRef]
- Khalyasmaa, A.I.; Senyuk, M.D.; Eroshenko, S.A. High-Voltage Circuit Breakers Technical State Patterns Recognition Based on Machine Learning Methods. IEEE Trans. Power Del. 2019, 34, 1747–1756. [Google Scholar] [CrossRef]
- Feizifar, B.; Usta, O. A Novel Arcing Power-Based Algorithm for Condition Monitoring of Electrical Wear of Circuit Breaker Contacts. IEEE Trans. Power Del. 2019, 34, 1060–1068. [Google Scholar] [CrossRef]
- Li, L.; Wang, B.; Liu, Y.; Yu, H.; Zhang, S.; Huang, M. Early Detection of Health Condition Degradation of Circuit Breaker Based on Electrical Quantity Monitoring. Energies 2023, 16, 5581. [Google Scholar] [CrossRef]
- Ito, H. Switching Equipment; CIGRE Green Book; Springer: Cham, Switzerland, 2019. [Google Scholar]
- Jürgensen, J.H.; Brodersson, A.L.; Nordström, L.; Hilber, P. Impact Assessment of Remote Control and Preventive Maintenance on the Failure Rate of a Disconnector Population. IEEE Trans. Power Del. 2018, 33, 1501–1509. [Google Scholar] [CrossRef]
- Lindquist, T.M.; Bertling, L.; Eriksson, R. Estimation of disconnector contact condition for modelling the effect of maintenance and ageing. In 2005 IEEE Russia Power Tech; IEEE: St. Petersburg, Russia, 2005; pp. 1–7. [Google Scholar]
- Zhang, C.; Ma, H.; Sun, W. Mechanical Fault Diagnosis Method of a Disconnector Based on Improved Dung Beetle Optimizer–Multivariate Variational Mode Decomposition and Convolutional Neural Network–Bidirectional Long Short-Term Memory. Machines 2025, 13, 332. [Google Scholar] [CrossRef]
- Zhang, Z.; Liu, C.; Wang, R.; Li, J.; Xiahou, D.; Liu, Q.; Cao, S.; Zhou, S. Mechanical Fault Diagnosis of a Disconnector Operating Mechanism Based on Vibration and the Motor Current. Energies 2022, 15, 5194. [Google Scholar] [CrossRef]
- Asefi, S. Review of High-Voltage Instrument Transformer Condition Monitoring. IEEE Trans. Dielectr. Electr. Insul. 2024, 31, 3331–3341. [Google Scholar] [CrossRef]
- Khalyasmaa, A.I.; Senyuk, M.D.; Eroshenko, S.A. Analysis of the State of High-Voltage Current Transformers Based on Gradient Boosting on Decision Trees. IEEE Trans. Power Del. 2021, 36, 2154–2163. [Google Scholar] [CrossRef]
- Cui, B.; Srivastava, A.K.; Banerjee, P. Synchrophasor-Based Condition Monitoring of Instrument Transformers Using Clustering Approach. IEEE Trans. Smart Grid 2020, 11, 2688–2698. [Google Scholar] [CrossRef]
- Belak, L.; Marusa, R.; Ferlic, R.; Pihler, J. Strategic Maintenance of 400-kV Switching Substations. IEEE Trans. Power Del. 2013, 28, 394–401. [Google Scholar] [CrossRef]
- Kitak, P.; Belak, L.; Pihler, J.; Ribič, J. Maintenance Management of a Transmission Substation with Optimization. Appl. Sci. 2021, 11, 11806. [Google Scholar] [CrossRef]
- Bohatyrewicz, P.; Płowucha, J.; Subocz, J. Condition Assessment of Power Transformers Based on Health Index Value. Appl. Sci. 2019, 9, 4877. [Google Scholar] [CrossRef]
- Zhang, F.; Wen, Z.; Liu, D.; Jiao, J.; Wan, H.; Zeng, B. Calculation and Analysis of Wind Turbine Health Monitoring Indicators Based on the Relationships with SCADA Data. Appl. Sci. 2020, 10, 410. [Google Scholar] [CrossRef]
- IEEE Std 859™; IEEE Standard Terms for Reporting and Analyzing Outage Occurrences and Outage States of Electrical Transmission Facilities. IEEE: New York, NY, USA, 2018.
- IEC Standard EN 13306; IEC Maintenance—Maintenance Terminology. IEC: Geneva, Switzerland, 2017.
- IEC Standard CEI IEC60694; IEC Common Specifications for High-Voltage Switchgear and Controlgear Standards. IEC: Geneva, Switzerland, 2002.
- IEC Standard IEC 60034-27-4; IEC Rotating Electrical Machines—Part 27-4: Measurement of Insulation Resistance and Polarization Index of Winding Insulation of Rotating Electrical Machines. IEC: Geneva, Switzerland, 2018.
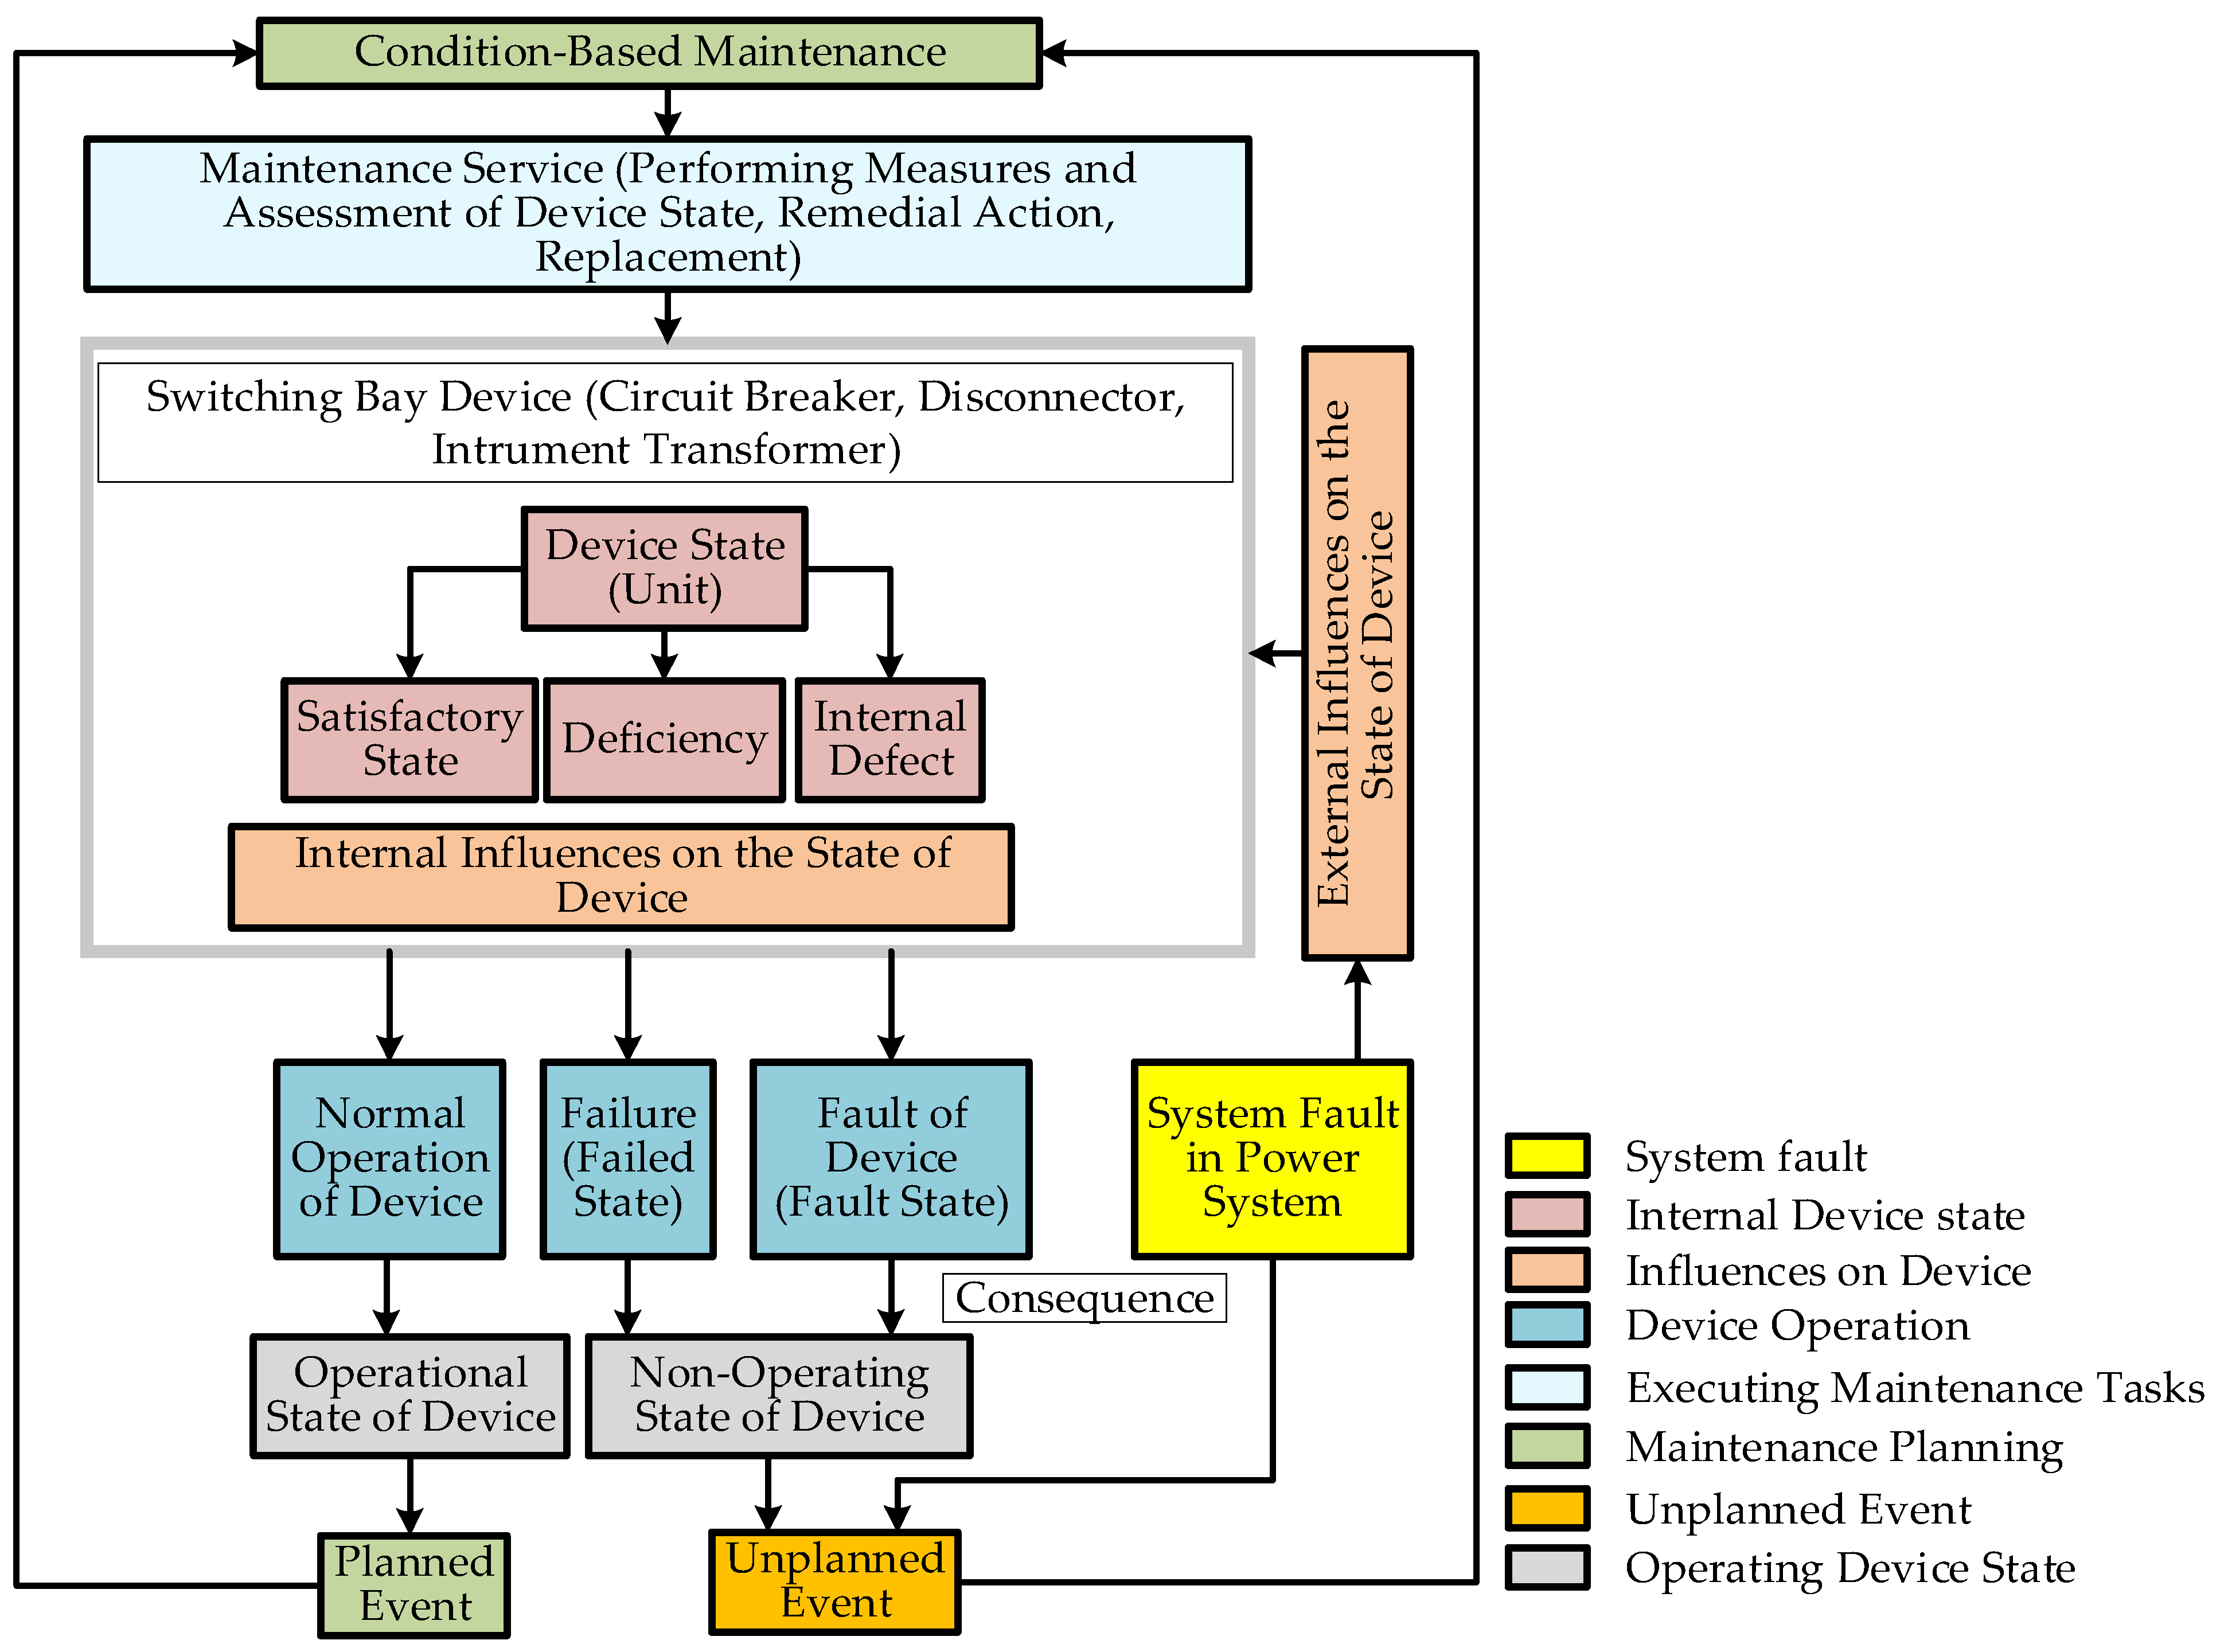
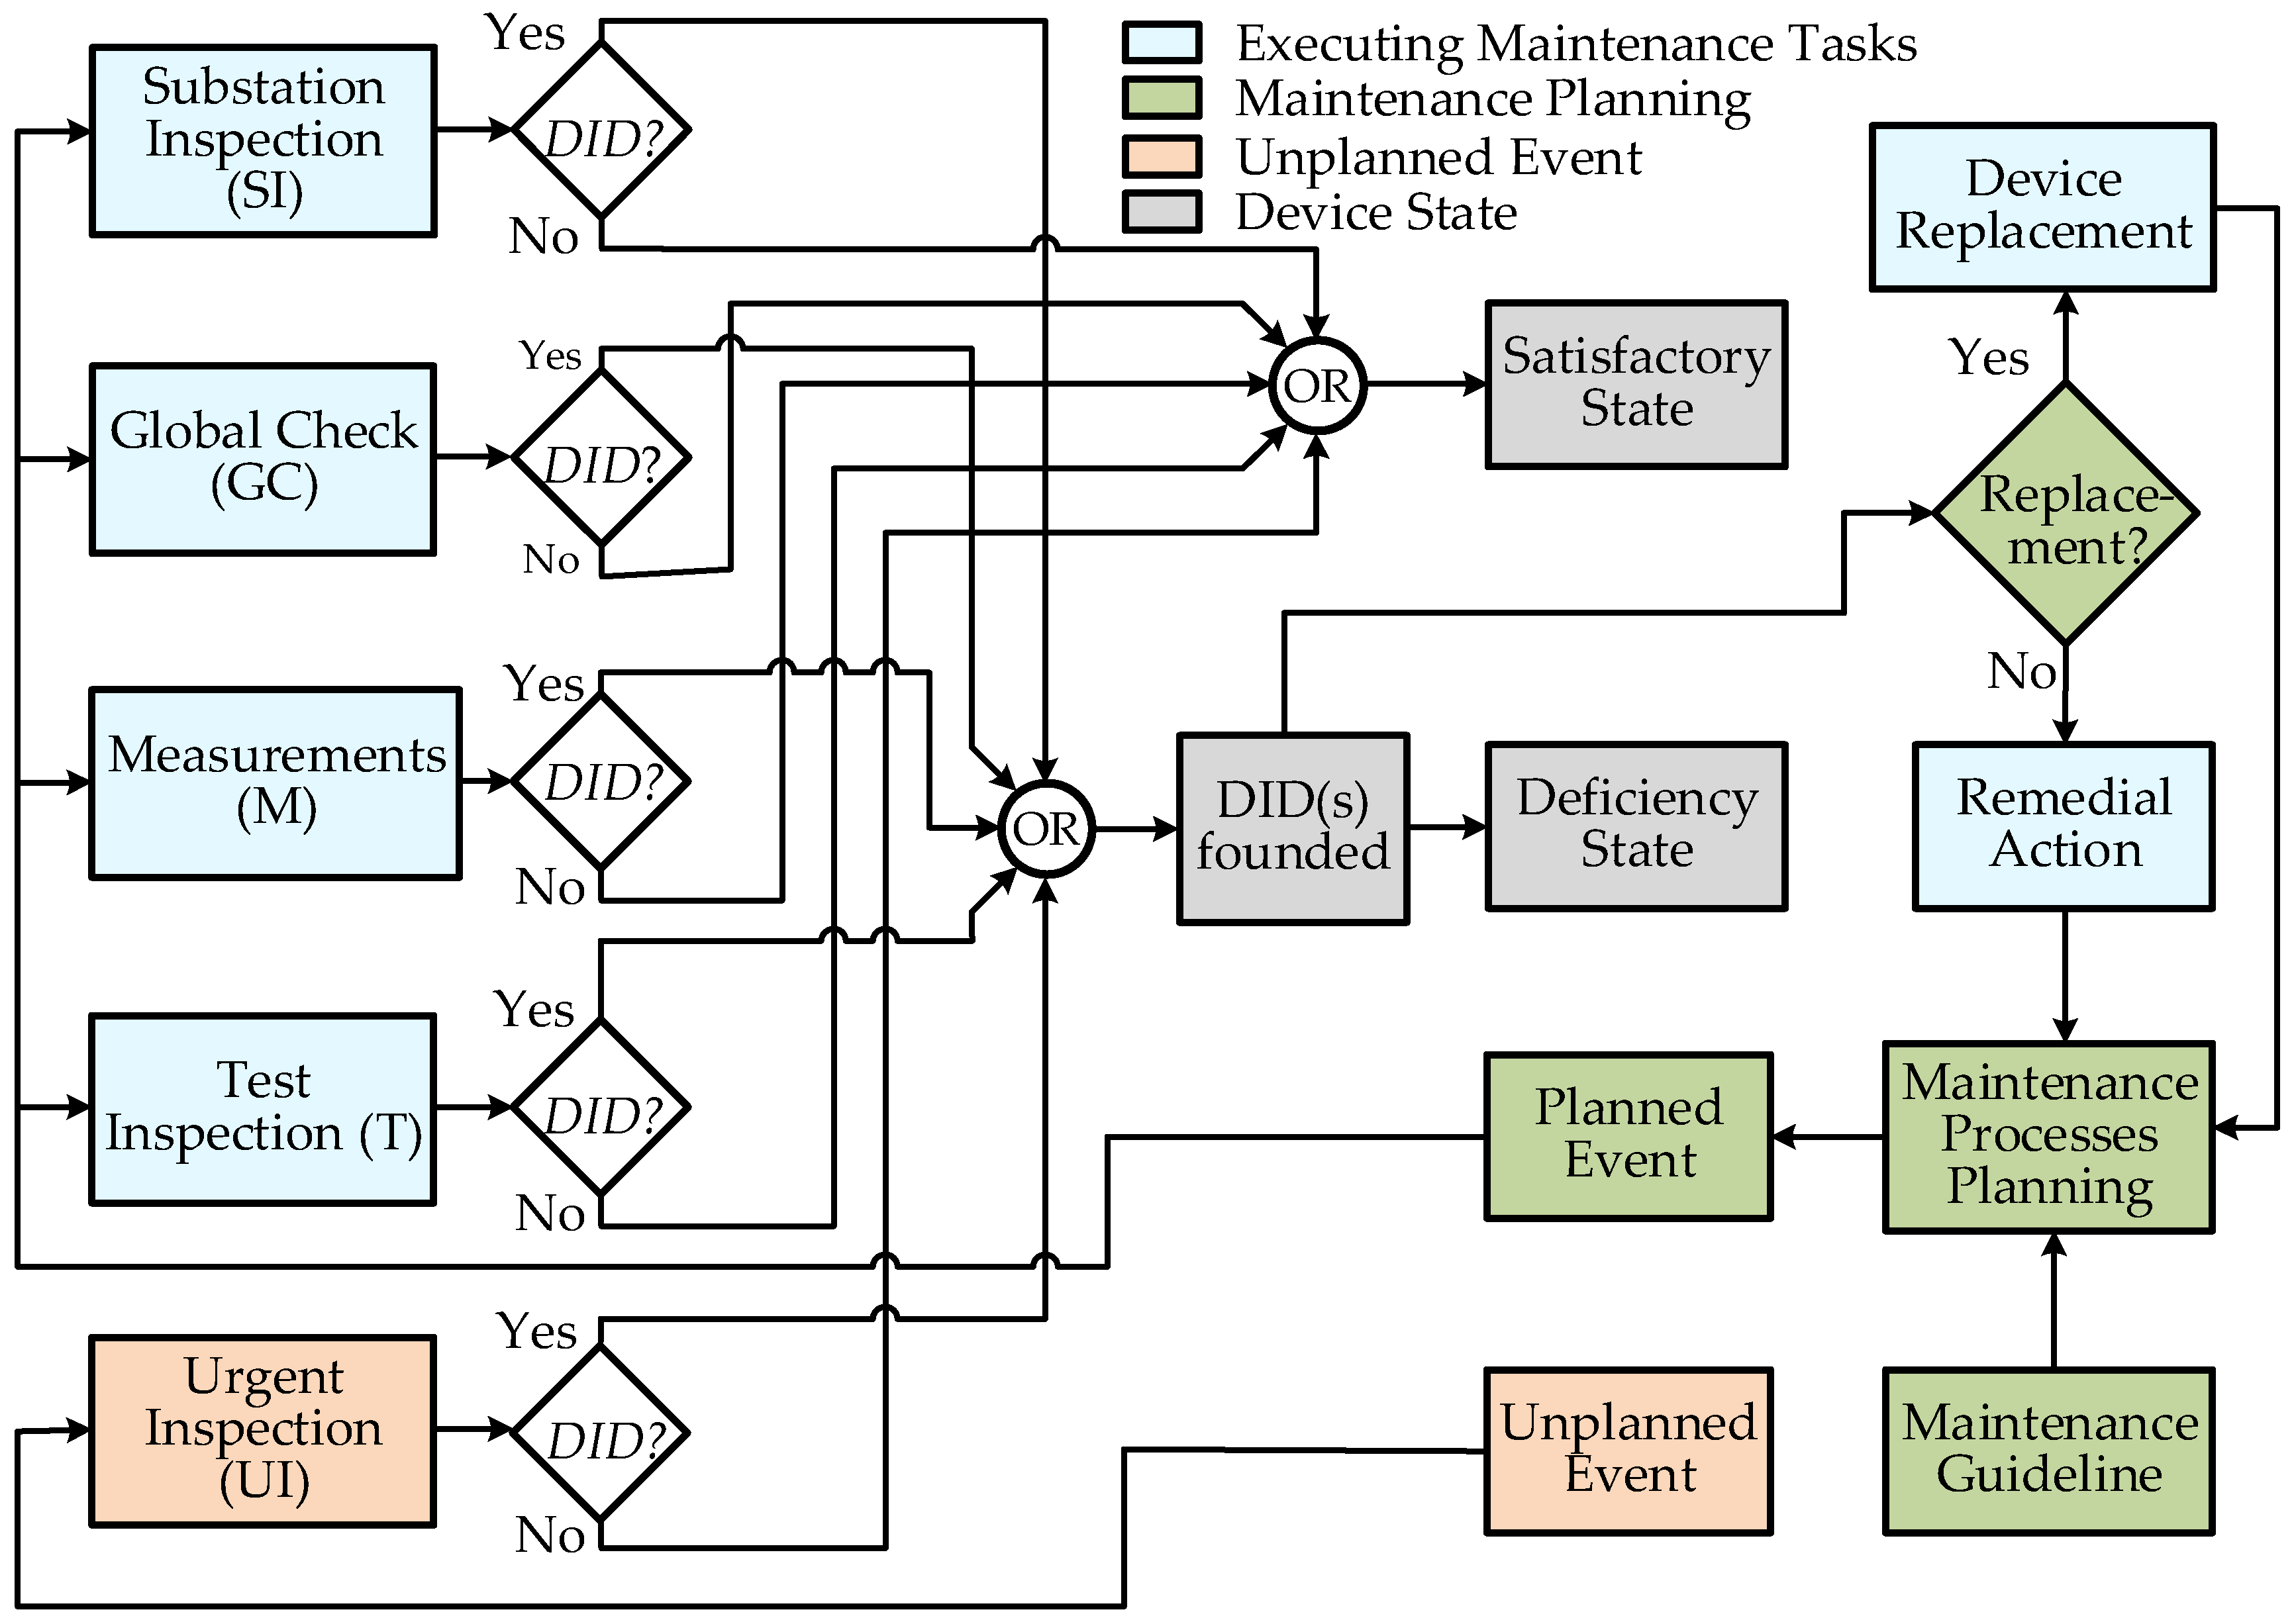
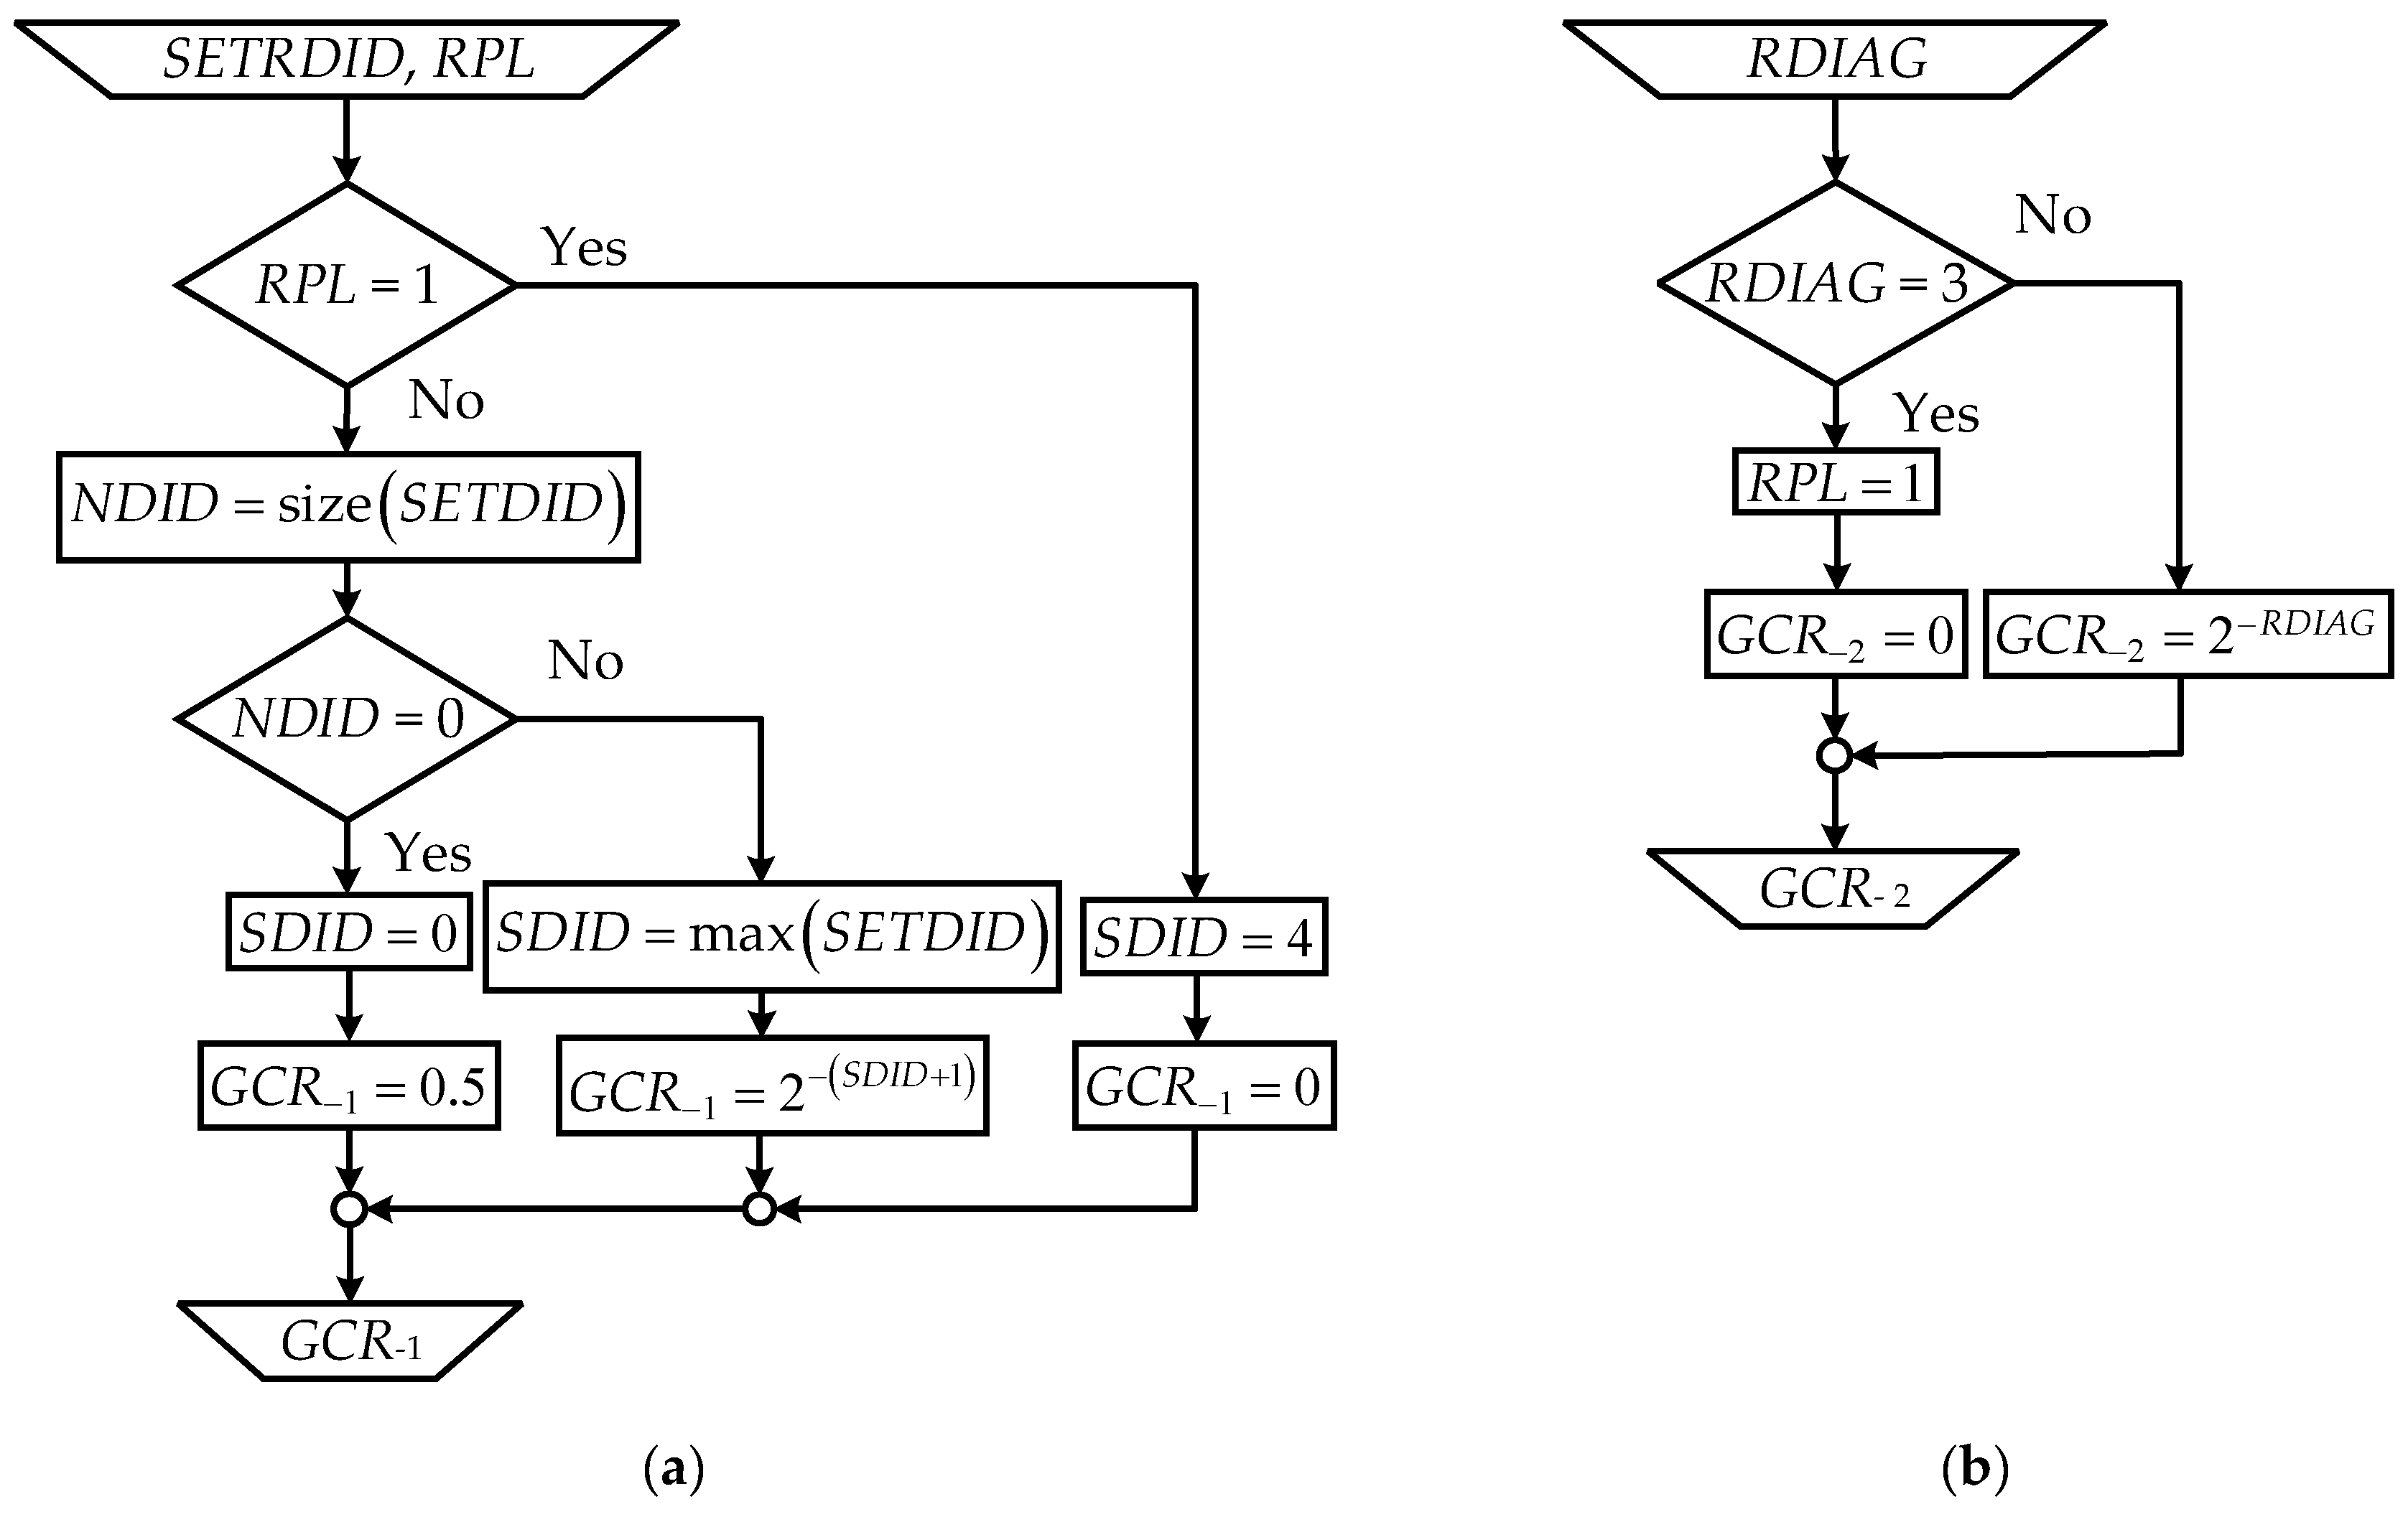


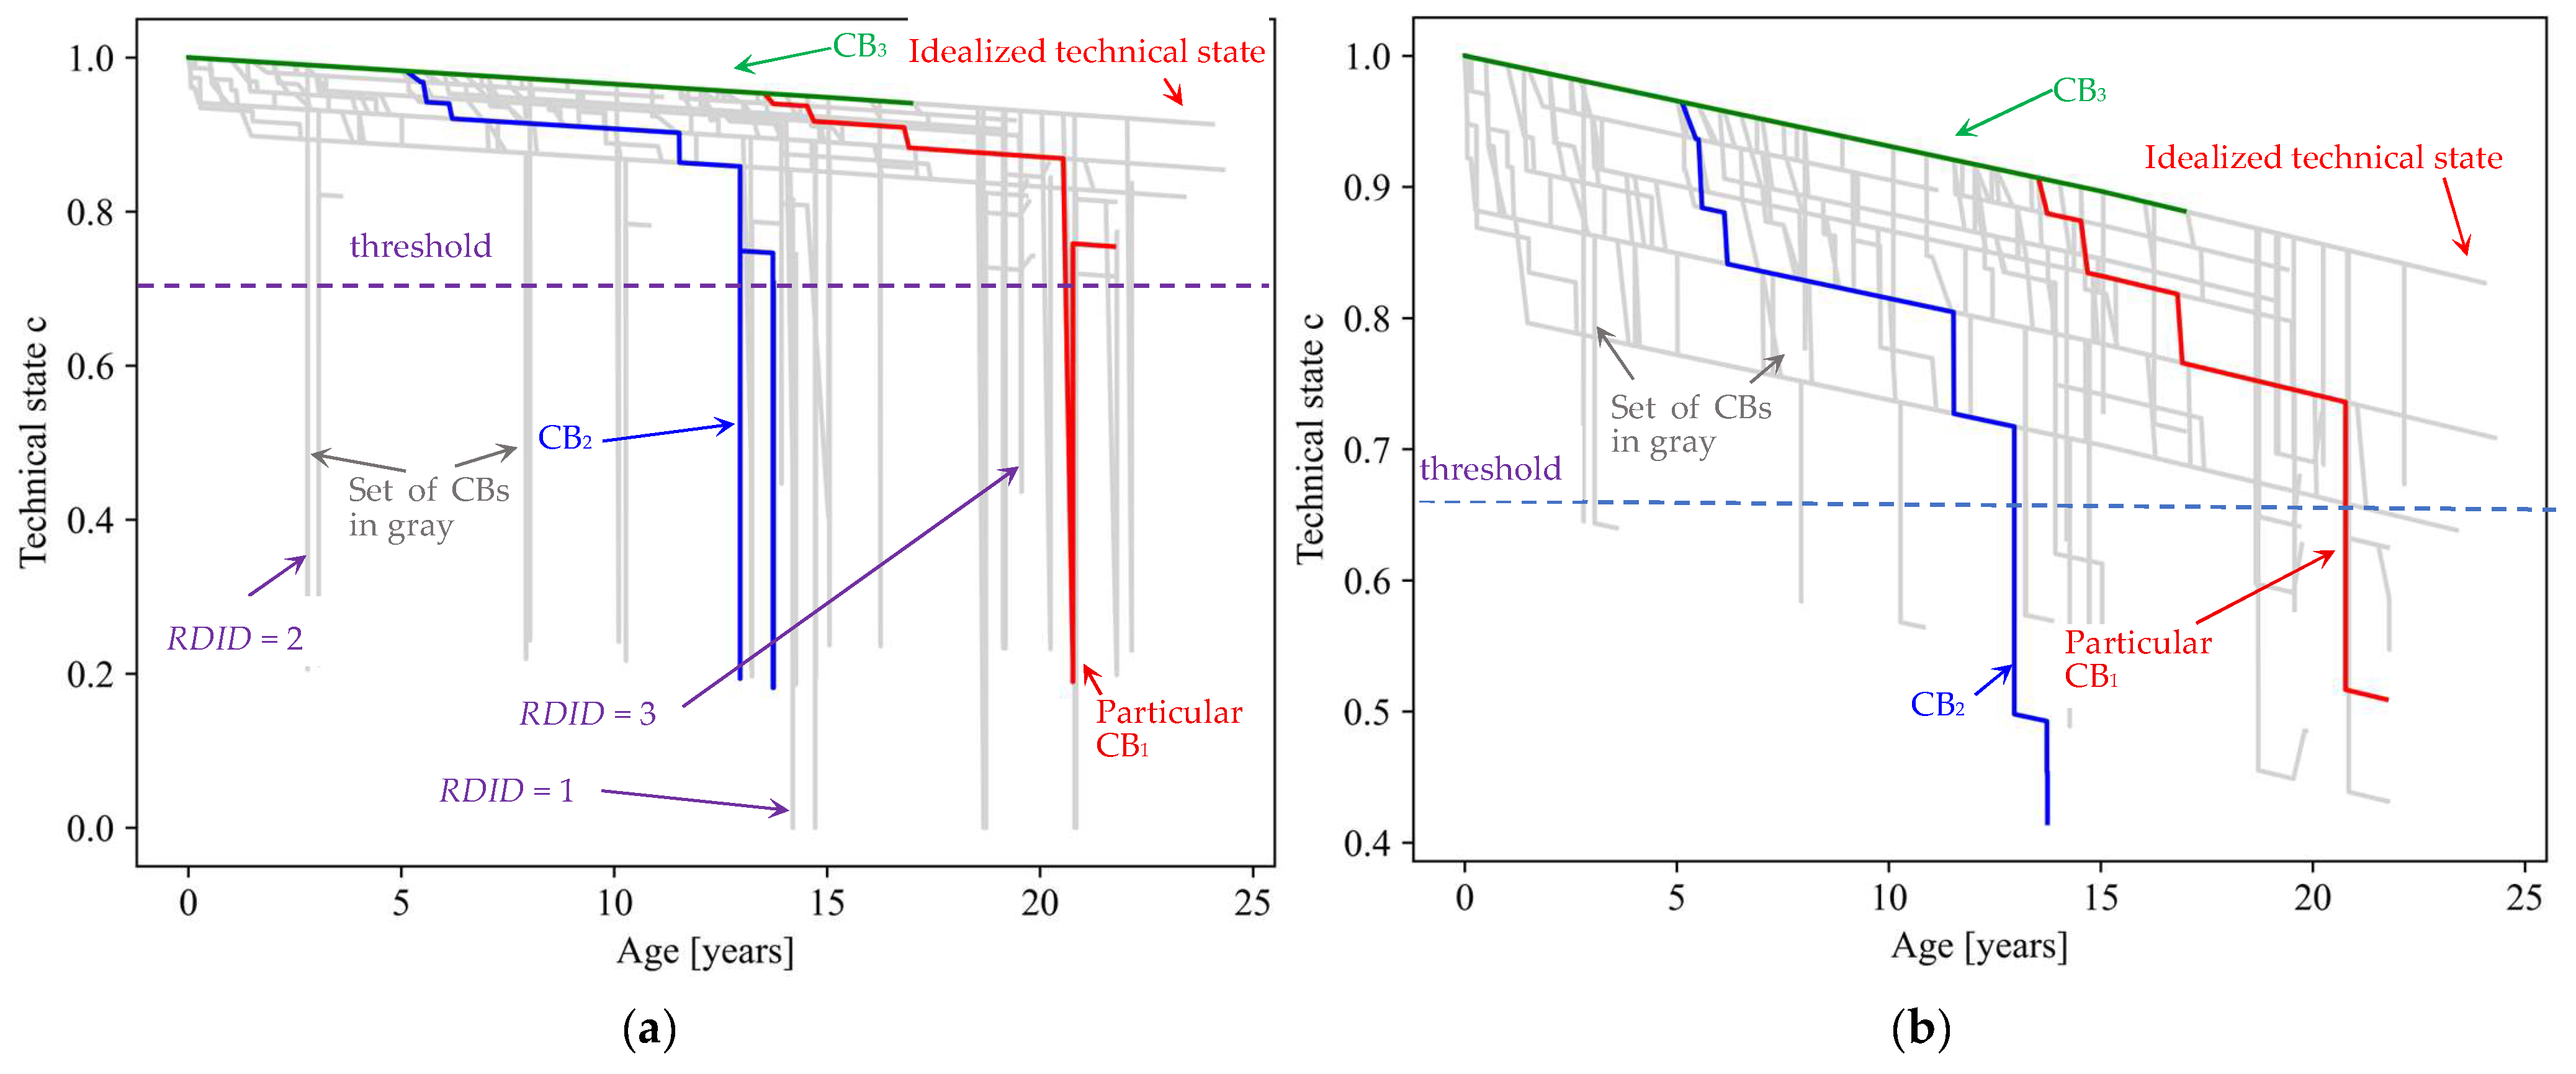
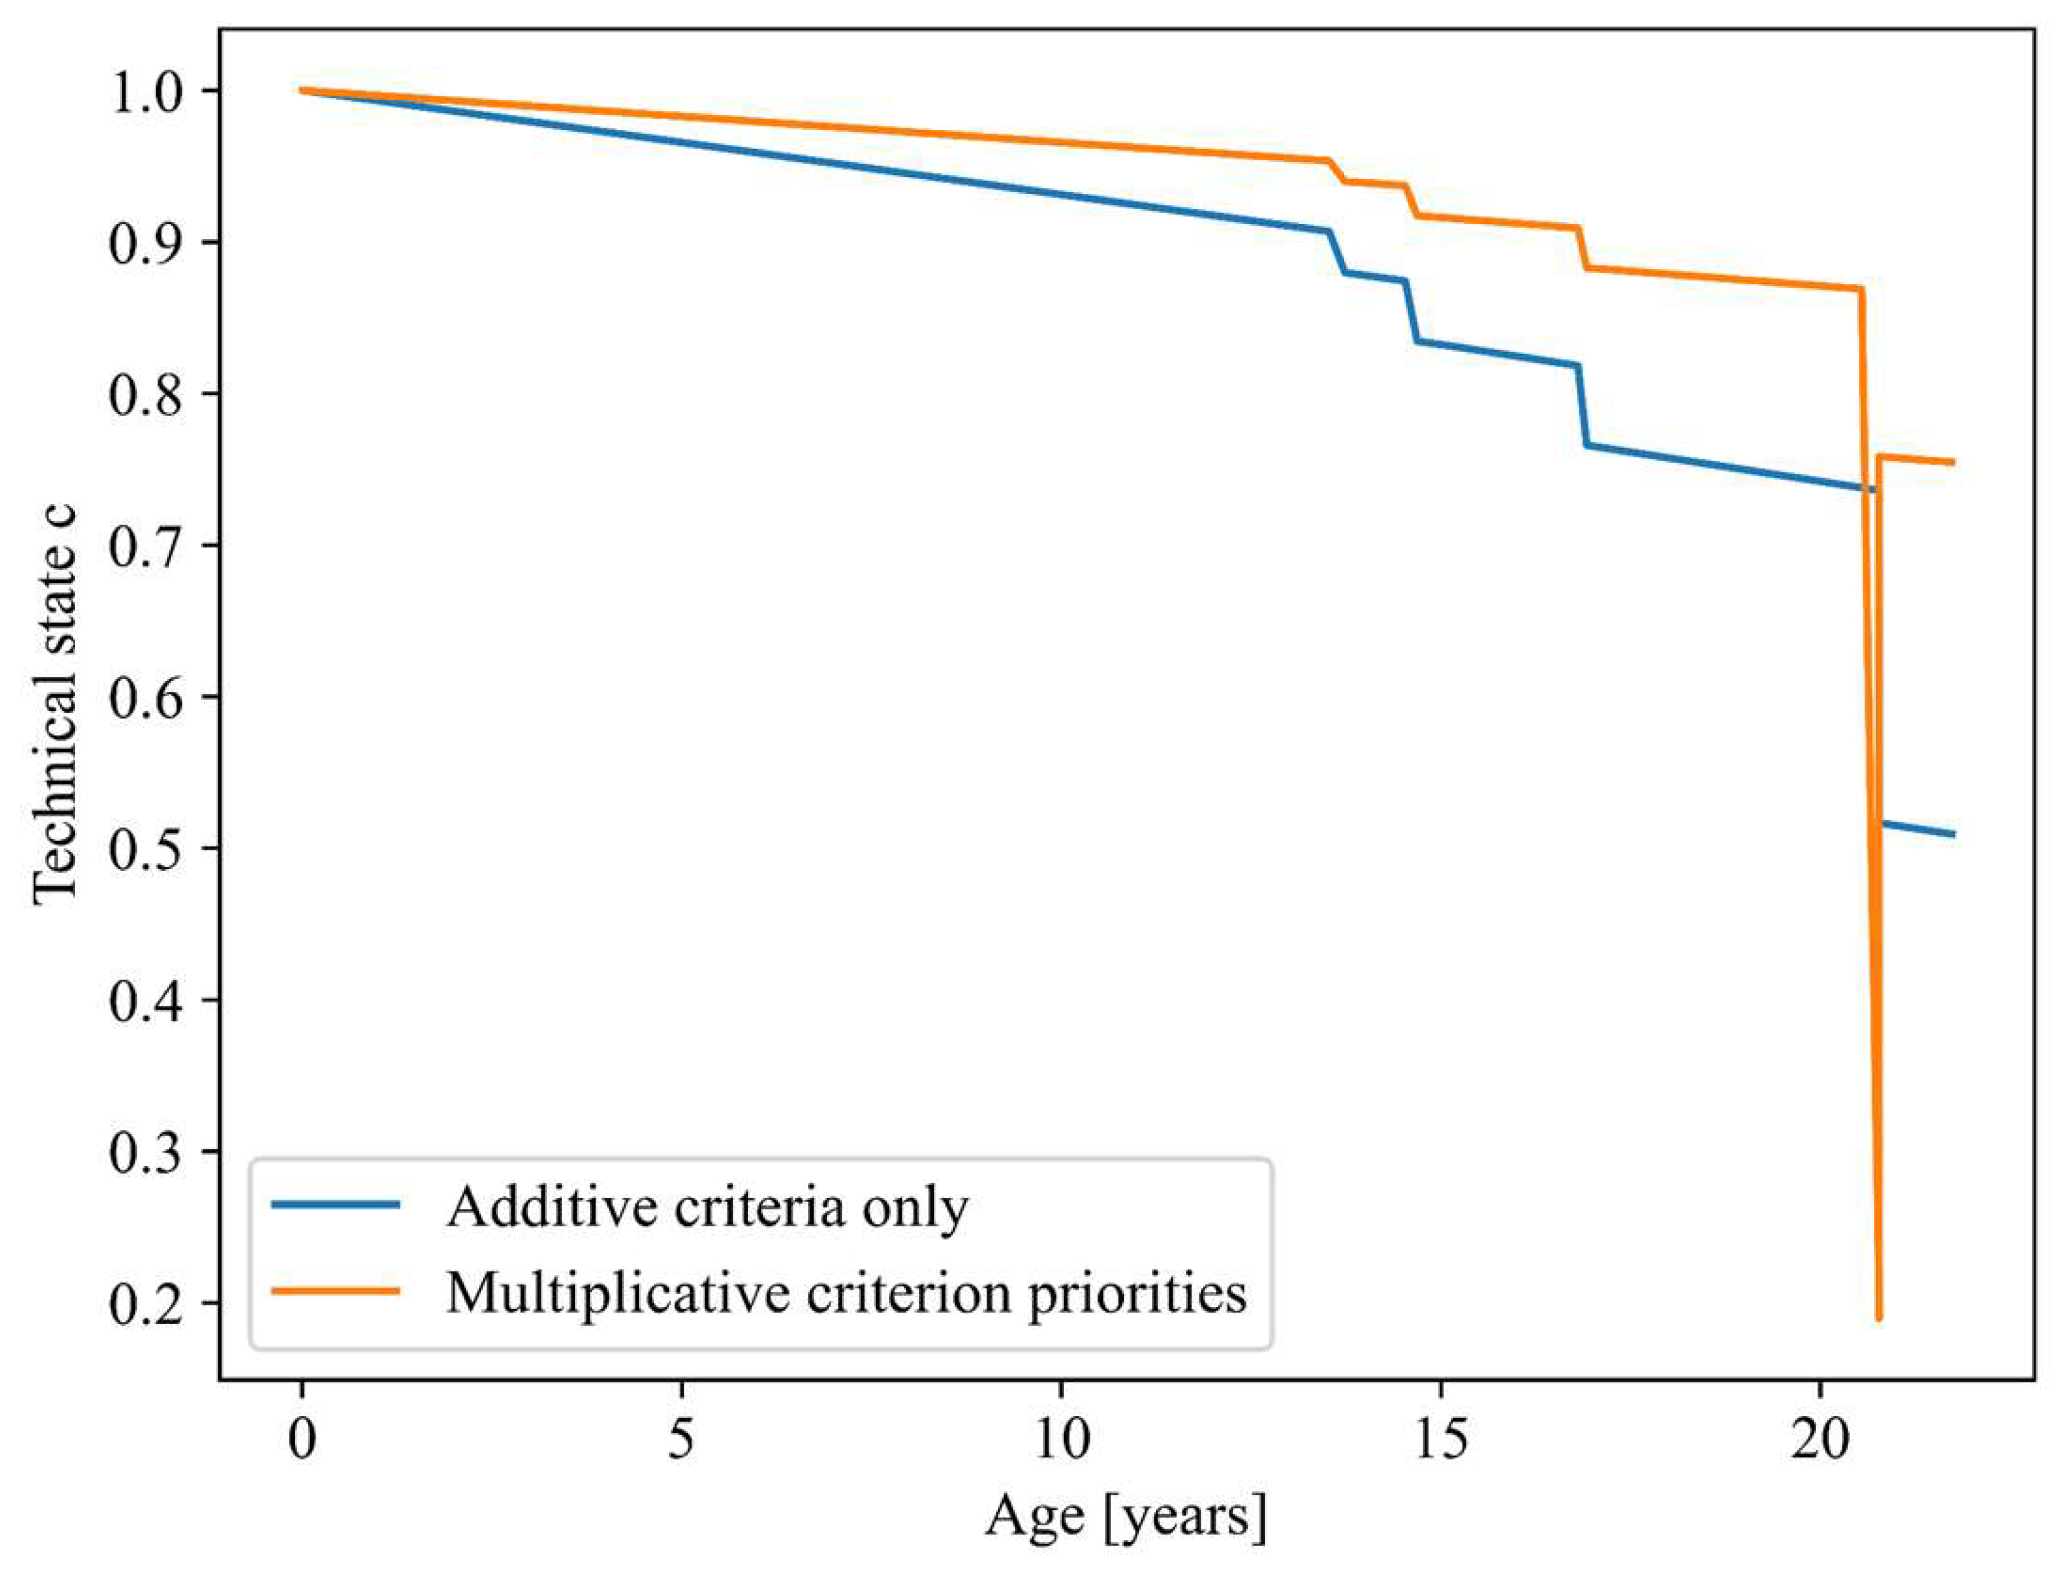
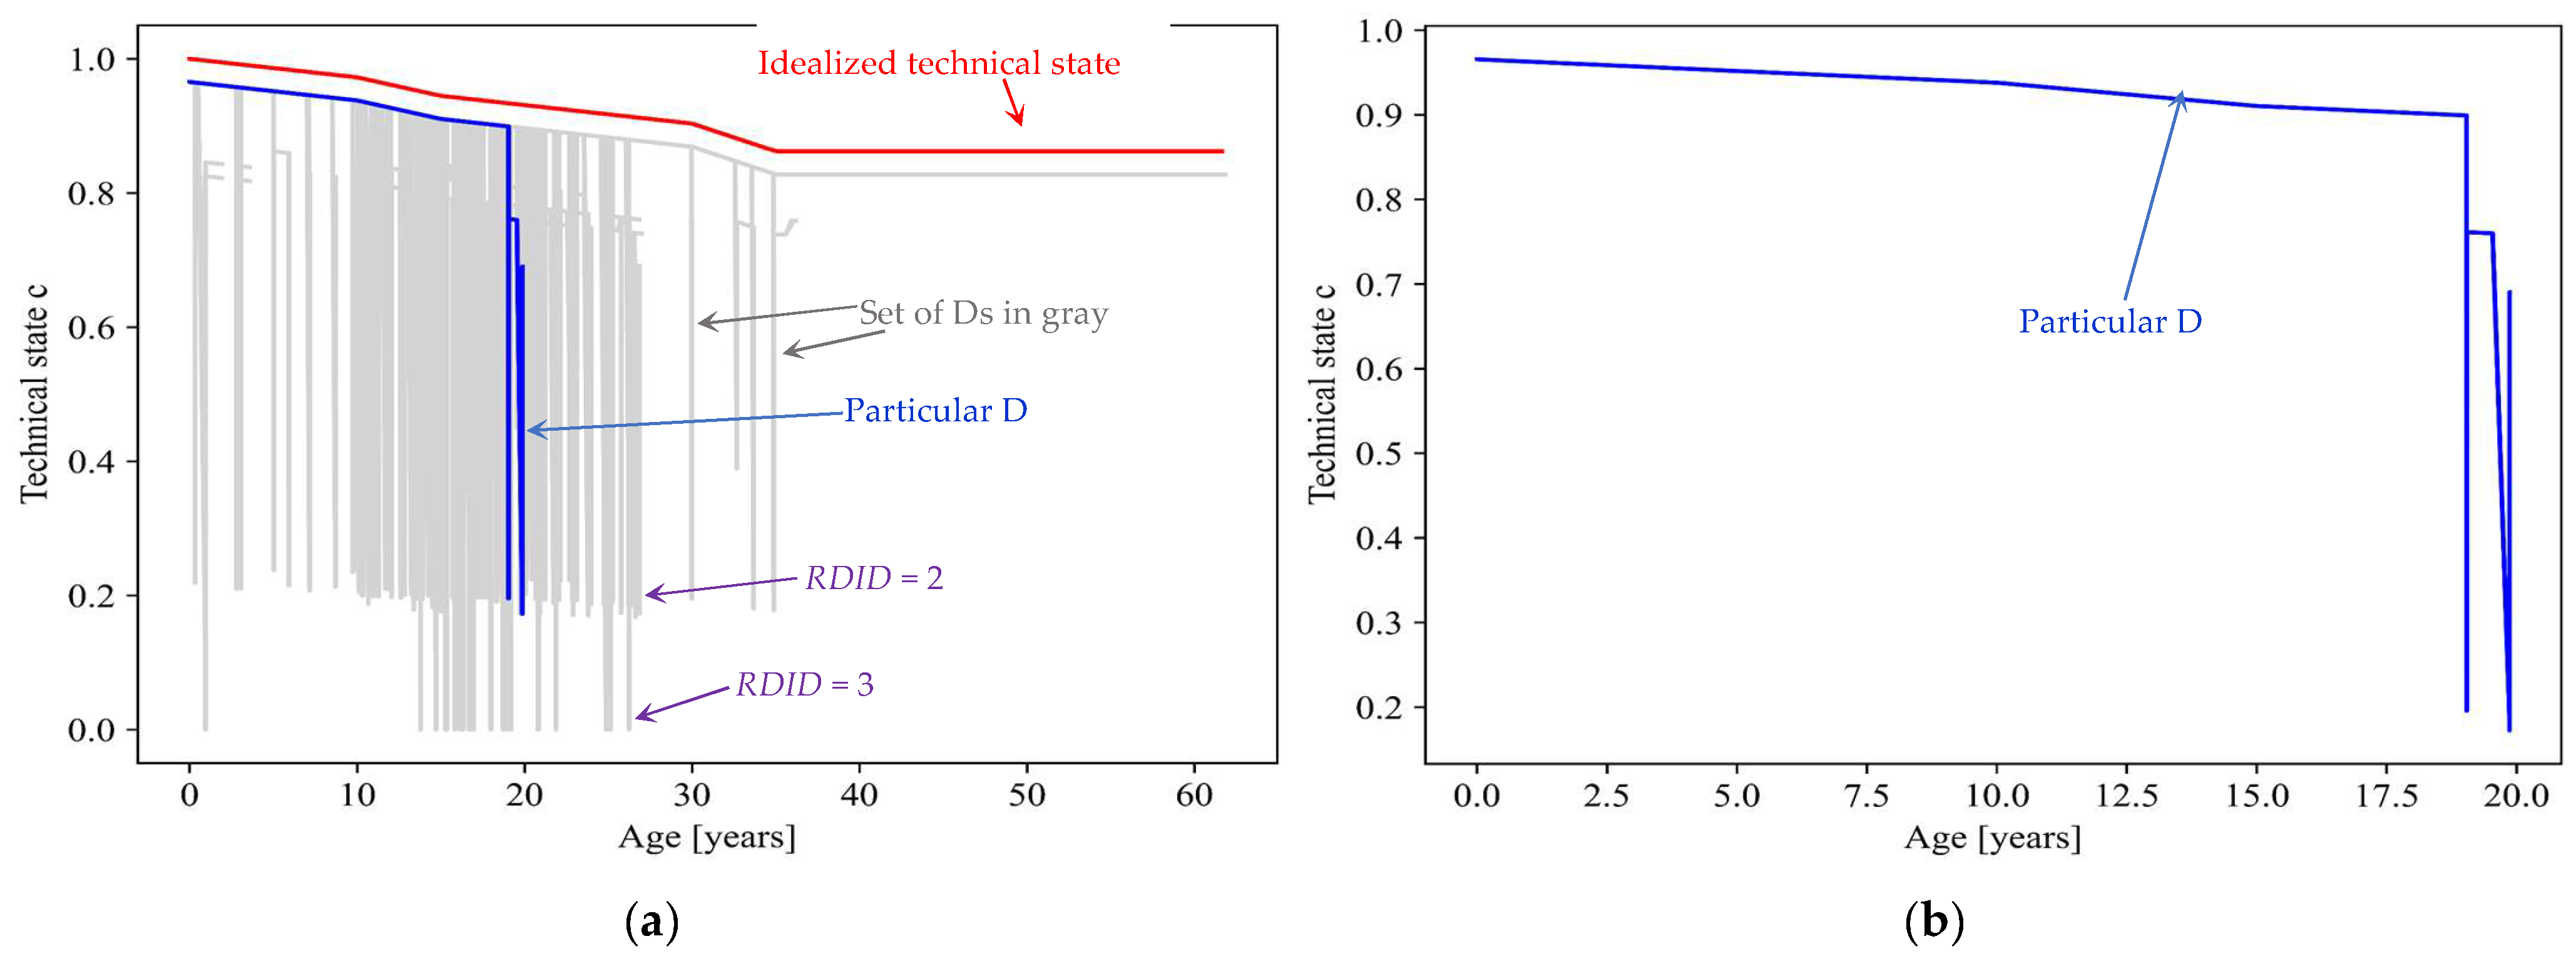
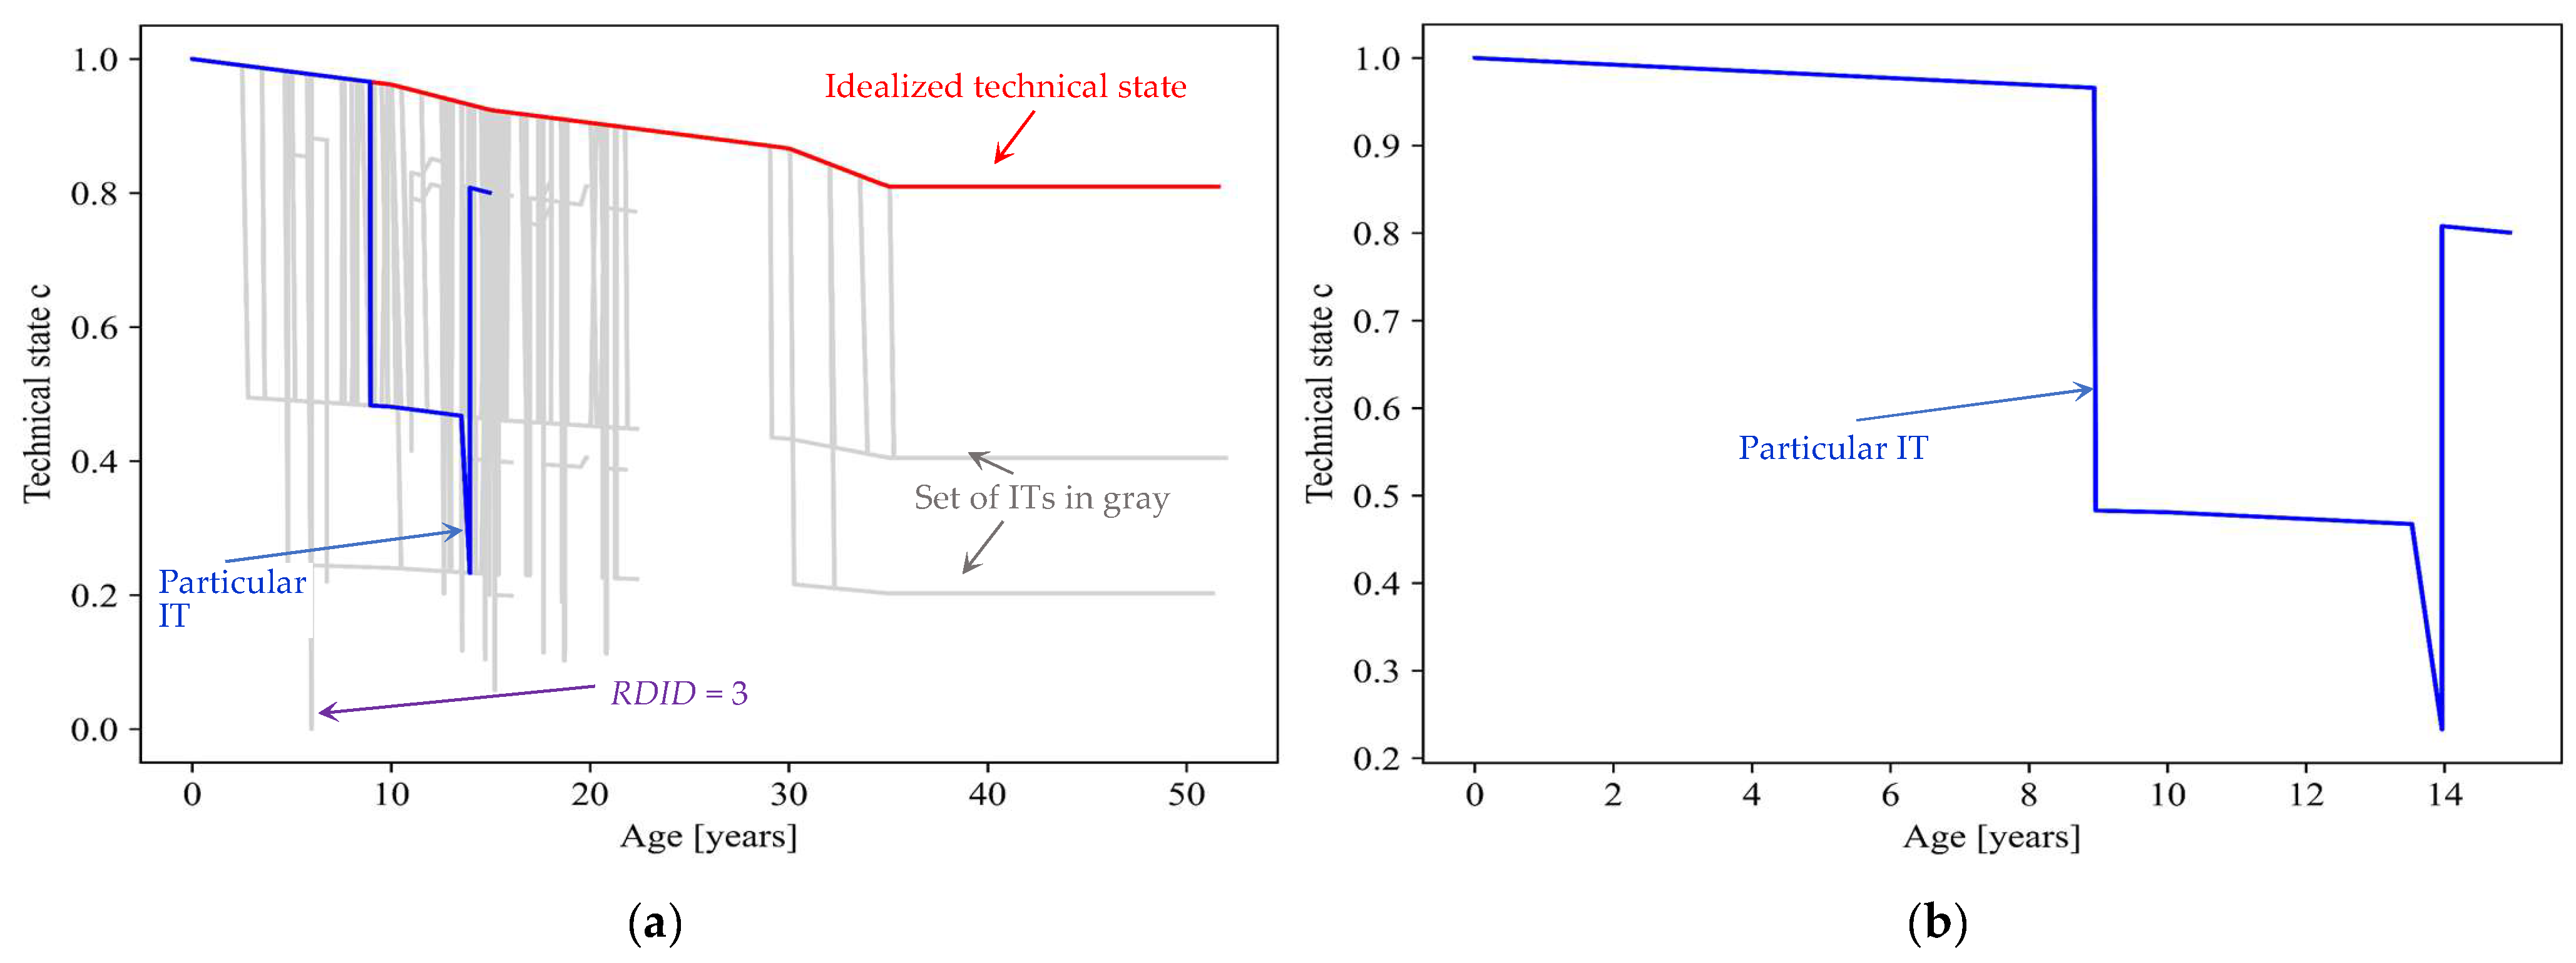
Disclaimer/Publisher’s Note: The statements, opinions and data contained in all publications are solely those of the individual author(s) and contributor(s) and not of MDPI and/or the editor(s). MDPI and/or the editor(s) disclaim responsibility for any injury to people or property resulting from any ideas, methods, instructions or products referred to in the content. |
© 2025 by the authors. Licensee MDPI, Basel, Switzerland. This article is an open access article distributed under the terms and conditions of the Creative Commons Attribution (CC BY) license (https://creativecommons.org/licenses/by/4.0/).