Article

Data-Driven Prediction of Binder Rheological Performance in RAP/RAS-Containing Asphalt Mixtures

by
Eslam Deef-Allah
1,2 and
Magdy Abdelrahman
1,*
1
Department of Civil, Architectural, and Environmental Engineering, Missouri University of Science & Technology, Rolla, MO 65409, USA
2
Construction Engineering and Utilities Department, Faculty of Engineering, Zagazig University, Zagazig 44519, Egypt
*
Author to whom correspondence should be addressed.
Appl. Sci. 2025, 15(13), 6976; https://doi.org/10.3390/app15136976
Submission received: 22 May 2025 / Revised: 14 June 2025 / Accepted: 18 June 2025 / Published: 20 June 2025
(This article belongs to the Section Civil Engineering)

Abstract

:
Asphalt recycling technologies have advanced considerably over the last few decades with the utilization of reclaimed asphalt pavements (RAP) and recycled asphalt shingles (RAS). Characterizing aged and heterogeneous binders in these mixtures is challenging, particularly with limited extracted binders. This study suggests a data-driven framework that considers the rheological, chemical, and thermal characteristics to predict the binders’ performance. Ninety-seven mixtures with 0–35% of the asphalt binder replaced with RAP/RAS binders were included as cores from the field, plant-produced mixtures, and laboratory-fabricated mixtures. The binders were chemically quantified using aging, aromatic, and aliphatic indices. Thermal analyses of the binders involved the percentage of the thermal residue. The framework predicted the rheological resistance of the binders to rutting and cracking using linear and nonlinear machine learning models. The nonlinear models outperformed the linear models for the three rheological parameters. The nonlinear models achieved a 69% reduction in the root mean square error (RMSE) for rutting, a 37% reduction in the RMSE for fatigue cracking, and a 21% reduction in the RMSE for thermal cracking. However, the nonlinear models overfitted for block cracking and had an RMSE 41% higher than the linear models, despite a perfect correlation (R = 1.00). The feature importance demonstrated the strong effects of the chemical and thermal parameters on rheological prediction. The data-driven framework can successfully support efforts to better manage asphalt recycling by predicting the binder performance.

1. Introduction

The economic and environmental incentives ultimately supported the growing utilization of recycled asphalt pavement (RAP) and recycled asphalt shingles (RAS) in asphalt mixtures. These include savings from construction waste and from virgin materials [1,2,3]. Heterogeneous and aged binders in RAP/RAS-containing mixtures may yield some potential performance deficiencies, such as stiffening and reduction of cracking resistance. Such issues jeopardize the longevity and resilience of pavements in cold conditions [4,5,6]. Therefore, the long-term sustainability of pavement is heavily dependent on better knowledge and prediction of the rheological properties of the binders extracted from different mixtures, including RAP and RAS. The rheological properties of the binder are sensitive to the use of RAP/RAS in asphalt mixtures. Conventional binder testing methodologies, including rheological assessments, necessitate specific quantities that may be inadequate following recovery and extraction procedures, hence limiting binder characterization [5,7]. This limitation may hinder a detailed characterization of the binder, as RAP/RAS comprises significantly aged binders with heterogeneous properties [8,9].
Previous studies have shown that rheological and chemical properties significantly influence the evaluation of aged binders’ performance [10,11]. The incorporation of RAP/RAS into mixtures alters the chemical composition and thermal decomposition of the extracted binders. More aliphatic compounds are converted to aromatics, and more aging indices are chemically detected in extracted binders from mixtures with RAP/RAS [12,13]. An increased level of thermal residue is generally indicative of a high asphaltene content, leading to a weakened fatigue life and lower resistance to thermal cracking of asphalt [12,14,15]. These alternations can be monitored using advanced techniques [i.e., Fourier transform infrared (FTIR) spectroscopy and thermogravimetric analysis (TGA)] on sub-milligram binders. Consequently, these methodologies offer an optimal alternative for analyzing characteristics when the binder is limited and a comprehensive understanding of aging and performance behavior is sought.
Numerous challenges persist in predicting the rheological performance of binders subjected to chemical and thermal characterization. The main reason for this is the inter-composition complexity of the binder components [16,17], nonlinear relationships among their properties, and complexity due to the high dimensionality of the data, which are more difficult to handle using conventional linear modeling. Data-driven techniques provide a good framework for processing this complexity. Machine learning is a specific example of these techniques. They extract correlations that can be predicted from different types of datasets. Random forest (RF) regression is an example of an ensemble model that handles complex interactions that are not linear between the input features and the targeted outcomes. They also do not assume functional relationships in advance. RF regression uses a parallel ensemble, which fits many decision trees simultaneously. Then, majority voting is used. This process reduces the overfitting problems. In addition, the procedure refines the precision of the predictions [18,19]. These modeling procedures are best suited for studies with multiple independent variables, such as asphalt binder replacement (ABR) by RAP/RAS, asphalt content (AC), chemical indices, age of the mix, and thermal residue, interacting with the complex responses of rheological characteristics. They also provide interpretability tools, such as feature importance and correlation heatmaps, that can instruct users on the relative contribution of different predictors to outcome patterns and subsequent design decisions regarding materials [20].
The prediction power of machine learning models, including decision trees and RF, has been used in various aspects of asphalt applications, such as roughness [21], rutting of asphalt mixes, including RAP [22], and optimum AC [23]. Decision tree-based Algorithms were used to predict the mechanical performance of asphalt mixtures containing RAP and demolition waste materials [24]. This study highlighted the importance of RAP content in the prediction process [24]. Another study [25] highlighted the importance of RAP content on the moisture susceptibility of asphalt mixtures using XGBoost models. Mixture stiffness was predicted using artificial neural networks with a high influence of RAS content on the dynamic modulus of the mixture [26]. Another study [27] conceptualized an ensemble machine-learning model to tackle the rutting and fatigue predictions of mixtures with RAP, citing binder content, asphalt grade, and RAP content as major predictor parameters. The main concern of these studies was the use of machine learning to predict the performance of asphalt mixtures. In contrast, little consideration has been given to the performance assessment of the extracted binder, particularly its evaluation through chemical and thermal analyses and their correlations with rheological properties.
Recent studies have explored the correlations between the rheological, thermal, and chemical properties of extracted binders from mixtures, including RAP/RAS [5,12,15,28]. The thermal residue and percentages of light-combusted components (LCC) during the pyrolysis of asphalt binders were correlated with the rutting parameter (G*/sinδ). The extracted binders with fewer aged components resulting from the lower RAP/RAS binder replacements contained higher LCC percentages and lower thermal residues and asphaltene content and exhibited lower G*/sinδ values, diminishing the rutting resistance [5]. Having the highest aging components from RAP/RAS binder replacements, the extracted binder showed the highest fatigue cracking value (G*.sinδ), thereby diminishing the binder’s resistance to fatigue cracking, which coincided with the highest thermal residue percentage, the highest carbonyl index, the highest aromatic index, and the lowest aliphatic index [12,15]. FTIR indices were correlated to the surface free energy of binder blends containing the RAP binder. Increasing the RAP binder reduced the surface free energy, likely because of the higher asphaltene content. However, the study [28] did not establish a clear correlation between the rheological and chemical properties of the binders. These previous studies pioneered the scope of the current study; however, they relied on bivariate correlations. The present study broadened the previous scope by incorporating multiple binders extracted from diverse mixture conditions, including various binder substitutions of RAP/RAS, into the multivariate machine learning models.
The main objective of this study was to present a comprehensive framework for predicting the rheological characteristics of asphalt binders extracted from RAP/RAS-containing asphalt mixtures. Machine learning models were developed, validated, and compared in this study. Statistical analyses were conducted to highlight the models’ predictive power.

2. Materials and Methods

2.1. Materials

Ninety-seven asphalt mixtures incorporating RAP, RAS, or both were considered in this study. The ABR by RAP-RAS ranged from 0 to 35%. Sixty mixtures were collected as cores from the field, twelve mixtures were obtained from the plant, and twenty-five mixtures were fabricated in the laboratory. Twelve field, plant, and laboratory mixtures shared the same components. The ages of the mixtures during the sampling process ranged from 0.04 to 14.00 years. The original binders had PGs of 46–34, 58–28, 64–22, 64–22H, and 70–22. The total AC percentage ranged from 4.7 to 6.2%. The details of these mixtures are listed in Table 1.

2.2. Methods

Following the collection of plant and field mixtures, laboratory samples were prepared. The proposed experimental framework is illustrated in Figure 1. This framework consists of five stages. The first stage involves the extraction and recovery of asphalt binders from asphalt mixtures. After the extraction and recovery processes, the second stage entailed chemical analyses using FTIR to verify that no trichloroethylene (TCE) remained in the extracted binders. Additionally, this stage aimed to assess the aging, aromatic, and aliphatic components of the extracted binders. The third stage focused on rheological assessments of the extracted binders at high, intermediate, and low temperatures. The fourth stage consisted of thermal analyses of the extracted binders using TGA. Finally, the last stage aimed to employ machine learning algorithms to predict the rheological parameters based on the descriptions of mixtures and analyses of binders, including their chemical and thermal properties.

2.2.1. Extraction and Recovery

The asphalt binders were extracted from asphalt mixtures using a centrifuge extractor, following ASTM D2172/D2172M-24 [29]. The mixtures were soaked in TCE solvent for 55 min before the centrifuge process was initiated, collecting the extracted effluent in a 2000 mL graduated cylinder. A 200 mL portion of TCE was added to the mixtures and left to sit for 10 min, after which the centrifuge process was initiated again. This process was repeated until the effluent exhibited a straw color. The binders were recovered from the solvents using a rotavapor after removing the mineral matter using a filterless centrifuge, following ASTM D5404/D5404M-24 [30]. The testing parameters involved a 40 mm Hg vacuum below atmospheric pressure, an oil bath temperature of 140 °C, carbon dioxide flow at 500 mL/min, maintaining an inert environment, and flask rotation at 40 rpm. These conditions persisted for about 2 h until minor TCE condensations were observed. Following that, intensified conditions were implemented for 10 min, which included immersing the flask in oil to 40 mm, increasing the vacuum to 600 mm Hg below atmospheric pressure, and increasing flask rotation to 45 rpm.

2.2.2. Chemical Analyses

An FTIR spectrometer was used to analyze the molecular vibrations and check for any remaining TCE in the binders. A thin film of the binder was placed on the diamond crystal to reduce the overall reflection. The test was performed using 32 scans with a resolution of 4 using wavenumbers between 4000 and 400 cm−1. Qualitative FTIR analyses aimed to compare spectra of TCE and binders, ensuring no TCE remained in the extracted binders. Quantitative FTIR analyses were performed by evaluating the aging indices [carbonyl (ICO) and sulfoxide (ISO) indices], aromatic index (ICC), and aliphatic index (ICH). At 1700 cm−1, the ICO shows aging due to carbonyl (C=O) as shown in Equation (1). At 1030 cm−1, ISO represents sulfoxide-induced aging (S=O); see Equation (2) [31,32]. The absorption bands for methylene (CH2) at 1460 cm−1 and methyl (CH3) at 1375 cm−1 indicate the C–H bending vibrations, which are not significantly affected by aging [31,33]. Equations (3) and (4) were employed to calculate the C=C stretching in the ICC and C–H bending in the ICH, respectively [28,34]. The increase in ICC and decrease in ICH reflect the aging processes of asphalt binders, as low-molecular-weight aliphatic compounds are converted into high-molecular-weight aromatics [28].
The following equation depicts the ICO:
I C O = A r e a   a t   1700   cm 1   band A r e a   a t   1460   cm 1   band + A r e a   a t   1375   cm 1   band ,
The subsequent equation defines ISO:
I S O = A r e a   a t   1030   cm 1   band A r e a   a t   1460   cm 1   band + A r e a   a t   1375   cm 1   band ,
The ICC was calculated using the following equation:
I C C = A r e a   a t   1600   cm 1   band A r e a   a t   1460 ,   1375 ,   1030 ,   1700 , a n d   1600   cm 1   bands ,
The following equation defines ICH:
I C H = A r e a   a t   1460   cm 1   band + A r e a   a t   1376   cm 1   band A r e a   a t   1460 ,   1375 ,   1030 ,   1700 , a n d   1600   cm 1   bands ,

2.2.3. Rheological Analyses

The extracted binders were collected and rheologically characterized using a dynamic shear rheometer (DSR), as per ASTM D7175-15 [35]. To ensure that the results were repeatable, each binder was tested with two replicate samples, and the average results were calculated.

Rutting Parameter

Binder samples—extracted from mixtures aged 0.00 to 0.04 years—measuring 1 mm in thickness and 25 mm in diameter were tested for the G*/sinδ at 64 °C; 10 rad/s frequency; and 10% shear strain.

Fatigue Cracking Parameter

The fatigue cracking resistance values of binders extracted from field mixtures aged over 0.04 years were evaluated. The binder fatigue resistance was investigated for specimens with a diameter of 8 mm and a thickness of 2 mm at 25 °C, 10 rad/s frequency, and 1% shear strain using the G*.sinδ.

Block Cracking Parameter

The resistance to block cracking was assessed on samples tested for fatigue cracking. At 15 °C, with a frequency of 0.005 rad/s and 1% shear strain, the block cracking or Glover-Rowe (G-R) parameter was assessed and computed using Equation (5) [36,37,38].
Using Equation (5), the G-R parameter in kPa was determined as follows:
G - R = G *   ( ( cos δ ) 2 sin δ ) ,
where
G* is the complex shear modulus (kPa), and δ is the phase angle (°).

Thermal Cracking Parameter

Thermal cracking resistance was assessed on samples tested for fatigue and block cracking. The test was conducted on a DSR using 4 mm plates for samples with a thickness of 1.75 mm. A frequency sweep test was conducted on the binders at angular frequencies of 50.00, 39.81, 25.12, 15.85, 10.00, 6.31, 3.98, 2.51, 1.58, 1.00, 0.63, 0.39, 0.25, 0.15, and 0.10 rad/s, with a strain value of 0.001% at temperatures ranging from −24 to 12 °C in 6 °C increments, while maintaining a normal force of 1 ± 0.1 N.
Thermal cracking parameter (ΔTc) was assessed using Equation (6), as follows:
Δ T c = T c , S T c , m ,
where
Tc,S is the continuous temperature based on the binder’s stiffness and was calculated using Equation (7) as follows:
T c , S = T 1 + ( T 1 T 2 ) ( log 300 log S 1 ) log S 1 log S 2 10
Tc,m is the continuous temperature based on the binder’s m-value and was evaluated using Equation (8) as follows:
T c , m = T 1 + ( T 1 T 2 ) ( 0.3 m 1 ) m 1 m 2 10
T1 is the temperature at which S(t) and m-value passed (S(t) ≤ 300 MPa and m-value ≥ 0.3);
T2 is the temperature at which S(t) and the m-value failed (S(t) > 300 MPa and m-value < 0.3);
S1 represents the S(t) value at T1;
S2 symbolizes the S(t) value at T2;
m1 corresponds to the m-value at T1;
m2 stands for the m-value at T2.

2.2.4. Thermal Analyses

Binders were subjected to thermal analysis to estimate the residue percent (R%) following ASTM E1131-20 [39] using TGA and to characterize the influence of aging on the binders. R% was selected based on previous studies [12,15,40,41,42,43]. It was found that aging increased R%, and the use of rejuvenators decreased R% owing to changes in the asphalt fractions. Strong correlations with R2 values of 0.89 were found between the asphaltene content and R% [44,45]. Binders weighing 15–25 mg were heated from room temperature to 750 °C using a high-resolution dynamic method [46,47], a nitrogen flow rate of 60 mL/min, and a maximum heating rate of 50 °C/min. The high-resolution dynamic approach optimizes the resolution by continuously and dynamically varying the heating rate as the sample decomposes [46,47].

2.2.5. Data-Driven Predictions of Rheological Parameters

The rheological characteristics of the extracted binders were predicted from the mix data (e.g., total AC%, ABR by RAP%, ABR by RAS%, mix type, and mix age in years), chemical indices, and residue thermal percentage. This was accomplished using machine learning algorithms implemented in Python (version 3.13), both linear and nonlinear models. Feature importance plots and heat correlation maps were generated to identify the most critical factors in these models. Different statistical metrics were used to quantify the accuracy of the model predictions, including the coefficient of determination (R2), Pearson’s correlation coefficient (R), ratio of standard error to standard deviation (Se/Sy), mean residual, standard deviation (STD) of residual, and root mean square error (RMSE).
During model selection, different machine learning methods were reviewed, including support vector regression (SVR), artificial neural networks (ANN), and extreme gradient boosting (XGBoost). However, the RF was selected because of its better predictive power, inbuilt resistance to overfitting, and excellent interpretability in the presence of limited data or strongly nonlinear relations being modeled. In addition, RF is more practical and easier to explain than SVR or ANN, which require much more careful tuning, and then there is XGBoost, an actual overfitting risk [48,49,50].
In Python, an RF regressor is an ensemble learning method that creates and trains several decision trees on different sub-samples of data and features. The trees learn in parallel and independently of one another as to whether they will provide a systematic pattern by splitting the data according to a threshold value along the respective features. The final prediction for regression tasks provided by the RF is the average of all the tree outputs. This is because the RF regressor has many trees of various structures, with different decisions that result in a model that is not a linear equation defining the entire model. There are essentially two major parts to the RF process: training and testing the model. Training the model implies that the algorithms learn from the training data. The data are used to create decision trees, and their split is then refined to minimize the prediction error [48,49,50].
RF models were produced using the Python library (scikit-learn). A systematic search of the hyperparameters was conducted to select the parameters that optimized performance from cross-validation. The search space included 100, 200, and 300 trees using the n_estimators parameter. The maximum depths were none, 10, 20, and 30, specified by the max_depth parameter. The number of samples needed to split an internal node was 2, 5, and 10, as highlighted by the min_samples_split parameter. The number of samples at a leaf node was 1, 2, and 4, as specified by the min_samples_leaf parameter. The search was carried out using GridSearchCV to make a search and then determine the best parameters to use, dependent on cross-validation performance. To decrease potential sampling bias, the dataset was randomly shuffled and split, with scikit-learn’s internal functions, into an 80:20 training and test set to provide a balanced training and unbiased evaluation.

3. Results and Discussion

3.1. Ensuring No TCE Traces in the Extracted Binders

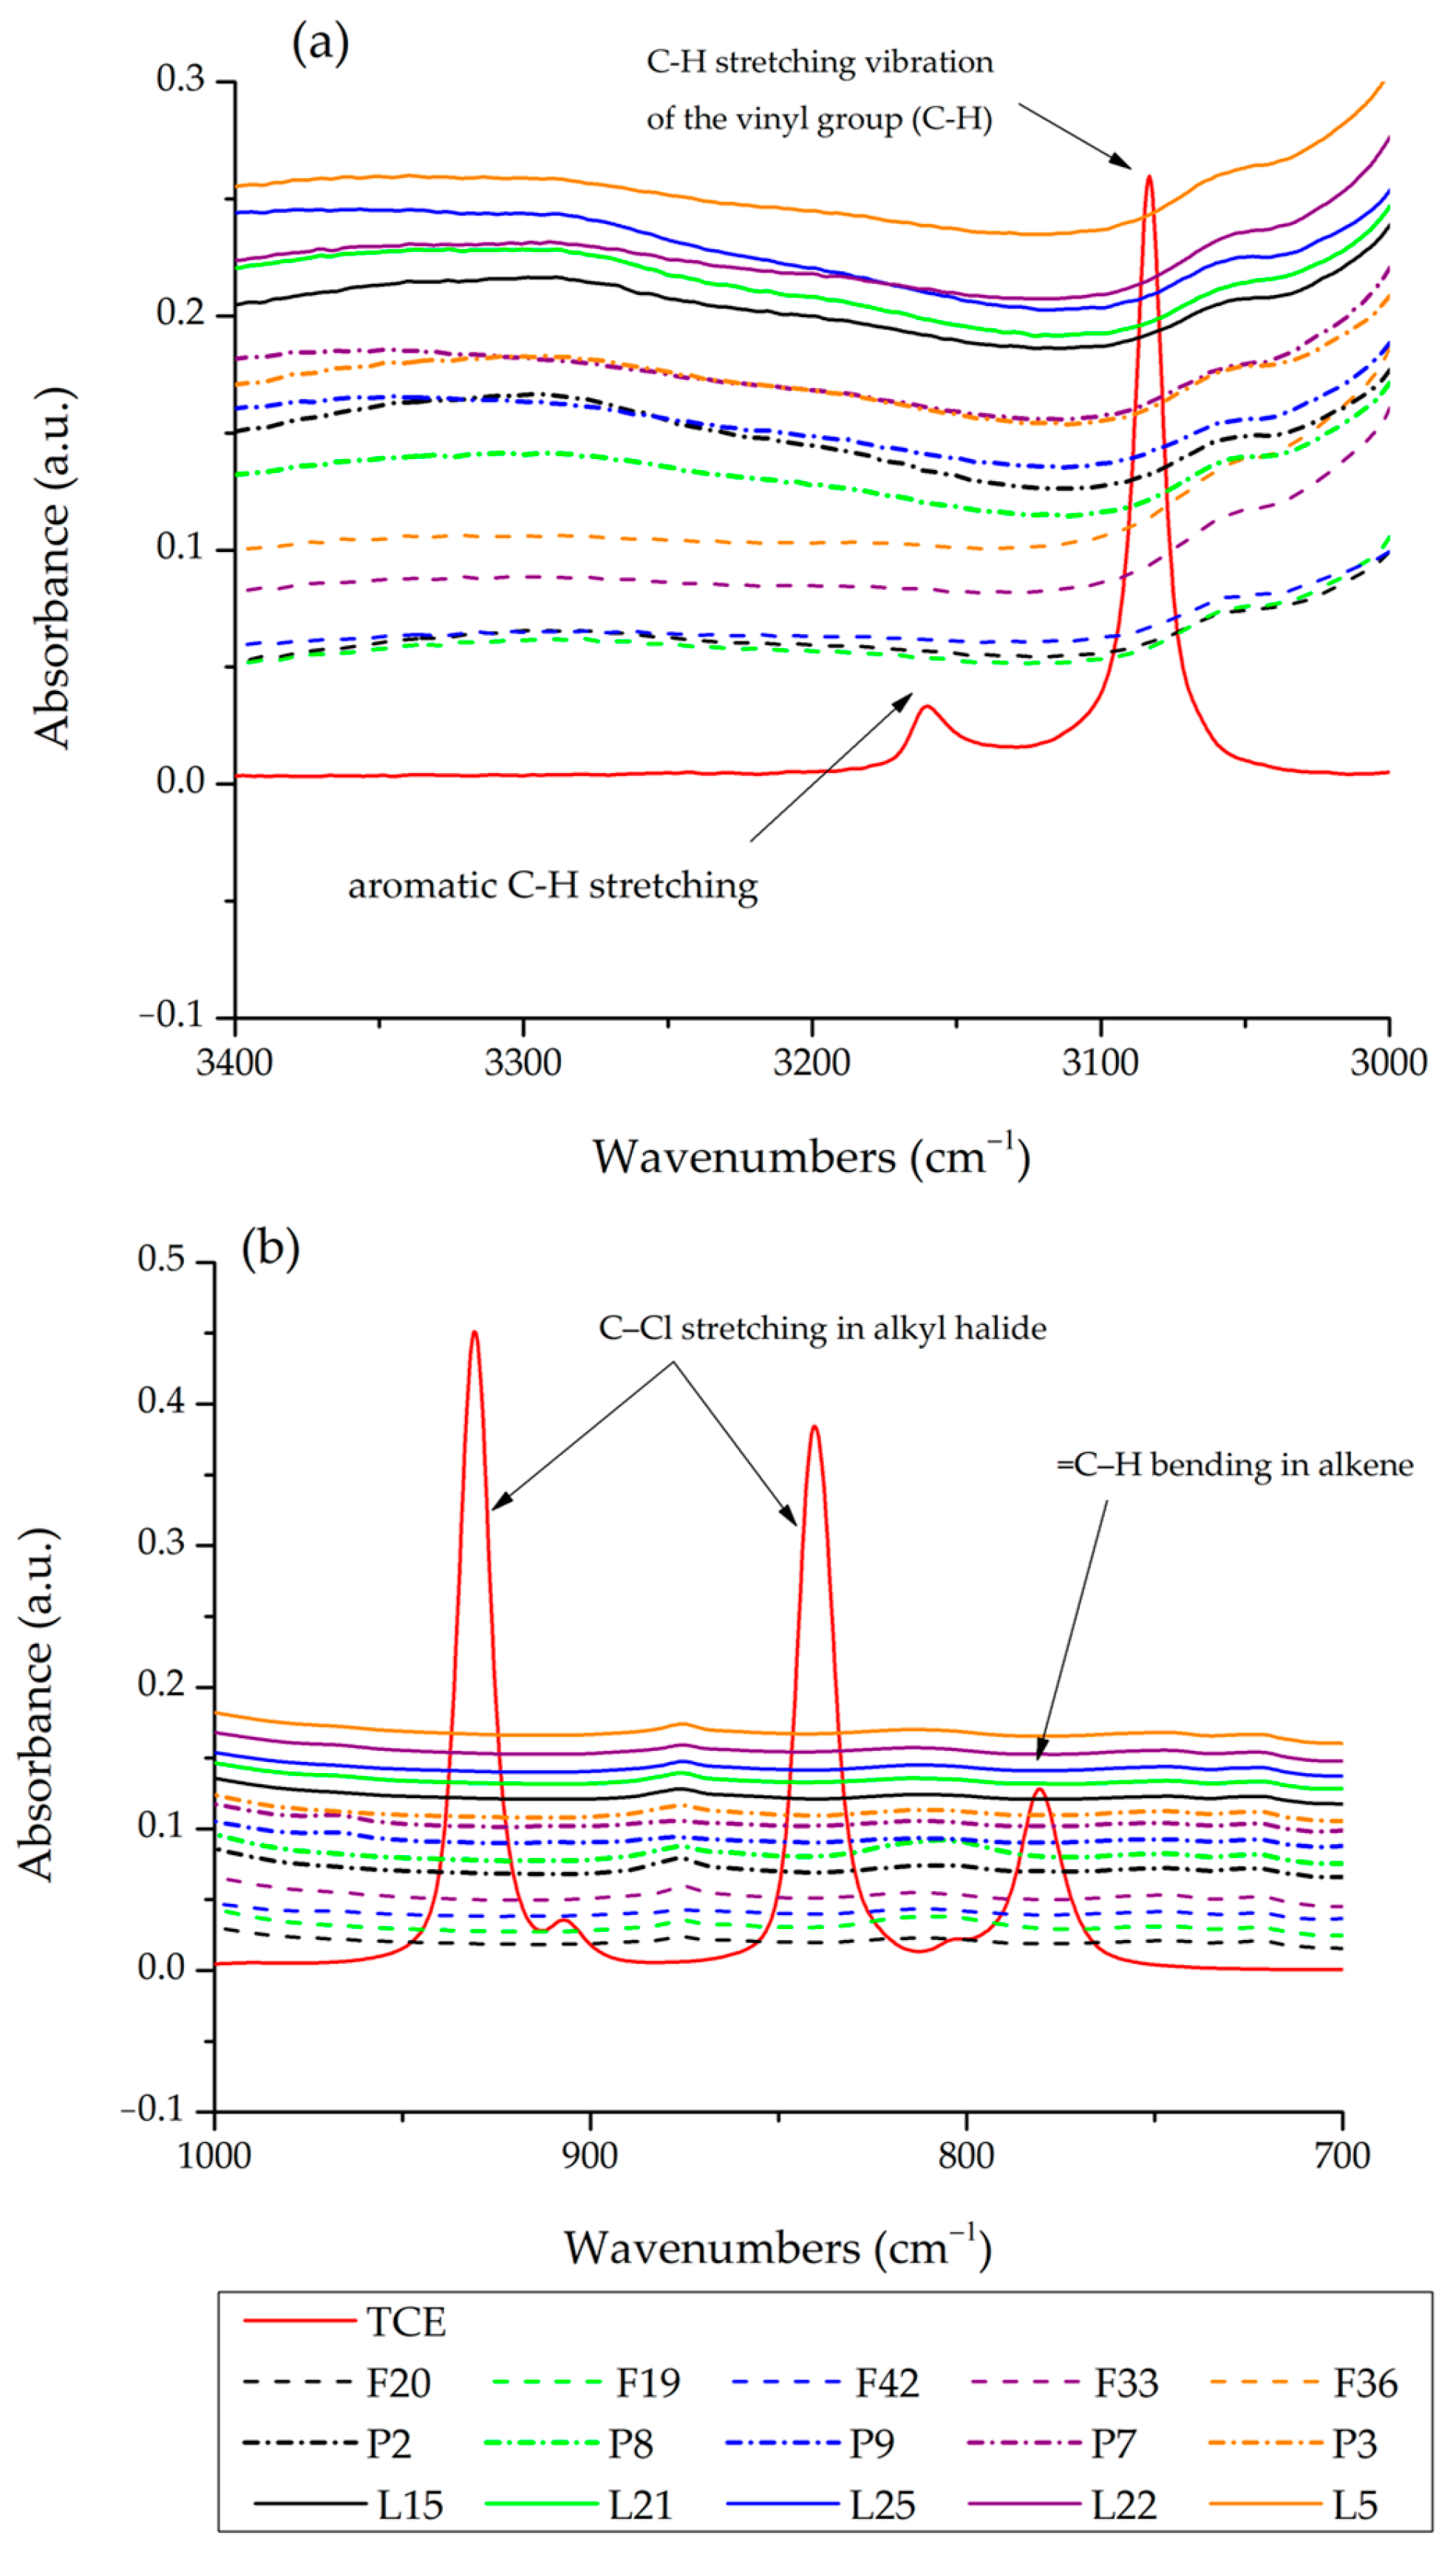
Prior to the characterization of the extracted binders, FTIR analyses were performed to compare the FTIR bands of the TCE and randomly selected extracted binders, as illustrated in Figure 2. The randomly selected samples comprised fifteen extracted binders: Five from field mixtures (F19, F20, F33, F36, and F42), five from plant mixtures (P2, P3, P7, P8, and P9), and five from laboratory mixtures (L5, L15, L21, L22, and L25). The major bands of TCE corresponded to the aromatic C–H stretching at 3150 cm−1, C–H stretching vibration of the vinyl group at 3060 cm−1, C–Cl stretching in alkyl halide between 944 and 849 cm−1, and =C–H bending in alkene at 783 cm−1 [51]. Figure 2 shows that no TCE traces were detected in the extracted binders. This conclusion was reached because of the absence of major TCE bands in the extracted binders.

3.2. Rheological, Chemical, and Thermal Characterization of the Extracted Binders

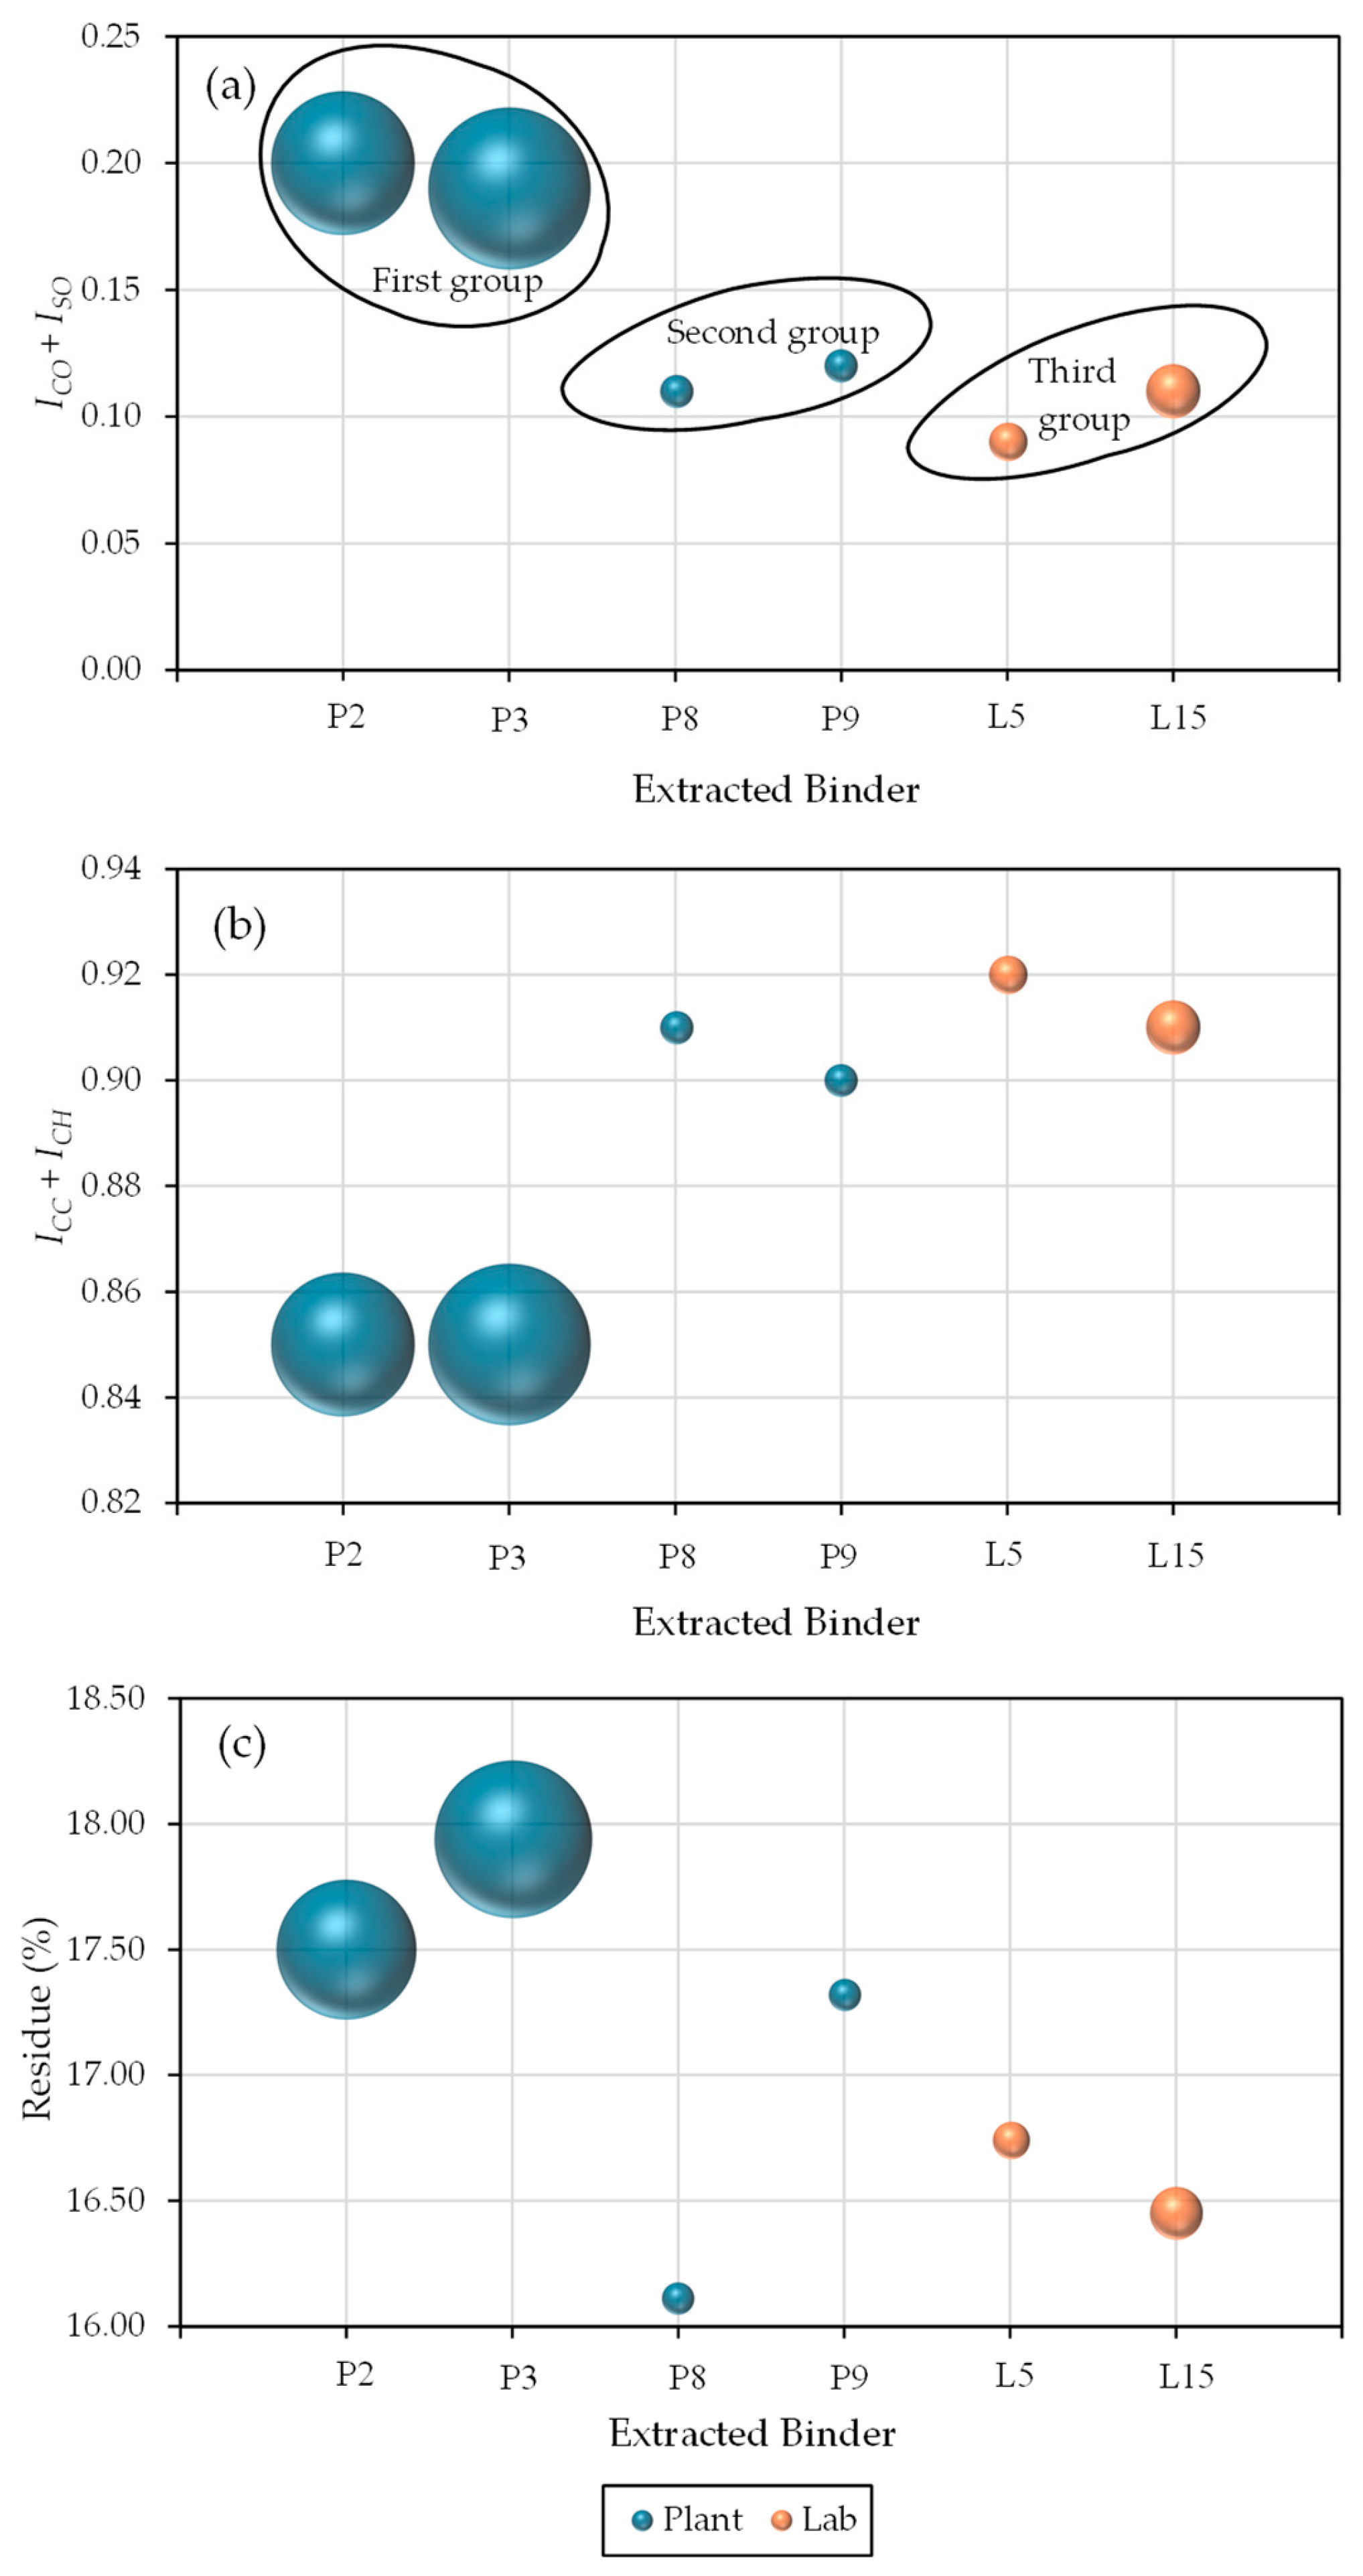
The rheological properties of the extracted binders were characterized and evaluated using FTIR chemical indices and thermal residue content. Figure 3 shows random groups of plant- and lab-extracted binders. In Figure 3a, the first and second groups represent plant-extracted binders (P2, P3, P8, and P9), whereas the third group represents laboratory-extracted binders (L5 and L15). The diameter of the bubbles reflected the rutting parameter. The larger the diameter, the greater the rutting parameter value. The first group of extracted binders containing RAS demonstrated the highest rutting performance. The second group of extracted binders, which included RAP, exhibited the lowest rutting parameters among all groups. The first sample in the third group of extracted binders (L5) contained the same components as the second group, but their corresponding mix was produced in the laboratory, resulting in similar rutting parameters. Binders with the highest rutting parameters (P2 and P3) had the highest aging indices in Figure 3a (ICO + ISO), the lowest aromatic plus aliphatic indices in Figure 3b (ICC + ICH), and the highest R% in Figure 3c. Higher aging indices and residue percentages indicate that the binders are more aged and contain more asphaltenes. Furthermore, during aging, aliphatic compounds are converted to aromatics [12,15,28,52]. Thus, binders exhibiting the greatest stiffness and rutting parameters demonstrated the lowest ICC + ICH values, as illustrated in Figure 3b. The incorporation of 20% rubber by weight of the binder in the L15 mix yielded an extracted binder with an elevated rutting parameter relative to that of the L5 extracted binder from the identical mix without rubber. This illustrates the impact of rubber on enhancing stiffness, as evidenced by the elevated aging indices in Figure 3a and diminished aromatic and aliphatic indices in Figure 3b.
The Pearson correlation and p-value analysis indicated a strong positive correlation between G*/sinδ and ICO + ISO (R = 0.97 and p-value < 0.05), suggesting that an increase in oxidative indices significantly increased binder stiffness. As binders became more aged, an increase in oxidative indices correlated with a decrease in aliphatic compounds and an increase in aromatics, leading to a higher ICO + ISO and a lower ICC + ICH [12,52]. Thus, G*/sinδ exhibits a strong negative correlation with ICC + ICH (R = −0.96 and p-value < 0.05). R% exhibited a moderate-to-strong positive correlation with G*/sinδ (R = 0.87 and p-value < 0.05), indicating that the thermal residue affects the rheological performance.
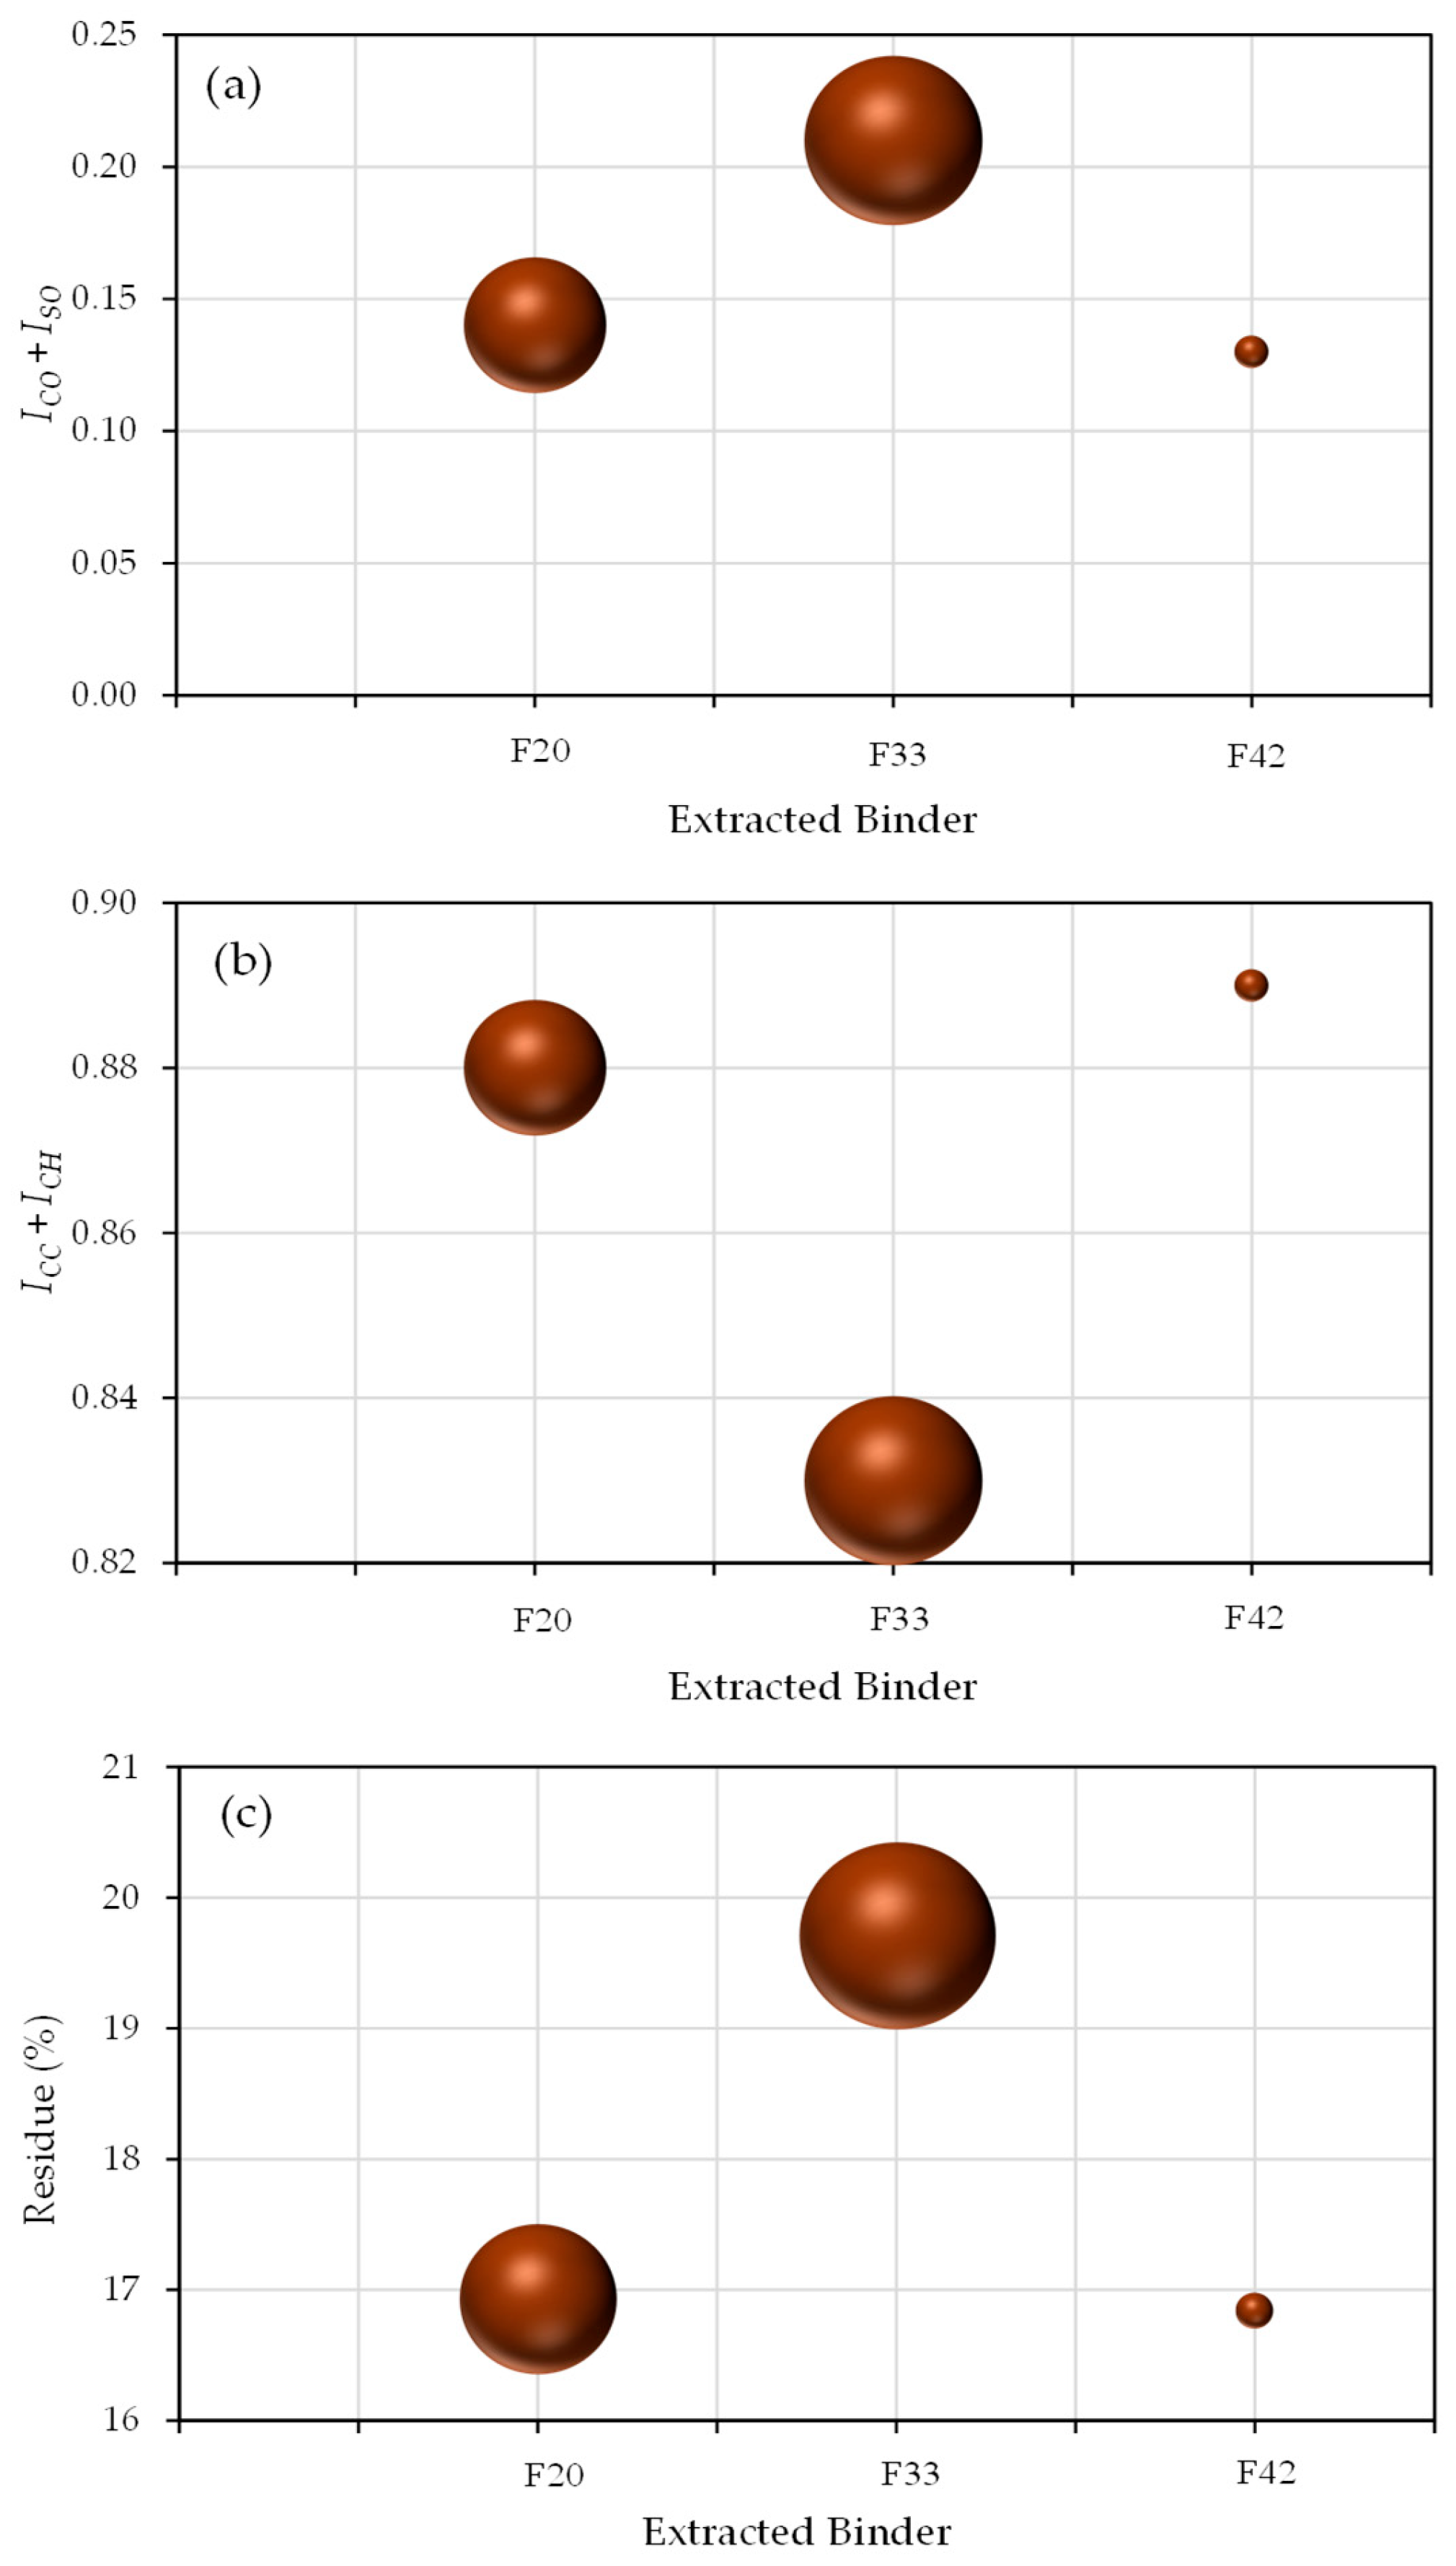
Figure 4 illustrates the fatigue and block-cracking parameters for the three extracted binders of the field mixes aged 4, 9, and 14 years (F20, F33, and F42). The diameters of the green bubbles indicate G*.sinδ values, whereas the diameters of the plum bubbles represent the G-R values. The results of the thermal cracking of the same samples (F20, F33, and F42) are illustrated in Figure 5, indicated by the diameter of the bubbles, which correspond to the ΔTc values. The first sample, F20, had 30% ABR from RAP; the second sample, F33, had 16–15% ABR from RAP-RAS, while the third sample contained neither RAP nor RAS. The F33 binder extracted from a mixture containing both RAP and RAS, which was 9 years old, exhibited the worst performance, with a G*.sinδ of 11,521.50 kPa, G-R of 5883.20 kPa, and a ΔTc of −9.60 °C. The chemical and thermal investigations corroborate that the F33 binder exhibited the highest aging indices (ICO + ISO = 0.21), the lowest ICC + ICH value at 0.83, and the highest R% at 19.71. In contrast, the F42 binder, extracted from a 14-year-old mixture with no recycled materials, had the best performance, with a G-R of 374.90 kPa and a ΔTc of −0.35 °C. This binder had the lowest ICO + ISO (0.13), the highest ICC + ICH (0.89), and the lowest R% (16.84). The F20 binder, including 30% ABR from RAP, exhibited intermediate behavior, aligning with its rheological and chemical characteristics.
The Pearson correlation and p-value analysis revealed a moderate positive correlation between G*.sinδ and ICO + ISO (R = 0.70), a moderate negative correlation between G*.sinδ and ICC + ICH (R = −0.67), and a moderate-to-strong positive correlation between G*.sinδ and R% (R = 0.76). The p-values exceeded 0.05, indicating that chemical and thermal analyses were not statistically significant in predicting the fatigue cracking parameters for the randomly selected samples F20, F33, and F42. A comparable statistical analysis was performed on G-R, thermal, and chemical properties. A strong positive correlation existed between G-R and ICO + ISO (R = 0.99), while a strong negative correlation was observed with ICC + ICH (R = −0.99). Furthermore, G-R exhibited an exceptionally robust positive correlation with R% (R = 1.00). The p-values for ICO + ISO and ICC + ICH surpassed 0.05, signifying that these chemical indices were not statistically significant predictors of block cracking resistance for the chosen samples. The correlation between G-R and R% was statistically significant (p-value < 0.05), indicating that thermal residue content (%R) significantly affects the binder’s resistance to block cracking. There was a strong negative correlation between ΔTc and ICO + ISO (R = −0.85), a strong positive correlation between ΔTc and ICC + ICH (R = 0.87), and a strong negative correlation between ΔTc and %R (R = −0.80). However, the p-values for all three correlations exceeded 0.05. Consequently, owing to the restricted statistical significance of individual chemical and thermal predictors in small sample sizes, machine learning algorithms were proposed and implemented on the complete dataset to enhance the predictive accuracy of binder performance parameters, as elaborated in Section 3.3.

3.3. Correlations Between Rheology and Other Parameters

3.3.1. Rutting Correlations

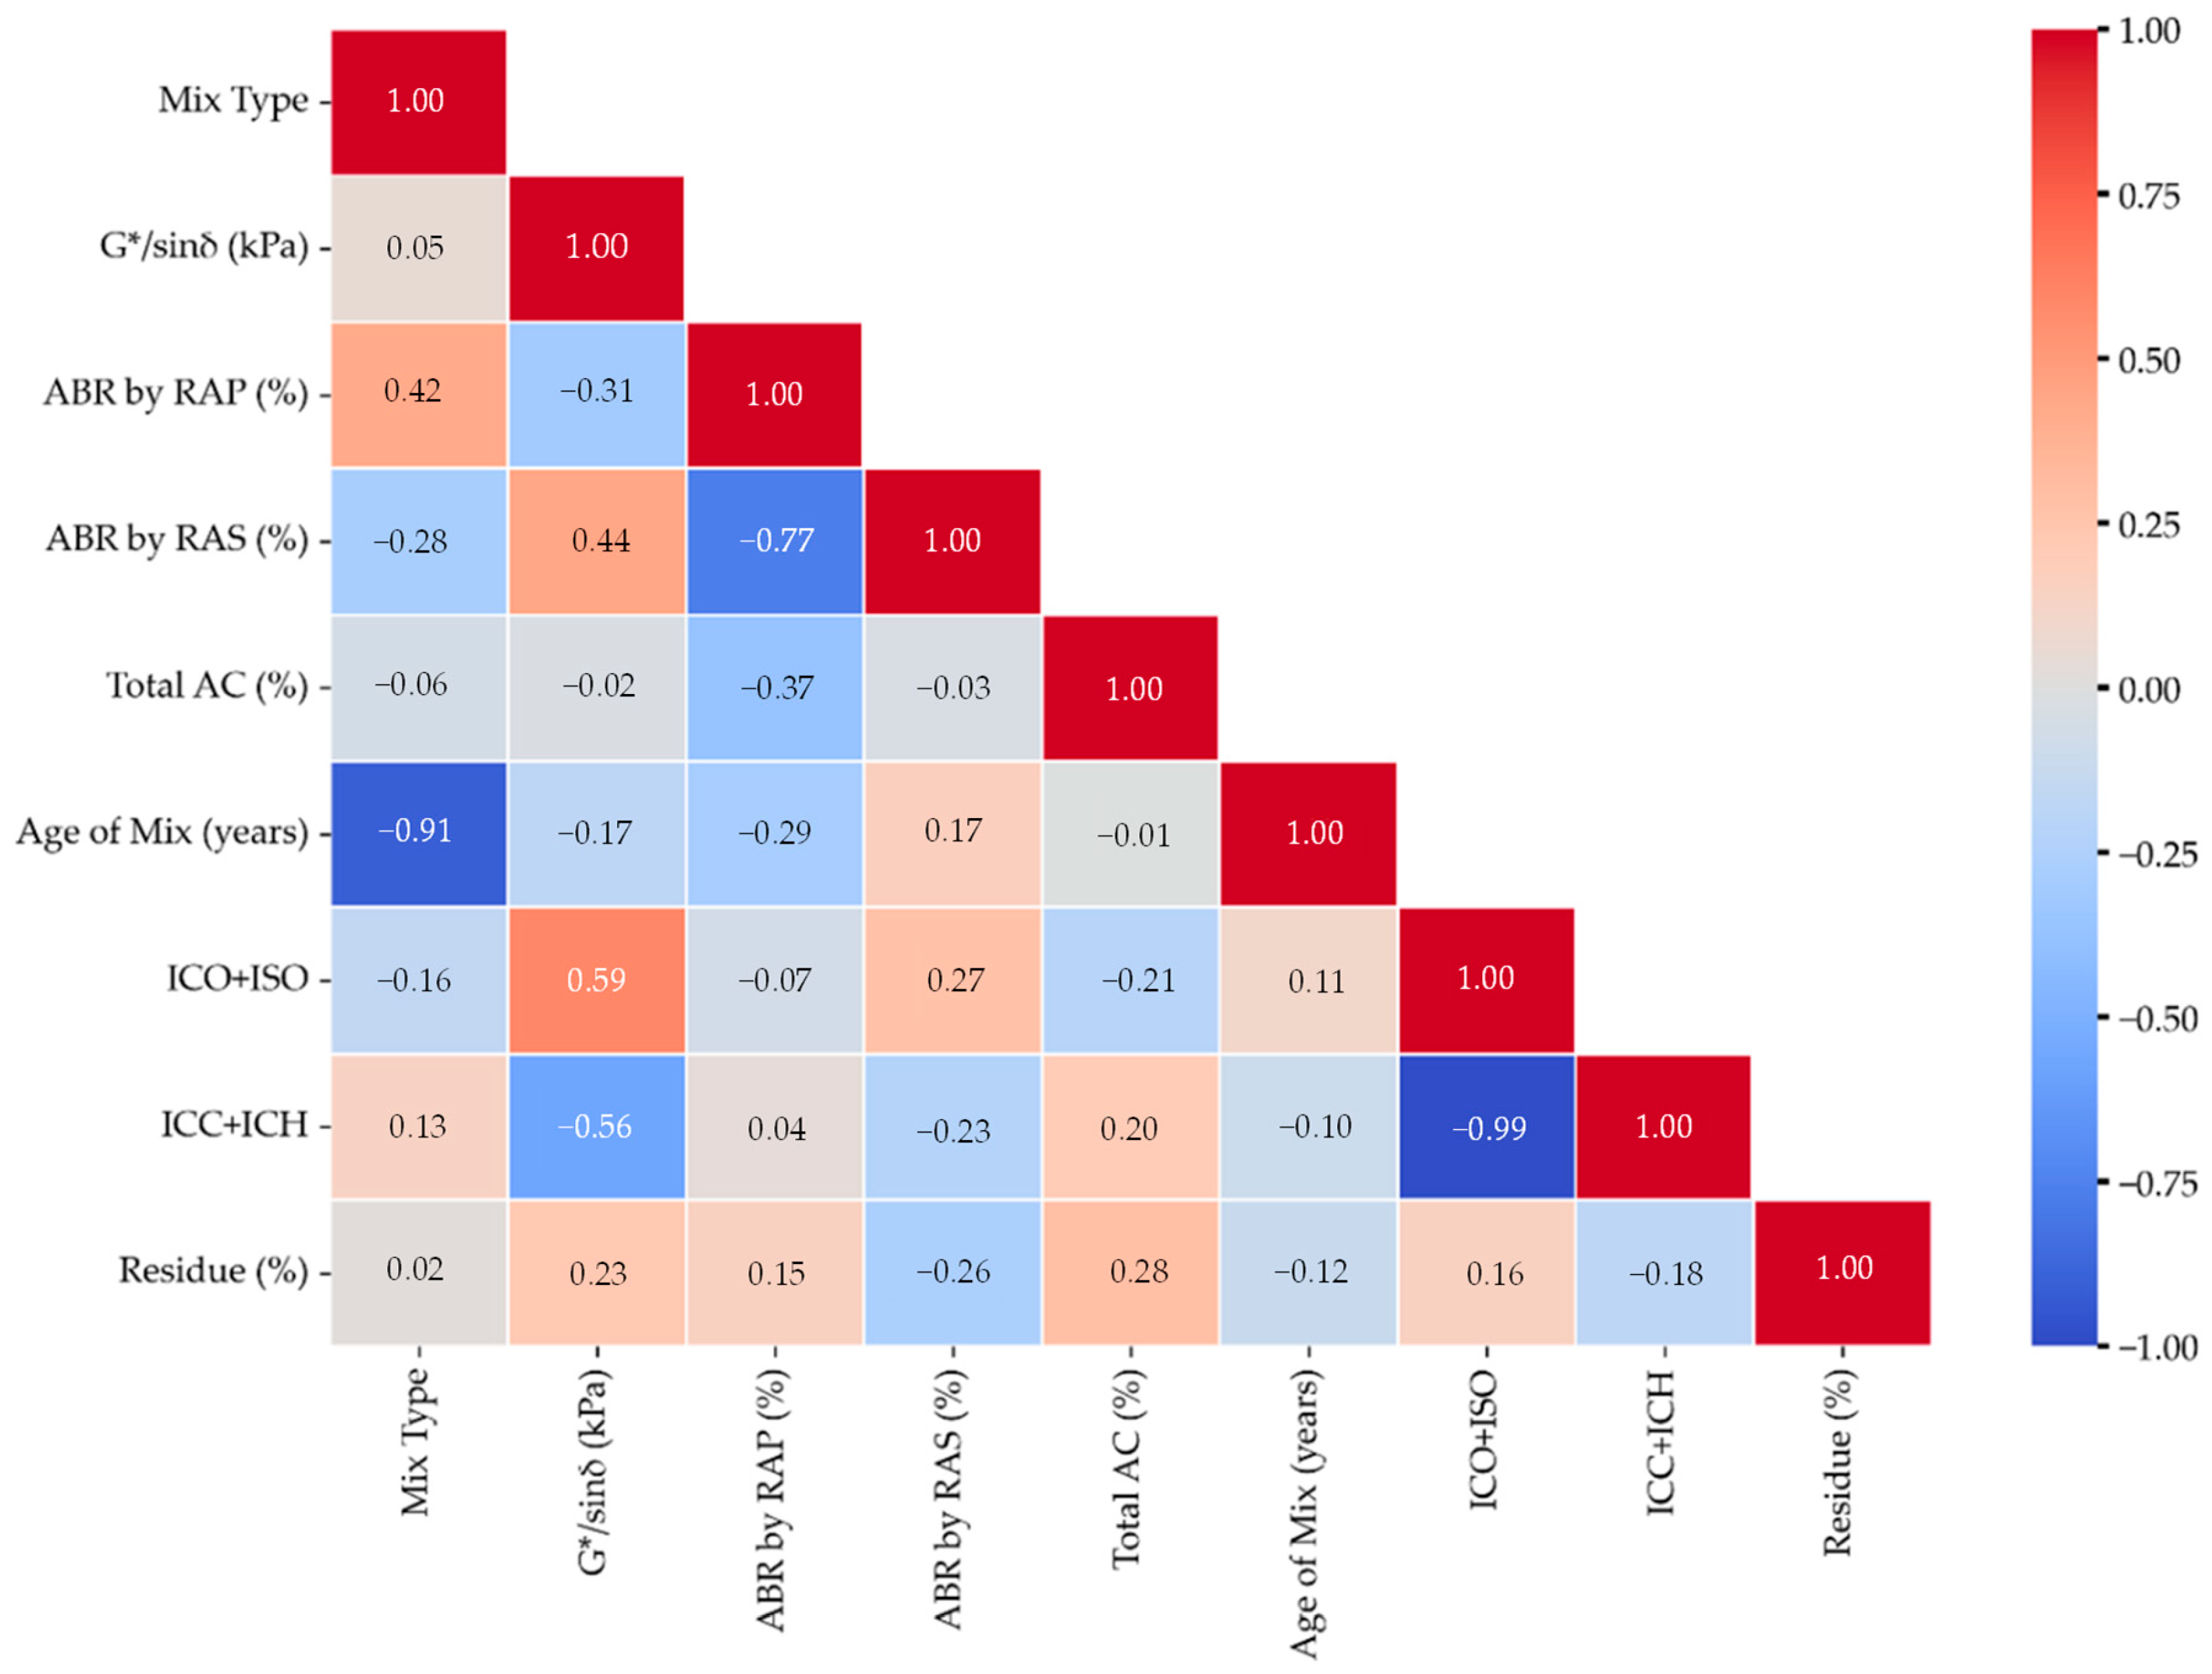
The Shapiro–Wilk test, using the (scipy.stats) Python library, evaluated the normality of the variables before the correlation analysis. The results revealed that most variables did not significantly vary from normality (p-value > 0.05), validating the application of Pearson’s correlation. Figure 6 presents a heatmap depicting the correlation matrix among G*/sinδ, chemical indices (ICO + ISO and ICC + ICH), thermal residue, and various other parameters (such as mix type: “field, plant, or lab,” ABR by RAP or RAS, total AC, and age of the mix). The numerical value and hue within each cell of the map represent Pearson’s correlation coefficient between the two variables on the x- and y-axes. The right-hand scale of the figure displays weak to very weak correlations in white or light grey, strong positive correlations close to 1 in red, and strong negative correlations close to −1 in blue. The absolute value of Pearson’s critical correlation (0.26) was computed using a sample size of 60 and a significance level of 0.05. This indicates that |r| > 0.26 signifies the Pearson correlation coefficient is statistically significant at the 0.05 level with n = 60.
A strong, significant negative correlation was observed between ICO + ISO and ICC + ICH: binders with increased aging exhibited higher aging indices ICO + ISO and reduced total aliphatic compounds compared to aromatics (lower ICC + ICH). Moderate, significant positive and negative correlations were assigned between G*/sinδ and ICO + ISO and ICC + ICH, respectively. The addition of aged materials from RAP/RAS increased the aging indices and promoted the conversion of aliphatic compounds to aromatics, suggesting that the binder had greater stiffness. Moderate, significant positive and negative correlations were observed between G*/sinδ and ABR by RAS and ABR by RAP, respectively. A moderately significant negative correlation was identified between the ABR by RAP and G*/sinδ, indicating that an increase in the RAP binder replacement diminishes the rutting resistance. This result can be attributed to the utilization of a softer virgin binder in high-RAP-content mixes, which can counteract the stiffening influence of the aged RAP binder. In addition, the variability in the RAP binders from different sources can lead to variations in the stiffness and performance of the extracted binder [5,7]. Weak correlations were noted between G*/sinδ and the remaining parameters, that is, mix type, total AC, mix’s age, and thermal residue content.
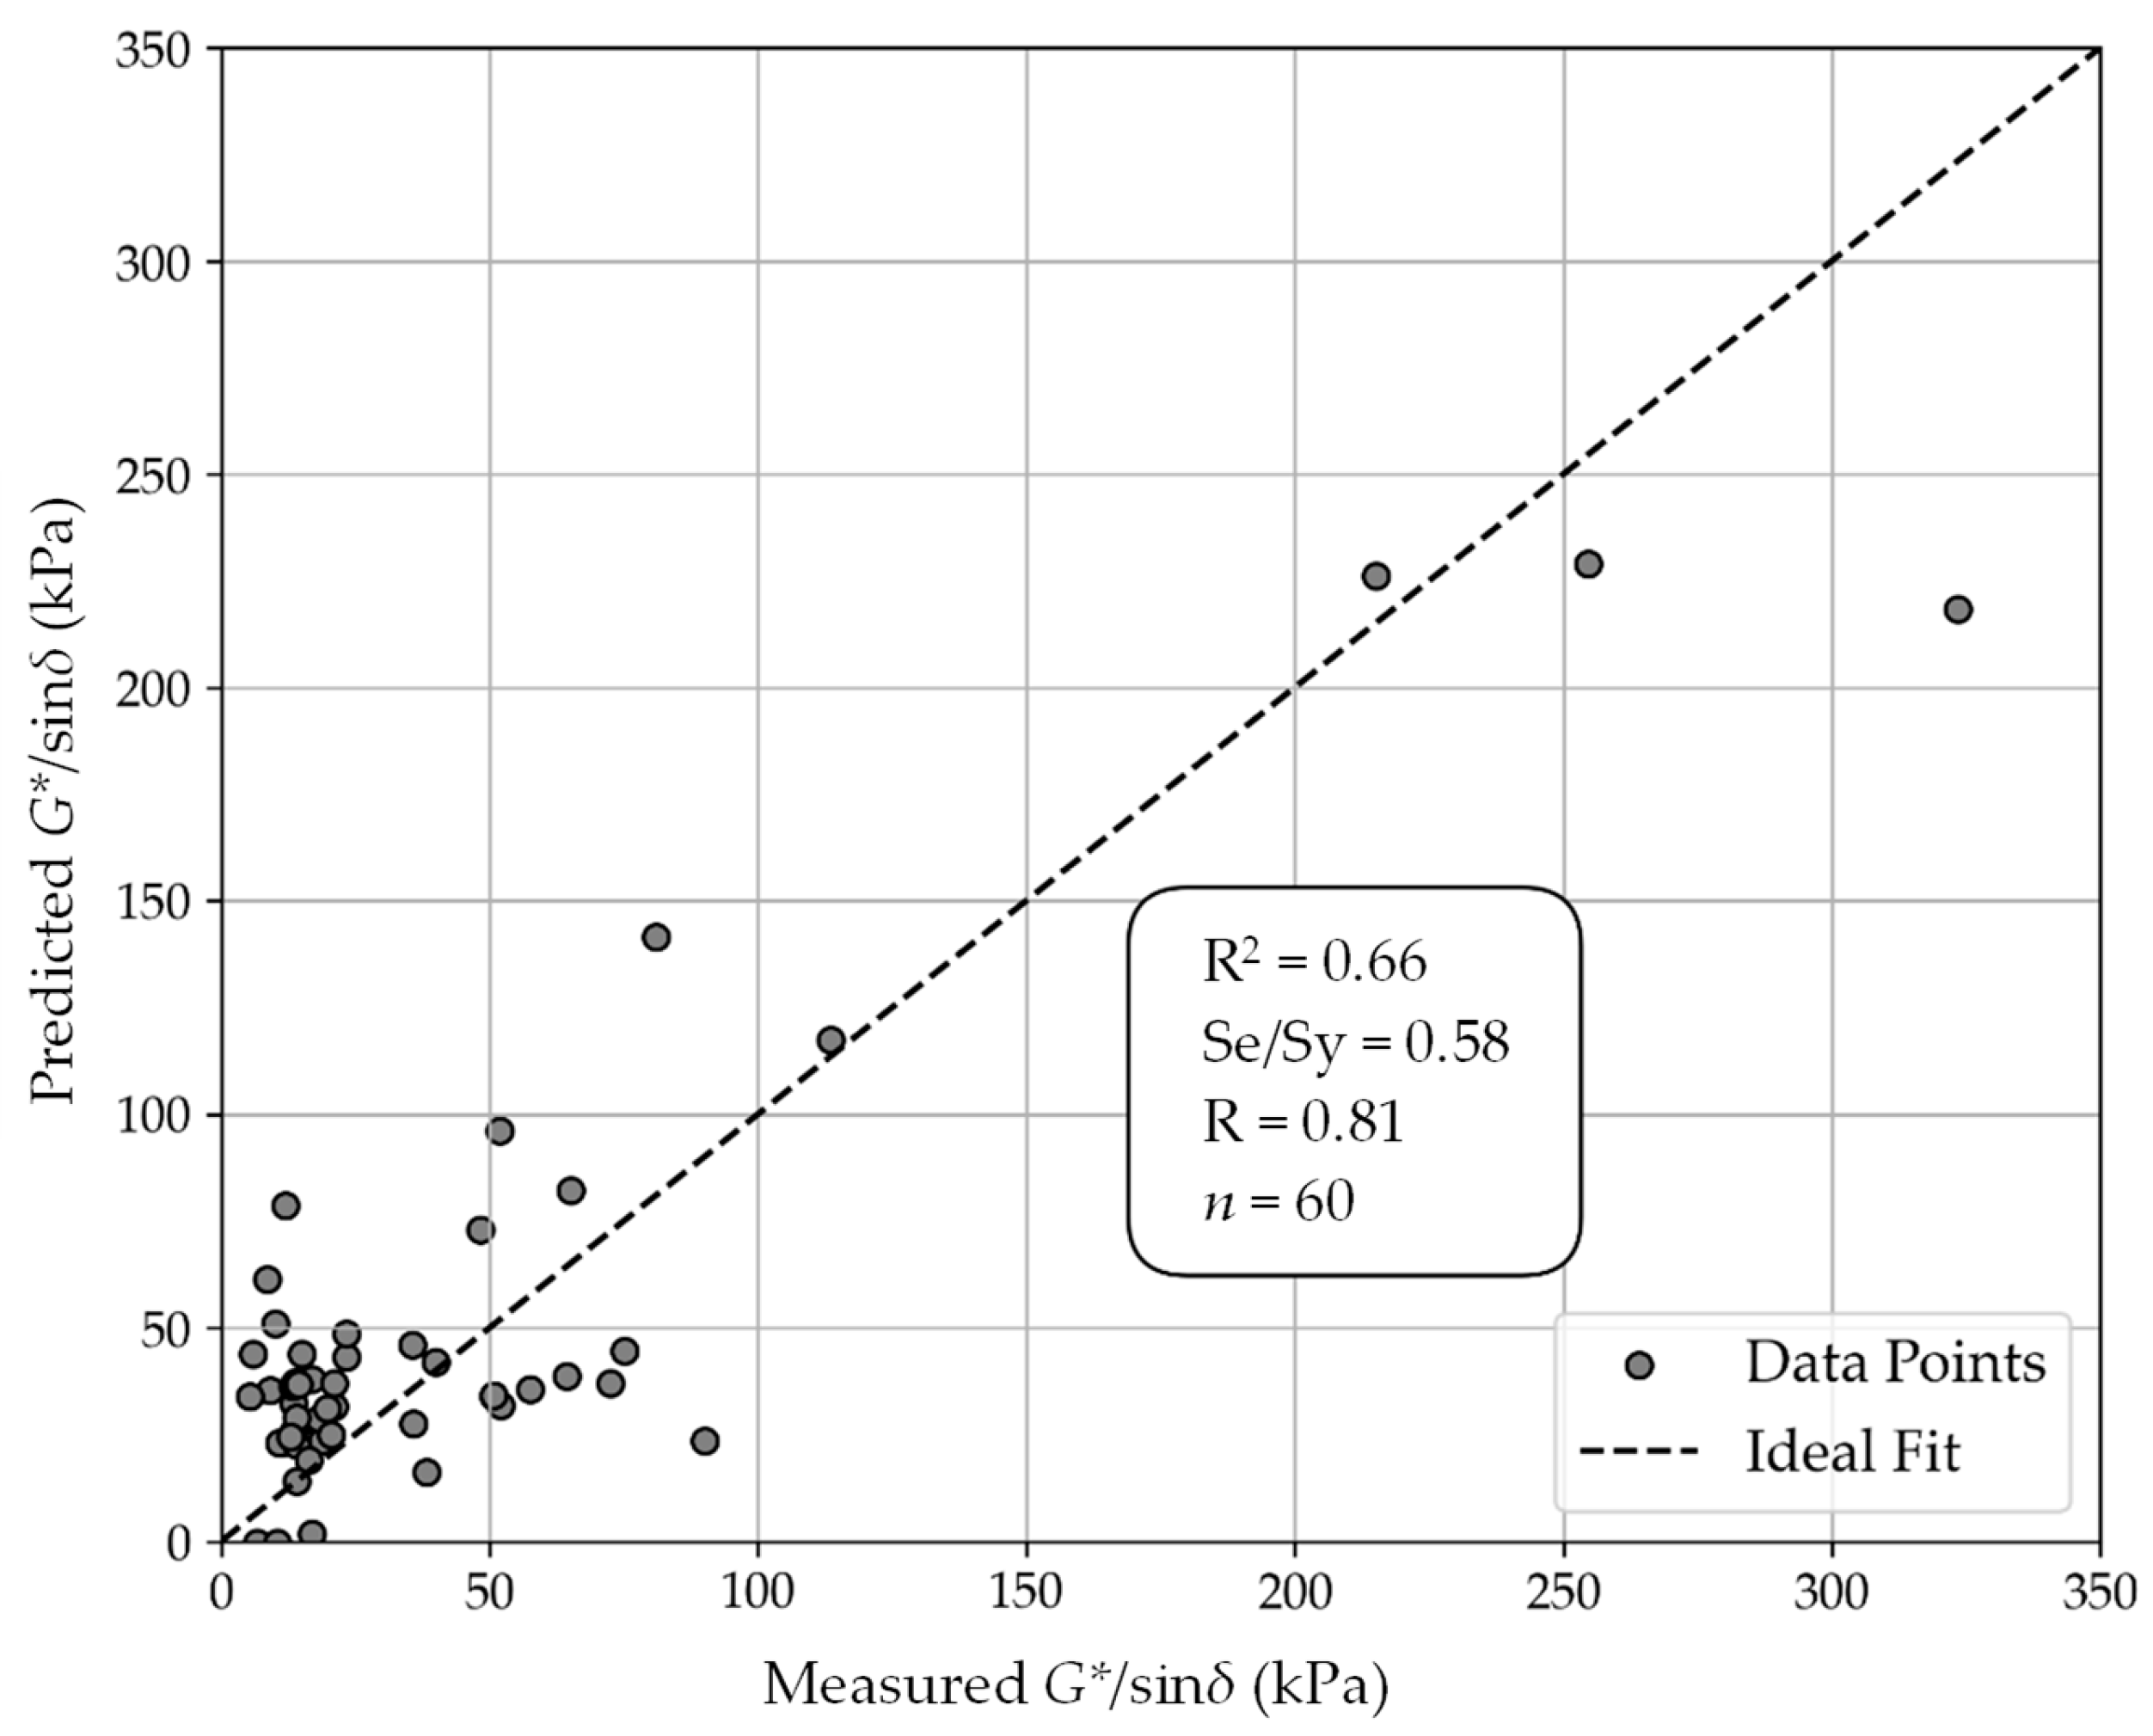
A linear regression relationship exists between G*/sinδ and other variables, as represented in Equation (9). Figure 7 illustrates the correlation between the measured and predicted G*/sinδ values of the 60 extracted binders using the linear model established by regression analysis. The data points clustered around a line, which represented an ideal fit for the data, as shown in Figure 7, with a 1:1 slope. The R2, which shows the extent to which the variability in the data are explained, was 0.66, and the R, which shows the predictive reliability of the G*/sinδ values, was 0.81. The standard error ratio (Se/Sy) was 0.58, indicating a moderate level of predictive error associated with variability among the samples. The chemical indices (ICO + ISO) and (ICC + ICH) interaction and the percentage of residue combined with the mix’s age were the most significant variables discovered in the linear analysis. Thus, this reflects the importance of chemical and thermal analyses in predicting the rutting parameters of the binders.
The subsequent equation illustrates a linear model between G*/sinδ and the other parameters:
G * / sin δ = 369.45 1.60   ×   A + 1.84   ×   B 10.96   ×   C 939.93   ×   D + 449.12   ×   E 454.32   ×   F + 6.60   ×   G + 4.47   ×   10 4   ×   H   ×   [ ( A 26.38 )   ×   ( B 4.05 ) ] 13,437.49   ×   [ ( E 0.13 )   ×   ( F 0.89 ) ] + 498.65   ×   [ ( D 0.02 )   ×   ( G 17.43 ) ] ,
where
A is the ABR by RAP (%);
B is the ABR by RAS (%);
C is the total AC (%);
D is the age of the mix (years);
E is ICO + ISO;
F is ICC + ICH;
G is the residue (%);
H is a factor based on the mix type (−10.23 for field, 0 for plant, and 10.23 for lab).
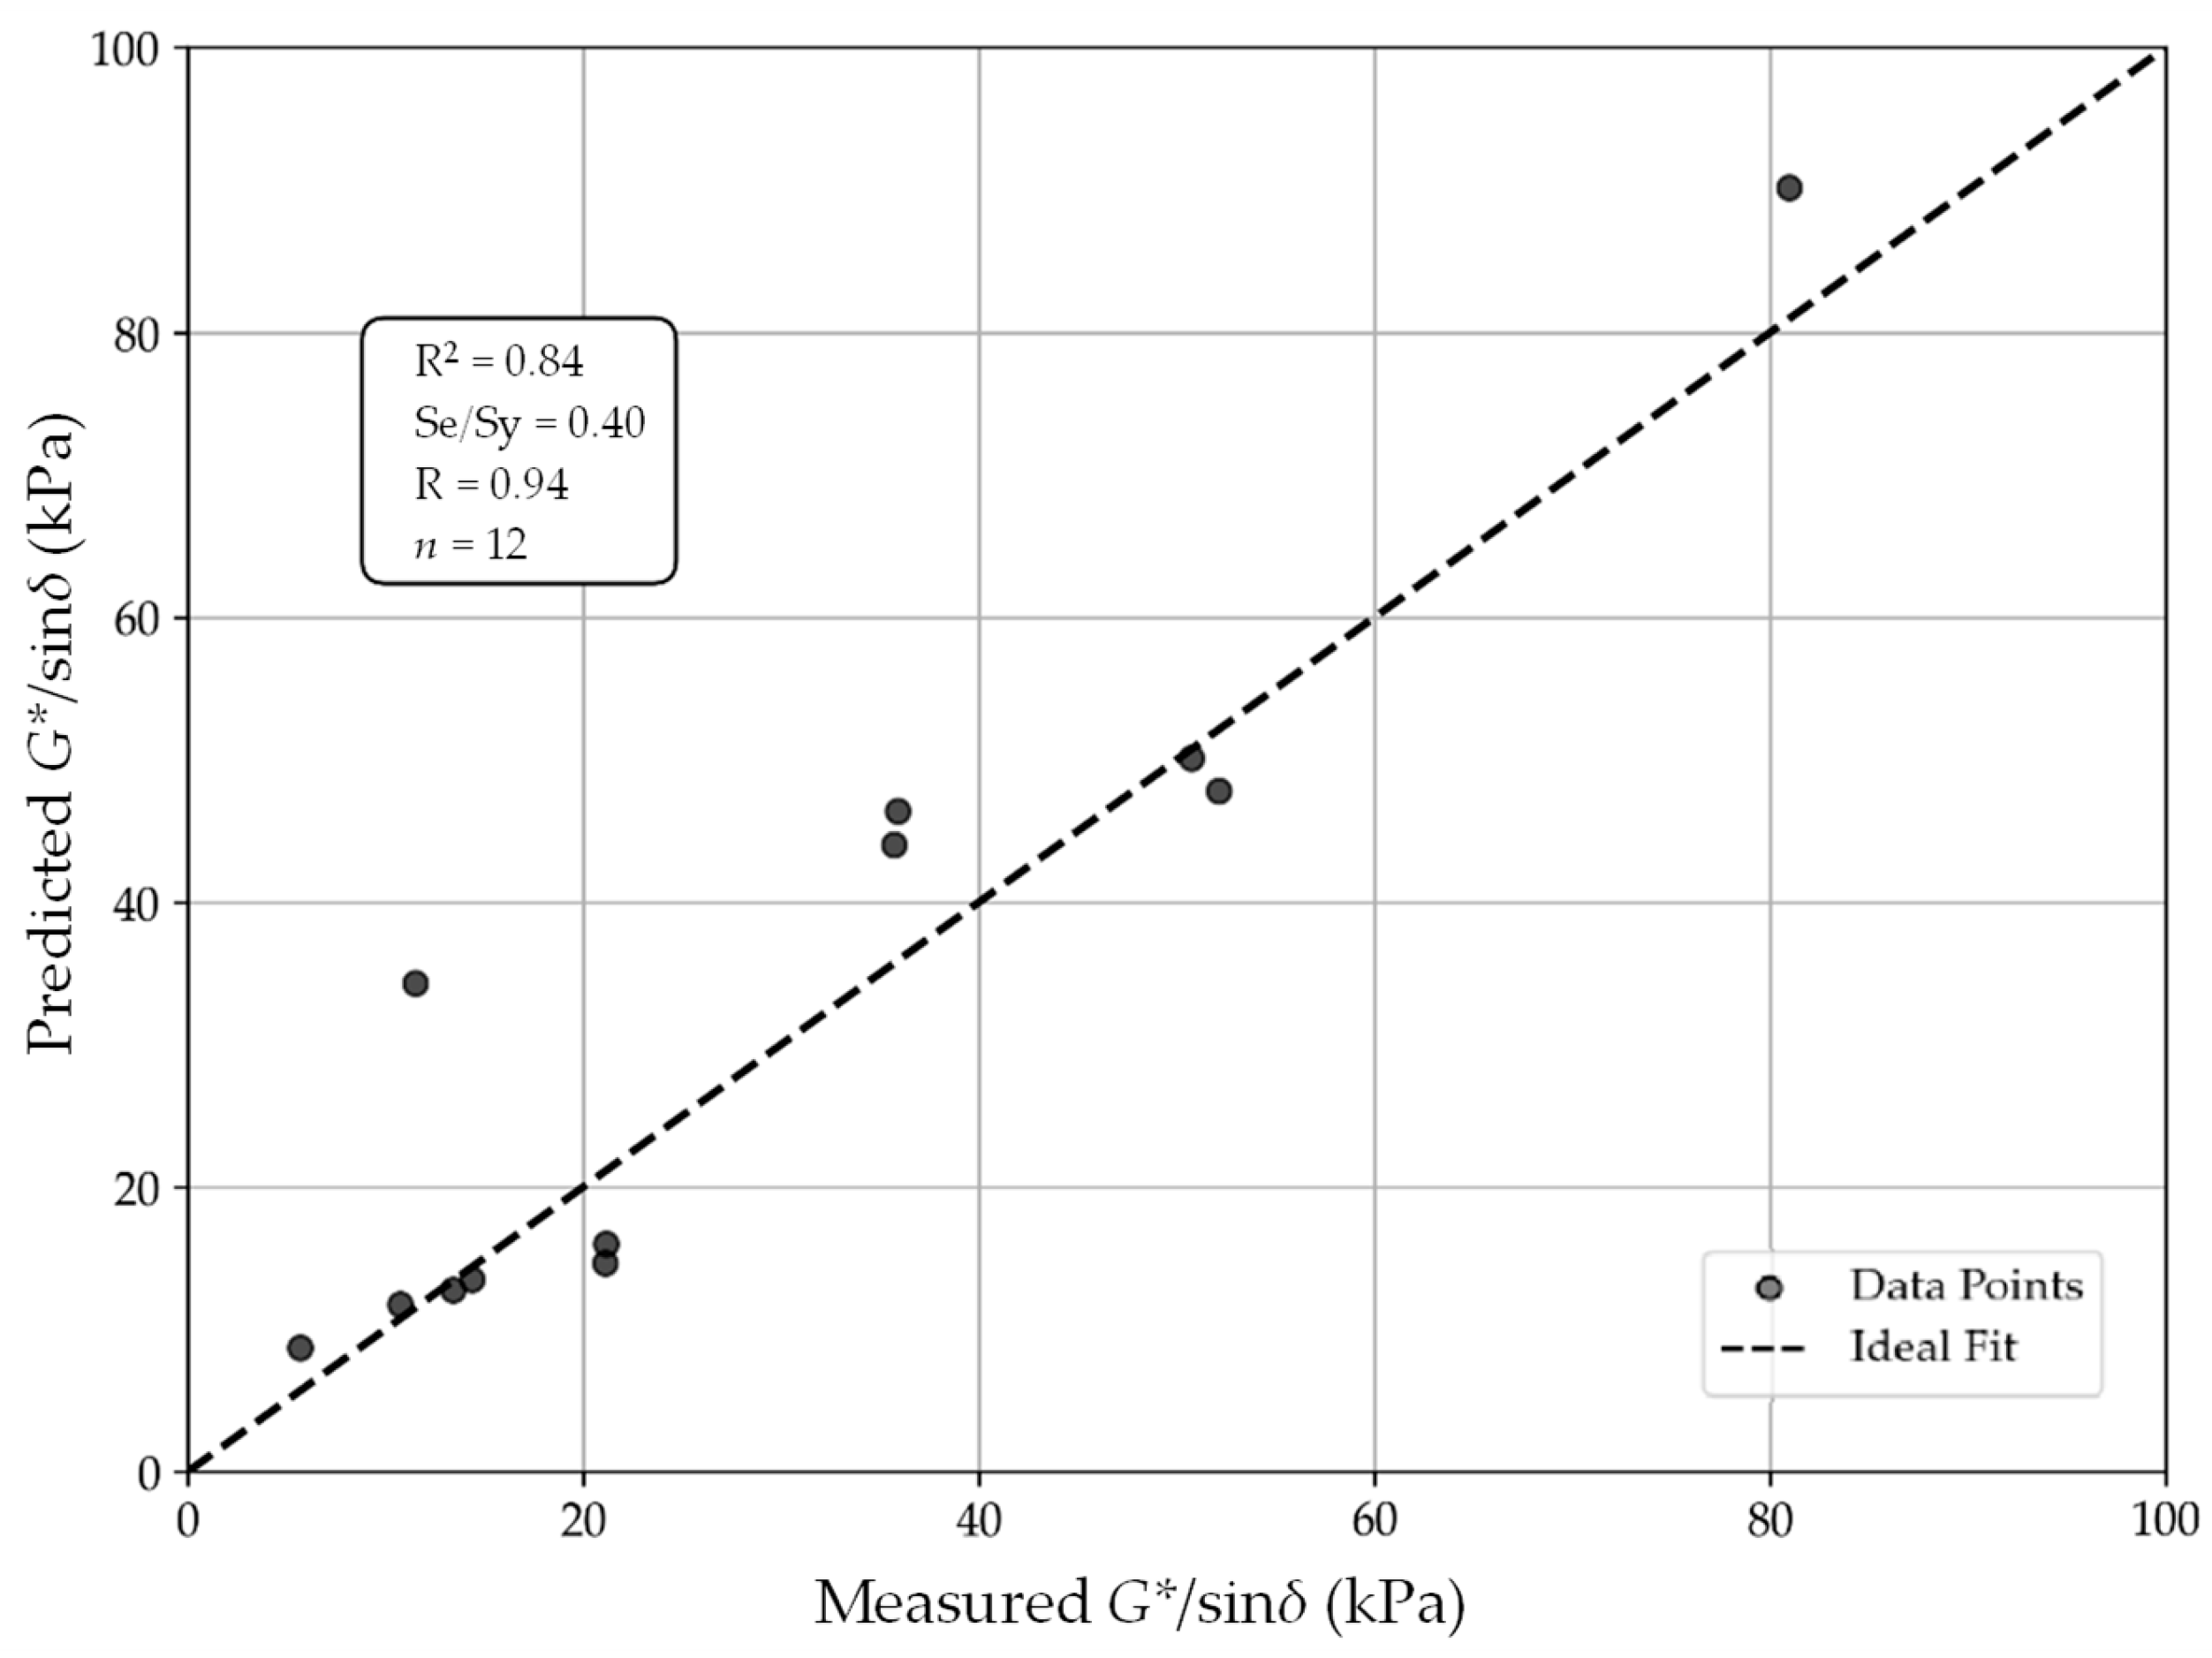
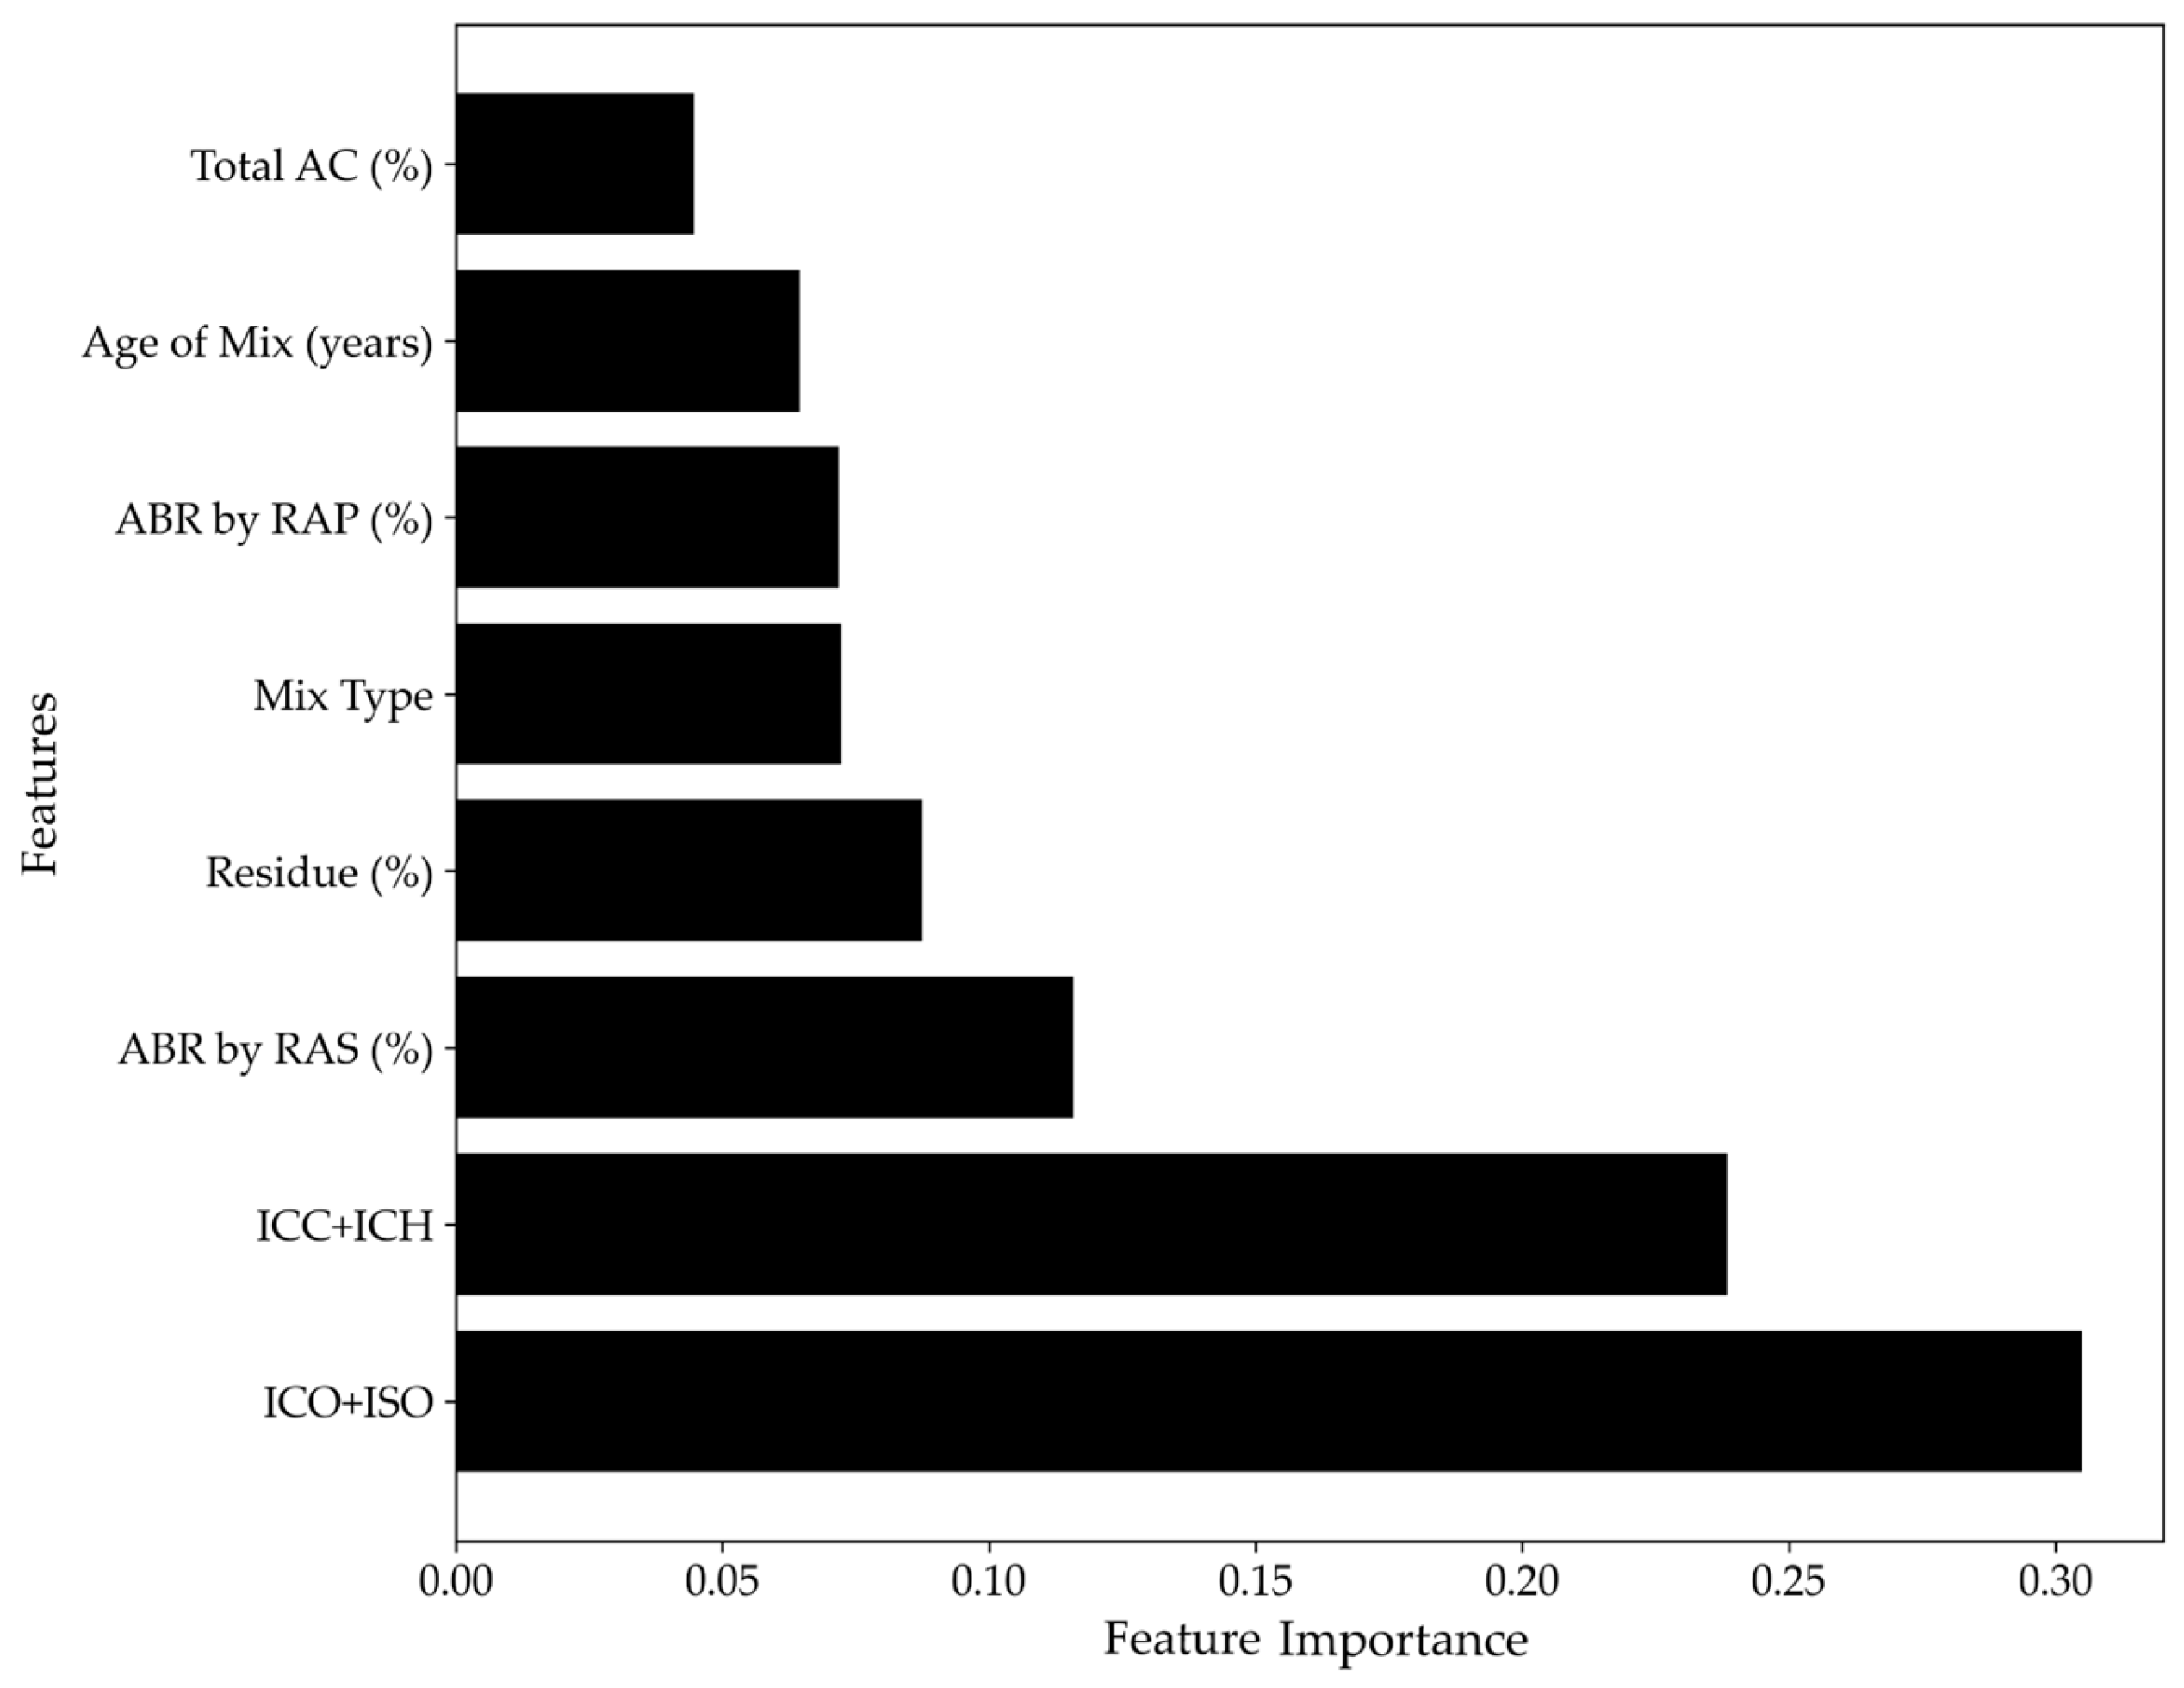
To predict G*/sinδ, an RF regression model was built, trained on 48 samples, and assessed using a separate set of 12 samples. A comparison of the predicted and measured G*/sinδ values is presented in Figure 8. On the assessed sample set, the model showed strong predictive analyses with an R2 of 0.84, Se/Sy of 0.40, and an R of 0.94. The data points encircled the ideal fit line, indicating a negligible divergence between the measured and predicted values. Figure 9 illustrates the relative significance of each feature used in the model. The most significant features were the chemical indices (ICO + ISO and ICC + ICH), followed by the ABR by RAS and thermal residue percentage. Other factors, such as mix type, ABR by RAP, mix’s age, and total AC, had little effect on the model. This illustrates the importance of binder chemical and thermal analyses for rutting parameter prediction compared with the mix descriptors.

3.3.2. Fatigue Cracking Correlations

Figure 10 shows a heatmap of the correlation matrix of G*.sinδ and other parameters, including thermal residue, chemical indices (ICO + ISO and ICC + ICH), ABR by RAP or RAS, total AC, and mix’s age. The absolute value of Pearson’s critical correlation (0.33) was calculated using a sample size of 37 and a significance level of 0.05. With a sample size of 37, the Pearson correlation coefficient was statistically significant at the 0.05 level (|r| > 0.33). A strong, significant negative correlation was observed between the ICO + ISO and ICC + ICH indices. Binders with increased aging have higher aging indices (ICO + ISO) and lower total aliphatic than aromatic compounds (lower ICC + ICH). Moderate, significant positive and negative correlations were observed for G*.sinδ, ICO + ISO, and ICC + ICH. The incorporation of aged materials from RAP/RAS boosted the aging indices and facilitated the transformation of aliphatic compounds into aromatics, indicating that the binders had a higher susceptibility to fatigue cracking. Additionally, moderately significant positive and negative correlations were observed for G*.sinδ, thermal residue, and total AC. Thus, as discussed in previous studies [12,52], the contributions of aging from RAP/RAS led to an increase in the transformation of maltenes into asphaltenes, increasing the thermal residue and reducing the binder’s resistance to fatigue cracking. A parallel observation was made in which the total AC was lowered and negatively impacted the binder resistance to fatigue cracking.
Moderate, significant positive and negative correlations were extrapolated between the thermal residue and ICO + ISO and ICC + ICH, respectively. Augmenting the aging components resulted in heightened aging indices (ICO + ISO), diminished ICC + ICH, and increased thermal residues. Moreover, the total AC exhibited moderately significant positive and negative correlations with ICC + ICH and ICO + ISO, respectively. A higher total AC resulted in slower aging conditions in asphalt mixes, leading to increased ICC + ICH and decreased ICO + ISO indices. The ABR by RAS and G*.sinδ exhibited a weak correlation. However, the ABR using RAS showed moderately significant positive and negative correlations with ICO + ISO and ICC + ICH. An increase in the aging components detected by the ABR using RAS raised the ICO + ISO and decreased the ICC + ICH.
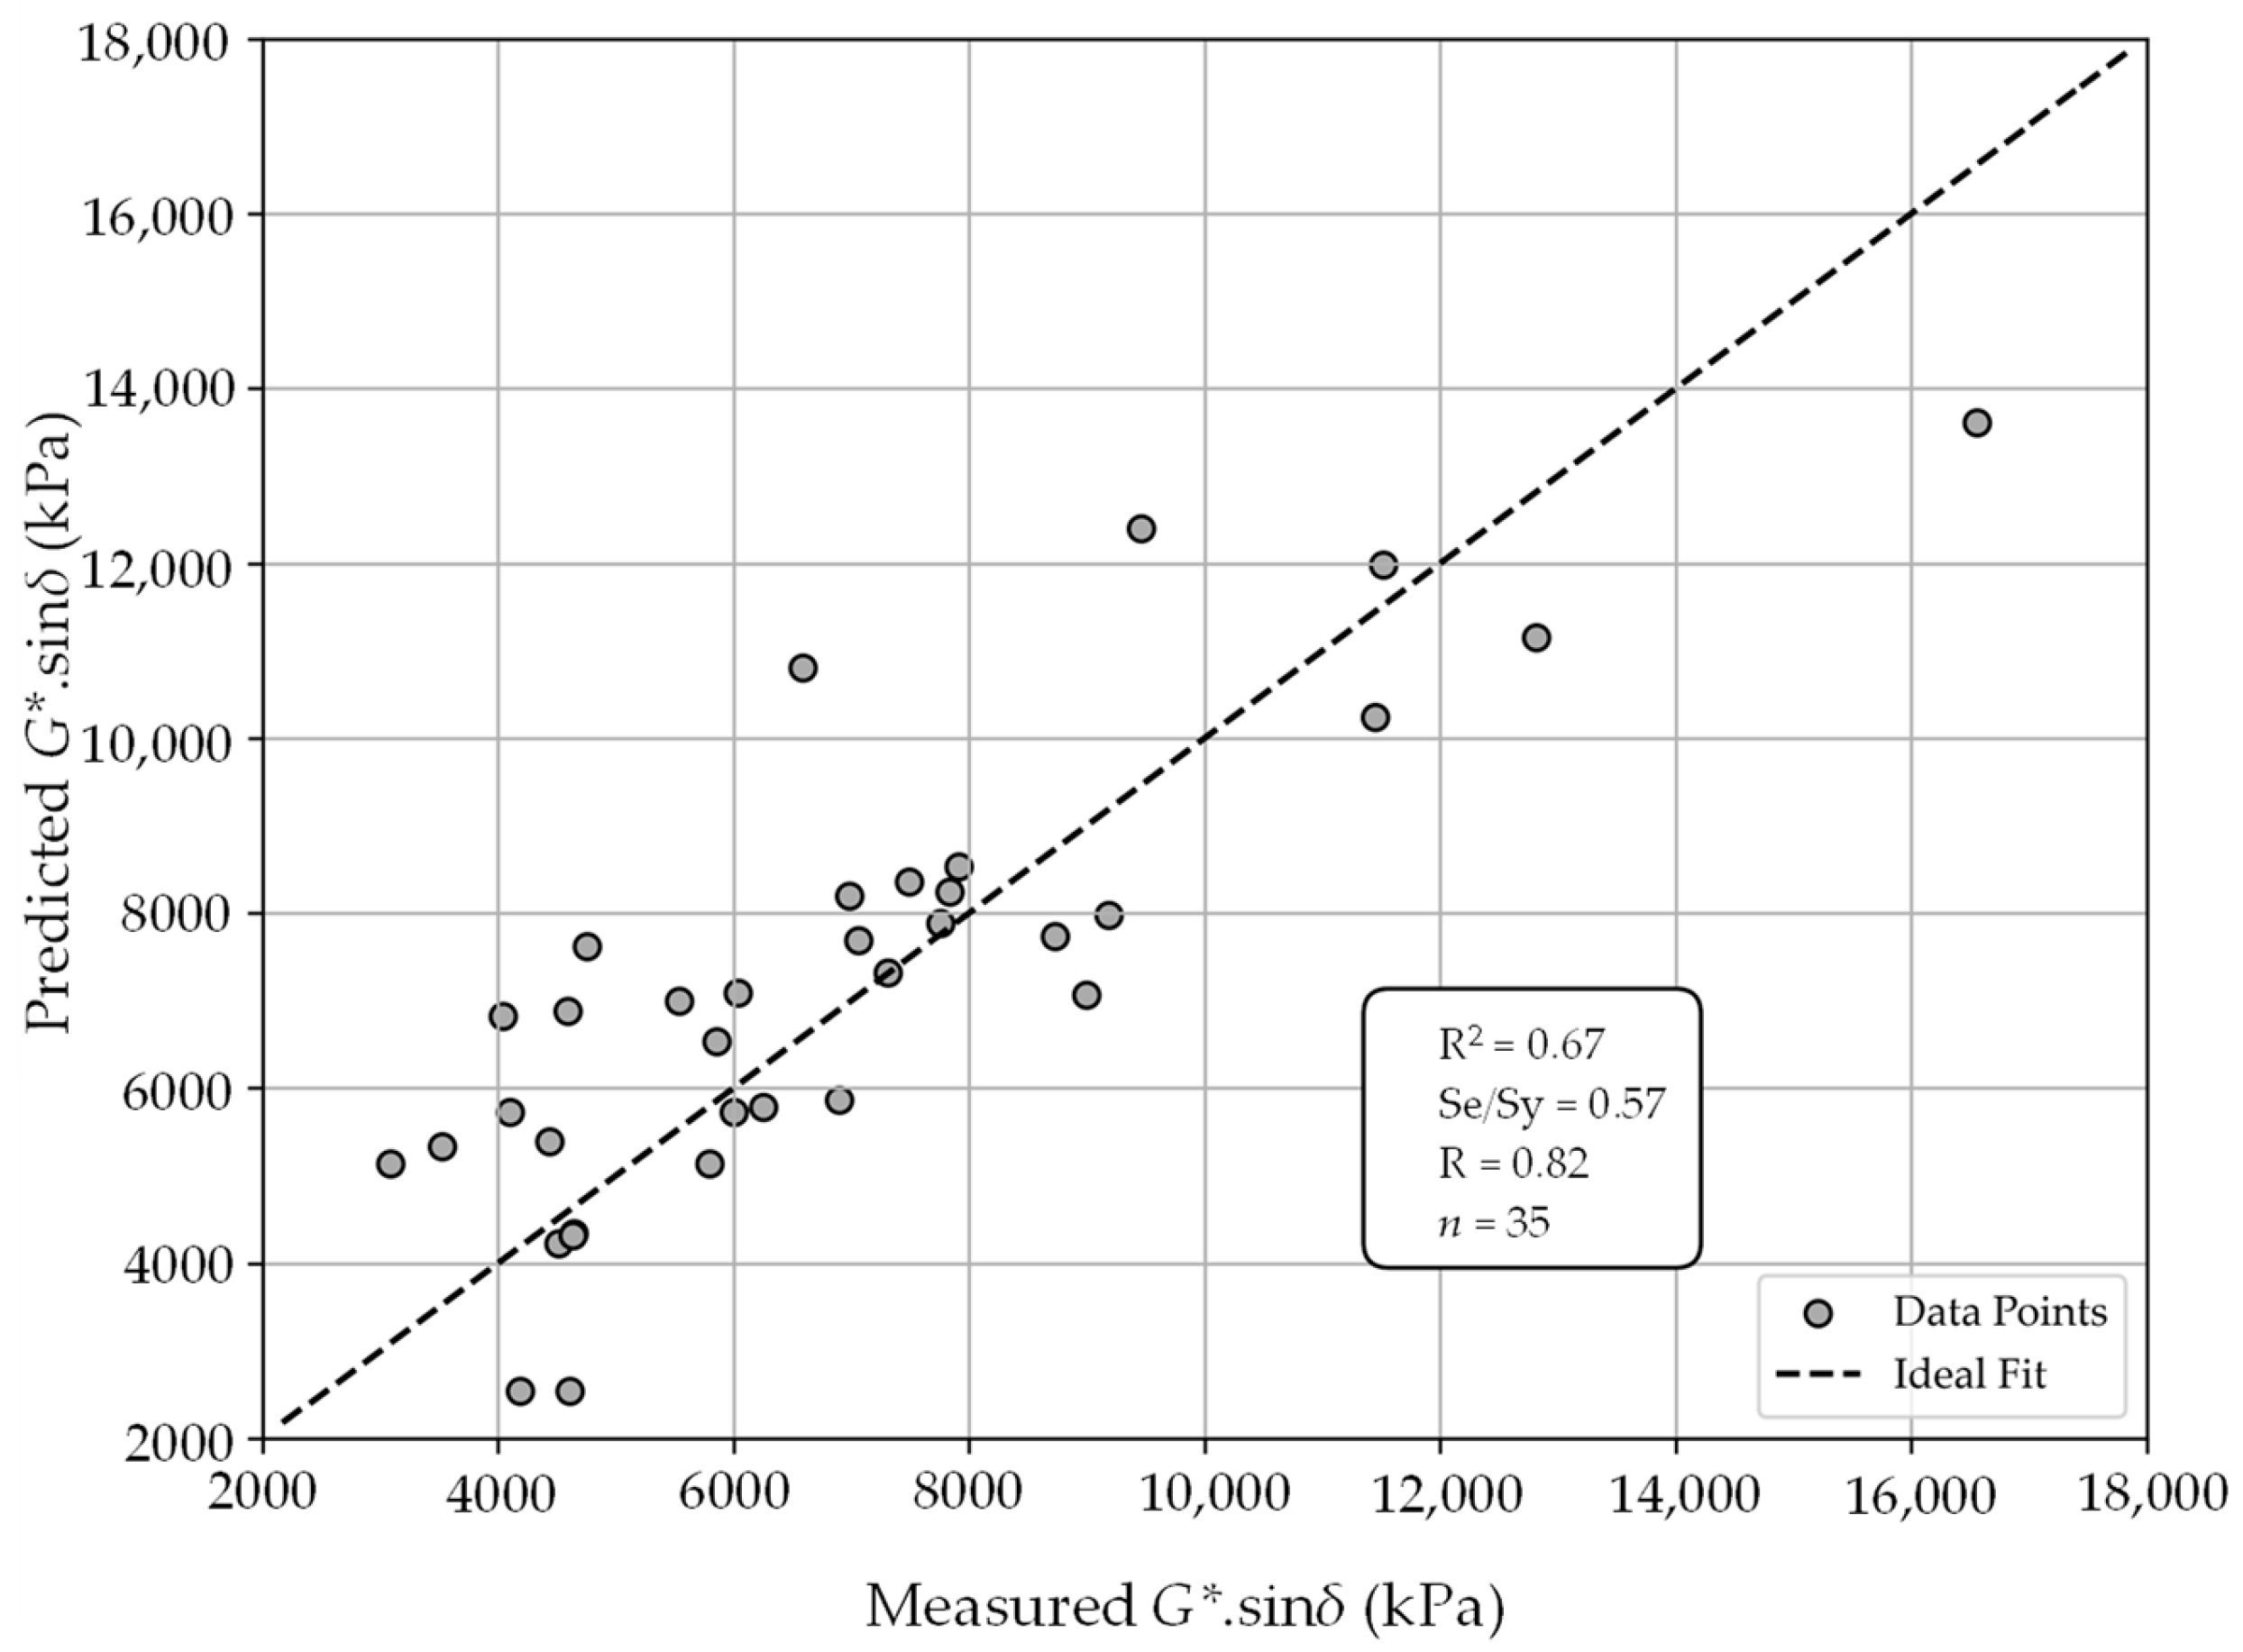
Equation (10) presents a linear model of G*.sinδ and other parameters. Using the linear regression model produced in Equation (10), Figure 11 depicts the correlation between the measured and predicted G*.sinδ values from 35 extracted binders. The data pairs were clustered around the ideal fit line with a slope of 1:1. The R2 value was 0.67, and the R value was 0.82, indicating a strong linear correlation. The prediction error based on the variation in the sample only was moderate, as indicated by the standard error ratio (Se/Sy = 0.57). The most significant factors of the linear model were thermal residue, total AC, the interaction between ABR by RAP, ABR by RAS, and the age of the mix, followed by the interaction between the chemical indices (ICO + ISO and ICC + ICH); therefore, this highlights the importance of chemical and thermal analyses as useful tools for predicting the binder fatigue cracking parameter.
The following equation represents the linear relationship between G*.sinδ and other parameters:
G * . sin δ = 84,992.28 3347.84   ×   A + 722.60   ×   B 54.91   ×   C 30.87   ×   D + 280.51   ×   E 56,300.56   ×   F 74,107.09   ×   G 4.49   ×   [ ( C 16.03 )   ×   ( D 5.60 )   ×   ( E 8.16 ) ] 406,043.969   ×   [ ( F 0.167 )   ×   ( G 0.87 ) ] ,
where
A is the total AC (%);
B is the residue (%);
C is the ABR by RAP (%);
D is the ABR by RAS (%);
E is the age of the mix (years);
F is ICO + ISO;
G is ICC + ICH.
An RF regression model was constructed using 31 training samples and six prediction samples to predict G*.sinδ. Predicted and measured G*.sinδ values are shown in Figure 12. For the test-sample set, the model showed strong predictive analytics with an R2 of 0.75, Se/Sy of 0.50, and R of 0.86. There was little variation between the measured and predicted values, as evidenced by the measured data points clustering around the ideal fit line. Figure 13 displays each feature’s relative importance within the model. The features that were ranked highest were the mix’s age, total AC, thermal residue, and ABR by RAS. ABR by RAP and chemical indices were the minor effects. This illustrates how crucial AC and thermal analysis are for forecasting fatigue cracking.

3.3.3. Block Cracking Correlations

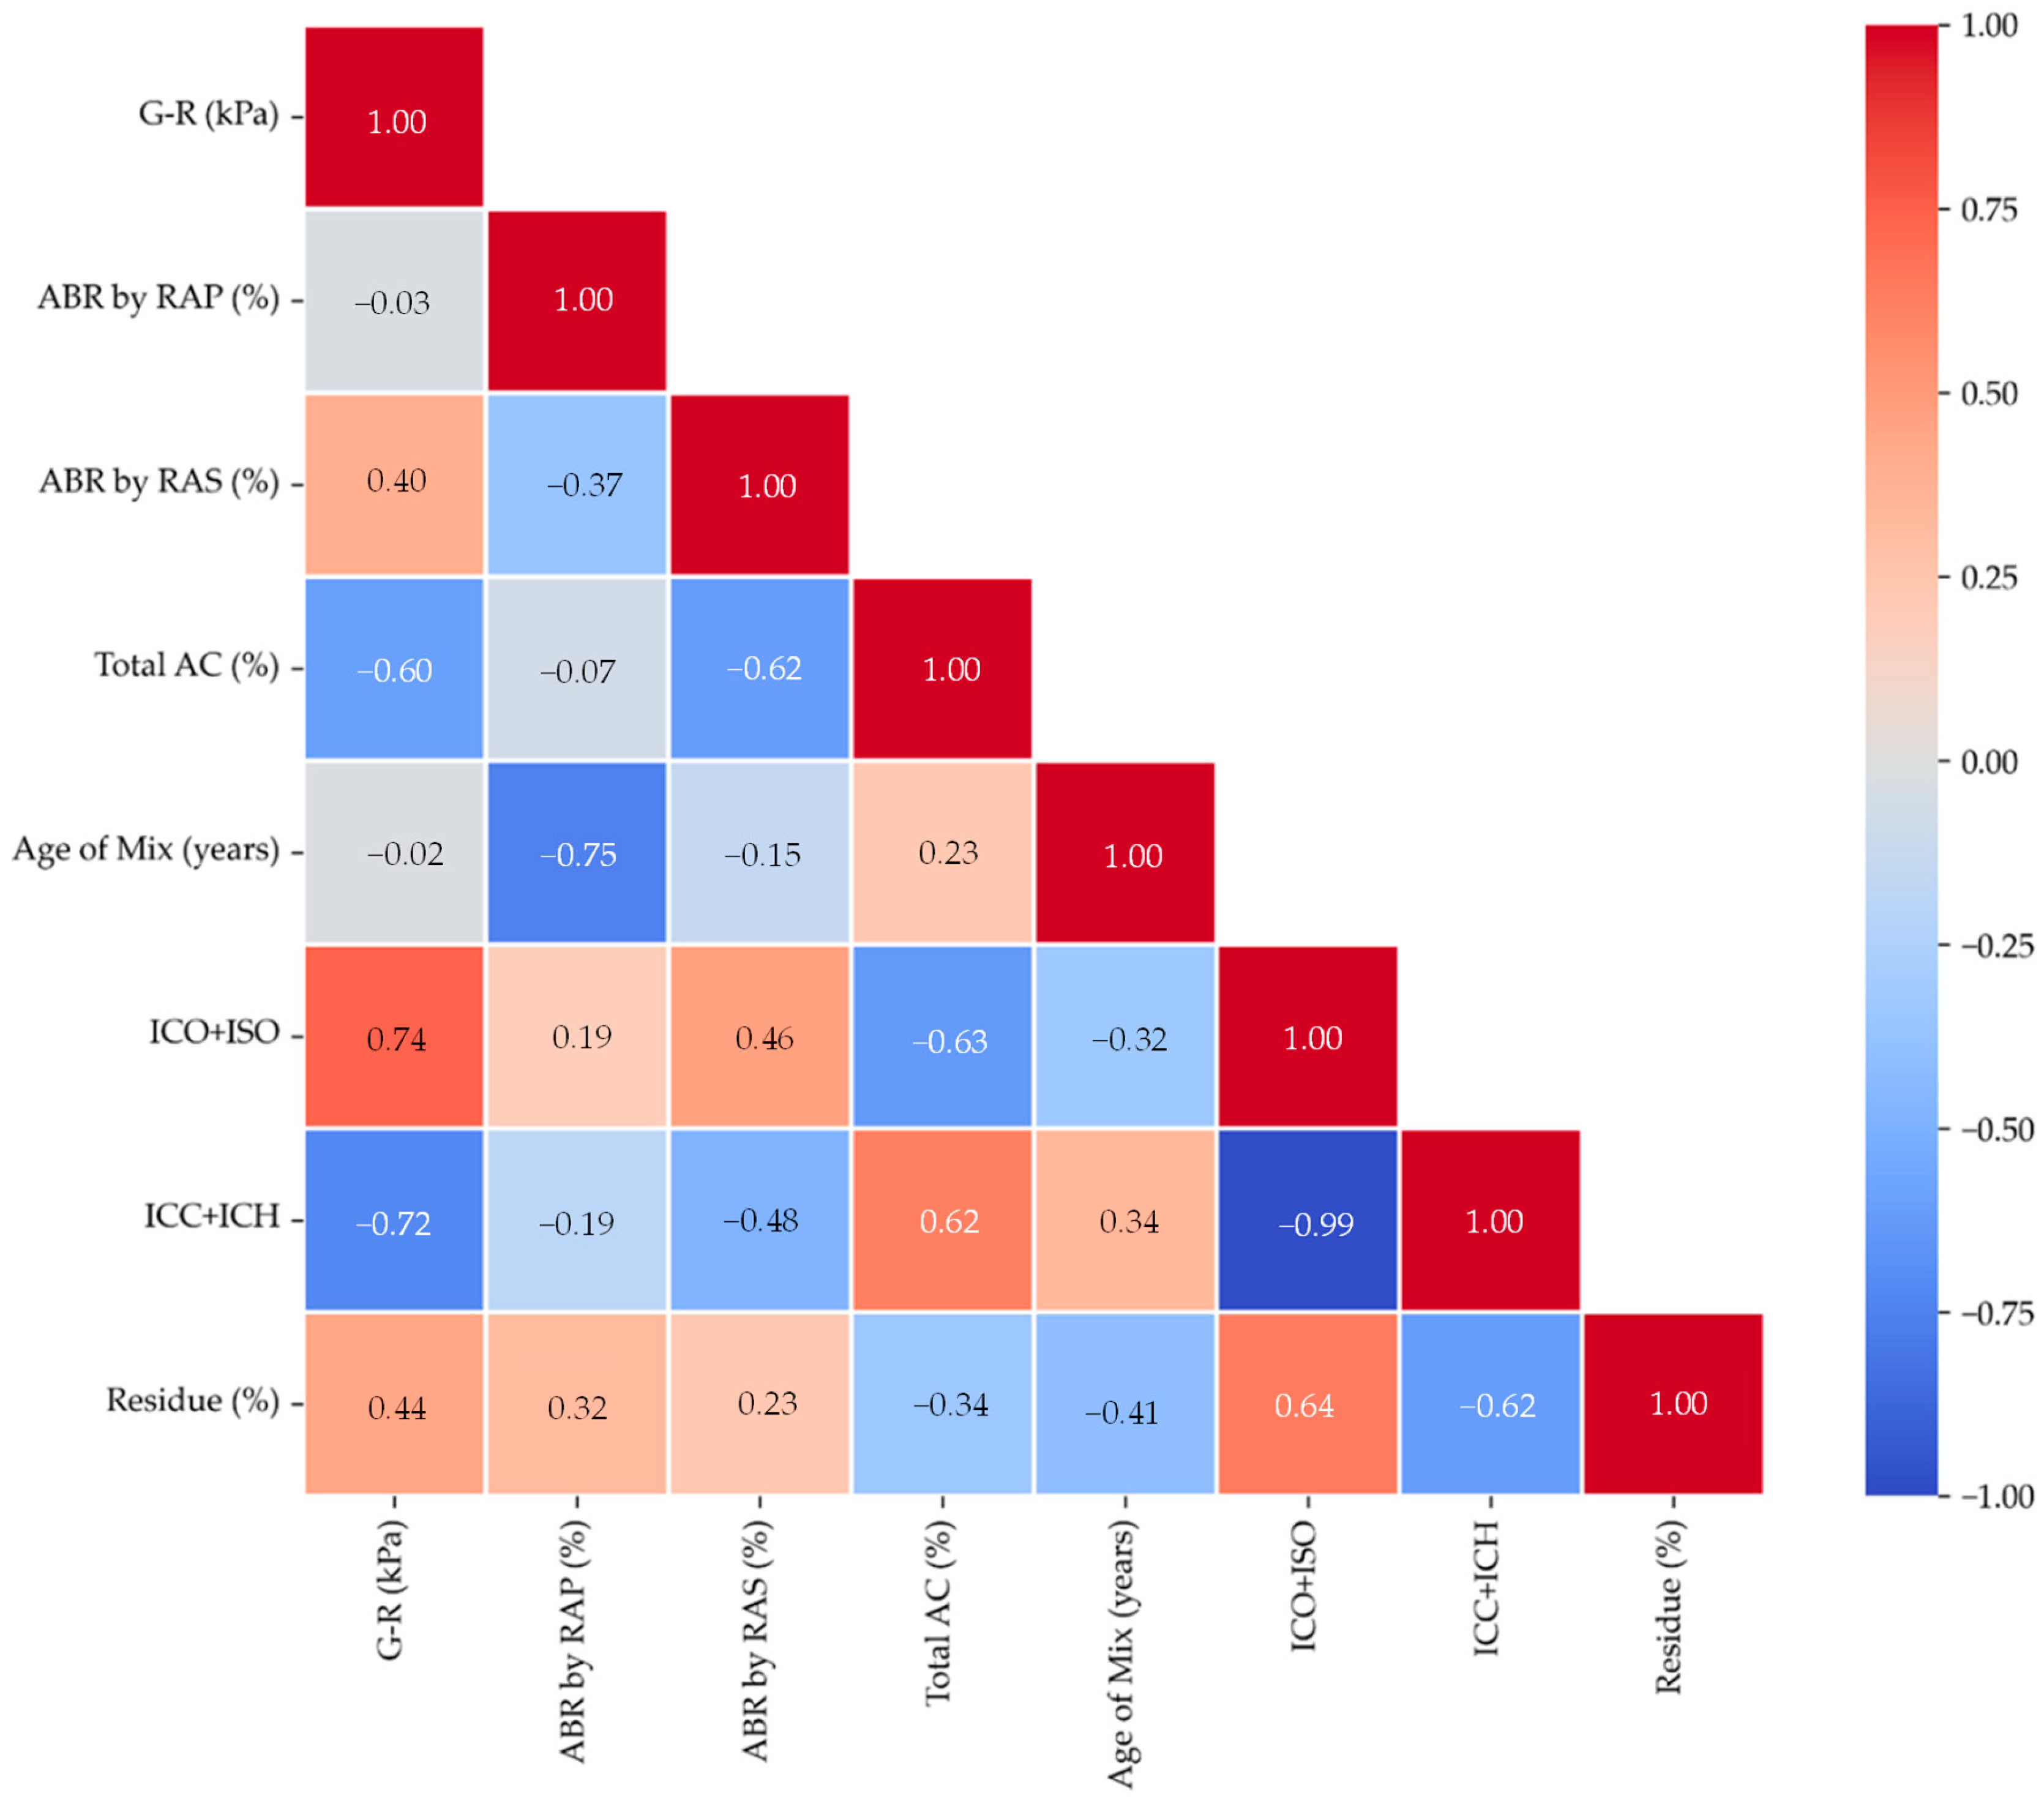
Figure 14 presents a heatmap showing the correlation matrix for the G-R and other parameters being tested, which consist of the thermal residue, chemical indices (ICO + ISO and ICC + ICH), ABR by RAP or RAS, total AC, and mix’s age. There were strong, significant positive and negative correlations between G-R and ICO + ISO and ICC + ICH, respectively. The aged material from RAP/RAS increased the aging indices, and the aliphatic components were transformed into aromatics, which created binders that were more susceptible to block cracking. A moderate, significant negative correlation was observed between G-R and total AC. Additionally, moderately significant positive correlations were observed between G-R and thermal residue and ABR by RAS. Reduced total AC and increased ABR by RAS affect the aging components and increase the aliphatic to aromatic transformers, which are reflected in the increased thermal residue and worsened binder-block-cracking resistance of the extracted binder.
Equation (11) is a linear model of the G-R and other factors, as shown in Figure 15, which shows the regression linear model generated from Equation (11) to show the relationship between the measured and predicted G-R values from the 37 binder samples. The measured and predicted pairs of data were clustered around the ideal fit slope line with a slope of 1:1. The R2 was 0.84 and R was 0.92, indicating a strong linear correlation. The prediction error based on the variation in the sample was moderate, as indicated by the standard error ratio (Se/Sy = 0.40). The strongest predictors of the linear model were the chemical indices interactions (ICO + ISO and ICC + ICH), followed by the thermal residue. This indicates the value of chemical and thermal analyses, which provide valuable information for predicting the binder block cracking parameter.
The following equation demonstrates the linear relationship between G-R and the additional parameters:
G - R = 29,195.90 101.54   ×   A 35.28   ×   B 1319.28   ×   C 287.85   ×   D + 67,875.74   ×   E + 27,939.39   ×   F + 314.38   ×   G 2,071.307.73   ×   [ ( E 16.73   ×   10 2 )   ×   ( F 86.65   ×   10 2 ) ] + 89.53   ×   [ ( D 8.16 )   ×   ( G 18.67 ) ] + 3.40   ×   [ ( A 16.03 )   ×   ( B 5.59 ) ] ,
where
A is the ABR by RAP (%);
B is ABR by RAS (%);
C is the total AC (%);
D is the age of the mix (years);
E is the ICO + ISO;
F is the ICC + ICH;
G is the residue (%).
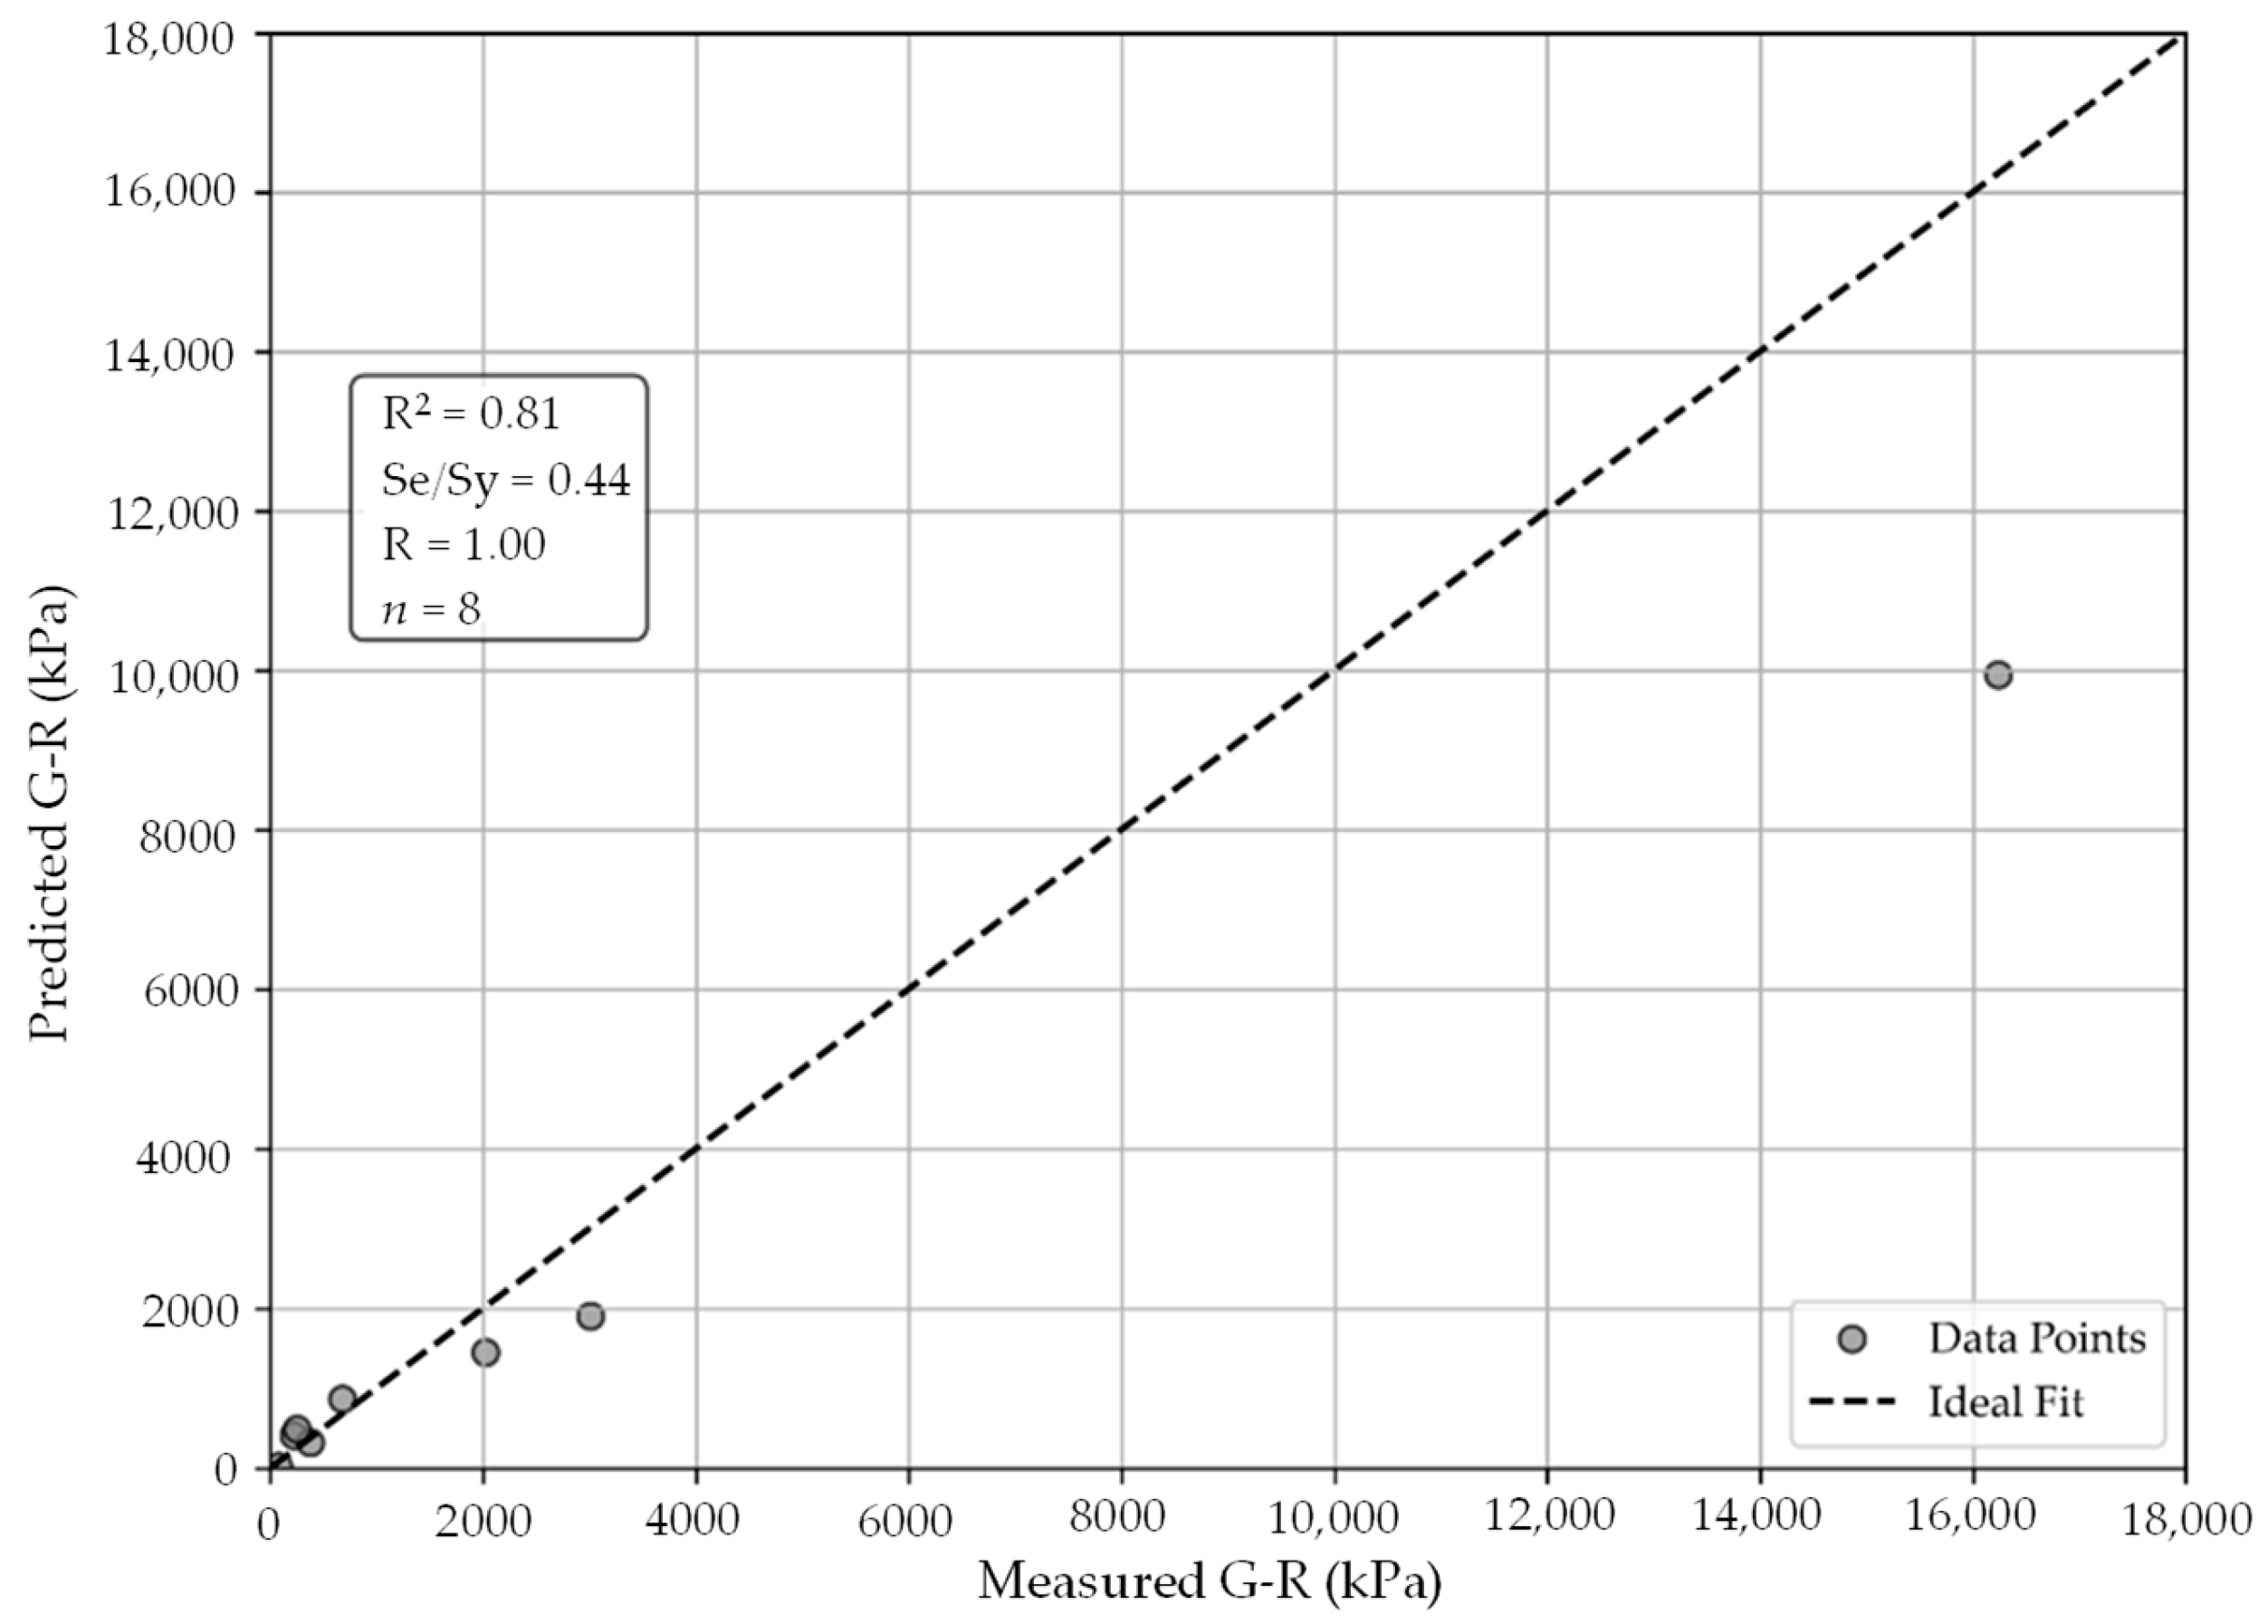
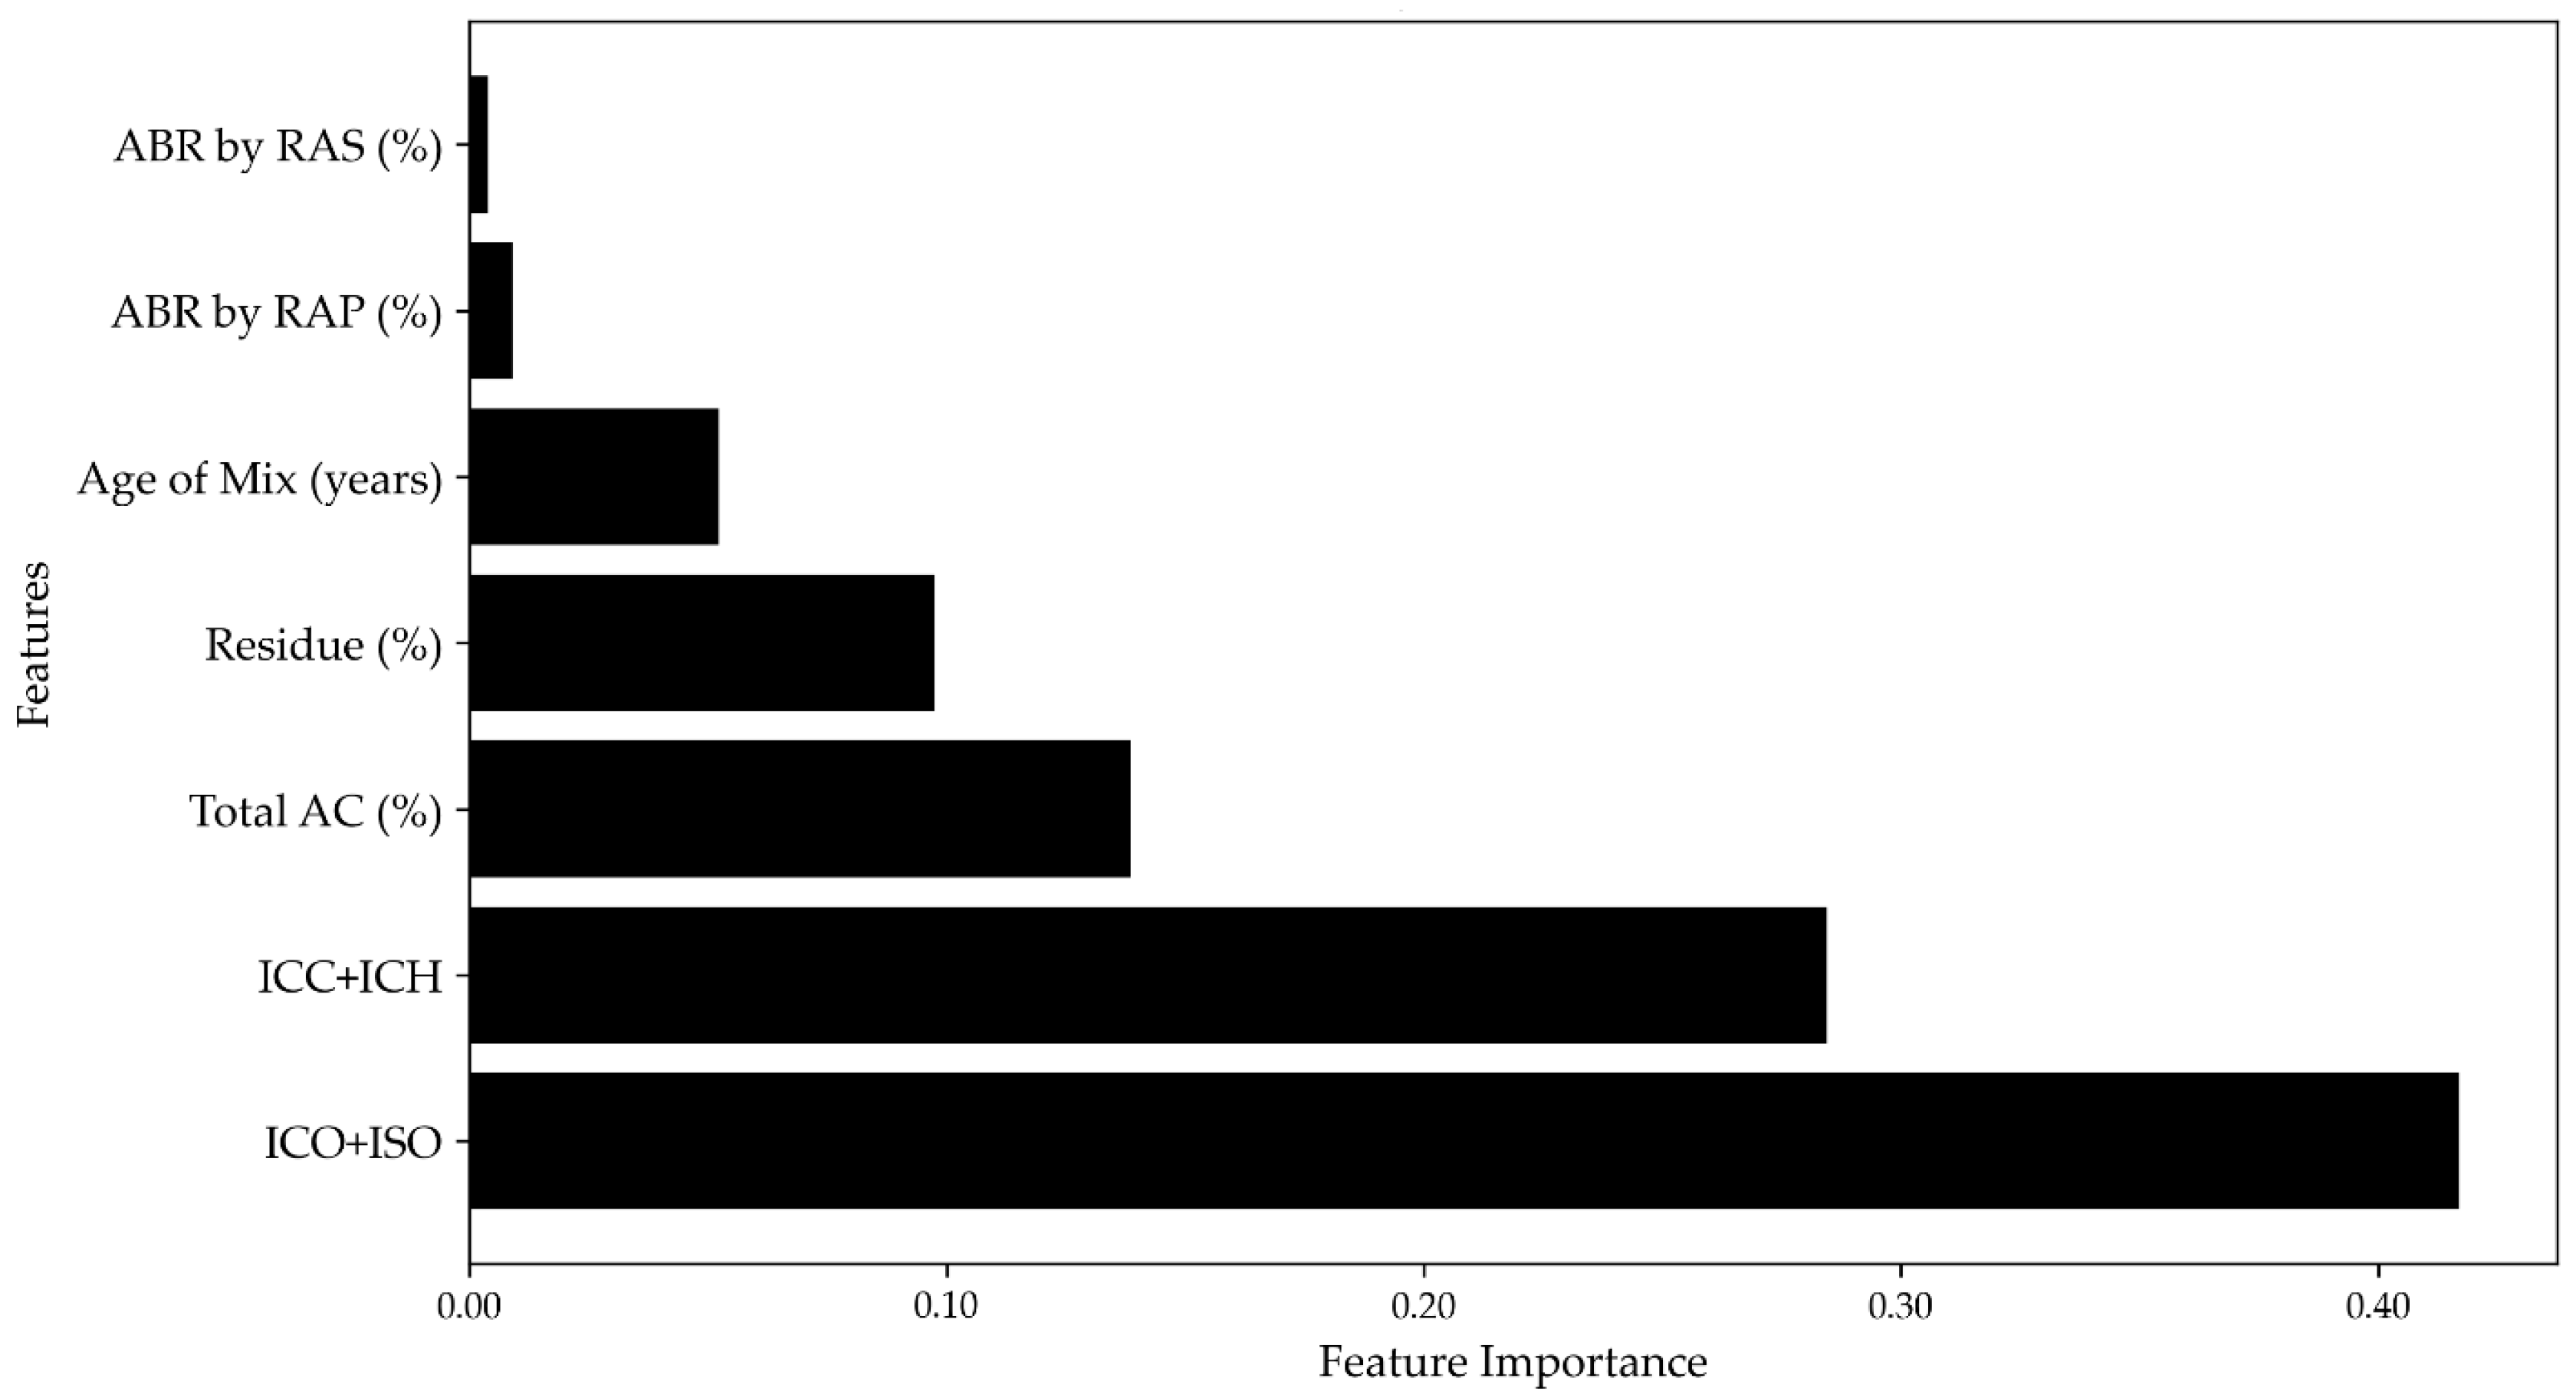
An RF regression model was built to predict G-R using 29 samples for training and 8 samples for prediction. A comparison of the measured and predicted results for the G-R model is shown in Figure 16. The model possessed high predictive capability, with an R2 of 0.81, an Se/Sy ratio of 0.44, and an R value of 1.00 for the test sample size. The observed data points were very close to the ideal-fit line, showing little spread between the measured and predicted values of the two. The relative importance of the features in the model is shown in Figure 17. The features rated the highest were ICO + ISO, ICC + ICH, total AC, and thermal residue. This further demonstrates the value of chemical and thermal analyses in predicting the binder block-cracking parameters.

3.3.4. Thermal Cracking Correlations

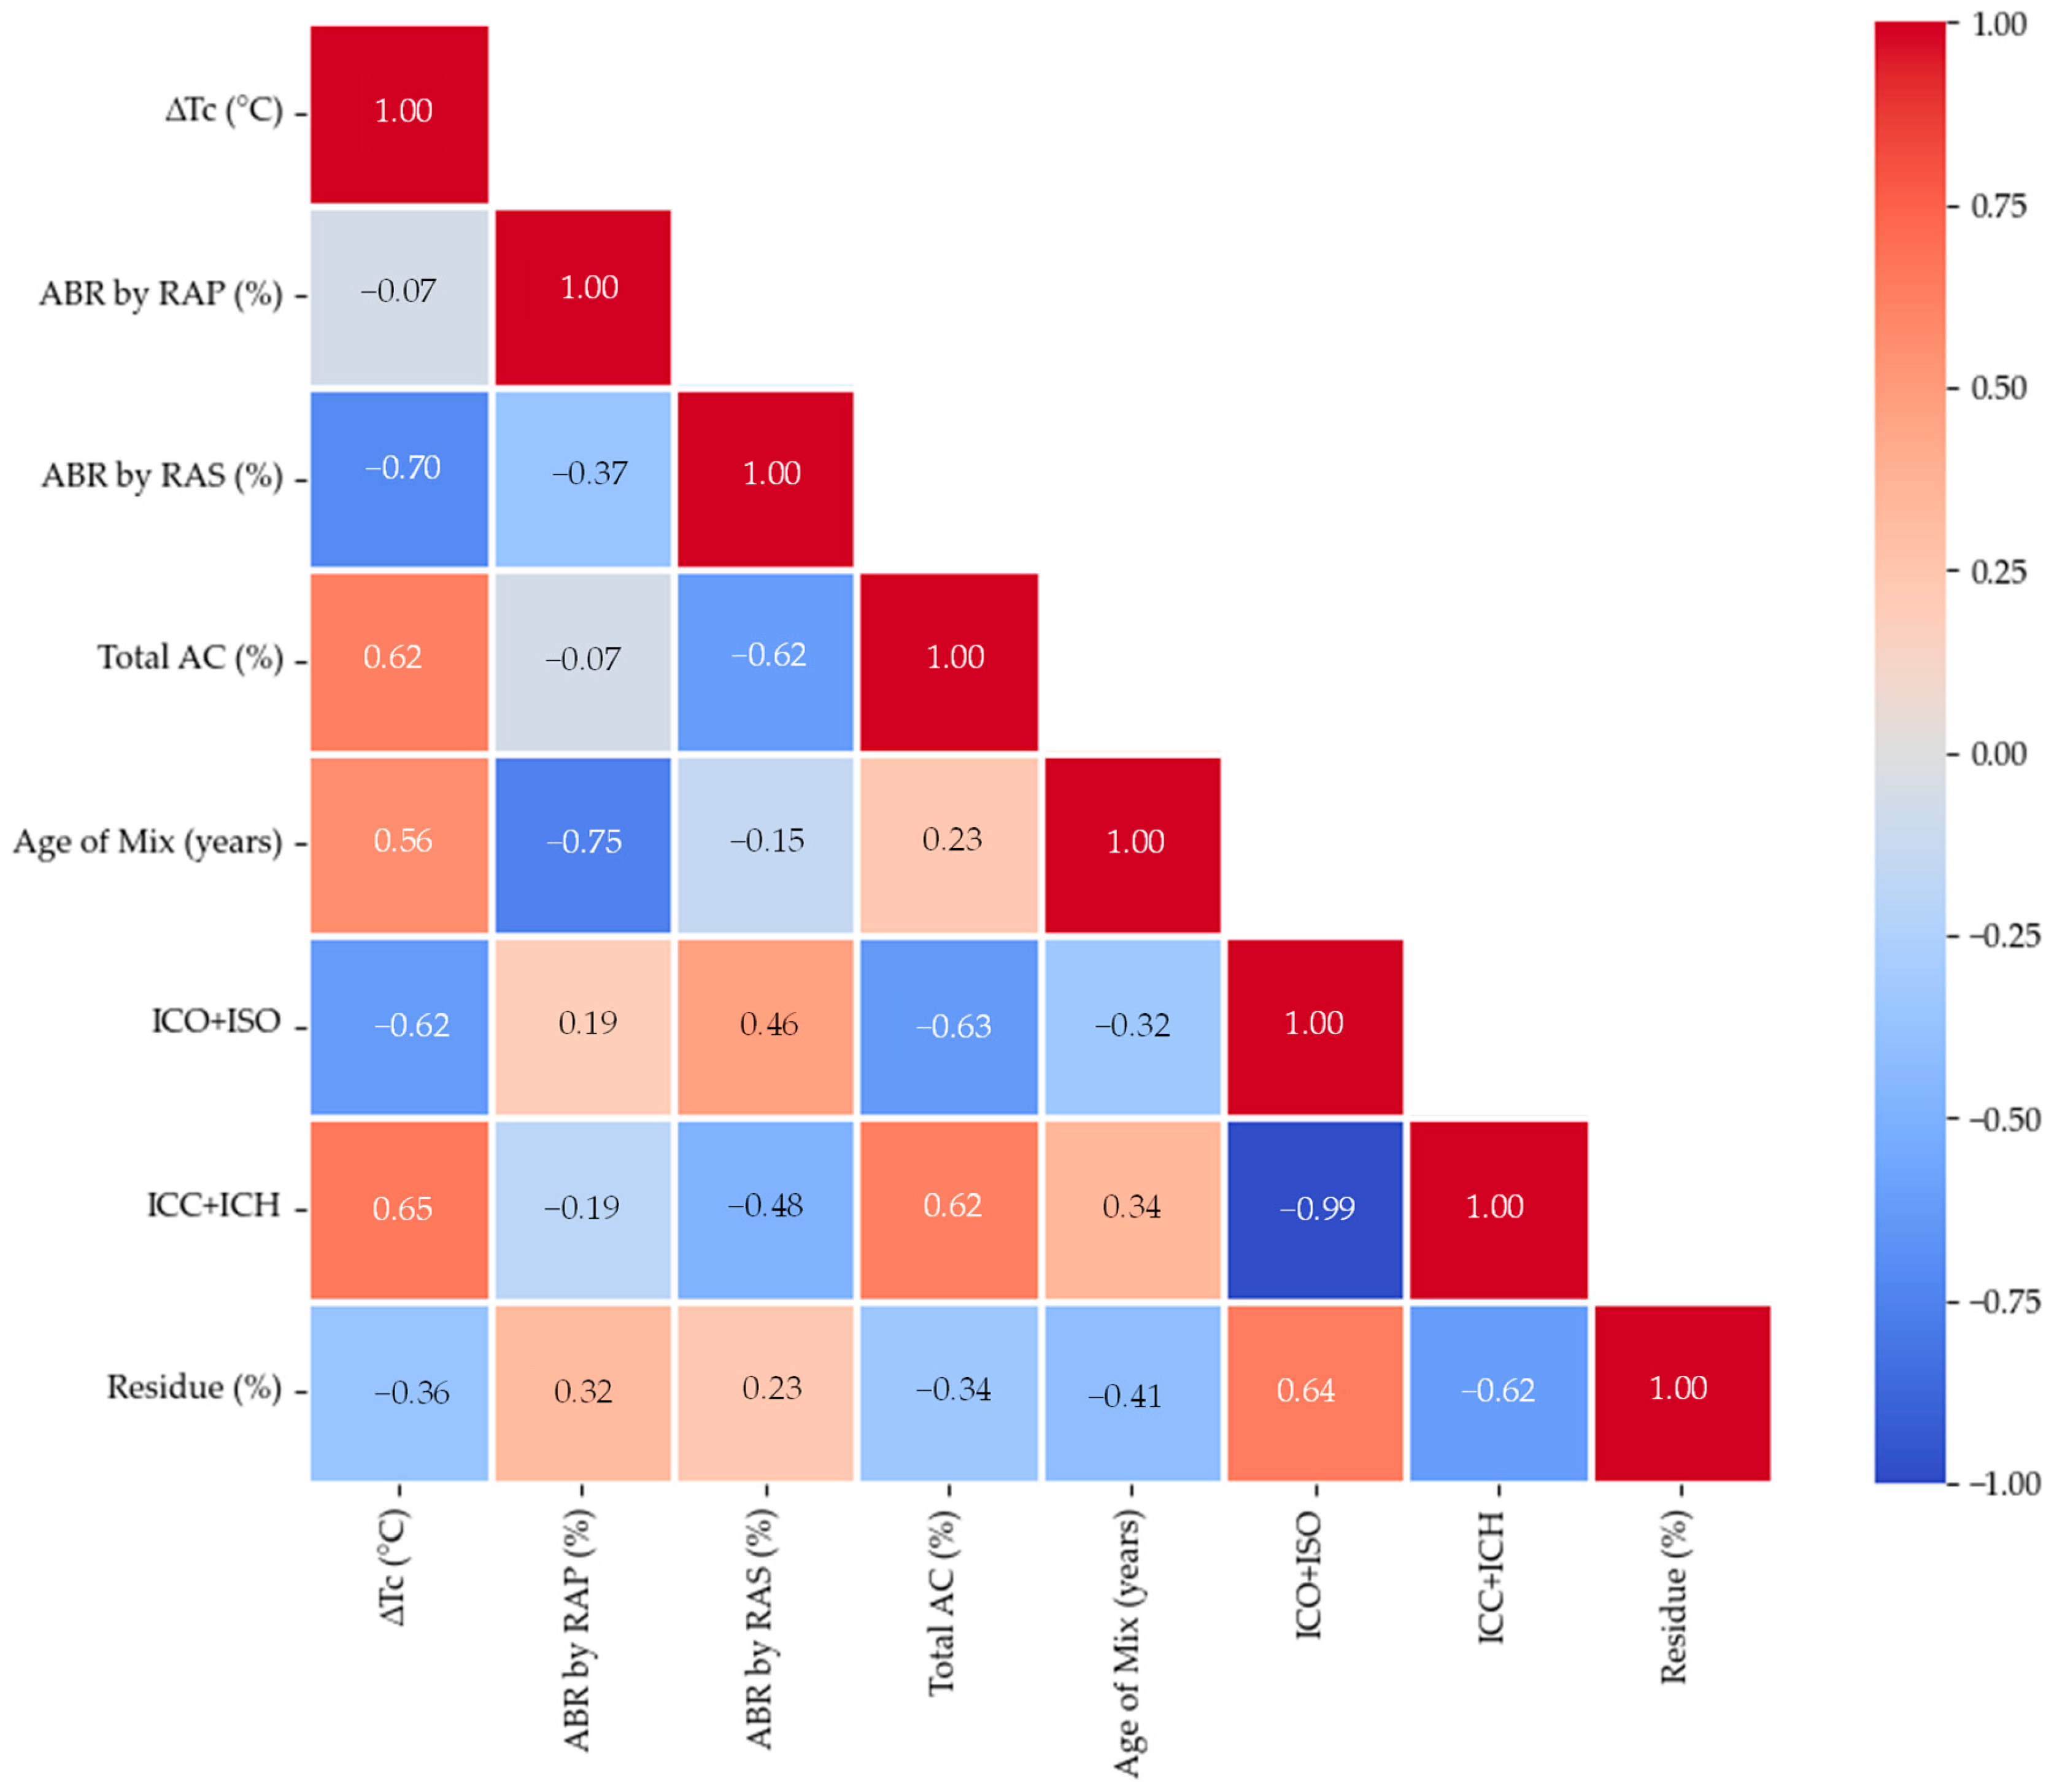
The heatmap in Figure 18 provides the correlation matrix for ΔTc and other parameters being tested [e.g., thermal residue and chemical indices (ICO + ISO and ICC + ICH)] and mixes’ information (e.g., ABR by RAP or RAS, total AC, and the age of the mix). There were moderate, significant positive correlations between ΔTc and ICC + ICH and the total AC. ΔTc had moderately significant negative correlations with the other features, including ICO + ISO and ABR by RAS. In addition to the total AC, the aged material from RAP/RAS played a crucial role in altering the binder chemical indices, which led to binders being more thermally susceptible to cracking.
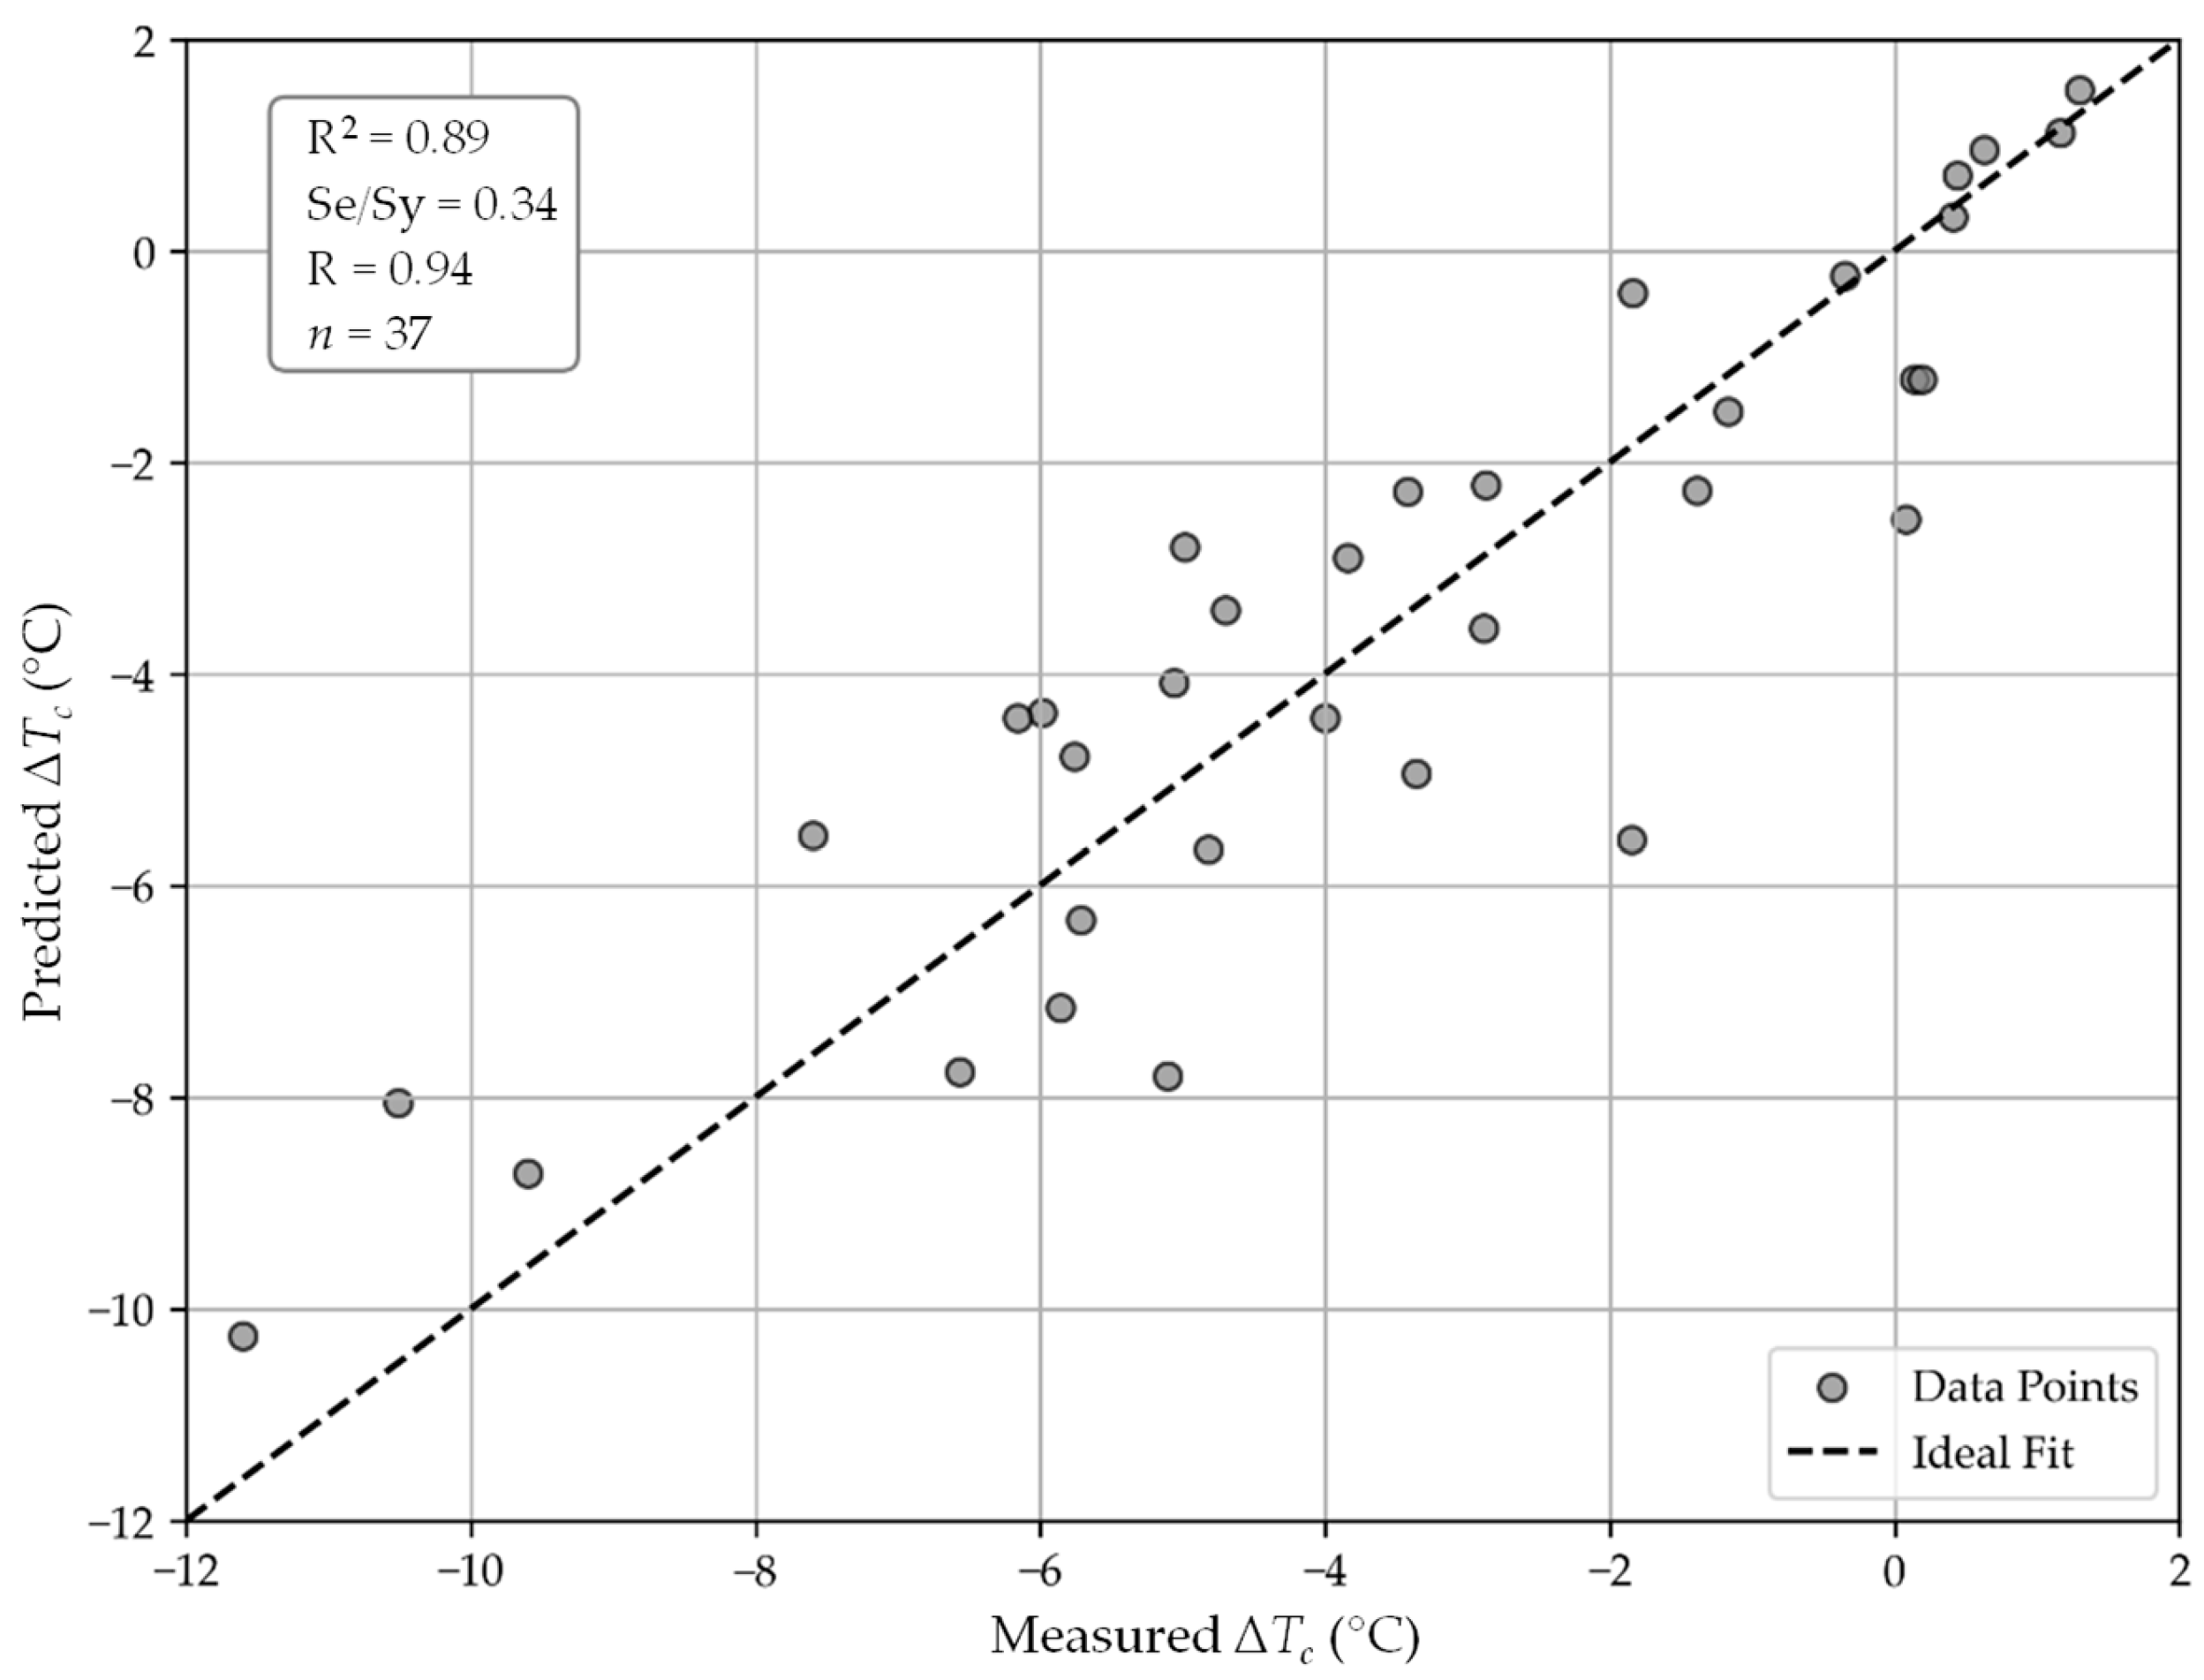
Equation (12) is the linear model of ΔTc and other factors. Figure 19 shows the linear regression model generated using Equation (12) to show the relationship between the measured and predicted ΔTc values of the 37 binder samples. The measured and predicted data pairs were clustered around an ideal fit slope line with a slope ratio of 1:1. The R2 was 0.89 and R was 0.94, indicating a strong linear relationship. The prediction error based on sample variation alone was moderate, with a standard error of 0.34 (Se/Sy). The age of the mixture, total AC, ABR by RAP, and ICC + ICH were the most robust predictors in the linear model.
The following equation illustrates the linear relationship between ΔTc and the additional parameters:
Δ T c = 274.32 + 0.32   ×   A + 6.10   ×   10 3   ×   B + 3.80   ×   C + 1.59   ×   D + 119.75   ×   E + 237.85   ×   F + 0.28   ×   G + 0.15   ×   [ ( D 8.16 )   ×   ( G 18.67 ) ] + 9.73   ×   10 3   ×   [ ( A 16.03 )   ×   ( B 5.60 )   ×   ( C 5.40 ) ]
where
A is the ABR by RAP (%);
B is ABR by RAS (%);
C is the total AC (%);
D is the age of the mix (years);
E is the ICO + ISO;
F is the ICC + ICH;
G is the residue (%).
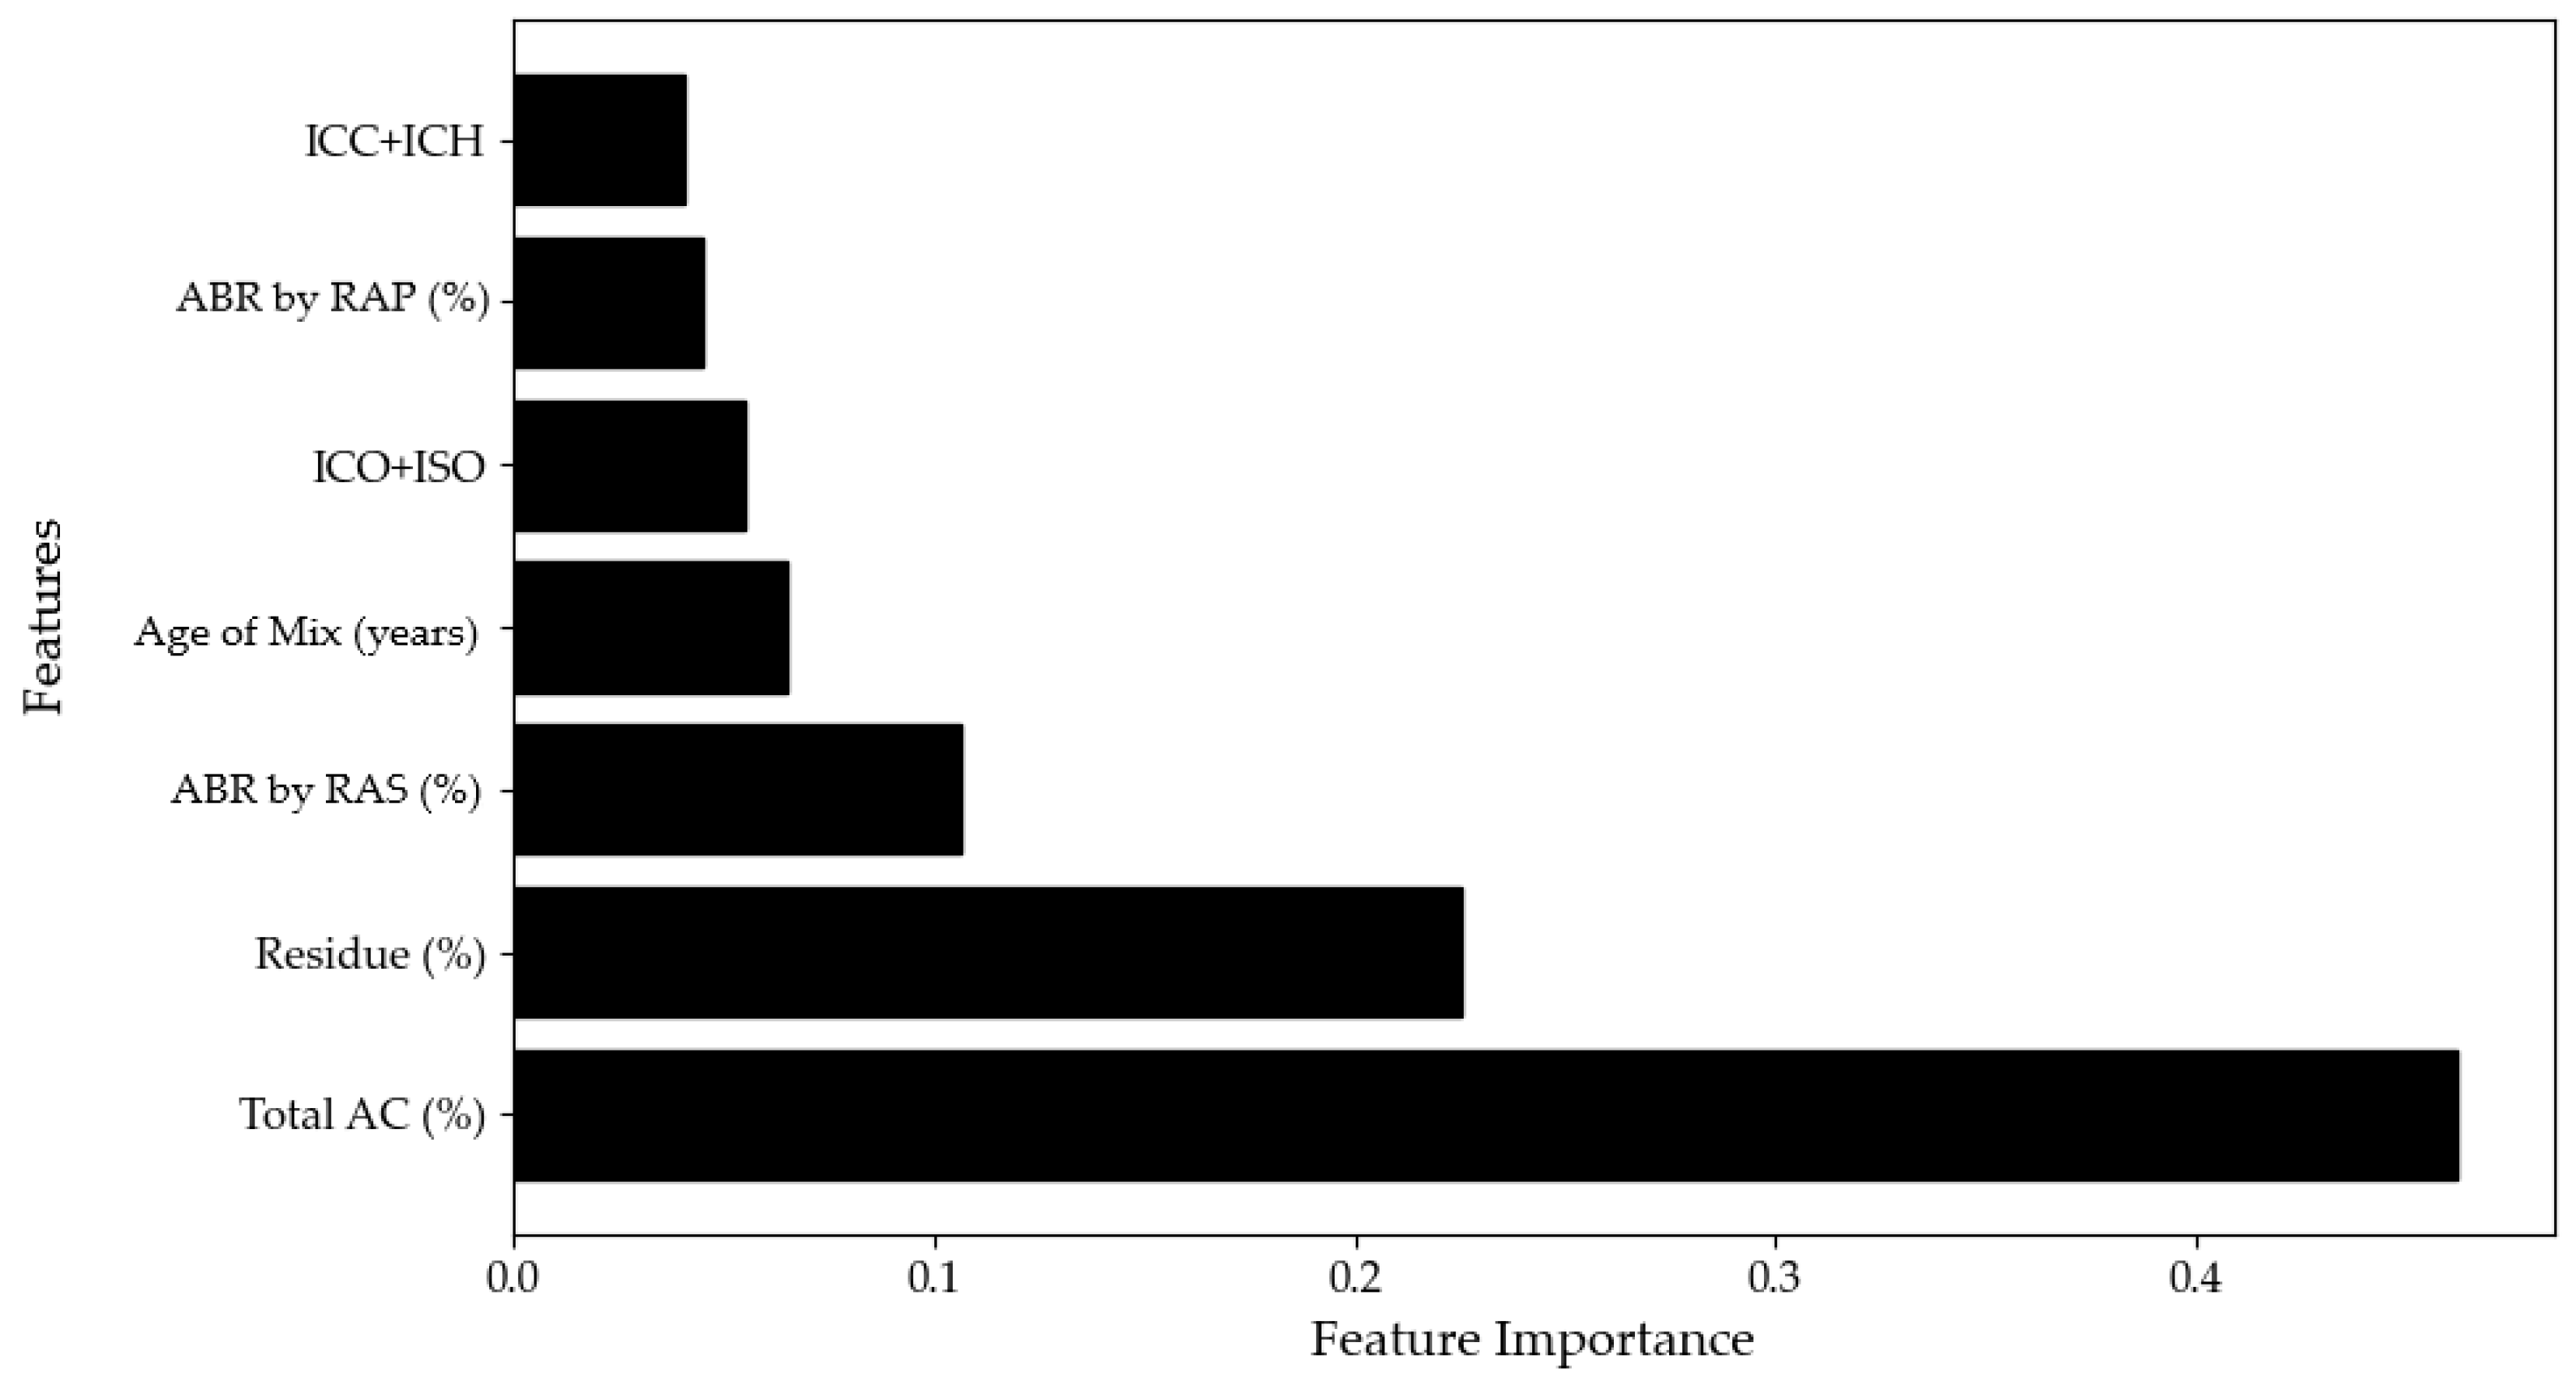
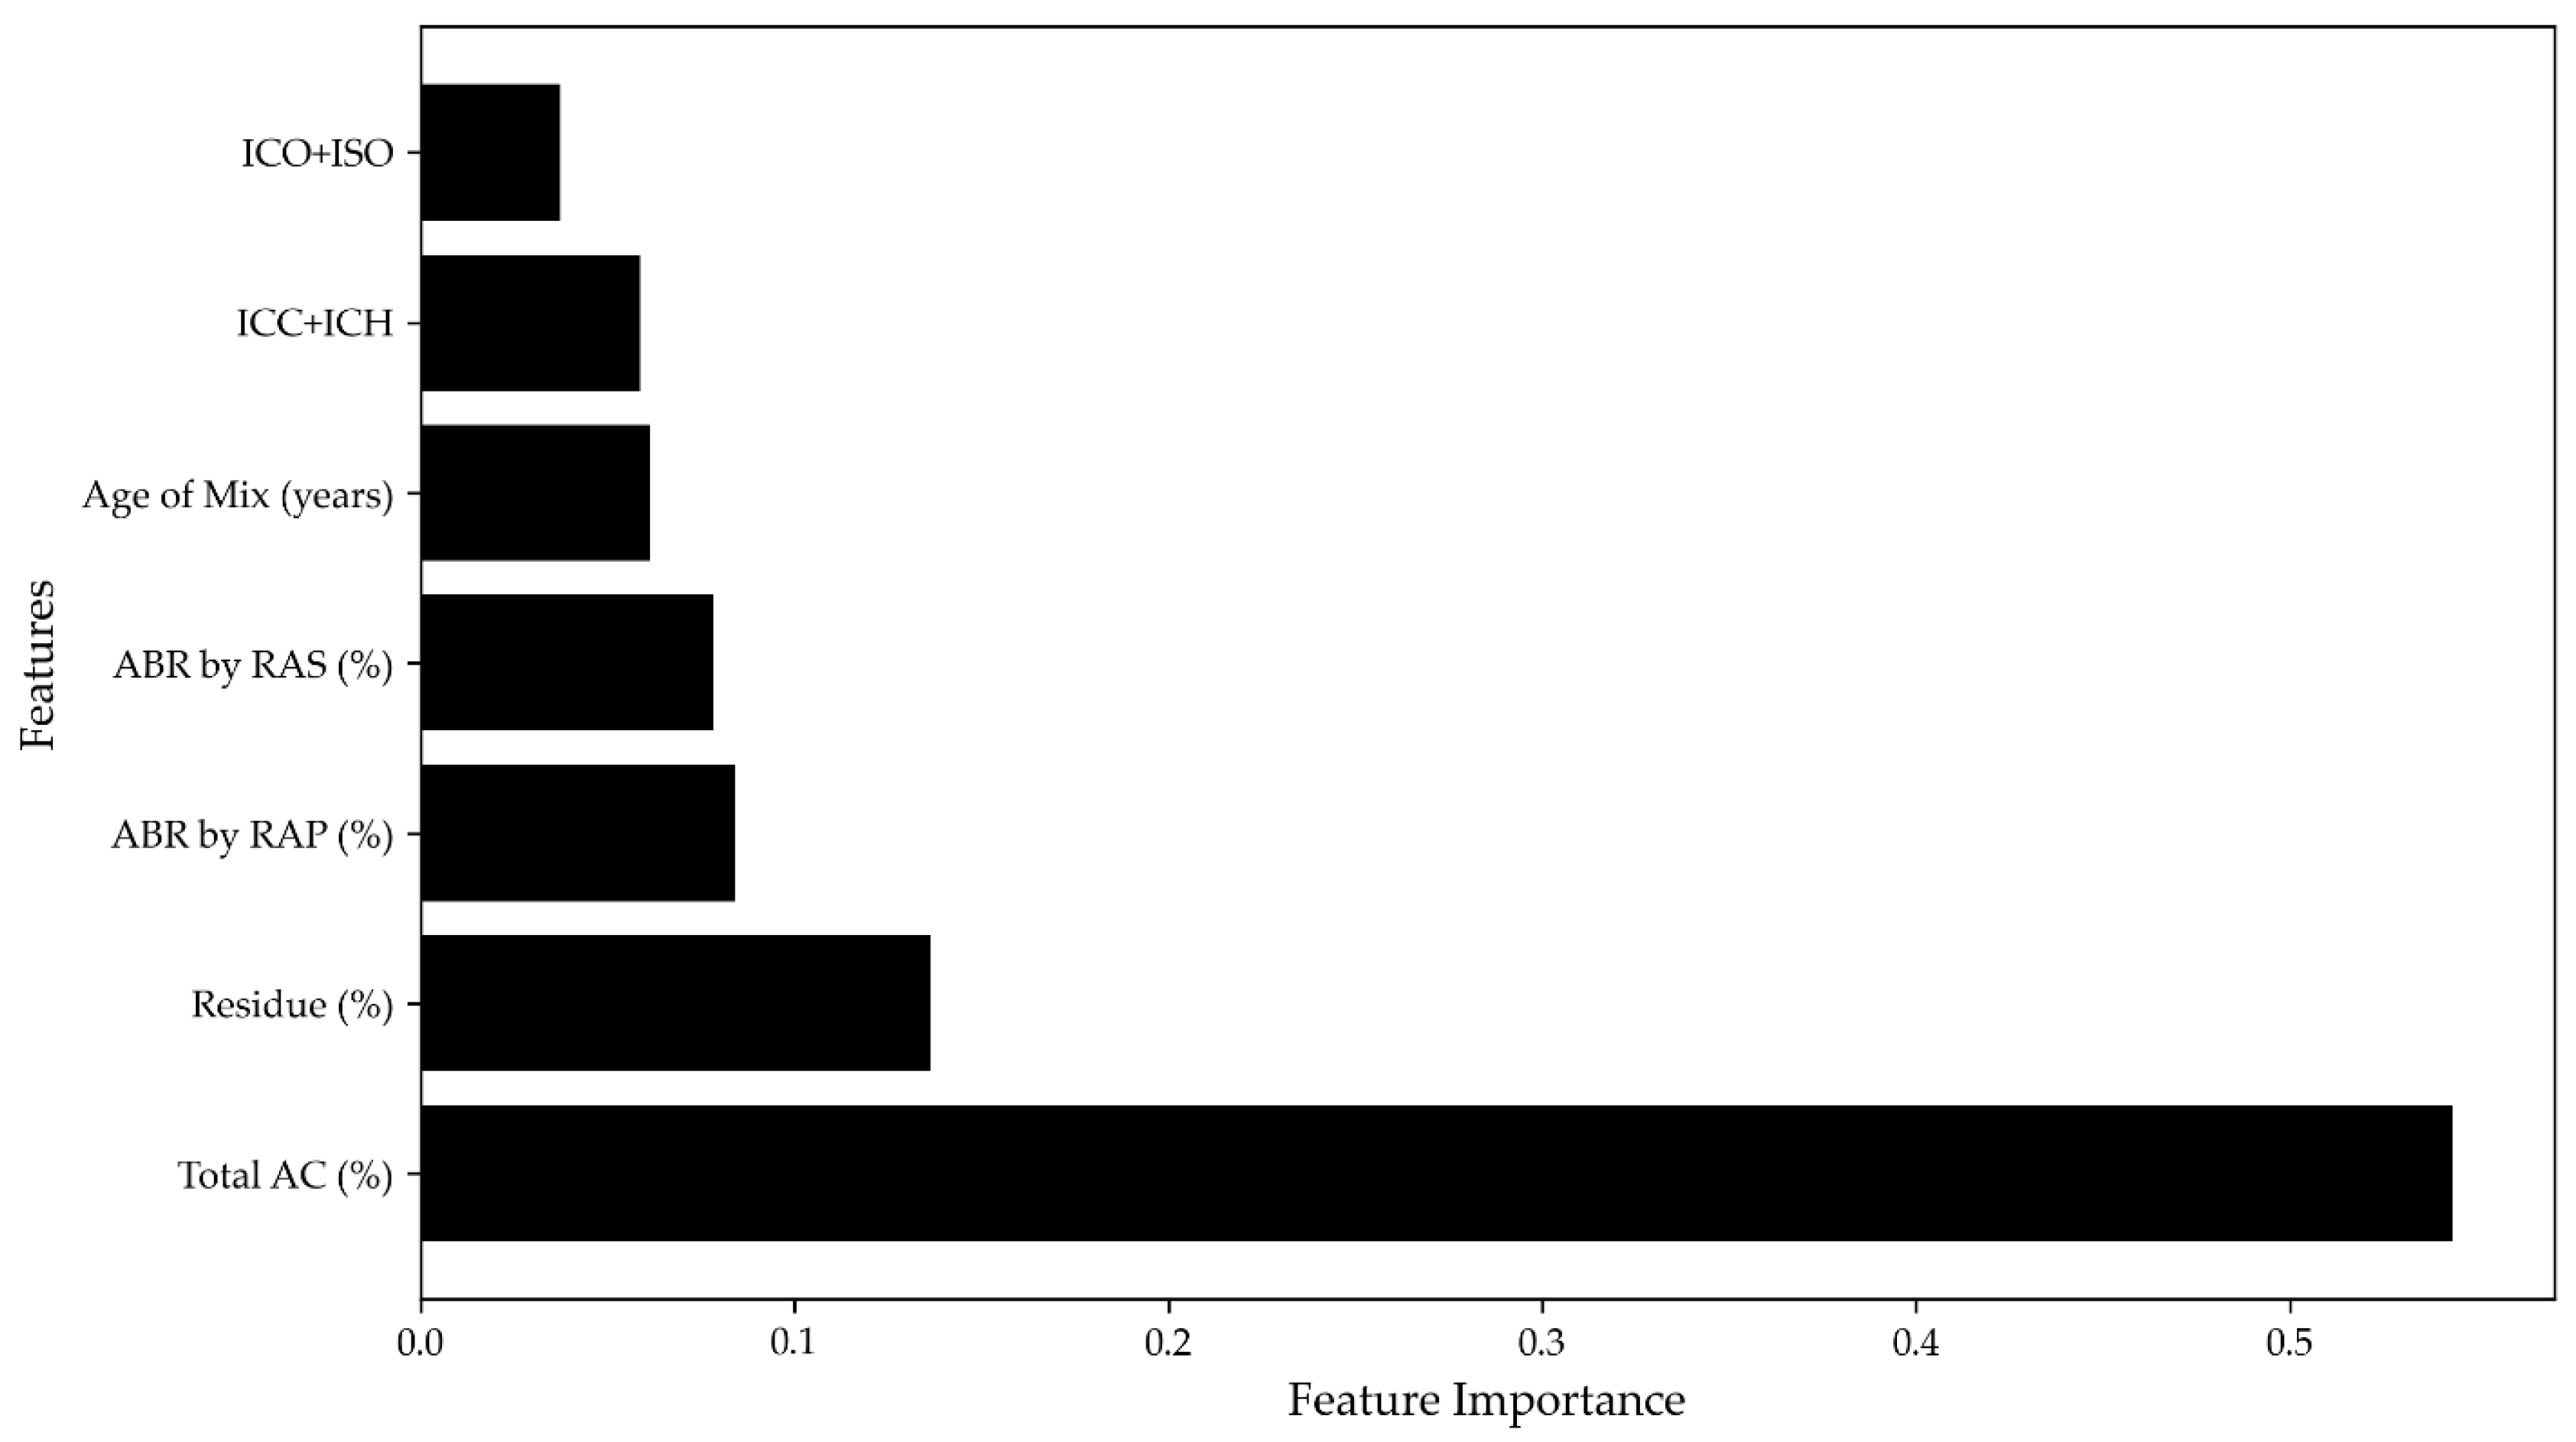
An RF regression model was constructed to predict ΔTc using 29 training and eight prediction samples. Figure 20 shows a comparison of ΔTc between the measured and predicted values. The ratio of Se to Sy of 0.36, R value of 0.95 for the test sample, and R2 value of 0.87 all showed that the model had high predictive power. The observed data showed minimal variation between the measured and predicted values and were extremely close to the ideal-fit line. Figure 21 shows the relative importance of the model’s features. The features with the highest ratings were total AC, thermal residue, ABR by RAP, and ABR by RAS. The aged RAP/RAS components with the total AC changed the binder components and affected the thermal residue, which in turn affected the binder resistance to thermal cracking.

3.4. Statistical Evaluation of Model Predictions

In a comparative statistical analysis of linear and RF nonlinear models for the four rheological parameters, it was found that, in terms of goodness of fit and accuracy of prediction, the RF models can be considered superior to the linear models, as shown in Table 2. The RF models displayed much higher R2 values (0.84 and 0.75) than (0.66 and 0.67) and much lower RMSE values (8.60 and 1038.87) than the RMSE values of (27.69 and 1644.82) for rutting and fatigue cracking, respectively, indicating that the RF models provide better predictions. The residual analysis of the models further supported the RF models, as the RF nonlinear models produced a lower STD of residuals, evidenced by the lower bias and more consistent results than the other models. For thermal cracking, both models proved to be good prediction models, as the RF nonlinear model provided a slight improvement in terms of the residual spread (STD of residuals of 1.13 versus 1.58). In terms of block cracking, the RF model had a statistically superior metric with an R value of 1.00; this model overfitted the data with poor generalization, with a higher RMSE and STD of residuals. Therefore, RF nonlinear models provide better predictive capability in most scenarios; however, caution should be exercised with overfitting when models are applied to datasets that can be very variable, as block cracking can compound a great deal of variability. Apart from model-based limitations, challenges arise from the variability of RAP/RAS and their binders. The extracted binders used in this study represent a limited range of RAP/RAS binder replacement levels (0–35%). Therefore, the applicability of the developed models with RAP/RAS binder replacement levels outside this range may be limited unless recalibrated with additional data. Hence, this study emphasized that measures of accuracy should be paired with residual analysis to provide a comprehensive view of both strength and reliability in modeling rheological behaviors.

4. Conclusions

Understanding and optimizing the performance of RAP/RAS-containing asphalt binders would require developing a comprehensive predictive framework, validating the models developed from machine learning, and selecting the key features that influence binders’ performance. Linear and RF nonlinear machine learning models were developed and validated in this study based on a framework incorporating the chemical and thermal properties of the binders and the descriptive information of the RAP/RAS-containing mixtures. The proposed framework is an important step-by-step guide for the pavement industry to enhance the performance of asphalt mixes based on sustainable asphalt recycling principles. The following principal conclusions were drawn:
  • Robust predictive capability: Machine learning, specifically RF regression, enabled accurate predictions of binder performance at high, intermediate, and low temperatures. The RF nonlinear models reduced RMSE by 69% for rutting resistance, 37% for fatigue cracking, and 21% for thermal cracking when compared to linear model performance. In terms of block cracking, the RF model had an R value of 1.00, but it overfitted the data, resulting in an RMSE that was 41% greater than that obtained using a linear model. While all of these results demonstrate the importance of combining metrics of accuracy with residuals to assess model robustness, they are of concern, especially with a dataset that had such variability.
  • Practical for limited binder amounts: One advantage of the framework is its capability to provide reliable predictions using small amounts of extracted binder. This is beneficial in practice because field cores with high RAP/RAS contents usually yield limited amounts of extracted binders.
  • Enhanced knowledge of binder performance: The combination of rheological and chemical analyses, such as aging, aromatic and aliphatic indices, and thermal residue characteristics, enables the understanding of binder development in recycled systems. This is a way to successfully break through some of the constraints of conventional methodologies based exclusively on rheological measurements.
  • Feature importance emphasizes the dominance of chemical and thermal properties: Thermal residue, along with carbonyl, sulfoxide, aromatic, and aliphatic indices, consistently ranked among the top five most influential features affecting the rheological characteristics of the extracted binders.
  • Promoting sustainable recycling: The framework allocates data-driven information on the use of RAP/RAS, thus ensuring that the utilization of RAP/RAS is more sustainable. The study establishes a benchmark for balancing sustainability and performance by evaluating RAP/RAS binder replacement up to 35%.
  • Scalability, broader applications, and limitations: This study was conducted on mixtures with RAP/RAS; however, the framework can be applied to other recycled or modified binders. With further development, it could be expanded into a digital tool for quality control and mixture optimization in both research and field industries. Although the suggested framework offers accurate forecasts on binders extracted from mixtures with 0–35% RAP/RAS binder replacements, its application beyond this range requires recalibration and validation with expanded datasets.

Author Contributions

Conceptualization, E.D.-A. and M.A.; methodology, E.D.-A. and M.A.; software, E.D.-A.; validation, E.D.-A. and M.A.; formal analysis, E.D.-A. and M.A.; investigation, E.D.-A.; resources, M.A.; data curation, E.D.-A. and M.A.; writing—original draft preparation, E.D.-A. and M.A.; writing—review and editing, E.D.-A. and M.A.; visualization, E.D.-A. and M.A.; supervision, M.A.; project administration, M.A.; funding acquisition, M.A. All authors have read and agreed to the published version of the manuscript.

Funding

This research was partially funded by Missouri University of Science and Technology (Missouri S&T), the Missouri Asphalt Pavement Association (MAPA) endowment fund, and the Missouri Department of Transportation (MoDOT) under Project number TR201807.

Institutional Review Board Statement

Not applicable.

Informed Consent Statement

Not applicable.

Data Availability Statement

The original contributions presented in this study are included in the article. Further inquiries can be directed to the corresponding author.

Acknowledgments

During the preparation of this manuscript, the author(s) used Python (version 3.13, released on 7 October 2024) for the purposes of machine learning.

Conflicts of Interest

The authors declare no conflicts of interest.

Abbreviations

The following abbreviations are used in this manuscript:
ABRAsphalt Binder Replacement
ACAsphalt Content
DSRDynamic Shear Rheometer
FTIRFourier Transform Infrared
G-RGlover-Rowe
RAPReclaimed Asphalt Pavement
RASRecycled Asphalt Shingles
RFRandom Forest
RMSERoot Mean Square Error
STDStandard Deviation
TCETrichloroethylene
TGAThermogravimetric Analysis

References

  1. Pasetto, M.; Haider, S.; Pasquini, E. Circular economy for transport infrastructure: An overview of the sustainable use of recycled asphalt shingles in asphalt mixtures. Appl. Sci. 2024, 14, 10145. [Google Scholar] [CrossRef]
  2. Elnaml, I.; Mohammad, L.N.; Baumgardner, G.; Cooper, S.; Cooper, S. Sustainability of asphalt mixtures containing 50% RAP and recycling agents. Recycling 2024, 9, 85. [Google Scholar] [CrossRef]
  3. Mocelin, D.M.; Isied, M.M.; Castorena, C. Influence of reclaimed asphalt pavement (RAP) and recycled asphalt shingle (RAS) binder availability on the composition of asphalt mixtures. J. Clean. Prod. 2023, 426, 139156. [Google Scholar] [CrossRef]
  4. Yu, J.; Lin, Z.; Zou, G.; Yu, H.; Leng, Z.; Zhang, Y. Long-term performance of recycled asphalt mixtures containing high RAP and RAS. J. Road Eng. 2024, 4, 36–53. [Google Scholar] [CrossRef]
  5. Deef-Allah, E.; Abdelrahman, M. Correlating the compositional changes to the rheological properties of recovered asphalt binders from recycled asphalt mixtures: Insights from the thermogravimetric measurements. Metrology 2025, 5, 16. [Google Scholar] [CrossRef]
  6. Rahman, M.A.; Mateos, A.; Harvey, J.T.; Buscheck, J.; Brotschi, J.; Jones, D.J.; Deng, H. Fatigue and age-related cracking performance of asphalt mixes containing RAP, RAS and recycling agents (RA). Constr. Build. Mater. 2025, 466, 140302. [Google Scholar] [CrossRef]
  7. Deef-Allah, E.; Abdelrahman, M. Quality assurance framework for recovered binders and aggregates from asphalt mixtures incorporating recycled materials. Recycling 2025, 10, 71. [Google Scholar] [CrossRef]
  8. Al-Saffar, Z.H.; Yaacob, H.; Katman, H.Y.; Mohd Satar, M.K.I.; Bilema, M.; Putra Jaya, R.; Eltwati, A.S.; Radeef, H.R. A review on the durability of recycled asphalt mixtures embraced with rejuvenators. Sustainability 2021, 13, 8970. [Google Scholar] [CrossRef]
  9. Sukhija, M.; Coleri, E. A systematic review on the role of reclaimed asphalt pavement materials: Insights into performance and sustainability. Clean. Mater. 2025, 16, 100316. [Google Scholar] [CrossRef]
  10. Li, H.; Xing, C.; Zhu, B.; Zhang, X.; Gao, Y.; Tang, S.; Cheng, H. Comparative analysis of four styrene-butadiene-styrene (SBS) structure repair agents in the rejuvenation of aged SBS-modified bitumen. Constr. Build. Mater. 2025, 476, 141232. [Google Scholar] [CrossRef]
  11. Xing, C.; Tang, S.; Chang, Z.; Han, Z.; Li, H.; Zhu, B. A comprehensive review on the plant-mixed cold recycling technology of emulsified asphalt: Raw materials and factors affecting performances. Constr. Build. Mater. 2024, 439, 137344. [Google Scholar] [CrossRef]
  12. Deef-Allah, E.; Abdelrahman, M. Investigating the relationship between the fatigue cracking resistance and thermal characteristics of asphalt binders extracted from field mixes containing recycled materials. Transp. Eng. 2021, 4, 100055. [Google Scholar] [CrossRef]
  13. Ren, S.; Liu, X.; Lin, P.; Jing, R.; Erkens, S. Toward the long-term aging influence and novel reaction kinetics models of bitumen. Int. J. Pavement Eng. 2023, 24, 2024188. [Google Scholar] [CrossRef]
  14. Elkashef, M.; Williams, R.C.; Cochran, E. Thermal stability and evolved gas analysis of rejuvenated reclaimed asphalt pavement (RAP) bitumen using thermogravimetric analysis–Fourier transform infrared (TG–FTIR). J. Therm. Anal. Calorim. 2018, 131, 865–871. [Google Scholar] [CrossRef]
  15. Deef-Allah, E.; Abdelrahman, M. Thermal, chemical and rheological properties of asphalt binders extracted from field cores. Innov. Infrastruct. Solut. 2022, 7, 235. [Google Scholar] [CrossRef]
  16. Pipintakos, G.; Sreeram, A.; Mirwald, J.; Bhasin, A. Engineering bitumen for future asphalt pavements: A review of chemistry, structure and rheology. Mater. Des. 2024, 244, 113157. [Google Scholar] [CrossRef]
  17. Liu, F.; Wen, H. Prediction of rheological and damage properties of asphalt binders that result from oxidative aging. Transp. Res. Rec. 2015, 2505, 92–98. [Google Scholar] [CrossRef]
  18. Sarker, I.H. Machine learning: Algorithms, real-world applications and research directions. SN Comput. Sci. 2021, 2, 160. [Google Scholar] [CrossRef]
  19. Sarker, I.H.; Salah, K. AppsPred: Predicting context-aware smartphone apps using random forest learning. Internet Things 2019, 8, 100106. [Google Scholar] [CrossRef]
  20. Cappelli, F.; Castronuovo, G.; Grimaldi, S.; Telesca, V. Random Forest and feature importance measures for discriminating the most influential environmental factors in predicting cardiovascular and respiratory diseases. Int. J. Environ. Res. Public. Health 2024, 21, 867. [Google Scholar] [CrossRef]
  21. Liu, J.; Liu, F.; Zheng, C.; Fanijo, E.O.; Wang, L. Improving asphalt mix design considering international roughness index of asphalt pavement predicted using autoencoders and machine learning. Constr. Build. Mater. 2022, 360, 129439. [Google Scholar] [CrossRef]
  22. Nguyen, H.L.; Tran, V.Q. Data-driven approach for investigating and predicting rutting depth of asphalt concrete containing reclaimed asphalt pavement. Constr. Build. Mater. 2023, 377, 131116. [Google Scholar] [CrossRef]
  23. Al-Ammari, M.; Dong, R.; Nasser, M.; Al-Maswari, A. Innovative machine learning approaches for predicting the asphalt content during Marshall design of asphalt mixtures. Materials 2025, 18, 1474. [Google Scholar] [CrossRef] [PubMed]
  24. Rondinella, F.; Oreto, C.; Abbondati, F.; Baldo, N. Laboratory investigation and machine learning modeling of road pavement asphalt mixtures prepared with construction and demolition waste and RAP. Sustainability 2023, 15, 16337. [Google Scholar] [CrossRef]
  25. Afshin, A.; Behnood, A. Prediction of moisture susceptibility of asphalt mixtures containing RAP materials using machine learning algorithms. Int. J. Pavement Eng. 2024, 25, 2431610. [Google Scholar] [CrossRef]
  26. Liu, J.; Yan, K.; Liu, J.; Zhao, X. Using artificial neural networks to predict the dynamic modulus of asphalt mixtures containing recycled asphalt shingles. J. Mater. Civ. Eng. 2018, 30, 04018051. [Google Scholar] [CrossRef]
  27. Ghavami, S.; Alipour, Z.; Naseri, H.; Jahanbakhsh, H.; Karimi, M.M. A new ensemble prediction method for reclaimed asphalt pavement (RAP) mixtures containing different constituents. Buildings 2023, 13, 1787. [Google Scholar] [CrossRef]
  28. Mullapudi, R.S.; Sudhakar Reddy, K. An investigation on the relationship between FTIR indices and surface free energy of RAP binders. Road Mater. Pavement Des. 2020, 21, 1326–1340. [Google Scholar] [CrossRef]
  29. ASTM D2172/D2172M-24; Test Methods for Quantitative Extraction of Asphalt Binder from Asphalt Mixtures. ASTM International: West Conshohocken, PA, USA, 2024.
  30. ASTM D5404/D5404M-24; Standard Practice for Recovery of Asphalt Binder from Solution Using the Rotary Evaporator. ASTM International: West Conshohocken, PA, USA, 2024.
  31. Van den Bergh, W. The Effect of Ageing on the Fatigue and Healing Properties of Bituminous Mortars. Ph.D. Thesis, Delft University of Technology, Delft, The Netherlands, 2011. [Google Scholar]
  32. Singh, D.; Sawant, D. Understanding effects of RAP on rheological performance and chemical composition of SBS modified binder using series of laboratory tests. Int. J. Pavement Res. Technol. 2016, 9, 178–189. [Google Scholar] [CrossRef]
  33. De la Roche, C.; van de Ven, M.; Planche, J.-P.; van den Bergh, W.; Grenfell, J.; Gabet, T.; Mouillet, V.; Porot, L.; Farcas, F.; Ruot, C. Hot recycling of bituminous mixtures. In Advances in Interlaboratory Testing and Evaluation of Bituminous Materials; Partl, M.N., Bahia, H.U., Canestrari, F., de la Roche, C., di Benedetto, H., Piber, H., Sybilski, D., Eds.; Springer: Dordrecht, The Netherlands, 2013; Volume 9, pp. 361–428. [Google Scholar]
  34. Gong, M.; Yang, J.; Yao, H.; Wang, M.; Niu, X.; Haddock, J.E. Investigating the performance, chemical, and microstructure properties of carbon nanotube-modified asphalt binder. Road Mater. Pavement Des. 2018, 19, 1499–1522. [Google Scholar] [CrossRef]
  35. ASTM D7175-15; Test Method for Determining the Rheological Properties of Asphalt Binder Using a Dynamic Shear Rheometer. ASTM International: West Conshohocken, PA, USA, 2023.
  36. Anderson, R.M.; King, G.N.; Hanson, D.I.; Blankenship, P.B. Evaluation of the relationship between asphalt binder properties and non-load related cracking. J. Assoc. Asph. Paving Technol. 2011, 80, 615–664. [Google Scholar]
  37. Deef-Allah, E.; Abdelrahman, M. Performance evaluation of extracted asphalt binders from field cores containing recycled components: Load-and non-load-associated cracking resistance. Adv. Mat. Res. 2023, 1175, 149–170. [Google Scholar] [CrossRef]
  38. Glover, C.J.; Davison, R.R.; Domke, C.H.; Ruan, Y.; Juristyarini, P.; Knorr, D.B.; Jung, S.H. Development of a New Method for Assessing Asphalt Binder Durability with Field Validation; Texas Department of Transportation: Austin, TX, USA, 2005. [Google Scholar]
  39. ASTM E1131-20; Standard Test Method for Compositional Analysis by Thermogravimetry. ASTM International: West Conshohocken, PA, USA, 2020.
  40. Nciri, N.; Shin, T.; Kim, N.; Caron, A.; ben Ismail, H.; Cho, N. Towards the use of waste pig fat as a novel potential bio-based rejuvenator for recycled asphalt pavement. Materials 2020, 13, 1002. [Google Scholar] [CrossRef] [PubMed]
  41. Zhang, C.; Xu, T.; Shi, H.; Wang, L. Physicochemical and pyrolysis properties of SARA fractions separated from asphalt binder. J. Therm. Anal. Calorim. 2015, 122, 241–249. [Google Scholar] [CrossRef]
  42. Yu, H.; Leng, Z.; Gao, Z. Thermal analysis on the component interaction of asphalt binders modified with crumb rubber and warm mix additives. Constr. Build. Mater. 2016, 125, 168–174. [Google Scholar] [CrossRef]
  43. Sugano, M.; Iwabuchi, Y.; Watanabe, T.; Kajita, J.; Iwai, S.; Hirano, K. Thermal degradation mechanism of polymer modified asphalt. Chem. Eng. Trans. 2009, 18, 839–844. [Google Scholar]
  44. Rogel, E.; Ovalles, C.; Moir, M. Asphaltene Chemical characterization as a function of solubility: Effects on stability and aggregation. Energy Fuels 2012, 26, 2655–2662. [Google Scholar] [CrossRef]
  45. Barneto, A.G.; Carmona, J.A.; Garrido, M.J.F. Thermogravimetric assessment of thermal degradation in asphaltenes. Thermochim. Acta 2016, 627–629, 1–8. [Google Scholar] [CrossRef]
  46. Salin, I.M.; Seferis, J.C. Kinetic Analysis of high-resolution TGA variable heating rate data. J. Appl. Polym. Sci. 1993, 47, 847–856. [Google Scholar] [CrossRef]
  47. Gill, P.S.; Sauerbrunn, S.R.; Crowe, B.S. High resolution thermogravimetry. J. Therm. Anal. 1992, 38, 255–266. [Google Scholar] [CrossRef]
  48. Breiman, L. Random Forests. Mach. Learn. 2001, 45, 5–32. [Google Scholar] [CrossRef]
  49. Hastie, T.; Tibshirani, R.; Friedman, J. The Elements of Statistical Learning, 2nd ed.; Springer New York: New York, NY, USA, 2009. [Google Scholar]
  50. Masis, S. Interpretable Machine Learning with Python: Build Explainable, Fair, and Robust High-Performance Models with Hands-On, Real-World Examples, 2nd ed.; Packt Publishing: Birmingham, UK, 2023. [Google Scholar]
  51. Nishikiori, H.; Hayashibe, M.; Fujii, T. Visible light-photocatalytic activity of sulfate-doped titanium dioxide prepared by the sol–gel method. Catalysts 2013, 3, 363–377. [Google Scholar] [CrossRef]
  52. Deef-Allah, E.; Abdelrahman, M.; Ragab, M. Components’ exchanges between recycled materials and asphalt binders in asphalt mixes. Adv. Civ. Eng. Mater. 2022, 11, 20210105. [Google Scholar] [CrossRef]
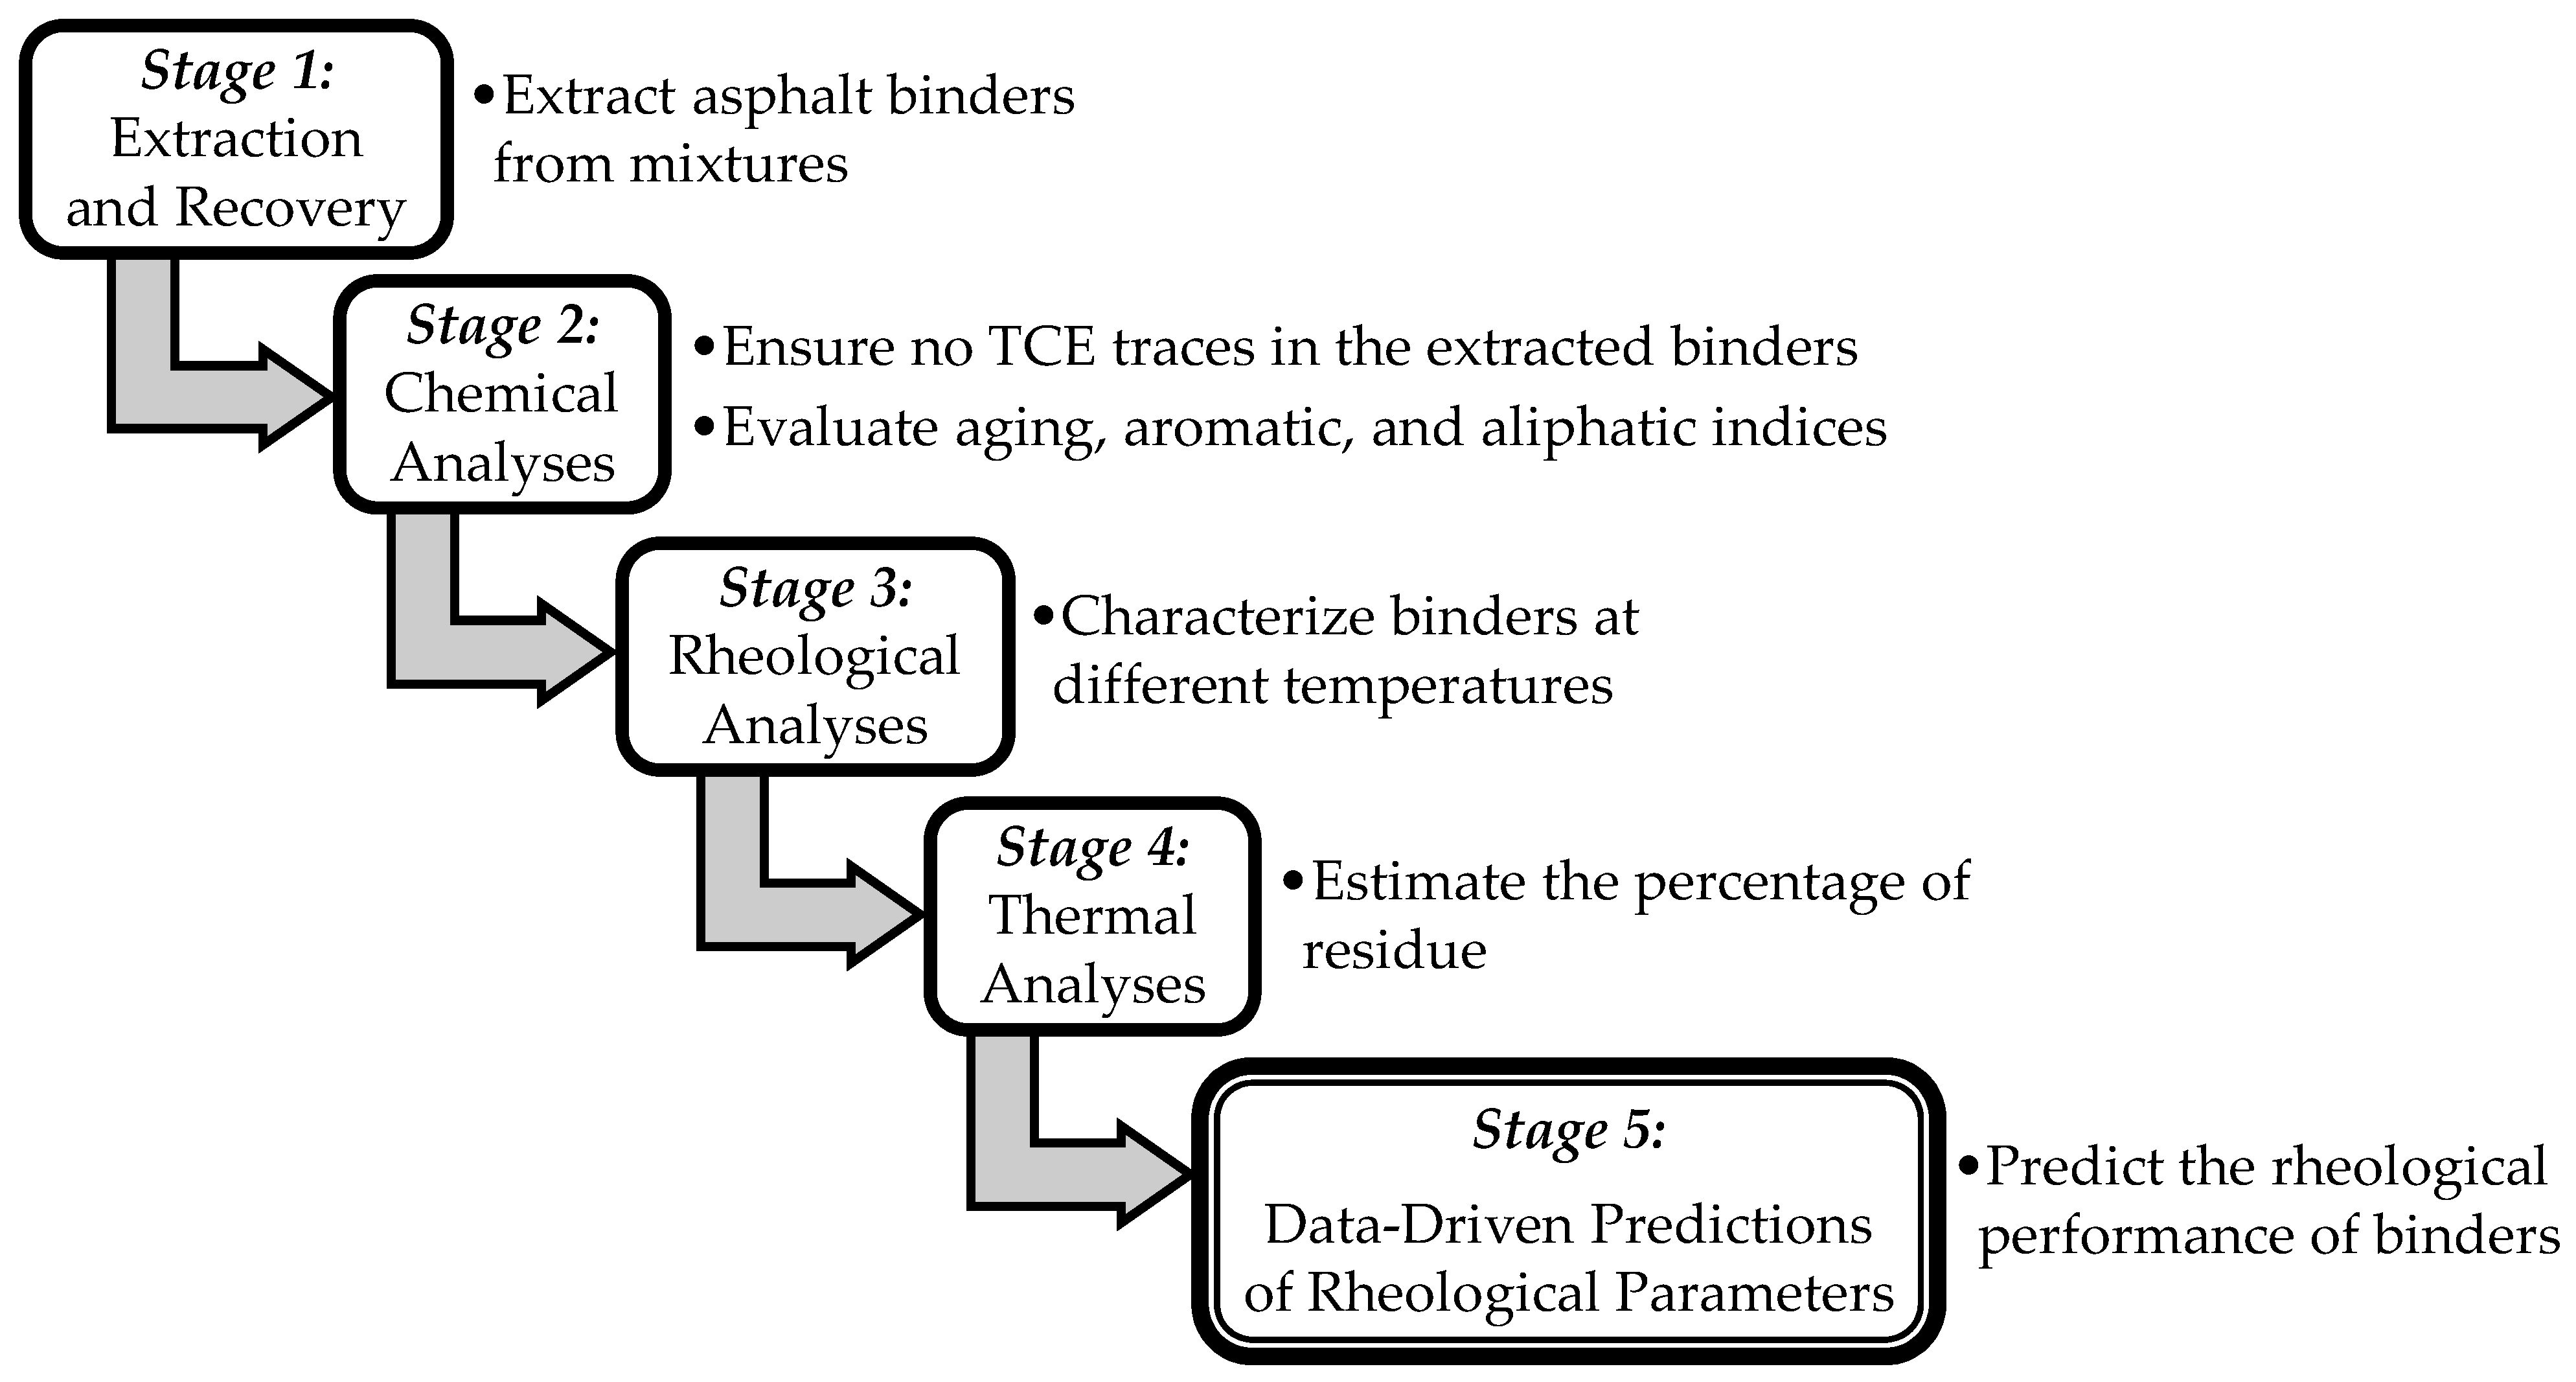
Figure 1. Experimental framework.
Applsci 15 06976 g001
Figure 2. Ensuring no TCE traces in the extracted binders: (a) 3400 to 3000 cm−1; (b) 1000 to 700 cm−1.
Applsci 15 06976 g002
Figure 3. Rutting parameters of extracted binders with (a) ICO + ISO, (b) ICC + ICH, and (c) R%.
Applsci 15 06976 g003
Figure 4. Fatigue and block cracking parameters of extracted binders with (a) ICO + ISO, (b) ICC + ICH, and (c) R%.
Applsci 15 06976 g004
Figure 5. Thermal cracking parameters of extracted binders with (a) ICO + ISO, (b) ICC + ICH, and (c) R%.
Applsci 15 06976 g005
Figure 6. Heatmap of rutting parameter.
Applsci 15 06976 g006
Figure 7. Measured versus predicted rutting parameters based on a linear model.
Applsci 15 06976 g007
Figure 8. Measured versus predicted rutting parameters based on an RF model.
Applsci 15 06976 g008
Figure 9. Feature importance in the rutting parameter RF model.
Applsci 15 06976 g009
Figure 10. Heatmap of fatigue cracking parameter.
Applsci 15 06976 g010
Figure 11. Measured versus predicted fatigue cracking parameters based on a linear model.
Applsci 15 06976 g011
Figure 12. Measured versus predicted fatigue cracking parameters based on an RF model.
Applsci 15 06976 g012
Figure 13. Feature importance in the fatigue cracking parameter RF model.
Applsci 15 06976 g013
Figure 14. Heatmap of block cracking parameter.
Applsci 15 06976 g014
Figure 15. Measured versus predicted block cracking parameters based on a linear model.
Applsci 15 06976 g015
Figure 16. Measured versus predicted block cracking parameters based on an RF model.
Applsci 15 06976 g016
Figure 17. Feature importance in the block cracking parameter RF model.
Applsci 15 06976 g017
Figure 18. Heatmap of the thermal cracking parameter.
Applsci 15 06976 g018
Figure 19. Measured versus predicted thermal cracking parameters based on a linear model.
Applsci 15 06976 g019
Figure 20. Measured versus predicted thermal cracking parameters based on an RF model.
Applsci 15 06976 g020
Figure 21. Feature importance in the thermal cracking parameter RF model.
Applsci 15 06976 g021
Table 1. Asphalt mixtures’ details.
Mixture CodeTypeOriginal Asphalt GradeABR by RAP-RAS (%)Total AC (%)Mix’s Age (Years)
F1, F2, and F3Field58–2833-05.30.04
F4, F5, and F631-05.1
F7, F8, and F90-335.2
F10, F11, and F1218-155.2
F13, F14, and F1535-05.1
F16, F17, F18, F19, and F2030-05.94.00
F21, F22, and F2364–2225-05.05.00
F24, F25, and F260-344.86.00
F27, F28, and F2920-105.68.00
F30, F31, and F3225-05.1
F33, F34, F35, F36, and F3716-154.79.00
F38, F39, and F400-06.213.00
F41, F42, and F430-05.614.00
F44, F45, and F4664–22H17-05.70.04
F47, F48, and F4935-04.8
F50 and F510-05.4
F52, F53, and F5430-05.36.00
F55, F56, and F5770–2212-05.79.00
F58, F59, and F609-05.610.00
P1, P2, and P3Plant58–280-335.20.00
P4, P5, and P635-05.1
P7, P8, and P931-05.1
P10, P11, and P1264–22H17-05.7
L1, L2, L3, L4, and L5Lab58–2831-05.10.00
L6, L7, and L835-0
L9 and L1046–3431-0
L11, L12, and L135.2
L14 and L155.5
L16, L17, L18, L19, L20, and L2135-05.1
L22 and L235.3
L24 and L255.5
Table 2. Statistical analyses of rheological prediction models.
Rheological ParameterModelGoodness of FitAccuracy of Prediction
R2RSe/SyMean of ResidualsSTD of ResidualsRMSE
RuttingLinear0.660.810.586.5826.9027.69
RF Nonlinear0.840.940.403.088.038.60
Fatigue CrackingLinear0.670.820.57381.891599.871644.82
RF Nonlinear0.750.860.50449.27936.701038.87
Block Cracking Linear0.840.920.40241.411542.361561.14
RF Nonlinear0.811.000.44−882.722014.342199.26
Thermal Cracking Linear0.890.940.340.041.581.58
RF Nonlinear0.870.950.36−0.531.131.25
Disclaimer/Publisher’s Note: The statements, opinions and data contained in all publications are solely those of the individual author(s) and contributor(s) and not of MDPI and/or the editor(s). MDPI and/or the editor(s) disclaim responsibility for any injury to people or property resulting from any ideas, methods, instructions or products referred to in the content.