Article

Surface Quality of CNC Face-Milled Maple (Acer pseudoplatanus) and Oak (Quercus robur) Using Two End-Mill Tool Types and Varying Processing Parameters

Faculty of Furniture Design and Wood Engineering, Transilvania University of Brasov, B-dul Eroilor, Nr. 29, 500036 Brasov, Romania
*
Author to whom correspondence should be addressed.
Appl. Sci. 2025, 15(13), 6975; https://doi.org/10.3390/app15136975
Submission received: 2 June 2025 / Revised: 16 June 2025 / Accepted: 17 June 2025 / Published: 20 June 2025

Abstract

Face milling with end-mill tools represents a solution for woodworking applications on small-scale or complex surfaces, but information regarding the surface quality per specific tool type, wood material, and processing parameters is still limited. Therefore, this study examined the surface quality of tangential oak and maple CNC face-milled with two end-mill tools—straight-edged and helical—for three values of stepover (5, 7, 9 mm) and two cutting depths (1 and 3 mm). The surface quality was analyzed with roughness parameters, roughness profiles, and stereomicroscopic images and was referenced to that of very smooth surfaces obtained by super finishing. The helical end mill caused significant fiber tearing in maple and disrupted vessel outlines, while prominent tool marks such as regular ridges across the grain were noticed in oak. The best surface roughness was obtained in the case of the straight-edged tool and minimum stepover and depth of cut, which came closest to the quality of the shaved surfaces. An increase in the cutting depth generally increased the core surface roughness and fuzziness, for both tools, and this trend increased with an increase in the stepover value. The species-dependent machining quality implies that the selection of tool geometry and process parameters must be tailored per species.

1. Introduction

Surface quality is a critical factor in the machining of hardwoods, directly influencing both the aesthetic characteristics and the functional performance of wooden components. In sectors such as furniture manufacturing and interior architecture, the demand for precise machining of wood and high surface quality has increased significantly. This growing need has led to the development and refinement of strategies that not only address the machining parameters but also need to consider the anatomical complexity and structural variability of hardwood species.
Among the machining methods for face surfacing, conventional rotary cutter blocks are widely used for continuous, large-area planing. However, their size and geometry limit their effectiveness when small surface areas with alternating depths and contours are the milling requirement. These tools often cause significant anatomical alterations beneath the surface, including lateral distortion, tissue rupture, and fiber crushing, particularly in hardwoods, where variability in vessel distribution and fiber orientation generates uneven cutting resistance [1]. As a result, roughness produced under such conditions affects more than just surface appearance; it also undermines downstream processes such as bonding and coating.
To address these limitations, more adaptable solutions have gained attention. Helical planning, for instance, is promoted for its ability to produce smoother surfaces and generate lower cutting forces but can also leave periodic ridges due to the geometry and motion of the tool path, especially at high feed speeds and for processing across the grain [2]. CNC-based face milling has become increasingly relevant in precision wood machining due to its capacity for controlled material removal and adaptability to complex surface geometries. Unlike traditional planning systems, face milling involves a perpendicular tool approach to the surface and is particularly well suited to CNC environments where tool paths can be finely programmed. Within this category, end mills with fronto–lateral cutting edges, tools that engage both axially and radially, have garnered interest for their versatility and geometric flexibility. Originally developed for metalworking and composite materials, such tools have been successfully adapted to the machining of solid wood components, where they enable high-precision processing of both planar and contoured surfaces [3,4].
Their geometry allows for an effective engagement with features such as recessed zones, narrow edges, and transitions in depth, making them particularly valuable in applications involving decorative or small-scale parts. Moreover, when properly selected and operated under optimized feed rates and cutting depths, fronto–lateral tools in face milling setups have been shown to deliver superior surface quality and reduced subsurface damage compared to conventional rotary cutter blocks [1,2]. Machining-induced subsurface deformation, such as cell compression and fiber rupture, can hinder adhesive penetration and reduce joint strength. These characteristics position face milling with fronto–lateral tools as a promising solution for fine woodworking applications that demand both dimensional accuracy and clean, bondable surfaces. Nonetheless, achieving optimal results requires close attention to the interplay between tool geometry, feed rate, cutting depth, and the anatomical structure of the wood.
In a study on face milling of paper birch, Ref. [2] employed a RotoPlane 16T face planer fitted with 34 insert knives to investigate the influence of the machining parameters on surface integrity. Three different feed speeds and cutting depths were tested, revealing that feed speed had a significant impact on both surface roughness and wettability, while cutting depth had a comparatively minor effect. These findings underscore the complexity of interactions between machining parameters and wood anatomical characteristics. Supporting this, Ref. [5] showed that machining method and fiber orientation significantly influence surface roughness in beech and aspen, while [6] reported that feed rate and cutting angle affect the surface quality of sessile oak, emphasizing species-specific sensitivity to tool geometry. Additionally, Ref. [7] noted that anatomical traits such as vessel diameter and fiber interlocking can outweigh bulk density in determining surface roughness, especially in tropical species. Furthermore, Ref. [8] identified feed rate and spindle speed as key factors in reducing roughness when CNC face milling palm wood, reinforcing the importance of process control.
To this body of evidence, Ref. [9] added information by demonstrating that lower feed speeds (10 m/min compared to 30 m/min), using a Weinig Unimat 500 planer (Tamex, Sarajevo, Bosnia and Herzegovina), significantly decreased surface roughness in oak, yielding results comparable to those achieved by combined planing and sanding using a Viet Opera V machine. Most recently, Ref. [3] explored the CNC face milling of Anatolian chestnut using high-speed steel straight-end mills (ø = 8 mm, 3 flutes) and found that the lowest Rz values were achieved at the spindle speed of 16,000 rpm and with the depth of 10 mm, confirming the importance of tool configuration and cutting strategy in optimizing surface quality.
Ring-porous species like oak exhibit pronounced variation in the cutting resistance between earlywood and latewood, even under identical machining settings. It was observed [7] that radial sections generally show higher roughness than tangential ones due to fiber interlock and vessel arrangement, especially when measured perpendicular to the grain. In a broader comparative study involving tropical hardwoods such as Garapa, Tatajuba, Wenge, and Merbau, the above author further found that the surface roughness values for measurements perpendicular to the grain were nearly double those measured along the grain, underlining the critical role of the anatomical structure (cell cavities) in shaping the surface texture.
While investigating several machining approaches, including face milling and super surfacing (shaving), Ref. [10] found that microstructural integrity played a crucial role in determining the tensile shear strength of glued joints. They observed that super surfacing, when using sharp, rounded tools, preserved subsurface quality and improved the bonding behavior—findings that directly support the use of super surfacing as a benchmark in our studies.
Similarly, Ref. [11] reported superior bonding on face-milled beech surfaces compared to conventionally planed ones, provided that the milling process was optimized to avoid excessive fiber damage. These observations highlight that achieving a smooth surface is not sufficient on its own; the underlying structure must also remain intact to ensure functional performance.
From a process control perspective, surface quality in face milling is influenced by factors such as tool entry direction, with climb milling generally resulting in less cell compression and more uniform textures [10]. Feed rate and tool sharpness also play a key role in minimizing subsurface damage, even when surface roughness appears acceptable [12]. Moreover, due to the inherent heterogeneity of wood, including variations in fiber orientation and vessel structure, machining strategies must often be tailored to each species. As [6] observed, parameters effective for one anatomical configuration may not be directly transferable to another without careful adjustment. In summary, surface quality in hardwood machining results from a complex interaction between process parameters, tool design, and wood anatomy. While conventional cutter blocks are suitable for flat surfaces, they lack the precision and adaptability needed for intricate components. CNC-based fronto–lateral end mills offer greater flexibility and accuracy, yet studies on their performance in the face milling of wood remain limited. Optimizing surface quality thus requires a tailored selection of parameters adapted to each wood’s anatomical structure. The present study aims to expand the current understanding of surface quality in hardwood machining by evaluating and comparing the effects of CNC face milling on oak and maple wood, using two end mill tools with different geometries, designed for fronto-lateral processing: one with straight cutting edges, and the other with helical blades. The selection of two contrasting wood species, one homogeneous with diffuse pores—maple—and the other more heterogeneous and ring-porous with large pores, allowed us to explore the effect of wood anatomy upon surface integrity and perform a reliable characterization of the tool marks and processing quality. Machining was performed under varied stepover and cutting depth conditions, and the resulting surfaces were assessed through a combination of profile roughness parameters and stereomicroscopic imaging. To establish a benchmark for high-quality surface finish, the CNC-milled surfaces were compared with those obtained through super surfacing (shaving), following a methodological approach similar to that employed by [10].
While the roughness parameter Ra was included primarily to facilitate comparisons with the existing literature, greater emphasis was placed on Abbott–Firestone parameters, i.e., Rk, Rpk, and Rvk, which offer a more reliable and structurally sensitive assessment of machined wood surfaces. These parameters allow for a clearer distinction between machining-induced irregularities and inherent anatomical texture, particularly in hardwoods. Ultimately, this study aimed to identify the best combinations of tool geometry and machining parameters that can achieve the smoothest surfaces in this CNC face-milling setup.

2. Materials and Methods

2.1. Wood Samples

Oak (Quercus robur) and maple (Acer pseudoplatanus) samples with a moisture content of 9.6% and 10.3% and a density of 717 kg/m3 and 580 kg/m3, respectively, were prepared with tangential cut faces, processed by straightening and planing, and then crosscut to achieve the final dimensions of 80 × 80 × 20 mm. Among them, 24 wood samples were directed to CNC processing, 12 of oak and 12 of maple, to test their surface quality after processing with two end-milling cutters, three stepover values, and two cutting depths (2 × 3 × 2 = 12). Supplementarily, one oak and one maple specimen, preprepared in the same way, were processed by shaving with a super surfacer and represent the reference surfaces, as will be further described.

2.2. Processing by CNC

The 24 prepared samples were machined using a CNC milling process along the grain direction, on the face surfaces, which were then analyzed to evaluate their quality. Although the used milling tools are capable of processing both the face and the edge surfaces, the study intentionally focused only on the quality of the face surface, as the edges involve radial orientations and additional factors that would necessitate a separate and more complex investigation beyond the scope of this work.
All specimens were uniformly secured to the machine table to minimize movement and vibration during machining, as shown in Figure 1a. The milling process employed two types of Leitz end-mill cutters, each with a 10 mm diameter: one featuring two helical blades, with I.D. 042278 and active cutting length of 25 mm (Figure 1b), and the other with straight blades, with I.D. 038058 and active cutting length of 23 mm (Figure 1c). Both cutters were made of tungsten carbide; however, the helical-bladed tool (T1) was additionally coated with a Marathon layer to enhance performance and durability. Both tools were designed with a positive twist orientation, from the face side of the workpiece toward the bottom, facilitating effective chip evacuation and improved dust extraction. To ensure consistency in the cutting performance, both tools were new, and their blades were microscopically inspected to confirm the absence of any defects.
Additionally, all milling operations were performed parallel to the wood grain, with each specimen carefully oriented so that cutting occurred in the direction of tree growth to minimize fiber damage and surface variability.
The samples were cut using a three-axis CNC router, ISEL GFV model, manufactured in Germany, with machining parameter settings divided into constant and variable, as summarized in Table 1. The depths of cut were chosen to represent typical roughing and finishing operations: 3 mm for roughing, and 1 mm for finishing. These values were validated by previous studies focused on wood machining, including [13,14,15], which identified similar depths as effective in balancing material removal rate with surface quality. Separate sets of samples were prepared for each depth of cut to ensure a reliable and consistent evaluation. The feed speed was maintained at a constant 4 m/min throughout all experiments. This value was selected based on prior research findings [16,17,18,19,20], which demonstrated that this feed rate contributes to reduced surface roughness in hardwood machining while avoiding excessive tool wear or burning effects common at lower speeds.
The stepover, defined as the lateral distance between adjacent toolpaths, was set relative to the tool diameter (10 mm) and varied to assess its influence on surface quality. Specifically, three stepover values were used, i.e., 5 mm, 7 mm, and 9 mm, corresponding to 50%, 70%, and 90% of the tool diameter, respectively. This range was achieved by adjusting the overlap between toolpaths from a minimum overlap of 1 mm (resulting in a 9 mm stepover) to a maximum overlap of 5 mm (resulting in a 5 mm stepover), with an intermediate setting of 3 mm (7 mm stepover) also included. This variation allowed for a comparative analysis of the effect of toolpath density on the resulting surface finish.

2.3. Processing by Super Surfacing (Shaving Operation)

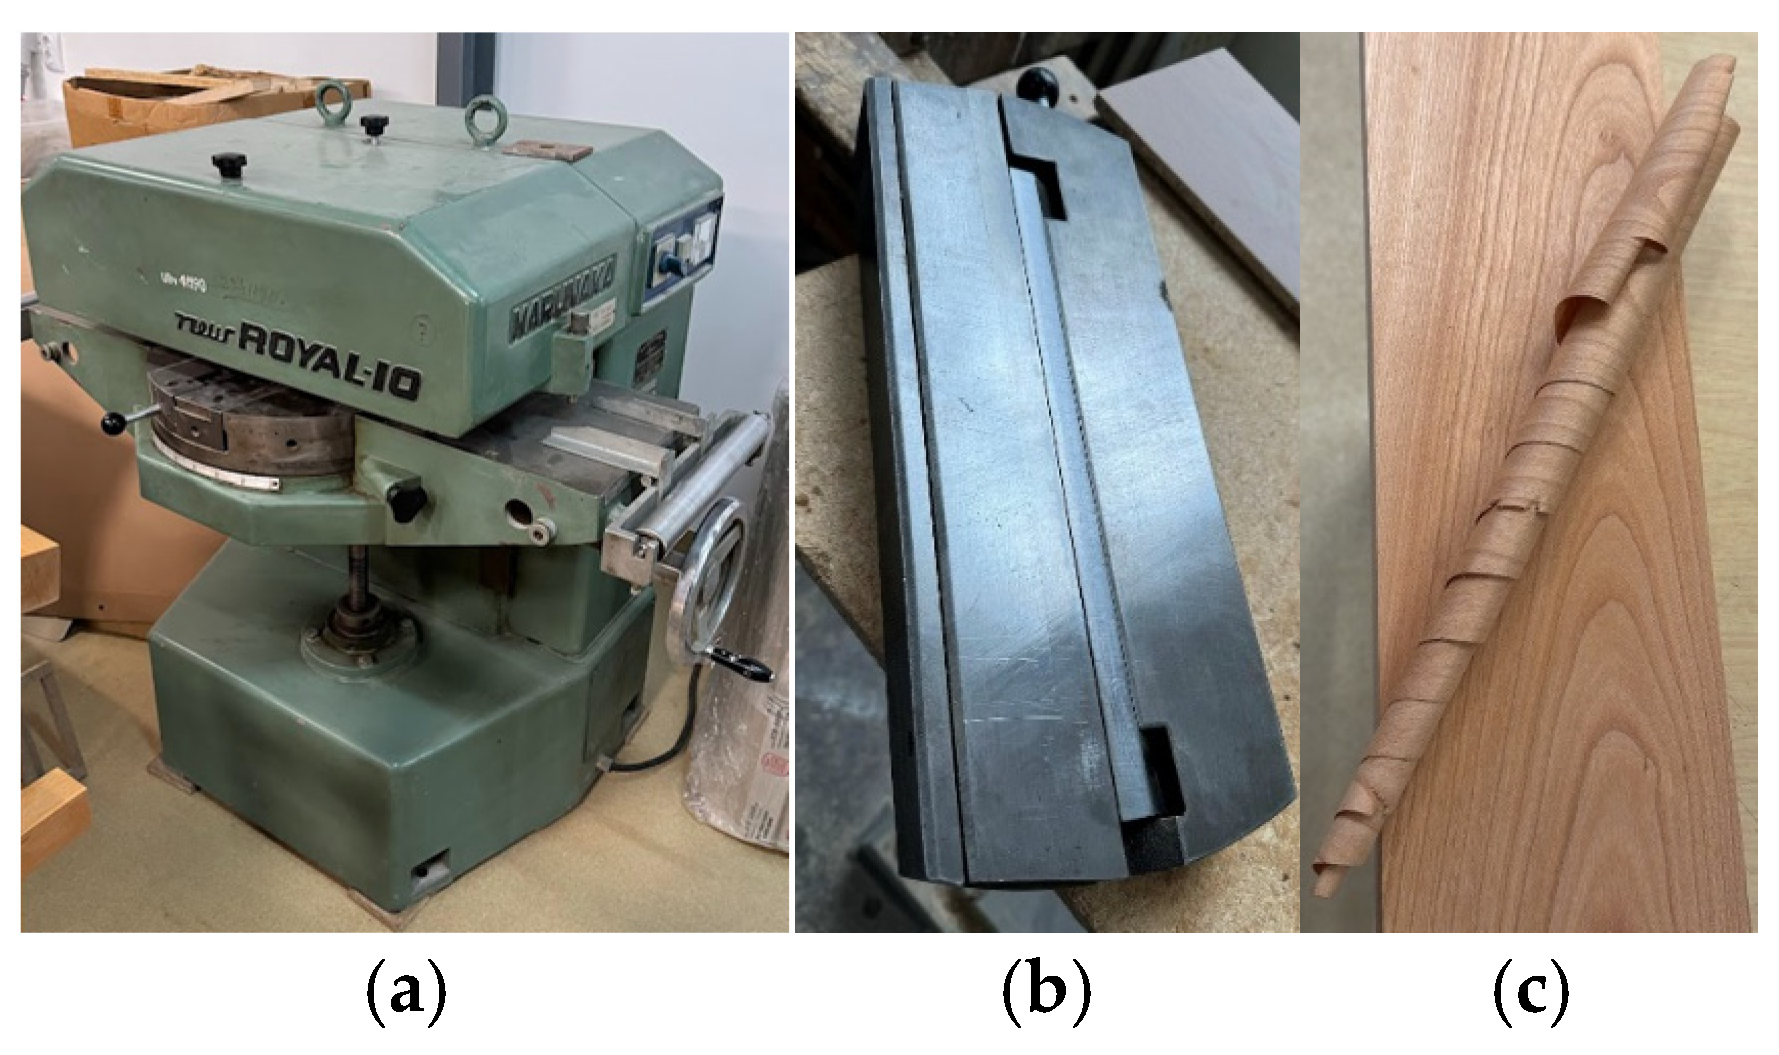
A Marunaka New Royal 10 super surfacer was used in this study (Figure 2a), which is a high-precision Japanese woodworking machine designed for ultra-fine surface shaving. The machine features a 390 mm fixed blade, mounted in a transverse slot on the working table and inclined at 20° relative to the feed direction. This configuration enables a controlled shearing cut as timber is fed longitudinally across the blade.
A rubber conveyor belt feed system, consisting of a continuous flat belt reinforced with longitudinal strips, guided the workpiece steadily across the blade. This mechanism ensures uniform pressure and smooth, controlled movement, allowing the machine to remove a consistent 0.1 mm wood surface layer. The result is the production of fine, continuous shavings while maintaining the anatomical integrity of the wood. The extended cutting edge of the blade exceeds the slot width, detaching full-width, uninterrupted shaving with each pass.
As shown in Figure 2b, the robust blade assembly contributes to minimal vibration and high dimensional stability throughout the cutting process. This stability ensures the production of thin, continuous, and uniform shavings (Figure 2c).

2.4. Surface Quality Measurements

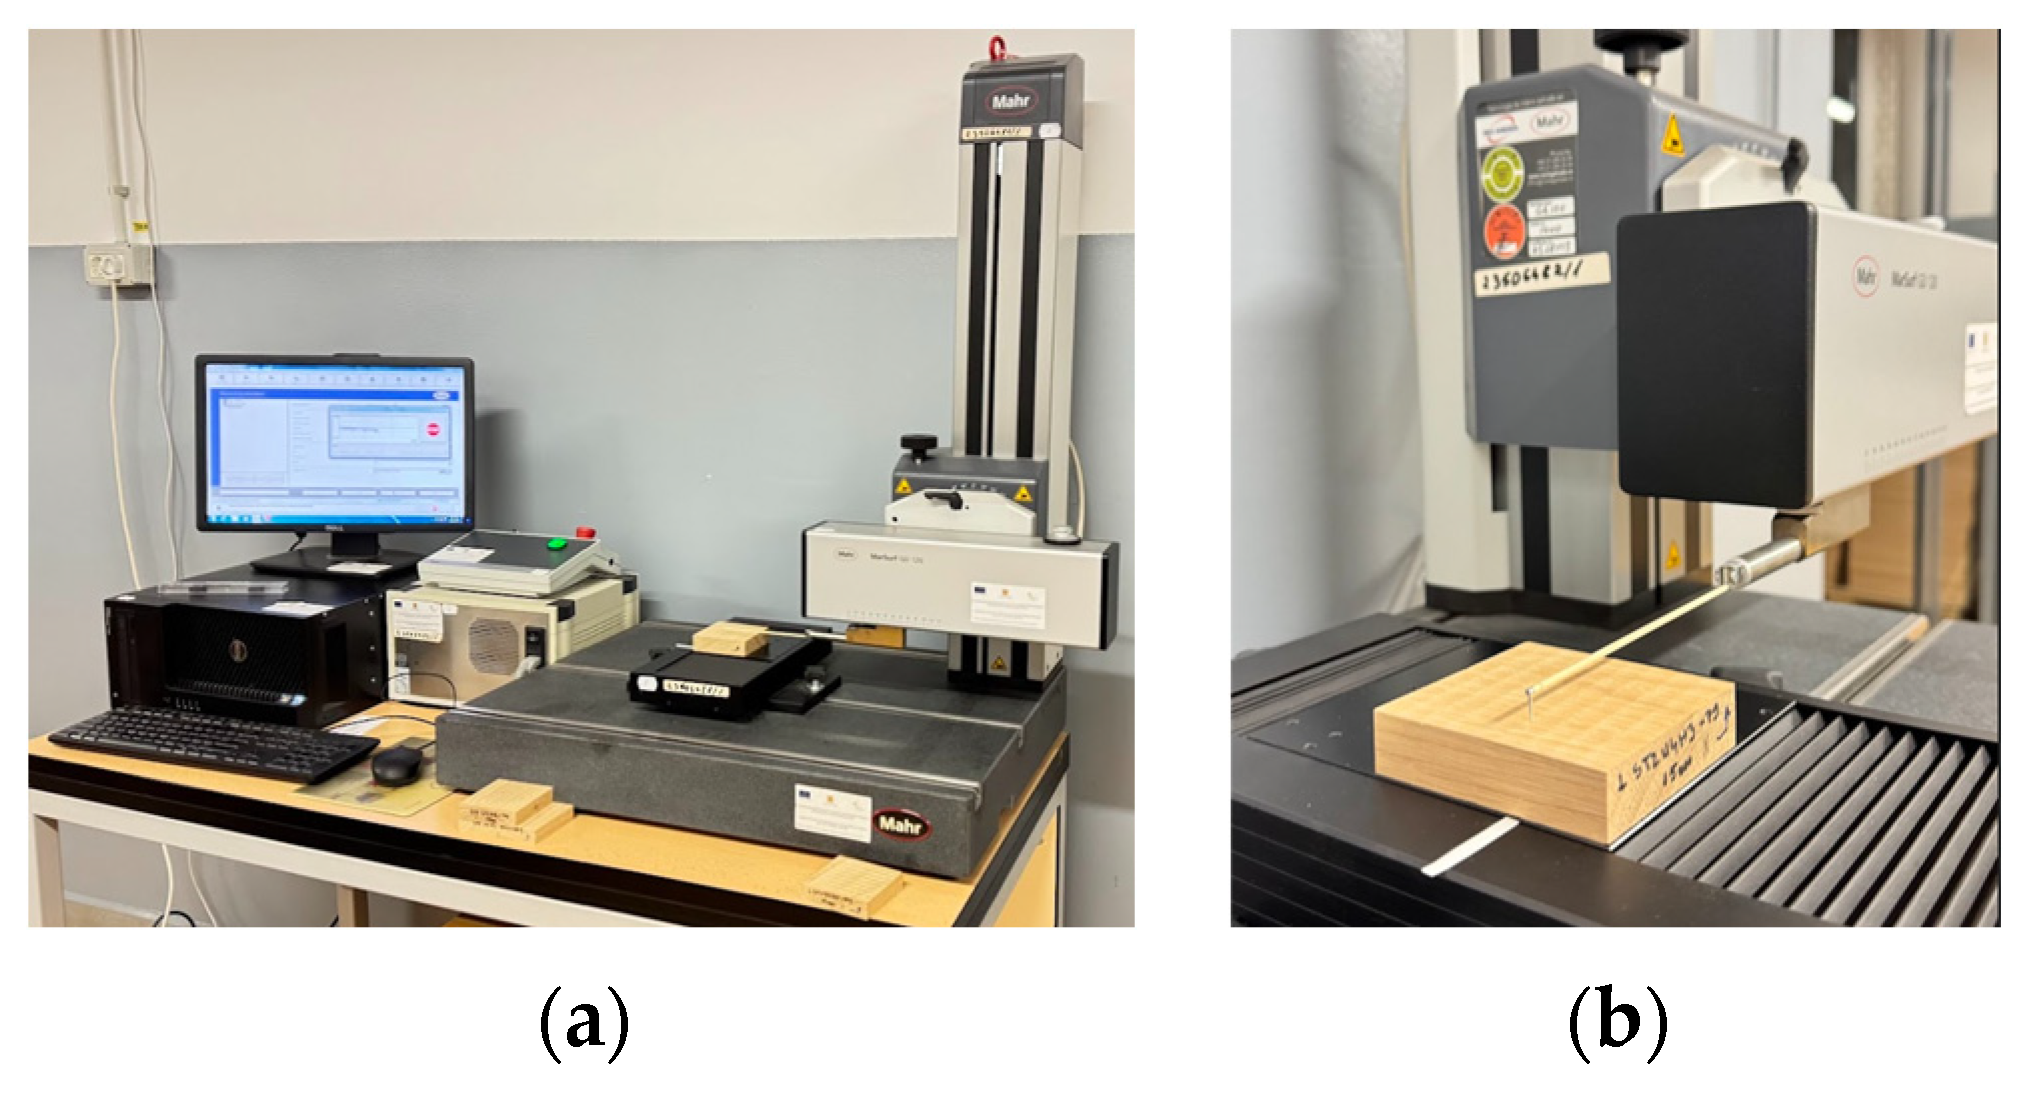
Surface characterization was carried out using the MarSurf XT20 system from MAHR Göttingen GmbH (Göttingen, Germany), equipped with an MFW 250 scanning head (Figure 3a). The instrument features a ±750 µm range tracing arm and a stylus tip with a 2 µm radius and a 90° tip angle. The measurements were conducted at a scanning speed of 0.5 mm/s, with a contact force of 0.7 mN and a lateral resolution of 5 µm. For each sample and CNC cutting parameter combination, four surface profiles of 50 mm were recorded (Figure 3b), all measured perpendicular to the grain direction. For the shaved surfaces, the procedure was the same, but the number of measured profiles was increased to six per sample.
The measured surface profiles were processed using MARWIN XR20 software (version 9.00-23 from 2013) supplied by the instrument’s manufacturer. The initial step involved the removal of form error through polynomial curve fitting, which eliminated large-scale geometric deviations. This correction enabled the extraction of the primary profile by subtracting the fitted curve from the raw data, following [21]. The primary profile retained both waviness and roughness components, which were distinguished based on wavelength, with longer wavelengths corresponding to waviness, and shorter wavelengths to surface roughness.
To separate the roughness profile from longer wavelength irregularities, a robust Gaussian regression filter was applied following [22], using a 2.5 mm cut-off length, as recommended for wood surface analysis [23,24]. From the filtered roughness profiles, roughness parameters were calculated [21], such as the arithmetical mean deviation (Ra) and the maximum profile valley depth (Rv). Given the hierarchical and anisotropic nature of wood, Abbott–Firestone curve parameters were also included to characterize the functional aspects of the surface. These comprised Rk (core roughness depth), Rpk (reduced peak height), and Rvk (reduced valley depth) [21]. These parameters are particularly relevant in wood surface evaluation, as supported by prior studies [24,25,26], with further methodological details provided in [27]. The use of these three descriptors is essential to capture the complex morphology of wood surfaces and to provide a comprehensive understanding of their topographical characteristics. The significance of the results for all processing parameters combinations was tested with single-factor and two-factor ANOVA, without replication for p < 0.05. Individual primary and roughness profiles were further obtained in MathCAD Professional 2000 (MathSoft Inc., Cambridge, MA, USA) by processing the original measured ASCII data to allow for comparisons between tools and cutting parameters.

2.5. Stereomicroscopy Analysis

The processed surfaces were examined using a NIKON SMZ 18-LOT2 stereomicroscope (Nikon Corporation, Tokyo, Japan). Micrographs were captured from all specimens machined by CNC, as well as from the shaved ones, and these visual observations were analyzed alongside the surface quality measurement data.

3. Results

3.1. Quality Evaluation of the Shaved Surfaces

Processing wood surfaces with a super surfacer provides an exceptionally smooth finish in which the influence of machining roughness is minimal or negligible. As a result, the surface texture primarily reflects the natural anatomical structure of wood and its cellular diversity. A shaved surface, as an almost ideal smooth surface, can be used as a quality reference for any type of processing, that is, CNC milling in this research. The shaved surfaces of maple and oak were very smooth to touch and shiny. As shown in Table 2, the roughness parameter values differed between maple and oak, even though both species were processed under identical conditions. The reason is that those roughness parameters are strongly influenced by the particular species’ anatomical cavities. However, the least affected parameter was Rk, whose mean value was similar for both species, despite their anatomical differences. This result indicates once more that Rk is the parameter that best approximates the surface roughness caused by machining, namely, the shaving operation in this case.
Figure 4 illustrates an example of the corresponding roughness profiles for both species. The red curve represents the maple profile, and the blue curve corresponds to oak. The irregularities observed below the black horizontal axis (the zero line) represent the lumens of wood cells, particularly the vessel voids, emphasizing that the surface topography was anatomically driven rather than mechanically induced. Although y-axis values are displayed, each roughness profile was vertically offset and referenced to its own zero line. This approach was adopted to facilitate a more effective comparison between the two species.
Although Ra is widely used to characterize a surface texture and is an average value of all surface irregularities [2,16,28,29,30,31,32], especially in the case of a very smooth finish combined with deep anatomical voids, it proves to be sensitive to anatomical features rather than to machining effects. Significant statistical differences in Ra were observed between maple and oak, despite the controlled and uniform shaving process that eliminated variability due to the cutting conditions. These differences are rooted in the distinct microscopic structures of the two species. Maple exhibits small, diffuse pores uniformly distributed across the growth ring, with diameters of approximately 25–30–50–70 (110) µm and a vessel proportion of 4–8.4% [33]. Combined with a sparse parenchyma, this leads to a smooth and uniform surface, resulting in a low Ra value (3.83 µm). In contrast, oak is characterized by large, ring-porous vessels in the earlywood, with diameters reaching up to 350–500 µm and a vessel area proportion that can exceed 40% in narrow growth rings, along with prominent, dense rays [33]. These features create a pronounced surface texture, reflected in a considerably higher Ra (9.96 µm). Therefore, Ra cannot be considered a reliable parameter for assessing surface quality in smoothly processed oak wood, as it predominantly captures anatomical variations rather than the actual effects of machining [1].
For both species, the low Rpk values indicate a surface with minimal protrusions and no prominent peaks, an expected result of the shaving process, which effectively levels the surface, thereby enhancing smoothness and visual uniformity. Rk, characterizing the roughness caused by the shaving tool, was similar for both species, approximately 6 µm. When examining the combined parameter Rk + Rpk, which represents the functional portion of the surface topography, the values were relatively similar: 7.43 µm for maple, and 8.83 µm for oak. This combined metric is especially relevant for applications involving contact or finishing treatments, where the interaction with the surface depends on both the core roughness (Rk) and any protruding surface peaks (Rpk). Despite the anatomical differences between the two species, the similarity in the Rk + Rpk values suggests that the shaving process produced comparable functional surfaces.
In line with this, Ref. [34] also highlighted the combined role of the machining parameters and the anatomical texture in determining surface morphology, noting that species with a diffuse-porous structure and a fine texture (e.g., beech) tend to exhibit smoother surfaces than ring-porous species such as oak, which have large vessels and a less uniform texture.
The roughness parameters, the roughness measured profiles, and the microscopic images of the shaved surfaces are further used as references for the quality analysis of the CNC milled maple and oak in the following sections.

3.2. Quality Evaluation of the CNC Milled Surfaces

3.2.1. Analysis of the Primary Profiles

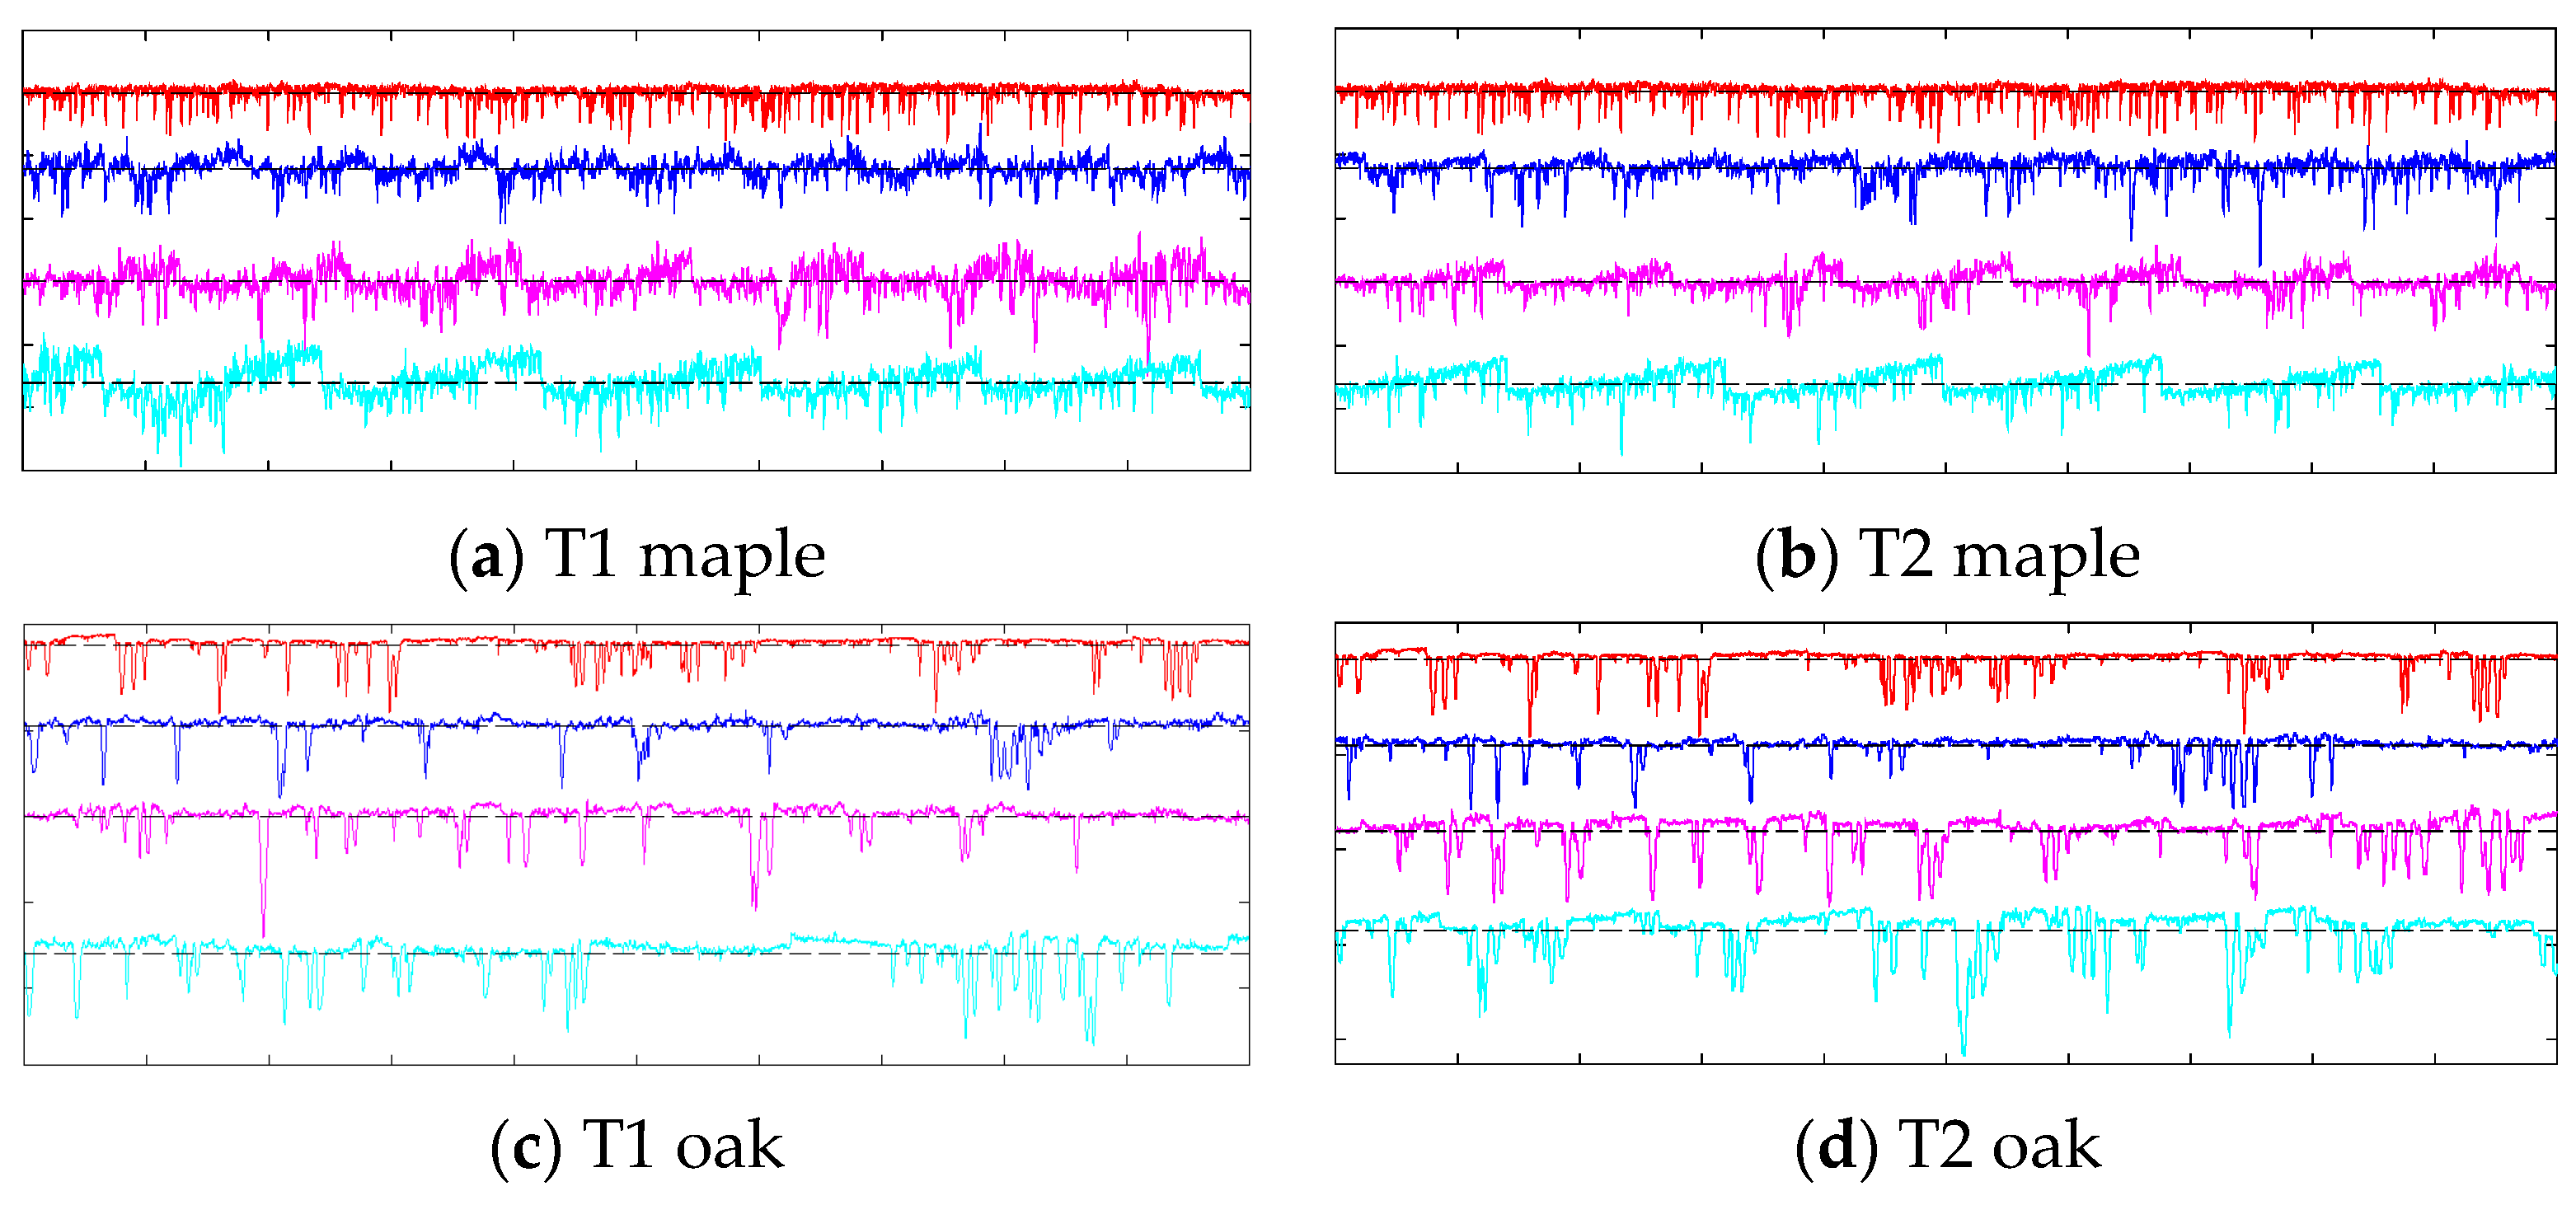
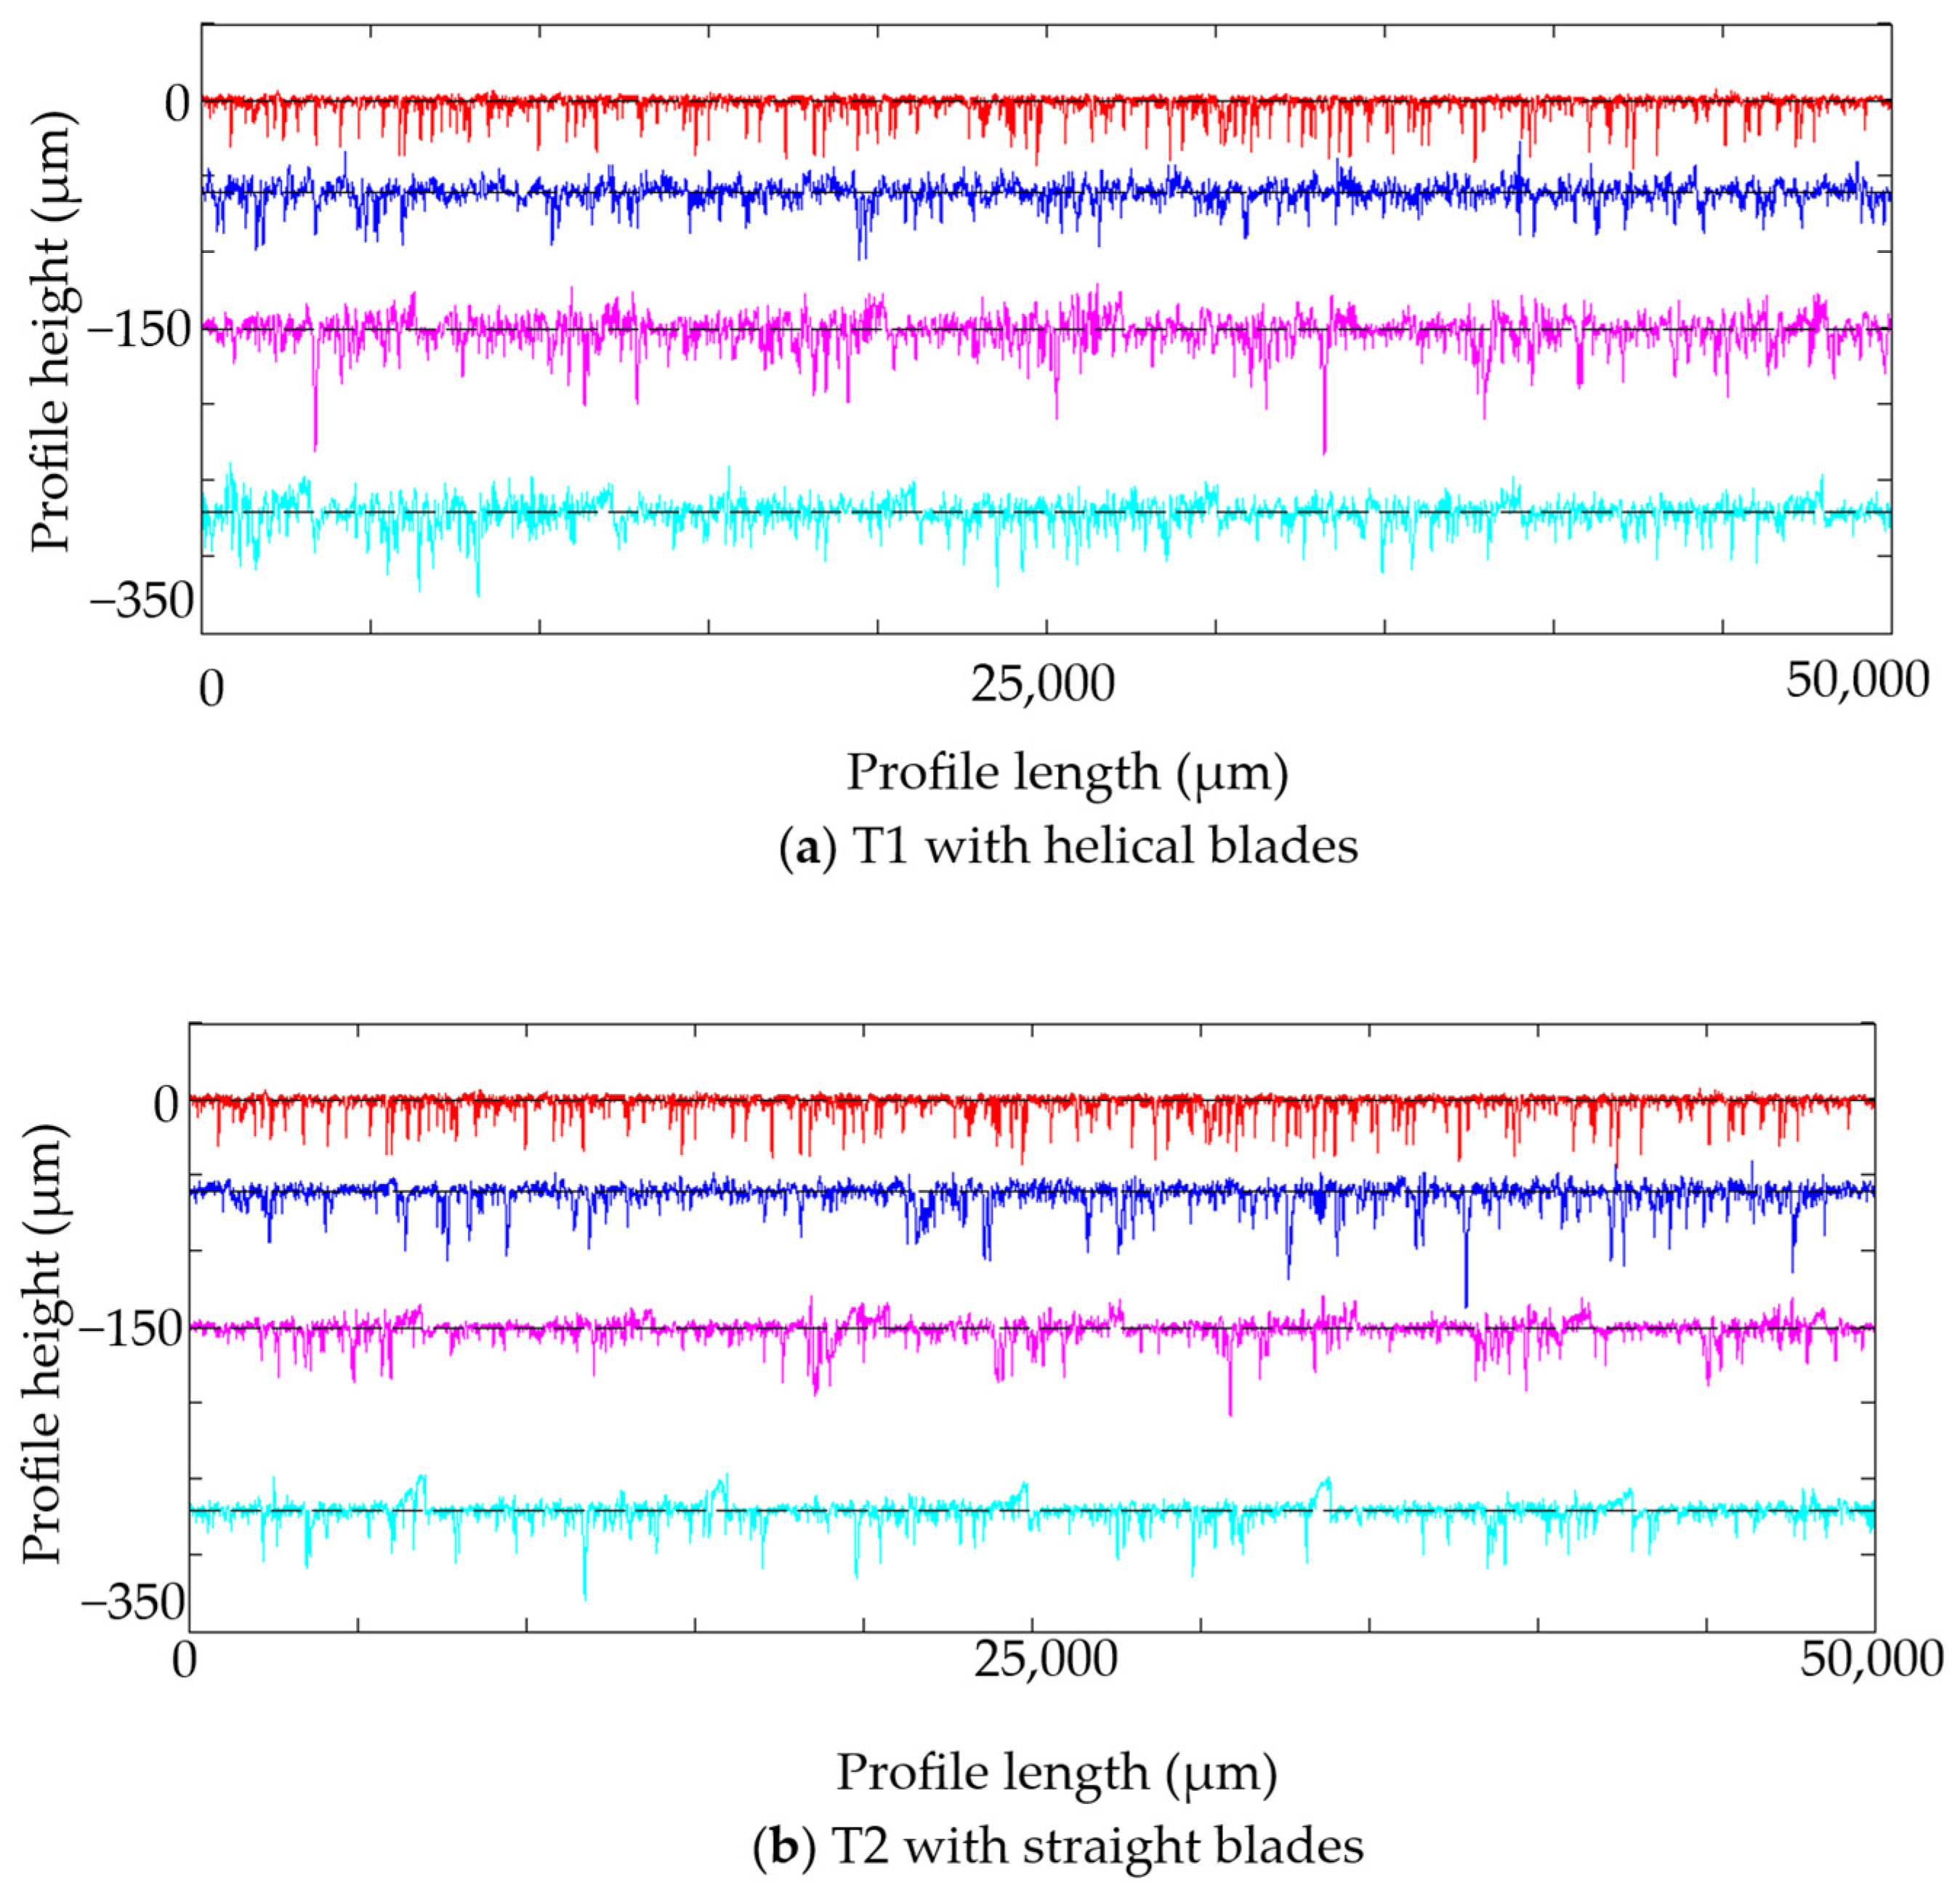
The primary profiles include both roughness and waviness components. The profiles reveal the presence of kinematic waviness, a typical feature of CNC milling, primarily generated by the stepover parameter. To investigate the influence of stepover and tool geometry on surface quality, primary profile graphs were generated for all combinations of these parameters (T1 with helical cutting edges, and T2 with straight cutting edges) and cutting depths (1 mm and 3 mm). Although similar observations were made for the 3 mm cutting depth, Figure 5 includes only the comparisons for the 1 mm depth.
Each graph includes the profile of the shaved surface, which served as the reference for high-quality finishing. A black center line is provided in all graphs to help interpret the data, acting as a baseline for evaluating the depth and distribution of surface irregularities. The primary profiles are color-coded: red represents the shaved surface, navy blue corresponds to milling with a 5 mm stepover, magenta to milling with a 7 mm stepover, and light blue to milling with a 9 mm stepover.
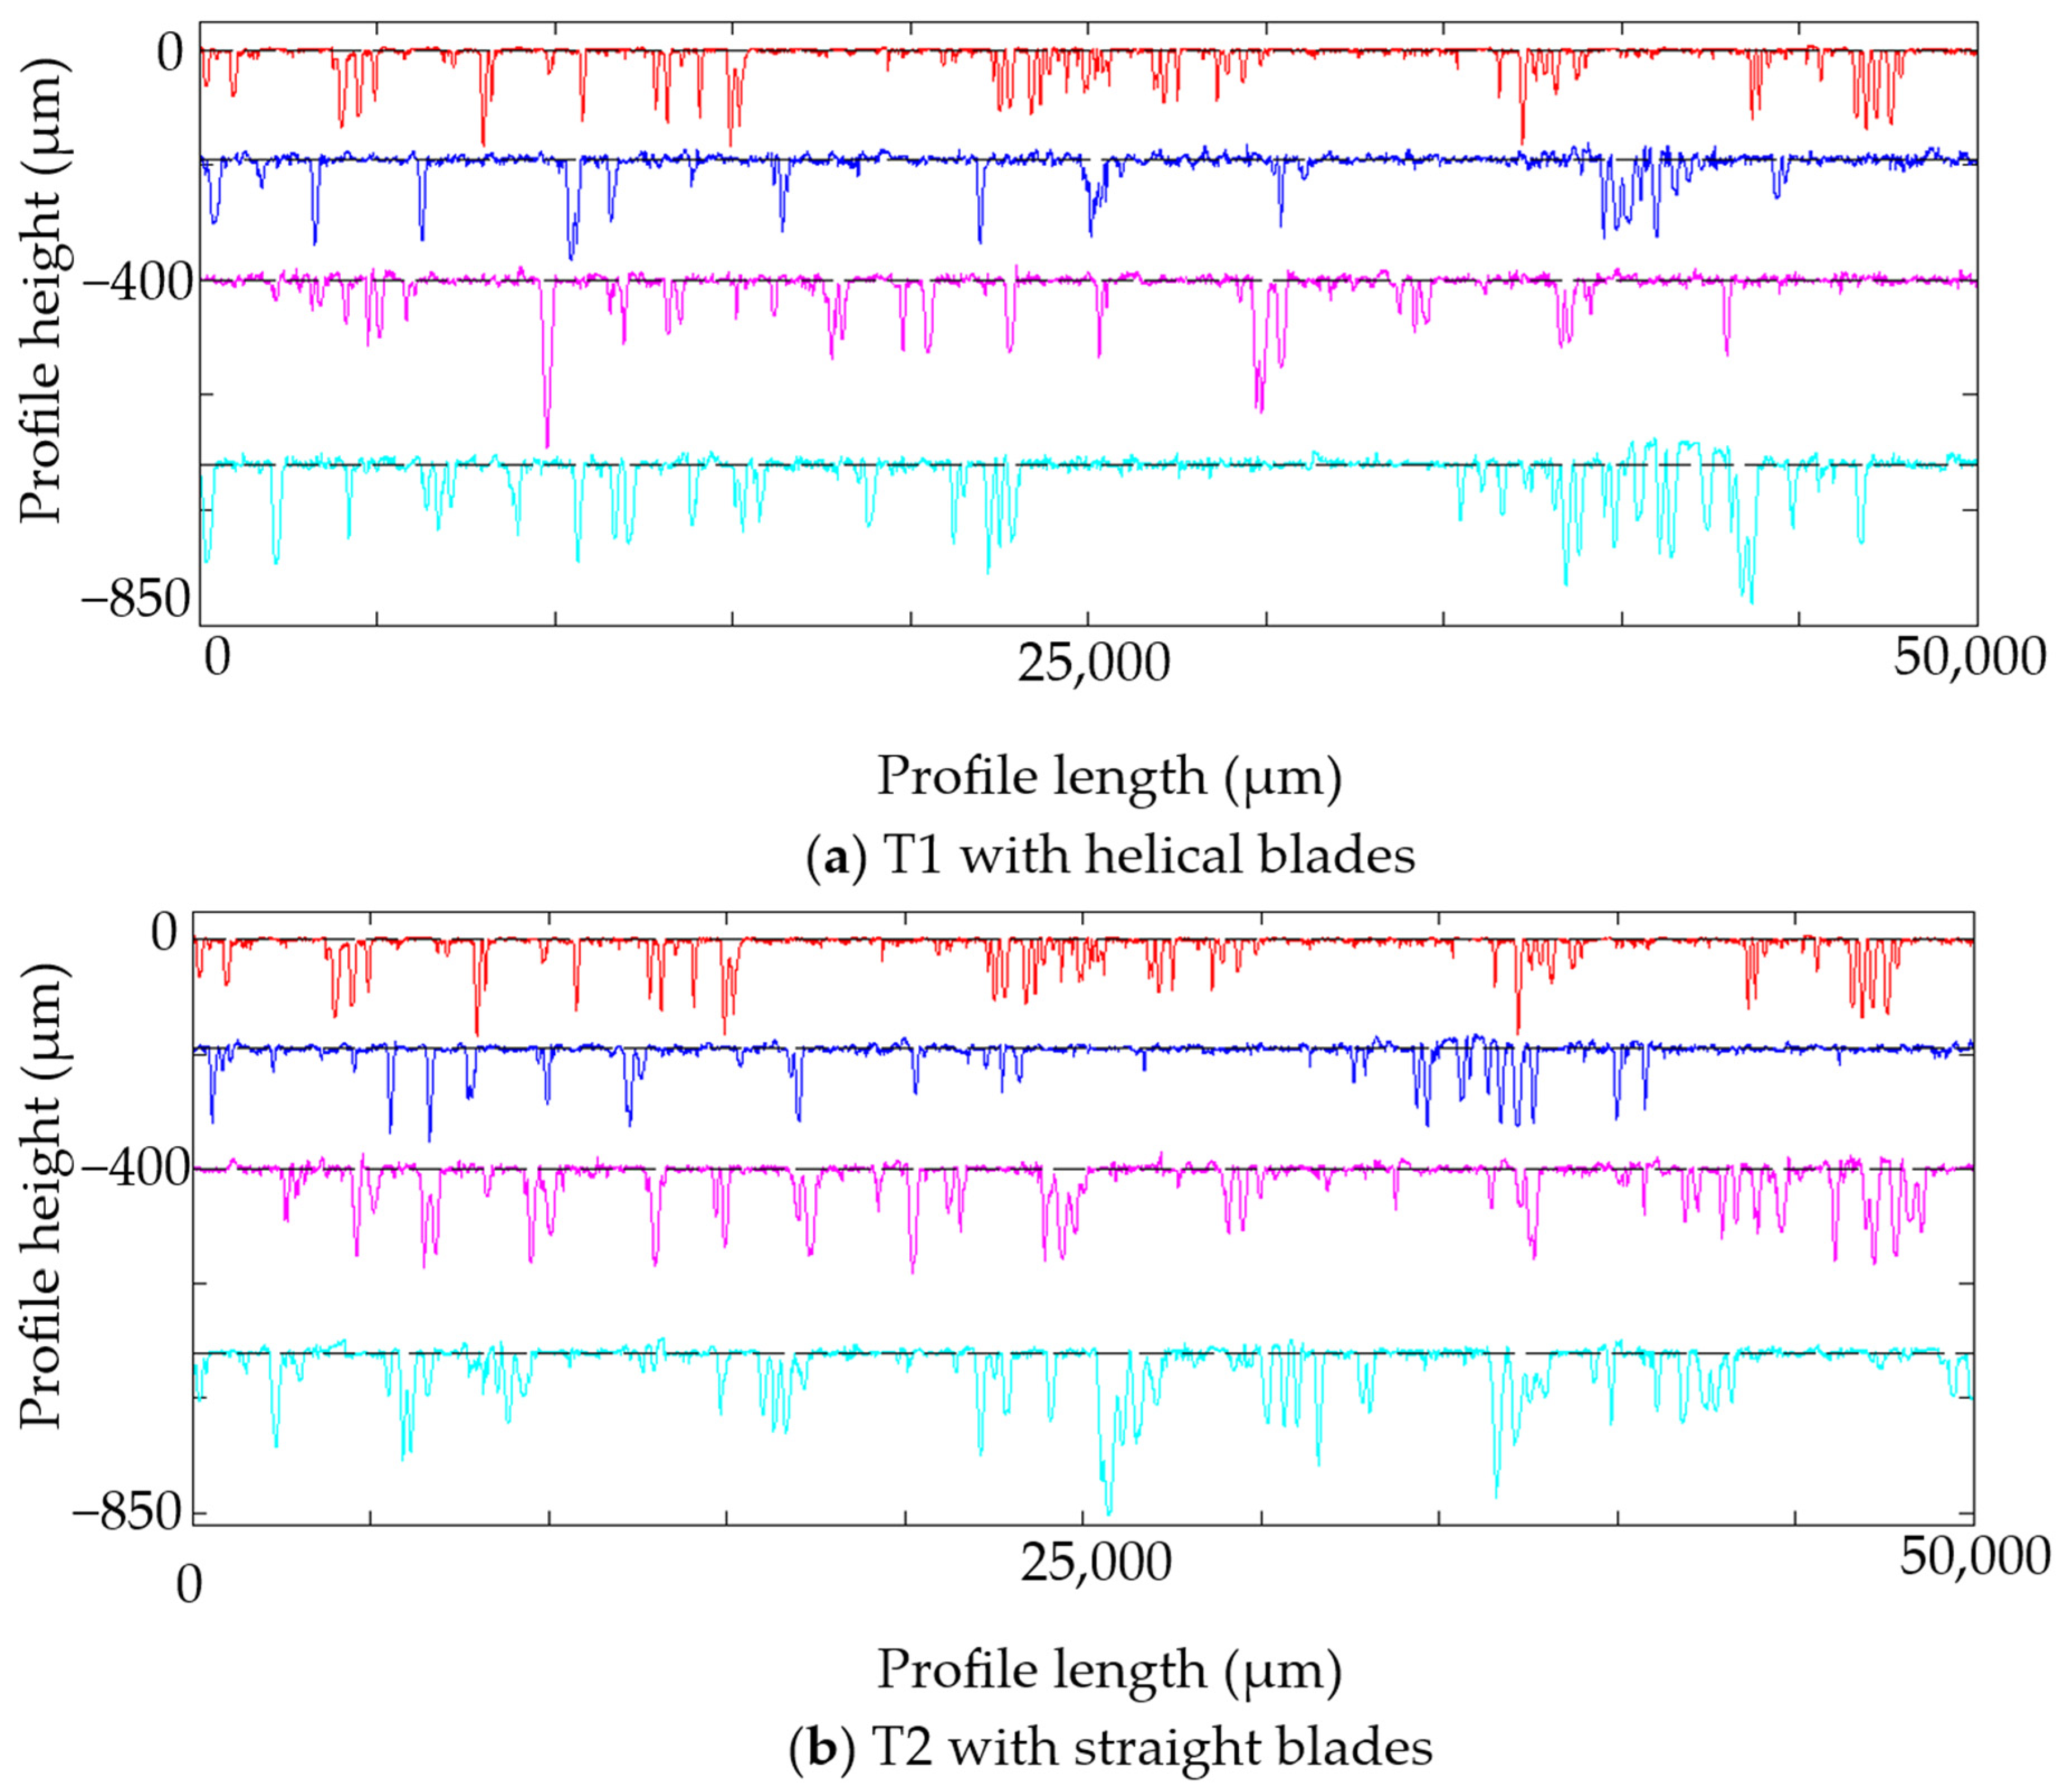
For maple and oak, both milling tools enhanced the surface waviness, as well as the fuzziness, as the stepover value increased (Figure 5). The profiles corresponding to the 5 mm stepover were relatively close to the reference profiles (red), especially for oak, but the deviations grew more pronounced with the 7 mm and, especially, the 9 mm stepover.

3.2.2. Surface Roughness and Stereomicroscopy Analysis of CNC-Processed Maple

This section presents an in-depth evaluation of the surface quality of CNC-processed maple, combining quantitative roughness measurements with qualitative observations obtained through the roughness profiles and stereomicroscopy. The analysis focused on the surface morphology resulting from different tool geometries and stepover values, under controlled machining parameters.
Table 3 presents the mean values and standard deviations of the surface morphology parameters for maple, corresponding to machining with tools featuring straight (T2) and helical cutting edges (T1), at depths of 1 mm and 3 mm, and stepover values of 5, 7, and 9 mm. The results obtained from the super surfacer are also included, representing the values for a high-quality reference surface (R) against which the machined samples were comparatively assessed.
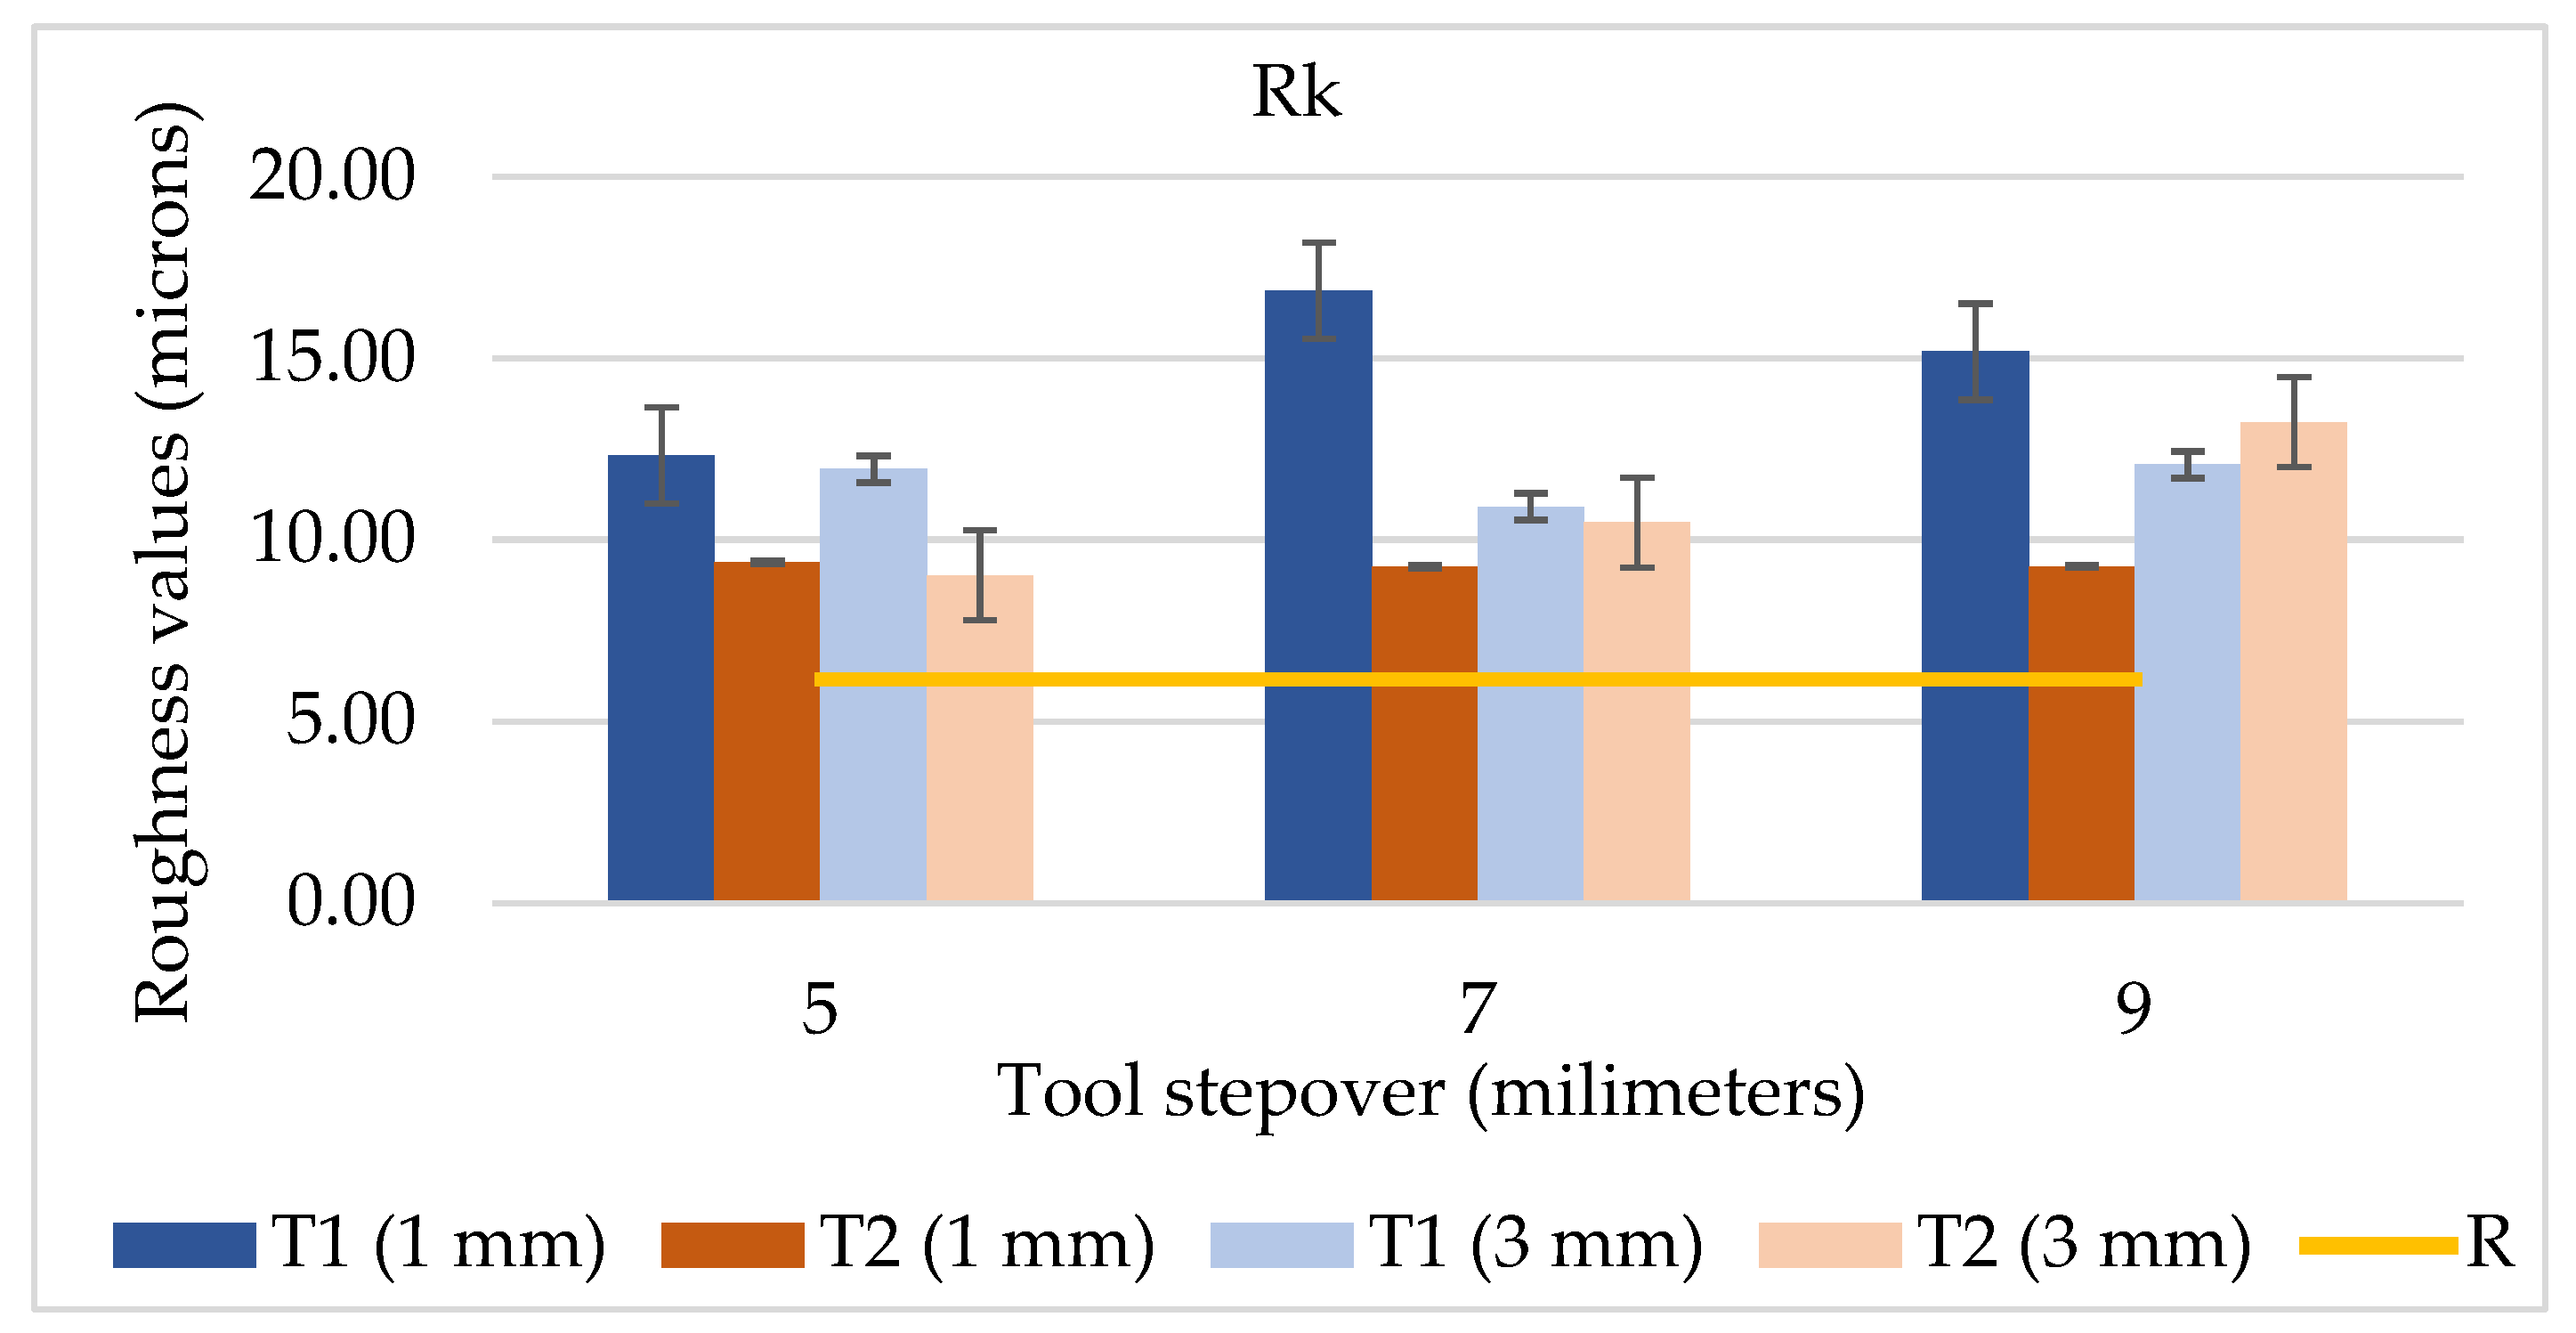
In a study on beech edge-glued panels [35], using a 6 mm diameter straight-end router bit with two cutting edges, geometrically similar to the T2 tool used in the present study, the Ra value at a 4 mm stepover was 4.463 µm, while the Ra values for depths of cut of 2 mm and 4 mm were 4.216 µm and 4.381 µm, respectively. The values were close to the Ra values for maple in our study, and the minimum values were recorded for T2 and were around 4.5–4.6 µm for a depth of cut of 1 mm and 4.03 µm for a depth of cut of 3 mm at a stepover of 5 mm. Although Ra is the most used parameter in the literature, here Rk was considered more reliable to differentiate the quality with different processing variables. The parameter Rk most effectively captures the central concentration of data points, as it is a robust parameter that excludes the influence of isolated surface features such as protruding fibers (surface fuzziness) or deep irregularities (pores, cracks). The evolution of the Rk parameter in relation to the stepover, the tool type, and the cutting depth can be seen in Table 3 and Figure 6. The surface obtained through super surfacing is also represented (R), marked by a gold line, serving as a reference for surface quality.
In general, for both cutting depths, the machining surface roughness depicted by the core roughness Rk was significantly smaller for T2 compared to T1 and for all stepover values, with the exception of the stepover of 9 mm at 3 mm depth, with which the surface quality worsened for both tools, leading to no statistical differences between corresponding surfaces. Compared to the reference shaved surface (Rk = 6.16 µm), the Rk values for T2 were the closest (Rk = approximately 9 µm), 33–34% higher for the milled surface for a cutting depth of 1 mm, whereas the surfaces processed by T1 were more than two times rougher.
In Table 4 is an example of a statistical analysis, in which, at a stepover of 5 mm, two-way ANOVA without replication indicates statistically significant differences among the four combinations of tool type (T1 and T2) and cutting depth (1 mm and 3 mm). The very low p-value (p = 6.00 × 10⁻⁵) confirmed that the variations in the Rk values were not due to random factors but were instead influenced by the combined effect of tool geometry and depth of cut. Conversely, the high p-value for the replicates (p = 0.9818) demonstrated the consistency and reproducibility of the measurements. A similar trend was observed at the 7 mm stepover, at which the influence of the processing parameters remained statistically significant, while the variation among the replicates remained low.
Concerning the stepover influence over the Rk parameter, a significant increase in Rk with the stepover value was found for T1 at the 1 mm depth of cut and for T2 at the 3 mm depth of cut, as tested by ANOVA without replication. Although the values of Rk for T2 and 1 mm depth of cut were similar (Table 3), the overall quality worsened with the increase in the stepover due to an increase in fuzziness and fiber detachment, which can be seen from the increase in the Rpk values in Table 3, as well as from the protuberances in the roughness profiles in Figure 7 or in the aspect of the micrographs in Figure 8. Increasing the depth of cut to 3 mm increased the core surface roughness Rk as well as the fuzziness (Rpk) in comparison with the values at 1 mm depth, and this trend increased as the value of the stepover increased (Figure 9). This showed that an increase in the depth of cut combined with an increasing stepover led to a significant deterioration in surface quality, the T2 cutter becoming more sensitive to the operating parameters under conditions of increased effort. Overall, T2 showed a clearer quality trend with changes in the cutting depth and stepover than T1, for which the quality variation was rather unpredictable.
For maple, Rv ranged from 59.52 µm to 74.27 µm for the 1 mm cutting depth and from 43.71 µm to 76.74 µm for the 3 mm cutting depth. The reference surface obtained by shaving exhibited Rv effective values from 42 to 49 µm, indicating that a substantial portion of the surface valleys were due to the natural anatomical structure of the wood. According to [33], the vessel diameters in maple typically range from 30 to 70 µm but can occasionally reach 110 µm, which corresponds well with the Rv values observed. This means that the deepest valleys measured by Rv and seen also in the roughness profiles of Figure 7 belonged to the vessel cavities opened during the cutting process.
To gain deeper insights, comparative roughness profiles and corresponding microscopic images were examined. The roughness profiles selected were for both tool types (T1 and T2) at the 1 mm cutting depth and for all three stepover values, as presented in Figure 7. The roughness profiles in Figure 7 are color-coded: red represents the shaved surface, navy blue corresponds to milling with a 5 mm stepover, magenta to milling with a 7 mm stepover, and light blue to milling with a 9 mm stepover.
At a cutting depth of 1 mm, the roughness profiles in Figure 7 revealed that the tool T2 (with straight blades) produced a cleaner surface finish compared to T1 (with helical blades).
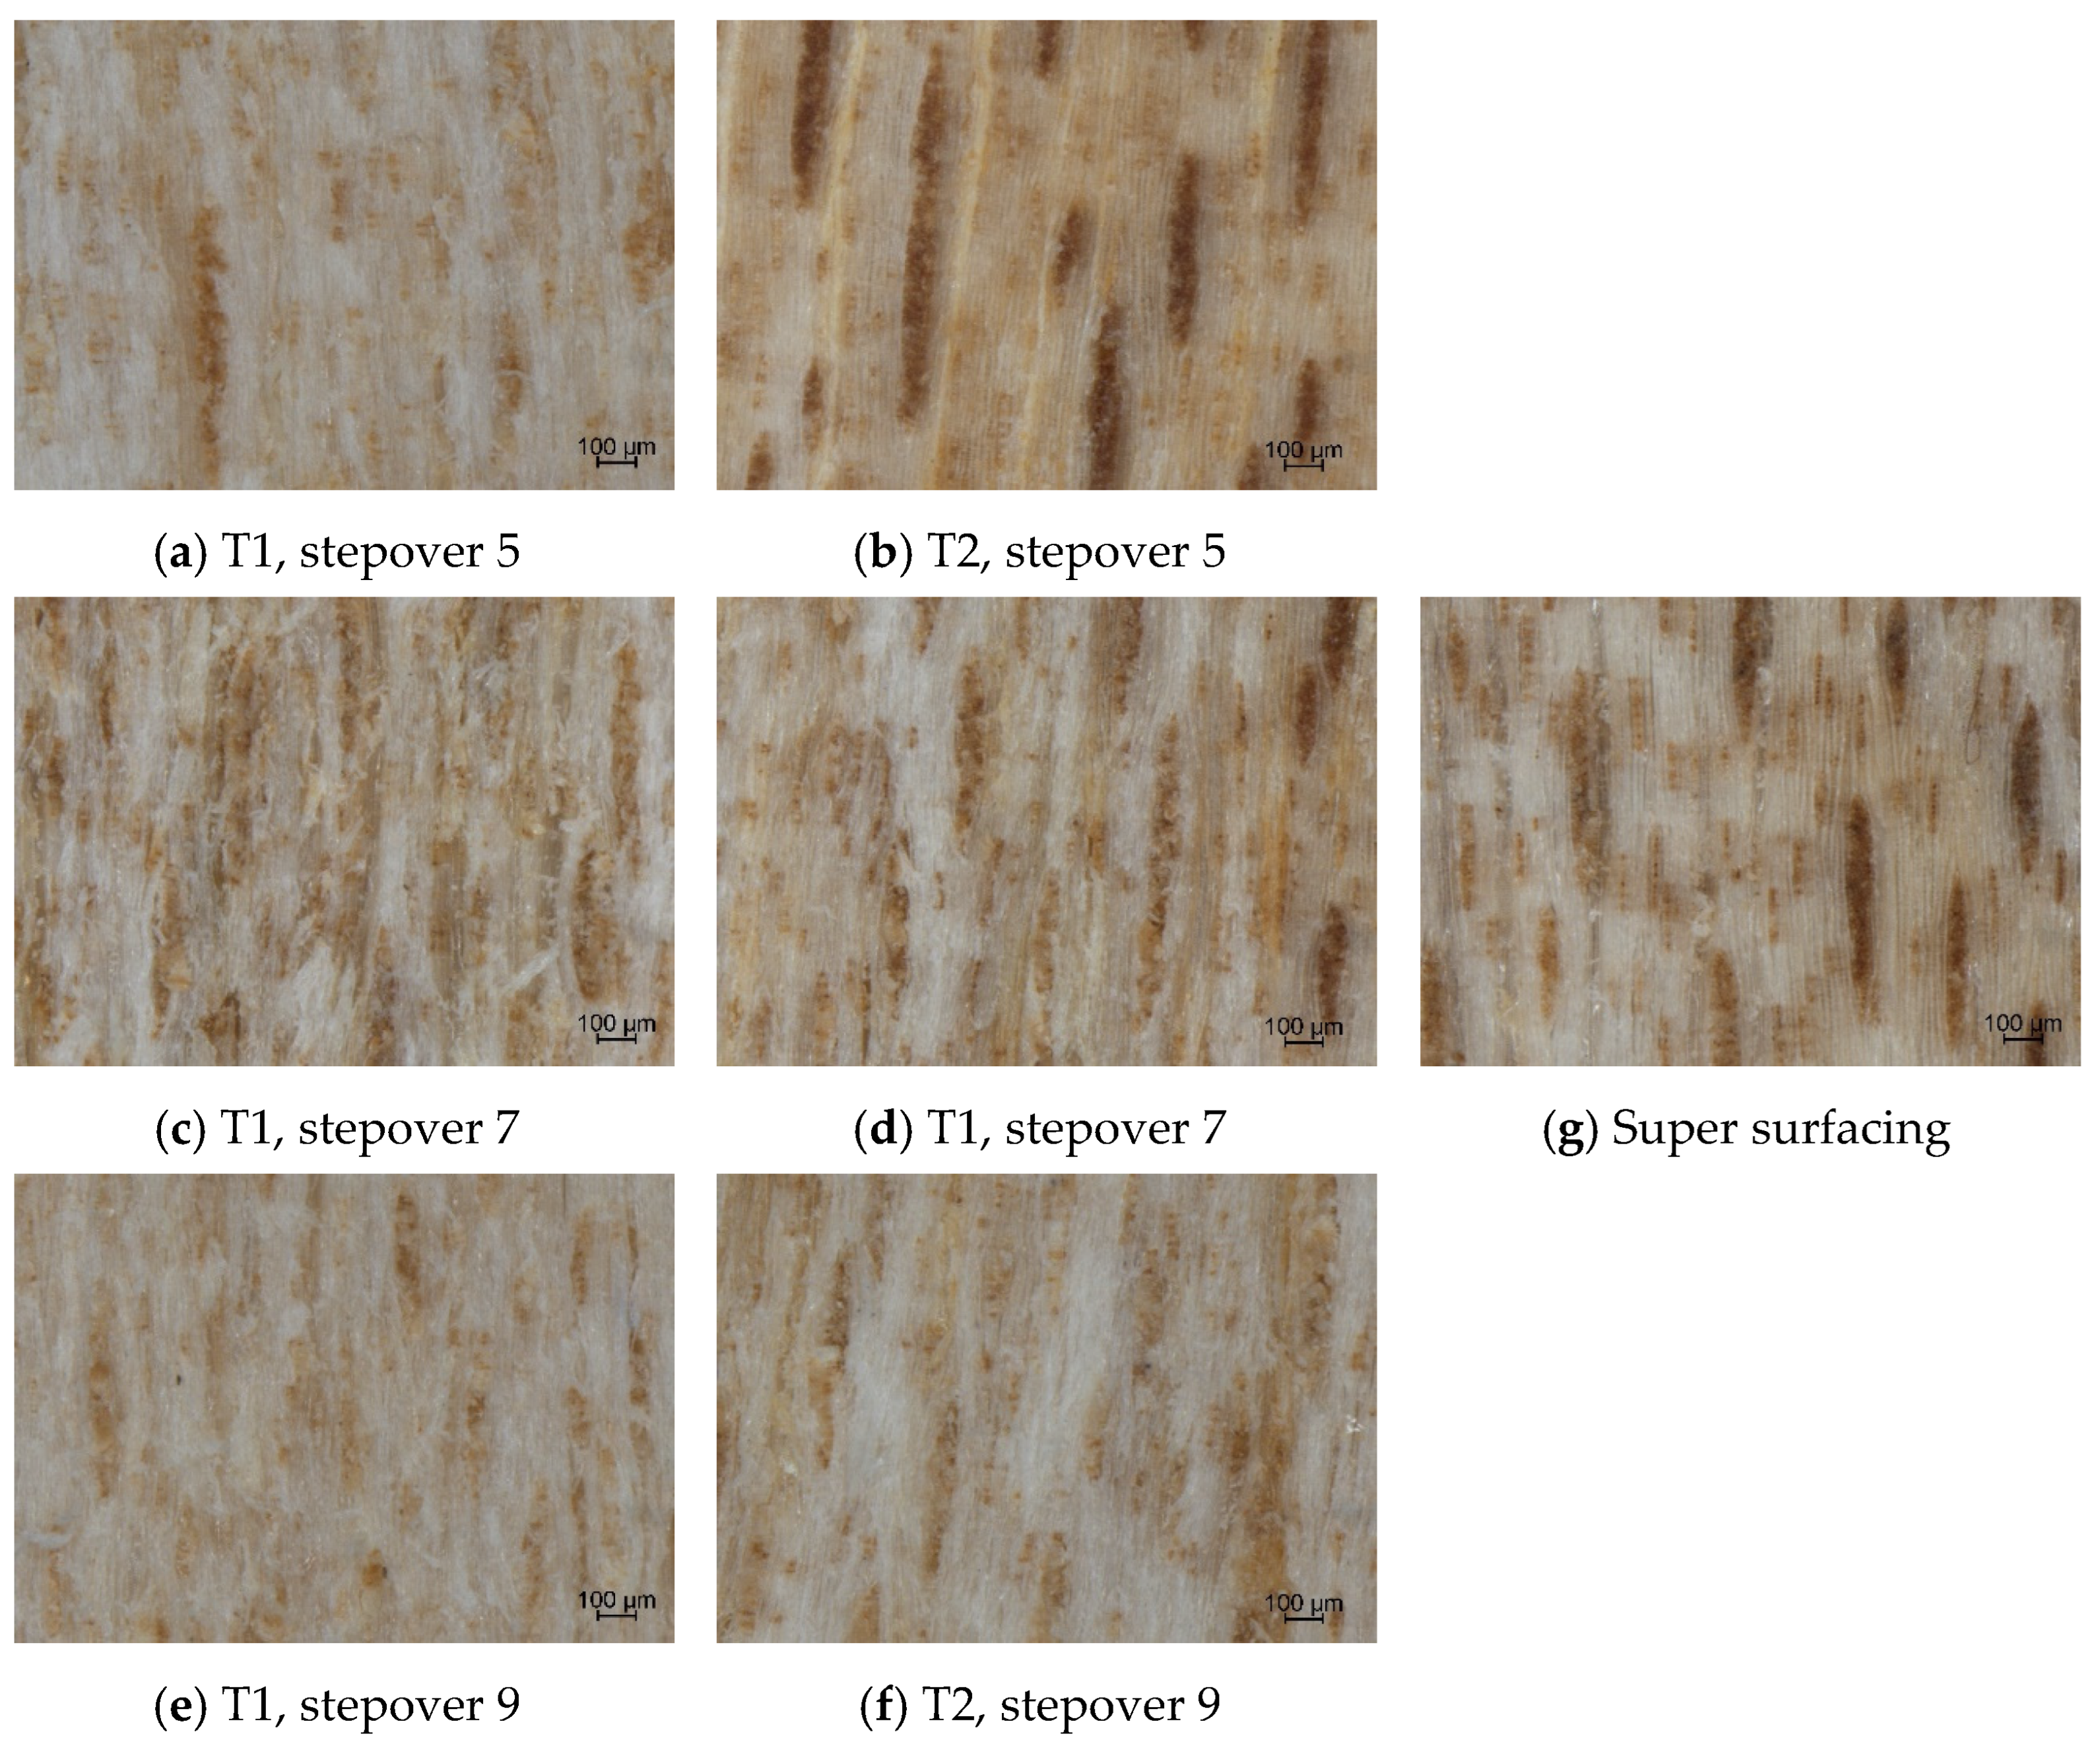
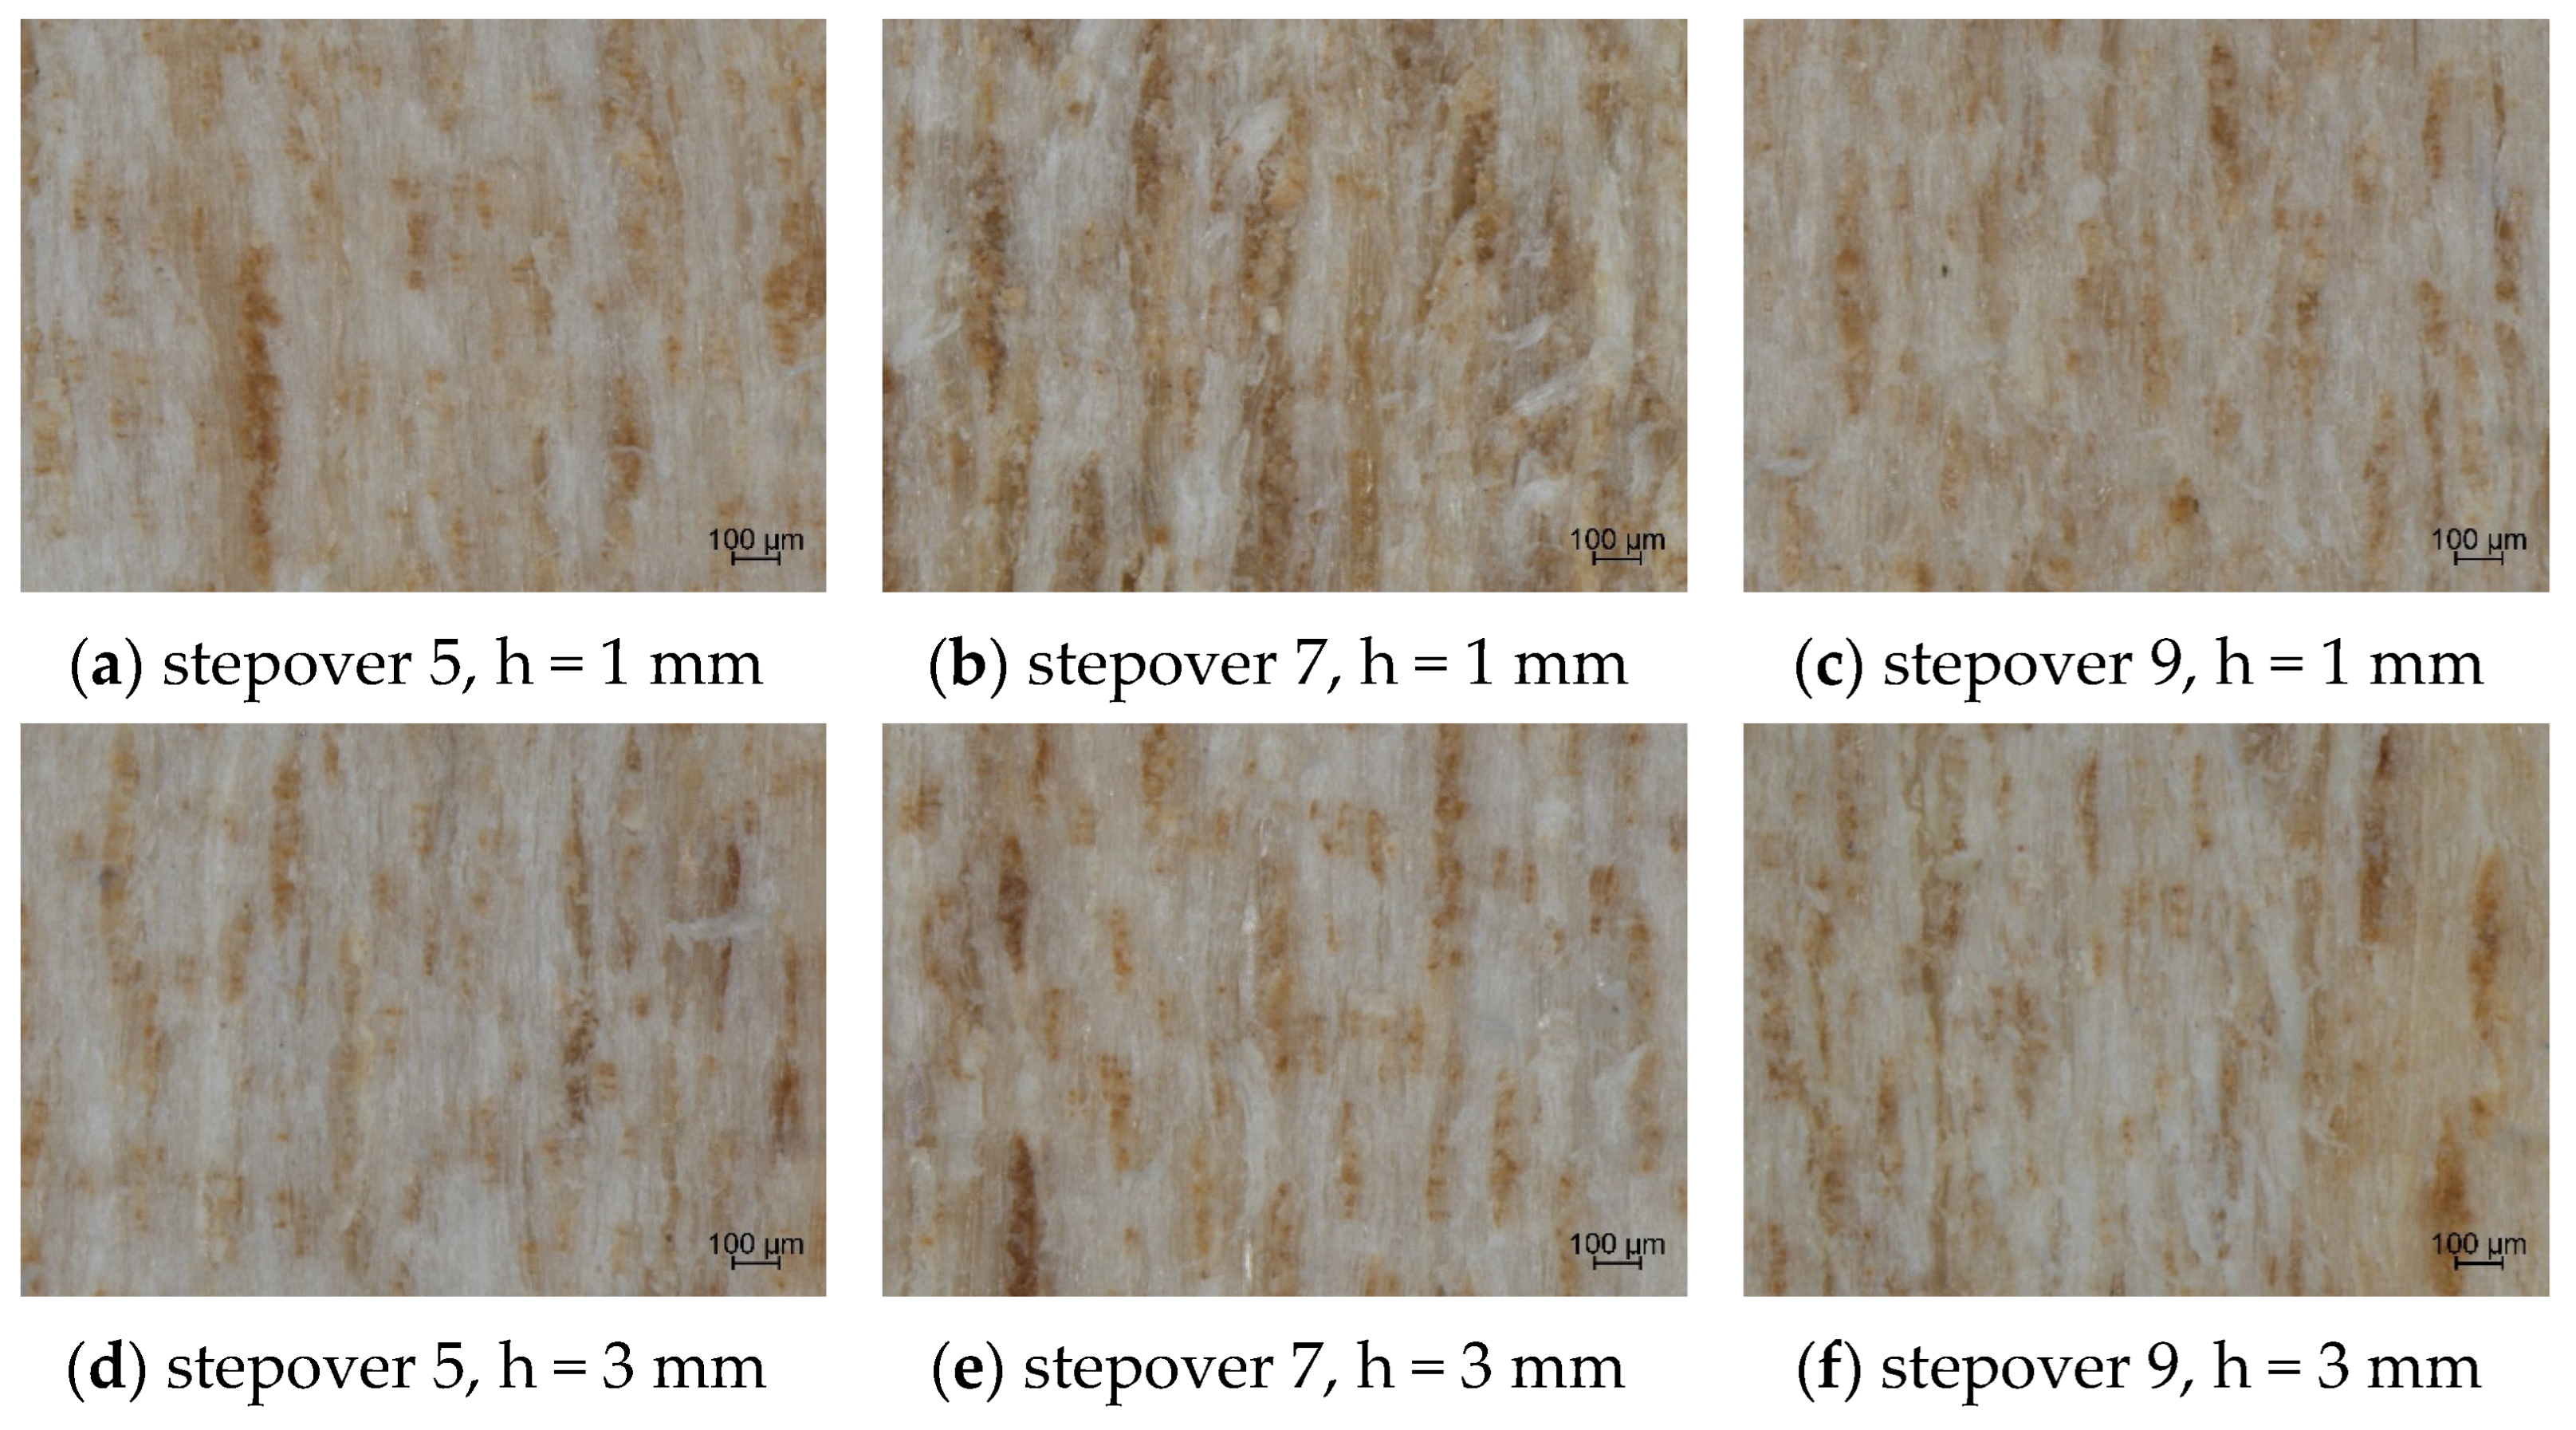
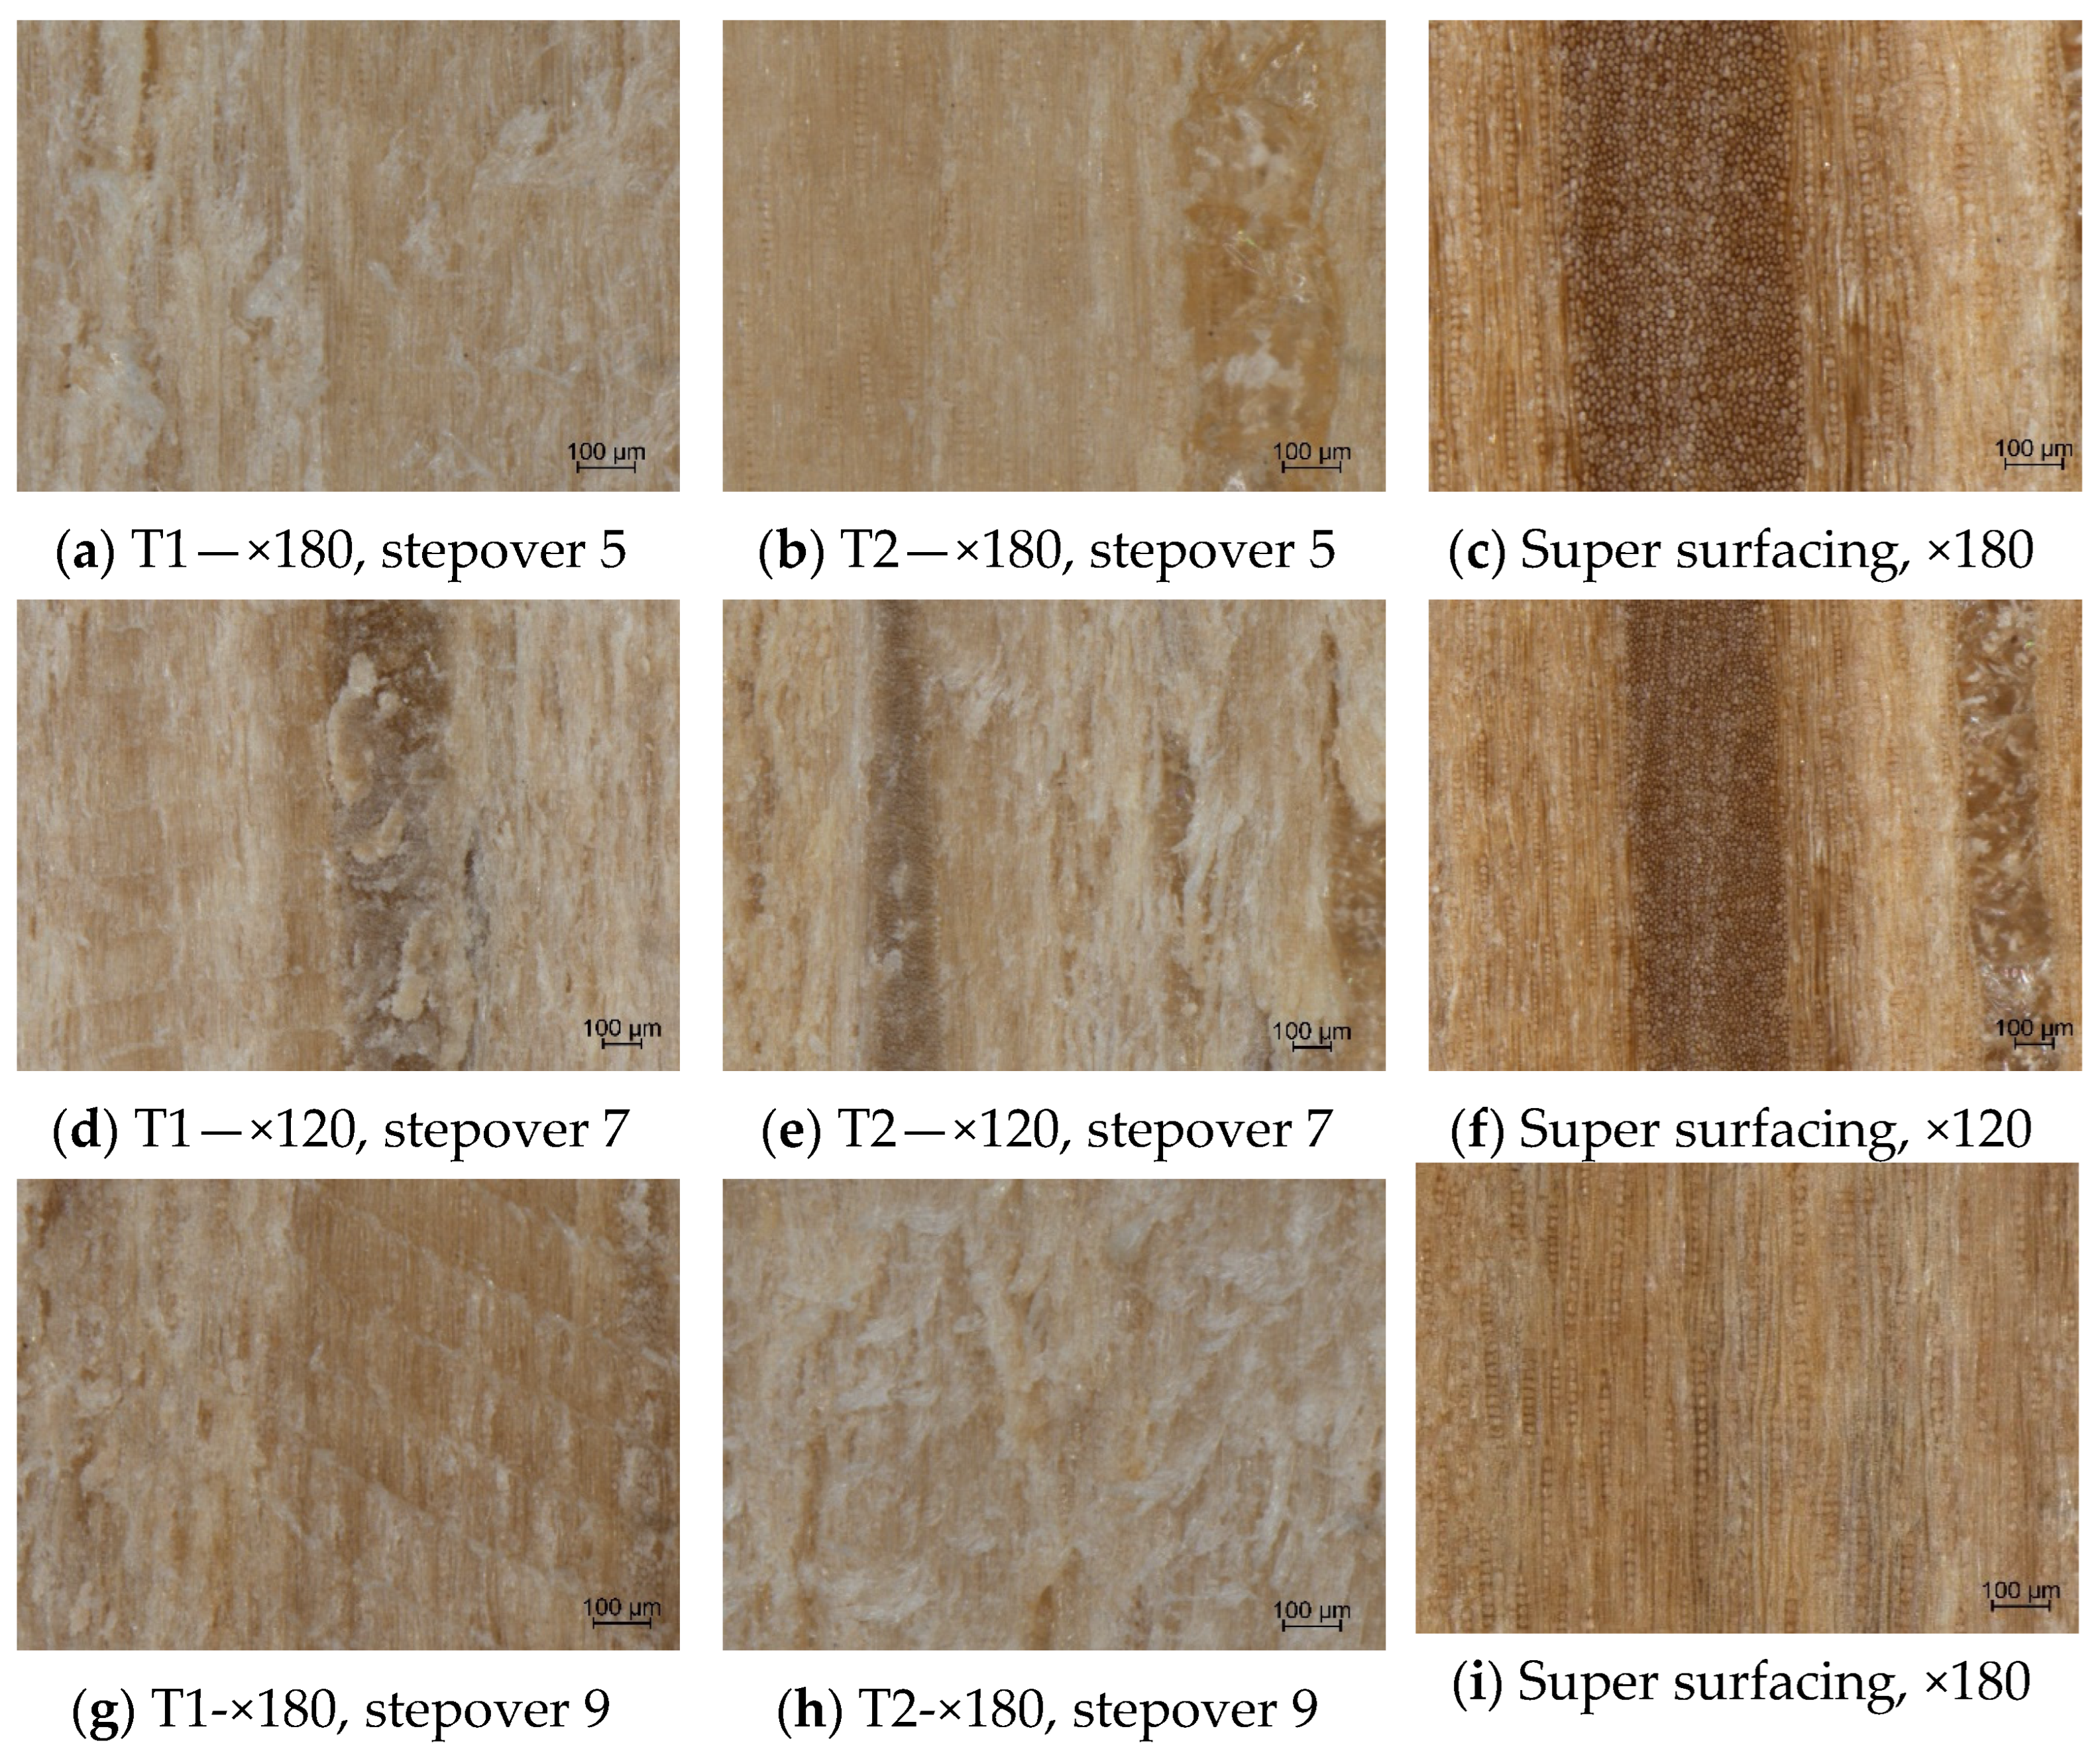
Furthermore, to better understand the differences in surface quality when processing with T1 and T2 and also with respect to the reference shaved surface it is useful to examine the microscopic images in Figure 8. These images, which include surfaces processed with the tools T1 and T2, as well as the reference shaved surface, highlight the differences in surface quality resulting from the machining parameters. Figure 9 and Figure 10 provide more insights regarding the influence of the cutting depth and stepover value for each milling tool.
In Figure 8, on the shaved surface, the wood anatomy is clearly visible and well preserved: fibers appear aligned and intact, vessels and their lumens are well defined, and medullary rays, including those uniseriate, are sharply delineated. This proved that shaving is an operation that uncovers and reveals wood surface anatomy with minimized surface disturbance caused by processing. This morphology corresponded to the lowest Rk value (6.16 µm), confirming the superior smoothness of the reference surface. In contrast, surfaces machined with T1 and T2 showed varying degrees of anatomical degradation. The surface processed with T1 (helical cutting edges) displayed significant fiber tearing, disrupted vessel outlines, and areas where the surface appeared fragmented, indicating an aggressive interaction between the tool and the wood. These characteristics were consistent with the higher roughness measured.
Although similar types of damage were present on the surface machined with T2 (straight cutting edges), the degree of fiber disturbance was visibly lower. The surface quality using the T2 milling tool resembled best the quality of the shaved surface, leaving distinct the anatomical features when the smallest stepover value was used (Figure 8). The anatomical cavities and their clarity faded with an increase in the stepover value, due to the occurrence of fuzzy grain or even the detachment of fiber bundles. The visual impression in Figure 8 suggests that T2 induced a less severe disruption, which aligns with its overall more favorable performance at a lower stepover value.
Microscopically, it was observed that an increase in the depth of cut from 1 to 3 mm increased the surface roughness of maple in the case of T2 and for all values of stepover (Figure 9), which validates the previous comments based on the results in Table 3 and Figure 6. The differences in quality caused by the depth of cut are not clear in the images of the T2-processed surfaces, confirming the previous observations (Figure 10).

3.2.3. Surface Roughness and Stereomicroscopy Analysis for CNC-Processed Oak

Oak samples were evaluated under the same CNC machining conditions applied to maple. Table 5 provides a summary of the mean values and standard deviations for the oak samples, covering all tool and parameter combinations, with the super surfaced reference included for comparison.
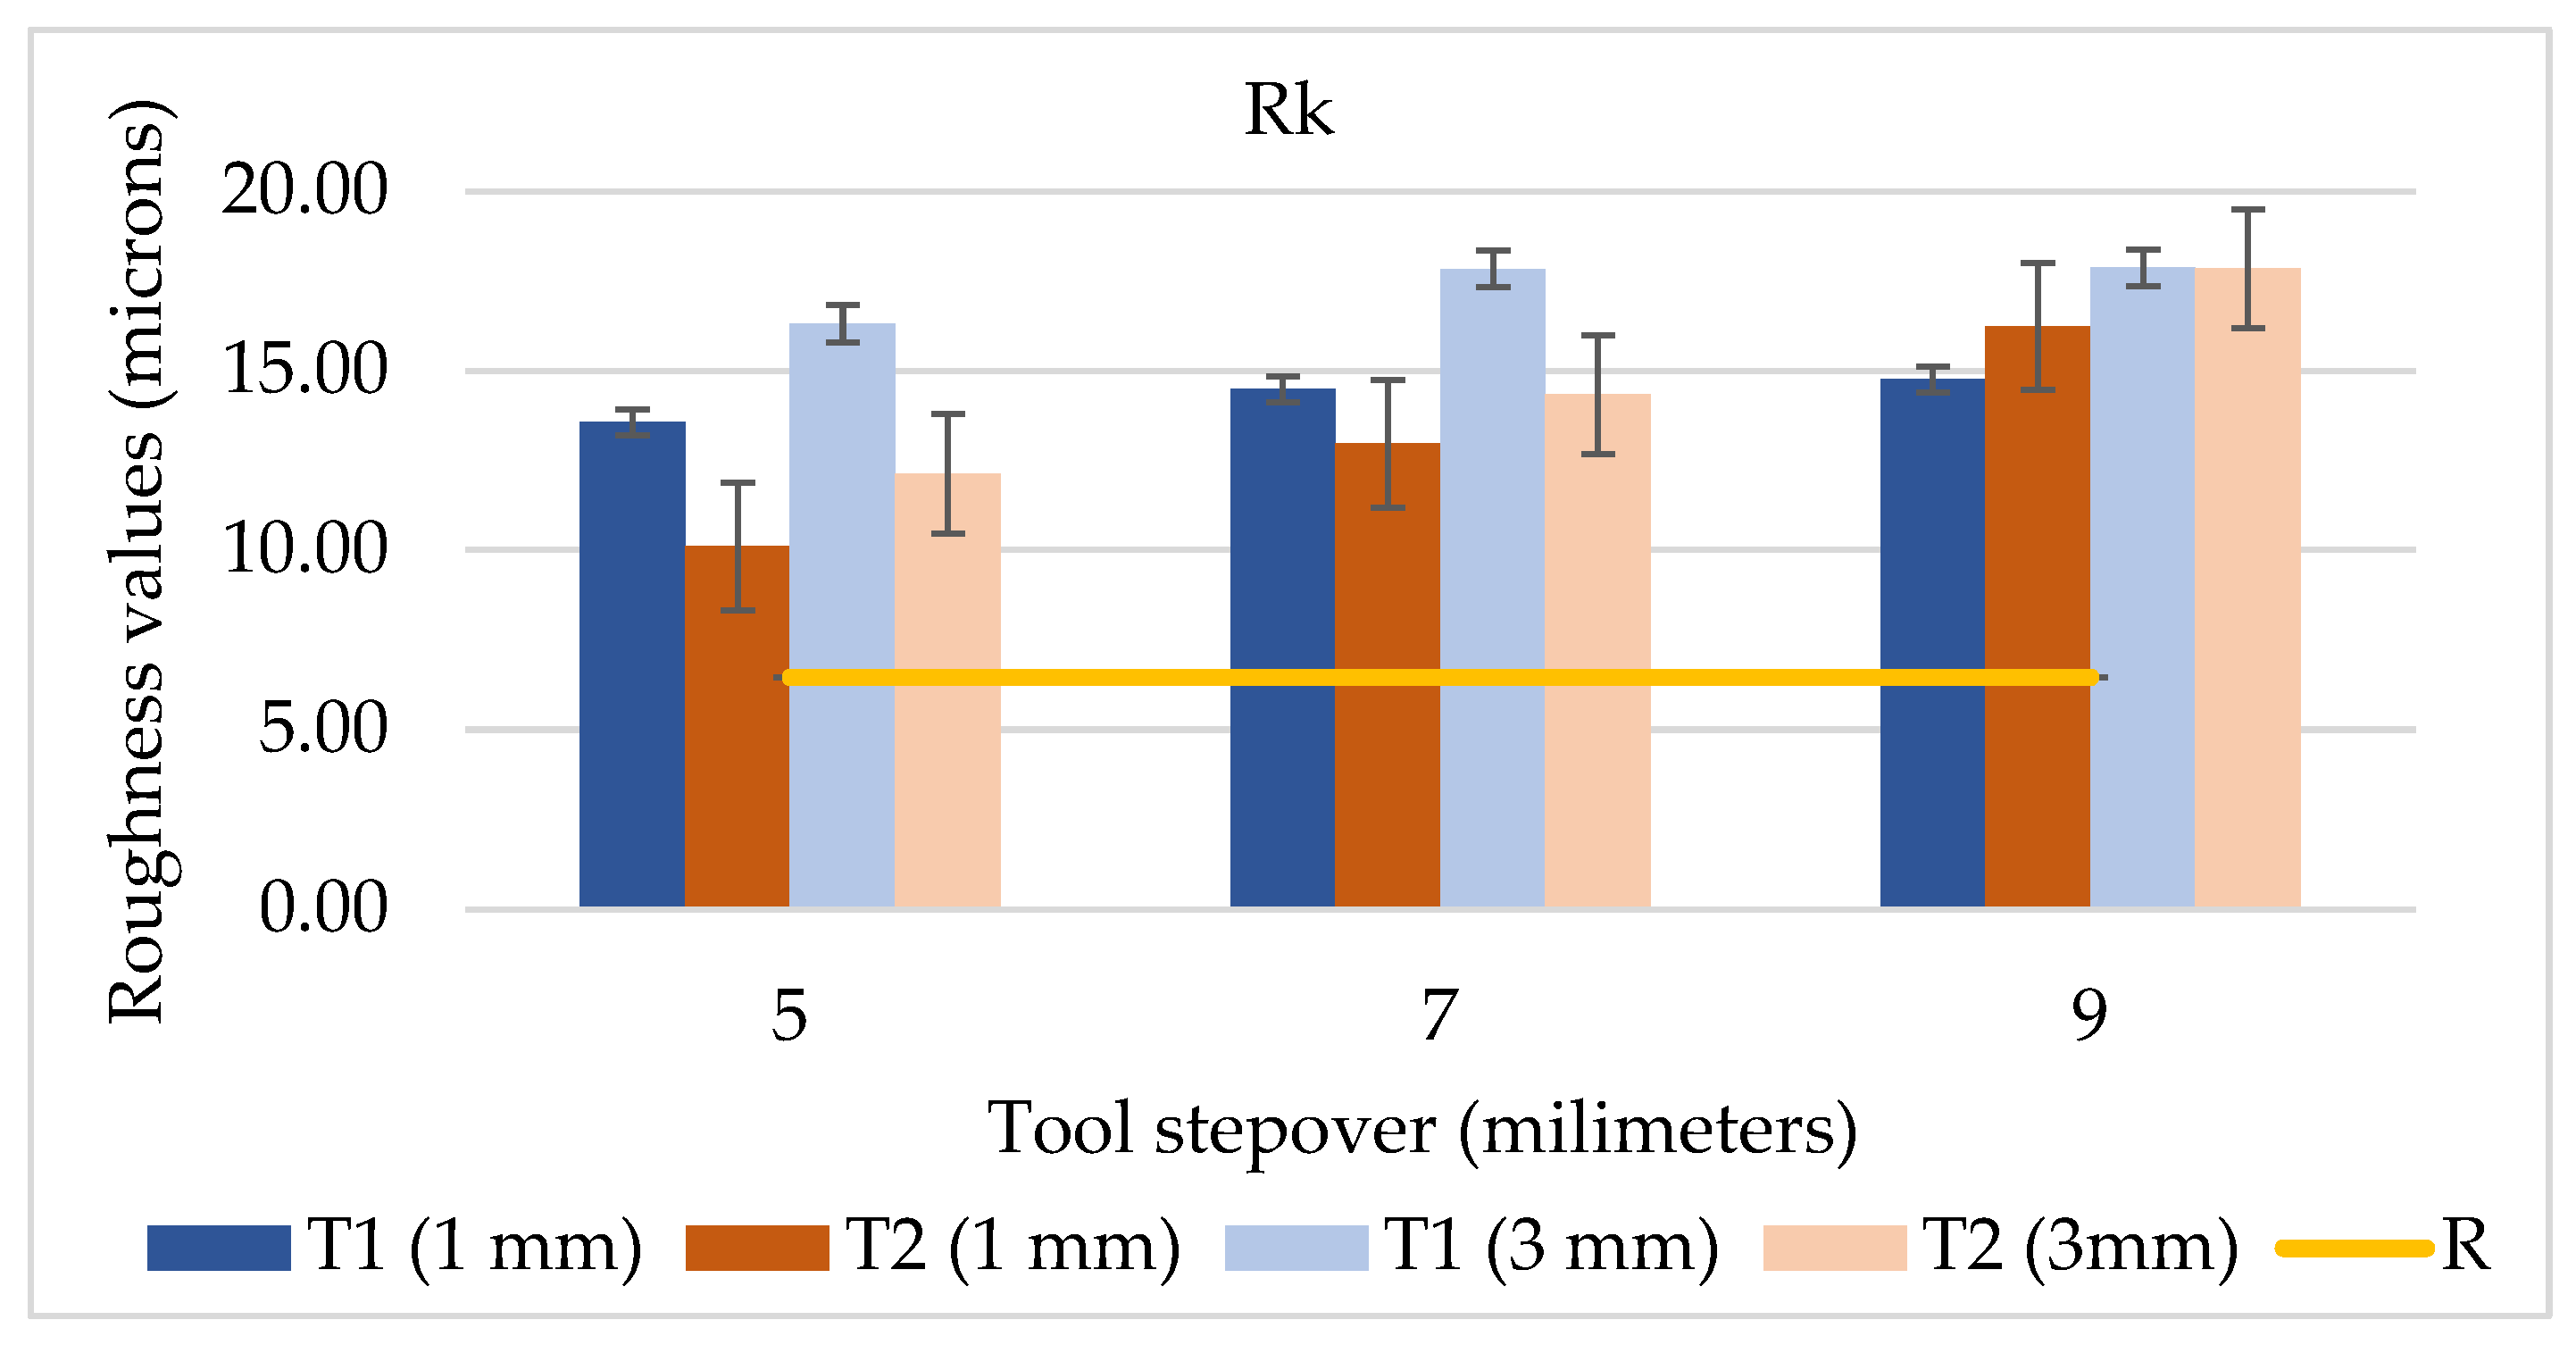
The value of Ra in the case of T2, depth of cut 1 mm, and stepover 5 mm was apparently higher than that of Ra for the shaved surface. This only proved, once more, that Ra is not reliable for species with deep pores like oak, because it is clearly influenced by wood local anatomical voids. The shaved surface not only provided an exceptional processing smoothness but also uncovered the wood anatomy almost like a microtome-processed surface. Open pores directly affect Ra, which cannot express the real machining quality of oak. Therefore, Rk was preferred in this research, as recommended in [26], although the vast majority of researchers base their reports on Ra. For example, in [36] the value of Ra for Quercus alba samples processed by surface planning, using a three-blade cutter head with a 76 mm diameter, a rotation speed of 4500 rot/min, and a feed rate of 6 m/min, was 11.27 µm on tangential surfaces. In comparison, the CNC milling tests conducted in the present study using a straight-edge geometry tool with a cutting depth of 1 mm, a stepover of 5 mm, and a feed rate of 4 m/min resulted in an Ra value of 8.50 µm. This indicates that milling with a straight-edged tool can produce a smoother surface on oak than conventional planing. Similarly, in [37], Ra after the planar milling of oak with a 130 mm spindle cutter was 8.33 µm, very close to the value observed in the present CNC milling tests with the T2 tool. The evolution of Rk with different stepover values, tool types, and cutting depths is illustrated in Figure 11, alongside the value for the super surfaced reference (R), marked with a gold line.
The core roughness parameter Rk for the surfaces processed by the T2 tool was significantly smaller compared to that obtained using T1 for stepover values of 5 and 7 mm, whatever the cutting depth, whereas the quality worsened for the stepover of 9 mm, indicating no significant differences between the tools at this particular stepover value. In comparison with the reference surface quality, the Rk for both CNC tools exceeded by more than twice the Rk after super surfacing. The tool T2 performed best for the stepover of 5 mm at the 1 mm cutting depth, leading to an Rk (10.1 µm) that was approximately 1.5 times the Rk obtained after shaving (6.46 µm).
An increase in the stepover value increased the Rk for both tools and depths of cut (Table 5 and Figure 11), but this trend was found significant by ANOVA only in the case of T2. The roughness profiles in Figure 12, as well as the micrographs in Figure 13, seem to confirm a surface deterioration with an increase in the stepover value for both tools.
The core roughness Rk increased with an increase in the cutting depth for both tools (Table 5, Figure 11), and this was found significant by ANOVA, especially for values of 5 and 7 mm stepover in the case of T2 and 7 and 9 mm stepover in the case of T1. The increasing roughness with the cutting depth is also visible in Figure 14 and Figure 15.
The two-factor ANOVA (without replication) presented in Table 6 for oak milling at a 5 mm stepover indicates that both tool type and cutting depth significantly influenced the surface roughness (p = 0.016). Comparing the two tools, T2 generated lower roughness values, particularly at the 1 mm depth, confirming a better performance under these conditions.
In general, the increase in stepover produced more fuzzy grain, which is seen in the Rpk values in Table 5 for a depth of cut of 1 mm and in the micrographs of Figure 13.
The Rvk and Rv values offer further insight into the depth of the surface valleys formed during machining. For oak, the Rv values reached up to 264.37 µm (T2 at 9 mm), which aligns with the anatomical data reported in the literature, according to which oak vessel diameters range from 350 to 500 µm [33]. The shaved reference surface showed a mean Rv of 165.04 µm, indicating that the deepest valleys observed in the CNC-processed surface were primarily related to the exposure of earlywood vessels cavities rather than to excessive tool penetration or machining defects.
Figure 13 illustrates microscopic images of oak surfaces machined with T1 and T2, for three values of stepover at a cutting depth of 1 mm, compared with the reference shaved surfaces, while Figure 14 and Figure 15 show a comparison of the effect of the cutting depth for each tool type.
The super surfaced reference images revealed a clean-cut anatomical structure, with distinctive types of cells with their corresponding open lumens and with negligible surface damage, almost like that of a microtomed surface. As in the case of maple, the surface processed with T2 at a stepover of 5 mm resembled the reference surface best, and this is also visible in the roughness profiles in Figure 12. For both tools, an increase in the stepover value worsened the surface quality (Figure 13). This was noticed for T1, as shown by the prominent tool marks appearing as regular ridges across the grain, in addition to material detachment and fuzziness, indicating a more aggressive cutting action that disturbed the anatomical integrity of the surface. The helical geometry of T1, while typically advantageous for chip evacuation, generates angled shear forces that may tear across earlywood vessels and ray tissue. This effect is particularly evident in ring-porous species like oak, where large earlywood pores and broad multiseriate rays lead to a non-uniform cutting resistance across the surface. On the other hand, the tool T2, with its straight cutting edges, resulted in a cleaner cut, preserving more successfully the integrity of anatomical features such as vessel boundaries and ray patterns.
Although the ANOVA test indicated a significant increase in the core roughness for a cutting depth of 3 mm, it was more difficult to discern any difference in quality caused by the two depths of cut in the case of the T2 tool, as shown in Figure 14; the amount of damage looked similar, while the best surface quality was clearly obtained for a stepover value of 5 mm.
A visual examination of the microscopic images in Figure 15 indicated that for oak processed by the T1 tool, the surface quality decreased with an increase in the stepover and depth of cut. Apart from the pull-out material, the quality was affected by the pronounced ridges imprinted by the T1 tool across the grain.

3.2.4. Influence of Wood Anatomy on Surface Roughness

When comparing the two species, the Ra values seemed consistently higher for oak than for maple across all machining conditions. However, Ra proved insufficient for fully describing the surface quality, as it is highly sensitive to the presence of large vessels. The Abbott–Firestone parameters provide instead a deeper insight into the stratified structure of processed wood surfaces. Although both wood species were machined using identical parameters, their surface responses differed notably due to their anatomical characteristics. Maple, a diffuse-porous species with fine and uniformly distributed vessels, generally produced smoother surfaces, particularly when milled with the straight-edged tool (T2). Its consistent texture contributed to lower Rk and Rpk values (Table 3) and resulted in a more predictable response to variations in the processing conditions.
In contrast, oak, a ring-porous species with large earlywood vessels and prominent rays, showed greater surface deterioration, especially when processed with the helical tool (T1). This was attributed to the uneven cutting resistance within its growth rings, caused by abrupt transitions between earlywood and latewood, which led to a fluctuating tool engagement and local fiber tearing. Although oak has a higher overall density than maple, a characteristic that would typically improve machinability, the disruptive effect of its anatomical heterogeneity proved dominant. As a result, the oak surfaces exhibited more pronounced roughness and morphological defects, despite the greater density of the material. Across most parameter combinations, oak exhibited higher Rk, Rpk, and Rvk values (Table 5), and the microscopic analysis revealed more frequent fiber disruption and visible tool marks.
Although machining could not fully replicate the anatomical clarity of super surfacing, the tool T2 consistently demonstrated superior performance compared to T1 in minimizing the core roughness and preserving the surface morphology during maple and oak CNC milling. These findings are consistent with the results reported by [38], who also found that straight-end mills produced smoother surfaces than spiral tools across various wood species, including beech and pine. The authors explained that the geometry of the straight edge, which cuts in a more planar and uniform manner, allows for better surface preservation by minimizing lateral fiber disruption. Although no study was found in the literature about an identical tool–wood material parameter setup, the minimum Ra values obtained in this research for maple and oak for the optimal combination (T1 tool, minimum stepover and depth of cut) were similar to the Ra values in other studies, which achieved optimal surface quality using end-mill or planing tools (Section 3.2.2 and Section 3.2.3).
Future research will give particular attention to the face milling of radial surfaces in order to observe the influence of grain orientation (radial–tangential) on surface quality after processing in identical conditions. Since both end tools are designed not only for face milling but also for edge/side milling, another research target will be to compare the tools’ performance in relation to the surface quality of processed edges and understand the influence of grain orientation and of the tool active part during CNC milling. The clear differentiation between tangential and radial surface responses is essential to define machining strategies that are anatomically tailored.
In addition, the experimental scope will be extended to include representative species from other hardwood categories, such as diffuse-porous, semi-ring-porous, and ring-porous groups, in order to capture the variability in surface formation mechanisms during face and edge milling. This comparative approach will help clarify whether the tool–material interactions observed for oak and maple are consistent across broader anatomical typologies or whether species-specific adjustments are required for optimal surface outcomes.

4. Conclusions

The surface quality achieved by face milling for maple and oak using two types of end-mill tools (with straight and helical cutters) for three values of stepover (5, 7 and 9 mm) and two values of depth of cut (1 and 3 mm) was comparatively analyzed. The results were referenced to those of almost ideally smooth surfaces obtained by super surfacing (shaving).
The reference surfaces obtained by shaving were very smooth and revealed with clarity and detail the species’ anatomical structure, with negligible surface disturbance caused by processing. Maple and oak presented a similar Rk value around 6 µm, characterizing the roughness caused by the shaving tool. Ra was strongly influenced by the wood species anatomy, particularly by the vessel deep voids of oak, which rendered Rk more reliable for the characterization of the machining quality.
The comparative morphology of maple and oak face-milled surfaces evidenced a species-dependent machining quality, from which the inherent deep anatomical voids were excluded. In general, for both species, the machining surface roughness depicted by the core roughness Rk was significantly smaller for the straight-edged tool compared to the helical tool for both cutting depths and all stepover values, with the exception of the stepover of 9 mm, with which the surface quality worsened for both tools due to an increase in fuzziness and fiber detachment.
For maple and oak, both milling tools enhanced the surface waviness, as well as the fuzziness, as the stepover value increased. An increase in the cutting depth generally increased the core surface roughness Rk, as well as the fuzziness (Rpk), and this trend increased as the value of the stepover increased.
In the case of maple, the straight-edged tool showed a clearer quality trend with increases in the cutting depth and stepover than the helical tool, for which the variation in quality, was rather unpredictable. The maple surface processed with the helical end mill displayed significant fiber tearing, disrupted vessel outlines, and areas where bundles of fibers appeared fragmented, indicating an aggressive interaction between the tool and wood, while for oak, apart from material detachment and fuzziness, prominent tool marks appearing like regular ridges across the grain were noticed. The deepest valleys (Rv) observed in the CNC-processed surfaces were primarily related to the exposure of earlywood vessels cavities rather than to machining defects.
Of the two tested tools, the straight-edged mill working with the smallest depth of cut (1 mm) and stepover (5 mm) approached the most the quality of the shaved surfaces, with values of Rk about 33–34% higher than that of the reference in the case of maple and 56% higher in the case of oak, whereas the surfaces processed by the helical tool were more than two times rougher. Further work would seek improvements in the selection of tool geometry and process parameters, tailored per species, to bring the quality of CNC-machined surfaces even nearer to the quality achieved through fine shaving.

Author Contributions

Conceptualization, L.G.; methodology L.G., A.-M.A. and M.I.; surface quality software A.-M.A.; microscopy, L.G. and A.-M.A.; data analysis, L.G. and A.-M.A.; validation, L.G. and M.I.; investigation, L.G. and A.-M.A.; resources, A.-M.A.; writing—original draft preparation, L.G., A.-M.A. and M.I.; editing, A.-M.A.; supervision, L.G. and M.I. All authors have read and agreed to the published version of the manuscript.

Funding

This research received no external funding.

Institutional Review Board Statement

Not applicable.

Informed Consent Statement

Not applicable.

Data Availability Statement

The original contributions presented in this study are included in the article. Further inquiries can be directed to the corresponding author.

Acknowledgments

We hereby acknowledge the structural funds project PRO-DD (POS-CCE, O.2.2.1., ID 123, SMIS 2637, No. 11/2009) for providing the infrastructure used in this work and the Contract No. 7/9.01.2014.

Conflicts of Interest

The authors declare no conflicts of interest.

References

  1. De Moura, L.F.; Cool, J.; Hernández, R.E. Anatomical Evaluation of Wood Surfaces Produced by Oblique Cutting and Face Milling. IAWA J. 2010, 31, 77–88. [Google Scholar] [CrossRef]
  2. Hernández, R.E.; Cool, J. Effects of Cutting Parameters on Surface Quality of Paper Birch Wood Machined across the Grain with Two Planing Techniques. Holz Roh Werkst. 2008, 66, 147–154. [Google Scholar] [CrossRef]
  3. Aras, O.; Sofuoğlu, S.D. Analyze the Effects of CNC Machining Parameters on the Surface Roughness (Rz) of Anatolian Chestnut. Ağaç ve Orman 2024, 5, 42–50. [Google Scholar] [CrossRef]
  4. Yaghoubi, S.; Rabiei, F. A Profound Evaluation of Different Strategies to Improve Surface Roughness of Manufactured Part in Wood-CNC Machining Process. J. Eng. Res. 2024; in press. [Google Scholar] [CrossRef]
  5. Kilic, M.; Hiziroglu, S.; Burdurlu, E. Effect of Machining on Surface Roughness of Wood. Build. Environ. 2006, 41, 1074–1078. [Google Scholar] [CrossRef]
  6. Dündar Sofuoğlu, S.; Kurtoğlu, A. Effects of Machining Conditions on Surface Roughness in Planing and Sanding of Solid Wood. Drv. Ind. 2015, 66, 265–272. [Google Scholar] [CrossRef]
  7. Jankowska, A. Understanding of Surface Roughness of Wood Based on Analysis Its Structure Anddensity. Ann. WULS-SGGW. For. Wood Technol. 2020, 111, 27–31. [Google Scholar] [CrossRef]
  8. Rawangwong, S.; Chatthong, J.; Rodjananugoon, J.; Boonchouytan, W. A Study of Proper Conditions in Face Milling Palmyra Palm Wood by Computer Numerical Controlled Milling Machine. Silpakorn Univ. Sci. Technol. J. 2011, 5, 33–39. [Google Scholar] [CrossRef]
  9. Smajic, S.; Jovanovic, J. Influence of Different Machining on the Roughness of Oak Wood. FWIAFE 2021, 14, 101–108. [Google Scholar] [CrossRef]
  10. Hänsel, A.; Tröger, J.; Rößler, M.; Brachhold, N.; Niemz, P. Influence of Surface Treatment on the Bonding Quality of Wood for Load-Bearing Purposes. Wood Mater. Sci. Eng. 2023, 18, 2128–2139. [Google Scholar] [CrossRef]
  11. Kläusler, O.; Hass, P.; Amen, C.; Schlegel, S.; Niemz, P. Improvement of Tensile Shear Strength and Wood Failure Percentage of 1C PUR Bonded Wooden Joints at Wet Stage by Means of DMF Priming. Eur. J. Wood Prod. 2014, 72, 343–354. [Google Scholar] [CrossRef]
  12. Stewart, H.A. Result Force and Surface Quality from Some Facemilling Variables. For. Prod. J. 1984, 19, 21–24. [Google Scholar]
  13. Su, W.-C.; Wang, Y. Effect of the Helix Angle of Router Bits on Chip Formation and Energy Consumption during Milling of Solid Wood. J. Wood Sci. 2002, 48, 126–131. [Google Scholar] [CrossRef]
  14. Salcă, E. Contribuții La Optimizarea Prelucrării Lemnului de Arin Prin Frezare și Șlefuire în Vederea Valorificarii în Producție de Mobilă; Universitatea Transilvania din Brașov: Brasov, Romania, 2008. [Google Scholar]
  15. Doichinov, A. Optimization of the Cnc Milling Process Via Modifying Some Parameters of the Cutting Mode when Processing Mdf Workpieces. Acta Fac. Xylologiae Zvolen 2023, 65, 99–108. [Google Scholar] [CrossRef]
  16. Pinkowski, G.; Szymański, W.; Nosowski, T. Analyses of Surface Roughness in Selected Wood Species after Machining on a CNC Woodworking Centre. Ann. Wars. Univ. Life Sci.-SGGW For. Wood Technol. 2012, 79, 164–169. [Google Scholar]
  17. Deus, P.R.; Alves, M.C.S.; Vieira, F.H.A.; Bilesky, L.R. Analysis of the Cutting Parameters in Front Milling for Medium Density Fiberboard. BioResources 2018, 13, 3404–3410. [Google Scholar] [CrossRef]
  18. Deus, P.R.; Alves, M.C.D.S.; Vieira, F.H.A. The Quality of MDF Workpieces Machined in CNC Milling Machine in Cutting Speeds, Feedrate, and Depth of Cut. Meccanica 2015, 50, 2899–2906. [Google Scholar] [CrossRef]
  19. Keturakis, G.; Bendikiene, R.; Baltrusaitis, A. Tool Wear Evolution and Surface Formation in Milling Various Wood Species. BioResources 2017, 12, 7943–7954. [Google Scholar] [CrossRef]
  20. İşleyen, Ü.K.; Karamanoğlu, M. The Influence of Machining Parameters on Surface Roughness of MDF in Milling Operation. BioResources 2019, 14, 3266–3277. [Google Scholar] [CrossRef]
  21. ISO 21920-2:2021; Geometrical Product Specifications (GPS)—Surface Texture: Profile Part 2: Terms, Definitions and Surface Texture Parameters. ISO: Geneva, Switzerland, 2021.
  22. ISO 16610-31:2016; Geometrical Product Specifications (GPS)—Filtration Part 31: Robust Profile Filters: Gaussian Regression Filters. ISO: Geneva, Switzerland, 2016.
  23. Gurău, L. The Roughness of Sanded Wood Surfaces. Ph.D. Thesis, Forest Products Research Centre, Buckinghamshire Chilterns University College, High Wycombe, UK, 2004. [Google Scholar]
  24. Tan, P.L.; Sharif, S.; Sudin, I. Roughness Models for Sanded Wood Surfaces. Wood Sci. Technol. 2012, 46, 129–142. [Google Scholar] [CrossRef]
  25. Gurău, L.; Irle, M. Surface Roughness Evaluation Methods for Wood Products: A Review. Curr. For. Rep. 2017, 3, 119–131. [Google Scholar] [CrossRef]
  26. Magoss, E. General Regularities of Wood Surface Roughness. Acta Silv. Lignaria Hung. 2008, 4, 81–93. [Google Scholar] [CrossRef]
  27. Gurău, L.; Coşereanu, C.; Paiu, I. Comparative Surface Quality of Larch (Larix decidua Mill.) Fretwork Patterns Cut through by CNC Routing and by Laser. Appl. Sci. 2021, 11, 6875. [Google Scholar] [CrossRef]
  28. Iskra, P.; Hernández, R. The Influence of Cutting Parameters on the Surface Quality of Routed Paper Birch and Surface Roughness Prediction Modeling. Wood Fiber Sci. 2009, 41, 28–37. [Google Scholar]
  29. Aykaç, E.; Sofuoglu, S.D. Investigation of the Effect of Machining Parameters on Surface Quality in Bamboo. Teh. Vjesn. 2021, 28, 684–688. [Google Scholar] [CrossRef]
  30. Piernik, M.; Pinkowski, G.; Krauss, A. Effect of Chip Thickness, Wood Cross-Sections, and Cutting Speed on Surface Roughness and Cutting Power during up-Milling of Beech Wood. BioResources 2023, 18, 6784–6801. [Google Scholar] [CrossRef]
  31. Kudela, J.; Mrenica, L.; Javorek, L. The Influence of Milling and Sanding on Wood Surface Morphology. Acta Fac. Xylologiae Zvolen 2018, 60, 71–83. [Google Scholar] [CrossRef]
  32. Sütçü, A. Investigation of Parameters Affecting Surface Roughness in CNC Routing Operation on Wooden EGP. BioResources 2012, 8, 795–805. [Google Scholar] [CrossRef]
  33. Wagenführ, R. Holzatlas; 5., erg. und erw. Aufl.; Fachbuchverl. im Hanser Verl: Leipzig, Germany, 2000; ISBN 978-3-446-21390-6. [Google Scholar]
  34. Thoma, H.; Peri, L.; Lato, E. Evaluation of Wood Surface Roughness Depending on Species Characteristics. Maderas Cienc. Tecnol. 2015, 17, 285–292. [Google Scholar] [CrossRef]
  35. Sütçü, A.; Karagöz, Ü. The Influence of Process Parameters on the Surface Roughness in Aesthetic Machining of Wooden Edge-Glued Panels (EGPs). BioResources 2013, 8, 5435–5448. [Google Scholar] [CrossRef]
  36. Laina, R.; Sanz-Lobera, A.; Villasante, A.; López-Espí, P.; Martínez-Rojas, J.A.; Alpuente, J.; Sánchez-Montero, R.; Vignote, S. Effect of the Anatomical Structure, Wood Properties and Machining Conditions on Surface Roughness of Wood. Maderas Cienc. Tecnol. 2017, 19, 203–212. [Google Scholar] [CrossRef]
  37. Vančo, M.; Korčok, M.; Barcík, Š.; Koleda, P.; Gochev, Z.B. Analysis of Factors Effecting on Qualitative Parameters of Surface When Planar Milling Heat–Treated Oak Wood. Innov. Woodwork. Ind. Eng. Des. 2020, 18, 15–28. [Google Scholar]
  38. Pelit, H.; Korkmaz, M.; Budakçı, M. Surface Roughness of Thermally Treated Wood Cut with Different Parameters in CNC Router Machine. BioResources 2021, 16, 5133–5147. [Google Scholar] [CrossRef]
Figure 1. Machining on CNC: (a) workpiece mounted; (b) spiral-end mill T1; (c) straight-end mill T2.
Applsci 15 06975 g001
Figure 2. Experimental setup and output of the super surfacing process: (a) Marunaka New Royal 10 super surfacer; (b) 390 mm fixed shaving blade; (c) resulting wood shaving and processed surface.
Applsci 15 06975 g002
Figure 3. Experimental setup for roughness measurement: (a) Marsurf XT20 system; (b) measuring the sample surface across the grain.
Applsci 15 06975 g003
Figure 4. Comparative roughness profiles of shaved reference surfaces.
Applsci 15 06975 g004
Figure 5. Comparison between the primary profiles of milled surfaces for stepovers of 5, 7, 9 mm, at 1 mm cutting depth and those of the shaved surfaces: red—shaved surface, navy blue—stepover 5 mm, magenta—stepover 7 mm, light blue—stepover 9 mm; x-axis—profile length; y-axis—profile height.
Applsci 15 06975 g005
Figure 6. Comparative analysis of the core roughness (Rk) mean values for maple CNC-machined with T1 and T2, referenced to the values for the shaved surface (R). The values in brackets represent the cutting depth.
Applsci 15 06975 g006
Figure 7. Comparative roughness profiles for maple processed by the tools T1 and T2 at the cutting depth of 1 mm and reference profile: red—shaved surface, navy blue—stepover 5 mm, magenta—stepover 7 mm, and light blue—stepover 9 mm. For visualization clarity, each roughness profile is vertically offset relative to its own baseline; the vertical positioning does not reflect the absolute height differences between conditions.
Applsci 15 06975 g007
Figure 8. Comparative microscopic images of maple processed by T1 and T2 at the cutting depth of 1 mm and of the reference surface. Magnification 120×.
Applsci 15 06975 g008
Figure 9. Comparative micrographs of maple processed by T2 for 2 cutting depths and 3 stepover values. Magnification 120×; h represents cutting depth.
Applsci 15 06975 g009aApplsci 15 06975 g009b
Figure 10. Comparative micrographs of maple processed by T1 for 2 cutting depths and 3 stepover values. Magnification 120×; h represents cutting depth.
Applsci 15 06975 g010
Figure 11. Comparative analysis of the core roughness (Rk) mean values for oak CNC-machined with T1 and T2, referenced to that for the shaved surface (R). The values in brackets represent the cutting depth.
Applsci 15 06975 g011
Figure 12. Comparative roughness profiles for oak processed by the tools T1 and T2 at the cutting depth of 1 mm and reference profile: red—shaved surface, navy blue—stepover 5 mm, magenta—stepover 7 mm, and light blue—stepover 9 mm. For visualization clarity, each roughness profile is vertically offset relative to its own baseline; the vertical positioning does not reflect the absolute height differences between conditions.
Applsci 15 06975 g012
Figure 13. Comparative microscopic images of oak processed by T1 and T2 at the cutting depth of 1 mm and of the reference surface.
Applsci 15 06975 g013
Figure 14. Comparative micrographs of oak processed by T2, for 2 cutting depths and 3 stepover values. Magnification 120×; h represents cutting depth.
Applsci 15 06975 g014
Figure 15. Comparative micrographs of oak processed by T1, for 2 cutting depths and 3 stepover values. Magnification 120×; h represents cutting depth.
Applsci 15 06975 g015
Table 1. Machining parameters used for CNC face milling.
ParameterValue
Rotation speed15,000 rpm (constant)
Feed speed4 m/min (constant)
Depth of cut1 and 3 mm
Stepover5 mm, 7 mm, and 9 mm
Tool characteristicsT1: D = 10 mm, Z = 2 (helical), L = 70 mm, active L = 25 mm
T2: D = 10 mm, Z = 2 (straight), L = 70 mm, active L = 23 mm
Table 2. Mean roughness parameters of the reference surfaces processed by super surfacing (shaving) for maple and oak. All roughness values are in µm, and the values in brackets represent the standard deviation.
Reference SurfaceRaRkRpkRvkRk + RpkRv
Maple3.83 (0.11)6.16 (0.21)1.27 (0.09)16.21 (0.64)7.43 (0.66)45.79 (3.19)
Oak9.96 (1.83)6.46 (0.62)2.37 (1.44)63.36 (10.80)8.83 (11.75)165.04 (8.98)
Table 3. Mean values of the roughness parameters in µm measured for maple processed by the T1 and T2 tools and the super surfacer (R). In brackets, the stepover values in mm. The cutting depth is in mm.
Roughness Parameter Cutting Depth T1 (5)T1 (7)T1 (9)T2 (5)T2 (7)T2 (9)R
Ra1mean4.666.995.844.684.504.653.83
ST. DEV0.310.270.280.210.130.360.11
3mean4.514.254.834.035.726.553.83
ST. DEV0.130.170.520.070.510.400.11
Rk1mean12.3216.8615.199.399.269.276.16
ST. DEV0.871.360.360.390.611.030.21
3mean11.9510.9212.089.0310.4813.246.16
ST. DEV0.410.591.130.450.421.250.21
Rpk1mean5.828.517.424.055.869.611.27
ST. DEV0.340.740.490.460.380.870.09
3mean5.966.037.073.667.177.041.27
ST. DEV0.620.800.810.210.521.190.09
Rvk1mean13.0820.5924.3318.7416.0615.6516.21
ST. DEV2.021.402.601.330.241.440.64
3mean12.1411.5214.0214.9221.9923.8516.21
ST. DEV0.890.992.661.372.322.130.64
Rk + Rpk1mean18.1425.3822.6113.4315.1218.897.42
ST. DEV0.761.100.700.670.260.760.66
3mean17.9116.9519.1512.6917.6520.287.42
ST. DEV0.081.391.720.470.742.270.66
Rv 1mean59.5274.2757.2769.7763.2356.0945.79
ST. DEV19.4410.122.7711.607.143.303.19
3mean50.9343.7156.9757.3066.5076.7445.79
ST. DEV8.213.1122.9911.604.366.833.19
Table 4. Two-way ANOVA without replication for maple, at a stepover of 5 mm.
ANOVA
Source of VariationSSdfMSFp-ValueF crit
Rows0.06233830.0207790.0552780.9818193363.8625484
Columns32.53002310.8433428.846256.00666 × 10−53.8625484
Error3.38311190.375901
Total35.9754715
Table 5. Mean values of the roughness parameters in µm measured for oak processed by the T1 and T2 tools and the super surfacer (R). In brackets, the stepover values in mm. The cutting depth is in mm.
Roughness ParameterCutting Depth T1 (5)T1 (7)T1 (9)T2 (5)T2 (7)T2 (9)R
Ra1mean10.0115.2115.978.5019.0622.479.96
ST. DEV1.101.563.901.471.521.801.83
3mean12.0418.0417.9516.1819.6521.199.96
ST. DEV3.95184.002.361.493.763.121.83
Rk1mean13.5714.4914.7610.1012.9716.236.46
ST. DEV0.290.821.400.721.172.140.62
3mean16.3117.8317.8612.1414.3317.856.46
ST. DEV2.700.990.870.720.972.040.62
Rpk1mean9.177.4911.205.509.3918.142.37
ST. DEV0.891.103.460.312.769.251.44
3mean9.019.458.956.6013.276.952.37
ST. DEV1.181.420.920.799.370.851.44
Rvk1mean61.5296.06101.8564.10102.77108.5863.36
ST. DEV10.948.2516.9511.175.246.4010.80
3mean65.0291.6892.10103.53106.91104.1763.36
ST. DEV22.9910.059.837.1217.375.4010.80
Rk + Rpk1mean22.7421.9825.9615.6122.3534.378.83
ST. DEV0.931.683.860.582.609.451.90
3mean25.3227.2926.8218.7427.6024.808.83
ST. DEV3.041.880.781.3010.021.781.90
Rv1mean172.50252.21203.70173.00219.93264.37165.04
ST. DEV12.2233.74245.718.1622.5425.398.98
3mean171.69196.71191.80219.15225.89238.48165.04
ST. DEV21.318.168.2520.6925.8517.138.98
Table 6. Two-way ANOVA without replication for oak, with a stepover of 5 mm.
ANOVA
Source of VariationSSdfMSFp-ValueF crit
Rows4.82641631.6088050.708468010.57083963.862548
Columns81.74111327.2470411.998751980.00169323.862548
Error20.437492.270823
Total107.004915
Disclaimer/Publisher’s Note: The statements, opinions and data contained in all publications are solely those of the individual author(s) and contributor(s) and not of MDPI and/or the editor(s). MDPI and/or the editor(s) disclaim responsibility for any injury to people or property resulting from any ideas, methods, instructions or products referred to in the content.