1. Introduction
The frequency and intensity of extreme weather events have significantly increased over the last decade, with the National Oceanic and Atmospheric Administration reporting a more than twofold increase in number of billion-USD weather and climate disasters compared to that in the previous decade in the USA alone [
1]. One such event was Hurricane Ida in September 2021, which hit Louisiana, USA, and caused 902,000 customers to lose electricity. Even after 15 days of restoration efforts, more than 10% of customers were still without power. The state faced significant infrastructure damage, including approximately 30,000 poles, 36,000 spans of wire, and 6000 transformers affected [
2,
3]. These stypes of extreme weather events, exacerbated by climate change, are ever-increasing and pose severe threats to power networks. The cascading and widespread outages due to extreme weather events result in massive power outage costs. These costs become even more prominent when critical load points, such as hospitals, fire stations, data centers, etc., are affected.
Researchers have proposed various infrastructure hardening and operational management strategies to enhance the resilience of power systems against extreme weather events [
4,
5,
6,
7]. However, given the unpredictable nature of the intensity and frequency of such events, it is generally anticipated that power systems will inevitably be affected by these extremes, even after employing resilience enhancement methods. Consequently, it is a usual practice to prioritize resource allocation in the restoration of critical loads during these events. A wide range of research methods have been explored for restoring critical loads in extreme event situations. System planning measures, such as the installation of distributed energy resources (DER) and microgrid formation for supplying critical loads during extreme events, as well as operational strategies to minimize their adverse impacts, have received considerable attention [
8,
9]. The authors of References [
6,
10] utilize DER for the restoration of critical loads in a distribution system. A graph-theoretic framework is utilized in [
10] to determine the available path between the DER and the critical load to facilitate the fast restoration of critical loads. Reference [
6] formulates an optimization problem to minimize the critical load curtailment in a microgrid based on the penalty cost for the load curtailed. References [
11,
12] utilize electric vehicles (EV) as mobile energy storage to restore critical loads. In Reference [
11], EVs parked at residential and commercial parking lots are used as an energy storage source to form a microgrid to supply the critical loads, whereas Reference [
12] assesses the real-time traffic conditions and congestion following an extreme event to strategically plan the optimal routes for EV and repair crews to reach critical loads. Reference [
13] suggests a dynamic strategy for restoring priority loads, wherein the restoration plan is regularly updated on an hourly basis. This updating process takes into account the current demand of the load and the availability of resources, ensuring an efficient restoration process. References [
14,
15] propose an intentional islanding scheme in a reconfigurable distribution system to improve the resilience of critical loads. Reference [
16] presents a combination of long-term hardening measures and short-term operational measures to restore the supply to the critical loads. The section comprising the distribution systems consisting of priority loads is undergrounded before the event. Following the event, mobile generators are deployed to supply power to critical components within the system. References [
7,
17,
18] propose a targeted hardening of infrastructures based on the location of essential load points to enhance the resilience of power systems against disastrous events.
Various researchers have proposed several metrics to quantify resilience, but there is still no universally accepted standard. There remains an ongoing debate within the research community regarding the necessity of a one-size-fits-all approach, given that resilience requirements can vary significantly depending on the specific context [
19]. References [
20,
21] propose resilience metrics based on the concept of a resilience trapezoid. Reference [
22] utilizes metrics like outage duration and unserved energy demand to evaluate system resilience. Reference [
23] assesses system performance under severe weather conditions using indicators such as the number of branches out of service, loss of load probability, and expected demand not supplied. In Reference [
24], the authors quantify resilience in independent water–power networks based on the amount of power restored.
Despite significant studies by academic researchers, the power system utilities are reluctant to invest in enhancing system resilience. There are no regulatory requirements or financial benefits to motivate such investments. This is mostly due to the rarity of extreme events and a lack of comprehension of the worth of resilience-driven investments. However, with the increasing frequency and severity of extreme weather events over the past decade, there is growing recognition among regulatory and planning bodies of the need to invest in measures that mitigate the overall societal costs resulting from such disruptions. The cost of these outages becomes even more significant when critical loads are considered. It is, therefore, a prudent approach for the utilities to make resilience-driven investments, prioritizing the critical loads. Previous literature [
25,
26,
27] has analyzed the investment strategies focusing on improving the performance of critical loads during extreme events. However, it is also important for the utilities to assess how this prioritization affects the performance of less critical loads and the overall system before committing to investments. This paper evaluates both infrastructural hardening and operational investment strategies to bolster the resilience of a system in regards to the performance of critical and non-critical load points. This paper contributes a valuable framework that can support the development of a value-based resilience model for long-term system planning.
This work modifies and extends the distribution system resilience assessment framework presented in Reference [
28] by incorporating the consideration of the critical loads, a method which is applicable to the evaluation of various resilience-driven investments. A key contribution of this paper is the development of a mathematical model that estimates system repair time, while accounting for load criticality. The sequence in which damaged components are repaired is influenced by the priority of the loads, the interdependence among the outage components, and the availability of repair crews. Since critical loads typically receive higher restoration priority, all available resources are initially assigned to these loads before being distributed to non-critical types. This necessitates a separate evaluation of the restoration of critical and non-critical loads during extreme events. This paper systematically models all possible scenarios arising from the prioritization of critical loads and varying crew availability while also factoring in component interdependencies and formulates a relationship to determine system repair time.
Another significant contribution of this study is the introduction of new metrics designated as disconnected load point hours (DLH) and normalized DLH (NDLH) for evaluating distribution system resilience. Unlike conventional duration-based indices commonly used for resilience assessment, the DLH and NDLH metrics capture both the system’s vulnerabilities and its ability to withstand extreme weather events. Moreover, the paper evaluates the efficacy of various investment strategies to improve system resilience, with a particular focus on the performance of critical loads.
Another major contribution of this paper is the examination of how these resilience enhancement strategies impact the resilience metrics for the critical load points and the impact of critical load prioritization on the performance of the rest of the system. This analysis is important to ensure that utilities avoid over-investment in critical load resilience improvement, causing non-critical loads to remain at a constant disadvantage. Although the critical load demands prioritization, the rest of the system cannot be constantly ignored on the basis of socio-political reasons.
2. Resilience Assessment Framework Considering Critical Loads
This paper presents an evaluation framework that utilizes a sequential Monte Carlo simulation to assess the resilience of an active distribution system, considering the criticality of the loads.
Figure 1 provides a process map outlining the overall methodology. The first step involves modeling the distribution system, where each component under consideration is modeled using graph theory in MATLAB 2023a. The individual components in the network are modeled as nodes, and the connection between them as edges. Next, the methodology incorporates the modeling of an extreme event. Since a distribution system cannot be resilient against all types of extreme incidents, the evaluation must be tailored to a specific extreme event. To develop this methodology, the framework evaluates the system’s resilience in response to extreme wind conditions. The key input characteristics used in the model are wind speed and event duration, which are estimated from historical extreme wind data. The duration of a wind event is modeled using an exponential distribution, whereas wind speed for the duration of the event is modeled using a Weibull distribution.
The next step in the methodology, as shown in
Figure 1, involves assessing damage to the network components resulting from the wind event during each simulation iteration. The framework considers the structural fragility functions of the distribution poles and lines to evaluate their vulnerability to wind events, as given by Equations (1) and (2), respectively.
where
a = 0.0001, b = 0.0421, c = 8 × 10–12, and
d = 5.1 are empirically determined tuning parameters, as reported in Reference [
29], and
w represents the wind speed in km/h.
A depth-first search algorithm [
30] is employed to traverse the graph structure of the network and assess the damage status of each component. For each component, a uniformly distributed random number, r~U(0,1), is compared to the failure probability derived from its fragility function. If the failure probability exceeds the random number, the component is classified as failed. In the event of a pole failure, all adjacent lines connected to that pole are also considered failed to account for dependent failures. This consideration of dependent failure in the framework provides a realistic approach to the resilience evaluation. Following an extreme event, the network divides into multiple segments, each transitioning into one of three possible states: (i) a grid-connected state, (ii) an islanded microgrid state, or (iii) a failed state.
When an extreme event impacts the system and a portion of the network becomes isolated from the main grid, the DER management system within the microgrid takes over and supplies power to the connected loads. The DER considered in this study are wind turbine generators (WTGs) and battery energy storage (BESS) units. While conventional sources like diesel generators offer more dependable grid support during extreme events, the inclusion of WTGs and BESS in this analysis reflects the global shift toward low-carbon, sustainable energy solutions. This framework builds on the mixed-integer linear programming-based optimization model from Reference [
28] to include the critical loads in the microgrid operation. The model is developed to prioritize the supply of critical loads in a microgrid before supplying the remaining loads. The objective function of the optimization problem is to minimize the overall load curtailment in the microgrid, as defined in Equation (3). The constraint to the function in Equation (4) prioritizes the critical loads such that non-critical loads can only be supplied by the DER once all critical loads are supplied in the microgrid.
Critical load constraint:
where
ΩB is the set of all the buses in the microgrid,
LC is the load curtailment at
ith bus,
yj is the binary variable indicating whether non-critical load
j is connected to a supply 1 or curtailed 0,
zk is the binary variable indicating whether critical load
k is connected 0 or curtailed 1, and
nc is the number of critical loads in the microgrid. The DER is operated within the linearized AC power flow constraints in the microgrid [
6]. The SOC level and the charging and discharging efficiency of the BESS are also considered. The output power from a WTG is determined using the wind turbine power output relationship presented in Reference [
31]. The microgrids are dynamically updated at each simulation step, as component failures during the event and the restoration of outage components afterward lead to changes in their topology and operational conditions, as described in
Section 2.1.
2.1. Restoration of Critical and Non-Critical Loads
The restoration of outage components begins after the wind speeds drop to a safe level for outdoor repair work. It is the usual practice to restore the critical loads before restoring the non-critical loads. The restoration methodology presented in this paper extends the hierarchical restoration model proposed in Reference [
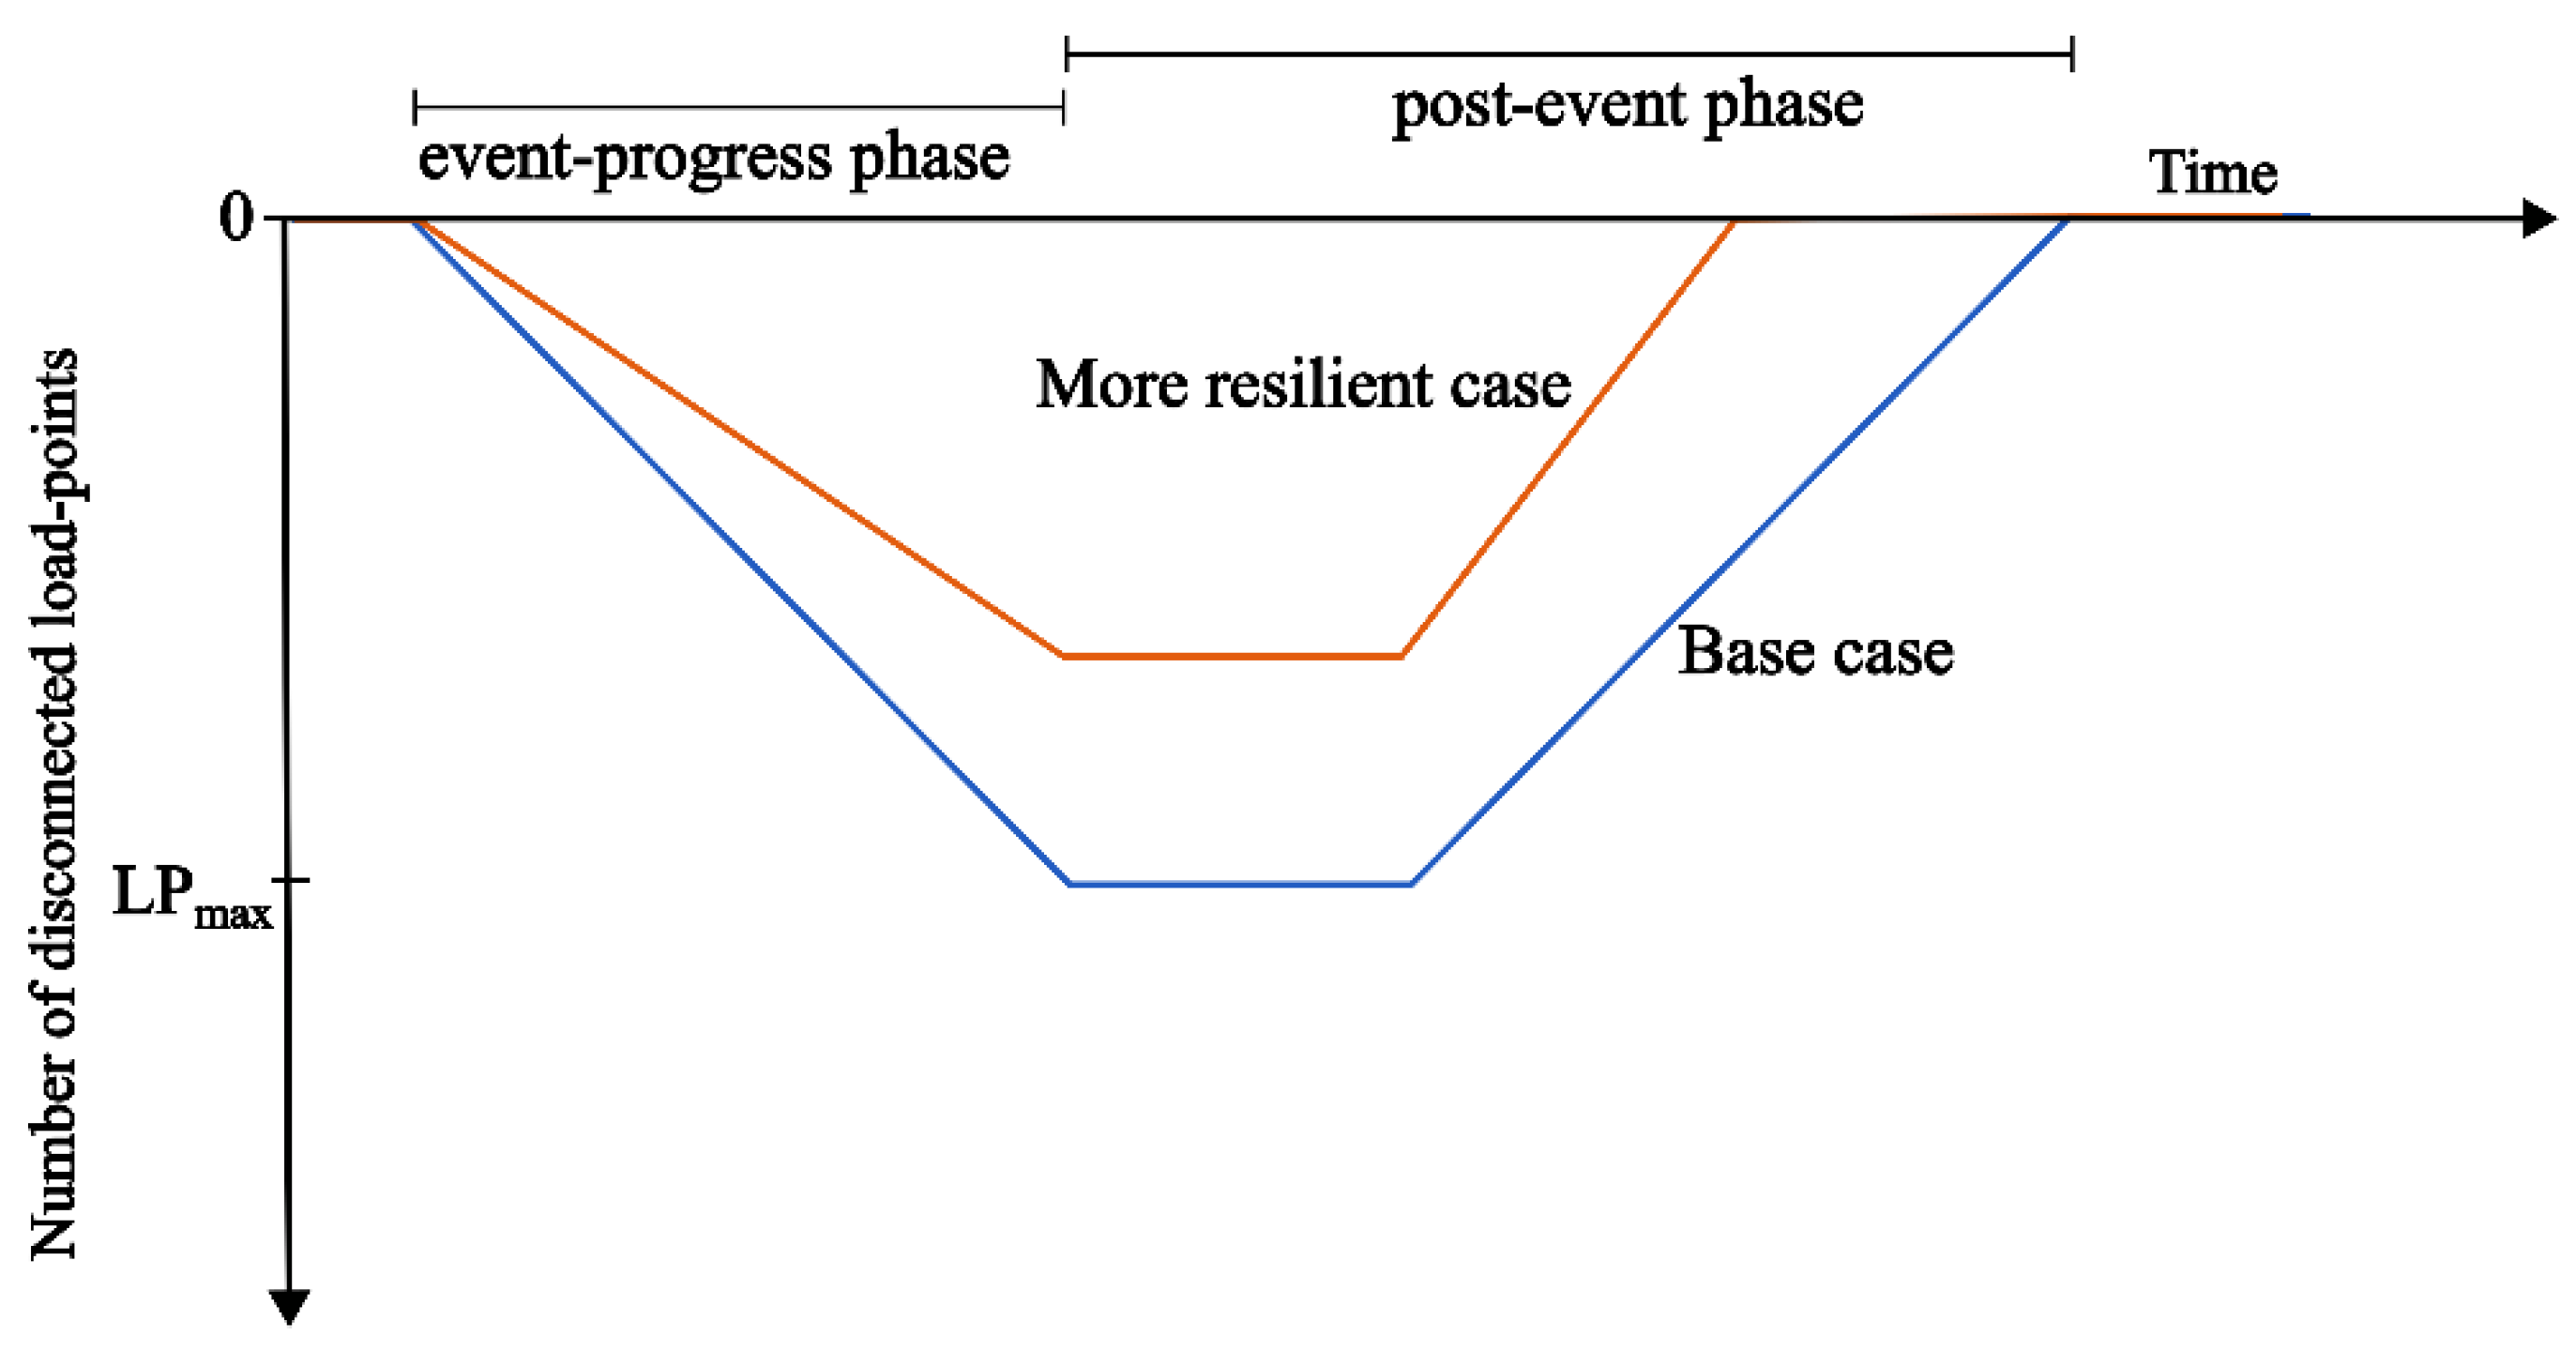
28] by prioritizing the critical loads, while recognizing the dependent repair events in assessing the overall restoration time. The restoration time depends on the number of failed components and the sequence of component repair. The component repair sequence further depends on the interdependency of the failed components and the number of available repair crews. Failed components are restored either sequentially or simultaneously, depending on whether they result from dependent or independent outages, respectively. The hierarchy-based load repair model assigns component outages resulting from dependent faults to separate repair hierarchies and addresses them sequentially. In contrast, components that have failed independently are grouped within the same hierarchy, enabling simultaneous repairs. It is assumed that each outage task is assigned to a single crew unit consisting of a few repair personnel, required equipment, and necessary replacement components. This model optimizes the repair process to restore power to affected customers as quickly as possible, aiming to minimize the number of disconnected load points at each simulation step. The outage components are evaluated based on their ability to reconnect the maximum number of system elements upon repair. The component with the highest restoration impact is assigned the highest priority. This process is iteratively applied to establish an optimal repair priority order for both critical and non-critical loads. The resilience trapezoid in
Figure 2 illustrates how system performance changes in regards to time chronology during the event-progress phase and the post-event phase. As the event unfolds, load points begin disconnecting and reach their maximum status at the end of the event-progress phase. During the post-event phase, restoration strategies are employed to swiftly reconnect disconnected load points. The total restoration time can be calculated using Equations (5)–(11), considering a combination of four possible repair scenarios resulting from load prioritization.
Equations (5) and (6) represent the condition where the number of available repair crews, denoted as
Ncr, is fewer than both the critical outage tasks
Ncl and the non-critical outage tasks
Nncl. The repair time for each set of outage components can be calculated using Equation (5), with the total repair time being the sum of both repair times, as outlined in Equation (6).
where
x represents the set of loads (either critical or non-critical),
is the time to repair a component within an outage task assigned to crew
j and has a dependent hierarchy
h, and
m is the number of dependent repair hierarchy tasks within an outage task. (
Npr)
x gives the permutations of the task sequences for the respective sets and is determined as
and
.
Equations (7) and (8) evaluate the repair time when the number of crew members exceeds the number of critical outage tasks but is still fewer than the total outage tasks. Initially, each critical outage task is assigned to a crew unit. At this condition, a number of non-critical outage tasks can also be addressed simultaneously alongside the critical components by some of the surplus crew units. Once the critical outage tasks are completed, the entire repair crew is redirected to restore the remaining non-critical outage tasks.
where
is the number of non-critical outage components that remain to be repaired by the time that all critical outage tasks are repaired and
=
.
The scenario in which the number of available crews is fewer than the critical outage tasks but greater than the non-critical outage tasks is represented by Equations (9) and (10). Since critical loads receive repair priority, they are addressed sequentially due to crew limitations, with their repair time calculated by Equation (9). Once the critical outage tasks are completed, the non-critical outages can be repaired simultaneously, as outlined in Equation (10).
Equation (11) represents a scenario in which the number of repair crews exceeds the total number of critical and non-critical outage tasks such that all repairs can be performed simultaneously. Since all tasks can be addressed at once, the critical load priority becomes irrelevant.
2.2. Resilience Metrics for Performance Evaluation
The MCS framework chronologically simulates the system performance to determine the critical and non-critical load point indices and the system indices. The expected outage duration (EOD) is the measurement of the duration of the outage that a customer can expect, given that the system succumbed to an extreme event, and is calculated at each load point using Equation (12). The load point EOD for the critical and non-critical loads is then obtained using Equations (13) and (14), respectively, by grouping the respective
EODlp. The system EOD is obtained from Equation (15).
where
is the number of simulations in which a outage occurs at the load point.
The expected energy not supplied (EENS) is the expected energy curtailed due to an extreme event. This index can be calculated at each load point using Equation (16) and can be aggregated using Equation (17) to obtain the system index. The EENS for critical and non-critical loads is obtained from Equations (18) and (19).
where
ENSlp is the energy not supplied for a load point. The EENS index is useful to convert the impact of extreme events into monetary value to determine the system outage cost. However, unlike EOD, the system EENS cannot be used to compare different systems unless it is normalized by the system capacity.
This work proposes two new resilience measurement metrics, DLH and NDLH. The DLH is the expected sum of the outage durations at all the load points, considering all probable durations and the intensity of extreme weather events. The DLH is a system index, and it considers the fact that the system does not succumb to all of the events and therefore, incorporates the system’s ability to withstand them. The DLH index captures the total number of customer-hours impacted by an outage, making it a particularly important metric for system operators. It quantifies overall system impact by capturing both the scale and duration of disruptions and serves as a valuable input for estimating economic losses, assessing customer-hour losses. DLH is calculated by Equation (20).
where
ODlp is the outage duration of a load point,
Nsim is the total number of simulated event scenarios, and
Nlp is the number of load points.
The NDLH is the expected outage duration per load point and is obtained from Equation (21) by dividing the DLH by the total number of load points in the system. It should be noted that NDLH and system-EOD both measure the average outage duration per load point per extreme event. The difference, however, is that EOD only considers the extreme events that cause outages, whereas NDLH considers the likelihood of all extreme events and the ability of the system infrastructure to withstand the events.
The relevance and effectiveness of these resilience metrics are demonstrated through a series of case studies that assess system performance under different investment strategies.
The overall simulation is repeated until the stopping criterion is met. This paper uses the convergence of the mean estimate of the load point EOD values as the stopping criterion with a threshold of . Equations (22)–(24) determine the stopping criterion. The running mean of the load point EOD at all the load points in the network is calculated using Equation (22) after every simulation. The deviation in from its value in the previous simulation is then obtained from Equation (23). Equation (24) is used to determine whether the maximum deviation, among all the load points, meets the stopping threshold. In order to avoid premature convergence, the stopping criteria must be met for 14 consecutive iterations before the simulation is considered to be converged.
Running mean after
k simulation for a load point
lp:Change in mean for load point
lp:Stopping criterion:
where
k* is first simulation for which the stopping criteria are met. If the criterion is not true for any of the subsequent 14 simulations, then
k* is reset.
3. Investigation of Resilience Investment Strategies
The framework outlined in
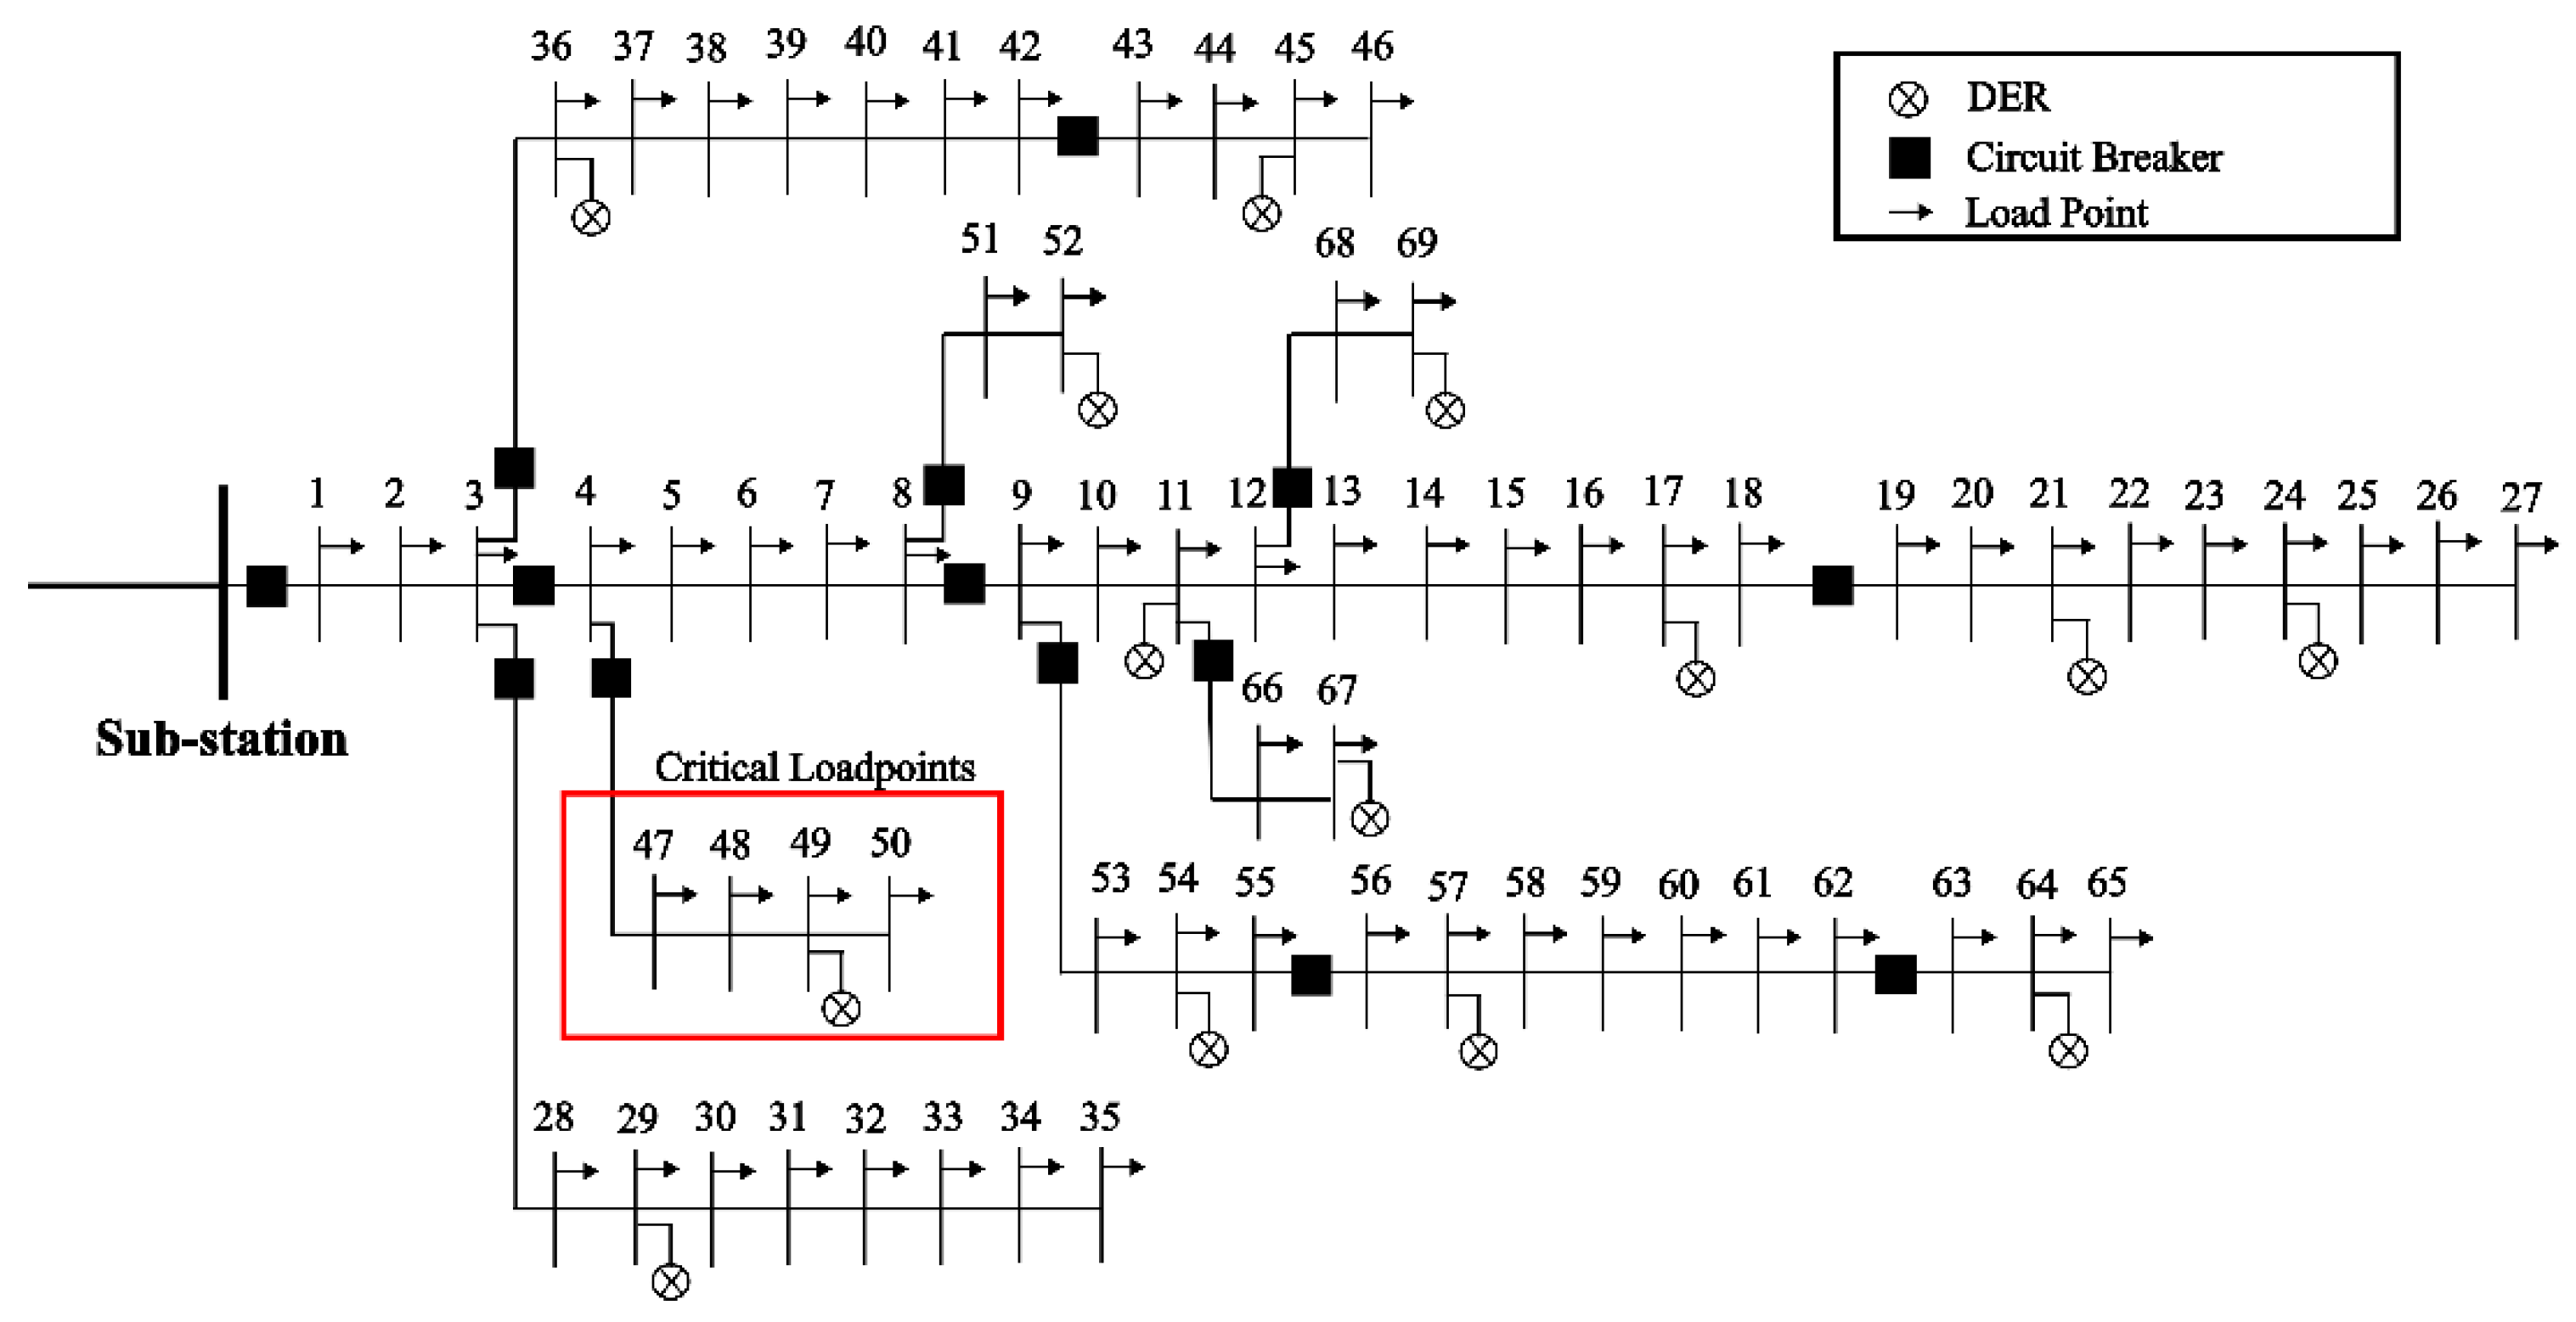
Section 2 is employed to investigate the resilience of a test distribution system and to consider various investment strategies to enhance system resilience, with a focus on the importance of critical loads. A modified IEEE 69-bus test system incorporating DER, as illustrated in
Figure 3 [
32], serves as the base case for this study. Each DER in
Figure 3 consists of a WTG and a BES. The system displays a total active and reactive load of 2.71 MW and 1.86 MVAR, respectively, operating at a nominal voltage of 12.66 kV. The critical loads, located between bus 47 and bus 50, account for 0.262 MW and 0.187 MVAR.
The system integrates WTGs and BESS to facilitate microgrid operations. The DER ratings for the base case are provided in the
Appendix A. The WTGs operate with cut-in, rated, and cut-off wind speeds of 11 km/h, 50 km/h, and 96 km/h, respectively, and are deactivated during extreme wind events for safety considerations. The pre-warning of the extreme weather event allows the operators to set the initial state of charge (SOC) of the BESS at 95%, with a charging and discharging efficiency of 0.95. The extreme wind conditions are modeled as described in
Section 2 using historical wind data from the Atlantic Region [
33]. For the base case, a repair priority framework ensures that critical loads are restored before non-critical loads. The repair time is obtained following one of the scenarios outlined in
Section 2. Within each category of critical and non-critical loads, the repair process is optimized to reconnect the maximum number of affected customers to the power supply as efficiently as possible in subsequent evaluation periods.
This paper analyzes three distinct resilience enhancement strategies: infrastructure hardening, DER management, and repair management. Within each of the strategies, a number of case studies are performed to study the resiliency of the distribution system in the presence of critical and non-critical loads.
3.1. Infrastructure Hardening
Infrastructure hardening is a long-term strategy that involves replacing or reinforcing weaker infrastructure with more robust alternatives. While this approach can be effective, it requires substantial initial investment. As strategic hardening of selective sections can enhance system resilience at reduced costs, this study considers three hardening cases:
- Case 1.
undergrounding the network section that supplies power to the critical loads from bus 47 to bus 60.
- Case 2.
undergrounding the network section which forms a part of the main feeder from bus 1 to bus 8.
- Case 3.
replacing overhead distribution assets with a 30% robust infrastructure as an alternative investment to undergrounding.
Cases 1 and 2 include a similar number of assets, requiring similar investment costs, thereby allowing for comparative cost/benefit analysis without requiring detailed cost calculations. Case 3 involves system-wide asset replacement and warrants further evaluation to enable a more accurate comparison. The results from these studies are compared to those for the base case in
Figure 4,
Figure 5,
Figure 6,
Figure 7 and
Figure 8.
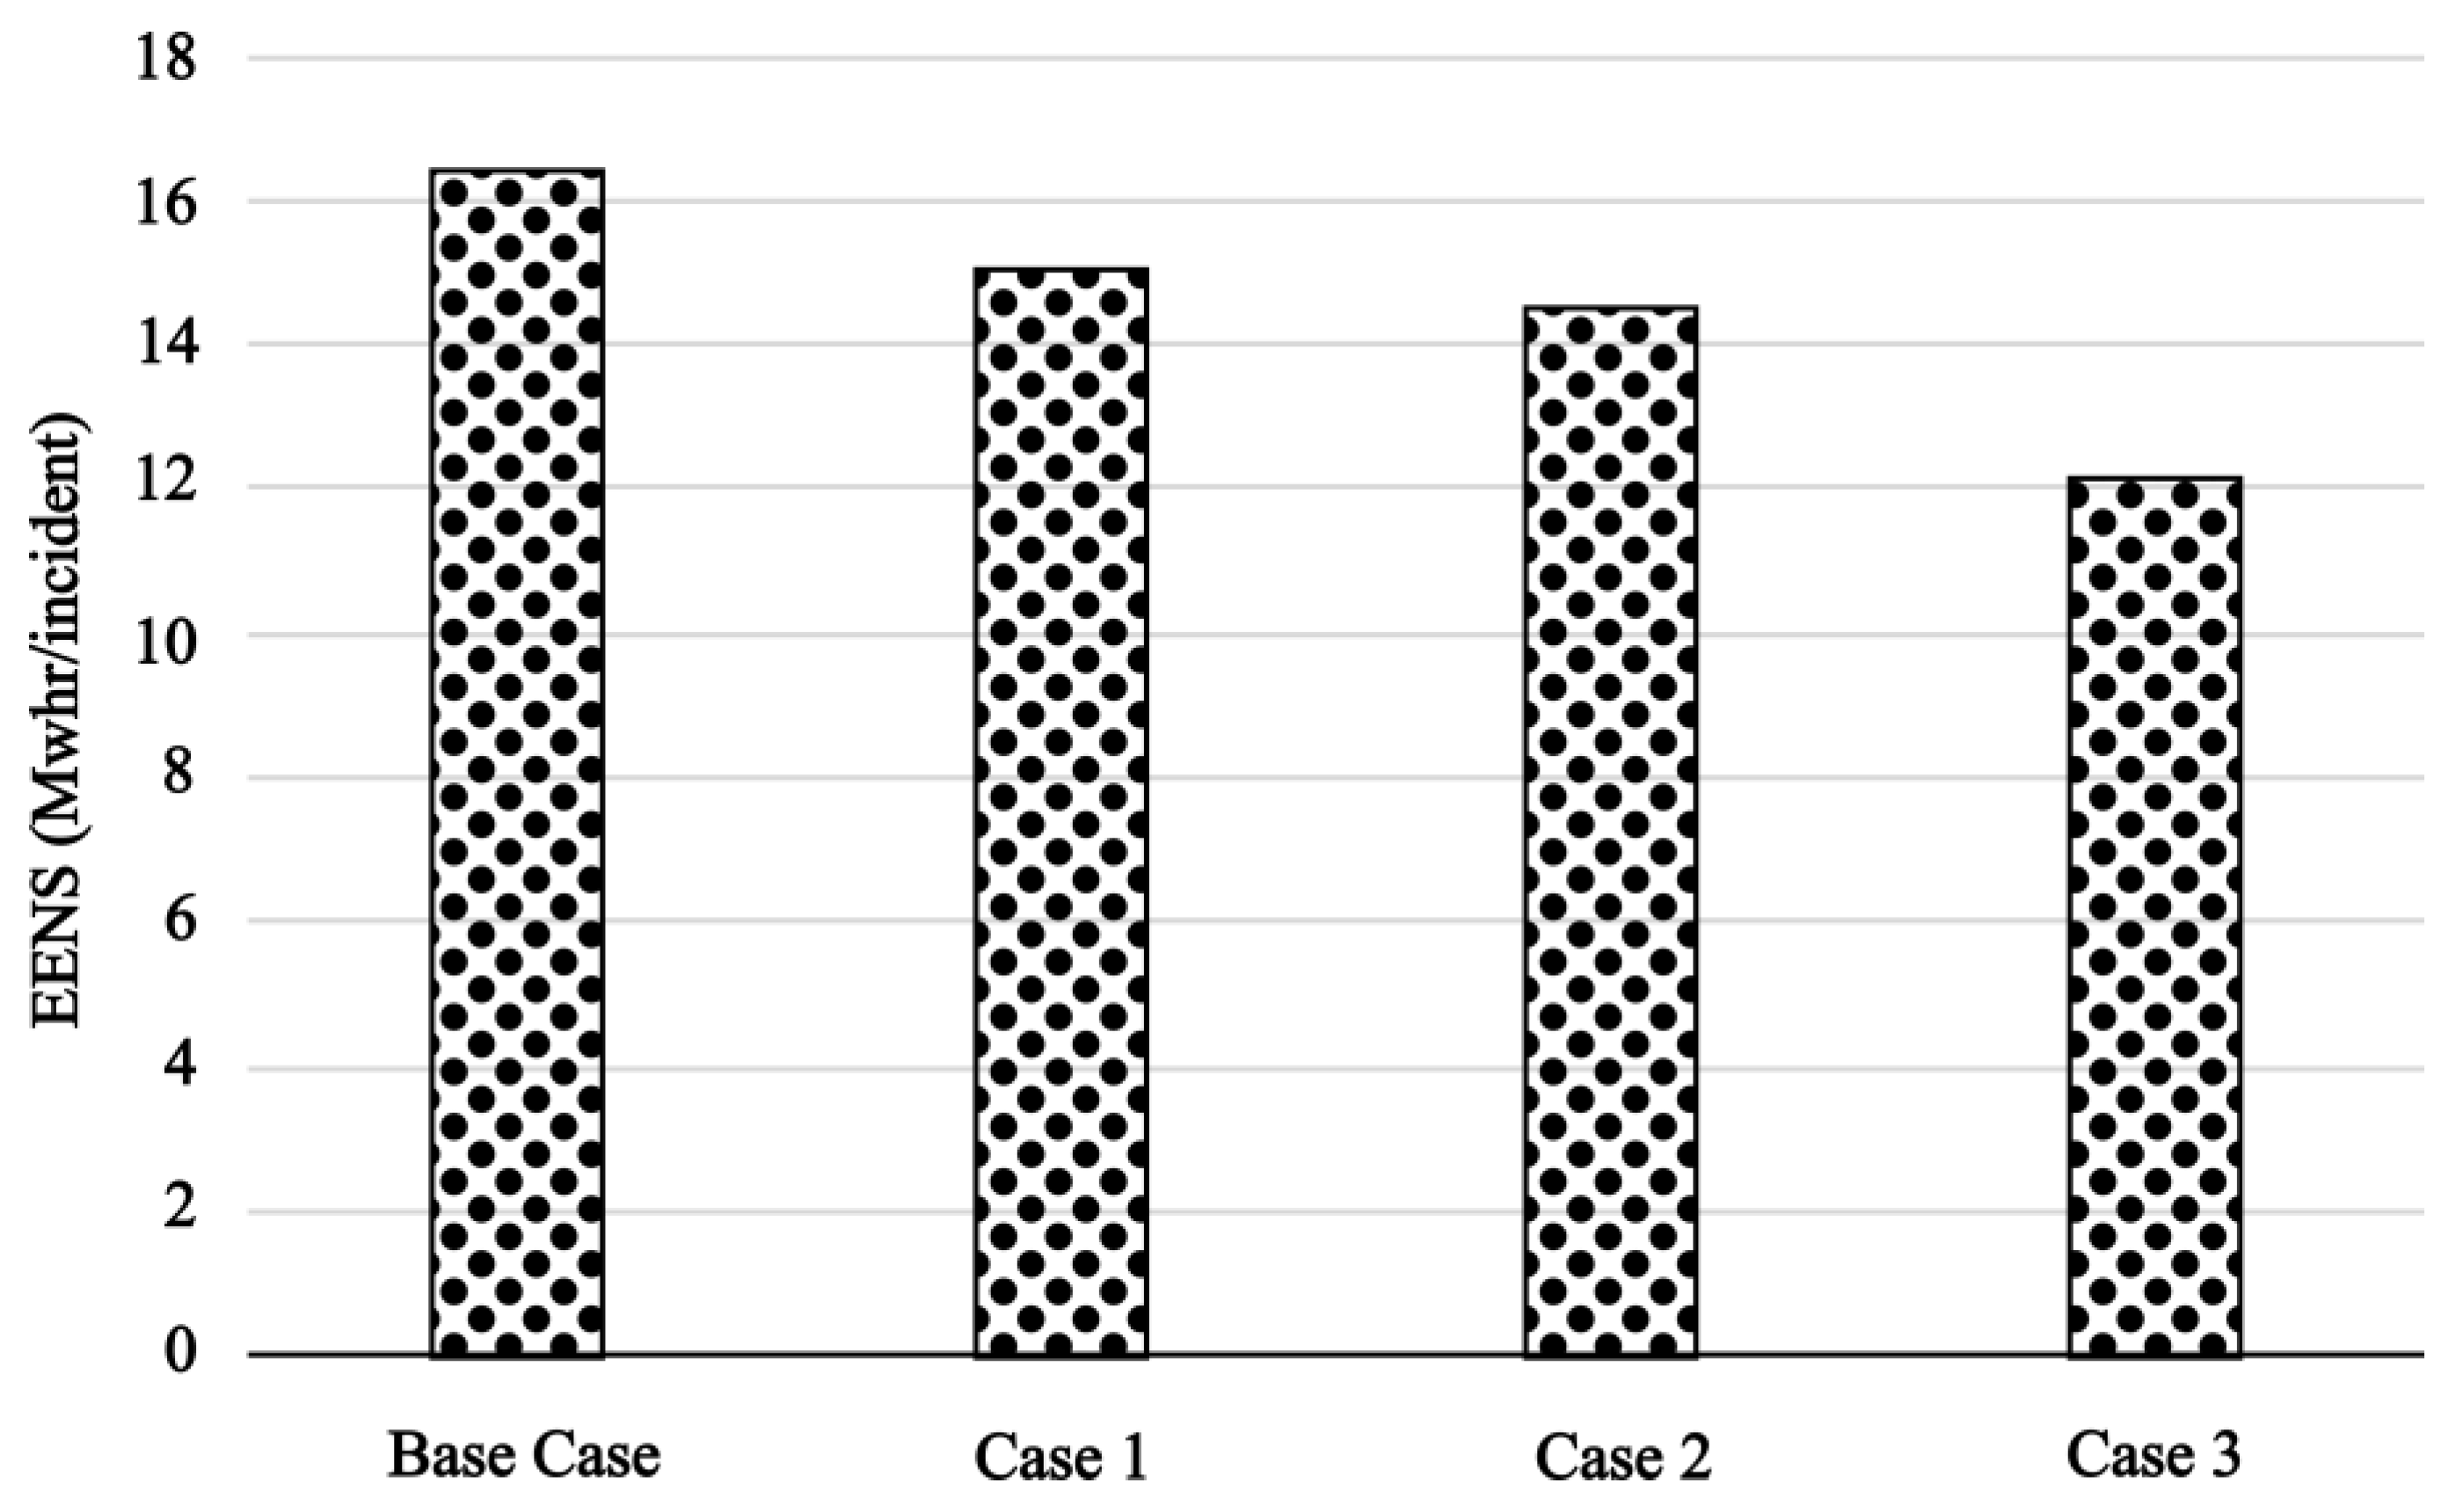
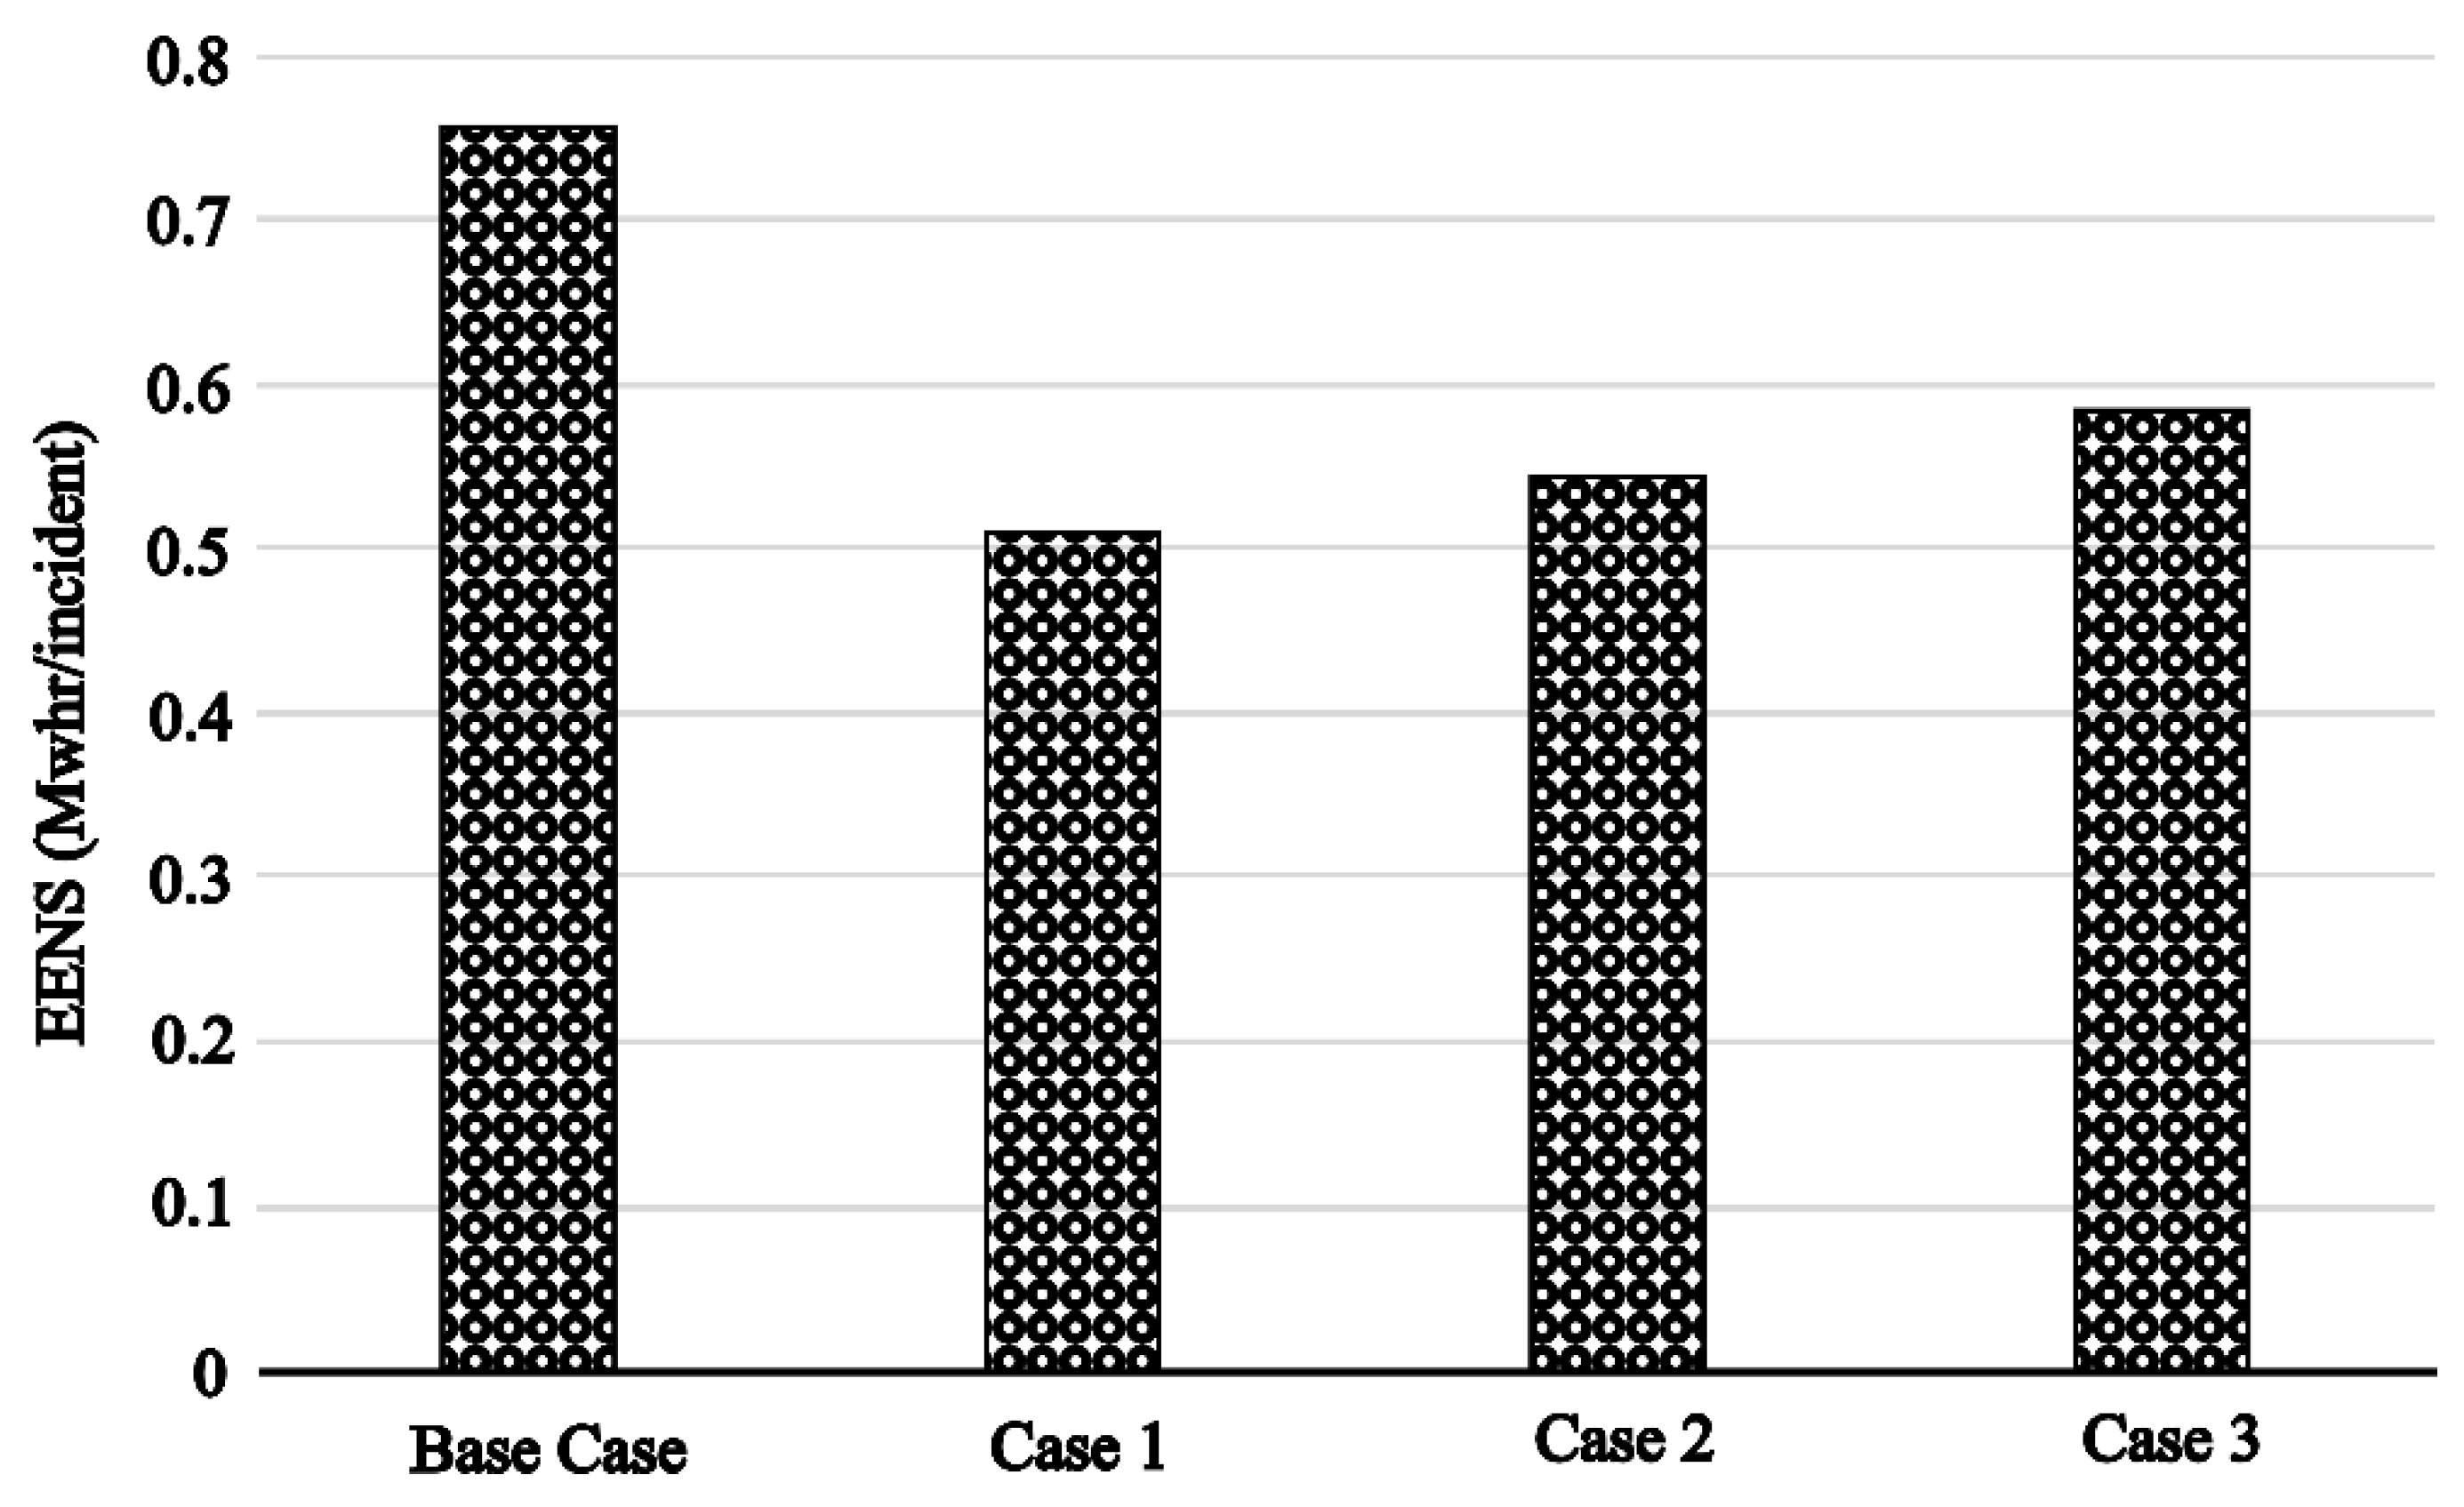
Figure 4 shows that the system EENS is reduced, and therefore, the system resilience is improved for all three cases of investment in infrastructure hardening. Case 3, in which the entire infrastructure is hardened, shows the greatest improvement,. Although the improvement from Case 2 is less than that of Case 3, the improvement is still quite significant and only requires hardening part of the system. The improvement in Case 2 was due to the strategic decision to harden the main feeder supplying the overall system. Case 1 results in the lowest improvement among the three cases, although the investment cost is comparable to that in Case 2. Case 1, however, significantly reduces the EENS of the critical loads from the base case, as shown in
Figure 5. The reduction in EENS for critical loads in Cases 2 and 3 is less significant compared to the improvement observed in Case 1. The enhancements in system performance for critical loads are highly valuable, since the outages of critical loads result in relatively high outage costs.
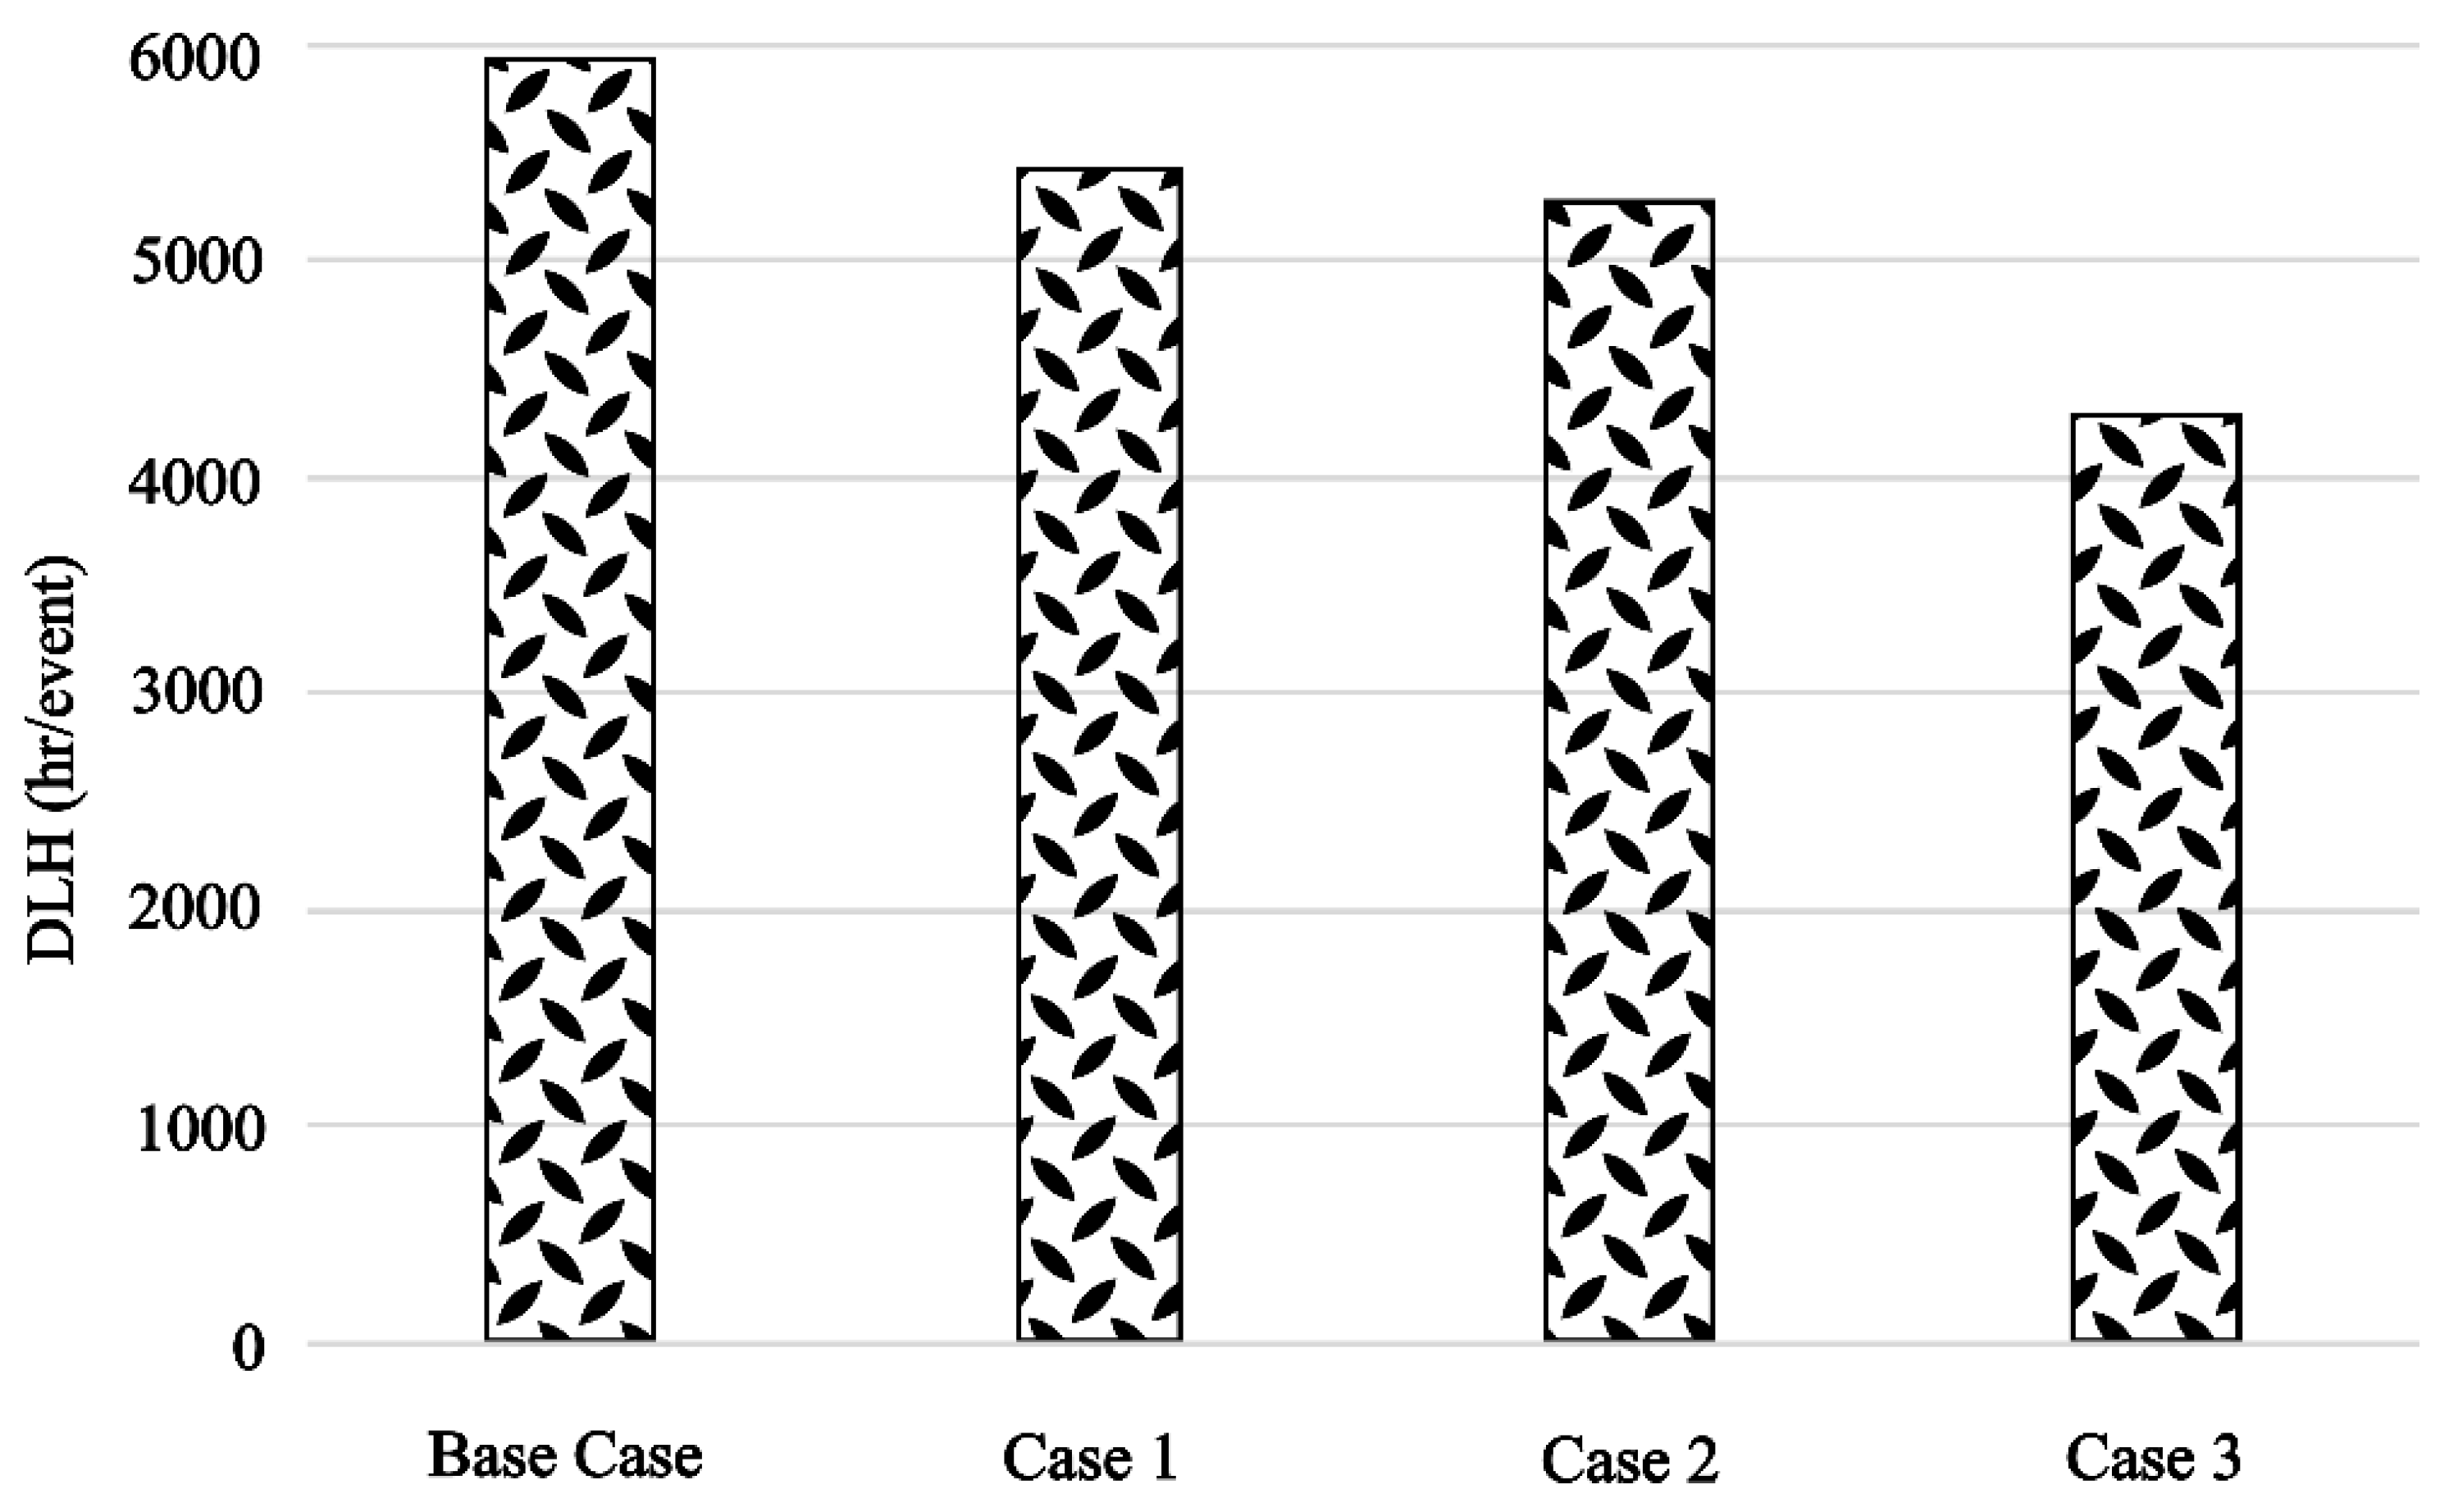
Figure 6 illustrates the DLH values for each of the hardening strategies relative to the base case, showing a similar pattern of resilience improvement consistent with the EENS metric.
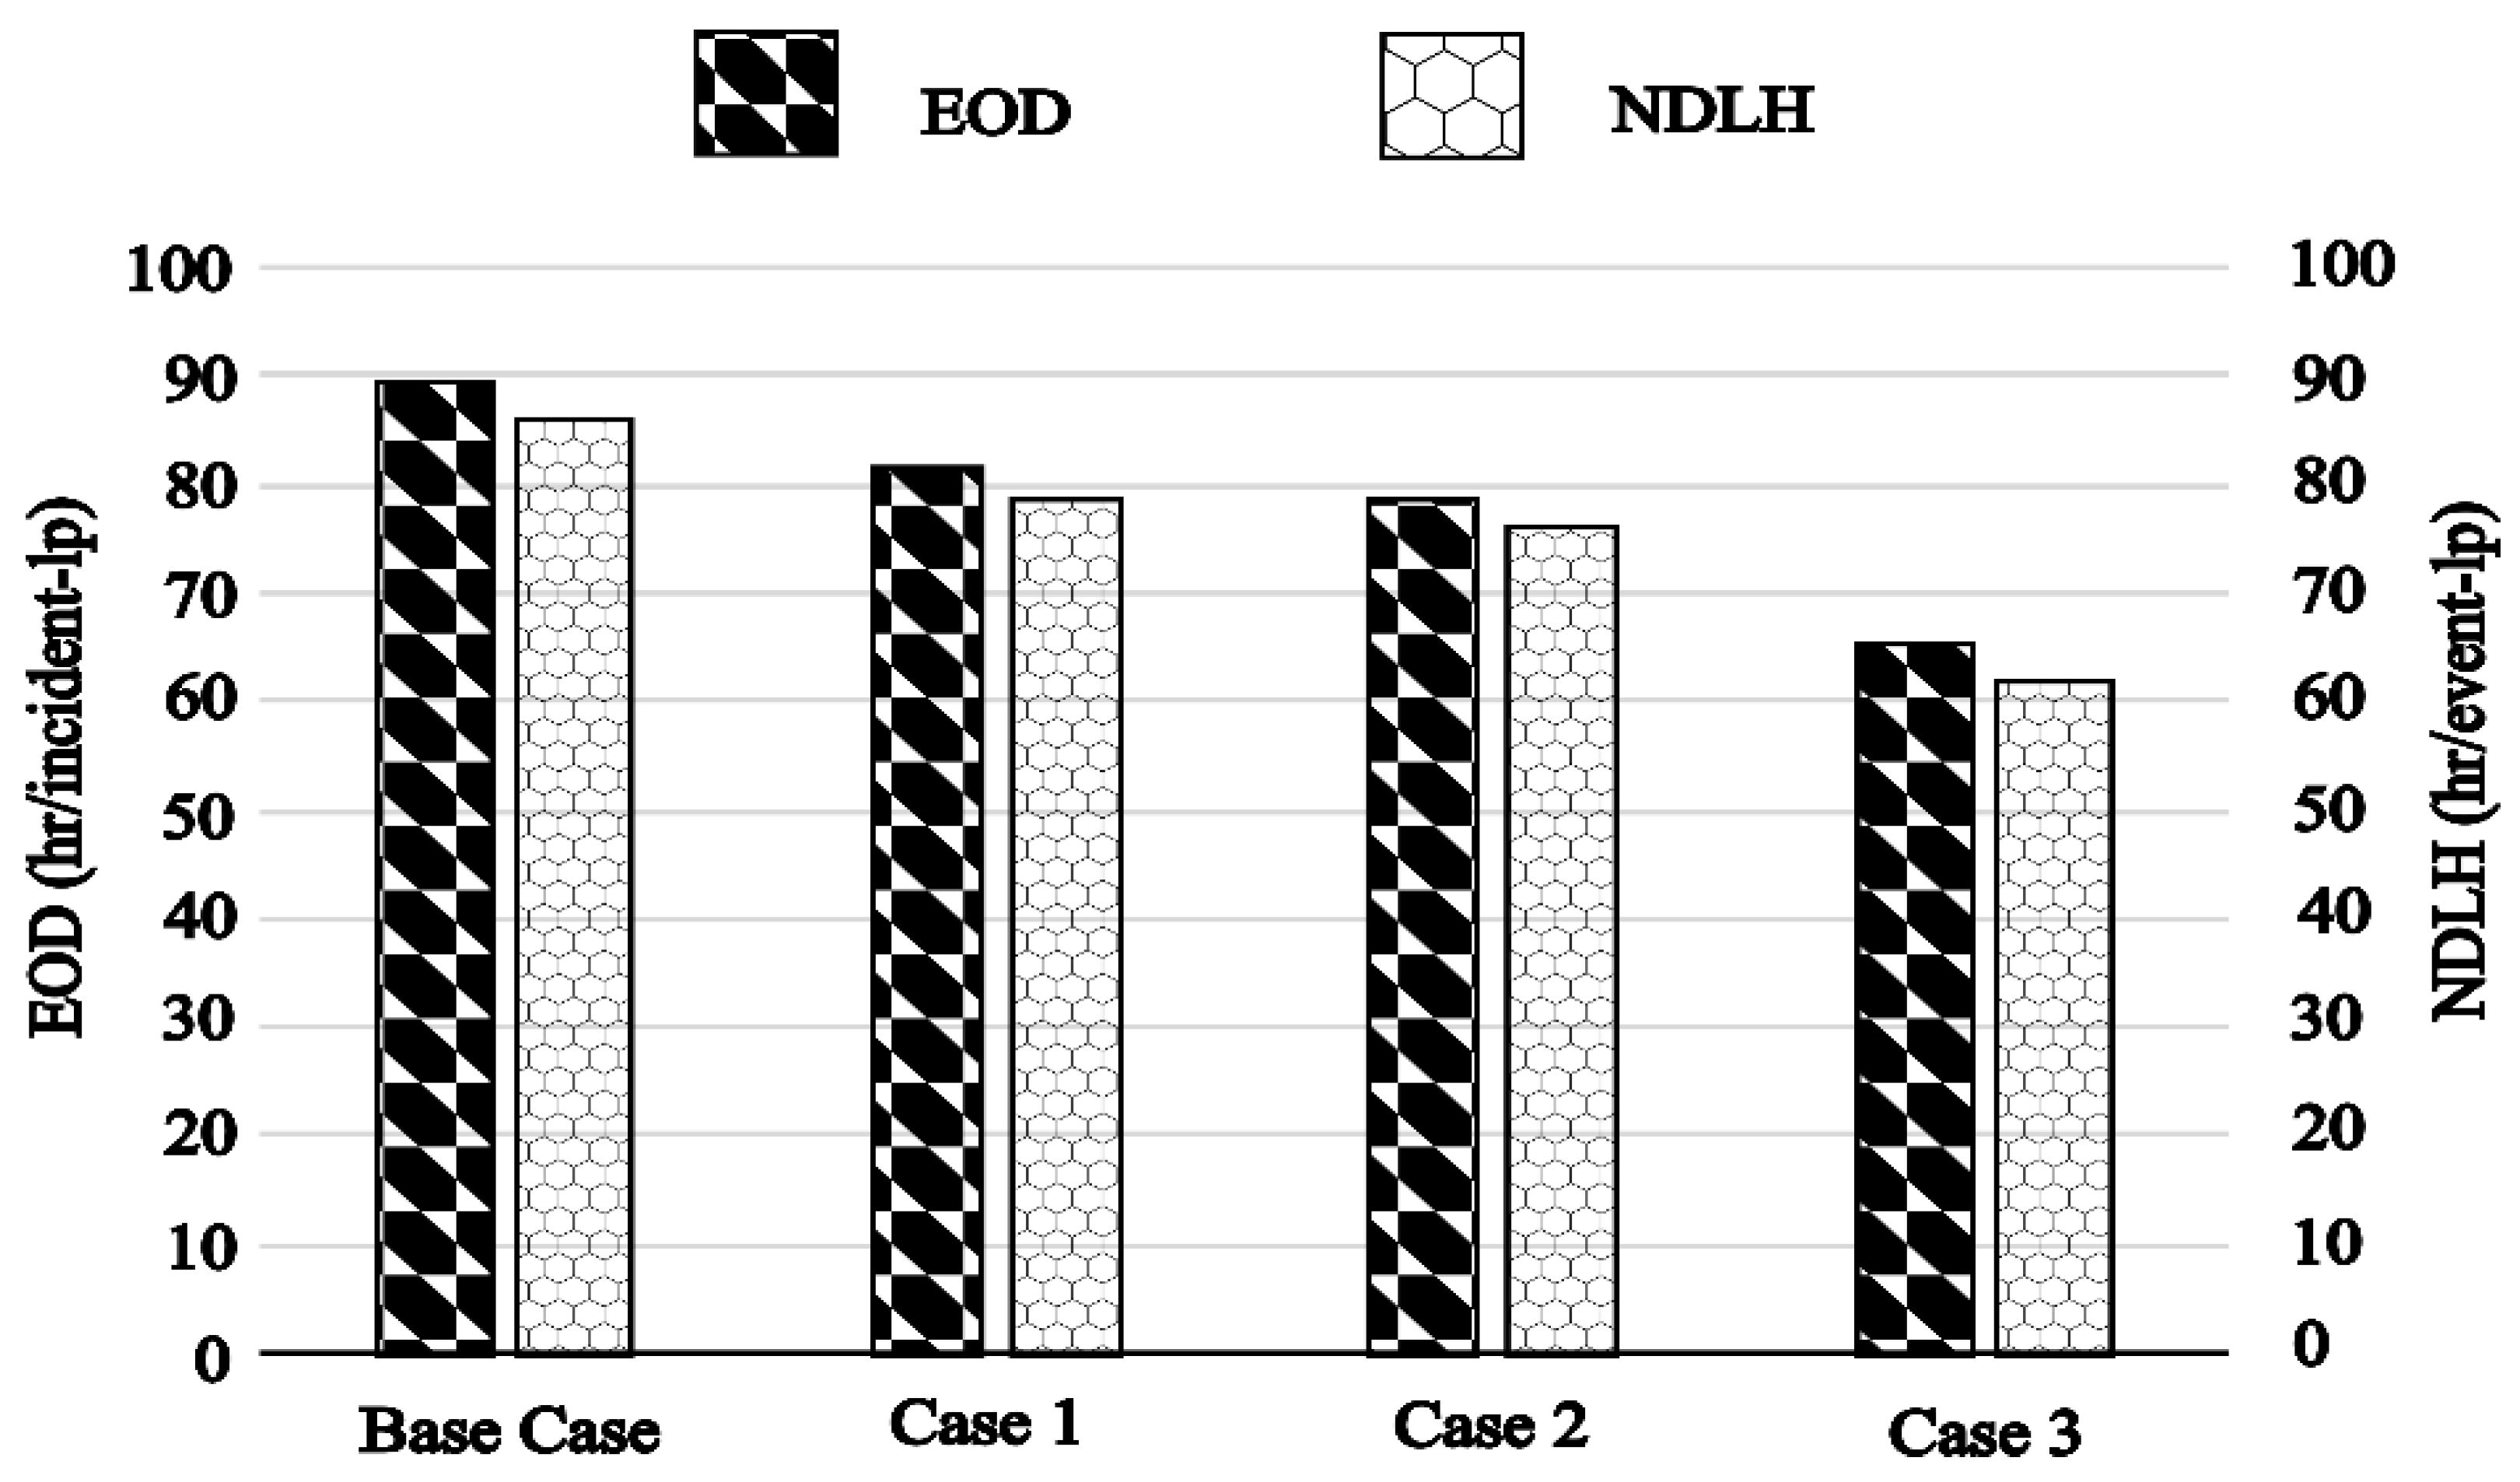
Figure 7 compares the system EOD and the NDLH indices for the above case studies. It can be noted that the value of NDLH is less than that of the EOD. The difference indicates the resilience of the infrastructure to withstand the extreme events. It should be noted that the difference increases as system hardening rises. This highlights the effectiveness of the NDLH metric in capturing both the system’s resilience and its vulnerability, unlike that noted for the EOD metric. The comparison of the three hardening cases with the base case using these two indices shows similar results to those obtained from the EENS index. The results for both the duration and energy metrics exhibit similar trends, although this correlation may not always hold true. In this study, the observed similarity can be attributed to the uniform load distribution and the specific topology of the network.
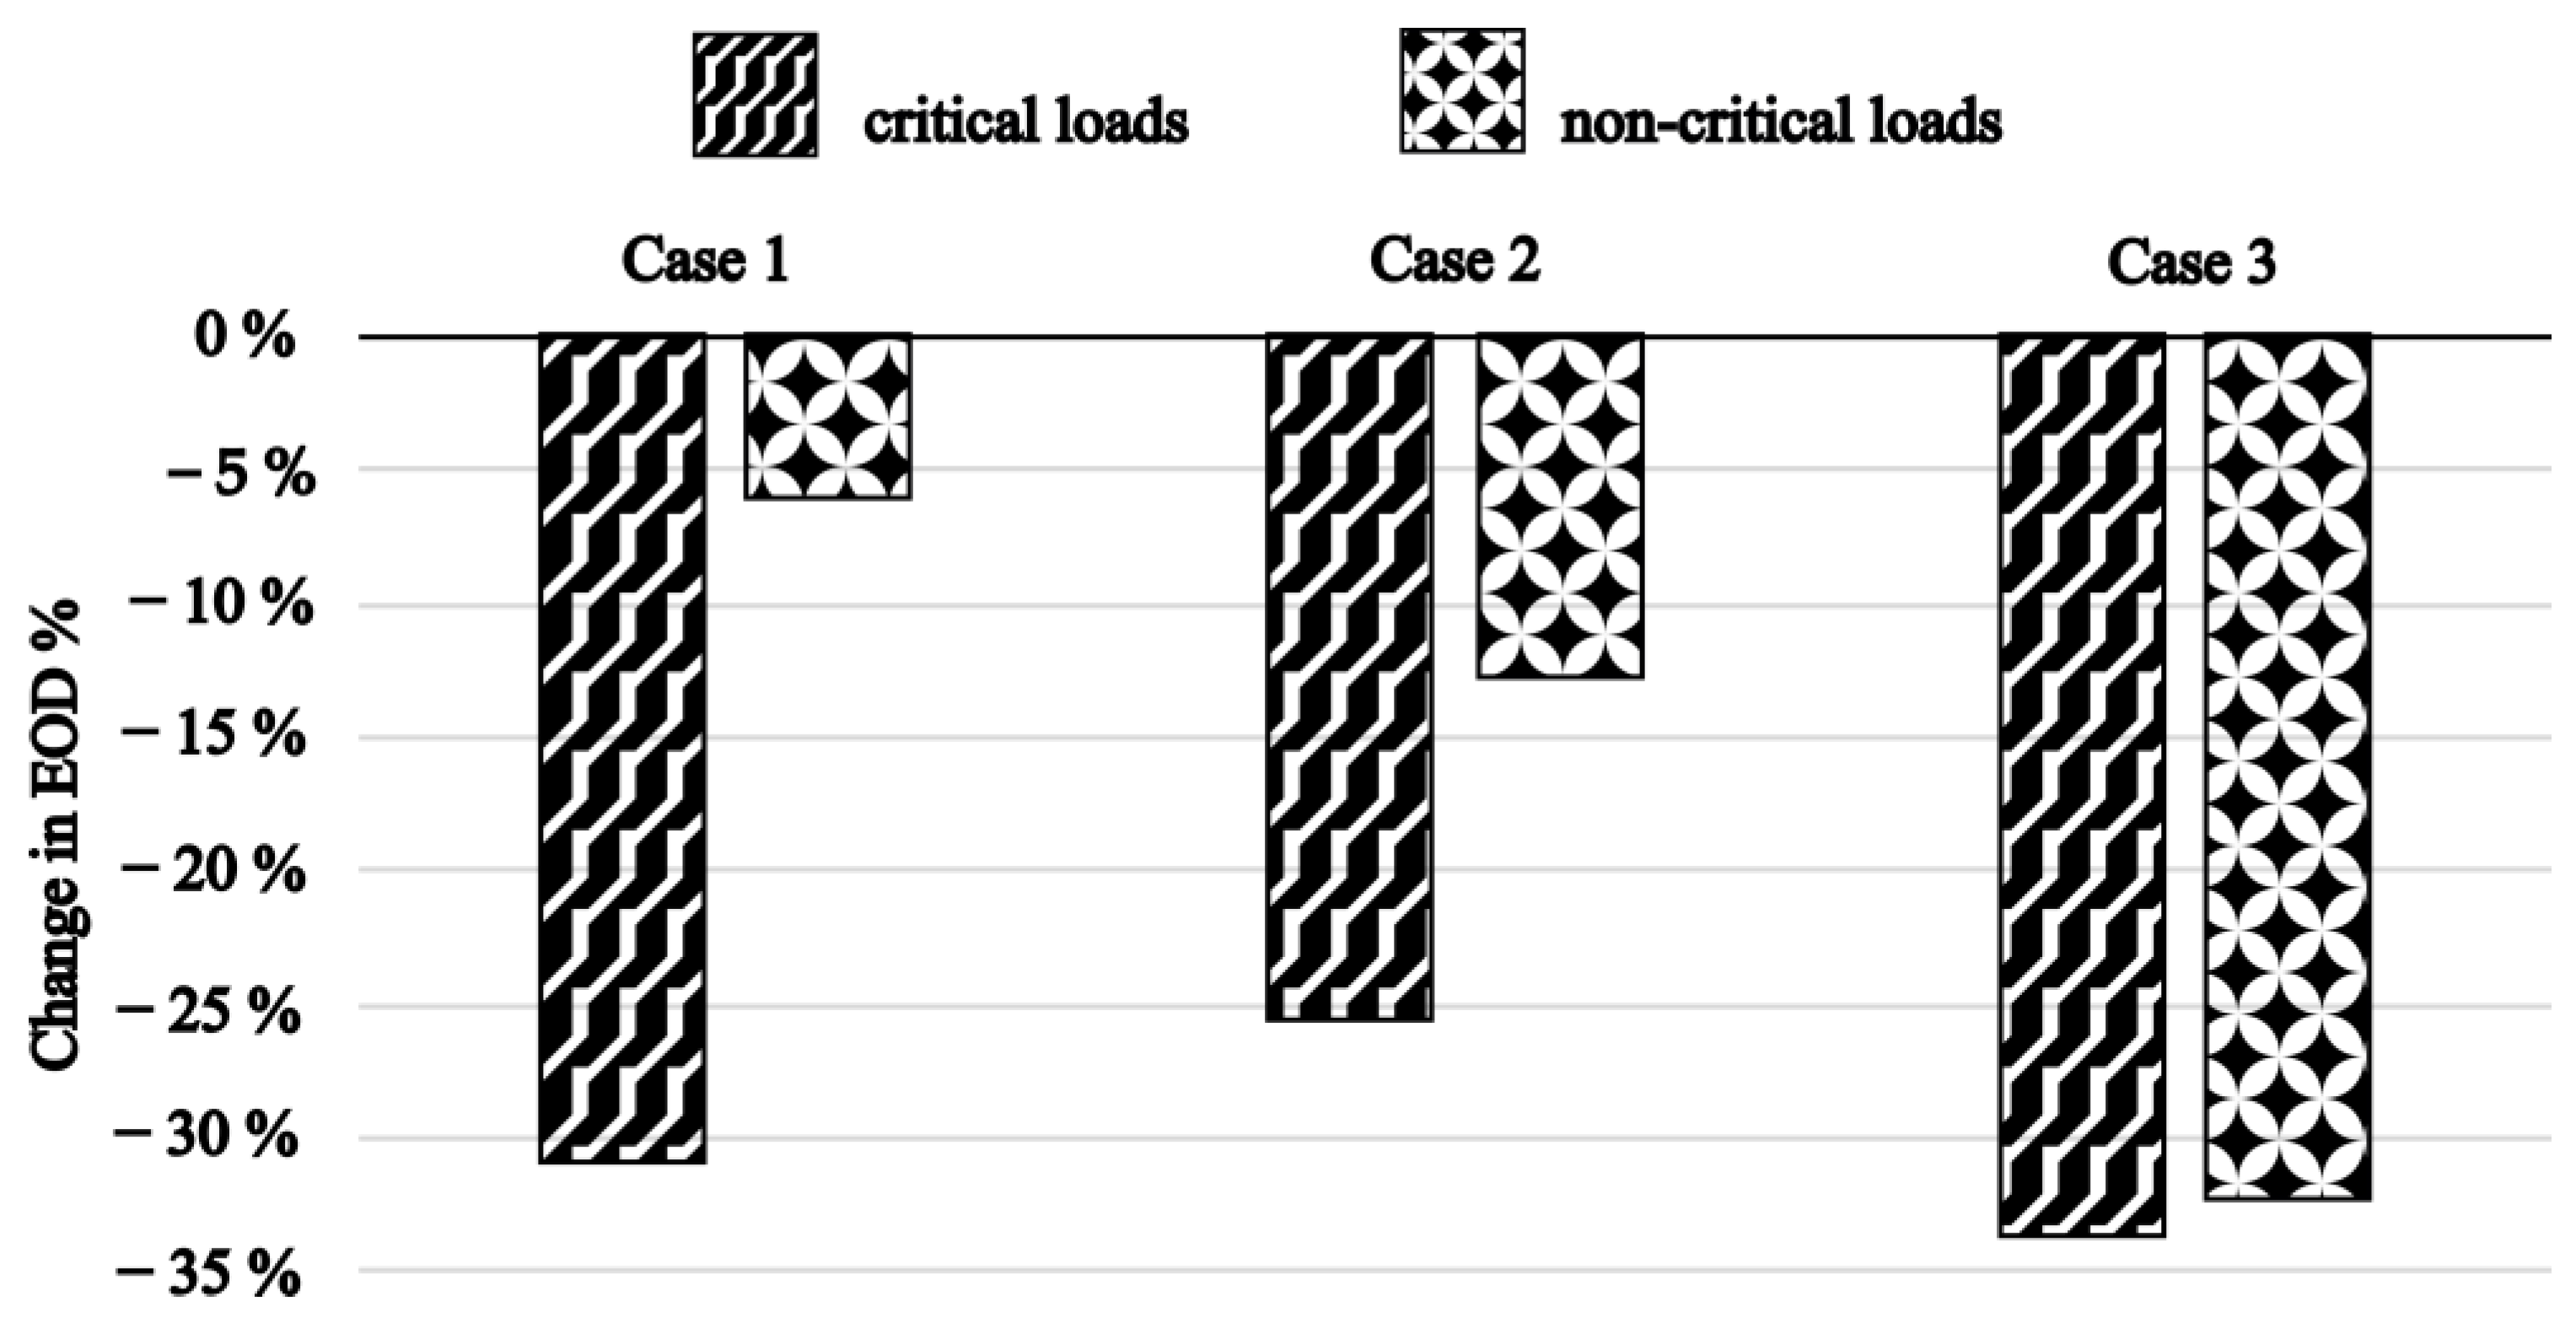
Figure 8 illustrates the percentage change in EOD from the base case when the performance of critical and non-critical loads is analyzed separately for each of the hardening strategies. As anticipated, hardening the critical sections in Case 1 results in a substantial 30.9% reduction in EOD for critical loads compared to the results for the base case. Interestingly, this strategy also yields a 5.9% improvement in EOD for non-critical loads, despite no direct hardening applied to those sections. This improvement is primarily due to the modified repair prioritization. The critical components, which were given the highest priority, are no longer in need of repair, allowing for faster restoration of non-critical segments. In Case 2, the targeted hardening of a main feeder leads to a significant 12.7% reduction in EOD for non-critical loads relative to the results for the base case. However, this comes at the expense of critical load performance, with only a 25.60% reduction in EOD from that of the base case. Case 3 shows a more uniform impact on EOD for both sets of loads. The EOD for the critical loads set decreases by 33.7%, whereas for non-critical loads, it decreases by 32.3% from the results for the base case.
3.2. DER Management
DER management is a long-term investment strategy that is applied shortly before or during an event. This study explores the following two cases of DER management:
- Case 4.
Doubling of DER capacity (both WTGs and BESS) at each point throughout the network.
- Case 5.
Case 4 + Case 1, i.e., a hybrid investment approach.
Table 1 shows the EENS obtained from the study for the overall system and for the critical loads. A comparison of Case 4 with the base case shows that even with doubling the investment in DER capacity across the network, the resulting improvement in resilience metrics is modest. The overall system EENS decreases by 2.08%, and the reduction for critical loads is 5.68%. A major limitation of DER-based investments lies in their reliance on the integrity of the infrastructure that connects the DERs to the loads. If this infrastructure succumbs to an extreme event, the effectiveness of DERs in enhancing resilience diminishes.
To overcome this limitation, Case 5 explores a hybrid investment strategy. This yields a significant improvement in resilience, as seen in
Table 1. The overall system EENS decreases by 11.07% and by 43.87% for critical loads compared to the results for the base case.
Table 1 includes the results from Case 1, as DER investment in Case 5 is made to the system hardened in Case 1. The table shows that the hybrid strategy in Case 5 yields only a 2.82% reduction in system EENS, which is still minimal, when compared to the infrastructure hardening scenario in Case 1. However, the EENS for the critical loads experiences a substantial reduction of 17.25%, highlighting the effectiveness of the hybrid approach in significantly improving resilience for critical segments of the network.
Table 2 presents the EOD and NDLH values for the base case, Case 4, and Case 5. Both metrics show improvement with increased investment, following a trend similar to that observed for EENS. Case 5, in particular, demonstrates a notable enhancement in system performance as a result of the hybrid investment strategy. An important observation is that the gap between EOD and NDLH widens with higher levels of investment. The difference between these two metrics increases from 3.98% in Case 4 to 6.04% in Case 5. This growing gap highlights the increasing relevance of the NDLH index as system resilience investments become more substantial.
3.3. Repair Management
Repair management is a short-term resilience-enhancement strategy that involves optimizing repair prioritization and workforce allocation. This study examines the following three distinct repair management approaches:
- Case 6.
Tripling the number of repair crews compared to the base case.
- Case 7.
Assuming an unlimited number of repair crews are available. To realize the scenario, the number of repair crews increased by 3000 times.
- Case 8.
Not considering the criticality of the loads during restoration.
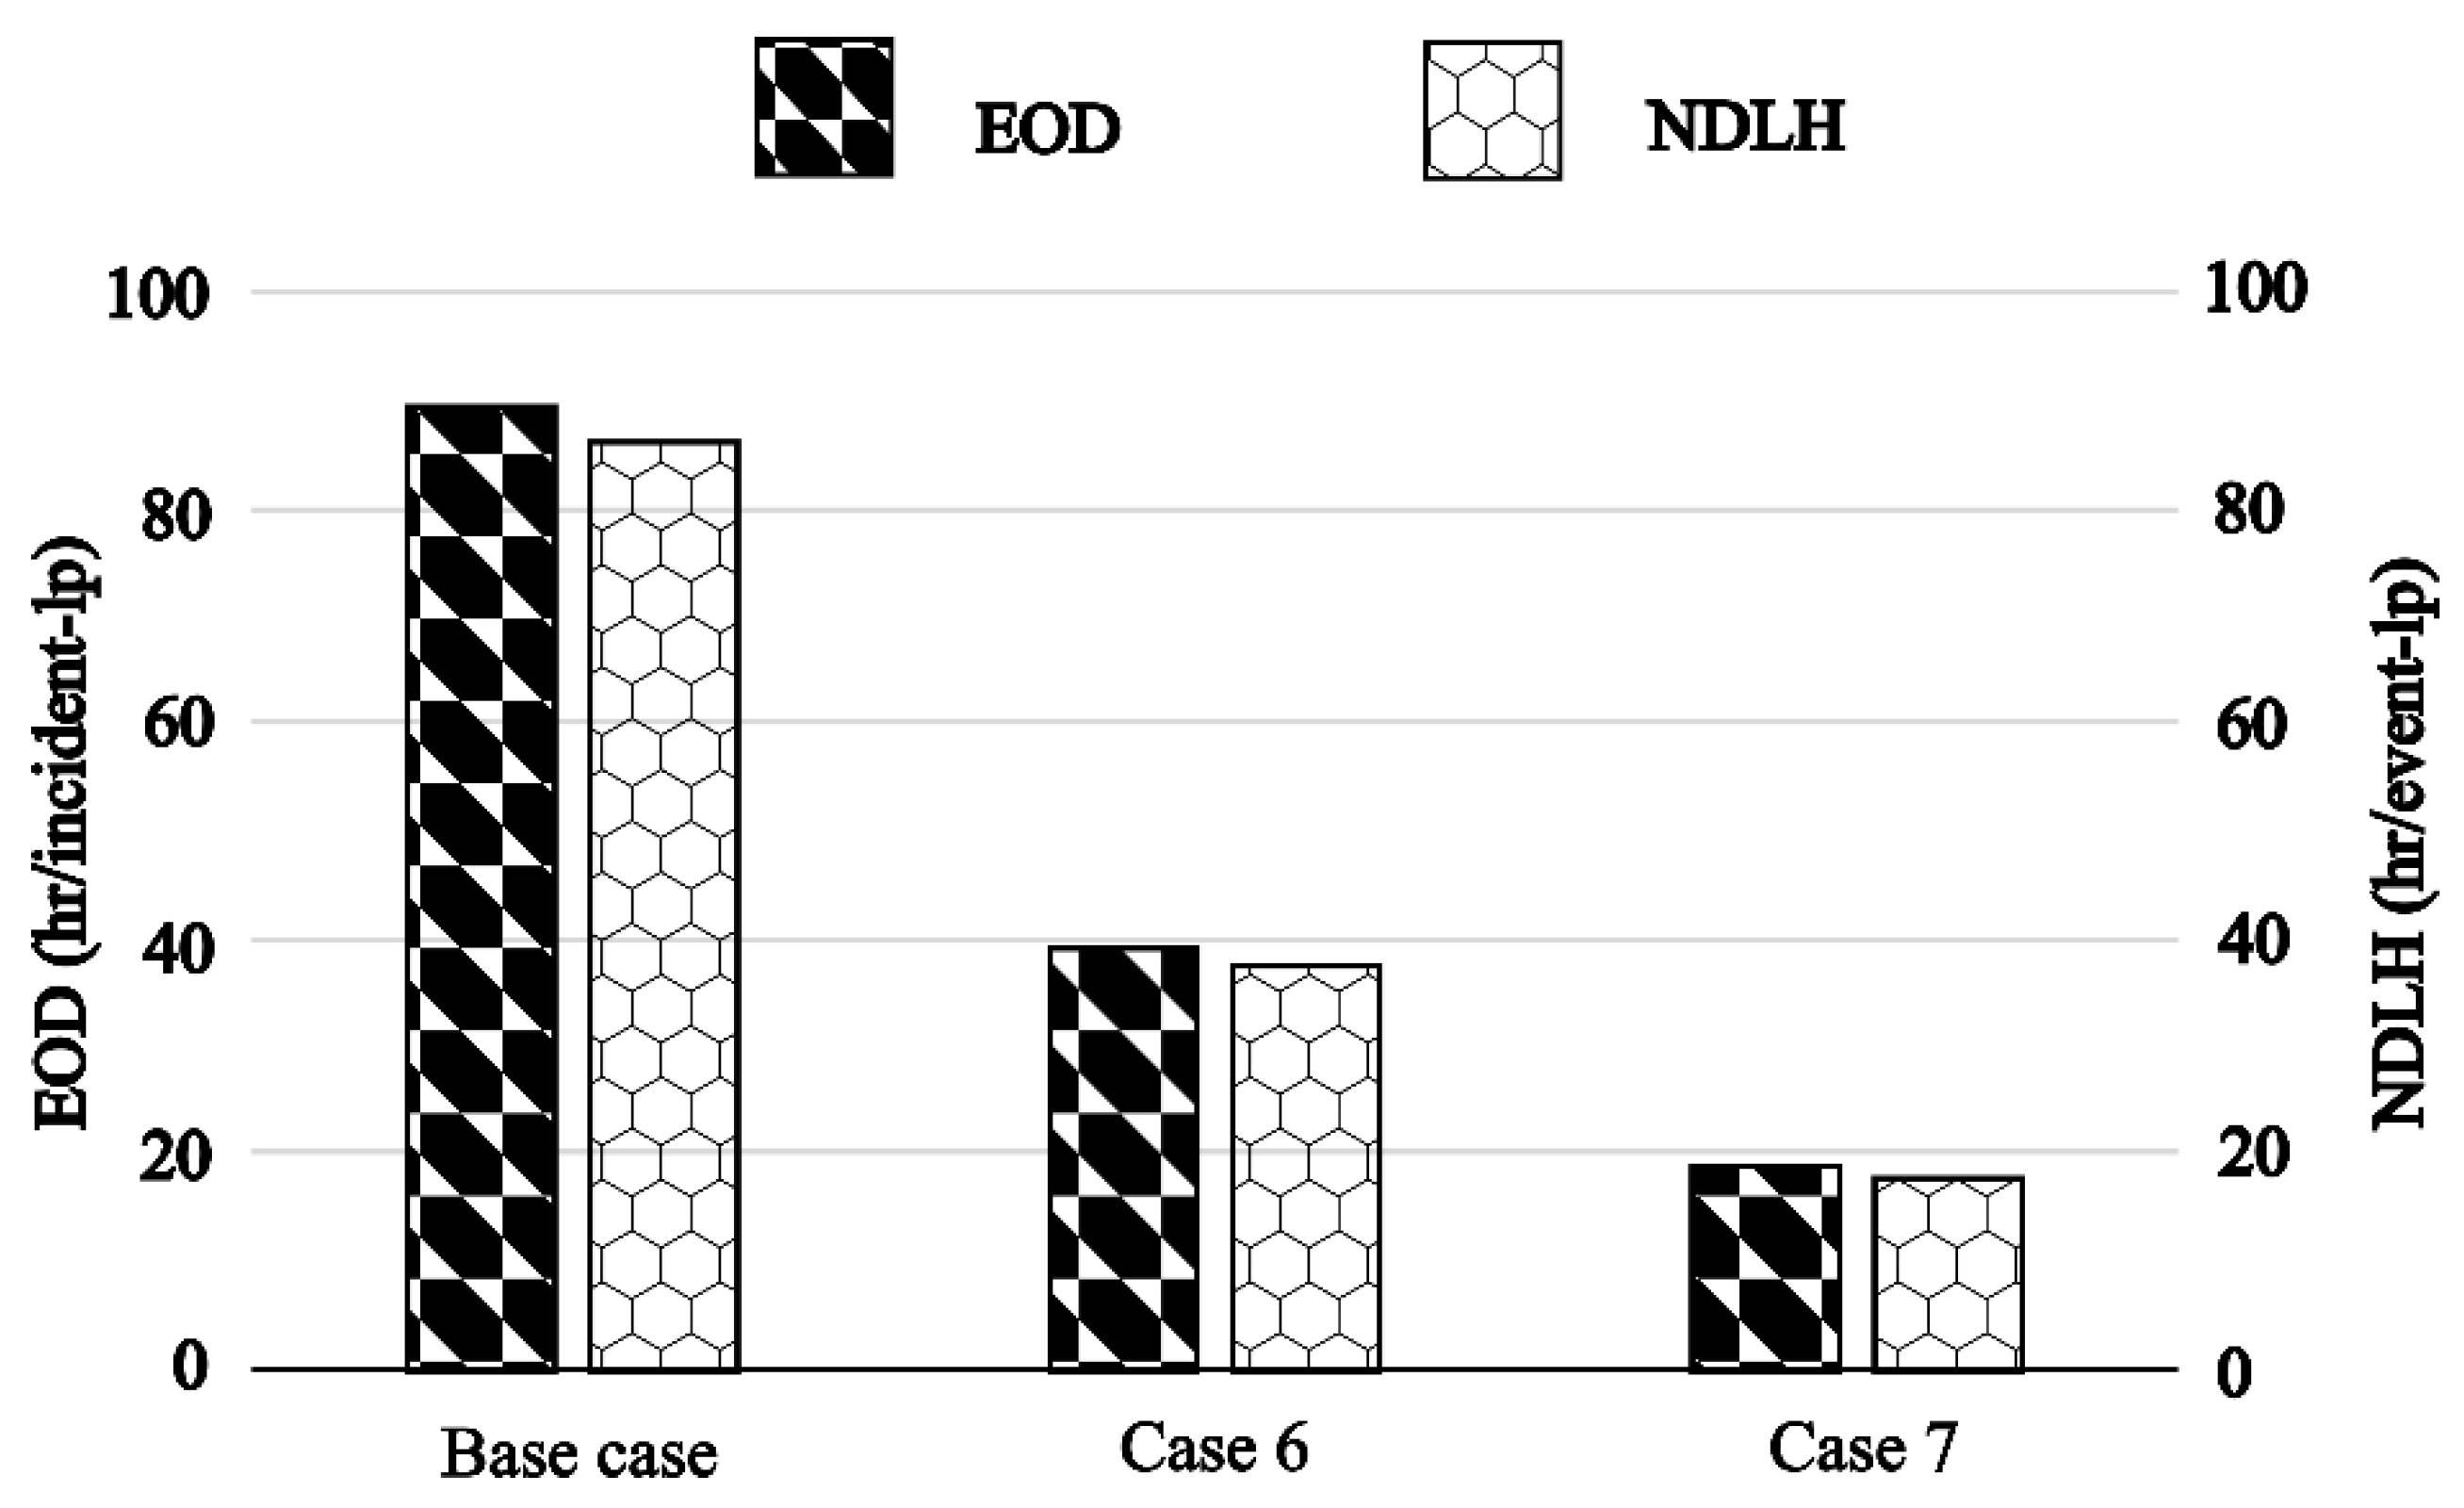
Figure 9 compares the EOD and NDLH metrics for Cases 6 and 7 against the base case, demonstrating that both metrics follow a similar trend across cases. The NDLH value is lower than that of EOD, consistent with the reasoning discussed earlier. The figure illustrates a substantial reduction in EOD, from 89.27 hr/incident-event in the base case to 39.38 hr/incident-event in Case 6. Further increasing the repair crew capacity without limit in Case 7 reduces the EOD even more, down to 19.01 hr/incident-event. These results indicate that while increasing repair crew size does improve the system performance, the improvement has a limit, unlike the effects observed with infrastructure hardening.
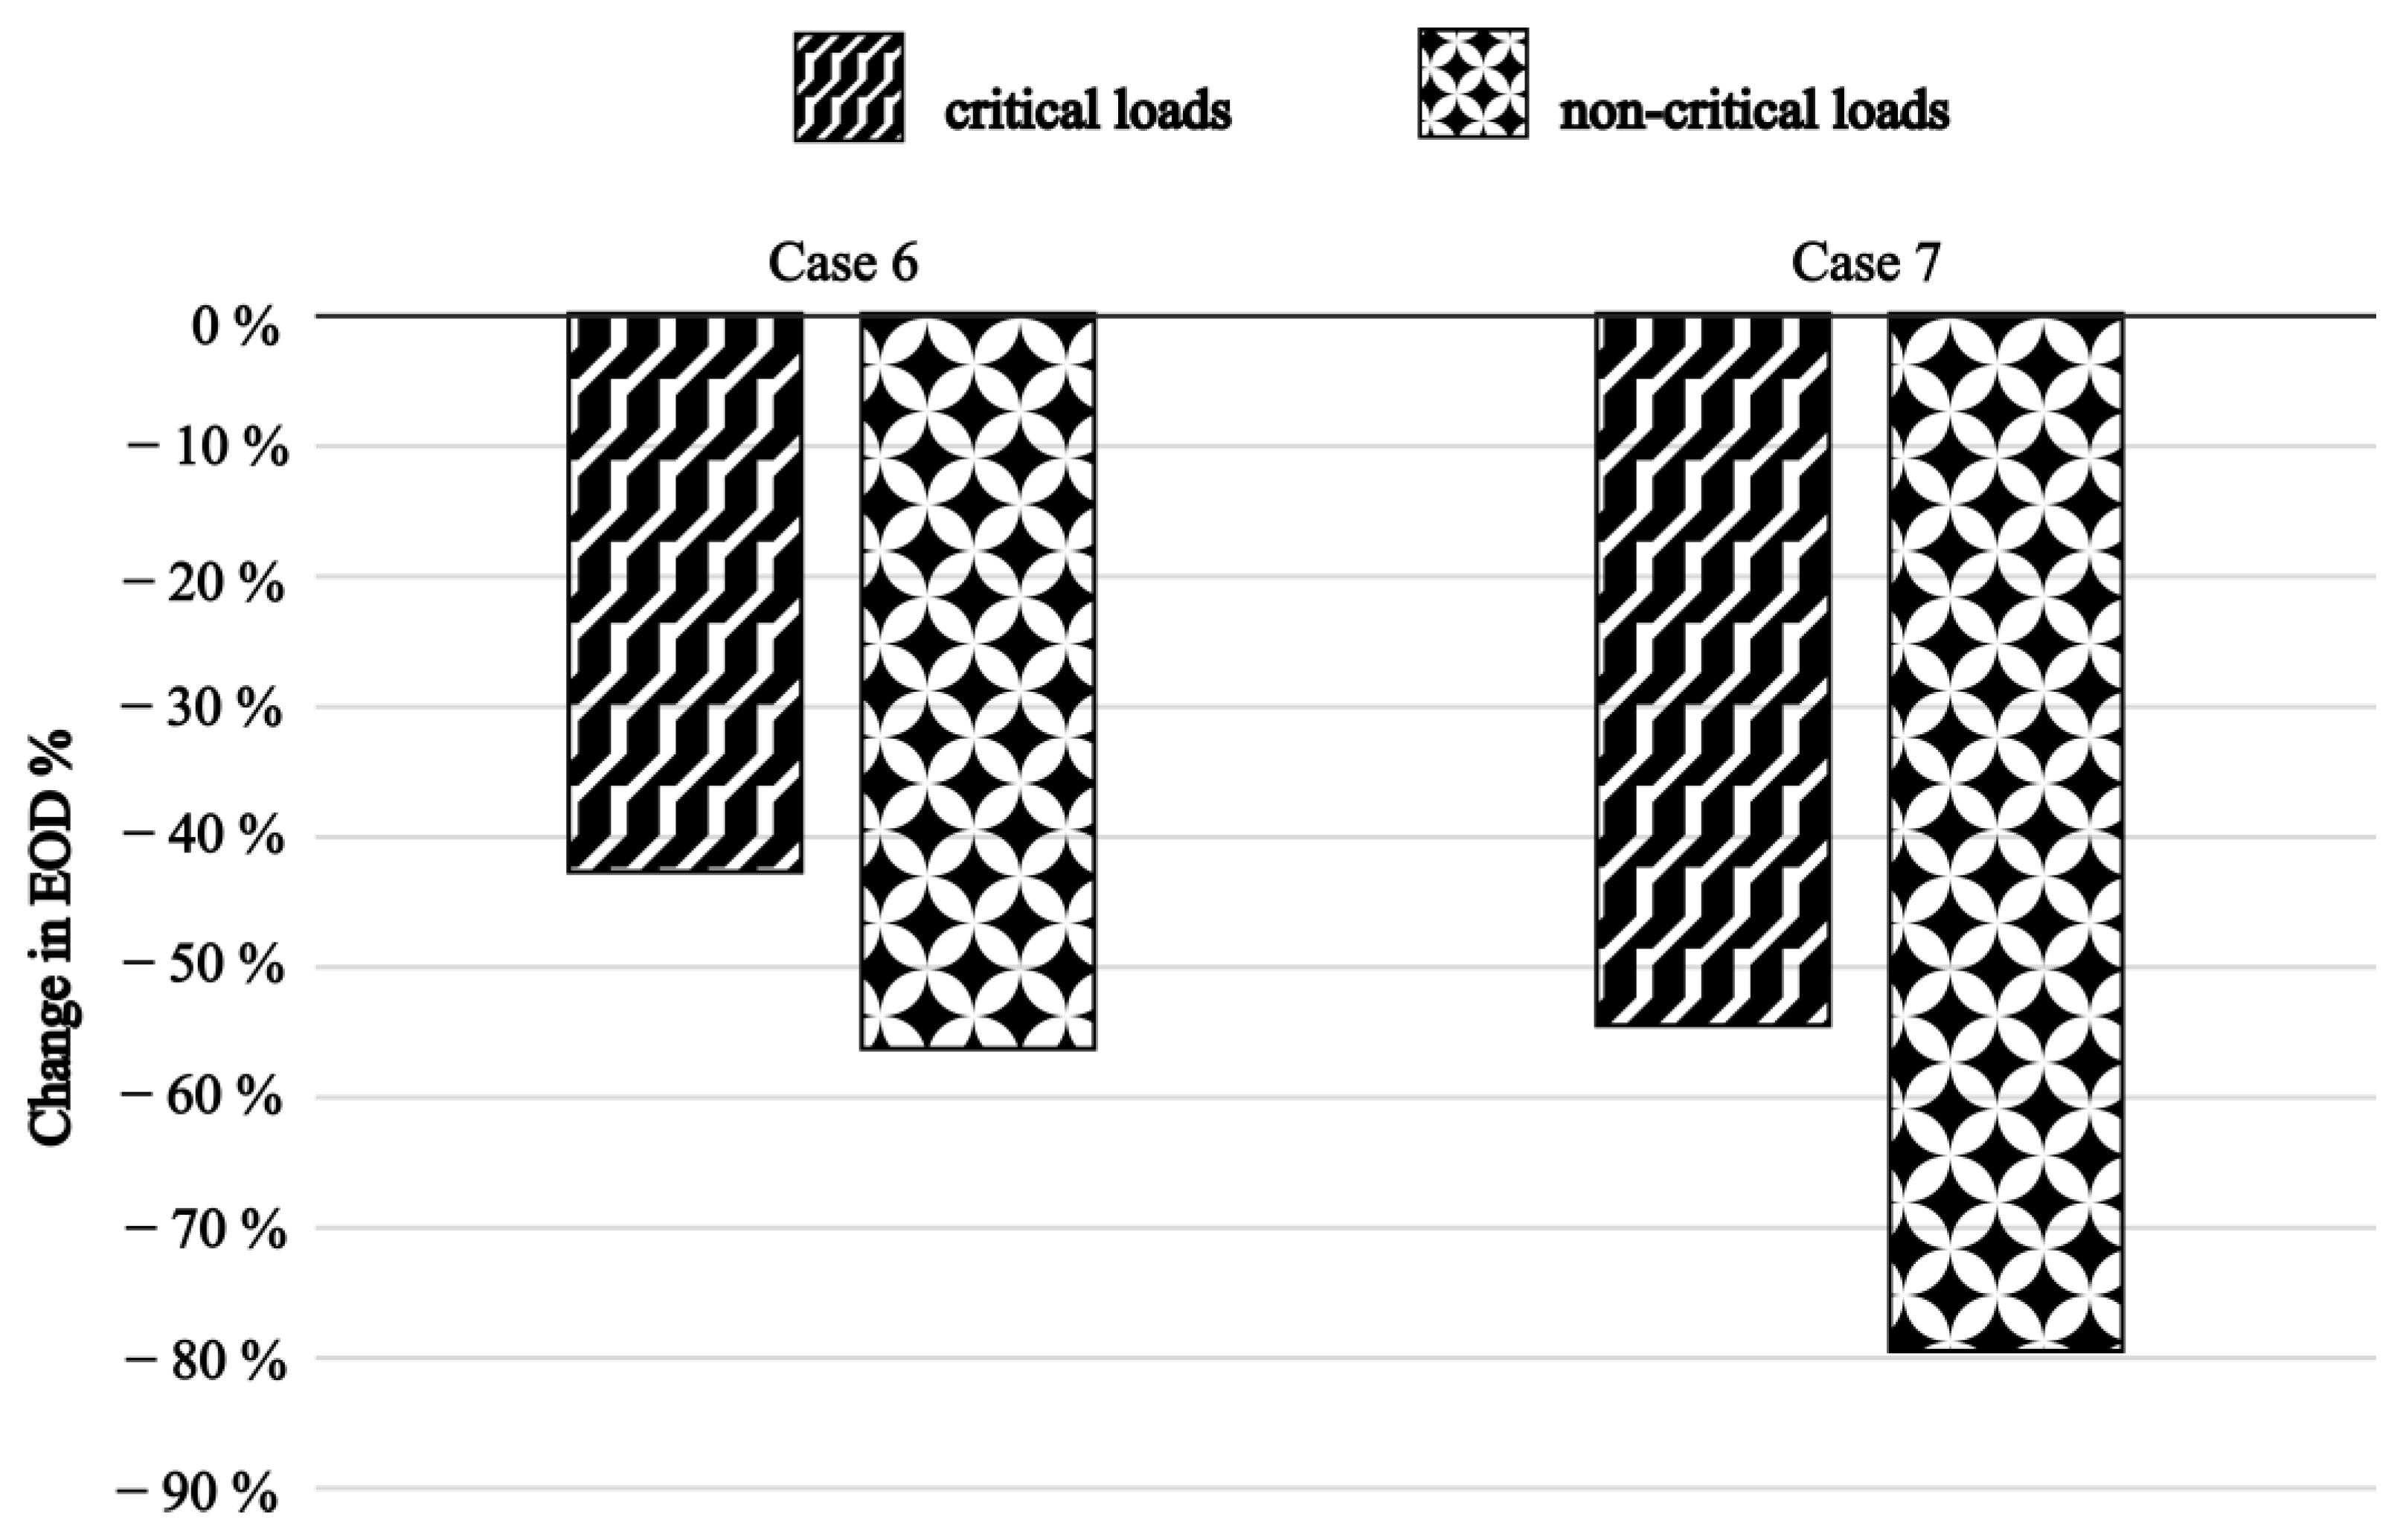
Figure 10 presents the percentage reduction in EOD relative to that of the base case for both critical and non-critical loads under Cases 6 and 7. In Case 6, the EOD for critical loads drops by 42.61%, while non-critical loads present a reduction of 56.25%. Case 7 achieves even greater improvements, with reductions of 54.64% and 79.37% for critical and non-critical loads, respectively. These results suggest that increasing repair crew size has a more significant impact on enhancing the resilience of non-critical loads. However, this interpretation can be misleading when taken in isolation. The measure of EOD in the base case is already significantly lower for critical than for non-critical loads. As previously discussed, the benefit of adding repair resources diminishes after a certain point, particularly for loads already exhibiting relatively lower outage durations. Hence, although critical loads appear to benefit less in relative terms, the absolute improvement across both load types remains comparable.
Table 3 presents a comparison of the EOD and NDLH metrics for Case 8 with those of the base case. The findings indicate that when the critical loads are prioritized during the restoration process, there is an overall improvement in system performance. This occurs because assigning the highest priority to critical loads has disrupted the optimality of the overall restoration sequence. An additional examination of the EOD values for critical and non-critical loads reveals that the EOD for critical loads increases significantly by 58.8%, whereas the EOD for non-critical loads decreases by only 5.5%. This indicates that the deterioration in the performance for critical loads far outweighs the modest gains observed for non-critical loads.
4. Analysis of Results for Investment Decisions
This section presents an analysis of the results obtained from the various case studies involving different investment strategies, as discussed in
Section 3. With the infrastructure hardening approaches, the results for system metrics show that both the selective hardening of the main feeder in Case 2 and the uniform hardening of the overall system in Case 3 demonstrate greater improvements in system resilience performance compared to those for the strategy focused solely on critical loads in Case 1. However, when specifically evaluating the performance of critical loads with investments targeted at these loads in Case 1, a notable enhancement in their resilience is realized.
Interestingly, the performance of critical loads in Case 2 remains relatively close to that in Case 1, as shown in
Figure 5. This is primarily due to the network configuration, where the critical load section is directly connected to the main feeder that was undergrounded in Case 2. As a result, even though the investment was not directly aimed at critical loads, their performance still benefited significantly. This highlights the importance of the physical location of critical loads within the network. Therefore, utilities can position critical loads closer to the substation during network planning or connect them through a dedicated feeder to enhance their resilience. Moreover, even considering a small improvement in the critical load performance, it is also essential to recognize that the cost of outages for critical loads is considerably higher than for non-critical loads. Since outage costs tend to escalate rapidly with duration, and extreme events may lead to prolonged outages lasting several hours to days, these costs become a crucial factor in planning. The EENS metric is commonly used to estimate outage costs by multiplying it by the value of the lost load (VoLL). VoLL accounts for both direct and indirect impacts of an outage and varies depending on customer type and load criticality. Consequently, not all critical loads display the same outage cost, and a more nuanced approach to cost estimation—one that incorporates critical load prioritization—may be necessary to guide infrastructure investment decisions more effectively.
Figure 8 highlights the performance gap between critical and non-critical load metrics. Further investment focused solely on hardening critical loads would likely widen this gap. While such investments are primarily intended for improving resilience during extreme events, they also influence performance under normal weather conditions. Therefore, a significant disparity between performance metrics is not ideal, as it consistently places non-critical loads at a disadvantage. Given that residential consumers typically fall under the non-critical category, a large investment imbalance may also raise socio-political concerns. In this context, Case 2 offers an investment option to narrow the performance gap following an initial investment in strengthening critical load points. If uniform reliability is preferred across all conditions, then an overall network hardening strategy, as seen in Case 3, serves as an alternative. However, it is important to note that Case 1 and Case 2 are directly comparable due to similar investment levels. Case 3 involves system-wide asset replacement and would require further evaluation for a more accurate comparison.
The results for Cases 4 and 5 highlight important insights into the relationship between DER investments and system resilience. While expanding DER capacity can contribute to improved resilience at lower investment costs, the effectiveness of such investments is significantly influenced by the condition and configuration of the supporting infrastructure. Marginal improvements in resilience metrics, despite substantial increases in DER capacity noted in Case 4, indicate that DER deployment alone may not yield proportional gains, especially when the connecting infrastructure remains vulnerable. This highlights the necessity of coupling DER investments with strategic infrastructure upgrades, such as hardening or undergrounding critical feeder sections. Such hybrid approaches are even more important for critical loads, as utilities tend to invest in additional backup generation, catering to the critical loads. A further sensitivity analysis can be performed to determine the optimal siting and sizing of DER under varying levels of infrastructure resilience in order to develop an effective and balanced investment strategy.
The findings from Cases 6 and 7 indicate that investment in repair manpower can be an effective strategy for enhancing system resilience, particularly because a significant portion of outage duration occurs after the disruptive event has passed, when repair crews are actively involved in restoration. The results reveal that increasing the number of repair crews yields comparable improvements in the performance of both critical and non-critical loads. However, utilities can further optimize the performance of the critical loads through proactive planning, especially in the case of weather-related events with sufficient advance warning. Strategically pre-positioning repair crews near critical infrastructure can enable faster restoration for high-priority loads during emergencies. The analysis also highlights a limit to improvements that can be realized solely through investment in repair crews. This constraint stems from two primary factors. First, repair activities can only commence once the event has concluded, meaning crew availability has no impact during the event itself. Second, the restoration sequence is influenced by the dependencies among failed components, which can delay the repair of some assets despite increased manpower, as detailed in
Section 2. These limitations underscore the need to complement repair crew management strategies with other resilience-enhancing measures, such as infrastructure hardening and DER management.
The analysis from Case 8 indicates the importance of prioritizing critical loads during the restoration process, given their high associated outage costs. However, the results also reveal that such prioritization can disadvantage the rest of the system, potentially leading to widespread customer dissatisfaction—an outcome that utilities typically aim to avoid. As an alternative, and considering socio-political pressures, utilities may opt to invest in dedicated backup energy systems for critical loads. This approach can ensure the reliability of critical services during disruptions without compromising the overall system performance during restoration.
5. Conclusions
This paper presents a comprehensive resilience evaluation framework that can be used by distribution system operators to plan and evaluate resilience-driven investments, particularly in the presence of critical loads in the system. The framework incorporates the priority of the critical loads in the islanded microgrid operation with DER as the system succumbs to extreme weather events. It also develops a practical model to estimate post-event load restoration time by considering the priority of the loads, the dependency of the outage components, and the availability of the repair crew. The paper evaluates the impact of various investment strategies on the performance of critical and non-critical loads by utilizing the novel metrics proposed in this paper, such as DLH and NDLH, as well as other traditional metrics, such as EOD and EENS.
A series of case studies within each investment strategy—infrastructure hardening, DER deployment, and repair process management—performed on a modified IEEE-69 bus test system reveals several key findings. Firstly, the strategic hardening of the main feeder provides better system-level resilience improvement compared to that of the targeted hardening of critical sections. However, the hardening of critical sections significantly reduces the outage duration and unserved energy for critical loads, which is a preferred investment model due to the high outage costs associated with the critical loads. Nevertheless, utilities must use care with this approach, as when increasing the resilience of critical loads, the performance gap between priority loads and the rest of the system tends to increase, which can be limited through strategic hardening alternatives. Second, DER management strategies provide a resilient solution at lower costs; however, their improvement is restricted by the vulnerability of the infrastructure needed to serve the loads. A hybrid strategy of combining DER deployment, along with hardening of strategically selected sections, provides substantial improvements, especially for the critical loads. Likewise, while the investment in repair crew has a uniform impact on the performance of both critical and non-critical loads, critical loads can be promptly restored through proactively deploying the crew near the site of priority loads as soon as the event warning is received.
The framework developed in this paper and the analysis of the results provide a valuable decision-making tool for system planners to design resilience-driven investments more effectively in an era of increasing climate-induced prolonged outages. The framework can be utilized to develop cost-optimization models for detailed economic analysis by integrating the investment costs of various resilience enhancement scenarios and the outage cost estimation using the value of the lost-load for the expected outage duration. A detailed sensitivity analysis can be carried out using the optimal DER siting and sizing, coupled with strategic and targeted hardening alternatives, to determine an optimal investment model.


