Abstract
Over the past 20 years, the use of the global positioning system (GPS) in football has become widespread. This technology has facilitated the tracking of external load both during training sessions and matches. Creating an external load profile for each playing position within specific formations can assist the coaching staff in shaping the training load of the microcycle according to the demands of each position. The purpose of this study was to create the running performance profile for high-level young football players based on their playing position in the 1-4-2-3-1 formation and to investigate potential differences between positions. Additionally, the study aimed to compare the players’ running performance across the two halves of the match. The study involved 22 Under-19 players from the academy of a professional football team. Only matches where the team used the 1-4-2-3-1 formation were analyzed (10 matches). The playing positions were categorized as: Central Defensive Fielders (CDFs), Central Midfielders (CMFs), Forwards (FWDs), Wide Defensive Fielders (WDFs), and Wide Midfielders (WMFs). Player movement was tracked using GPS devices and categorized into four velocity zones: (Zone 1: 3.6–10.8 km/h, Zone 2: 10.9–18.0 km/h, Zone 3: 18.1–25.2 km/h, Zone 4: >25.2 km/h). Depending on whether normality was present in our data, either a one-way analysis of variance (ANOVA) or a Kruskal–Wallis test was conducted. A subsequent analysis was performed to compare the performance between the first and second halves of the match, using either the independent samples t-test or the Mann–Whitney U test. The results showed that CMF players covered the greatest total distance and had the highest movement velocity (distance/min) compared to all other positions (p = 0.001). In high-speed running (>18 km/h), CMF again covered the greatest distance, followed by WDF. In sprinting, CDF covered the shortest distance and reached the lowest maximum speed (p = 0.001). CMF performed the most accelerations and decelerations across all positions (p = 0.001). As for the entire team, total distance, movement rate, and the number of accelerations and decelerations decreased in the second half. All players except the WDF also showed a decrease in total distance, while midfielders experienced a notable drop in sprint distance. In conclusion, this study underscores the positional specificity of physical demands in elite football and the systematic decline in physical output as matches progress. While all positions demonstrated some level of second-half performance deterioration, midfielders experienced the most significant decreases in both volume and intensity-related metrics. These insights offer valuable implications for position-specific physical condition, recovery planning, and substitution strategies, helping to optimize performance and manage player load in elite football environments. It should be reiterated that the results of the present study apply exclusively to the 1-4-2-3-1 formation.
1. Introduction
Football is a long-duration intermittent sport characterized by periods of low intensity alternating with short periods of high and very high intensity [1]. The physiological demands of the sport constantly change, with a key feature of modern football being the increased intensity during the match [2,3]. Therefore, to cope with these demands, football players must develop both endurance and speed, strength, and power [4]. A key indicator of a footballer’s level is the number of successful high-intensity actions performed [5].
In recent decades, technological advancements have greatly assisted coaching staff in improving players’ physical condition. Specifically, the development of the Global Positioning System (GPS) has enabled the quantification and better monitoring of physical load to enhance performance [6]. Additionally, the use of the GPS and proper load management help prevent injuries [7]. Thus, in the past decade, the GPS has been used daily to measure the external load experienced by footballers both in training and matches. Knowing the match load helps the coaching staff better design the training load during the microcycle [8]. Match data recordings have shown that players’ running performance depends on various factors, including the formation the team plays in and the playing position [9,10].
From a practical standpoint, knowing the running load for each playing position within each formation helps better individualize training loads. For example, knowing that central defenders cover a significantly shorter distance at sprint speed compared to wide midfielders during a match, they will be trained over different distances during the microcycle. Additionally, the knowledge of match-specific running profiles can assist in determining player suitability for specific formations. Finally, coaches working with young players can better prepare them (physically) for transitioning from one age category to another (e.g., from under the age of 17 to under the age of 19).
A review of the literature shows that Central Defensive Fielders (CDFs) in formations with three defenders cover greater distances during a match compared to formations with two CDFs [11,12,13]. Also, Central Midfielders (CMFs) have been reported to cover more distance at maximum speed in the 1-4-2-3-1 formation compared to the 1-4-4-2, while Wide Defensive Fielders (WDFs) in the 1-4-4-2 formation appear to cover a shorter distance at high speed compared to the 1-3-5-2 formation [11]. Moreover, the 1-4-4-2 formation appears to limit high-intensity actions compared to the 1-4-3-3 [14,15]. Another factor influencing running performance is the number of central strikers in the formation. Specifically, using two Forwards (FWDs) (1-3-5-2) has been associated with greater distances covered at high speeds compared to formations with a single FWD (1-4-3-3) [16,17]. In most formations, CMFs are observed to cover the greatest distances [10,14,18,19]. The GPS also records the number of accelerations and decelerations a player performs. Previous studies have reported that the number of such high-intensity actions affects players’ neuromuscular load and is, therefore, a significant factor in estimating fatigue [20,21,22]. The existing literature clearly shows that dozens of such actions occur in all football matches, regardless of the level [6,23].
Another parameter evaluated by the coaching staff is the change in players’ running performance between the two halves. A decrease of ~10% is commonly observed and may be due to various factors (scoreline, reduced effective playing time), among which fatigue is included [24]. For example, a recent study conducted on youth players playing in a 1-4-3-3 formation observed a reduction in the distance covered at high intensity in the second half, though not in the total distance [25]. A reduction in high-speed distance has also been reported in other studies on professional players [24], although there are also reports that found no change [26,27].
From the literature review, it is evident that related studies are limited, and most focus on professional footballers. Therefore, the aim of the present study is to create the match running profile of high-level youth footballers according to their playing position in the 1-4-2-3-1 formation. The study also aims to examine differences between playing positions in this formation and performance across the two halves. Based on previous research, we hypothesize that CMFs will cover greater distances, wide players will cover the most high-speed meters, and that a drop in running performance will be observed in the second half.
2. Methods
2.1. Participants
The study examined 22 football players (age 18.5 ± 0.5 years, body mass 74.7 ± 8.5 kg, body height 178 ± 5 cm) from the academy of a professional football club, all of whom were members of the Under-19 (U19) team competing in the national U19 league, which comprises top-tier professional teams. Participants engaged in four to five training sessions per week, in addition to one official match. A total of 10 league matches were included in the analysis, during which the team consistently employed a 1-4-2-3-1 tactical formation. Matches were excluded from the dataset if: (a) the team deviated from the designated formation at any point; (b) a player was dismissed with a red card; or (c) environmental conditions, such as heavy rainfall, had the potential to affect performance.
Only data from players who completed the full 90 min in the same position were included in the analysis. Goalkeepers were not considered, and the remaining positions were categorized as Central Defensive Fielders (CDFs), Central Midfielders (CMFs), Forwards (FWDs), Wide Defensive Fielders (WDFs) and Wide Midfielders (WMFs). All participating footballers were briefed on the nature of the study and provided written informed consent. The research received approval from the local Institutional Review Board (approval number 217/2024) and adhered to the principles of the Helsinki Declaration.
2.2. Data Collection
The physical performance data were collected using the Titan 2 GNSS device (Integrated Bionics Inc., Houston, TX, USA), operating at a sampling frequency of 10 Hz. The validity and between-unit reliability of comparable GNSS systems have been established in the literature [28], supporting their appropriateness for monitoring distance, peak speed, and high-intensity actions in team sports.
To enhance the reliability of data acquisition, each player consistently wore the same GNSS unit across all matches to minimize inter-unit variability. All devices were activated simultaneously by the research team exactly 15 min prior to kick-off, ensuring consistent satellite acquisition and stable signal reception. Devices were placed between the scapulae in specially designed vests, in accordance with best practice recommendations.
Raw data were manually checked after each match for signal dropout, artifacts, or missing values. Only complete and valid recordings were included in the analysis. No imputation or correction of missing data was applied.
The external load of the football players during the team’s official matches over the course of one year was recorded using the above GNSS system. Only the matches in which the team played the entire 90 min in a 1-4-2-3-1 formation were included in the analysis.
The external load variables used were total distance, distance per speed zone, and the frequency of accelerations and decelerations. The distance covered by the football players was divided according to their movement speed into Zone 1 (3.6–10.8 km/h), Zone 2 (10.9–18.0 km/h), Zone 3 (18.1–25.19 km/h), and Zone 4 (≥25.2 km/h). For accelerations (ACC) and decelerations (DEC), only those exceeding 2 m/s2 were taken into account.
2.3. Statistical Analysis
The statistical analyses were performed using IBM SPSS Statistics (version 29 for Windows) [29], Jamovi (version 2.6.23.0 for Windows) [30], and JASP for data visualization (JASP version 0.19.3.0 for Windows) [31]. Prior to the main analysis, normality was assessed for all variables. Variables that met the assumption of normality, as assessed by the Shapiro–Wilk test—namely, maximum speed achieved (km/h), Distance Zone 1, accelerations ≥ 2.0 m/s2, and decelerations ≤ −2.0 m/s2—were subjected to parametric testing via one-way analysis of variance (ANOVA) to assess differences across playing positions. When statistically significant effects emerged, Tukey’s post hoc procedure was employed to identify pairwise differences. For the remaining non-normally distributed variables that violated the normality assumption—specifically, total distance (km), number of sprints, total sprint distance (km), relative distance covered (m/min), Distance Zone 2, Distance Zone 3, and Distance Zone 4—non-parametric Kruskal–Wallis tests were applied. In cases where significant group differences were detected, pairwise post hoc analyses were performed to further explore the inter-positional contrasts. Effect sizes (ES) were computed in accordance with Cohen’s [32] benchmarks: η2 was used for parametric outcomes, while ε2 was calculated for non-parametric data. The thresholds for interpreting ES were defined as small (0.01–0.06), moderate (0.06–0.14), and large (>0.14) [32].
A subsequent analysis was conducted to compare performance between the first and second halves of the match. For this purpose, normality checks were repeated for each variable after splitting the dataset in half, and variables that followed normal distribution—such as accelerations (≥2.0 m/s2) and decelerations (≤−2.0 m/s2)—were analyzed using the independent samples t-test. Variables that deviated from normality, including the total distance (km), Distance Zone 1–4, relative distance covered (m/min), number of sprints, total sprint distance (km), and maximum speed achieved (km/h), were examined using the Mann–Whitney U test. Corresponding effect sizes were reported: Cohen’s d for parametric tests and the rank-biserial correlation for non-parametric outcomes. The interpretation of effect sizes followed Cohen’s classification: small (0.20–0.49), moderate (0.50–0.79), and large (≥0.80). Furthermore, within-position comparisons across match halves were also conducted. For variables maintaining normality, paired samples t-tests were used (i.e., accelerations and decelerations), while the Wilcoxon signed-rank test was utilized for non-normally distributed variables. The level for statistical significance was set at p < 0.05.
3. Results
Statistical analysis revealed significant positional differences, with small to large effect sizes across several external load metrics during the match play (Table 1). Distance Zone 1 was the only variable with no significant differences found. Conversely, a large significant difference was found in Distance Zone 2 (H = 42.9, ε2 = 0.572, p = 0.001), Distance Zone 3 (H = 33.8, p = 0.001, ε2 = 0.451), and Distance Zone 4 (H = 16.2, p = 0.003, ε2 = 0.216). From the analysis for the total distance covered, a large significant difference was also indicated (H = 31.9, ε2 = 0.426, p = 0.001), as well as for the relative distance covered per minute (H = 29.0, ε2 = 0.387, p = 0.001). Similarly, large significant differences were observed among players’ positions in the number of sprints (H = 38.1, ε2 = 0.508, p = 0.001), total sprint distance (H = 36.4, ε2 = 0.486, p = 0.001), and maximum speed achieved (F = 6.555, η2 = 0.270, p = 0.001). Accelerations equal to or greater than 2.0 m/s2 showed large statistically significant differences (F = 7.041, η2 = 0.284, p = 0.001), as did decelerations equal to or lower than −2.0 m/s2 (F = 13.638, η2 = 0.435, p = 0.001). These results indicated meaningful variations in external load indicators, particularly in higher-speed and high-intensity activities, while low-speed metrics such as Distance Zone 1 remained statistically consistent across the sample.

Table 1.
Statistical results for physical performance metrics across playing positions: test statistics, significance levels, and effect sizes.
Post hoc comparisons (Table 2 and Figure 1 and Figure 2) further clarified the nature of the significant differences reported in Table 1. Specifically, central midfielders consistently demonstrated higher values across most variables, including the total distance covered, relative distance per minute, and sprint metrics. Their performance differed significantly from that of multiple other positions, particularly in Distance Zones 2, 3, and 4, suggesting greater involvement in moderate-to-high intensity efforts. In Distance Zone 2, significant differences were found between central midfielders and forwards. Sprint-related performance metrics—such as the number of sprints and total sprint distance—showed that central midfielders recorded higher values compared to central defenders and forwards. For maximum speed, the highest values were observed among forwards and wide midfielders, reflecting the explosive running demands of their positions. The central midfielders appeared to perform the highest number of accelerations and decelerations compared to the other playing positions.
Table 2.
Descriptive statistics for the distance covered and speed metrics by playing position: means, confidence intervals, and standard deviations.
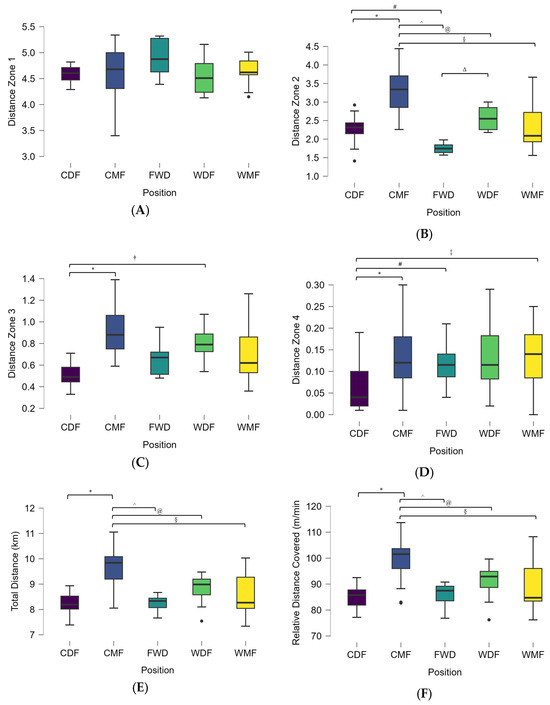
Figure 1.
An inter-positional comparison of movement demands across distance zones and the total distance. Note: The boxplots (A–F) illustrate the distribution of key performance metrics (Distance Zones 1–4 and the total distance in km; relative distance covered in m/min) across playing positions: Central Defensive Fielders (CDFs), Central Midfielders (CMFs), Forwards (FWDs), Wide Defensive Fielders (WDFs) and Wide Midfielders (WMFs). The following symbols denote significant pairwise differences: CDF vs. CMF (*), CDF vs. FWD (#), CDF vs. WDF (†), CDF vs. WMF (‡), CMF vs. FWD (^), CMF vs. WMF (§), CMF vs. WDF (@), FWD vs. WDF (Δ). Dots indicate statistical outliers identified using the IQR method, which were retained in the analysis due to their potential to represent meaningful individual differences in physical performance. Dots represent statistical outliers (IQR method) retained for analysis, as they may reflect meaningful individual variability in physical performance.
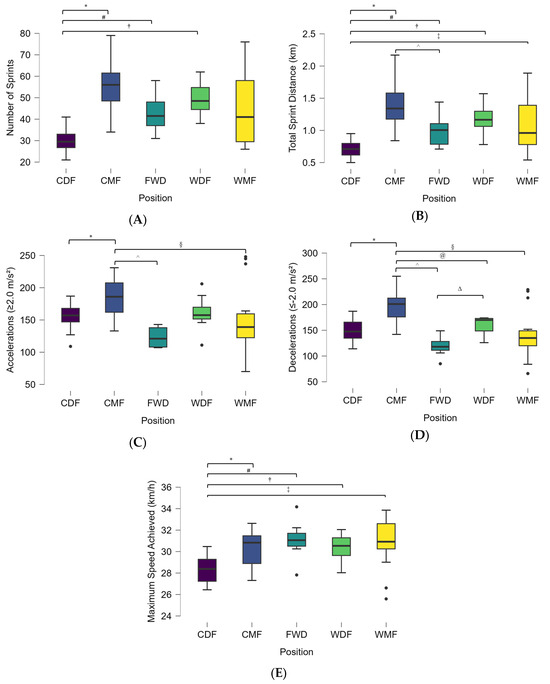
Figure 2.
An inter-positional comparison of speed-related metrics and high-intensity movement demands. Note: The boxplots (A–E) illustrate the distribution of key performance metrics across playing positions: Central Defensive Fielders (CDFs), Central Midfielders (CMFs), Forwards (FWDs), Wide Defensive Fielders (WDFs), and Wide Midfielders (WMFs). The following symbols denote significant pairwise differences: CDF vs. CMF (*), CDF vs. FWD (#), CDF vs. WDF (†), CDF vs. WMF (‡), CMF vs. FWD (^), CMF vs. WMF (§), CMF vs. WDF (@), FWD vs. WDF (Δ). Dots indicate statistical outliers identified using the IQR method, which were retained in the analysis due to their potential to represent meaningful individual differences in physical performance. Dots represent statistical outliers (IQR method) retained for analysis, as they may reflect meaningful individual variability in physical performance.
A secondary normality analysis was conducted for each variable after splitting the dataset in half (first and second halves) in order to examine positional movement patterns across halves. The analysis between the first and second halves of the matches revealed statistically significant reductions in several physical performance metrics, as shown in Table 3. Specifically, moderate significant differences between first and second halves were noted in the total distance covered (U = 1756, ES = −0.437, p = 0.001) and relative distance covered per minute (U = 1110, ES = −0.644, p = 0.001), with players decreasing their performance during the second half. Distances covered in lower-intensity zones also showed a decline, with small significant differences observed in Distance Zone 1 (U = 1477, ES = –0.526, p = 0.001) and Distance Zone 2 (U = 2158, ES = –0.308, p = 0.001). Although a decrease was noted in Distance Zone 3 (p = 0.093) and Distance Zone 4 (p = 0.454), these did not reach statistical significance. Sprint-related variables followed a similar trend; a small significant decline in the number of sprints was observed (U = 2325, ES = –0.255, p = 0.006), whereas the reduction in the total sprint distance only approached but did not meet statistical significance (U = 2565, p = 0.053). In addition, small significant declines for accelerations (t = 2.76, ES = 0.438, p = 0.007) and decelerations (t = 2.93, ES = 0.465, p = 0.004) were noted during the second halves compared to the first ones. Maximum speed achieved did not differ significantly between halves (p = 0.390).
Table 3.
A comparison of physical performance metrics between first and second halves: test statistics, significance levels, and effect sizes.
A consistent decline in physical performance was observed in the second halves across most variables (Table 3 and Table 4 and Figure 3 and Figure 4). Specifically, in Distance Zone 1, a significant decrease was indicated from a mean of 2.42 km in the first half to 2.20 km in the second half, while Distance Zone 2 followed a similar pattern, decreasing from 1.40 km to 1.19 km (p < 0.05). Although Distance Zones 3 and 4 also showed slight reductions, these changes were not statistically significant. However, the total distance covered significantly decreased from 4.61 km to 4.18 km between the halves (p < 0.05), as did the relative distance covered per minute, which declined from 98.14 to 84.07 m/min (p < 0.05), indicating a reduction in running output over time.
Table 4.
Descriptive statistics of the distance covered across zones, the total distance, and speed metrics between the first and second halves.
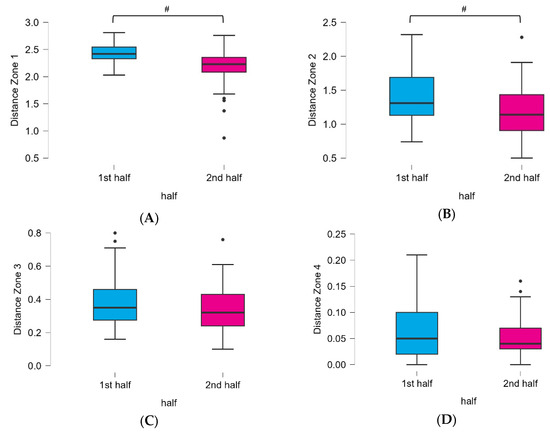
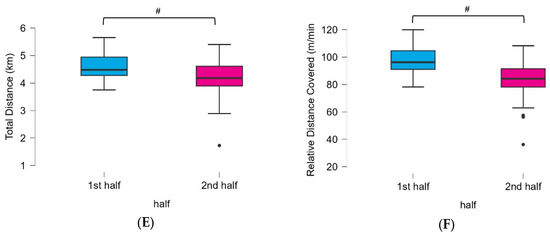
Figure 3.
A comparison of the distance covered across intensity zones and total distance between the halves. Note: The boxplots (A–F) illustrate the distribution of the distance covered across different intensity zones (Distance Zone 1–4 and the total distance in km; relative distance covered in m/min) across the first and second halves of the matches. The symbol # indicates significant differences at p < 0.05. Dots indicate statistical outliers identified using the IQR method, which were retained in the analysis due to their potential to represent meaningful individual differences in physical performance. Dots represent statistical outliers (IQR method) retained for analysis, as they may reflect meaningful individual variability in physical performance.
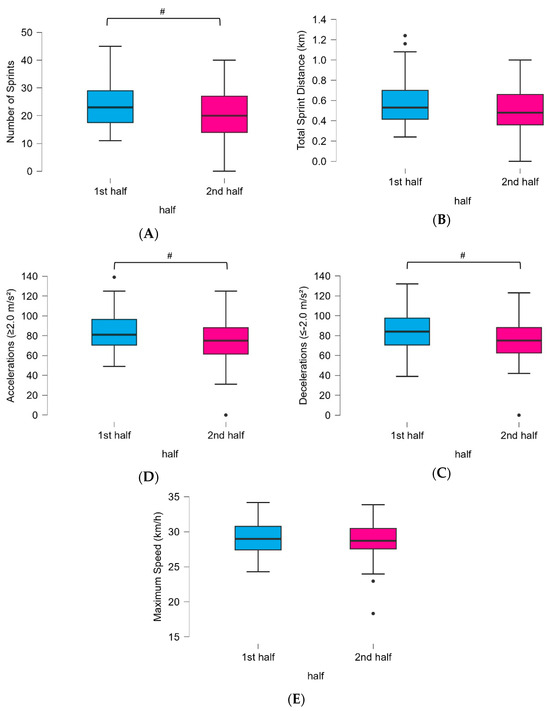
Figure 4.
A comparison of distance covered across speed metrics between the halves. Note: The boxplots (A–E) illustrate the distribution of speed metrics across the first and second halves of the matches. The symbol # indicates significant differences at p < 0.05. Dots indicate statistical outliers identified using the IQR method, which were retained in the analysis due to their potential to represent meaningful individual differences in physical performance. Dots represent statistical outliers (IQR method) retained for analysis, as they may reflect meaningful individual variability in physical performance.
Sprint-related metrics also declined, with the number of sprints dropping from 24.13 to 20.25 (p < 0.05), although the total sprint distance exhibited only a non-significant reduction. Similarly, a non-significant decrease in maximum speed was observed (29.12 km/h to 28.67 km/h). Finally, the number of high-intensity actions decreased, with accelerations (≥2.0 m/s2) falling from 84.42 to 75.72 and decelerations (≤−2.0 m/s2) from 85.25 to 75.52 (p < 0.05).
Subsequently, paired-samples tests were applied to assess intra-positional variations in movement and speed parameters among different playing positions, with paired t-tests used for normally distributed variables (e.g., accelerations and decelerations) and Wilcoxon signed-rank tests employed for those not meeting normality assumptions, highlighting position-specific demands (Table 5, Table 6 and Table 7, Figure 5 and Figure 6).
Table 5.
Descriptive statistics of the distance covered across zones between the first and second halves by playing position.
Table 6.
Descriptive statistics of total distance covered between the first and second halves by playing position.
Table 7.
Descriptive statistics of speed metrics between the first and second halves by playing position.
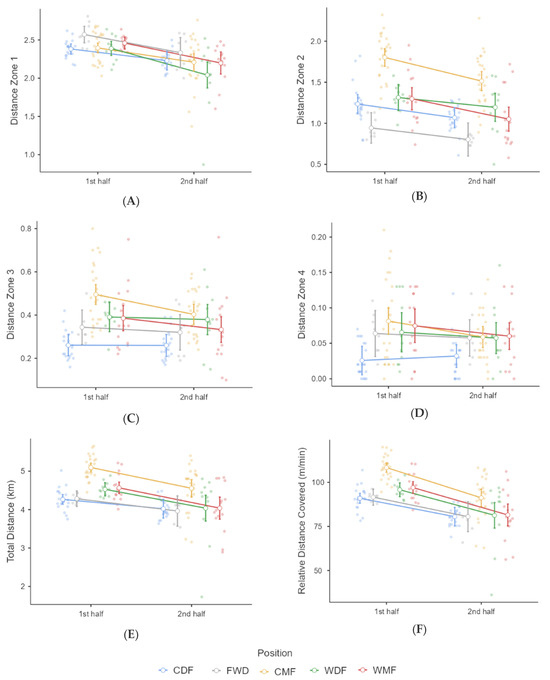
Figure 5.
An intra-positional comparison of the distance covered between the match halves. Note: The boxplots (A–F) depict the distribution of the distance covered across intensity zones and the total distance between halves, highlighting within-position differences in physical performance during the match.
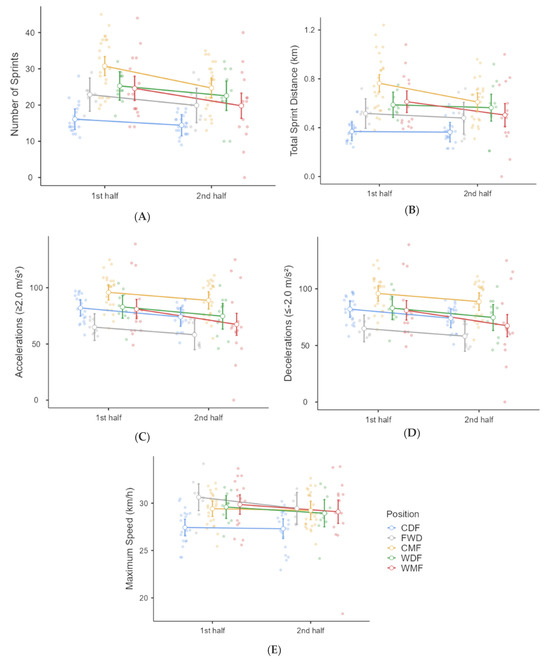
Figure 6.
An intra-positional comparison of speed metrics between the match halves. Note: The boxplots (A–E) depict the distribution of speed metrics between halves, highlighting within-position differences in physical performance during the match.
In Central Defensive Fielders (CDFs), accelerations decreased significantly during the second half compared to the first half (first half: 82.00 ± 11.80; second half: 74.00 ± 11.10; t = 3.14, p = 0.005). A similar decline was observed for decelerations, which were also significantly lower in the second half than in the first half (first half: 79.38 ± 15.59; second half: 73.57 ± 10.26; t = 2.29, p = 0.033). The distance covered in Zone 1 significantly declined in the second half (Z = −3.669, p = 0.001), as did Zone 2 (Z = −2.886, p = 0.004). No significant differences were found for Zone 3 (Z = −0.225, p = 0.822), or Zone 4 (Z = 1.132, p = 0.258). The total distance was significantly lower in the second half (Z = −3.702, p = 0.001), and a similar trend also followed the relative distance covered per minute (Z = −4.015, p = 0.001), indicating a reduced work rate in the second half. Conversely, no significant differences were observed in the sprint count (p = 0.156), total sprint distance (p = 0.728), or top speed (p = 0.881), reflecting consistent sprinting capacity and peak velocity between the halves.
In Wide Defensive Fielders (WDFs), paired-sample analyses indicated not statistically significant differences in mean values for accelerations that decreased from 82.91 ± 13.93 to 74.64 ± 17.40 and decelerations that declined from 83.73 ± 9.38 to 73.36 ± 15.27 (p = 0.155 and p = 0.056, respectively). Among the distance zones, only Distance Zone 1 showed a statistically significant reduction in the second half (Z = −2.845, p = 0.004), while no significant changes were observed in Zone 2, Zone 3, or Zone 4 as all corresponding p-values exceeded 0.35. The total distance exhibited a numerical decrease but did not reach statistical significance (p = 0.091). In contrast, a significant reduction was found in relative distance per minute, decreasing from the first to the second half (Z = −2.845, p = 0.004), indicating an overall decline in match intensity rather than in absolute distance. Metrics related to the number of sprints, total sprint distance, and maximum speed showed no statistically significant differences across the halves (p > 0.35), indicating that sprint-specific demands were relatively maintained.
In Central Midfielders (CMFs), analyses revealed a statistically significant reduction in the number of accelerations during the second half compared to the first (first half: 95.88 ± 16.33; second half: 88.71 ± 15.97; t = 2.34, p = 0.029). A similar pattern was observed for decelerations, which decreased significantly in the second half (first half: 102.63 ± 13.78; second half: 92.50 ± 19.85; t = 2.51, p = 0.019). Distance Zone 1, Zone 2, Zone 3, and Zone 4 showed statistically significant declines (p ≤ 0.045), suggesting a widespread drop in intensity-specific running output. Furthermore, the CMF covered a significantly shorter total distance in the second half (Z = −3.643, p = 0.001) and had reduced relative distance per minute (Z = −4.114, p = 0.001). Key performance metrics such as the number of sprints (p = 0.005) and the total sprint distance (p = 0.012) also declined. However, the maximum speed did not significantly differ between the halves (p = 0.710).
In Wide Midfielders (WMFs), within-position comparisons revealed statistically significant reductions in both accelerations (first half: 80.93 ± 26.13; second half: 67.47 ± 32.12; t = 2.526, p = 0.024) and decelerations (first half: 77.87 ± 22.41; second half: 64.00 ± 27.94; t = 3.206, p = 0.006). The Wilcoxon signed-rank tests also indicated significant reductions in lower and moderate intensity distance zones. Specifically, Distance Zone 1 and Distance Zone 2 were significantly reduced in the second half (p = 0.001 and p = 0.002, respectively), whereas no changes were observed in Distance Zones 3 and 4. The total distance covered (Z = −3.408, p = 0.001) and relative distance per minute (Z = −3.408, p = 0.001) also showed significant reductions. Although the number of sprints did not significantly differ across the halves (p = 0.058), the total sprint distance was significantly reduced (Z = −2.216, p = 0.027), indicating a decrease in the volume rather than the frequency of sprinting. The maximum speed remained unchanged (p = 0.363), indicating that peak sprinting capacity was preserved despite reductions in accumulated physical demands.
Lastly, in Forwards (FWDs), a significant decline in the number of accelerations during the second half compared to the first was observed (first half: 65.00 ± 6.55; second half: 58.25 ± 10.51; t = 2.85, p = 0.025). Similarly, decelerations were also significantly reduced in the second half relative to the first half (first half: 64.50 ± 14.04; second half: 54.25 ± 7.17; t = 2.59, p = 0.036). A significant reduction in Distance Zone 1 (Z = −2.524, p = 0.012) and Distance Zone 2 (Z = −2.521, p = 0.012) across the halves, was also indicated. However, no significant differences were observed in Distance Zones 3 and 4 (p > 0.05), indicating a stability in higher-speed outputs. Moreover, the total distance covered (Z = −2.521, p = 0.012) and the relative distance per minute (Z = −2.521, p = 0.012) significantly decreased in the second half. While a trend toward reduction was observed in the sprint count (p = 0.061), sprint total distance (p = 0.176), and maximum speed (p = 0.161), these differences did not reach statistical significance. These findings may indicate that FWD experienced a notable decline in moderate-intensity efforts and overall distance metrics as the match progressed, whereas their high-speed and sprint-related outputs remained unaffected.
4. Discussion
The aim of the study was to create the match running profile of high-level young football players based on their playing positions in the 1-4-2-3-1 formation. An additional objective was to observe possible differences between the playing positions as well as between the two halves of the match. The results showed that the initial hypotheses were partially confirmed, with the CMFs covering the greatest total distance, while the WDFs covered the greatest distance at a high speed. CMFs performed the most accelerations and decelerations across all positions. As for the entire team, the total distance, movement rate, and the number of accelerations and decelerations decreased in the second half.
4.1. CDF External Load
In this study, CDFs covered the least total distance compared to other playing positions, with significant differences appearing only in comparison to the CMFs. In a recent study [16] conducted on a similar sample, the running profile of playing positions was compared in the formations 1-4-4-2, 1-4-3-3, and 1-3-5-2. The results of the present study are in agreement with those of previous studies, where, regardless of the number of defenders, the central defenders (CDFs) were shown to cover the shortest total distance [16,25]. The tactical role of the position, as well as the strict defensive discipline required in the area in front of the goal, is likely the reason why these players cover the shortest distance.
In a study examining the effects of the 1-4-2-3-1 formation on physical and technical performance in the Chinese First Division League, it was observed that CDFs covered the least TD, while CMFs and WMFs covered the most [11]. The findings of the present study regarding CDFs align with those of other studies, regardless of formation differences. This suggests that the tactical role of CDFs strictly determines their movement on the pitch.
In the present study, CDFs also covered the shortest distance in high-speed running, and their performance was significantly different compared to the CMFs and WDFs. Regarding sprints, CDFs again covered the shortest distance among all positions. Additionally, along with FWDs, the CDFs recorded the fewest accelerations and decelerations. Similar findings regarding the distance covered at a high speed have also been reported in previous studies [11,24,25], regardless of the formation the team used. This may indicate the significant influence of match tactics. More specifically, the tactical role of certain playing positions does not change significantly with a change in formation, resulting in consistent running demands. Regarding accelerations and decelerations, previous studies have also reported similar results, with CDFs performing the fewest in both adult and youth players [20,33,34,35,36].
4.2. WDF External Load
Regarding the WDFs in the current study, they were found to cover a shorter TD than the CMFs. In contrast, Michailidis et al. (2025) [25] observed that youth WDFs in a 1-4-3-3 formation covered more TD than the CMFs. Similarly, among professional players in the same formation (1-4-3-3), WDFs covered the greatest TD. In the 1-3-5-2 formation, WDFs covered similar distances to the FWDs and significantly shorter distances than the CMFs [16]. A study investigating the running demands of the 1-4-2-3-1 formation (same as the current study) found that WDFs covered less TD than the midfielders [11]. The tactical role of WDFs in the defensive line may vary and heavily depends on the midfield players and their roles. As mentioned earlier, formations with three midfielders require greater activity from the WDFs.
In the current study, WDFs covered greater distances than the CDFs in high-speed zones. Additionally, WDFs performed fewer accelerations and decelerations than CMFs but more decelerations than FWDs. The findings of the present study are in agreement with those of previous research [8,11,16,24,25,34]. In modern formations, WDFs actively contribute to both the attacking development and the defensive function of the team. Additionally, players in this position have ample space to carry out their actions. These two elements, which are directly related to the tactical role of the position, may also determine its running profile.
4.3. CMF External Load
The CMFs (Central Midfielders) in the present study covered the greatest total distance (TD) and at the highest rate. In a previous study, it was observed that CMFs covered the greatest distance compared to all other positions [25]. Vardakis et al. [24] report that CMFs covered the greatest TD compared to other playing positions in the 1-4-3-3 formation. In a study comparing formations, it was observed that CMFs covered the greatest distance among all positions in the 1-4-4-2 and 1-4-3-3 formations, while in the 1-3-5-2 formation, they had the second-best performance behind WDFs (Wide Defenders) [16]. In a study conducted in the Chinese football league, it was found that CMFs covered the greatest TD among all positions in the formations 1-4-2-3-1, 1-4-1-4, 1-4-3-3, 1-3-5-2, and 1-3-4-3 [11]. From the above, it is clear that the active role of CMFs in all phases of the game (defense, attack, and transitions) and their connecting role between the other two lines (defense and attack) requires them to be highly active regardless of the formation.
As previously mentioned, in high-speed distances, CMFs covered more distance than CDFs (Central Defenders), while in maximum speed distances, they surpassed both CDFs and FWDs (Forwards). Furthermore, CMFs executed the most accelerations and decelerations compared to all other playing positions. In a study of Under-17 players in the 1-4-3-3 formation, it was observed that CMFs covered the least distance at maximum speed among all positions [25]. In a previous study, it was noted that CMFs covered a shorter distance than WDFs at speeds of 19.8–24 km/h and similar distances at maximum speed compared to FWDs and CDFs [24]. Borghi et al. (2020) [16] observed that in the 1-3-5-2 formation, CMFs covered the greatest high-speed distance, while in other formations, they moved around the team average. Zhang et al. (2024) [11] observed that in the formations 1-4-2-3-1, 1-4-3-3, 1-4-4-2, and 1-4-1-4-1, CMFs had some of the lowest performances in high-speed and maximum-speed distances. Previous studies have shown that wide players perform more accelerations and decelerations [33,34], although there are also reports that found no positional differences [25]. From this review, it appears that findings are not consistent regarding CMF workload in relation to formation. Players operating centrally tend to have more limited space due to a higher number of players (formations strengthen the center), thus this limited space restricts the intense actions they can perform (e.g., it is more difficult to reach speeds >25.2 km/h in the center than on the flanks).
4.4. WMF External Load
WMFs in the present study covered a shorter distance than CMFs and at a slower rate (distance/min). In the 1-4-3-3 formation in youth athletes, it has been reported that WMFs covered the least TD [25], while in the same formation among professional athletes, it was noted that WMFs covered a shorter distance than WDFs but greater than FWDs [24]. In the study by Borghi et al. (2020) [16], it was observed that in the 1-4-4-2 formation, WMFs covered the second greatest TD, something not observed in the 1-4-3-3 and 1-3-5-2 formations. In a recent study, it is reported that in the 1-4-4-2 formation, WMFs covered the greatest TD, while in the 1-4-2-3-1 and 1-4-1-4-1 formations, they covered the second greatest TD [11]. In formations with three defenders (1-3-4-3, 1-3-5-2), they covered distances close to the team’s average TD [11]. These findings suggest that the number of players in the defense and midfield can influence WMF’s running performance.
In the present study, WMFs did not differ significantly from other positions in high-speed distances. In sprints, they covered more distance than CDFs, while in accelerations, they only differed from CMFs. According to the literature, Wide Midfielders (WMFs) are among the playing positions that cover a significant distance at high speed [11,16,24,25]. In the formation used in the present study (1-4-2-3-1), the WMFs, along with the SDFs, operate in the wide areas of the pitch and contribute to both the attacking and defensive actions of the team. This active tactical role, along with the space they have to move in (as there is no congestion of players like in the central axis), is the reason why players in this position cover a considerable distance at high speed. In a recent study on youth players regarding accelerations and decelerations, no positional differences were observed in the 1-4-3-3 formation [25]. However, other studies have reported that wide players performed more accelerations and decelerations than central players [33,34]. Most studies suggest that WMFs cover above-average distances, and players in these positions are distinguished by the intense actions they perform during the match. When comparing accelerations and decelerations across studies, it is important to consider the scale each study uses. WMFs operate in areas where they can reach high speeds and, therefore, can perform high-intensity accelerations and decelerations. CMFs, on the other hand, play in areas where more duels take place, leading to more frequent changes of direction and, thus, a higher number of accelerations and decelerations. However, these may be of lower intensity compared to those performed by players operating in the wide areas of the pitch.
4.5. FWD External Load
FWD in the present study covered a shorter total distance than CMF but did not differ significantly from other positions. Similarly, a recent study observed that FWDs in a 1-4-3-3 formation covered a significantly shorter TD than CMFs; however, no differences were noted compared to other positions [25]. Another study reported that FWDs covered the least TD compared to all other positions in the 1-4-3-3 formation [24]. It has also been reported that FWDs covered the second shortest TD in the 1-4-4-2, 1-4-3-3, and 1-3-5-2 formations [16]. Lastly, Zhang et al. (2024) [11] observed that FWDs covered the second least TD in the 1-3-4-3, 1-3-5-2, 1-4-1-4-1, and 1-4-2-3-1 formations. From the above, it appears that regardless of the formation, FWDs cover less distance than players in other positions—a fact determined by the tactical role of the position and the specific areas of the pitch these players move in.
In distances covered at high speed, there were no significant differences between positions, whereas in sprints, FWDs covered a greater distance than CDFs. Additionally, FWDs performed fewer accelerations than CMFs and fewer decelerations than both CMFs and WDFs. These findings are partially confirmed by previous studies that indicate FWDs in the 1-4-3-3 formation covered a greater distance than CDFs at speeds exceeding 19.8 and 24 km/h [24]. However, Michailidis et al. (2025) reported that in the 1-4-3-3 formation, FWDs covered greater distances at maximum speed compared to CMF [25]. Borghi et al. (2020) [16] also noted that FWDs covered the second greatest distance at high speeds in the 1-4-4-2, 1-4-3-3, and 1-3-5-2 formations. A recent study found that FWD covered the greatest distance at maximum speed in the 1-3-5-2 and 1-4-3-3 formations [11]. Previous studies have reported that FWDs lag behind in the number of accelerations and decelerations compared to wide-position players [33,34]. Generally, the actions of forwards are characterized by high intensity, as they often operate under pressure from one or more opponents. However, their performance may also be influenced by team formation and the number of nearby teammates.
4.6. Halves
Comparing the players’ performance between the two halves in the present study, it was observed that the entire team showed a decrease in TD, pace (distance/min), and in the number of accelerations and decelerations. Regarding positions, all players reduced their performance in terms of accelerations, decelerations, distance at speeds up to 18 km/h, and pace during the second half. Additionally, all positions except WDFs showed a decrease in TD in the second half, while midfield players (CMFs, WMFs) also reduced their sprint performance during the second half. The total distance covered decreased from 4.61 ± 0.44 km to 4.18 ± 0.60 km, and the relative distance per minute dropped from 98.14 ± 9.56 m/min to 84.07 ± 12.70 m/min, suggesting a notable reduction in running volume and intensity over time. Distances covered in lower- and moderate-intensity zones also declined significantly, particularly in Distance Zone 1 (2.42 → 2.20 km) and Distance Zone 2 (1.40 → 1.19 km), whereas Zones 3 and 4 did not exhibit statistically meaningful changes. Sprint-related metrics such as the number of sprints significantly decreased (24.13 → 20.25), while reductions in the total sprint distance and maximum speed did not reach statistical significance, indicating relatively preserved sprint capacity across the halves. Within-position analyses further indicated these patterns. CMFs showed performance reductions across nearly all variables, including the total distance (5.10 → 4.56 km), relative distance (108.36 → 91.22 m/min), sprint count (30.75 → 24.71), and sprint distance (0.76 → 0.61 km), all with statistically significant declines. Similar trends were observed among CDFs, whose running output decreased significantly in Distance Zones 1 and 2, as well as in the total distance and relative intensity, though their sprint outputs remained stable. Forwards also experienced reductions in accelerative actions (65.00 → 58.25) and submaximal running, although they maintained sprint distance and top speed across the halves. WDF and WMF exhibited declines in lower-intensity distances and relative effort, though their high-intensity metrics, including sprinting and maximum speed, remained largely unaffected.
These findings partially align with previous research reporting that CDFs, WDFs, and CMFs covered shorter distances at moderate speeds (<19.8 km/h) in the second half [24,26,33,37]. Borghi et al. (2020) [16] observed that in the 1-4-3-3 formation, CDFs, WDFs, and CMFs covered a shorter TD in the second half. A reduction in high-intensity distance (>19.8 km/h) has also been observed for CMFs and CDFs in the second half [24]; however, there are studies that did not observe a performance drop in the second half [26,27,37,38]. Borghi et al. (2020) [16] noted that WDFs and FWDs reduced high-speed distance in the second half in the 1-4-3-3 formation. As for the distance at the maximum speed, it has been reported that in the 1-4-3-3 formation, only WDFs failed to maintain their performance in the second half [24]. Sprint performance maintenance has also been reported by other studies [26,27,33,38]. The reduction in accelerations and decelerations in the second half observed in the present study was also reported in a previous study [37].
From the existing literature, it is evident that several studies report a decline in running performance during the second half of matches [10,16,19,24,39,40]. This decline may be partially explained by the onset of fatigue as the end of the match approaches [41]. Another factor that may affect performance is the match score [42]. Unfortunately, such parameters were not included in the present study, and this is acknowledged later under the study’s limitations.
4.7. Limitations
Although the study provides useful information for coaches regarding the physical demands across positions in the 1-4-2-3-1 formation, there are some limitations. As previously mentioned, factors that may affect running performance—such as fatigue, coaching philosophy, and individual tactical instructions—were not taken into account. Additional contextual variables (e.g., match score, home or away game) were also excluded from the analysis. Furthermore, the sample was limited, involving only one football team, which does not allow for generalization of the findings. Therefore, future research involving larger samples of young players, incorporating contextual variables that could influence running performance, will provide a more comprehensive profile of this formation.
5. Conclusions
The present study aimed to establish a comprehensive physical performance profile of an elite youth football team by examining (a) inter-positional differences, (b) temporal variations across the match halves, and (c) the interaction between playing position and a match half in running patterns and high-intensity movement demands. Significant variations were observed among playing positions, particularly with CMFs consistently exhibiting the highest external load values. CMFs recorded the greatest total distance covered, relative distance per minute, and total sprint distance, while also demonstrating superior values in accelerations and decelerations, underlining the demanding and transitional role of CMFs. Forwards and wide midfielders reached the highest maximum speeds (31.09 km/h and 30.91 km/h, respectively), reflecting their positional requirements for explosive, high-velocity actions. Further analyses revealed significant decreases in several key performance indicators from the first to the second half.
In summary, this study underscored the positional specificity of physical demands in elite football and the systematic decline in physical output as the matches progress. While all positions demonstrated some degree of second-half performance deterioration, midfielders experienced the most substantial declines in both volume and intensity-related metrics. More specifically, this observation suggests that midfielders could benefit from physical conditioning training in order to reduce the decline in their running performance during the second half. Furthermore, the findings of the present study indicate that running performance demands vary depending on the playing position. Therefore, during the training process, both the content and the volume of load can be adjusted according to the playing position (e.g., WDFs may need to cover greater high-speed distances compared to CDFs).
Author Contributions
Y.M., V.S. and P.V. designed the study and provided critical feedback on the manuscript; V.S., D.K., A.T. and P.V. collected and processed. A.S., P.V. and Y.M. analyzed the data. Y.M., V.S. and A.S. revised the first draft; A.S. and Y.M. conducted the statistical analysis. All authors have read and agreed to the published version of the manuscript.
Funding
This research received no external funding.
Institutional Review Board Statement
The Ethics Committee of the School of Physical Education and Sport Science at Thessaloniki hereby approved the study (App. No. 217/2024, date: 12 November 2024).
Informed Consent Statement
Informed consent was obtained from all subjects or parents of subjects involved in the study.
Data Availability Statement
Data are available upon request from the corresponding author.
Acknowledgments
The authors thank the players of the team who participated in the study.
Conflicts of Interest
Authors Periklis Vlachakis and Athanasios Trampas were employed by the company SMART Physio. The remaining authors declare that the research was conducted in the absence of any commercial or financial relationships that could be construed as a potential conflict of interest.
References
- Stølen, T.; Chamari, K.; Castagna, C.; Wisløff, U. Physiology of soccer: An update. Sports Med. 2005, 35, 501–536. [Google Scholar] [CrossRef]
- Lago-Peñas, C.; Lorenzo-Martinez, M.; López-Del Campo, R.; Resta, R.; Rey, E. Evolution of physical and technical parameters in the Spanish 2012–2019. Sci. Med. Footb. 2023, 7, 41–46. [Google Scholar] [CrossRef]
- Nassis, G.P.; Massey, A.; Jacobsen, P.; Brito, J.; Randers, M.B.; Castagna, C.; Mohr, M.; Krustrup, P. Elite football of 2030 will not be the same as that of 2020: Preparing players, coaches, and support staff for the evolution. Scand. J. Med. Sci. Sports 2020, 30, 962–964. [Google Scholar] [CrossRef]
- Rampinini, E.; Coutts, A.J.; Castagna, C.; Sassi, R.; Impellizzeri, F.M. Variation in top level soccer match performance. Int. J. Sports Med. 2007, 28, 1018–1024. [Google Scholar] [CrossRef]
- Reilly, T.; Bangsbo, J.; Franks, A. Anthropometric and physiological predispositions for elite soccer. J. Sports Sci. 2000, 18, 669–683. [Google Scholar] [CrossRef]
- Vardakis, L.; Michailidis, Y.; Topalidis, P.; Zelenitsas, C.; Mandroukas, A.; Gissis, I.; Christoulas, K.; Mavrommatis, G.; Metaxas, T. Application of a structured training plan on different-length microcycles in soccer—Internal and external load analysis between training weeks and games. Appl. Sci. 2023, 13, 6935. [Google Scholar] [CrossRef]
- Fousekis, A.; Fousekis, K.; Fousekis, G.; Vaitsis, N.; Terzidis, I.; Christoulas, K.; Michailidis, Y.; Mandroukas, A.; Metaxas, T. Two or four weeks acute: Chronic workload ratio is more useful to prevent injuries in soccer? Appl. Sci. 2023, 13, 495. [Google Scholar] [CrossRef]
- Ravé, G.; Granacher, U.; Boullosa, D.; Hackney, A.C.; Zouhal, H. How to use global positioning systems (GPS) data to monitor training load in the “real world” of elite soccer. Front. Physiol. 2020, 11, 944. [Google Scholar] [CrossRef]
- Schuth, G.; Carr, G.; Barnes, C.; Carling, C.; Bradley, P. Positional interchanges influence the physical and technical match performance variables of elite soccer players. J. Sports Sci. 2016, 34, 501–508. [Google Scholar] [CrossRef]
- Rivilla-Garcia, J.; Calvo, L.C.; Jiménez-Rubio, S.; Paredes-Hernández, V.; Muñoz, A.; Van Den Tillaar, R.; Navandar, A. Characteristics of very high intensity runs of soccer players in relation to their playing position and playing half in the 2013–14 Spanish La Liga season. J. Hum. Kinet. 2019, 66, 213–222. [Google Scholar] [CrossRef]
- Zhang, W.; Gong, B.; Tao, R.; Zhou, F.; Ruano, M.Á.G.; Zhou, C. The influence of tactical formation on physical and technical performance across playing positions in the Chinese Super League. Sci. Rep. 2024, 14, 2538. [Google Scholar] [CrossRef]
- Modric, T.; Versic, S.; Sekulic, D. Position specific running performances in professional football (soccer): Influence of different tactical formations. Sports 2020, 8, 161. [Google Scholar] [CrossRef]
- Tierney, P.J.; Young, A.; Clarke, N.D.; Duncan, M.J. Match play demands of 11 versus 11 professional football using global positioning system tracking: Variations across common playing formations. Hum. Mov. Sci. 2016, 49, 1–8. [Google Scholar] [CrossRef]
- Aquino, R.; Vieira, L.H.P.; Carling, C.; Martins, G.H.; Alves, I.S.; Puggina, E.F. Effects of competitive standard, team formation and playing position on match running performance of Brazilian professional soccer players. Int. J. Perform. Anal. Sport 2017, 17, 695–705. [Google Scholar] [CrossRef]
- Vieira, L.H.P.; Aquino, R.; Lago-Penas, C.; Martins, G.H.M.; Puggina, E.F.; Barbieri, F.A. Running performance in Brazilian professional football players during a congested match schedule. J. Strength Cond. Res. 2018, 32, 313–325. [Google Scholar] [CrossRef]
- Borghi, S.; Colombo, D.; La Torre, A.; Banfi, G.; Bonato, M.; Vitale, J.A. Differences in GPS variables according to playing formations and playing positions in U19 male soccer players. Res. Sports Med. 2021, 29, 225–239. [Google Scholar] [CrossRef]
- Arjol-Serrano, J.L.; Lampre, M.; Díez, A.; Castillo, D.; Sanz-López, F.; Lozano, D. The influence of playing formation on physical demands and technical-tactical actions according to playing positions in an elite soccer team. Int. J. Environ. Res. Public Health 2021, 18, 4148. [Google Scholar] [CrossRef]
- Dellal, A.; Wong, D.P.; Moalla, W.; Chamari, K. Physical and technical activity of soccer players in the French First League–with special reference to their playing position. J. Sports Sci. 2010, 11, 278–290. [Google Scholar]
- Vigh-Larsen, J.F.; Dalgas, U.; Andersen, T.B. Position-specific acceleration and deceleration profiles in elite youth and senior soccer players. J. Strength Cond. Res. 2017, 32, 1114–1122. [Google Scholar] [CrossRef]
- Conde-Pipó, J.; de Sousa Pinheiro, G.; Pombal, D.F.; Toscano, L.M.; Llamas, J.E.G.; Gallardo, J.M.C.; Requena, B.; Mariscal-Arcas, M. Investigating acceleration and deceleration patterns in elite youth football: The interplay of ball possession and tactical behavior. Appl. Sci. 2024, 14, 4336. [Google Scholar] [CrossRef]
- Djaoui, L.; Owen, A.; Newton, M.; Nikolaidis, P.T.; Dellal, A.; Chamari, K. Effects of congested match periods on acceleration and deceleration profiles in professional soccer. Biol. Sport 2022, 39, 307–317. [Google Scholar] [CrossRef] [PubMed]
- Hader, K.; Rumpf, M.C.; Hertzog, M.; Kilduff, L.P.; Girard, O.; Silva, J.R. Monitoring the athlete match response: Can external load variables predict post-match acute and residual fatigue in soccer? A systematic review with meta-analysis. Sports Med. Open 2019, 5, 48. [Google Scholar] [CrossRef] [PubMed]
- Thoseby, B.; Govus, A.D.; Clarke, A.C.; Middleton, K.J.; Dascombe, B.J. Peak match acceleration demands differentiate between elite youth and professional football players. PLoS ONE 2023, 18, e0277901. [Google Scholar] [CrossRef] [PubMed]
- Vardakis, L.; Michailidis, Y.; Mandroukas, A.; Mavrommatis, G.; Christoulas, K.; Metaxas, T. Analysis of the running performance of elite soccer players depending on position in the 1-4-3-3 formation. Ger. J. Exerc. Sport Res. 2020, 50, 241–250. [Google Scholar] [CrossRef]
- Michailidis, Y.; Stafylidis, A.; Vardakis, L.; Kyranoudis, A.E.; Mittas, V.; Leftheroudis, V.; Plakias, S.; Mandroukas, A.; Metaxas, T.I. The running performance of elite youth football players in matches with a 1-4-3-3 formation in relation to their playing position. Appl. Sci. 2025, 15, 3984. [Google Scholar] [CrossRef]
- Di Salvo, V.; Baron, R.; Tschan, H.; Calderon Montero, F.J.; Bachl, N.; Pigozzi, F. Performance characteristics according to playing position in elite soccer. Int. J. Sports Med. 2007, 28, 222–227. [Google Scholar] [CrossRef]
- Barros, R.; Misuta, M.; Menezes, R.; Figueroa, P.; Moura, F.; Cunha, S.; Leite, N.; Anido, R. Analysis of the distances covered by first division Brazilian soccer players obtained with an automatic tracking method. J. Sports Sci. Med. 2007, 6, 233–242. [Google Scholar]
- Beato, M.; Coratella, G.; Stiff, A.; Iacono, A.D. The Validity and Between-Unit Variability of GNSS Units (STATSports Apex 10 and 18 Hz) for Measuring Distance and Peak Speed in Team Sports. Front. Physiol. 2018, 9, 1288. [Google Scholar] [CrossRef]
- IBM Corporation. IBM SPSS Statistics for Windows, Version 29.0.2.0; IBM Corporation: Armonk, NY, USA, 2025. Available online: https://www.ibm.com/analytics/spss-statistics-software (accessed on 20 March 2025).
- The Jamovi Project. Jamovi, Version 2.6; The Jamovi Project: Sydney, Australia, 2025. Available online: https://www.jamovi.org (accessed on 20 March 2025).
- JASP Team. JASP, Version 0.19.3.0; JASP Team: Amsterdam, The Netherlands, 2025. Available online: https://jasp-stats.org (accessed on 20 March 2025).
- Cohen, J. Statistical Power Analysis for the Behavioral Sciences; Routledge: London, UK, 2013. [Google Scholar]
- Ingebrigtsen, J.; Dillern, T.; Shalfawi, S.A. Aerobic capacities and anthropometric characteristics of elite female soccer players. J. Strength Cond. Res. 2011, 25, 3352–3357. [Google Scholar] [CrossRef]
- Dillern, T.; Ingebrigtsen, J.; Essendrop, G.; Haugen, G.H.; Wisløff, U. Player load, acceleration, and deceleration during 45 competitive matches of elite soccer. J. Strength Cond. Res. 2016, 30, 351–359. [Google Scholar]
- Serpiello, F.R.; Duthie, G.M.; Moran, C.; Kovacevic, D.; Selimi, E.; Varley, M.C. The occurrence of repeated high acceleration ability (RHAA) in elite youth football. Int. J. Sports Med. 2018, 39, 502–507. [Google Scholar] [CrossRef] [PubMed]
- Morgans, R.; Bezuglov, E.; Orme, P.; Burns, K.; Rhodes, D.; Babraj, J.; Di Michele, R.; Oliveira, R.F. The physical demands of match-play in academy and senior soccer players from the Scottish Premiership. Sports 2022, 10, 150. [Google Scholar] [CrossRef] [PubMed]
- Vigne, G.; Gaudino, C.; Rogowski, I.; Alloatti, G.; Hautier, C. Activity profile in elite Italian soccer team. Int. J. Sports Med. 2010, 31, 304–310. [Google Scholar] [CrossRef] [PubMed]
- Bradley, P.S.; Sheldon, W.; Wooster, B.; Olsen, P.; Boanas, P.; Krustrup, P. High intensity running in English FA Premier League soccer matches. J. Sports Sci. 2009, 27, 159–168. [Google Scholar] [CrossRef]
- Akenhead, R.; Hayes, P.R.; Thompson, K.G.; French, D. Diminutions of acceleration and deceleration output during professional football match play. J. Sci. Med. Sport 2013, 16, 556–561. [Google Scholar] [CrossRef]
- Reilly, T.; Drust, B.; Clarke, N. Muscle fatigue during football match-play. Sports Med. 2008, 38, 357–367. [Google Scholar] [CrossRef]
- Asian-Clemente, J.; Suarez-Arrones, L.; Requena, B.; Santalla, A. Influence of tactical behaviour on running performance in the three most successful soccer teams during the competitive season of the Spanish First Division. J. Hum. Kinet. 2022, 82, 135–144. [Google Scholar] [CrossRef]
- Plakias, S.; Michailidis, Y. Factors affecting the running performance of soccer teams in the Turkish Super League. Sports 2024, 12, 196. [Google Scholar] [CrossRef]
Disclaimer/Publisher’s Note: The statements, opinions and data contained in all publications are solely those of the individual author(s) and contributor(s) and not of MDPI and/or the editor(s). MDPI and/or the editor(s) disclaim responsibility for any injury to people or property resulting from any ideas, methods, instructions or products referred to in the content. |
© 2025 by the authors. Licensee MDPI, Basel, Switzerland. This article is an open access article distributed under the terms and conditions of the Creative Commons Attribution (CC BY) license (https://creativecommons.org/licenses/by/4.0/).