1. Introduction
As demand for coal rises, China’s shallow coal resources are slowly running out. Mining is moving deeper, and the amount of coal mined from deep mines has increased [
1,
2,
3]. As mining goes deeper, the geological environment around the roadways is getting worse, and the distribution of ground stress fields is becoming increasingly complex [
4,
5]. The conditions for coal to form in China are complicated and constantly changing. In the active area of deep geological structures, the joints of rock layers cut each other, and the surrounding rock is very tectonically active [
6,
7]. The high tectonic stress complicates road excavation. The geological environment surrounding the roadway differs greatly from the gravitational field as a result of tectonic stress [
8,
9]. For example, obstacles include an elevated stress concentration coefficient, difficulties matching the roadway’s axial direction with the principal stress direction, and worsening roadway deformation and failure [
10,
11,
12]. If the roadway support measures are not performed correctly, the rock around the roadway will also deform a lot, and the supporting structure will become unstable. Some studies have focused on the numerical simulation and physical modeling of roadway deformation under complex stress fields [
13,
14,
15]. For safe mining operations in deep coal mines, it is currently crucial to address the stability of the surrounding rock in a soft rock roadway within a deep structural zone [
16,
17,
18].
In recent years, international research has proposed advanced technologies for monitoring and stabilizing mine roadways under complex stress conditions. For example, Kononov et al. [
19] developed a smart controller system for real-time assessment of bottom-hole drill string vibrations and shock loads, offering new insights into intelligent monitoring in dynamic underground environments. Shatov et al. [
20] introduced a novel friction damper based on a helically cut shell structure, demonstrating improved performance in absorbing dynamic energy and enhancing roadway stability.
Additionally, Babets et al. [
21] investigated deformation mechanisms and stress redistribution near goaf boundaries, emphasizing the role of tectonic stress in roadway damage. Demin et al. [
22] explored longwall support strategies under high-stress conditions, providing practical insights for reinforcement design in deep mining. These studies enrich the understanding of roadway behavior under complex geological conditions and support the application of intelligent and adaptive support systems in modern coal mines.
Furthermore, when driving excavations through geologically disturbed zones, the stability of surrounding rock becomes substantially more challenging due to intensified deformation and failure risks. Under such complex stress environments, it is often necessary to employ enhanced support techniques, such as thickened supports or specially designed yielding supports that are designed to accommodate large deformations without losing their load-bearing capacity [
23].
In recent years, numerous studies have focused on the control of roadway stability under tectonic stress. For example, Szlązak et al. [
24] used the finite element method to assess the influence of various support types and concluded that pre-grouting significantly improved roadway stability in fault-affected zones, providing a basis for support optimization. Sun et al. [
25] conducted physical modeling and monitored roof subsidence, floor heave, and thermal anomalies using infrared thermography and visual recording. Their findings indicated that thermal anomalies were concentrated in high-stress areas, correlating with the initiation of tensile cracks and plastic deformation, thus demonstrating the feasibility of using thermal monitoring to predict early failure. Li et al. [
26] investigated roadway failures in weak strata and proposed a new support scheme based on the coupled effect of high tectonic stress and low rock strength, which was validated through on-site applications. Ma et al. [
27] examined red shale in deep mines and found that compressive strength decreased significantly with increasing in situ stress and unfavorable bedding angles, indicating the importance of structural anisotropy in roadway support design. Tang et al. [
28] employed numerical simulations to evaluate how abrupt changes in coal properties impact gas outbursts. They found that stress is transferred non-uniformly between soft and hard coal seams, potentially increasing the risk of dynamic disasters in transition zones. Xie et al. [
29] proposed an “external anchor–internal unloading” control technology for gob-side entries in ultra-deep mines. Their results demonstrated that this technique effectively redistributed stress and limited surrounding rock deformation, particularly during excavation near goafs. Xiao et al. [
30] studied coal pillar failure induced by fault-induced stress concentration. They identified zones of high elastic energy accumulation within coal seams and revealed that the coupling between coal seam, roof, and floor plays a key role in inducing bursts.
While these studies offer important insights, most focus on specific geological conditions or individual stress orientations. Few systematically investigate how variations in the angle between the roadway axis and the principal horizontal tectonic stress affect surrounding rock behavior. Further research is needed to understand the mechanical response of surrounding rock when the roadway is oriented at different angles to deep tectonic stress, particularly in the extreme case of perpendicular (90°) alignment, which is associated with the most severe deformation and stress concentration. This study addresses this gap through numerical simulations and field validation under varying angular conditions.
This paper examines the 1232(3) working face at Dingji Coal Mine. The mine is situated near Huainan, China. We analyze a soft rock roadway subjected to significant tectonic stress. Our investigation focuses on the stability of roof rock. We evaluate mechanical reactions at various stress–roadway angles. The redistribution of stress is contingent upon this angle. We also examine the impact of excavation under tectonic loading. The findings will inform pragmatic engineering solutions.
2. Project Overview
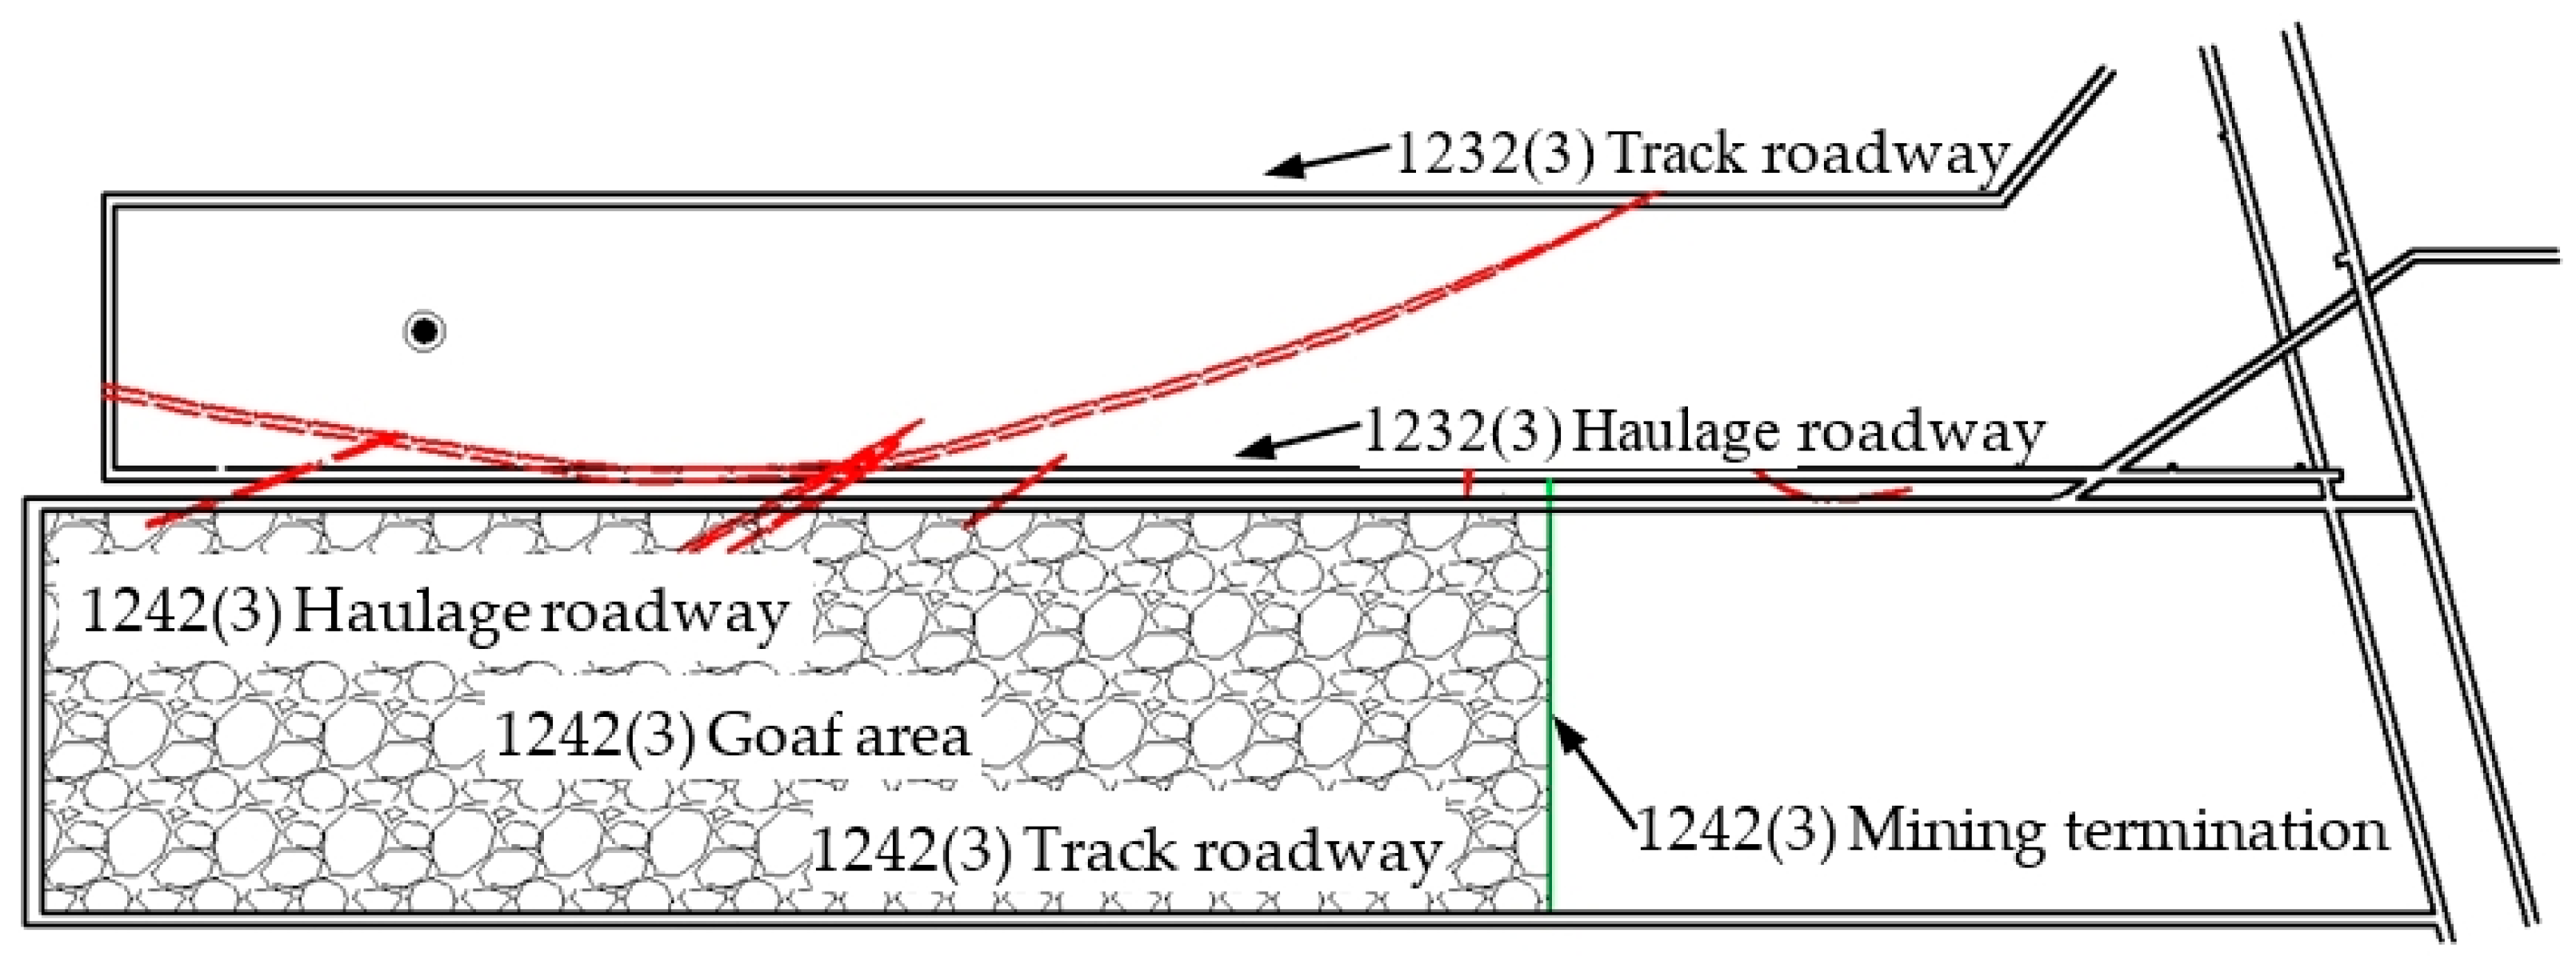
The Dingji Coal Mine is situated in the northwest of Huainan City, Anhui Province, China, near the geographic center of the Panxie mining area. There is a specific structural framework around the 1232(3) working face. The mining area system roadway runs along the eastern edge, and the boundary of the Xiyi 13-1 mining area runs along the western edge. The F84 reverse fault, which has a throw of 60 m, is to the north, and the 1242(3) working face, which was previously mined, is to the south. The study examines the 1232(3) transportation road. A protective coal pillar separates this road from the goaf of the nearby 1242(3) working face. This roadway goes along the goaf.
Figure 1 shows the plan for the working face’s roadway layout. The average daily advancement is approximately 3.5 m. After mining, both ends of the face are sealed using shotcrete to isolate the goaf and prevent air leakage.
The operational face lies in the 13th coal seam. The coal seam has an average dip angle of 7° and a thickness of 3.8 m. The majority of the coal seam’s roof is mudstone; however fine sandstone can also be found in select areas. This lithological unit is about 4 m thick on average. The main roof is made up of sandy mudstone, which is sometimes mixed with mudstone. It is about 3 m thick on average. The mudstone at the foot of the coal seam has an average thickness of 4.8 m. The original bottom of the coal seam is composed of fine sandstone that is approximately 4.5 m thick. We extracted standard samples from roof strata, floor strata, and coal body samples from the roadway. The strength of the specimens was evaluated through standard tests. Tensile strengths of 0.7 MPa for 13-1 coal, 1.4 MPa for mudstone, 1.5 MPa for sandy mudstone, and 2.58 MPa for fine sandstone were determined by the test results. These tensile strength values were obtained in accordance with the Chinese national standard GB/T 23561.5-2009 [
31], which is consistent with the International Society for Rock Mechanics’ (ISRM) suggested methods for indirect tensile strength testing of rock. The results show that the surrounding rock mass is structurally weak, which means it has low bearing capacity.
Figure 2 provides further details on the strata of the ceiling and substrate.
The test results from three places—the south side of the Huqiaozi syncline (No. 1 station), the area around the Huqiaozi syncline (No. 2 station), and the north side of the Huqiaozi syncline (No. 3 station) are used to calculate the in situ stress of the 1232(3) working face.
According to
Table 1, the lateral pressure coefficient at the working face is determined to range from 1.03 to 1.65. This shows that horizontal tectonic stress is the most important type of stress in the region [
32]. The anchor net cable’s symmetrical support is used in the design of the 1242(3) transportation roadway’s support. During excavation, the rock around the 1242(3) transportation roadway seems to change shape a lot. This paper is mostly about the mechanical response characteristics and use of the surrounding rock of the 1232(3) transport roadway because it is next to the 1242(3) transport roadway.
3. Mechanical Investigation of the Surrounding Rock in a Deep Soft Rock Roadway Generated by Tectonic Stress
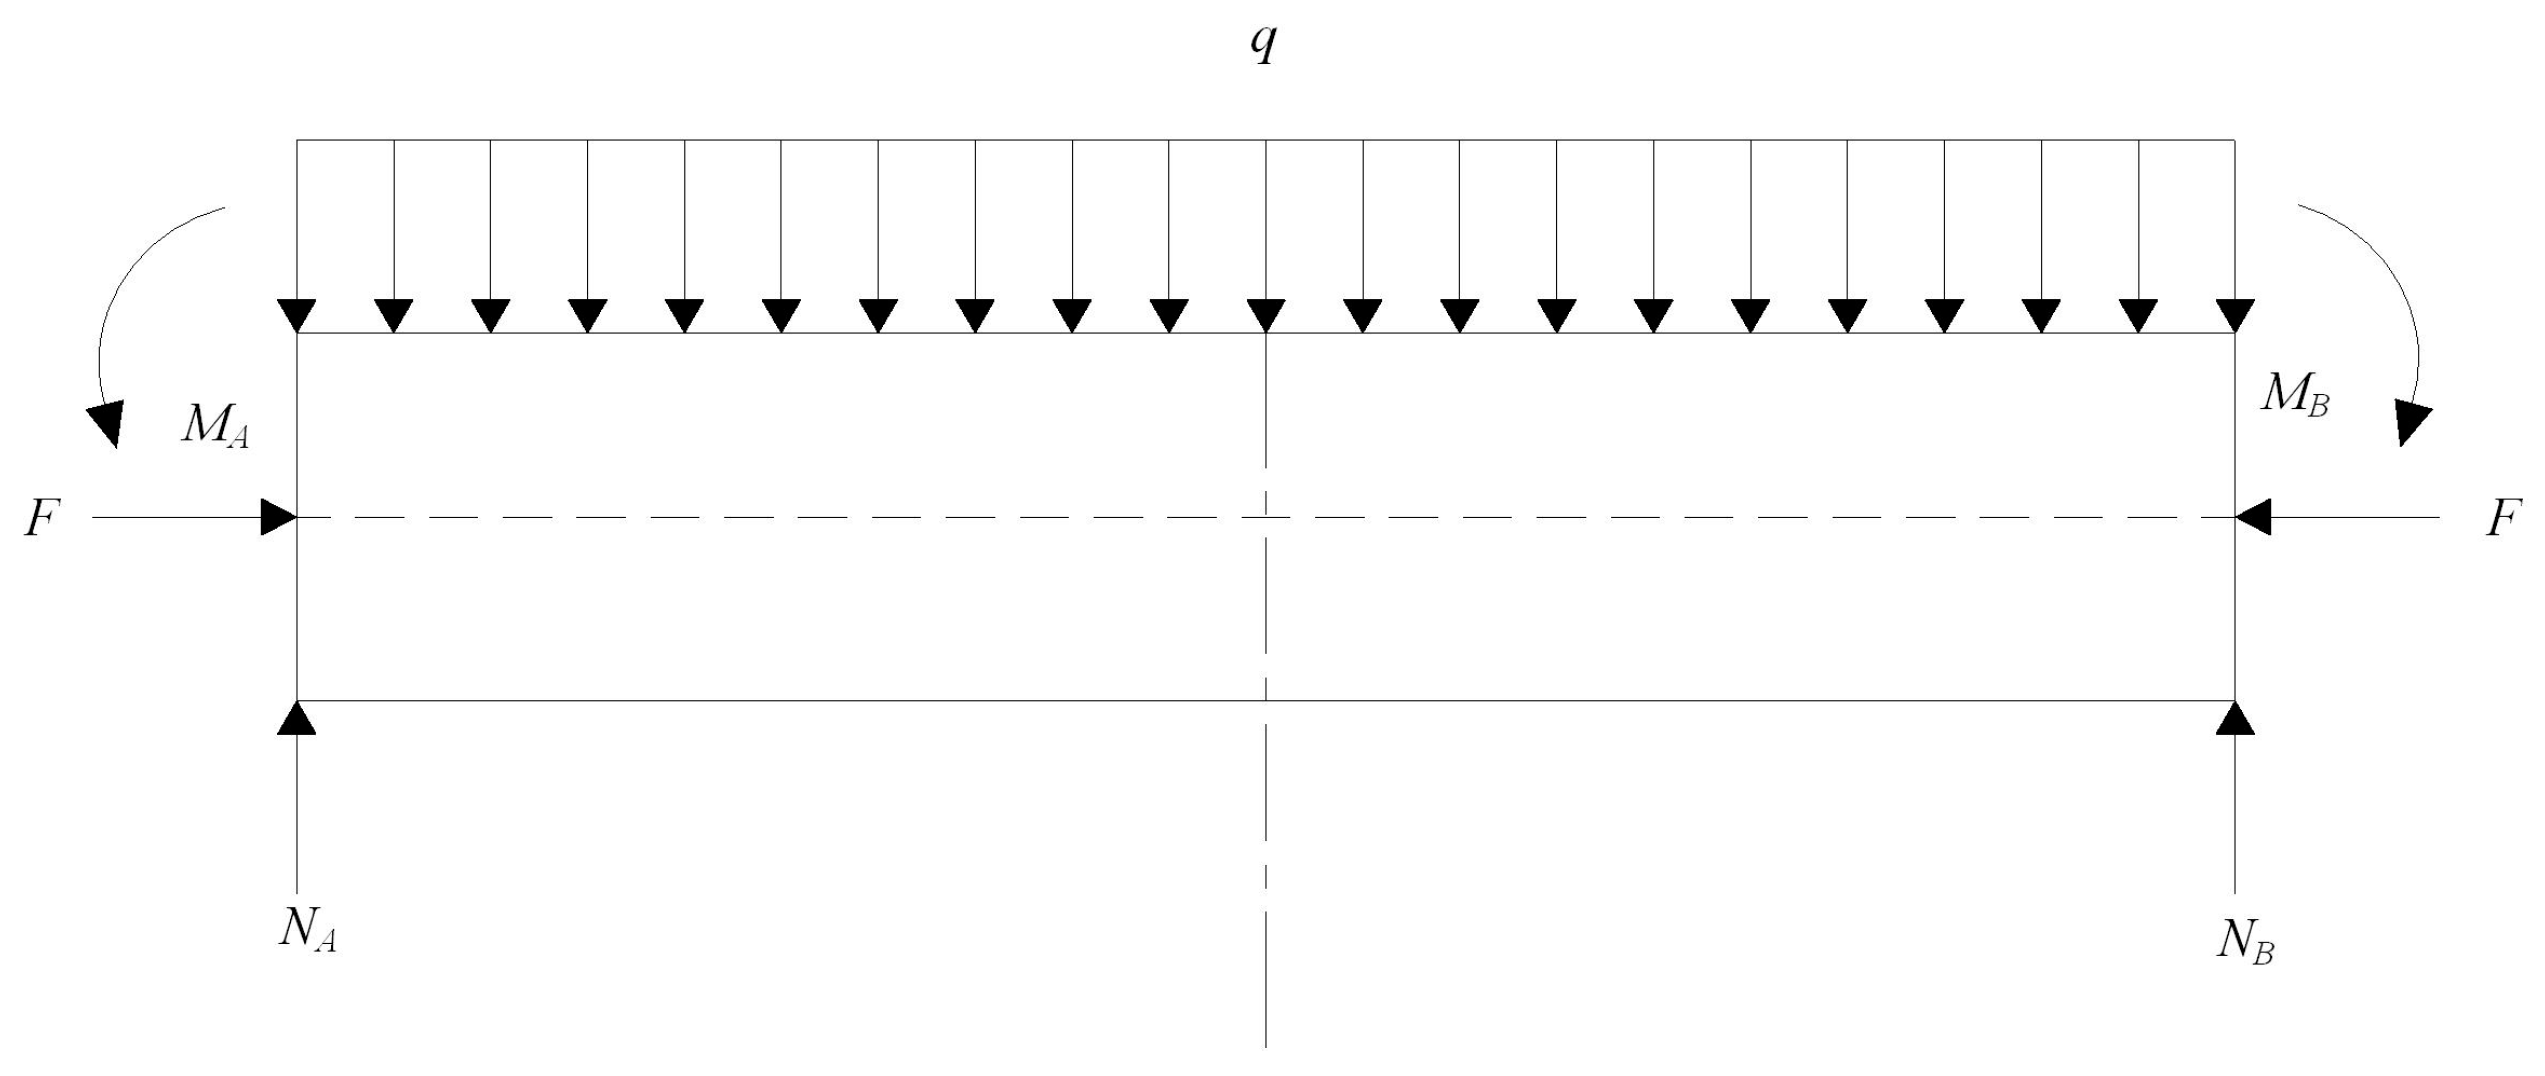
Because the roof of the roadway is stable, the theoretical research method is usually to simplify the roof strata into beam and plate models that are clamped or simply support [
33]. However, the model does not take into account the horizontal tectonic stress on both ends, which creates a big difference between the calculated results and what actually happened on the project. This section improves the standard mechanical model of roof strata. In the project area, the roof strata consist of multiple thin rock layers with differing mechanical and deformation properties. Due to the geological complexity and the difficulty in accurately characterizing the mechanical interactions and potential slip surfaces between layers, the layered structure was simplified into a single equivalent beam with averaged mechanical properties.
Additionally, to facilitate the development of the mechanical model and reduce computational complexity, the roof material was assumed to follow linear elastic behavior. This simplification allows for tractable analysis of stress transfer and deformation mechanisms. However, it does not fully capture the nonlinear, anisotropic, or time-dependent characteristics of deep soft rocks under high in situ stress, particularly in tectonically active zones. The process of creating a mechanical model of the roadway roof strata is illustrated in
Figure 3.
The reaction moment
MA MB and the support reaction force
NA NB come from the two ends of the roadway support. This happens because of the self-weight
q and the horizontal tectonic stress
F. The equation for how the roof beam bends is:
We can find
Mx in Equation (1) when
:
E is the roof’s elastic modulus.
I is the section’s moment of inertia.
F is the tectonic stress acting on both ends of the roof.
L is the horizontal span of the roadway roof. Set
. Equation (2) can be simplified as:
The general solution of the homogeneous equation
is
, where A and B are two whole numbers. The non-homogeneous special solution to Equation (3) is
. We can find constants A and B by looking at the boundary conditions. By putting A and B into Equation (3), we can find the bending deformation of roof strata caused by both
q and
F. It is clear that the deflection is biggest when
x =
L/2, and its value is:
Based on this linear elastic assumption and the beam-like geometry of the roof strata, the Euler–Bernoulli beam theory is adopted to analyze the buckling behavior of the roof under axial tectonic stress. The minimum horizontal tectonic stress
Fcr, which causes the roof beam to bend and lose stability, is calculated as:
If there is no horizontal tectonic stress, then
q acts alone, and Equation (2) can be written as:
The answer to the boundary conditions shows that the deflection is highest at
x =
L/2, and the value is:
The buried depth of the coal seam and the actual conditions of the roadway excavation show that the bulk density γ of the overlaying strata is 2500 kN/m3, the buried depth of the roadway is 800 m, and the horizontal span L of the roadway roof is 5.5 m. When the roof beam reaches the yield limit under the minimum horizontal tectonic stress, the deflection is w = 7.72 cm. This is found by adding each parameter into Equation (7).
The deflection limit of 7.72 cm is determined from theoretical analysis as the maximum yield limit of the roof beam under horizontal tectonic stress. Exceeding this threshold indicates the onset of large deformation and potential instability. In engineering applications, the stability control measures proposed in
Section 6 have been implemented to constrain roof separation within 77 mm. Field monitoring confirms that, under these measures, the roof deformation remained below the theoretical failure limit, validating the applicability of the criterion.
More research shows that after the 1232(3) transportation route has been dug up to the 1242(3) stop line, the horizontal tectonic stress in the rock around the roadway will alter a lot because of the stress transfer from the nearby goaf. To find out how the change in the maximum horizontal tectonic stress affects the bending of the road roof, we define the ratio
as the buckling deflection variation coefficient and the ratio
as the horizontal tectonic stress variation coefficient. More information can be obtained by putting (5), (6), and (7) into it:
Figure 4 shows that, when
Fw is less than 0.6,
Rw rises slowly. This is a slow and stable change interval, which means that the change in horizontal tectonic stress does not have much of an effect on the change in roof deflection. The change in the deflection ratio gets bigger when
Fw is greater than 0.6. Specifically, when the actual tectonic stress
F exceeds 76% of the critical buckling threshold
Fcr, which is the minimum horizontal stress required to initiate roof beam buckling, that is, when
F > 0.76
Fcr, the roof deformation increases rapidly. This marks the onset of structural yield and indicates a high risk of roof instability or failure.
4. Mechanical Response Characteristics of Roadway Surrounding Rock Under Different Angles Between Tectonic Stress and Roadway
The third part of the theoretical analysis explores the influence of horizontal tectonic stress on the roof rock beam of the roadway. In practical engineering applications, the orientation of tectonic stress frequently does not align with the configuration of roadway layouts, resulting in altered stress distributions in the surrounding rocks. It is necessary for the theoretical model to be used in engineering practice to find out how the rock around the roadway reacts when the horizontal tectonic stress and the roadway are at different angles.
4.1. Changing the Coordinates of the Numerical Model
The third-order primary stress tensor needs to be converted into the third-order stress tensor in the generalized plane coordinate system, since in situ stress measurement typically yields the principal stress and its direction of in situ stress, and the roadway layout is possible in any direction [
34,
35,
36]. Using Equation (9), the tensor of the known coordinate system can be changed into the tensor expression of the coordinate system in any direction.
A is the tensor in the original coordinate system. A′ is the tensor in the new coordinate system. L is the transition matrix from the original coordinate system to the new coordinate system.
Figure 5 shows the model for calculating the roadway in any direction.
σ1,
σ2 and
σ3 are known ground stresses. The new system’s vertical coordinate lines up with that of the original system because a new coordinate framework has been set up. Equation (10) shows the transition matrix.
In the equation,
θ is the angle between the
σ1 direction of the maximum horizontal principal stress square and the axial direction of the roadway layout. Using the equation above, the stress transformation is performed, and the stress tensor of the new coordinate system is put into the formula for calculating the stress field:
Here, σ1, σ2 and σ3 are known ground stresses, and the stress tensor Pij represents transformed stress components within the new coordinate system.
The angle
θ is the variable in the simulation experiment, and there are five working conditions: 0°, 30°, 45°, 60°, and 90°. We use the results of the in situ stress test in
Table 1 to find the
σ’xx,
σ’yy and
σ’zz for five different sets of working conditions. The results are shown in
Table 2. Using the findings of the calculations above, we look at how different angles affect the rock around the roadway.
4.2. Building a Numerical Model with Different Angles Between Tectonic Stress and the Roadway
We use FLAC
3D software (FLAC
3D v5.0) to create a three-dimensional numerical simulation model and simulate the five groups of operating conditions presented in
Table 2. The initial stress shown in
Table 2 is applied in the
x and
y directions of the model. The ratio of
σ’xx to
σ’zz gives you the lateral pressure coefficient. Different stress gradients are simulated by changing the lateral pressure coefficients.
Figure 6 shows the numerical calculation model.
Table 3 shows the mechanical properties of rock layers. The mechanical parameters listed in
Table 3 were obtained through laboratory testing of standard specimens sampled from the roof, floor, and coal seam. Testing followed procedures outlined in the Chinese national standard GB/T 50266-99 [
37]. Bulk modulus values were derived from measured elastic modulus and Poisson’s ratio.
4.3. Distribution Characteristics of Horizontal Stress Under Different Angles Between Tectonic Stress and Roadway
Cloud diagrams showing horizontal stress distributions in the surrounding rock at various angles to the axial direction of the roadway plan and the direction of tectonic stress are displayed in
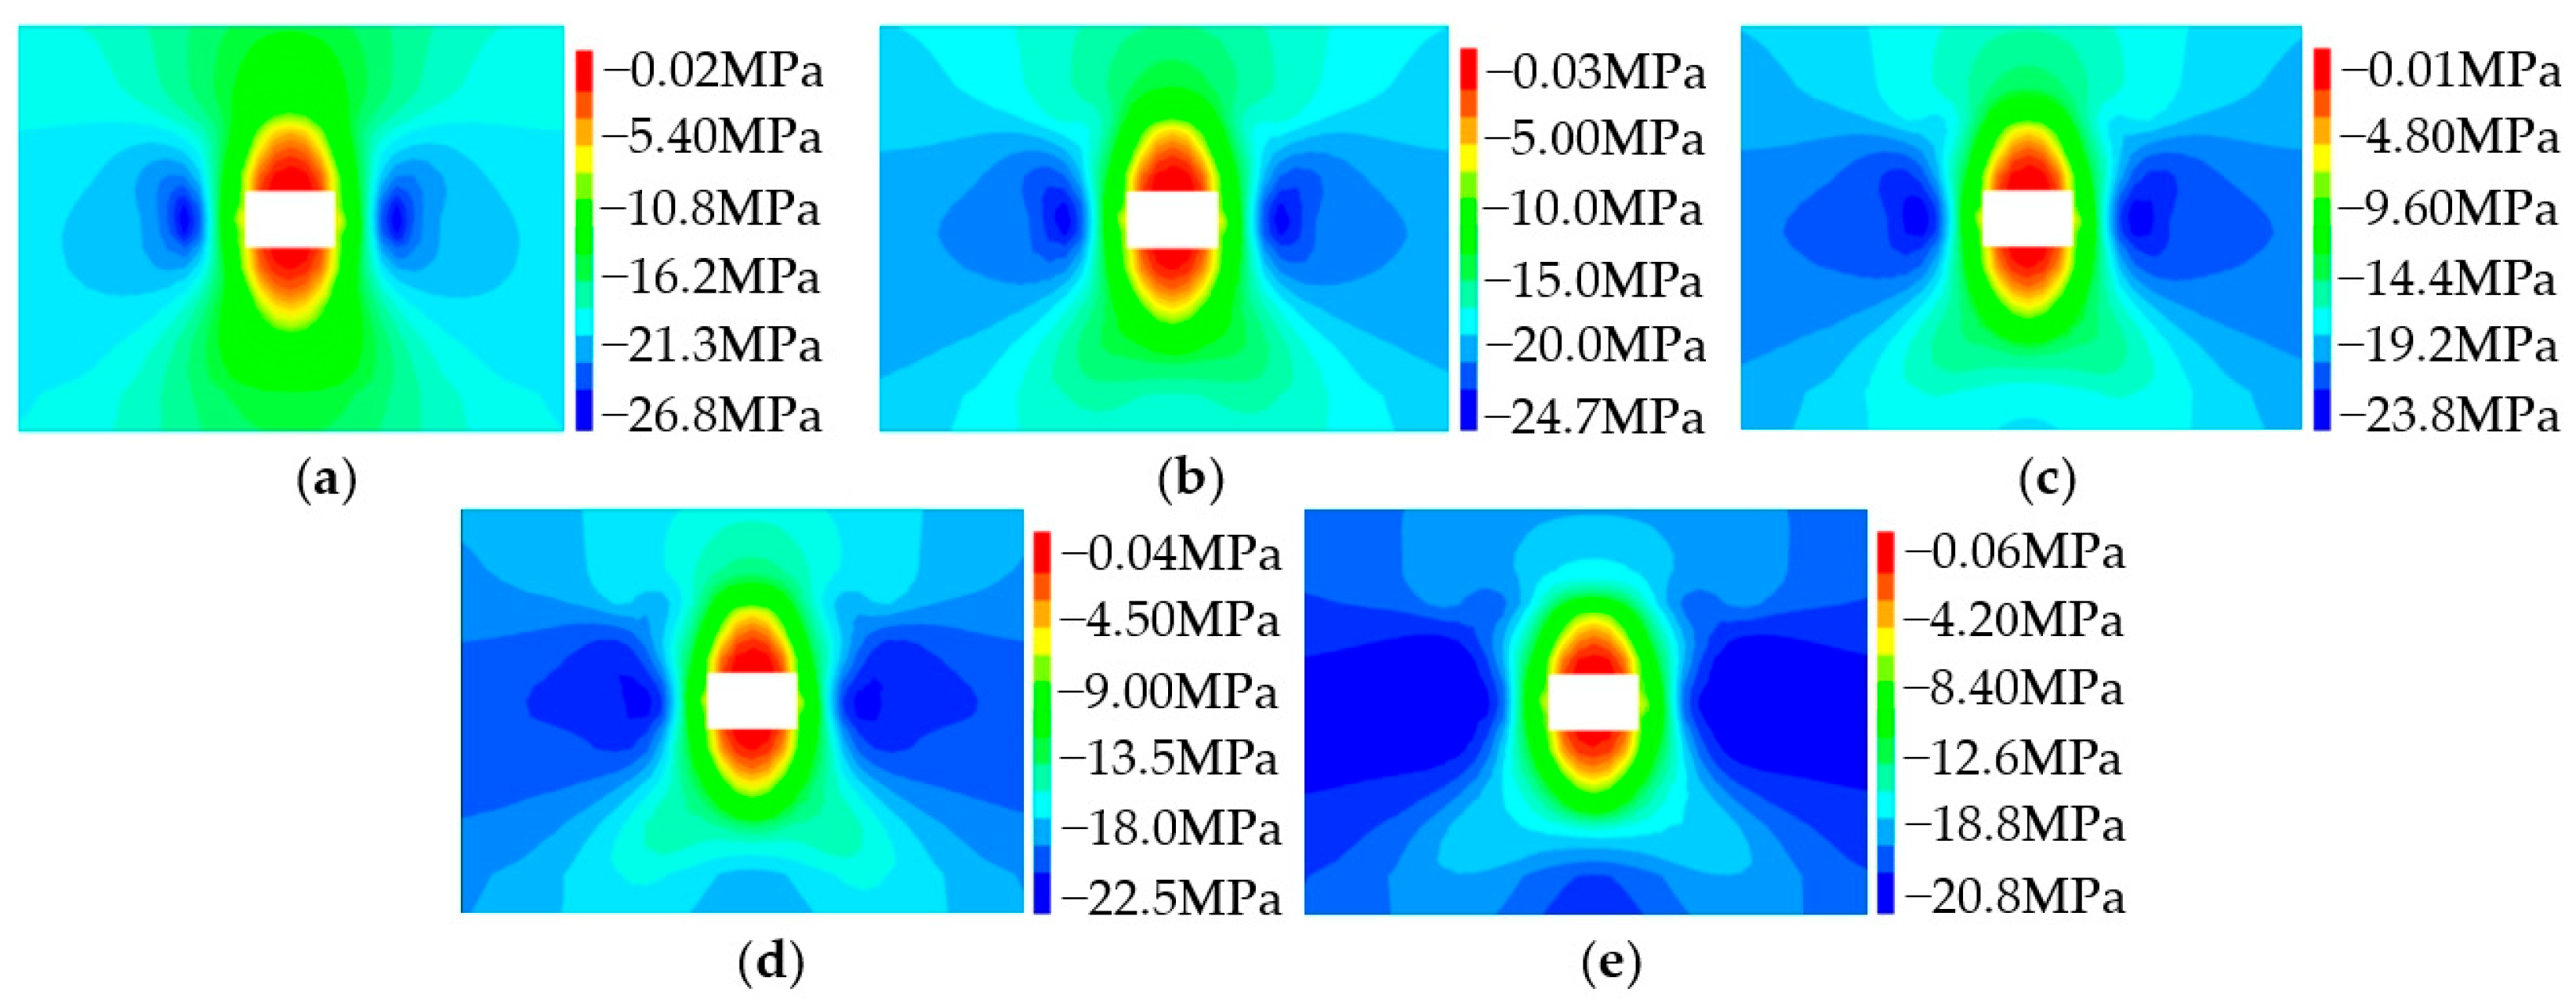
Figure 7. The horizontal stress reduction zone manifests in the floor and roof’s shallow layers, as well as those on either side of the roadway, when the angle is 0 degrees. The horizontal stress concentration zone appears in the deep layers on the roof and floor. The highest horizontal stress in the deep rock layer of the top plate is 39.6 MPa. The deeper rock layers of the top plate have more horizontal stress than the bottom plate. When the angle is 30°, the peak horizontal stress of the deep rock in the roof rises to 46.2 MPa, after which it progressively diminishes in the deeper rock layer of the roof. When the angle is 45°, the pressure relief range on both sides of the roadway and the shallow layers of the roof and floor gets bigger. The deep rock layer of the roof has a wider range of horizontal stress concentrations. The highest horizontal stress is 49.8 MPa. The highest level of horizontal stress concentration in the deep rock layer of the roof rises to 55.0 MPa when the angle is 60°. The area of the roadway that can relieve pressure has grown, but the amount of pressure relief is getting less. When the angle is 90°, the horizontal stress concentration in the deep rock strata of the roof attains its maximum level, with a peak value of 59.4 MPa. As mentioned earlier, the surrounding rock mainly consists of mudstone, sandy mudstone, and fine sandstone, with a tensile strength of less than 2 MPa, based on laboratory test results. Given that the roadway is located in a deep soft rock environment, the surrounding rock mass exhibits low load-bearing capacity and is highly susceptible to failure induced by high horizontal stress. Under these conditions, the concentrated stress far exceeds the tensile strength, increasing the likelihood of tensile cracking, interlayer separation, and roof deformation. Therefore, the 90° orientation represents the most unfavorable stress configuration and a critical condition for roof instability.
The horizontal tectonic stress directly controls the amount of horizontal stress around the roadway and how it is released by directional extrusion. As the angle gets bigger, the shallow rock layer of the roadway’s pressure relief range gets bigger, and the deep rock layer of the roadway’s horizontal stress gets bigger. The roof causes horizontal stress to build up in certain areas because of horizontal tectonic stress extrusion. The roadway roof is the most likely to change shape.
4.4. Vertical Stress Distribution Characteristics Under Different Angles Between Tectonic Stress and Roadway
Figure 8 illustrates the vertical stress distribution of the roadway surrounding rock at various angles. At an angle of 0°, a vertical stress reduction zone manifests in the ceiling and floor of the roadway, whereas a vertical stress concentration zone emerges on the two sides of the roadway. Additionally, vertical stress concentration areas are present on both sides of the roadway. The pressure relief range of the roadway roof and floor remains relatively stable when the angle is 30°. The vertical stress concentration peak is 24.7 MPa, and the vertical stress concentration degree on both sides of the roadway is going down. At an angle of 45°, the vertical stress concentration peak drops to 23.8 MPa, and the vertical stress concentration degree on both sides of the roadway is even lower. A stress disturbance zone is present at a 60° angle around the roadway, along with a localized vertical stress concentration zone in the deep rock strata of the roof and floor. The deep rock layers in the roof and floor experience their highest vertical stress concentration range at an angle of 90 degrees.
In conclusion, the horizontal tectonic stress leads to a redistribution of stress following roadway excavation by altering the original rock stress field’s distribution state, thereby influencing the spatial distribution characteristics of vertical stress. As the angle incrementally rises from 0° to 90°, there is a noticeable increase in the vertical stress concentration within the rock strata at the base of the roadway, while the vertical stress concentration on the sides of the roadway exhibits a declining trend. The horizontal tectonic stress extrusion alleviates the vertical stress in the center of the roof and floor, resulting in the formation of a compressive stress zone at the upper section of the roadway, which leads to roof separation.
4.5. Distribution Characteristics of the Flexible Zone in Surrounding Rock at Varying Angles Between Tectonic Stress and the Roadway
Figure 9 illustrates that, at an angle of 0°, the majority of the damage to the roof and floor of the roadway, as well as the two sides, exhibits a yield state following shear failure. Notably, the extent of damage on the two sides of the roadway is the most significant, demonstrating a ladder-like progression into the deeper strata on both sides. At an angle of 30°, the shear failure of the roadway’s roof and floor is exacerbated. The roadway’s roof strata are experiencing shear failure. When the angle is 45°, the deepest point of failure on both sides of the roadway moves from the middle to the shoulder angle. At this point, the shoulder angle of the roadway looks like it is experiencing tensile–shear composite failure. At an angle of 60°, the failure range on both sides of the roadway tends to stay the same. The shear failure at the top and bottom angles moves deeper, and the plastic zone’s maximum depth is at the shoulder angle. When the angle is 90°, the plastic zone of roof shear failure spreads even more into the deep rock stratum. The plastic zone has the biggest failure range, and the rock around the roadway is the most damaged. Quantitative analysis shows that, at an angle of 0°, the plastic zone extends approximately 4.0 m into the roof and floor, and up to 8.0 m into both sidewalls. At 45°, the maximum shear failure depth at the shoulder angle is about 5.5 m, and 4.5 m in the roof. When the angle reaches 90°, the failure zone penetrates the deepest, extending to 7.0 m in the roof, 6.4 m in the floor, 7.2 m at the shoulder angles, and approximately 6.0 m into both sidewalls.
In conclusion, when the roadway is positioned within the tectonic stress zone, the roof and floor strata are directly influenced by horizontal tectonic stress. The roof and floor are subjected to horizontal compression, resulting in shear failure of the roof and buckling failure of the floor. The two sides of the roadway are currently exhibiting a yield state following the damage incurred. As the angle progressively rises from 0° to 90°, there is a noticeable increase in the plastic zones of the roof, floor, and both sides. Following the shear failure at the shoulder angle, the plastic zone extends into the deeper rock layer, exhibiting the most significant growth. The angle of the roadway roof and shoulder was identified as the location of maximum plastic strain accumulation. Although the observed relationship between tectonic stress angle and plastic zone depth remains generally valid, specific values and failure patterns may vary depending on rock mass properties, burial depth, and local structural features. Therefore, extrapolation to other sites should account for differences in geological conditions.
5. How the Surrounding Rock Reacts Mechanically When a Roadway Is Being Dug Under Tectonic Stress
The fourth part of the research illustrates that the stability of the surrounding rock is significantly influenced by the disparity between tectonic stress and the axial angle of the road design; however, the mechanical response of the surrounding rock during the actual project is a continuous process. This paper analyzes the mechanical response characteristics of surrounding rock during roadway excavation.
5.1. Model Construction
Utilizing the engineering geological conditions and in situ stress field test findings, FLAC
3D software was employed to simulate the mechanical response of the surrounding rock during the excavation of the 1232(3) transport route under tectonic stress circumstances.
Figure 10 shows the plan for the simulated excavation of the working face. There are two stages to digging out the 1232(3) transportation roadway: the rock roadway stage and the gob-side stage. This section mostly looks at how the surrounding rock reacts mechanically at six points: 50 m along the roadway, 20 m along the roadway, 5 m along the roadway, 5 m along the gob, 20 m along the gob, and 50 m along the gob.
5.2. Distribution of Horizontal Stress in Different Places in the Rock Around the Roadway Under Tectonic Stress
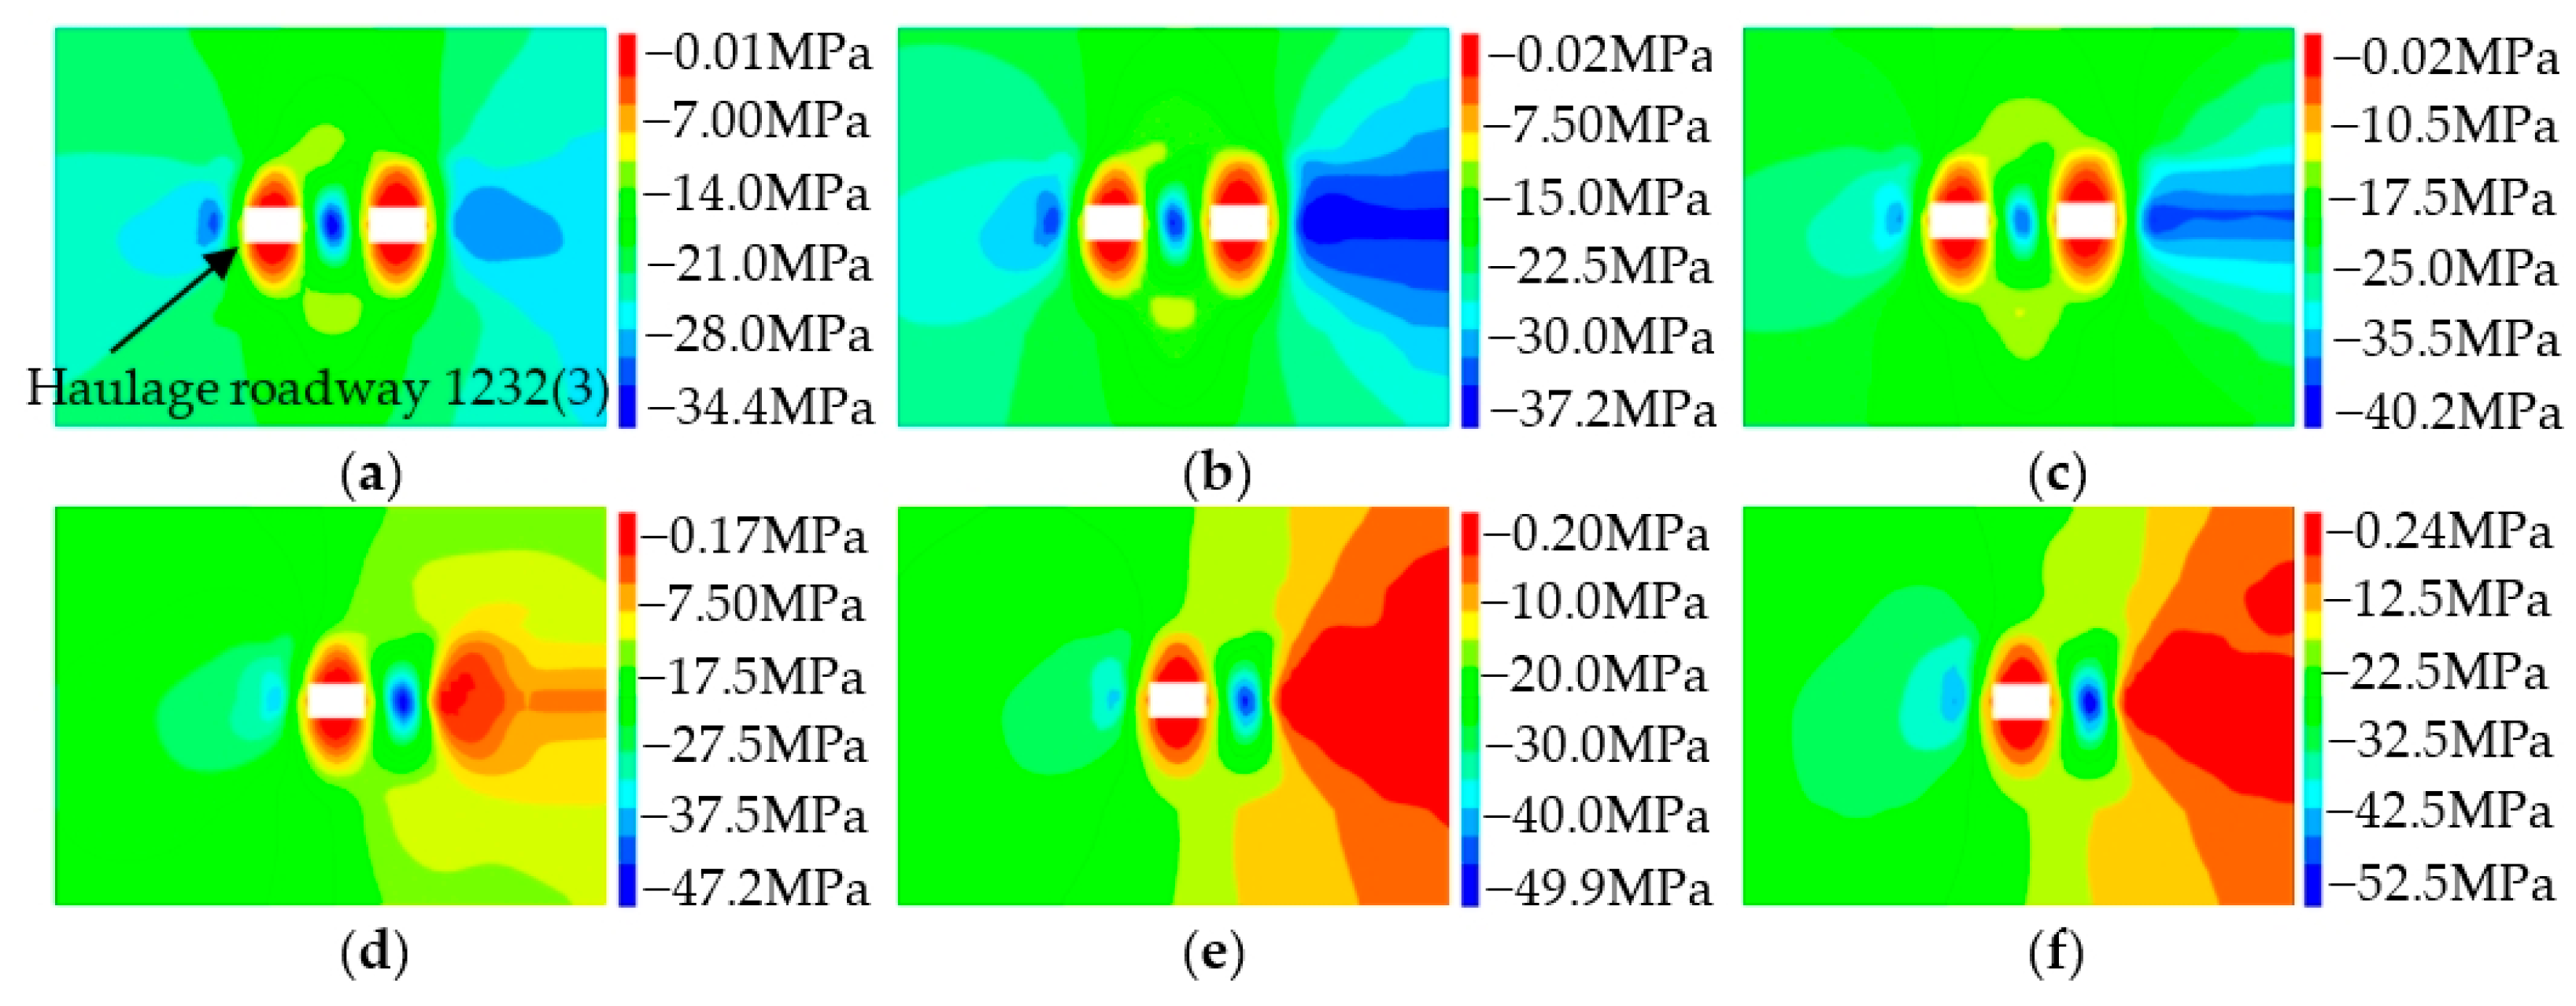
Figure 11 shows the horizontal stress distribution cloud diagram for different parts of the roadway that was made using a computer simulation.
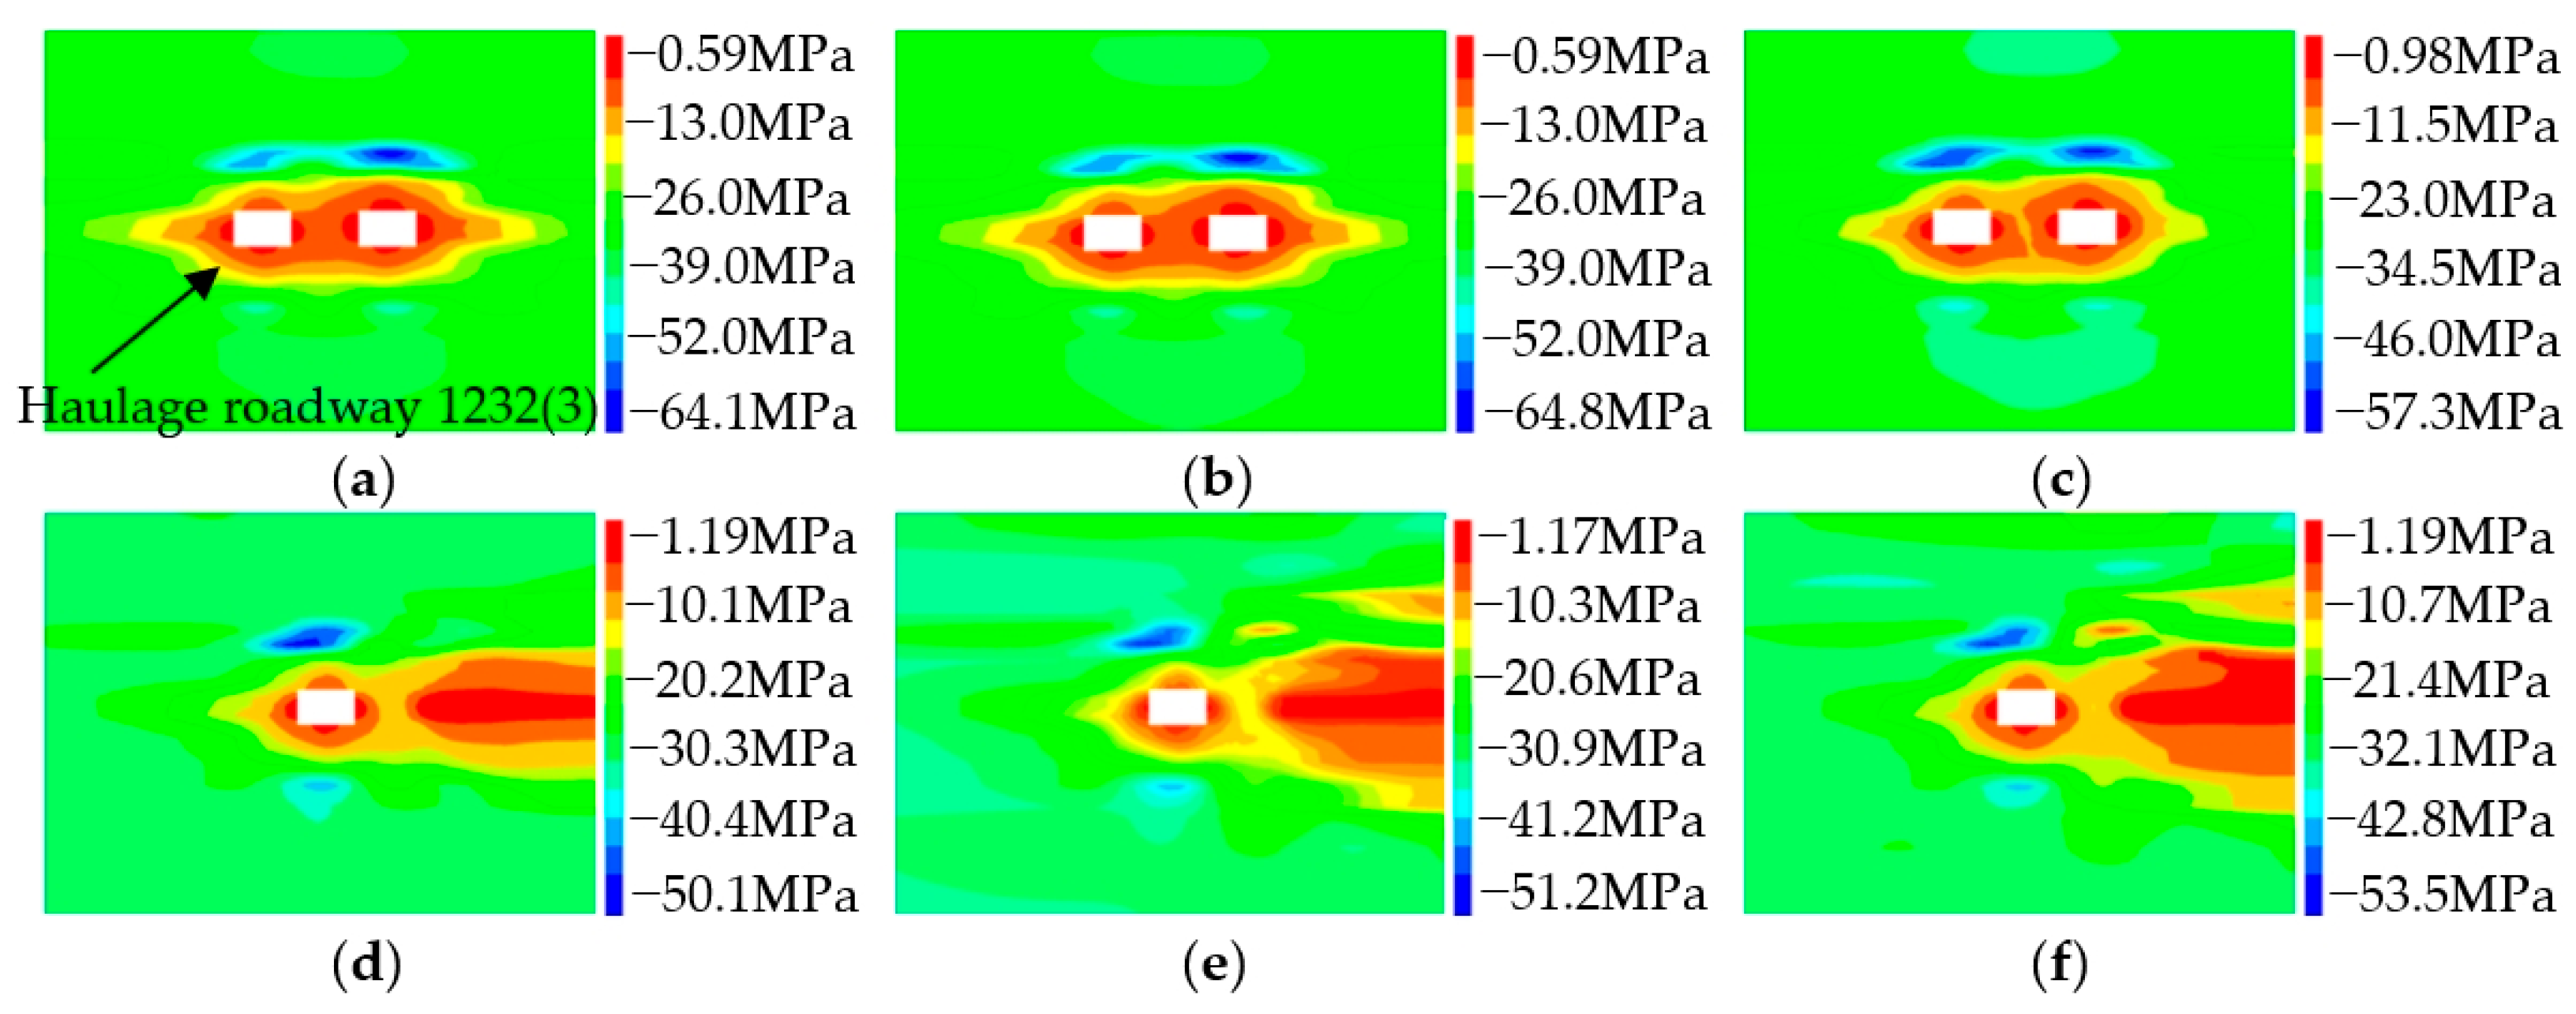
Figure 11a–c shows that the 1232(3) transport roadway is in the stage along the roadway. The horizontal stress reduction zone appears in the shallow rock layer around the roadway as it gets closer to the goaf. The horizontal stress concentration zone appears in the deep rock layer of the roof. The top horizontal stress concentration zone relocates to the solid coal side. The horizontal stress in the deep rock layers that make up the roof of the 1232(3) transport roadway seems to be going up a little bit at first and then going down.
Figure 11d–f illustrates that, in the gob-side stage of the 1232(3) transportation roadway, the pressure relief range of the goaf adjacent to the coal pillar progressively expands, while the concentration of horizontal stress on the roadway roof diminishes gradually. The horizontal stress concentration zone of the roof penetrates into the deeper strata of the surrounding rock. A little concentration of horizontal tension exists inside the deep rock strata of the floor. The horizontal stress on the solid coal side is markedly greater than that on the coal pillar side.
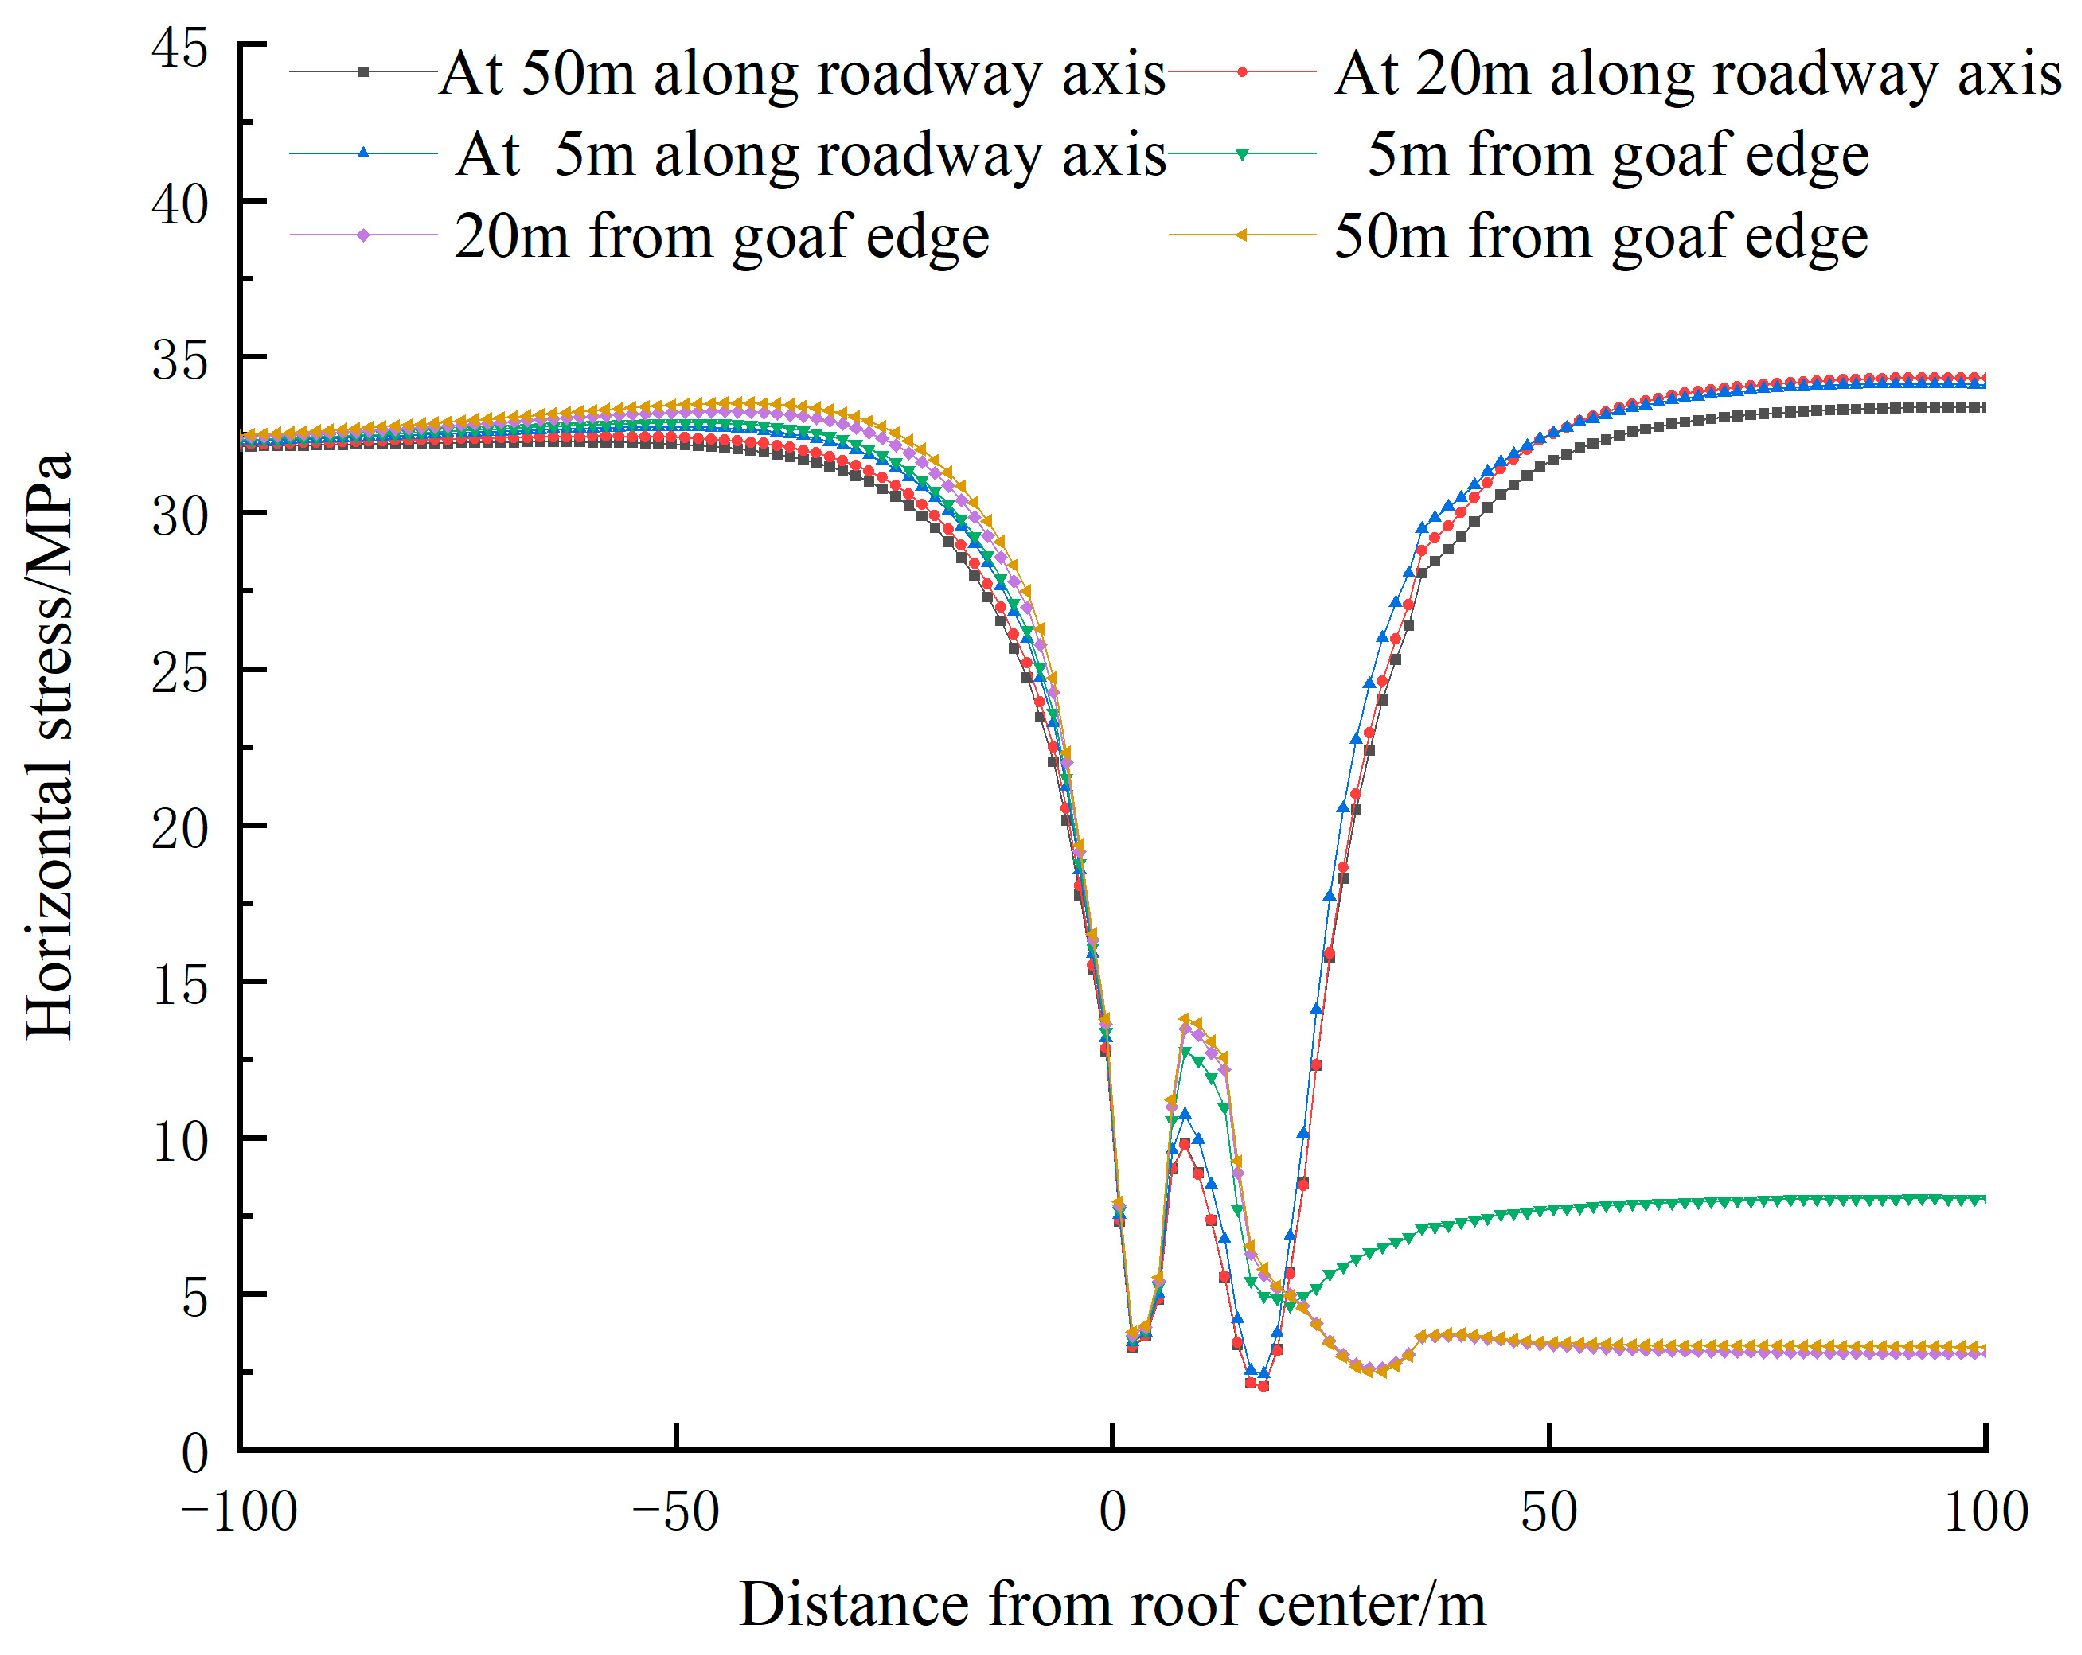
After the excavation of 1232(3) transportation roadway is finished, the stress monitoring path is placed horizontally along the vertical roadway roof position, based on the model calculation results. This provides the horizontal stress distribution curves at different positions on both sides of the roadway roof, as shown in
Figure 12.
Figure 12 shows that the horizontal stress on the 1232(3) transportation roadway is approximately evenly spread out across the roadway stage, with a peak value of 33 MPa. The peak value of horizontal stress on the coal pillar side is 10 MPa, which is lower than the peak value of horizontal stress on the solid coal side. When the roadway is between 5 m along the roadway side and 5 m along the goaf side, the horizontal stress on the coal pillar side goes up as the roadway enters the goaf stage. The peak value of the horizontal stress goes up to 13 MPa. The goaf’s pressure relief range is getting bigger, and the horizontal stress on the goaf’s side is going down to 10 MPa. The horizontal stress on the solid coal side of the gob-side stage of 1232(3) transportation roadway does not change much from the roadway stage. However, the horizontal stress on the coal pillar side goes up even more, reaching a peak value of 15 MPa.
As shown in the analysis above, the stress concentration degree on the solid coal side does not change much from the roadway stage to the gob-side stage. However, the stress concentration degree on the coal pillar side is getting higher. The locus of maximum tension on the coal pillar’s side progressively transitions towards its center. The horizontal tectonic stress during the roadway stage predominantly affects the roof strata, while the horizontal tectonic stress in the gob-side stage primarily impacts the coal pillar side of the roadway.
5.3. Distribution of Vertical Stresses in the Rock Surrounding a Roadway at Various Phases of Tectonic Stress
Figure 13a–c illustrates the stress redistribution of the surrounding rock following the excavation of the 1232(3) transportation route. The vertical stress reduction zone is created by the vertical roof and floor, whereas the vertical stress increase zone is established by the two sides of the roadway. The influence of the 1242(3) excavation roadway has resulted in an unbalanced distribution of the stress peak on both sides of the 1232(3) transportation roadway. The maximum vertical stress on the coal pillar side is 40.2 MPa, with a stress concentration factor of 2.01. The maximum vertical stress on the solid coal side is 37.5 MPa, with a stress concentration factor of 1.88. The stress concentration factor on the coal pillar side is greater than that on the solid coal side.
Figure 13d–f shows that the vertical stress on the two sides of the roadway is not evenly distributed. This is because the goaf in the 1232(3) transportation roadway affected the gob-side stage. On the side of the coal pillar, there is a zone of high vertical stress. The stress concentration factors are 2.36, 2.50, and 2.58 when the goaf is 5 m, 20 m, and 50 m, respectively.
Following the excavation of transportation roadway 1232(3), the vertical stress monitoring pathway is established horizontally along the central axis of the vertical roadway, based on model calculation results, yielding vertical stress distribution curves for both sides of the roadway at various positions, as illustrated in
Figure 14.
Figure 14 illustrates that, at a distance of 50 m along the roadway, the maximum stress on the coal pillar side is 33 MPa. The maximum vertical tension on the solid coal side is 27 MPa. The vertical force on the coal pillar side exceeds that on the solid coal side. At 20 m along the roadway, the vertical stress of the two sides of the roadway further increases. As the roadway extends from 5 m along the roadway side to 5 m along the goaf side, the vertical tension peak on the coal pillar side of the roadway progressively escalates. The maximum vertical stress on the coal pillar’s side progressively relocates to its center. The vertical stress on the goaf side decreased to 7 MPa; when the roadway is situated 50 m along the goaf side, the vertical stress peak on the coal pillar side escalates further. The maximum vertical stress is 52 MPa. It is located at about 4 m on the side of the roadway coal pillar.
The vertical tension along the roadway stage to the gob-side stage exhibits an asymmetrical distribution, characterized by a growing concentration of vertical stress on either side. The location of the maximum tension on the coal pillar’s side progressively transitions to the pillar’s center. The vertical force on the goaf side experiences an initial increase followed by a decrease. The coal seam adjacent to the roadway is susceptible to loosening and fracturing as a result of horizontal tectonic stress. The corresponding support and control measures adopted before and after the roadway passed the goaf are discussed in detail in
Section 6.
5.4. Distribution Features of the Plastic Zone at Various Phases of Roadway Surrounding Rock Under Tectonic Stress Conditions
Figure 15a–c illustrates that, when the roadway measures 50 m, the majority of the damage to the ceiling and floor of the 1232(3) transportation roadway and the solid coal side exhibits a yield state following shear failure. The plastic zone of shear failure on both sides of the roadway is asymmetrically distributed. The plastic region of the roof and floor after shear failure is dispersed. As the proximity to the goaf decreases, the extent of the plastic zone damage from shear failure on the roadway coal pillar’s side is increasing.
Figure 15d–f shows that the floor of transportation roadway 1232(3) has undergone tensile–shear composite failure. Both the roof and floor are experiencing shear failure. The plastic zone associated with shear failure displays an unbalanced distribution on either side. The extent of the plastic zone linked to shear failure on the coal pillar side surpasses that of the solid coal. The plastic shear failure zone next to the coal pillar is related to the fracture of the 1242(3) goaf. Currently, the coal pillar is fractured, leading to a reduced bearing capacity.
The analysis of the damage range indicates that, when the roadway is situated 50 m from the edge, it primarily exhibits shear failure. The extent of the plastic zone associated with shear failure in the ceiling and floor of the roadway is less than 1.5 m. The shear failure range on the coal pillar side measures between 1.0 and 2.0 m, while the range on the solid coal side is between 3.0 and 8.0 m. At a distance of 20 m from the roadway side, the depth of the plastic zone for shear failure in the roof ranges from 4.0 to 5.0 m. In contrast, the depth of the plastic failure zone at the roadway shoulder angle can extend up to 6.5 m. The plastic zone depth of shear failure in the coal pillar is between 6.0 and 8.0 m when the roadway is positioned from 5 m on the roadway side to 5 m on the goaf side. The coal pillar is likely to interface with the plastic zone that is adjacent to the goaf. When the roadway is situated 20 to 50 m along the goaf side, the failure plastic zone near the coal pillar is connected to fractures in the goaf. A significant area of the shear failure plastic zone is observed in the central and lower sections of the coal pillar, with a depth reaching 4.5 m. The apex of the plastic failure zone in the roadway is the coal pillar.
The investigation indicates that the plastic zone of the roadway surrounding rock predominantly experiences shear failure, with significant shear failure observed at the shoulder angle and coal pillar side. Upon entering the gob-side stage, the coal pillar is dismantled and removed, resulting in the solid coal side transitioning from the originally high-pressure elastic zone to the plastic failure zone. Horizontal tectonic force induces substantial compressive stress on the coal pillar’s side, resulting in its fracture and an increased failure depth. The roof strata induce shear failure, leading to roof instability. The subfloor rock layer causes buckling failure and protrudes onto the roadway area.
6. Plan for Controlling the Rock Around the Roadway When There Is Tectonic Stress
6.1. Control Principle of Roadway Surrounding Rock
The directional properties of tectonic stress are crucial, because the angular disparity between the roadway’s axial direction and the tectonic stress direction will result in varying mechanical conditions of the surrounding rock. When the axial orientation of the roadway aligns with the direction of horizontal tectonic stress, the impact of tectonic stress is minimized, resulting in optimal roadway stability. If the two are perpendicular, the detrimental impact of tectonic stress is maximized, resulting in the least favorable stability of the roadway. The extent of tectonic stress interference on roadway stability varies approximately with the square of the sine of its angle. Consequently, in regions experiencing considerable tectonic stress, it is imperative to optimize the orientation of roadway design to mitigate its detrimental impacts.
During this stage along the roadway, the roof and floor layers of the roadway are directly affected by horizontal tectonic stress. This high-level stress squeezes the two sides of the roadway, breaking up the coal body and causing it to spall. When horizontal tectonic stress pushes out and vertical stress releases, the roof and floor bend in different directions, causing shear failure. This makes the strata move apart and separate, which then causes the surrounding rock to expand and change shape on a large scale. After deformation, the rock around the roof and floor is pushed out to the free surface. When the support is not strong enough, the roof can cave in, the coal wall can fall down, and the floor can rise up.
In the gob-side stage, the floor rock mass is initially destabilized by tectonic force. Consequently, the roof pressure causes a redistribution of stress in the coal on both sides of the roadway, resulting in fractures, and the surrounding rock entered a state of overall instability. Currently, the gravitational stress field is the primary factor inducing the surrounding rock to shift towards the goaf, owing to the release of tectonic stress, which leads to a pronounced asymmetric distribution of vertical stress on either side; the coal pillars at the periphery of the goaf are already subjected to a high vertical stress state. The superposition of horizontal tectonic stress may cause the stress value to surpass the strength limit of coal rock, leading to the growth of the plastic zone, with the damage to the coal pillar side typically being greater than that of the solid coal side. The transfer of vertical stress to the depths results in the progressive failure of both sides until the vertical stress distribution stabilizes, leading to a gradual recovery of the surrounding rock to a stable state.
6.2. Roadway Surrounding Rock Control Countermeasures
During the roadway stage, the roof employs high-strength pre-tensioned bolts, a steel belt, and grouted anchor cables paired with a T-shaped rigid beam. The steel belt and steel beam are positioned at the center of the roadway. The bolts are vertically secured to the roadway ceiling through the steel belt. The use of high pre-tightening bolts creates a state of transverse compression in the roof strata. An active bearing structure is formed by the axial constraint of the anchor cables and the radial constraint of the steel strip beam, which enhances the overall shear strength of the roof. The roof is reinforced through advanced pre-grouting techniques and the timely application of grouting. This process aims to improve the physical and mechanical properties of the surrounding rock of the roadway roof and to strengthen the integrity of the surrounding rock. Anchors are installed vertically on both sides. Metal mesh is utilized to seal the roof coal and rock mass, preventing lateral movement towards the lower corner.
In the gob-side stage, the support configuration along the roadway stage incorporates an anchor cable bundle into the roof. The central anchor cable of this bundle is 1 m longer than the anchor cables on either side. I-steel is used to reinforce the roof. The anchor cable is installed at the shoulder angle of the roof and the side to enhance the rigidity of the roadway roof. The strike anchor cable is applied to the lateral aspect of the coal pillar. An expansive tray serves as reinforcement, with the supporting force distributed uniformly around the tray through the reinforcing rib, which helps to reduce plastic deformation of the coal body’s sidewalls. Spray grouting modification and reinforcement are performed on the coal pillar’s side, and a wooden point column is established. The strike anchor cable is secured to the solid coal side, while the large tray is employed to reduce the extrusion damage caused by the advance support pressure on the solid coal wall. Recent research by Demin et al. emphasizes the effectiveness of roof-bolt and cable bolt fastening technologies in mine roadways subjected to increased rock pressure behind longwall faces. Their findings highlight improvements in load distribution and stability in complex geological conditions, supporting the rationale of the fastening systems applied in this gob-side stage [
22].
6.3. Field Application Effect
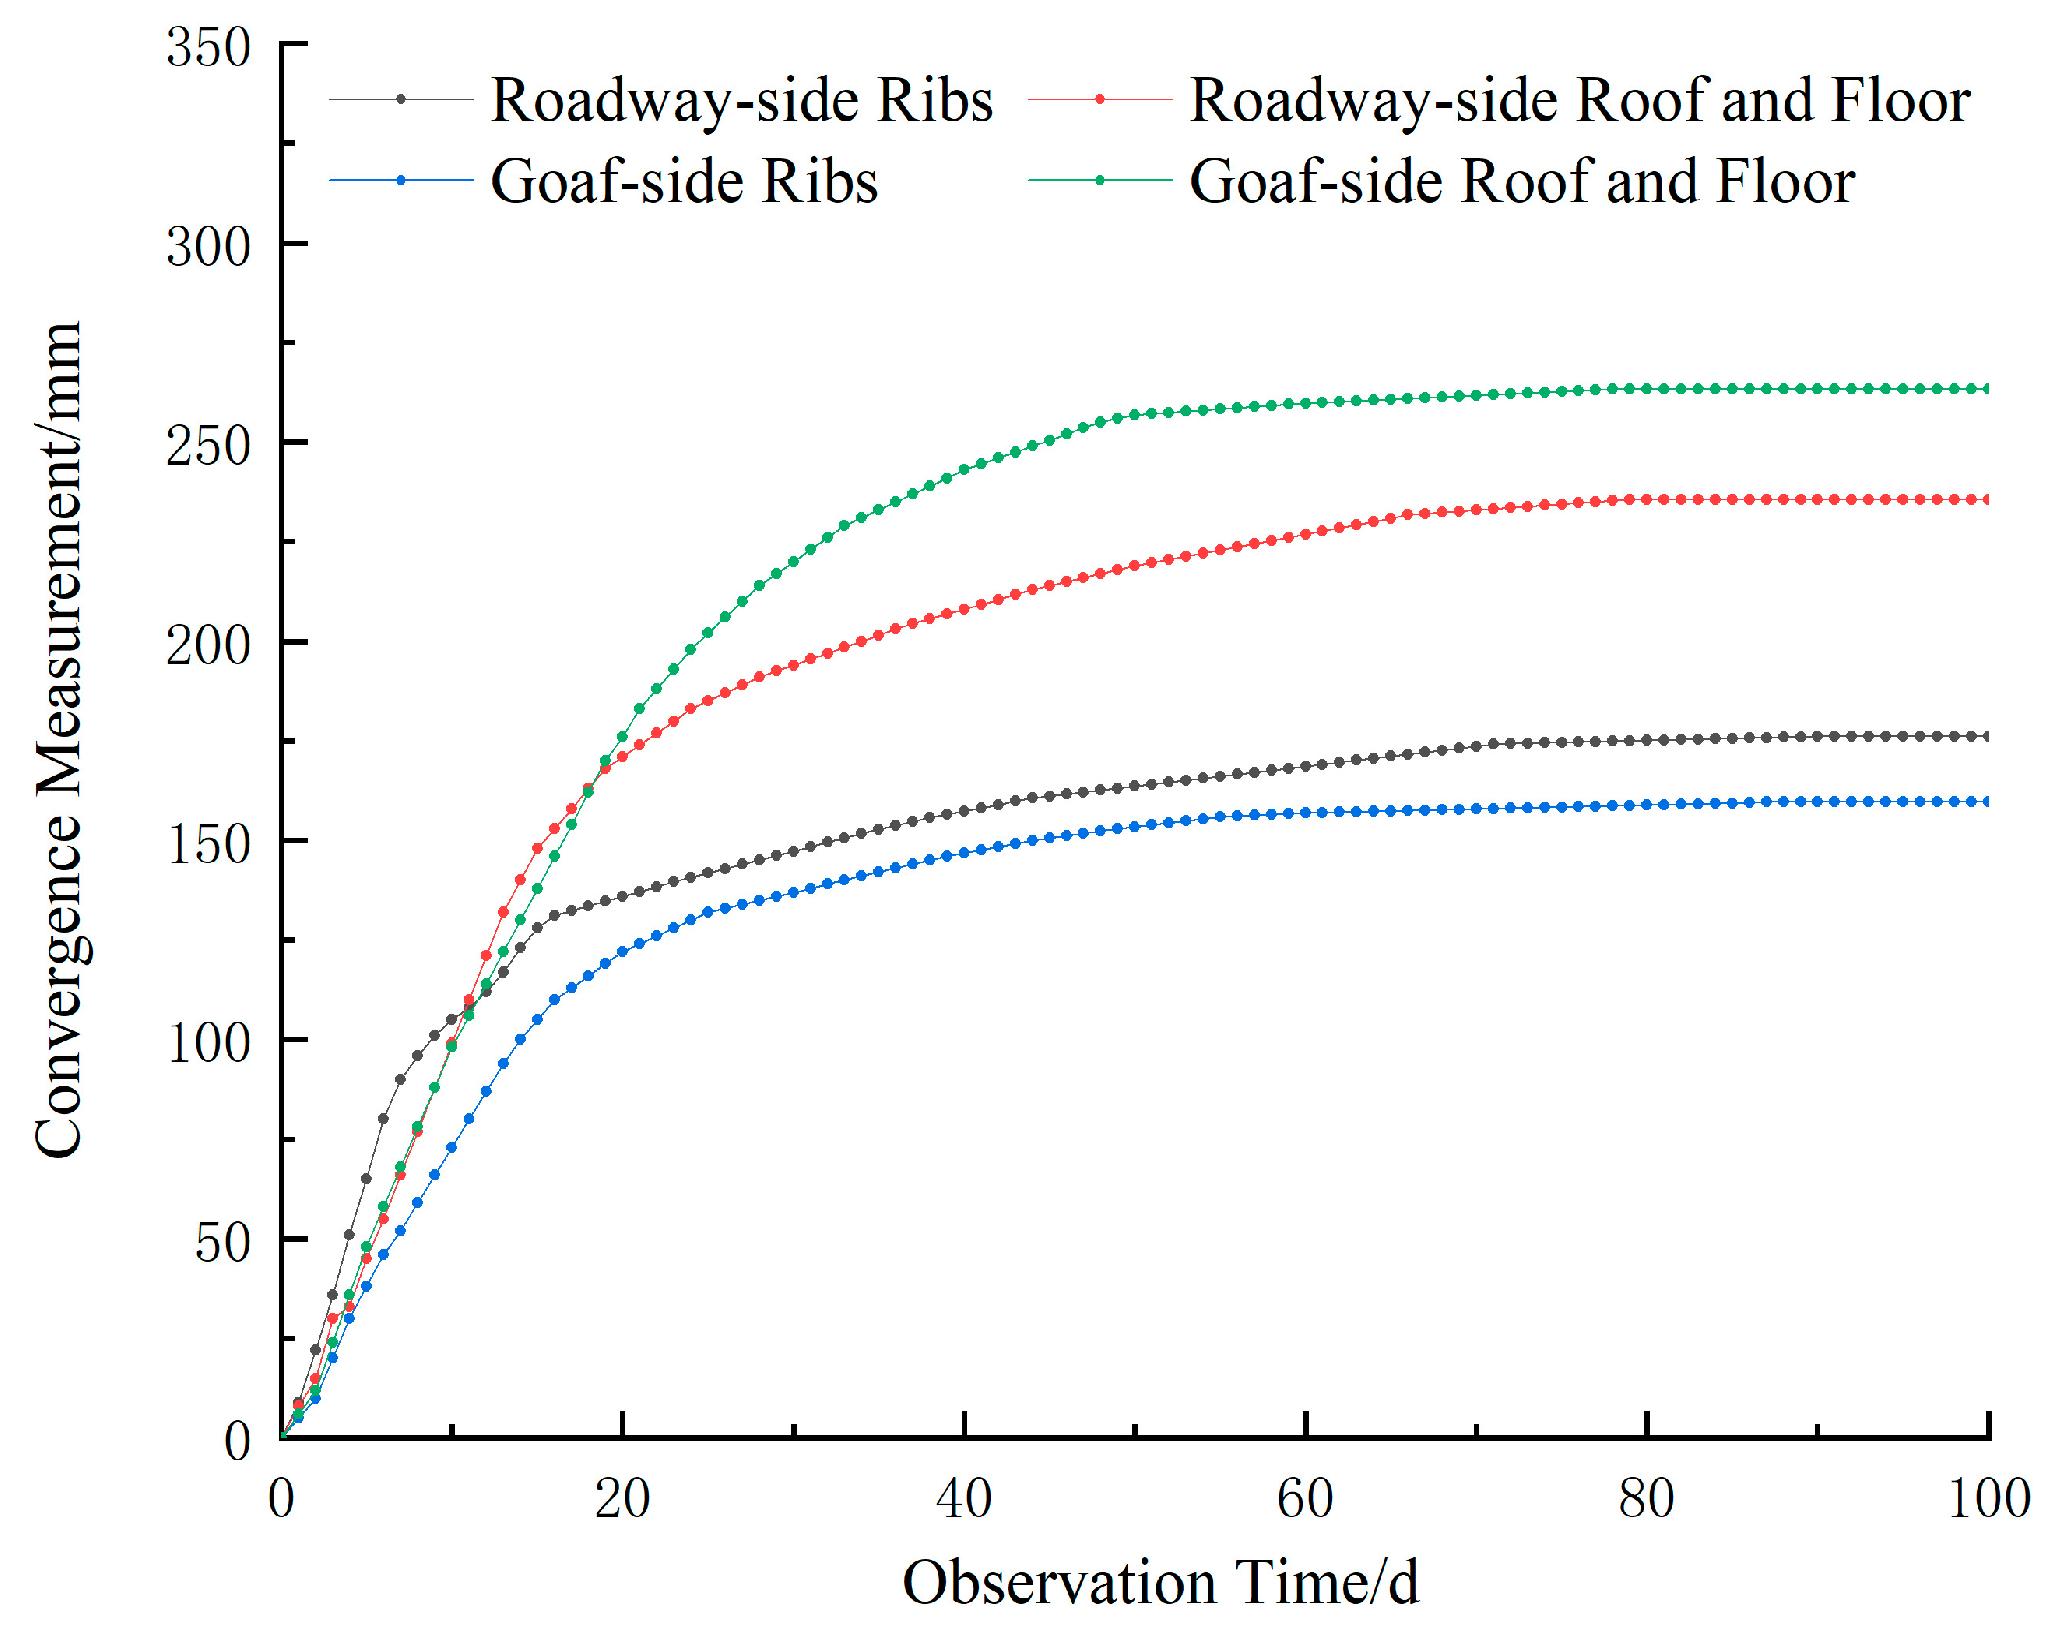
We selected a full station for both the roadway section and the gob section, closely monitoring how the roof, floor, and two sides of the 1232(3) transportation roadway changed shape. Bed separation and convergence were monitored using displacement sensors manufactured by SISKOSAI. Measurements were taken once per day during the observation period.
Figure 16 illustrates that the amount of roof separation varies significantly during the week following protection. Between 7 and 15 d after support, the roof separation tends to stabilize gradually. After 15 d of support, the roof is no longer separated and is likely to remain that way. At No. 3 station, the distance between the shallow base points measures 10.6 mm, while the distance between the deep base points is 15.1 mm. At No. 4 station, the distance between the shallow base point and the deep base point is 11.9 mm, resulting in a total distance of 27.6 mm.
After optimizing the support mechanism, the deformation of the ceiling, floor, and both sides was successfully regulated, resulting in negligible changes during the subsequent excavation.
Figure 17 illustrates the findings from the observation of roadway surface deformation. Within 10 d following the support, the surface displacement of the surrounding rock in the roadway increased significantly. Between 10 and 30 d post-support, as the support structure and the adjacent rock in the roadway progressively reached a coupled state, the rate of deformation displacement in the roadway gradually decreased. After 30 d of support, the adjacent rock in the roadway typically stabilized. At the third station of the roadway, the surrounding rock deformation primarily occurred in the roof and floor, with maximum displacements of 235.6 mm for the roof and 176.1 mm for the two sides. At the No. 4 station on the gob side, the deformation of the surrounding rock’s two sides surpassed that of the roof and floor, recording a roof and floor convergence of 263.3 mm and a side convergence of 159.6 mm.
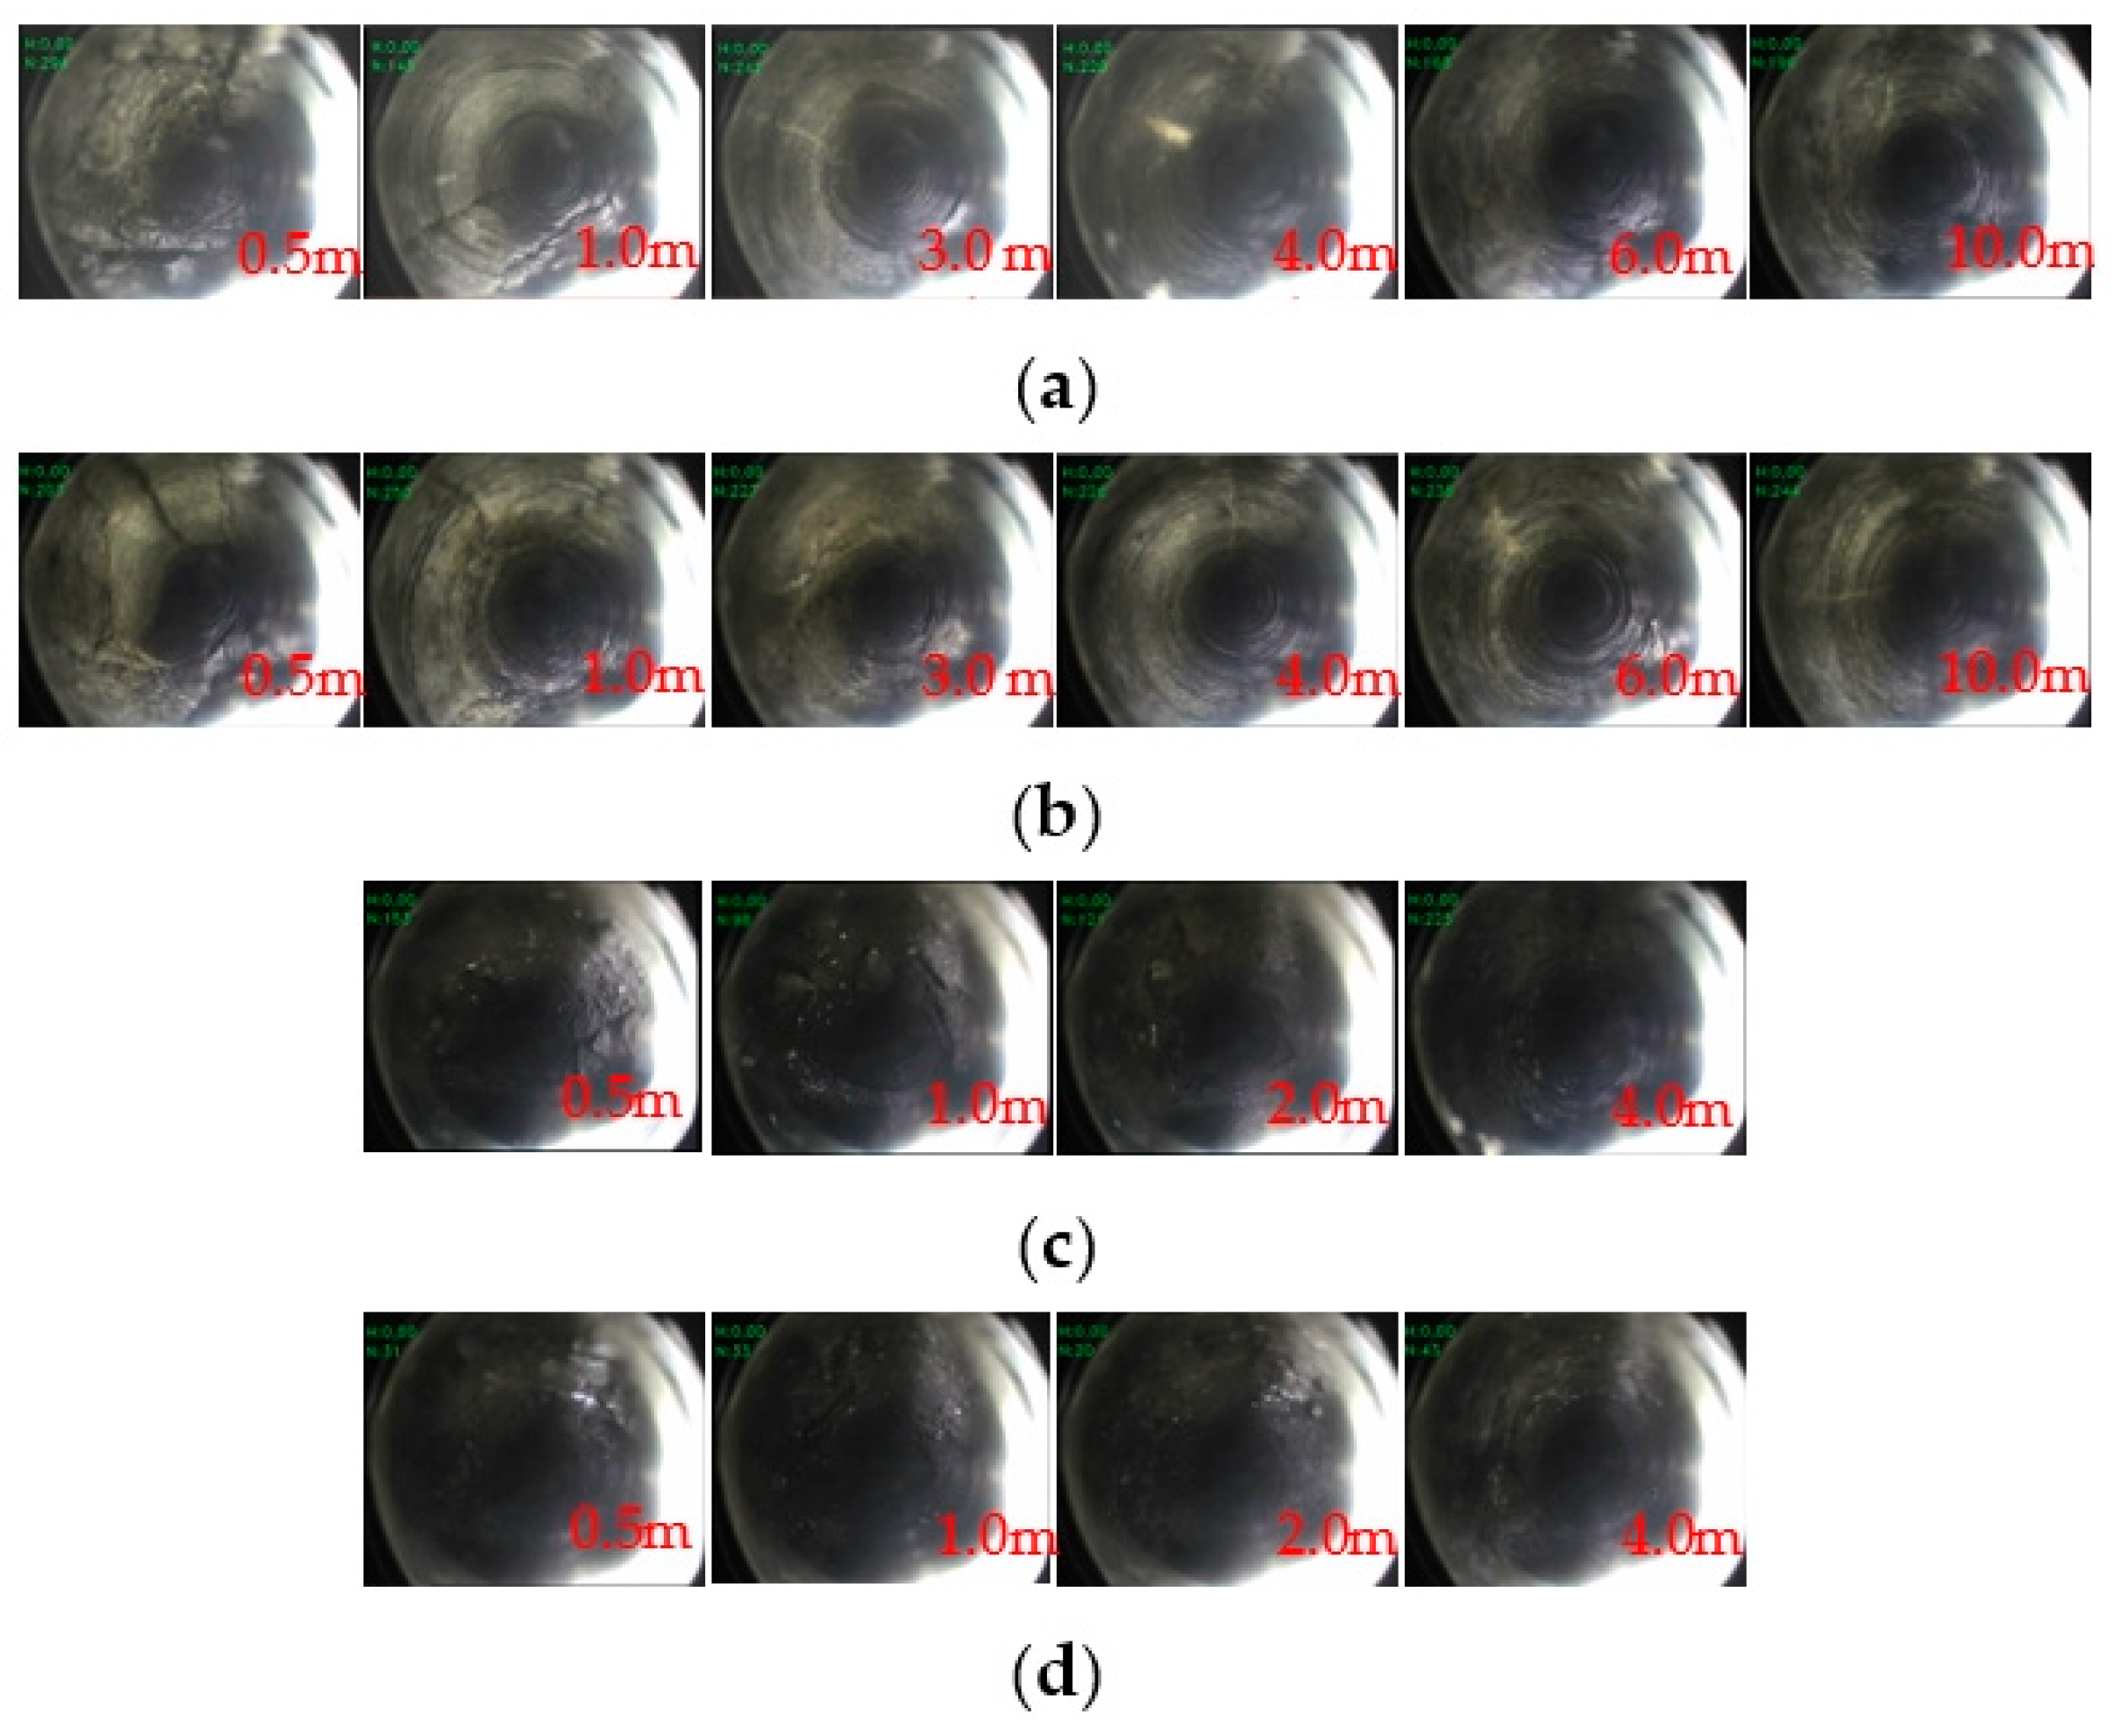
To further verify the internal structural response of the surrounding rock under support conditions, borehole video inspections were conducted in the roadway cross-section before and after entering the gob-side area. As shown in
Figure 18, prior to entering the gob-side section, transverse fractures in the roof rock mass were primarily concentrated within the shallow range of 0–1.0 m. During the gob-side stage, the surrounding rock from the borehole collar to 1.0 m was relatively fractured and dominated mainly by longitudinal fractures. Progressing to the 1.0–3.0 m range, sparse and underdeveloped longitudinal fractures were observed, with the surrounding rock remaining largely intact. Ultimately beyond 3.0 m, the surrounding rock exhibited stability with no significant fractures. On the pillar-side during the gob-side stage, coal within 0–1.0 m appeared highly fractured, gradually transitioning to micro-fractures beyond this range. In contrast, on the solid coal side during the same stage, the internal structure remained relatively intact beyond the initial 0.5 m.
These borehole observations confirm the asymmetric fracture distribution and more severe damage on the goaf side, consistent with numerical simulations and field monitoring results. Compared to the 7.0–8.0 m plastic zone depth predicted in unsupported numerical models, support measures effectively reduced the plastic zone by over 80%, significantly inhibiting fracture propagation induced by stress concentration.
The control measures for the rock surrounding the road effectively prevented uneven bending along both the roadway stage and the gob-side stage. They also provided strong support for the road.
Figure 19 illustrates the impact of on-site support, which enhances the integrity of adjacent rock formations. The self-bearing capacity of the surrounding rock is improved. There is a focused management approach regarding roof damage along the roadway and the distortion of coal pillars adjacent to the roadway. This strategy meets the requirements for safe and efficient production at the working face.
7. Conclusions
1. A mechanical model has been developed to illustrate how the roof rock beam of a road bends under significant tectonic stress, demonstrating the relationship between horizontal tectonic stress and the bending of the roof rock beam. When the roof reaches its yield limit and is subjected to horizontal tectonic stress, it bends by 7.72 cm. We define the maximum horizontal principal stress variation coefficient, Fw. When Fw exceeds 0.76, the deformation rate of the roof rock beam increases significantly, which can lead to severe cases of roof collapse.
2. The study examines the mechanical response of surrounding rock as the angle between tectonic stress and the road varies. The horizontal stress on the roof increases with the angle, peaking at θ = 90°. As θ increases, the vertical stress concentration on both sides of the road gradually decreases. The roof, floor, and shoulder angle of the road create a distinct transition zone for stress concentration. The surrounding rock predominantly exhibits shear failure characteristics, with the failure area primarily located in the zones of stress concentration, specifically at the roof, floor, and shoulder angle of the road. The sheared plastic zone reaches its maximum depth when the angle is 90°.
3. We examined the impact of tectonic stress on the stability of the surrounding rock at the 1232(3) working face in Dingji Coal Mine. During the roadway stage, horizontal tectonic stress significantly influences the roadway roof, evidenced by the concentration of horizontal stress in the center of the roof. During the gob-side stage, both the roof and floor of the roadway exhibit a weakening trend in horizontal stress concentration, attributed to the pressure relief response from the goaf. The vertical stress distribution along the two sides of the roadway is uneven. The shear failure plastic zone adjacent to the coal pillar extends 8 m deep and is linked to the cracks in the goaf. Damage is most severe in the middle and lower sections of the coal pillar. Based on the mechanical reactions of the surrounding rock at various stages, we developed and implemented differential control countermeasures in the field, which proved effective.
4. The roadway experiences significant stress concentration and asymmetric deformation under the combined influence of horizontal tectonic stress and adjacent goaf. In response to the high stress conditions, targeted support strategies are required to ensure roadway stability. During the roadway excavation stage, a pre-tensioned bolt system with grouted anchor cables and T-shaped steel beams is used to form an active bearing structure that enhances the overall shear strength of the roof. In the gob-side stage, a differentiated support system is employed, including extended anchor cable bundles, I-steel reinforcement, and expansive trays to reduce deformation on the coal pillar side. These reinforcement measures are effective in controlling deformation and maintaining the long-term stability of the roadway in high-stress environments.


