
Dielectric Spectroscopy: Yesterday, Today and Tomorrow


Abstract
1. Introduction
2. Dielectric Spectroscopy-Yesterday
3. Dielectric Spectroscopy-Today
4. The Current Understanding of Dielectric Relaxation Processes
5. Dielectric Spectroscopy-Tomorrow
6. Conclusions and Outlook
Author Contributions
Funding
Institutional Review Board Statement
Informed Consent Statement
Data Availability Statement
Conflicts of Interest
References
- Debye, P. Einige Resultate einer Kinetischen Theorie der Isolatoren. Phys. Z. 1912, 13, 97. [Google Scholar]
- Debye, P.J.W. Zur Theorie der anomalen Dispersion im Gebiete der langwelligen elektrischen Strahlung. Verhandl. Dt. Phys. Ges. 1913, 15, 777. [Google Scholar]
- Debye, P. Polare Molekeln; Verlag von S. Hirzel: Leipzig, Germany, 1929. [Google Scholar]
- Einstein, A. Zur theorie der brownschen bewegung. Ann. Phys. 1906, 324, 371–381. [Google Scholar] [CrossRef]
- Floudas, G.; Paluch, M.; Grzybowski, A.; Ngai, K. Molecular Dynamics of Glass-Forming Systems: Effects of Pressure; Springer: Berlin/Heidelberg, Germany, 2010; Volume 1. [Google Scholar]
- Kremer, F. Dynamics in Geometrical Confinement; Springer: Berlin/Heidelberg, Germany, 2014. [Google Scholar]
- Paluch, M. Dielectric Properties of Ionic Liquids; Springer: Berlin/Heidelberg, Germany, 2016; Volume 8. [Google Scholar]
- Richert, R. Nonlinear Dielectric Spectroscopy; Springer: Berlin/Heidelberg, Germany, 2018. [Google Scholar]
- Kremer, F.; Loidl, A. The Scaling of Relaxation Processes; Springer: Berlin/Heidelberg, Germany, 2018. [Google Scholar]
- Ezquerra, T.A.; Nogales, A. Crystallization as Studied by Broadband Dielectric Spectroscopy; Springer: Berlin/Heidelberg, Germany, 2020. [Google Scholar]
- Schönhals, A.; Szymoniak, P. Dynamics of Composite Materials; Springer: Berlin/Heidelberg, Germany, 2022. [Google Scholar]
- Fröhlich, H. Theory of Dielectrics; Oxford Clarendon Press: Oxford, UK, 1949. [Google Scholar]
- McCrum, N.G.; Read, B.E.; Williams, G. Anelastic and Dielectric Effects in Polymeric Solids; John Wiley & Sons Ltd.: Hoboken, NJ, USA, 1967. [Google Scholar]
- Böttcher, C. Theory of Electric Polarization, Volume I; Elsevier: Amsterdam, The Netherlands, 1973. [Google Scholar]
- Böttcher, C.; Bordewijk, P. Theory of Electric Polarization, Volume II; Elsevier: Amsterdam, The Netherlands, 1973. [Google Scholar]
- Hedvig, P. Dielectric Spectroscopy of Polymers; Adam Hilger Ltd.: Bristol, UK, 1977. [Google Scholar]
- Jonscher, A. Dielectric Relaxation in Solids; Chelsea Dielectrics Press: London, UK, 1983. [Google Scholar]
- Riande, E.; Saiz, E. Dipole Moments and Birefringence of Polymers; Prentice Hall: Englewood Cliffs, NJ, USA, 1992. [Google Scholar]
- Jonscher, A. Universal Relaxation Law; Chelsea Dielectrics Press: London, UK, 1996. [Google Scholar]
- Havriliak, S.; Havriliak, S.J. Dielectric and Mechanical Relaxation in Materials: Analysis, Interpretation, and Application to Polymers; Hanser Publishers: Munich, Germany, 1997. [Google Scholar]
- Scaife, B.K.P. Principles of Dielectrics; Oxford University Press: Oxford, UK, 1998. [Google Scholar]
- Gaiduk, V.I. Dielectric Relaxation and Dynamics of Polar Molecules; World Scientific: Singapore, 1999. [Google Scholar]
- Kremer, F.; Schönhals, A. Broadband Dielectric Spectroscopy, 1st ed.; Springer: Berlin/Heidelberg, Germany, 2002. [Google Scholar]
- Raicu, V.; Feldman, Y. Dielectric Relaxation in Biological Systems: Physical Principles, Methods, and Applications; Academic Press: Cambridge, MA, USA, 2015. [Google Scholar]
- Hecksher, T.; Torchinsky, D.H.; Klieber, C.; Johnson, J.A.; Dyre, J.C.; Nelson, K.A. Toward broadband mechanical spectroscopy. Proc. Natl. Acad. Sci. USA 2017, 114, 8710–8715. [Google Scholar] [CrossRef]
- Gabriel, J.; Pabst, F.; Helbling, A.; Böhmer, T.; Blochowicz, T. Depolarized dynamic light scattering and dielectric spectroscopy: Two perspectives on molecular reorientation in supercooled liquids. In The Scaling of Relaxation Processes; Springer: Berlin/Heidelberg, Germany, 2018; pp. 203–245. [Google Scholar]
- Tropin, T.; Schmelzer, J.; Schulz, G.; Schick, C. The calorimetric glass transition in a wide range of cooling rates and frequencies. In The Scaling of Relaxation Processes; Springer: Berlin/Heidelberg, Germany, 2018; pp. 307–351. [Google Scholar]
- Kremer, F.; Kossack, W.; Anton, A.M. Glassy Dynamics as Reflected in the Inter-and Intra-molecular Interactions. In The Scaling of Relaxation Processes; Kremer, F., Loidl, A., Eds.; Springer International Publishing: Cham, Switzerland, 2018; pp. 61–76. [Google Scholar]
- Bock, D.; Körber, T.; Mohamed, F.; Pötzschner, B.; Rössler, E. Dynamic heterogeneities in binary glass-forming systems. In The Scaling of Relaxation Processes; Springer: Berlin/Heidelberg, Germany, 2018; pp. 173–201. [Google Scholar]
- Arbe, A.; Colmenero, J. Relaxation Processes in Liquids and Glass-Forming Systems: What Can We Learn by Comparing Neutron Scattering and Dielectric Spectroscopy Results? In The Scaling of Relaxation Processes; Springer: Berlin/Heidelberg, Germany, 2018; pp. 247–277. [Google Scholar]
- Schönhals, A.; Frick, B.; Zorn, R. The scaling of the molecular dynamics of liquid crystals as revealed by broadband dielectric, specific heat, and neutron spectroscopy. In The Scaling of Relaxation Processes; Springer: Berlin/Heidelberg, Germany, 2018; pp. 279–306. [Google Scholar]
- Gabriel, J.P.; Tress, M.; Kossack, W.; Popp, L.; Kremer, F. Molecular heterogeneities in the thermal expansivity of polyalcohols. J. Chem. Phys. 2021, 154. [Google Scholar] [CrossRef]
- Nakanishi, M.; Nozaki, R. Dynamics and structure of hydrogen-bonding glass formers: Comparison between hexanetriol and sugar alcohols based on dielectric relaxation. Phys. Rev. E 2010, 81, 041501. [Google Scholar] [CrossRef]
- Böhmer, T.; Gabriel, J.P.; Zeißler, R.; Richter, T.; Blochowicz, T. Glassy dynamics in polyalcohols: Intermolecular simplicity vs. intramolecular complexity. Phys. Chem. Chem. Phys. 2022, 24, 18272–18280. [Google Scholar] [CrossRef]
- Böhmer, T.; Pabst, F.; Gabriel, J.P.; Zeißler, R.; Blochowicz, T. On the spectral shape of the structural relaxation in supercooled liquids. J. Chem. Phys. 2025, 162, 120902. [Google Scholar] [CrossRef]
- Blazhnov, I.V.; Malomuzh, N.P.; Lishchuk, S.V. Temperature dependence of density, thermal expansion coefficient and shear viscosity of supercooled glycerol as a reflection of its structure. J. Chem. Phys. 2004, 121, 6435–6441. [Google Scholar] [CrossRef]
- Nakanishi, M.; Nozaki, R. Systematic study of the glass transition in polyhydric alcohols. Phys. Rev. E 2011, 83, 051503. [Google Scholar] [CrossRef]
- Hidaka, H.; Yamazaki, M.; Yabe, M.; Kakiuchi, H.; Ona, E.P.; Kojima, Y.; Matsuda, H. Evaluation of fundamental characteristics of D-Threitol as phase change material at high temperature. In Proceedings of the Asian Pacific Confederation of Chemical Engineering Congress Program and Abstracts Asian Pacific Confederation of Chemical Engineers Congress Program and Abstracts, Kitakyushu, Japan, 17–21 October 2004; The Society of Chemical Engineers: Tokyo, Japan, 2004; p. 535. [Google Scholar]
- Chen, Z.; Huang, C.; Yao, X.; Benmore, C.J.; Yu, L. Structures of glass-forming liquids by X-ray scattering: Glycerol, xylitol, and D-sorbitol. J. Chem. Phys. 2021, 155, 244508. [Google Scholar] [CrossRef] [PubMed]
- Naoki, M.; Ujita, K.; Kashima, S. Pressure-volume-temperature relations and configurational energy of liquid, crystal, and glasses of D-sorbitol. J. Phys. Chem. 1993, 97, 12356–12362. [Google Scholar] [CrossRef]
- Chelli, R.; Procacci, P.; Cardini, G.; Della Valle, R.G.; Califano, S. Glycerol condensed phases Part I. A molecular dynamics study. Phys. Chem. Chem. Phys. 1999, 1, 871–877. [Google Scholar] [CrossRef]
- Popp, L. Inter- und Intramolekulare Dynamil in Organischen Glasbildnern. Master’s Thesis, Leipzig University, Leipzig, Germany, 2015. [Google Scholar]
- Onsager, L. Electric moments of molecules in liquids. J. Am. Chem. Soc. 1936, 58, 1486–1493. [Google Scholar] [CrossRef]
- Gabriel, J.P.; Zourchang, P.; Pabst, F.; Helbling, A.; Weigl, P.; Böhmer, T.; Blochowicz, T. Intermolecular cross-correlations in the dielectric response of glycerol. Phys. Chem. Chem. Phys. 2020, 22, 11644–11651. [Google Scholar] [CrossRef]
- Ryabov, Y.E.; Hayashi, Y.; Gutina, A.; Feldman, Y. Features of supercooled glycerol dynamics. Phys. Rev. B 2003, 67, 132202, Erratum in Phys. Rev. B 2004, 69, 189904. https://doi.org/10.1103/PhysRevB.69.189904. [Google Scholar] [CrossRef]
- Böhmer, T.; Richter, T.; Gabriel, J.P.; Zeißler, R.; Weigl, P.; Pabst, F.; Blochowicz, T. Revealing complex relaxation behavior of monohydroxy alcohols in a series of octanol isomers. J. Chem. Phys. 2023, 159, 054501. [Google Scholar] [CrossRef]
- Deb, N.; Tiwary, A.S.; Mukherjee, A.K. Calculation of the Kirkwood–Frohlich correlation factor and dielectric constant of methanol using a statistical model and density functional theory. Mol. Phys. 2010, 108, 1907–1917. [Google Scholar] [CrossRef]
- Chelli, R.; Gervasio, F.L.; Gellini, C.; Procacci, P.; Cardini, G.; Schettino, V. Conformational distribution of gas-phase glycerol. J. Phys. Chem. A 2000, 104, 11220–11222. [Google Scholar] [CrossRef]
- Böhmer, T.; Gabriel, J.P.; Richter, T.; Pabst, F.; Blochowicz, T. Influence of Molecular Architecture on the Dynamics of H-Bonded Supramolecular Structures in Phenyl-Propanols. J. Phys. Chem. B 2019, 123, 10959–10966. [Google Scholar] [CrossRef]
- Déjardin, P.M.; Pabst, F.; Cornaton, Y.; Helbling, A.; Blochowicz, T. Temperature dependence of the Kirkwood correlation factor and linear dielectric constant of simple isotropic polar fluids. Phys. Rev. E 2022, 105, 024108. [Google Scholar] [CrossRef] [PubMed]
- Carpentier, L.; Desprez, S.; Descamps, M. Crystallization and glass properties of pentitols. J. Therm. Anal. Calorim. 2003, 73, 577–586. [Google Scholar] [CrossRef]
- Pawlus, S.; Grzybowski, A.; Paluch, M.; Wlodarczyk, P. Role of hydrogen bonds and molecular structure in relaxation dynamics of pentiol isomers. Phys. Rev. E 2012, 85, 052501. [Google Scholar] [CrossRef] [PubMed]
- Sibik, J.; Zeitler, J.A. Terahertz spectroscopy of hydrogen-bonded glass-forming liquids. In Proceedings of the 2013 38th International Conference on Infrared, Millimeter, and Terahertz Waves (IRMMW-THz), Mainz, Germany, 1–6 September 2013; pp. 1–3. [Google Scholar] [CrossRef]
- Kampfrath, T.; Campen, R.K.; Wolf, M.; Sajadi, M. The Nature of the Dielectric Response of Methanol Revealed by the Terahertz Kerr Effect. J. Phys. Chem. Lett. 2018, 9, 1279–1283. [Google Scholar] [CrossRef]
- Haken, H.; Wolf, H.C. Molecular Physics and Elements of Quantum Chemistry: Introduction to Experiments and Theory; Springer: Berlin/Heidelberg, Germany, 2013. [Google Scholar]
- Kremer, F.; Kipnusu, W.K.; Fränzl, M. Orientation polarization spectroscopy—Toward an atomistic understanding of dielectric relaxation processes. Int. J. Mol. Sci. 2022, 23, 8254. [Google Scholar] [CrossRef]
- Israelachvili, J.N. Intermolecular and Surface Forces; Academic Press: Cambridge, MA, USA, 2011. [Google Scholar]


| Name | Sum | Structure | [g/mol] | [g/cm3] | [K] | [Å3] | [Å3] |
|---|---|---|---|---|---|---|---|
| glycerol | C3H8O3 |  | 92.09 | 1.259 * [36] | 192 [37] | 121 | 40.4 |
| DL-threiol | C4H10O4 | 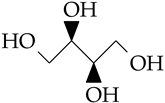 | 122.1 | 1.386 ** [38] | 226 [37] | 146 | 36.6 |
| xylitol | C5H12O5 |  | 152.2 | 1.402 *** [39] | 248 [37] | 180 | 36.0 |
| D-sorbitol | C6H14O6 | 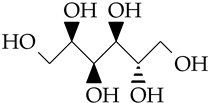 | 182.2 | 1.449 * [40] | 268 [37] | 209 | 34.8 |
| Bond Type | Bond Length | Dipole Moment | |
|---|---|---|---|
| [pm] | [ cm] | [Debye] | |
| O-H | 96 | 15.1 | 4.5 |
| C-H | 110 | 2.4 | 0.72 |
| C-O | 143 | 17.5 | 5.3 |
| C-C | 150 | 0.65 | 0.19 |
| Bond Type | Vibrational Type | Force Field Constant |
|---|---|---|
| C-C/C-O | stretching | ∼1300 kJ mol−1 Å−2 |
| CH2 | bending | ∼150 kJ mol−1 rad−2 |
| OCCO | torsion | ∼0.6 kJ mol−1 |
Disclaimer/Publisher’s Note: The statements, opinions and data contained in all publications are solely those of the individual author(s) and contributor(s) and not of MDPI and/or the editor(s). MDPI and/or the editor(s) disclaim responsibility for any injury to people or property resulting from any ideas, methods, instructions or products referred to in the content. |
© 2025 by the authors. Licensee MDPI, Basel, Switzerland. This article is an open access article distributed under the terms and conditions of the Creative Commons Attribution (CC BY) license (https://creativecommons.org/licenses/by/4.0/).
Share and Cite
Kremer, F.; Tress, M. Dielectric Spectroscopy: Yesterday, Today and Tomorrow. Appl. Sci. 2025, 15, 6954. https://doi.org/10.3390/app15136954
Kremer F, Tress M. Dielectric Spectroscopy: Yesterday, Today and Tomorrow. Applied Sciences. 2025; 15(13):6954. https://doi.org/10.3390/app15136954
Chicago/Turabian StyleKremer, Friedrich, and Martin Tress. 2025. "Dielectric Spectroscopy: Yesterday, Today and Tomorrow" Applied Sciences 15, no. 13: 6954. https://doi.org/10.3390/app15136954
APA StyleKremer, F., & Tress, M. (2025). Dielectric Spectroscopy: Yesterday, Today and Tomorrow. Applied Sciences, 15(13), 6954. https://doi.org/10.3390/app15136954