Abstract
This paper presents a detailed analysis of the dynamics of indoor environmental parameters under three simulated fire scenarios in a multi-story building, using the PyroSim platform (based on the Fire Dynamics Simulator—FDS). The study compares two smoke control strategies, organized natural ventilation (a passive system) and mechanical pressurization (an active system), evaluating their influence on temperature, differential pressure, air velocity, heat release rate (HRR), and toxic gas distribution. The simulations revealed that passive systems, relying on the stack effect and vertical natural ventilation, do not ensure the effective control of smoke infiltration into evacuation routes, allowing significant heat accumulation and reduced visibility. The results highlight the superior effectiveness of unidirectional mechanical pressurization in maintaining a stable flow regime, functional visibility, and a safe evacuation environment. A key finding is the transition from static pressure control to velocity-based flow control at the moment of door opening toward the fire source. The results confirm that a dynamically adapted application of mechanical pressurization—synchronized with the opening of access pathways—not only reinforces existing principles for protecting egress routes, but also provides a precise operational approach for optimizing emergency responses in high-rise buildings.
1. Introduction
Fire safety in high-rise buildings poses a significant challenge, with smoke control playing a critical role in preventing casualties and facilitating smoke extraction operations. The survival rate of occupants [1] trapped in a fire drops significantly within the first 2–4 min due to increased exposure to smoke and toxic gases, highlighting the critical importance of effective smoke management systems. Most fire-related deaths result from the inhalation of smoke, carbon monoxide (CO), and other toxic gases, rather than burn injuries, highlighting the critical impact of intoxication in fire mortality [2,3,4]. Additionally, the exposure of firefighters to smoke particles can lead to respiratory and cardiovascular diseases [5] as well as cancer, since protective equipment cannot fully prevent contaminant absorption through the skin. This underlines the need for advanced biomonitoring strategies and strict decontamination measures to mitigate long-term health risks [6]. Inadequate ventilation during fires increases smoke toxicity by promoting the accumulation of CO, CO2, hydrogen cyanide (HCN), and other toxic gases that can accelerate the heat release rate (HRR). This highlights the necessity for achieving an optimal safety balance in ventilation design and the need for regulatory frameworks governing smoke toxicity [7,8,9]. CO and soot particle emissions in mechanically ventilated fires are influenced by the ventilation rate and the fuel container’s size. Higher CO concentrations are observed under low ventilated conditions, while well-ventilated environments tend to produce more soot. This demonstrates the complex interaction between fuel characteristics and ventilation parameters in managing pollutant emissions during fires.
The opening of upper natural vents accelerates the spread of smoke, and natural ventilation alone is insufficient to ensure occupant safety [10]. Although intuitive, natural ventilation fails to effectively prevent smoke infiltration into stairwells [11], amplifying the stack effect and justifying continued research into mechanical pressurization, which has shown greater efficiency [12,13]. However, modern airtight buildings pose new risks related to positive pressure ventilation (PPV) and uncontrolled smoke migration during fires, underscoring the importance of strategically controlled ventilation to ensure both evacuation safety and structural integrity [14]. Positive pressure ventilation can either isolate smoke or unintentionally entrain it. Without optimized pressurization, the stack effect may transform airflow into a vector for contaminating egress routes [15]. Ventilation significantly influences fire dynamics in enclosed compartments, affecting combustion efficiency, temperature, and flame stability. Changes in ventilation may either enhance safety or increase the risk of re-ignition and unburnt gas accumulation [16,17]. In airtight compartments, the rapid rise in the pressure differential (from 100 Pa to 1650 Pa within less than 50 s of ignition) can obstruct egress routes, reverse ventilation flows, and compromise structural stability. Therefore, technical solutions for controlled pressure relief and optimized ventilation are essential in fire safety design [18].
Current fire safety research typically examines natural ventilation and mechanical pressurization separately. Natural ventilation is sustainable but is compromised by the stack effect [10], while mechanical pressurization enhances evacuation safety but requires precise pressure control [19]. Our study uniquely integrates both methods under identical fire conditions. Using advanced CFD simulations and a validated model, we analyze key safety parameters. This novel approach connects fire dynamics with ventilation performance, improving evacuation and firefighting strategies.
In Romania, a building is classified as high-rise if the highest usable floor exceeds 28 m, with those up to 45 m still considered high-rise, while structures above that height are classified as very tall buildings [20]. A review of international definitions shows variation: in the USA, a high-rise is defined as exceeding 23 m, measured from the fire department access point to the highest occupied floor [21]; in China, high-rise buildings are defined by fire safety regulations as residential buildings taller than 27 m, and multi-story factory, storage, or civil buildings taller than 24 m, according to the Code for Fire Protection Design of Buildings [22]; in the UK [23], buildings exceeding 18 m or having more than seven stories are considered high-rise. In the scientific literature, buildings over 35–36 m or 12 stories are often classified as tall [24], though this definition varies significantly depending on regulations and factors such as structural safety, wind loads, and urban integration, necessitating a flexible, context-sensitive classification approach. The importance of studying high-rise buildings arises from devastating fire incidents that have affected such structures, causing a significant loss of life and material damage. By implementing efficient evacuation strategies [25] and CFD-based numerical modeling [26], fire safety design in high-rise buildings can be improved.
The present study focuses on optimizing mechanical pressurization systems for smoke confinement in stairwells, comparing them to organized natural ventilation. It evaluates the effectiveness of different smoke pressurization strategies based on the configuration of an B + GF + 9F (basement + ground floor + nine floors) office building and the dynamic conditions of fire scenarios simulated in FDS. Within this context, two essential mechanisms influence smoke dynamics in a compartment fire in a high-rise building: the stack effect and positive pressure mechanical ventilation (PPV).
This research investigates the comparison between the stack effect and PPV for smoke control in an office building fire, addressing the following questions:
- What is the importance of pressurization and controlled ventilation in fire management?
- How do interior environmental parameters such as temperature, visibility, differential pressure, airflow velocity, HRR, and CO/CO2 concentrations differ in a multi-story building fire scenario when using the stack effect versus positive pressure ventilation?
- How effective are natural and mechanical ventilation systems in the analyzed scenarios at limiting the spread of smoke and toxic gases in an office building fire?
This paper addresses the gap in studying natural and mechanical ventilation together in high-rise fires. Current studies typically evaluate them separately [10,11,12,13]. We use advanced simulations to compare both methods under realistic conditions. This provides a clearer understanding of their combined effects on fire safety.
The following sections present the structure of the numerical model used to simulate the above-mentioned phenomena, including geometric configuration, ventilation setup, simulation domain and mesh discretization, boundary conditions, fire source parameters, result discussions, and study conclusions.
2. Modeling and Parameter Adjustment
2.1. Geometrical Model and Ventilation Setup
This research focused on a public civil office building with a height configuration of B + GF + 9F (basement, ground floor, and nine upper stories), analyzing a fire scenario originating in a compartment on the ground floor—a highly challenging situation in terms of both occupant evacuation and smoke management in the stairwell (Figure 1). The stairwell is not equipped with natural lighting, as opening windows in the stairwell significantly reduces pressurization efficiency [27]. To ensure differential pressure between the stairwell and adjacent spaces, a fan was installed on both the ground floor and the top floor.
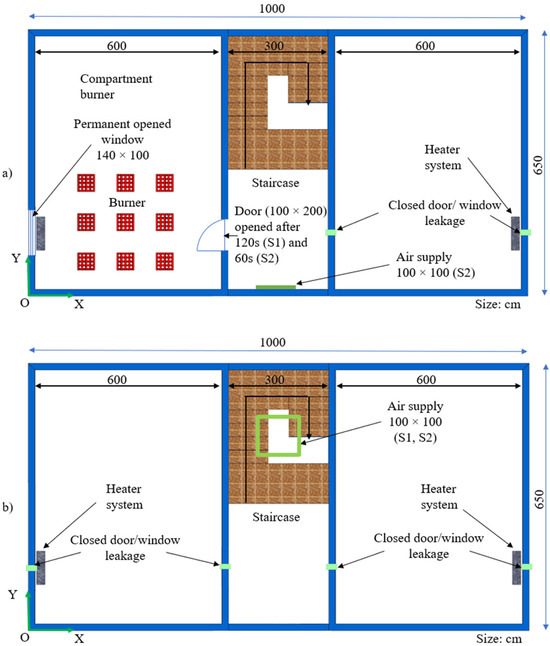
Figure 1.
Horizontal section through the building: the ground floor (a) and the top floor (b).
While previous studies often employ multiple air injection points into the stairwell to achieve the required pressurization, this research targets existing buildings, where implementing extensive ductwork is structurally infeasible. As such, three scenarios were defined:
- Scenario S0 simulates natural ventilation, relying on vertical smoke movement through passive openings and thermal buoyancy.
- Scenario S1 represents mechanical pressurization with a single air supply at the top of the stairwell to prevent smoke infiltration during evacuation.
- Scenario S2 uses dual mechanical pressurization, with air supplied at both the top and bottom of the stairwell to optimize airflow and smoke control.
Maintaining effective stairwell pressurization to prevent smoke ingress in high-rise buildings requires both careful system design—capable of compensating for pressure differentials across floor levels—and real-time dynamic adjustment of fire door dampers. This ensures a constant and adaptive protection regime during fire emergencies [28,29].
The basis for our building model lies in its reflection of a common layout found in many multi-story buildings, characterized by a central stairwell and two open compartments. This configuration aligns with typical conditions where doors remain open, thereby obviating the need for additional compartmentalization. Such a design effectively captures the essential dynamics of smoke propagation and ventilation, while ensuring computational efficiency. By avoiding the complexity of detailed geometric modeling, which could significantly increase computational time, we maintain a practical balance between accuracy and efficiency. Supported by previous research [10], which has validated its ability to accurately replicate critical fire phenomena such as the stack effect and smoke movement, this model is both representative and reliable for evaluating various ventilation strategies.
In order to achieve a simulation that closely approximates real fire conditions, a series of assumptions were established, based on the requirements of SR EN 12101-6 [30] and SR EN 12101-13 [31]:
- Positive pressure was applied exclusively at the stairwell level, using either a single fan with a 1 m × 1 m supply duct located on the upper level (scenario S1), or two fans, each with a 1 m × 1 m duct positioned on the upper and lower levels, respectively (scenario S2). This configuration was adopted considering that direct access to the fire compartment is provided through the stairwell.
- Within the fire compartment, the presence of an exterior opening (a window) [32] with dimensions of 1.40 m × 1.00 m was assumed. This opening was treated as a smoke and pressure exhaust path to the exterior.
- It was considered that the door to the fire-affected compartment opens after 120 s in scenario S1 and 60 s in scenario S2, as a result of occupant evacuation. During firefighting operations, this door remains open, while all other doors connected to the stairwell are assumed to be closed.
- The differential pressure between the stairwell and adjacent rooms, as established by standards, is approximately Pa 50 ± 10 Pa [30]. Additional research [33] shows that the pressure can reach hazardous levels, obstructing evacuation and rescue operations, highlighting that ventilation settings are essential for accurate simulations.
- Given that in PyroSim software version 6.7.9, introducing a pressure relief vent condition causes a significant drop in overpressure, such a condition was deliberately omitted from the model in order to preserve the accuracy of the simulated pressure behavior.
- Infiltration openings measuring 0.10 m × 0.10 m were taken into account, representing the cumulative area of leakage through windows and doors of compartments aligned with the external windows [10].
- The airflow rate was determined based on the total building volume, the required air exchange rate, and the effective leakage through each flow path. The resulting analysis established an air supply rate of 1 m3/s on the upper level and 1 m3/s on the lower level. Furthermore, when the stairwell door is opened at t = 120 s (scenario S1) and t = 60 s (scenario S2), the differential pressure criterion is replaced with a velocity-based criterion [31], which requires a minimum airflow velocity of 2 m/s at the doorway leading to the fire compartment.
Ventilation performance is governed by two opposing constraints: ensuring stairwell velocities exceed 2 m/s upon opening the door to the fire-affected area, and limiting pressure differentials between the stairwell and adjacent compartments to below 50 Pa. In the context of our analyzed building, characterized by specific infiltration rates outlined in the preceding chapter, these conditions cannot be simultaneously achieved. Consequently, a flow rate of 2 cubic meters per second (m3/s) is selected as an optimal compromise. The ventilation scenarios, S1 and S2, utilize similar airflow rates, distinguished by their points of introduction; scenario S1 introduces air exclusively from the top, whereas scenario S2 introduces air from both the bottom and the top of the structure
In this study, PyroSim 2023.3.1312 is employed to perform targeted simulations aimed at analyzing fire behavior and assessing the influence of ventilation on smoke propagation. By utilizing computational fluid dynamics (CFD)-based modeling, the results contribute to a deeper understanding of associated risks and the optimization of protective measures within the evaluated scenarios. PyroSim [34] is an intuitive software platform that supports fire and smoke spread simulations, offering a graphical interface for the Fire Dynamics Simulator (FDS).
Ventilation modeling plays a critical role in fire simulations, as it directly affects both smoke movement and the performance of HVAC systems. While PyroSim allows a detailed configuration of fan parameters, conventional models such as the quadratic fan model have limited accuracy in capturing dynamic pressure variations, which may compromise the reliability of simulation outputs. Recent studies [35,36] have proposed a novel approach based on the operating point method, where fan flow rates are adjusted according to system curves. This approach yields more precise and realistic results, particularly in dynamic fire conditions. Considering that the focus of this research is the improvement of evacuation conditions via stairwells in existing buildings, where the installation of air supply ductwork is not feasible, a pressure build up strategy was adopted using the supply function and strategically placed fans (Figure 2).
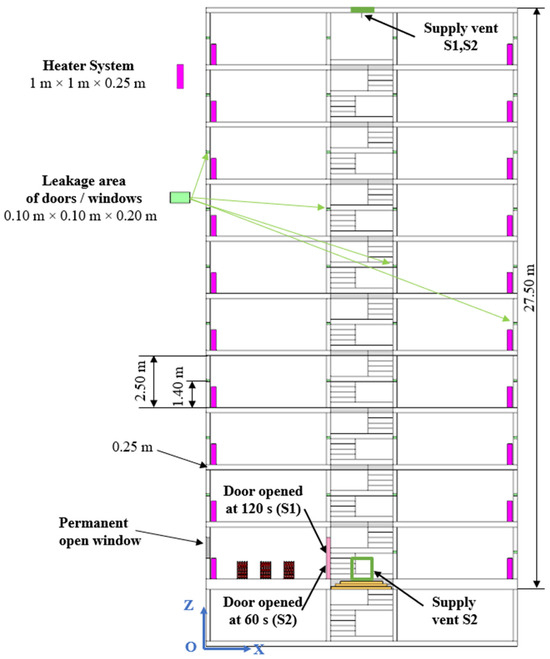
Figure 2.
Vertical section through the building along the Y-axis.
This method allows for air to be introduced directly into a specific zone and is significantly more practical and time efficient compared with implementing a full-scale HVAC system. A supply vent enables the localized control of airflow and positive pressure generation, making it ideal for preventing smoke spread into critical areas without the complexity and infrastructure requirements of a full HVAC system, which typically involves extensive duct networks and multiple fans.
2.2. Domain and Mesh
The optimal configuration of the simulation domain and mesh in FDS is critical for ensuring both the accuracy of the results and the computational efficiency of the numerical model. The domain size must be sufficiently large to capture fluid dynamic interactions with the physical boundaries, thereby providing realistic boundary conditions. The selected mesh resolution directly impacts the accuracy of thermal flow modeling and smoke propagation [37], and is typically determined based on the characteristic fire diameter. Achieving a balance between mesh granularity and computational cost is essential for obtaining reliable results, which justifies the necessity for sensitivity analyses and mesh optimization strategies [34,38].
The computational model presented in Figure 3 was developed in compliance with current simulation guidelines for Large Eddy Simulation (LES)-based fire dynamics simulations [34]. The domain dimensions were extended beyond the physical envelope of the building to accurately represent external airflow and climatic conditions. The mesh was structured using a combination of uniform and localized refined subdomains, ensuring both numerical accuracy and computational efficiency. Mesh cell alignment was maintained to prevent interpolation errors at mesh interfaces. Leakage areas were configured according to prior validated research [10], and design decisions were informed by the provisions of SR EN 12101-6 and SR EN 12101-13 regarding differential pressure smoke control systems.
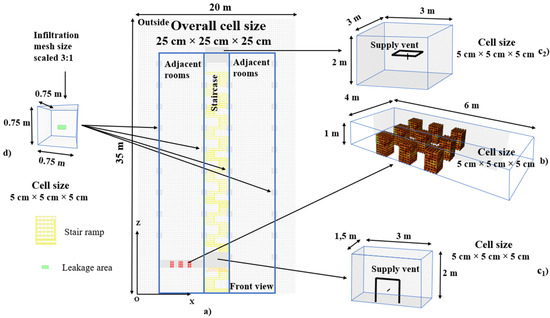
Figure 3.
Domain size and geometry: (a) two-dimensional schematic of the overall simulation domain; (b) fire source subdomain; (c1,c2) mechanical air supply subdomains; and (d) infiltration subdomains, shown in three-dimensional view.
For the simulations performed on this building, the analysis domain was extended beyond the physical limits of the structure. This approach enables the representation of various environmental conditions and allows for the monitoring of airflow both inside and outside the building envelope. The final dimensions of the simulation domain were defined as 35 m × 20 m × 15 m.
Multiple subdomains were defined to improve resolution in the areas of interest (Figure 3), including 1 surrounding the fire source, 36 subdomains for infiltration areas associated with doors and windows, and 2 subdomains for mechanical air supply used to generate positive pressure. The ignition source subdomain, located on the ground floor within the fire compartment, measured 6 m × 4 m × 1 m. The subdomains surrounding the infiltration openings—aligned with external windows and entrance doors—measured 0.75 m × 0.75 m × 0.75 m each. The subdomains for mechanical air supply were configured with dimensions of 3 m × 3 m × 2 m for the upper supply zone and 3 m × 1.5 m × 2 m for the lower zone.
Figure 3 illustrates the dimensions of the computational domain used in the simulation. Figure 3a provides a 2D schematic of the overall geometry, while Figure 3b through Figure 3d present detailed 3D views of specific subdomains. To enhance visualization, the infiltration Figure 3d is shown at a scale of 3:1. This modification is purely illustrative and has no impact on the accuracy of the physical model.
The mesh size [39] significantly influences both the accuracy and computational time of the simulation; therefore, selecting an appropriate compromise is essential to obtain reliable results within a reasonable timeframe. To evaluate the influence of mesh resolution, several grid sizes were tested using the D*/dx ratio, which quantifies the relation between the characteristic fire diameter and cell size [40]. In this study, the D*/dx values ranged from 6.68 (coarse mesh with 0.25 m cells) to 33.4 (fine mesh with 0.05 m cells). The mesh sensitivity analysis demonstrated that the 0.05 m cell size provided sufficient accuracy in resolving fire-induced flows and smoke behavior, without incurring excessive computational cost. Therefore, this resolution was adopted for the final simulations [10].
In the present study, a fine mesh with a cell size of 0.05 m was applied in the fire source area, air supply openings, and specific air leakage surfaces, while a coarse mesh with a cell size of 0.25 m was used for the remainder of the domain. The fire source subdomain contains 192,000 cells; the upper air supply subdomain contains 144,000 cells; the lower air supply subdomain contains 72,000 cells; and the combined infiltration subdomains consist of 128,250 cells. Considering the total cell count of 1,198,008, the coarse mesh accounts for 661,758 cells.
2.3. Boundary Conditions and Initial Conditions
According to the PyroSim manual [34], the simulation domain boundaries were set as open boundaries, as these are essential for ventilation control in fire simulations without restricting airflow movement. Furthermore, defining open boundaries within the domain allows free air circulation between the interior and exterior, thereby simulating passive openings such as windows or doors. The Mesh Boundary Vents settings in PyroSim were configured with an exterior temperature of 0.0 °C and a differential pressure between the exterior and interior of 0.0 Pa, in order to define the external environmental conditions and regulate airflow, ensuring the correct interaction between the indoor and outdoor environments during the fire simulation.
The following ambient conditions were set for the interior of the building in PyroSim:
- Ambient temperature: 20.0 °C;
- Ambient pressure: 1.01325 × 10⁵ Pa;
- Ambient oxygen mass fraction: 0.232378 kg/kg;
- Ambient carbon dioxide mass fraction: 5.95 × 10⁻⁴ kg/kg;
- Relative humidity: 40.0%;
- Maximum visibility: 30.0 m;
- Visibility factor: 3.0;
- Gravity: gravitational acceleration of −9.81 m/s2 along the Z-axis.
To realistically simulate outdoor environmental conditions, PyroSim 2024.2.1120 applied the Monin–Obukhov similarity theory to model stratified flows in the atmospheric boundary layer. This approach ensures horizontal homogeneity and accuracy in modeling thermal and turbulent interactions, which is crucial for complex scenarios such as pollutant dispersion and urban microclimates [41].
In this study, the scaling length L was set to 350 m, with a roughness height Z0 of 0.03 m. The reference height was established at 2 m, and the potential temperature scaling was set to 0 K. The initial horizontal wind speed was 1.0 m/s, directed at 180° (south). Default settings were applied for the vertical variation in wind speed with height (Z-axis), while the temperature profile included ground level at 0 m and a lapse rate of 0.0 K/m. These conditions are essential for simulating wind behavior over an open, thermally stable area, applied here in the CFD analysis of airflow patterns.
Boundary conditions in this study were carefully defined to realistically replicate typical indoor and outdoor environments influencing fire and smoke dynamics in high-rise buildings. Indoor parameters—including ambient temperature, pressure, and gas concentrations (oxygen and carbon dioxide)—were established based on standardized conditions reported in the fire safety literature [10]. Outdoor boundary conditions, such as wind speed, wind direction, and atmospheric stability, were modeled using the Monin–Obukhov similarity theory, which enables the accurate simulation of stratified atmospheric flows and turbulence. To enable natural airflow exchange between the building interior and exterior, open boundary conditions were applied, which is critical for accurately capturing ventilation-driven smoke movement and fire behavior.
2.4. Simulation Setup
In the simulations conducted using PyroSim, an essential aspect for controlling airflow and maintaining overpressure in the stairwell is the integration of a supply fan to generate differential pressure. In this context, one supply fan with a specified flow rate of 2 m3/s was introduced on the upper level (scenario S1), and two supply fans with a flow rate of 1 m3/s each were introduced in scenario S2. These fans were configured to simulate an atmospheric profile with a power law exponent of 0.2, and a profile origin set at 3.0 m for the fan located on the ground floor and 30 m for the fan located on the top floor. These settings enable the efficient modeling of air movement within the simulation domain, with the pressure ramp duration configured at 3 s.
A constant heat transfer coefficient of 50.0 W/(m2·K) was defined to accurately model heat exchange. In addition, the thermal boundary conditions for the fan surfaces were set with a fixed temperature, and the surface emissivity was configured at 0.9. The surface temperature was controlled using the TMPA parameter, with a ramp up duration for temperature set at 1.0 s, allowing for a smooth thermal transition. The fan was configured to operate continuously, without any deactivation conditions triggered by the differential pressure exceeding certain thresholds. The use of this fan system is critical for ventilation control in fire scenarios, ensuring both smoke containment and the maintenance of a controlled indoor environment.
The selection of environmental parameters—pressure, temperature, and heat release rate (HRR)—was based on their critical influence on fire development and smoke movement in high-rise compartments, as emphasized in recent CFD-based studies on fire dynamics and ventilation efficiency [42,43,44,45]. HRR was calibrated using the standardized t-squared fire growth model, adapted to the fire load and geometry of the scenario. Pressure and temperature boundary conditions were derived from realistic building operating conditions and refined through iterative sensitivity analysis to ensure both model stability and physical fidelity. The simulation setup aligns with the PyroSim user manual and adheres to European fire safety standards EN 12101-6 and EN 12101-13.
The arrangement of temperature measuring points was based on capturing critical fire and smoke behavior within the fire-affected zone and along evacuation routes, while also monitoring airflow patterns influenced by the stack effect and mechanical ventilation. This setup allows for a comprehensive assessment of thermal stratification, smoke propagation, differential pressure effects, occupant safety, and firefighting conditions. The coordinates of the five monitoring points are listed below:
| P1—X = 3.25; | Y = 2; | Z = 1.7 | (m) |
| P2—X = 7.5; | Y = 5.75; | Z = 1.7 | (m) |
| P3—X = 7.5; | Y = 5.75; | Z = 15.45 | (m) | |
| P4—X = 7.5; | Y = 5.75; | Z = 26.45 | (m) | |
| P5—X = 3.25; | Y = 2; | Z = 26.45 | (m) |
In complex fire simulations, the analysis of key parameter distributions—such as air velocity, temperature, pressure, and visibility—is essential for understanding the behavior of environments affected by fire. The use of slice files at various building heights (Figure 4) allows for the examination of how these variables change during the development of a fire event. This approach provides valuable insights for assessing safety conditions and evaluating the effectiveness of evacuation strategies.
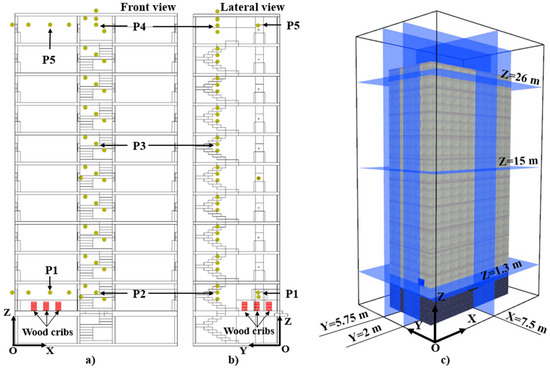
Figure 4.
Configuration of points monitoring (a,b) and slice planes used to record temperature, velocity, visibility, and pressure parameters (c).
To evaluate fire development and smoke propagation, five monitoring points were placed in key areas: within the fire compartment, on three levels inside the stairwell, and on the top floor. These locations were used to record temperature, air velocity, CO, and CO2 concentrations. As shown in Figure 4 their distribution enables the detailed analysis of thermal stratification, gas movement, and exposure conditions. To ensure consistency and allow comparison with the naturally ventilated scenario analyzed in [10], the same monitoring coordinates were adopted.
To obtain the simulation results in PyroSim, multiple workstations were used, each equipped with a 13th-generation Intel Core i9-13900K processor (Intel, Santa Clara, CA, USA). This CPU combines a frequency of up to 5.80 GHz, 36 MB of cache, and a hybrid architecture, delivering a top-tier performance for complex tasks and advanced multitasking. The simulations were conducted for a total duration of 360 s for scenarios S0, S1, and S2, with a constant time step maintained throughout the entire run. It is important to note that the numerical simulation of scenario S0, involving the natural-organized smoke ventilation [10], was re-executed with the same 360 s simulation time for consistency. The simulation time required to complete each scenario was approximately 48 h.
2.5. Burner Characteristics
In accordance with the methodology described in study [10], the fire source was defined using nine wood stacks to ensure consistency and comparability across the ventilation scenarios. The maximum value of the heat release rate (HRR) was determined using a specialized computational program, based on parameters such as calorific potential, ventilation conditions, and total combustible mass. This analysis yielded a peak HRR of 4350 kW, sustained for 960 s. The HRR evolution followed the theoretical t-squared (t2) fire growth model (HRR = α·t2), which reliably captures the development of fires during their growth phase [46]. The fire scenario incorporated an ignition delay of 10 s, a growth rate α = 0.1876 kW/s2, and a decay rate of 0.00293 kW/s2. The total combustible surface area was 80.325 m2, with a heat release rate per unit area (HRRPUA) of 100.0 kW/m2. A ramp up function was applied to simulate the progressive increase in HRR, ensuring a realistic fire development profile across all simulated ventilation configurations.
The combustion settings allowed for the detailed configuration of fire parameters. In this study, the heat of combustion per unit mass of oxygen was set at 13,100 kJ/kg, with a radiative fraction of 0.35, a carbon monoxide yield of 0.042, and a soot yield of 0.198, ensuring the accurate simulation of both thermal behavior and pollutant emissions during fire development.
A critical aspect in fire development is the occurrence of thermal phenomena such as flashover and backdraft. Flashover represents the critical point in a compartment fire where all combustible materials ignite almost simultaneously, marking the transition to the fully developed phase. This phenomenon is preceded by a rapid increase in heat and followed by decay and cooling phases, significantly impacting the structural behavior of exposed building elements [47]. Regarding backdraft, both temperature and the location of the ventilation opening play essential roles in its onset. Higher temperatures and lower-level openings favor the rapid occurrence of backdraft, while lower temperatures and higher-level openings delay it. This highlights the importance of temperature control and the strategic selection of opening locations to ensure firefighter safety during intervention [48,49]. Simulating backdraft remains a complex challenge in numerical fire modeling, requiring refined reignition parameters and more realistic definitions of initial conditions to reproduce experimentally observed behaviors—especially in scenarios involving gaseous fuels and sensitive mixing regimes [50]. The FDS results window provides a detailed view of fire evolution within a compartment, including 3D smoke movement simulations, an evaluation of heat release rate per unit volume (HRRPUV), and smoke density analysis. These parameters are essential for understanding fire behavior and for developing effective ventilation and firefighting strategies.
The building model has been previously studied in related research [10] focusing on office fires and stack effect interactions in multi-story buildings. The FDS model setup adhered to official guidelines, with mesh and time step sensitivity tests ensuring numerical stability. The error between experimental and numerical results is within accepted limits (5–10% mean relative error), confirming the model’s reliability for smoke and fire dynamics simulations in high-rise structures.
The fire source was validated experimentally and numerically in an independent study providing a reliable basis for HRR and fire growth parameters [10].
3. Numerical Results
3.1. Simulation Scenarios
The following section analyzes the behavior of an office building under fire scenarios, comparing the influence of two types of ventilation system—organized natural ventilation [10] and mechanical ventilation—on the evolution of the fire and indoor environmental parameters. The objective is to highlight how each system affects the distribution of temperature, smoke, pressure, HRR, carbon monoxide, and carbon dioxide under extreme conditions, in order to evaluate the performance of each ventilation solution in preventing fire spread and ensuring occupant safety.
Three ventilation scenarios were considered to evaluate their influence on fire dynamics in the high-rise building:
- Scenario S0 represents natural ventilation with organized openings: the window (1.40 m × 1 m) and door (1 m × 1 m) of the fire compartment are open, while on the top floor, smoke is evacuated through both a 1 m × 1 m smoke exhaust hatch and an open exterior window (1 m × 1 m) connected to the stairwell via a partially open door (0.5 m × 2 m). This configuration enables vertical smoke movement driven by thermal buoyancy (Figure 5—S0).
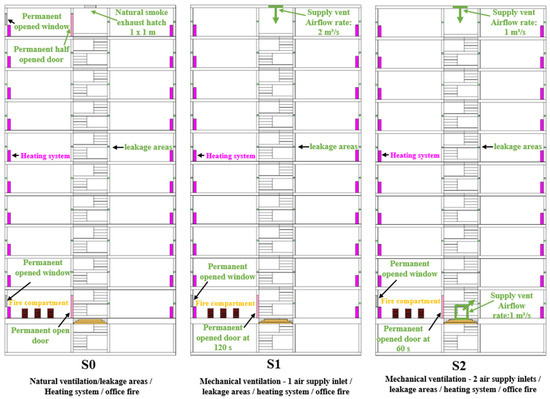 Figure 5. Fire simulation scenarios [10].
 - Under mechanical ventilation, scenario S1 includes a single air supply on the top floor, with the fire compartment window permanently open and the door opening at t = 120 s; the airflow rate is 2 m3/s (Figure 5—S1).
- Scenario S2 features dual air supply inlets located on the ground and top floors, with the fire compartment window also permanently open and the door opening at t = 60 s; each inlet provides an airflow rate of 1 m3/s. These defined conditions provide a comparative framework for analyzing the effects of natural versus mechanical ventilation on smoke control, airflow patterns, and overall fire behavior in high-rise structures (Figure 5—S2).
The three fire scenarios were selected to reflect typical and critical fire conditions in office buildings, focusing on ground floor fires that challenge evacuation and smoke control. Fire growth was modeled using the standardized t-squared curve to realistically simulate fire development. Fuel load assumptions were based on a fire load density of 420 MJ/m2, consistent with average office environments, resulting in a total heat release of approximately 6720 MJ [10]. Building characteristics, including geometry and ventilation openings, were defined to replicate realistic physical conditions. The numerical model was deliberately simplified to capture essential fire and ventilation dynamics without unnecessary complexity, ensuring computational efficiency while maintaining representativity. This balance allows a robust evaluation of ventilation strategies under realistic fire conditions.
3.2. Temperature Variation Inside the Building
The analysis of temperature distribution across the three fire simulation scenarios reveals significant differences both in the fire compartment and along the evacuation route. In scenario S2, a maximum temperature of 490 °C is observed, uniformly distributed within the fire compartment (as illustrated in Figure 6—S2 at T = 240 s). This distribution is explained by the additional air supply entering from the staircase, which is maintained at a higher pressure relative to the adjacent rooms, with air being introduced even on the lower level. This increased oxygen supply promotes intense combustion and elevated temperatures in the affected zone.
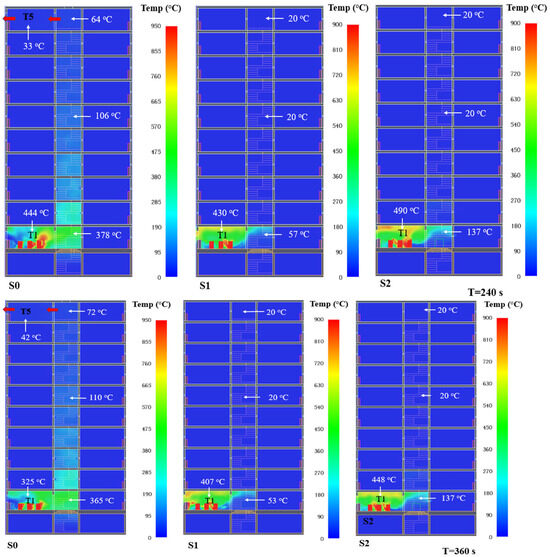
Figure 6.
Temperature distribution in the slice at Y = 2.00 m at times T = 240 s and T = 360 s.
In contrast, scenario S1 shows the lowest temperature in the staircase, with a maximum value of 57 °C recorded on the ground floor. This condition is particularly favorable from the perspective of the safe evacuation of occupants on the upper levels, as well as for firefighter intervention, by offering a thermally protected area.
In scenario S0, a temperature of 378 °C is recorded at point T2 in the staircase, a value that compromises the possibility of safe evacuation through this route. By comparison, in scenario S1, the temperature at the same location (T2) remains between 53 and 57 °C, indicating significantly better thermal protection. In scenario S2, the temperature at T2 reaches 137 °C, placing it between the values observed in the other two scenarios. Therefore, scenario S1 is the most favorable in terms of evacuation conditions and intervention safety, due to its effective thermal control within the stairwell.
Figure 7 presents the temperature distribution through the slice at Y = 5.75 m, from which the following conclusions can be drawn:
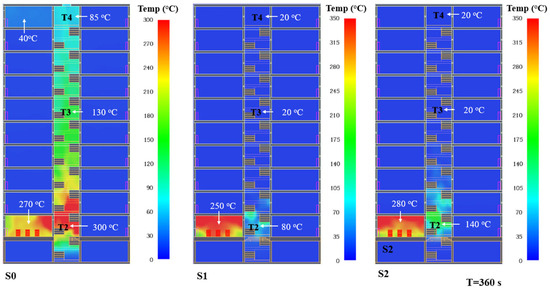
Figure 7.
Temperature distribution in the slice at Y = 5.75 m at time T = 360 s.
- In scenario S0, the stairwell acts as a vertical conduit for the propagation of hot gases, reaching temperatures up to 130 °C on the upper floors (T3) and 85 °C at location T4. The high vertical temperatures indicate an intense infiltration of smoke and heat, severely compromising evacuation conditions.
- In scenario S1, where the stairwell is pressurized and the door is opened at 120 s, the most favorable thermal profile is achieved: temperatures remain at 20 °C at points T3 and T4, while only 80 °C is recorded on the ground floor (T2). This scenario demonstrates the effectiveness of pressurization in preventing the ingress of hot gases into the stairwell, ensuring a safe and functional evacuation route for occupants and emergency responders.
- In scenario S2, although the stairwell is pressurized, the door opening at 60 s and the placement of the fan on the lower level reduces the system’s effectiveness. Temperatures significantly increase on the ground floor, reaching 140 °C at T2, which considerably reduces vertical evacuation safety. While the upper floors remain at 20 °C, the thermal load from the lower part of the stairwell adversely affects evacuation.
Therefore, scenario S1 offers the best thermal protection conditions within the stairwell, while scenario S0 is the least favorable. Scenario S2 indicates partial protection, compromised by the timing of door opening and fan placement on the lower level. These results highlight the critical importance of precise synchronization between pressurization, fan placement, and access control to the fire-affected areas in maintaining a functional evacuation route.
Figure 8 shows the temperature variation recorded by a thermocouple placed at X = 3.25 m, Y = 2.00 m, Z = 1.7 m above the fire source in the three simulated scenarios (S0, S1, and S2), highlighting the influence of the door opening time and ventilation configuration on the thermal regime.
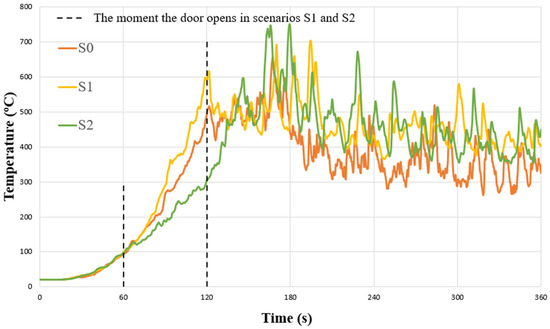
Figure 8.
Temperature graph recorded above the fire source by a thermocouple positioned at X = 3.25 m, Y = 2.00 m, Z = 1.7 m.
In scenario S2, the early door opening at 60 s does not cause a sudden temperature spike but rather a gradual and apparently controlled increase. This trend indicates that the active lower ventilation helps partially dissipate hot gases to the outside, reducing immediate thermal accumulation. However, after 120 s, an accelerated temperature rise is observed, reaching a significant peak above 700 °C—the highest among the three scenarios. This suggests that, in the short term, forced exhaust limits combustion intensity, but as the hot gas layer develops, the effect reverses: the introduced air stimulates combustion, and ventilation becomes an additional oxygen source.
In scenario S1, the door opening at 120 s leads to a slight temperature increase up to approximately 620 °C, followed by a short decline until around t = 170 s, when a sharp rise occurs, reaching 700 °C. The upper pressurization system supplies oxygen directly to the fire source, accelerating combustion.
In scenario S0, the temperature increases steadily but without significant oscillations or high peaks. This reflects a more stable combustion regime, though with moderate thermal efficiency, characteristic of organized natural ventilation. Although the peak temperature is lower, the persistent heat accumulation compromises long-term evacuation safety.
The simulations clearly demonstrate the critical role of door opening timing and ventilation system configuration on the localized thermal regime at the fire source. Scenario S2’s lower ventilation has a dual effect: initially low thermal growth, but it later promotes intensified combustion and the development of a high thermal regime. Scenario S1, lacking a gas exhaust path, triggers a rapid and aggressive reaction upon door opening. Meanwhile, scenario S0 offers a more predictable evolution but lacks active control over fire development. Therefore, the combined control of door opening timing, fan placement, and airflow direction is essential to limit fire growth in the early phase and protect evacuation routes.
In conclusion, the simulation results obtained with PyroSim demonstrate the effectiveness of the mechanical stairwell pressurization system presented in scenario S1. This system generates a differential pressure that prevents heat accumulation along evacuation routes, thereby ensuring their accessibility for both emergency responders and occupants during evacuation. This underscores the critical importance of employing mechanical pressurization in fire scenarios to maintain safety and efficiency in evacuation management. Scenario S1, which combines stairwell pressurization with delayed door opening, provides the most favorable thermal safety conditions by maintaining low temperatures vertically and ensuring a protected evacuation path. In contrast, scenario S0 facilitates heat propagation within the stairwell, while scenario S2, although more effective at the fire source level, partially compromises the thermal protection of the evacuation route.
3.3. Velocity of Airflow Throughout the Building Interior
From the perspective of the airflow velocity analysis presented in Figure 9, Figure 10 and Figure 11, it is observed that scenarios S1 and S2 exhibit lower velocity values compared with scenario S0, where smoke evacuation is achieved through organized natural ventilation. In scenario S0, the stack effect significantly increases air velocity within the stairwell, with the airflow direction being upward, as opposed to the downward direction observed in scenarios S1 and S2. Once the door to the fire compartment is opened, the pressure differential criterion is replaced by the velocity criterion. At this point, velocities of up to 2 m/s can be observed on the ground floor level of the stairwell, which are below the recommended thresholds established by the European standard SR EN 12101-6 [30].
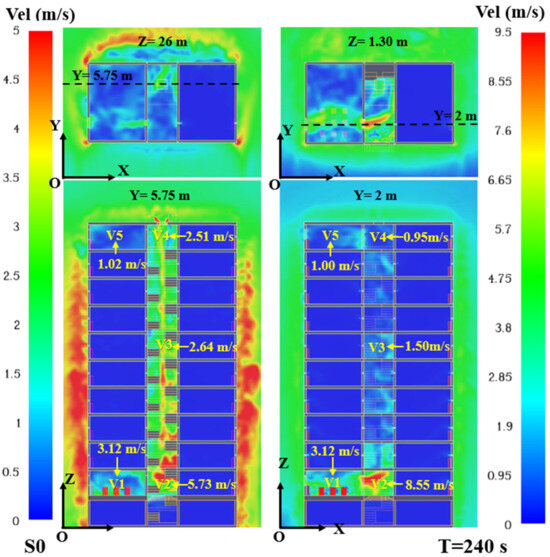
Figure 9.
Velocity distribution in the Y = 2 m and Y = 5.75 m slices for scenario S0.
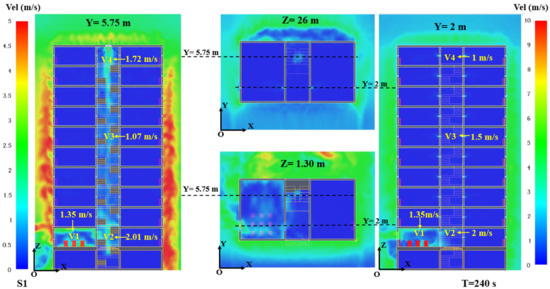
Figure 10.
Velocity distribution in the Y = 2 m and Y = 5.75 m slices for scenario S1.
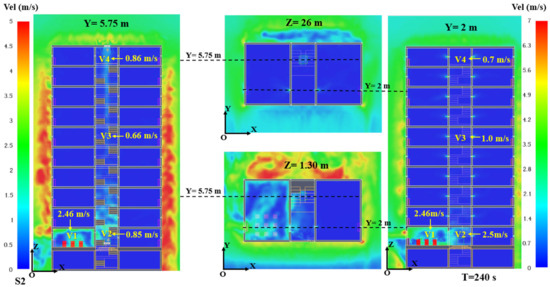
Figure 11.
Velocity distribution in the Y = 2 m and Y = 5.75 m slices for scenario S2.
The graphical representation of air velocity distribution (Figure 9, Figure 10 and Figure 11) in three characteristic planes—two vertical (Y = 2 m and Y = 5.75 m) and two horizontal (Z = 1.3 m and Z = 26 m)—allows for a comprehensive spatial analysis of airflow behavior within the stairwell. This multi-sectional orthogonal approach provides a three-dimensional understanding of the interaction between ventilation dynamics, building geometry, and thermal buoyancy effects. The evaluation is carried out under the condition that the door to the fire compartment is open, in which case the relevant criterion becomes the airflow velocity through the opening, rather than the differential pressure.
Scenario S0 (Figure 9) highlights an aerodynamic regime entirely dependent on thermal buoyancy, with no mechanical air supply. The recorded values (V2: 5.73 m/s; V3: 2.64 m/s; and V4: 2.51 m/s) suggest a rapid vertical propagation of hot gases within the stairwell, while the airflow remains undirected and uncontrolled, indicating the absence of effective smoke management. The airflow patterns in the horizontal Z planes reveal uneven smoke propagation both vertically and laterally, compromising evacuation safety. Additionally, the Y = 2 m slice shows high airflow velocities of up to 8.55 m/s at the fire compartment door leading into the stairwell, indicating a hazardous gas flow dynamic. Such conditions demand precise control through coordinated ventilation strategies and timed access opening. In the absence of effective control, there is a high risk of secondary flashover or backdraft, endangering both structural integrity and human life. Therefore, scenario S0 proves to be ineffective, as high velocity alone does not equate to protection in the absence of controlled airflow.
Scenario S1 (Figure 10) is the only case in which the fan configuration successfully generates a stable downward jet, precisely directed opposite to the smoke propagation. The recorded velocity in the lower area (V2: 2.01 m/s at T = 240 s) aligns exactly with the threshold set by the standard, forming an effective barrier against the flow of toxic gases. The vertical velocities (V3, V4: ~1.6–1.7 m/s) are nearly uniform, ensuring consistent pressurization along the entire height of the stairwell. The horizontal planes (Z = 1.3 m and 26 m) confirm the absence of recirculating flows, supporting the validation of this scenario as the only strategy that meets both velocity requirements and flow stability criteria.
In scenario S2 (Figure 11), although air is introduced both at the top and bottom of the stairwell, the resulting velocities are significantly lower: V2 = 0.85 m/s, V3 = 0.66 m/s, and V4 = 0.86 m/s. This distribution indicates weak airflow, with zones of stagnation and turbulence—particularly near the fire source, where the lower fan interferes with the combustion gases. None of the measured points reach the 2 m/s threshold, meaning that scenario S2 does not provide effective protection against smoke infiltration into the stairwell. The placement of the fan at ground level contributes to the mixing with hot smoke, further reducing the system’s overall efficiency.
In scenario S1, the airflow is well directed and downward, and constant infiltration from the stairwell into adjacent rooms is observed near the doors. The velocity values in these areas are close to the functional threshold of 2 m/s, indicating the presence of an effective aerodynamic barrier capable of limiting smoke ingress into the protected zone. The vertical airflow regime remains stable throughout.
In scenario S2, the infiltration velocity is significantly lower, and the airflow near the doors is fragmented and unstable. The uneven pressure distribution—caused by air being introduced at both the top and bottom of the stairwell—prevents the achievement of the critical sealing velocity, especially in the lower zone, where the proximity to the fire source increases the risk of smoke contamination.
In conclusion, only scenario S1 ensures coherent and directed infiltration flows capable of acting as an active barrier against smoke penetration. In scenario S2, performance is hindered by the lack of sufficient differential pressure, while in scenario S0, the effect is completely reversed, with uncontrolled smoke ingress into adjacent rooms, significantly amplifying risks for occupants.
Figure 12 illustrates the velocity distribution through the slice at X = 7.50 m, highlighting that scenario S1, with superior pressurization and a unidirectional downward jet, provides the most effective smoke control in the stairwell by maintaining a stable flow and an efficient aerodynamic barrier. In scenario S2, the interaction between opposing jets and the fire-induced flow generates instabilities in the lower region, reducing the overall protection efficiency. Scenario S0 allows for the formation of an uncontrolled stack effect with high velocities, promoting the rapid contamination of the evacuation space.
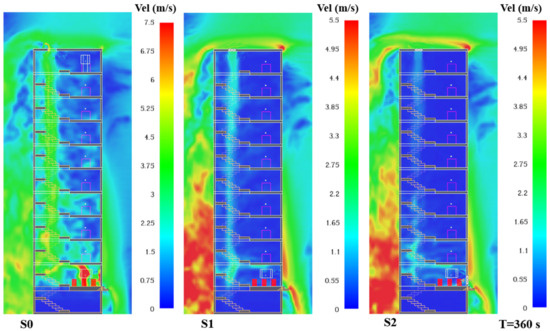
Figure 12.
Velocity distribution in the slice at X = 7.50 m at time T = 360 s.
3.4. Visibility Inside the Building
Visibility is a critical indicator for assessing safety conditions during evacuation in the event of a fire. The comparative analysis of the three scenarios (Figure 13) reveals significant differences in maintaining a breathable and safe environment within the stairwell. In scenario S0, the progressive and severe contamination of the stairwell by combustion products is observed. The visibility values remain consistently below 3 m throughout the entire height at both T = 240 s and T = 360 s, indicating a complete inability to maintain a usable evacuation route. Smoke freely penetrates from the fire compartment due to the thermal stack effect and distributes vertically in an uncontrolled manner.
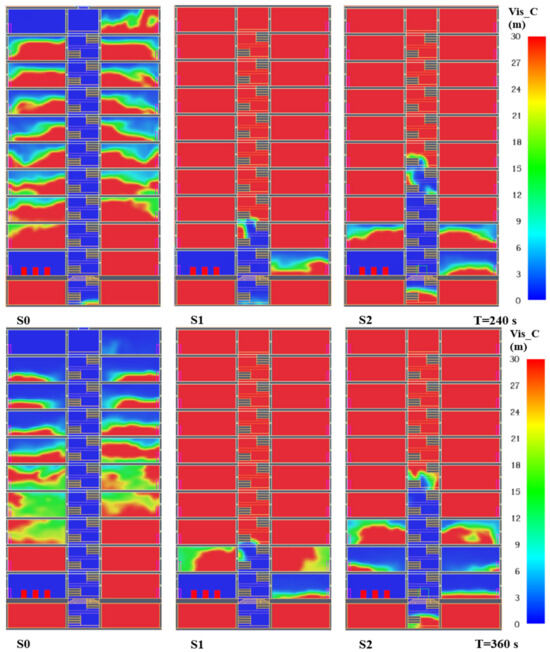
Figure 13.
Visibility distribution in the cross-sectional plane Y = 5.75 m, corresponding to the times T = 240 s and T = 360 s.
Regarding the dissipation of combustion gases inside the building (Figure 14), the visibility distribution confirms the previous conclusions about the vertical airflow behavior within the stairwell. Scenario S1 stands out as the most effective, maintaining an overall visibility level adequate for evacuation. Although a localized decrease in visibility down to approximately 2–3 m is observed in the lower part of the stairwell, it remains consistently above the minimum functional threshold. This area does not disrupt the continuity of evacuation, being controlled by the downward jet induced by pressurization, which ensures that the evacuation route remains operational throughout the duration of the fire.
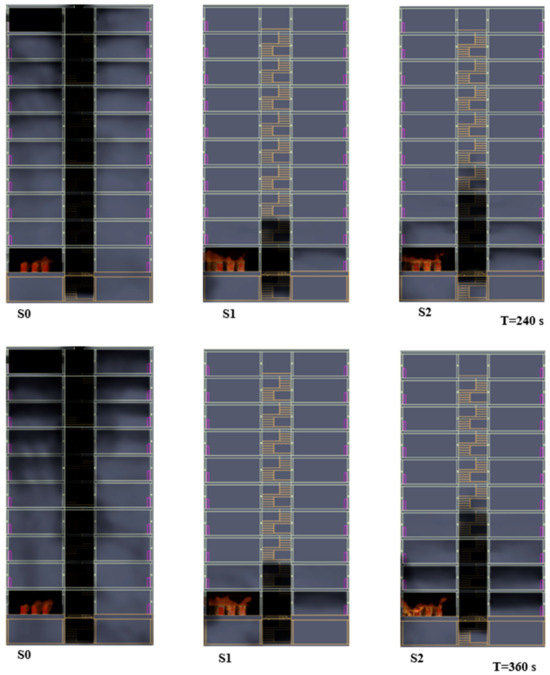
Figure 14.
Smoke distribution in front view for the scenarios corresponding to times T = 240 s and T = 360 s.
In conclusion, scenario S1 provides an optimal balance between the dissipation of toxic gases and the maintenance of functional visibility within the stairwell, ensuring essential conditions for a safe and uninterrupted evacuation. This configuration enables the simultaneous control of air contamination and visual clarity along evacuation routes, thus offering a clear operational advantage over the other scenarios analyzed.
3.5. Differential Pressure Inside the Building
The distribution of differential pressure in the three analyzed scenarios (Figure 15, Figure 16 and Figure 17) highlights the direct influence of the ventilation strategy on the system’s ability to maintain an effective pressure barrier within the stairwell. Scenario S0 (Figure 15) illustrates the typical behavior of a building exposed to the thermal stack effect generated by a fire. Due to intense heating near the fire source and the absence of a controlled air supply, a pronounced negative differential pressure develops within the stairwell, with values reaching as low as −32.84 Pa, caused by the upward movement of hot gases. This negative pressure is physically explained by the temperature and density differences between indoor and outdoor air, and the analytical estimation correlates well with the simulation results. In the absence of a pressure barrier, the stairwell becomes an open channel for smoke contamination, leading to a rapid and irreversible deterioration of visibility and evacuation conditions.
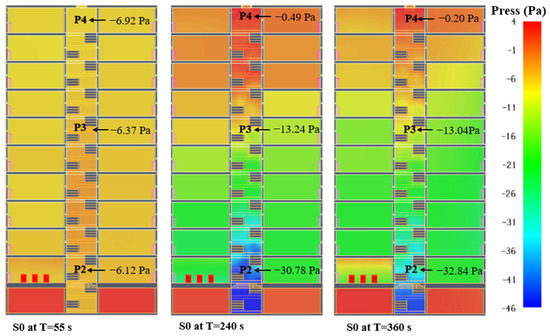
Figure 15.
Differential pressure distribution in the sectional plane Y = 5.75 m for scenario S0 at different time moments.
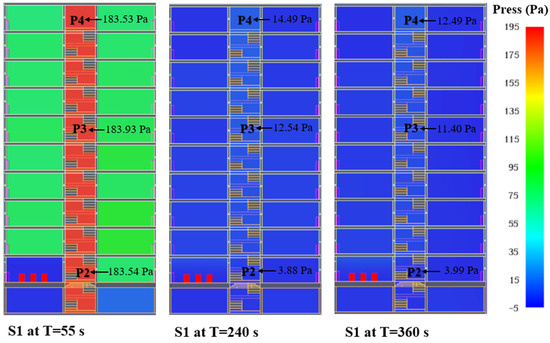
Figure 16.
Differential pressure distribution in the sectional plane Y = 5.75 m for scenario S1 at different time moments.
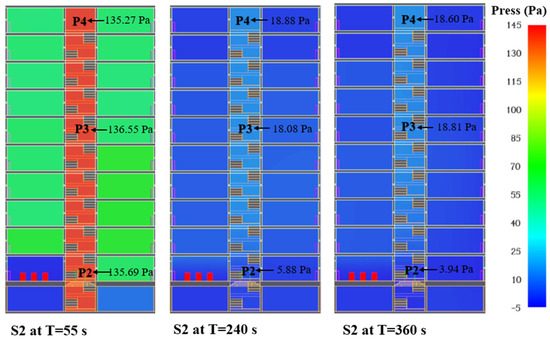
Figure 17.
Differential pressure distribution in the sectional plane Y = 5.75 m for scenario S2 at different time moments.
In scenario S1 (Figure 16), by introducing air solely on the upper level, the system generates a positive and stable vertical pressure gradient. At T = 360 s, the pressure values range between 12.5 Pa (top) and 3.9 Pa (bottom). This distribution ensures a stable downward airflow and effective protection against smoke infiltration, even when the access door to the fire compartment remains open. The system effectively compensates for leakage losses.
In scenario S2 (Figure 17), although the pressure values remain positive (18.6 Pa at the top, 3.9 Pa at the bottom at T = 360 s), the dual fan configuration introduces interference between the ascending and descending airflow streams. The presence of the lower fan, placed near the fire source with the door open, actively supplies air to the fire zone, reducing the local pressure differential and, consequently, the effectiveness of the aerodynamic barrier. Instead of supporting pressure maintenance in the stairwell, the lower fan may indirectly feed combustion or facilitate smoke propagation into intermediate volumes, negatively affecting pressure control in these areas.
A key moment is recorded at t = 55 s, when a pressure of approximately 183 Pa is observed in the stairwell, compared with 110 Pa in the adjacent spaces in scenario S1, and 136 Pa versus 80 Pa in scenario S2. The pressure values in the adjacent spaces result from air infiltration from the stairwell due to its pressurization. The resulting pressure differentials—73 Pa in S1 and 56 Pa in S2—fall within the optimal range recommended by European standards (50 Pa ± 10%), allowing doors to be opened without additional effort and ensuring safe evacuation conditions [30].
The door opening at 120 s in scenario S1 and at 60 s in scenario S2 produces a controlled decrease in differential pressure, with a balanced redistribution along the vertical axis over time. Although the pressure drops compared with the initial moment, the values remain functional for protecting evacuation routes, particularly in the upper zones. However, maintaining control on the lower levels is essential, where the pressure falls below the optimal threshold. According to the NFPA 92 standard [51], maintaining a minimum differential pressure of 25 Pa (for compartments without sprinklers) is essential to prevent smoke migration between compartments. In the simulation results shown in Figure 16 and Figure 17 for scenarios S1 and S2, the values recorded after door opening indicate that although pressure is partially maintained in the upper zone, the lower level no longer meets the required minimum threshold, partially compromising the effectiveness of the smoke control system in the lower section.
A comparative analysis of the three ventilation scenarios (S0, S1, and S2) highlights the critical influence of the pressurization strategy on aerodynamic behavior in the stairwell under fire conditions. In scenario S0, the absence of active pressurization leads to the development of pronounced negative differential pressure due to thermal buoyancy, which promotes uncontrolled smoke infiltration and completely compromises the evacuation routes. Scenario S1, with unidirectional top-down pressurization, ensures the most stable pressure regime and effectively maintains a downward airflow, preventing smoke ingress into the stairwell. Scenario S2, although characterized by globally positive pressure, suffers from local imbalances caused by the interaction between opposing jets and fire-induced flow, reducing the protection of the stairwell, particularly in the lower and middle regions.
A critical aspect identified is the transition from differential pressure control to airflow velocity control upon door opening toward the fire compartment. In such cases, effective protection is governed not by the maintenance of static pressure but by the direction and magnitude of airflow velocity at the opening.
3.6. Dynamics of Combustion Gas Accumulation (CO and CO2) in the Built Environment
In addition to analyzing thermal and visibility parameters, evaluating occupant risk during a fire requires the strict monitoring of toxic gas concentrations produced by combustion—especially carbon monoxide (CO) and carbon dioxide (CO2). According to the specialized literature [10], exposure for 15 min to CO concentrations in the range of 1000–1200 ppm (0.1–0.12%) is associated with a high risk of lethal intoxication. For CO2, the safety threshold is exceeded at concentrations above 4% (≈40,000 ppm), which impairs individuals’ physiological ability to evacuate.
The CFD simulation data presented in Figure 18 and Figure 19 reveal a clear differentiation between the scenarios in terms of toxicological risk. In scenarios S0 and S2, the values recorded at monitoring point P2 show a rapid exceedance of lethal thresholds for both CO and CO2. In scenario S0, the CO concentrations exceed 0.12% after only 116 s, while in S2 this occurs at 155 s (Figure 18). The critical CO2 level of 4% is reached at 130 s in S0 and 170 s in S2 (Figure 19). This trend indicates an accelerated accumulation of toxic gases due to the lack of efficient ventilation and the inability to evacuate safely. Conversely, scenario S1 maintains CO and CO2 concentrations at significantly lower levels. Although slight increases in CO above 0.12% are observed at isolated moments, the levels do not reach dangerous thresholds and do not persist for critical durations. This confirms the effectiveness of unidirectional pressurization in limiting the spread of combustion gases. Notably, CO becomes toxic before CO2, as evidenced by the chronology of threshold exceedance in all scenarios. This behavior highlights the importance of differential monitoring and rapid response, as CO—being odorless and neurotoxic even at low concentrations—poses the primary risk factor during the initial minutes of a fire.
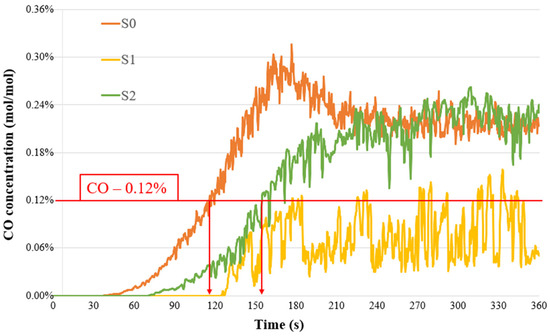
Figure 18.
Variation in CO concentrations at point P2 in the stairwell for scenarios S0, S1, and S2.
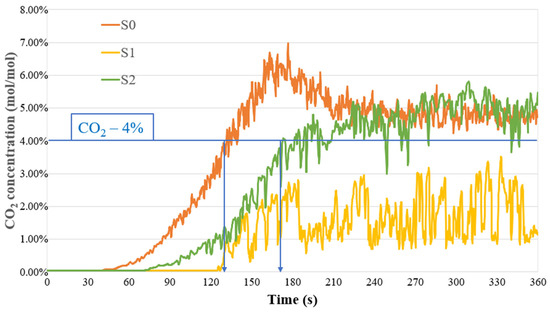
Figure 19.
Variation in CO2 concentrations at point P2 in the stairwell for scenarios S0, S1, and S2.
CO and soot emissions in a mechanically ventilated fire are influenced by the ventilation rate and the size of the fuel container, with underventilation favoring CO production, while effective ventilation leads to increased soot generation [52]. In this context, at points P3 and P4, mechanical positive pressure ventilation provides complete protection against the accumulation of toxic gases, maintaining the CO and CO2 concentrations at zero throughout the simulation. Among the three simulated scenarios, only S1 ensures that the CO and CO2 concentrations remain within acceptable limits for safe evacuation. In scenarios S0 and S2, the toxic gases rapidly exceed critical thresholds, confirming the inadequacy of natural ventilation (S0) and the instability of airflow in the top-down fan configuration (S2). These findings support the conclusion that monitoring toxic gases—especially CO—and ensuring a controlled, unidirectional airflow are essential requirements for the effective protection of occupants during fire events.
3.7. Analysis of Heat Release Rate (HRR) in the Fire Compartment
The evolution of the heat release rate (HRR) reflects the sensitivity of the combustion process to ventilation conditions and to dynamic events that alter the oxygen balance within the compartment. All three scenarios (Figure 20) exhibit a similar initial increase in HRR, up to the point of reaching a fully developed fire, around t = 120–150 s, after which their behavior diverges.
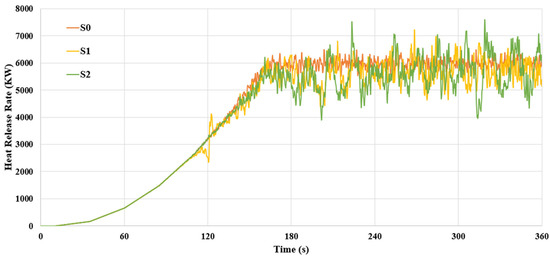
Figure 20.
HRR variation across the three scenarios.
- In scenario S0, the HRR reaches approximately 6000 kW and stabilizes in an oxygen-limited burning regime, with minor fluctuations governed by thermal buoyancy and passive air leakage.
- In scenario S1, the HRR is significantly influenced by the moment the door is opened, allowing air from the stairwell to enter the compartment. Although the system mitigates abrupt variations, this air inflow triggers a transient increase in HRR, confirming that pressurization alone cannot fully prevent combustion intensification when a direct opening is created.
- In scenario S2, the HRR exhibits the highest instability, with frequent peaks exceeding 7000 kW. This behavior is explained by the combined effect of the early door opening and the placement of the lower fan on the ground floor, in close proximity to the fire source. The fresh air introduced from below flows directly into the combustion zone, fueling the fire in an uncontrolled manner and promoting oscillatory burning regimes that are difficult to stabilize.
Scenario S2 generates the most unstable combustion regime due to bidirectional ventilation and the placement of the lower fan near the fire source. Scenario S1, although temporarily affected by the door opening, provides better control over HRR. Scenario S0 exhibits stable but oxygen-limited combustion. Optimizing ventilation involves not only selecting the appropriate airflow rate but also strategically positioning air inlets to avoid directly feeding the fire source.
4. Discussions
The specific quantitative measures that most clearly demonstrate the differences in performance between the ventilation methods are maximum temperature, pressure difference, V2 airflow velocity, and toxic gas concentrations (CO and CO2). Scenario S0 shows high maximum temperatures (300 °C), a negative pressure differential (−32.84 Pa), and an ascensional V2 velocity (5.73 m/s), with CO exceeding 0.12% at 116 s and CO2 surpassing 4% at 130 s. Scenario S1 maintains safer temperatures (80–85 °C), a positive pressure differential (+73 Pa), a downward V2 velocity (2.01 m/s), and maintains CO and CO2 below hazardous thresholds. Scenario S2 has moderate temperatures (140 °C), a positive pressure differential (+56 Pa), V2 with both directions at 0.85 m/s, with CO exceeding 0.12% at 155 s and CO2 surpassing 4% at 170 s. These measures indicate that mechanical ventilation through differential pressure, as demonstrated in scenario S1, provides the most effective smoke management and optimal evacuation conditions.
Sensitivity analyses were performed to assess the robustness of the simulation results concerning key parameters. The use of CFD FDS combined with polynomial chaos identified crucial variables such as fuel mass flux and activation energy, which significantly influence smoke dynamics [53]. Another study highlighted the importance of turbulent model constants and combustion efficiency through a design of experiment approach, demonstrating their significant effects on simulation outputs [54]. Our study extends these findings by analyzing ventilation scenarios, revealing that airflow configuration is critical to understanding fire behavior and optimizing evacuation strategies. This comprehensive analysis underscores the need for precise parameterization to enhance the accuracy and reliability of fire safety models.
The simulation results inform practical design and operational decisions for fire safety systems in high-rise buildings by demonstrating the effectiveness of mechanical pressurization. This method stabilizes thermal conditions, maintains positive pressure, and controls toxic gas levels, thereby ensuring safe evacuation routes. Key insights include the importance of unidirectional airflow to prevent smoke ingress and the role of fan placement and door timing in managing fire intensity. These findings emphasize the necessity of precise ventilation control to enhance occupant safety and effectiveness during fire emergencies.
Natural and mechanical ventilation have distinct effects on the development of fires, as seen in three scenarios. Scenario S0 involves natural upward airflow, allowing smoke to infiltrate adjacent compartments through gaps. Scenario S1 employs mechanical ventilation with a downward airflow due to the fan’s position at the top, effectively containing smoke to the first floor within the stairwell. Scenario S2 presents a mix of upward and downward airflows, with a reduced output from fan 1 and the activation of fan 2, resulting in smoke dispersion up to the third floor within the stairwell. In both S1 and S2, the strategic opening of windows in the fire compartment allows the effective evacuation of smoke, protecting the rest of the building. This demonstrates the positive impact of ventilation. There is only a minimal performance difference between S1 and S2, indicating that both configurations provide significant protection against smoke propagation.
As part of our future work, we intend to extend the proposed method to analyze the behavior of structures exposed to fire. Recent studies [55] have demonstrated that architectural factors (ventilation, ceiling height, and room dimensions) significantly influence the temperature field in RC elements under fire exposure. Their combined use of CFD and FEA modeling to simulate fire dynamics and heat propagation highlights the complexity and variability of real fire scenarios, which differ markedly from standardized ISO fire curves. Integrating such thermal behavior into our method would further enhance its applicability and accuracy in assessing fire-induced structural performance.
5. Conclusions
This study employed PyroSim (FDS) simulations to evaluate fire scenarios in a high-rise office building, focusing on evacuation safety. The analysis highlighted the superiority of mechanical positive pressure ventilation over natural ventilation. Mechanical pressurization stabilizes thermal conditions along evacuation routes, maintaining safe temperatures and limiting toxic gas accumulation. It creates stable airflow barriers, preventing smoke ingress into stairwells and ensuring safe egress. Visibility is preserved, facilitating evacuation and firefighter access. Maintaining positive pressure counteracts smoke infiltration, while strategic airflow management limits hazardous gases like CO and CO2. Fan placement and door timing are critical in managing fire intensity and heat release. This study emphasizes that optimal protection requires the precise control of airflow distribution, rather than simply having a ventilation system. Scenario S1 demonstrated the most effective stairwell protection, avoiding the smoke migration and instabilities seen in scenarios S0 and S2.
Author Contributions
D.-A.I., the main author, developed the structure of the paper, performed the numerical simulations, validated the data, and interpreted the results. He was also responsible for the formal analysis and the drafting of the manuscript. V.I., also a main author, contributed to defining the overall research direction, supervised the conducted work, and actively participated in the interpretation of results and the final revision of the manuscript. I.-C.E., also the main and corresponding author, provided essential support in conducting the computational tests, ensuring the technical framework necessary for the development of the numerical model. I.A., the fourth author, contributed significantly by facilitating access to the simulation platform required for running the numerical simulations. All authors have read and agreed to the published version of the manuscript.
Funding
This research work would not have been possible without the use of workstations from the “CFD Fire Simulation and Evacuation for Large Infrastructures” Laboratory, developed through the project “Development of an Innovative Center for Smart Digital Coordination,” funded by the National Recovery and Resilience Plan, Component C15: Education/Reform 5: Adoption of the Legislative Framework for the Digitalization of Education/Investment 16: Digitalization of Universities and Their Preparation for the Digital Professions of the Future.” The digitalization project “Development of an Innovative Center for Smart Digital Coordination,” project code e-PNRR: 2031753094, was approved by the Order of the Minister of Education No. 4168/30.06.2022. The Funding Contract No. 14017 dated 16 September 2022 is between the “Alexandru Ioan Cuza” Police Academy and the Ministry of Education.
Institutional Review Board Statement
Not applicable.
Informed Consent Statement
Not applicable.
Data Availability Statement
The original contributions presented in the study are included in the article. Further inquiries can be directed to the corresponding authors.
Acknowledgments
We wish to extend our gratitude to Florin Bode for his valuable expertise, careful guidance, and constant support in the development of this work.
Conflicts of Interest
The authors declare no conflicts of interest.
References
- National Fire Data Center. Firefighter Rescue Survey the First 3000 Rescues Time v Survival Percentage Search Time Removal Time the First 3000 Rescues. 2024. Available online: https://www.firefighterrescuesurvey.com/uploads/2/5/3/6/25366566/.3000_slides_pdf.pdf (accessed on 7 December 2024).
- McKenna, S.T.; Birtles, R.; Dickens, K.; Walker, R.G.; Spearpoint, M.J.; Stec, A.A.; Hull, T.R. Flame retardants in UK furniture increase smoke toxicity more than they reduce fire growth rate. Chemosphere 2018, 196, 429–439. [Google Scholar] [CrossRef] [PubMed]
- Hansen-Bruhn, I.; Hull, T.R. Smoke toxicity of fire protecting timber treatments. Fire Saf. J. 2023, 141, 103977. [Google Scholar] [CrossRef]
- Purser, D.A. Assessment of pre-warning, pre-travel and travel behavior interactions with smoke and toxic gases during fire incidents. Fire Saf. J. 2023, 141, 103938. [Google Scholar] [CrossRef]
- Xu, X.; Shang, Y.; Tian, L.; Weng, W.; Tu, J. A numerical study on firefighter nasal airway dosimetry of smoke particles from a realistic composite deck fire. J. Aerosol Sci. 2018, 123, 91–104. [Google Scholar] [CrossRef]
- Gill, B.; Britz-McKibbin, P. Biomonitoring of smoke exposure in firefighters: A review. Curr. Opin. Environ. Sci. Health 2020, 15, 57–65. [Google Scholar] [CrossRef]
- Hull, T.R.; Brein, D.; Stec, A.A. Quantification of toxic hazard from fires in buildings. J. Build. Eng. 2016, 8, 313–318. [Google Scholar] [CrossRef]
- Stec, A.A.; Hull, T.R. Assessment of the fire toxicity of building insulation materials. Energy Build. 2011, 43, 498–506. [Google Scholar] [CrossRef]
- Mózer, V.; Hejtmánek, P.; Hadingerová, L.; Pokorný, M. Toxicity of smoke from upholstery materials in under-ventilated fires. Transp. Res. Procedia 2023, 74, 1485–1491. [Google Scholar] [CrossRef]
- Ene, I.-C.; Iordache, V.; Anghel, I. The Impact of an Office Fire Combined with the Stack Effect in a Multi-Story Building. Appl. Sci. 2024, 14, 11659. [Google Scholar] [CrossRef]
- He, J.; Huang, X.; Ning, X.; Zhou, T.; Wang, J.; Yuen, R.K.K. Modelling fire smoke dynamics in a stairwell of high-rise building: Effect of ambient pressure. Case Stud. Therm. Eng. 2022, 32, 101907. [Google Scholar] [CrossRef]
- Alianto, B.; Nasruddin, N.; Nugroho, Y.S. High-rise building fire safety using mechanical ventilation and stairwell pressurization: A review. J. Build. Eng. 2022, 50, 104224. [Google Scholar] [CrossRef]
- Sharma, A.; Mishra, K.B. Performance assessment of stairwell smoke prevention techniques in a model high-rise building. Therm. Sci. Eng. Prog. 2024, 53, 102725. [Google Scholar] [CrossRef]
- Hostikka, S.; Janardhan, R.K.; Riaz, U.; Sikanen, T. Fire-induced pressure and smoke spreading in mechanically ventilated buildings with air-tight envelopes. Fire Saf. J. 2017, 91, 380–388. [Google Scholar] [CrossRef]
- Li, M.; Gao, Z.; Ji, J.; Li, K. Modeling of positive pressure ventilation to prevent smoke spreading in sprinklered high-rise buildings. Fire Saf. J. 2018, 95, 87–100. [Google Scholar] [CrossRef]
- Manescau, B.; Wang, H.-Y.; Garo, J.P.; Coudour, B.; Acherar, L. Impact of Fuel Type on Fire Dynamics in Mechanically Ventilated Compartment as a Consequence of Closing Inlet Vent. Fire Technol. 2022, 58, 1509–1544. [Google Scholar] [CrossRef]
- Li, Q.; Zhang, J.-Q.; Li, J.-M.; Zhang, B.-S.; Jiang, Y. Combustion phenomena of pool fire in a ceiling vent compartment: The vent far away from the fire source. Procedia Eng. 2018, 211, 358–364. [Google Scholar] [CrossRef]
- Janardhan, R.K.; Hostikka, S. Experiments and Numerical Simulations of Pressure Effects in Apartment Fires. Fire Technol. 2016, 53, 1353–1377. [Google Scholar] [CrossRef]
- Kaczmarzyk, P.; Janik, P.; Małozięć, D.; Klapsa, W.; Warguła, Ł. Experimental Studies of the Impact of the Geometric Dimensions of the Outlet Opening on the Effectiveness of Positive Pressure Ventilation in a Multi-Storey Building—Flow Characteristics. Appl. Sci. 2023, 13, 5714. [Google Scholar] [CrossRef]
- Ministerul Dezvoltării, Lucrărilor Publice și Administrației. Normativ Privind Securitatea la Incendiu a Construcţiilor Indicativ P 118-1/2025; Monitorul Oficial al României: București, Romania, 2025. [Google Scholar]
- NFPA 101. Available online: https://up.codes/viewer/texas/nfpa-101-2021/chapter/3/definitions#3.3.37.7 (accessed on 14 October 2024).
- GB 50016-2014; Code for Fire Protection Design of Buildings. Ministry of Housing and Urban-Rural Development of the People’s Republic of China: Beijing, China, 2018. Available online: https://www.chinesestandard.net/PDF.aspx/GB50016-2018 (accessed on 7 June 2025).
- Ministry of Housing, Communities and Local Government; Department for Levelling Up, Housing and Communities. Guidance on the Criteria for Being a Higher-Risk Building. 2023. Available online: https://www.gov.uk/guidance/criteria-for-being-a-higher-risk-building-during-the-occupation-phase-of-the-new-higher-risk-regime (accessed on 15 October 2024).
- Shakir, I.; Jasim, M.A.; Weli, S.S. High Rise Buildings: Design, Analysis, and Safety. Int. J. Arch. Eng. Technol. 2021, 8, 1–13. [Google Scholar] [CrossRef]
- Lu, P.; Zhang, Z.; Onyebuchi, C.H.; Zheng, L. Agent-based modeling of high-rise building fires reveals self-rescue behaviors and better fire protection designs. Eng. Appl. Artif. Intell. 2023, 127, 107401. [Google Scholar] [CrossRef]
- Khan, A.A.; Khan, M.A.; Domada, R.V.V.; Huang, X.; Usmani, A.; Bakhtiyari, S.; Ashtiani, M.J.; Garivani, S.; Aghakouchak, A.A. Fire modelling framework for investigating tall building fire: A case study of the Plasco Building. Case Stud. Therm. Eng. 2023, 45, 103018. [Google Scholar] [CrossRef]
- Wang, P.; Ban, Q.-Y.; Liu, J.; Zhao, C.-S. Impacts of staircase windows on pressurized ventilation system. Procedia Eng. 2013, 52, 363–370. [Google Scholar] [CrossRef][Green Version]
- You, W.J.; Ko, G.H.; Ryou, H.S. A study on the unsteady flow characteristics in a vestibule for an injection and pressurization smoke-control system. Fire Saf. J. 2014, 70, 112–120. [Google Scholar] [CrossRef]
- Lozinsky, C.H.; Stopps, H.; Touchie, M.F. In-situ performance of a pressurized corridor ventilation system: A long-term study in a high-rise multi-unit residential building. J. Build. Eng. 2023, 70, 106320. [Google Scholar] [CrossRef]
- SRPS EN 12101-6:2022; Smoke and Heat Control Systems-Part 6: Specification for Pressure Differential Systems-Kits. Standrads Policy and Strategy Committee: London, UK, 2022.
- EN 12101-13:2022; Smoke and Heat Control Systems—Part 13: Pressure Differential Systems (PDS)—Design and Calculation Methods, Installation, Acceptance Testing, Routine Testing and Maintenance. European Committee for Standardization: Brussels, Belgium, 2022.
- Chu, T.; Jiang, L.; Zhu, G.; Usmani, A. Integrating glass breakage models into CFD simulation to investigate realistic compartment fire behaviour. J. Build. Eng. 2023, 82, 108314. [Google Scholar] [CrossRef]
- Li, J.; Beji, T.; Brohez, S.; Merci, B. CFD study of fire-induced pressure variation in a mechanically-ventilated air-tight compartment. Fire Saf. J. 2020, 115, 103012. [Google Scholar] [CrossRef]
- Thunderhead Engineering. PyroSim—User Manual; Thunderhead Engineering: Manhattan, KS, USA, 2024; Available online: https://www.thunderheadeng.com (accessed on 17 December 2024).
- Bliemer, M.C.; Raadsen, M.P. Continuous-time general link transmission model with simplified fanning, Part I: Theory and link model formulation. Transp. Res. Part B Methodol. 2019, 126, 442–470. [Google Scholar] [CrossRef]
- Ralph, B.; Mofidi, N. Operation point fan model—A new evaluated approach for atypical pressure conditions in buildings. Build. Environ. 2020, 186, 107321. [Google Scholar] [CrossRef]
- Brohez, S.; Caravita, I. Fire induced pressure in airthigh houses: Experiments and FDS validation. Fire Saf. J. 2020, 114, 103008. [Google Scholar] [CrossRef]
- McGrattan, K.B. Fire Dynamics Simulator (Version 4); NIST: Gaithersburg, MD, USA, 2024. [Google Scholar] [CrossRef]
- Vinay; Raja, S.; Tauseef, S.; Varadharajan, S. Investigating the impact of oxygen concentration on fire dynamics using numerical simulation with FDS. Process. Saf. Environ. Prot. 2023, 178, 195–203. [Google Scholar] [CrossRef]
- Yan, X.; Gernay, T. Numerical modeling of localized fire exposures on structures using FDS-FEM and simple models. Eng. Struct. 2021, 246, 1122997. [Google Scholar] [CrossRef]
- Wang, H.S.; Blocken, B.; Lin, Z. CFD simulation of the stratified atmospheric boundary layer: Consistency between Monin-Obukhov similarity theory and the standard k-ε model. Build. Environ. 2024, 267, 112284. [Google Scholar] [CrossRef]
- Andreozzi, A.; Bianco, N.; Musto, M.; Rotondo, G. Parametric analysis of input data on the CFD fire simulation. J. Phys. Conf. Ser. 2019, 1224, 012011. [Google Scholar] [CrossRef]
- Gomez, R.S.; Porto, T.R.N.; Magalhães, H.L.F.; Santos, A.C.Q.; Viana, V.H.V.; Gomes, K.C.; Lima, A.G.B. Thermo-fluid dynamics analysis of fire smoke dispersion and control strategy in buildings. Energies 2020, 13, 6000. [Google Scholar] [CrossRef]
- Maragkos, G.; Beji, T. Review of convective heat transfer modelling in cfd simulations of fire-driven flows. Appl. Sci. 2021, 11, 5240. [Google Scholar] [CrossRef]
- Parsa, V.; Santiago, A.; Laím, L. Computational Fluid Dynamics of Compartment Fires: A Review of Methods and Applications. Appl. Sci. 2025, 15, 2342. [Google Scholar] [CrossRef]
- Ciani, F.; Capobelli, M. Fire Growth Rate Strategies in FDS. J. Phys. Conf. Ser. 2018, 1107, 042007. [Google Scholar] [CrossRef]
- Lucherini, A.; Torero, J.L. Defining the fire decay and the cooling phase of post-flashover compartment fires. Fire Saf. J. 2023, 141, 103965. [Google Scholar] [CrossRef]
- Wu, C.L.; Juan, W.Y. Experimental study of opening location affecting the delay time of backdraft. Fire Saf. J. 2024, 147, 104184. [Google Scholar] [CrossRef]
- Tseng, T.-Y.; Wu, C.-L.; Tsai, K.-C. Effect of temperature in the occurrence of backdraft. J. Loss Prev. Process Ind. 2024, 87, 105250. [Google Scholar] [CrossRef]
- Vanella, M.; Falkenstein-Smith, R.; Cleary, T. Backdraft experiments and large eddy simulations in a scaled compartment. Fire Saf. J. 2023, 141, 103960. [Google Scholar] [CrossRef] [PubMed]
- NFPA 92; Standard for Smoke Control Systems, 2018. National Fire Protection Association: Quincy, MA, USA, 2018.
- Valoy, Y.M.M.; Mosiria, D.B.; Sautet, J.-C.; Coppalle, A. Effect of ventilation on carbon monoxide and soot particles emissions in a confined and mechanically-ventilated fire. Fire Saf. J. 2023, 138, 103805. [Google Scholar] [CrossRef]
- Wang, A.; Manescau, B.; Serra, Q.; Chetehouna, K.; Florentin, E.; De Izarra, C. Numerical simulations of outdoor wind effects on smoke spreading along a corridor: Physical and sensitivity analysis. Int. J. Therm. Sci. 2019, 142, 332–347. [Google Scholar] [CrossRef]
- Suard, S.; Lapuerta, C.; Kaiss, A.; Porterie, B. Sensitivity analysis of a fire field model in the case of a large-scale compartment fire scenario. Numer. Heat Transf. Part A Appl. 2013, 63, 879–905. [Google Scholar] [CrossRef]
- Bolina, F.L.; Fachinelli, E.G.; Pachla, E.C.; Centeno, F.R. A critical analysis of the influence of architecture on the temperature field of RC structures subjected to fire using CFD and FEA models. Appl. Therm. Eng. 2024, 247, 123086. [Google Scholar] [CrossRef]
Disclaimer/Publisher’s Note: The statements, opinions and data contained in all publications are solely those of the individual author(s) and contributor(s) and not of MDPI and/or the editor(s). MDPI and/or the editor(s) disclaim responsibility for any injury to people or property resulting from any ideas, methods, instructions or products referred to in the content. |
© 2025 by the authors. Licensee MDPI, Basel, Switzerland. This article is an open access article distributed under the terms and conditions of the Creative Commons Attribution (CC BY) license (https://creativecommons.org/licenses/by/4.0/).