
Numerical Investigation of the Pull-Out and Shear Mechanical Characteristics and Support Effectiveness of Yielding Bolt in a Soft Rock Tunnel


Abstract
1. Introduction
2. Methodology
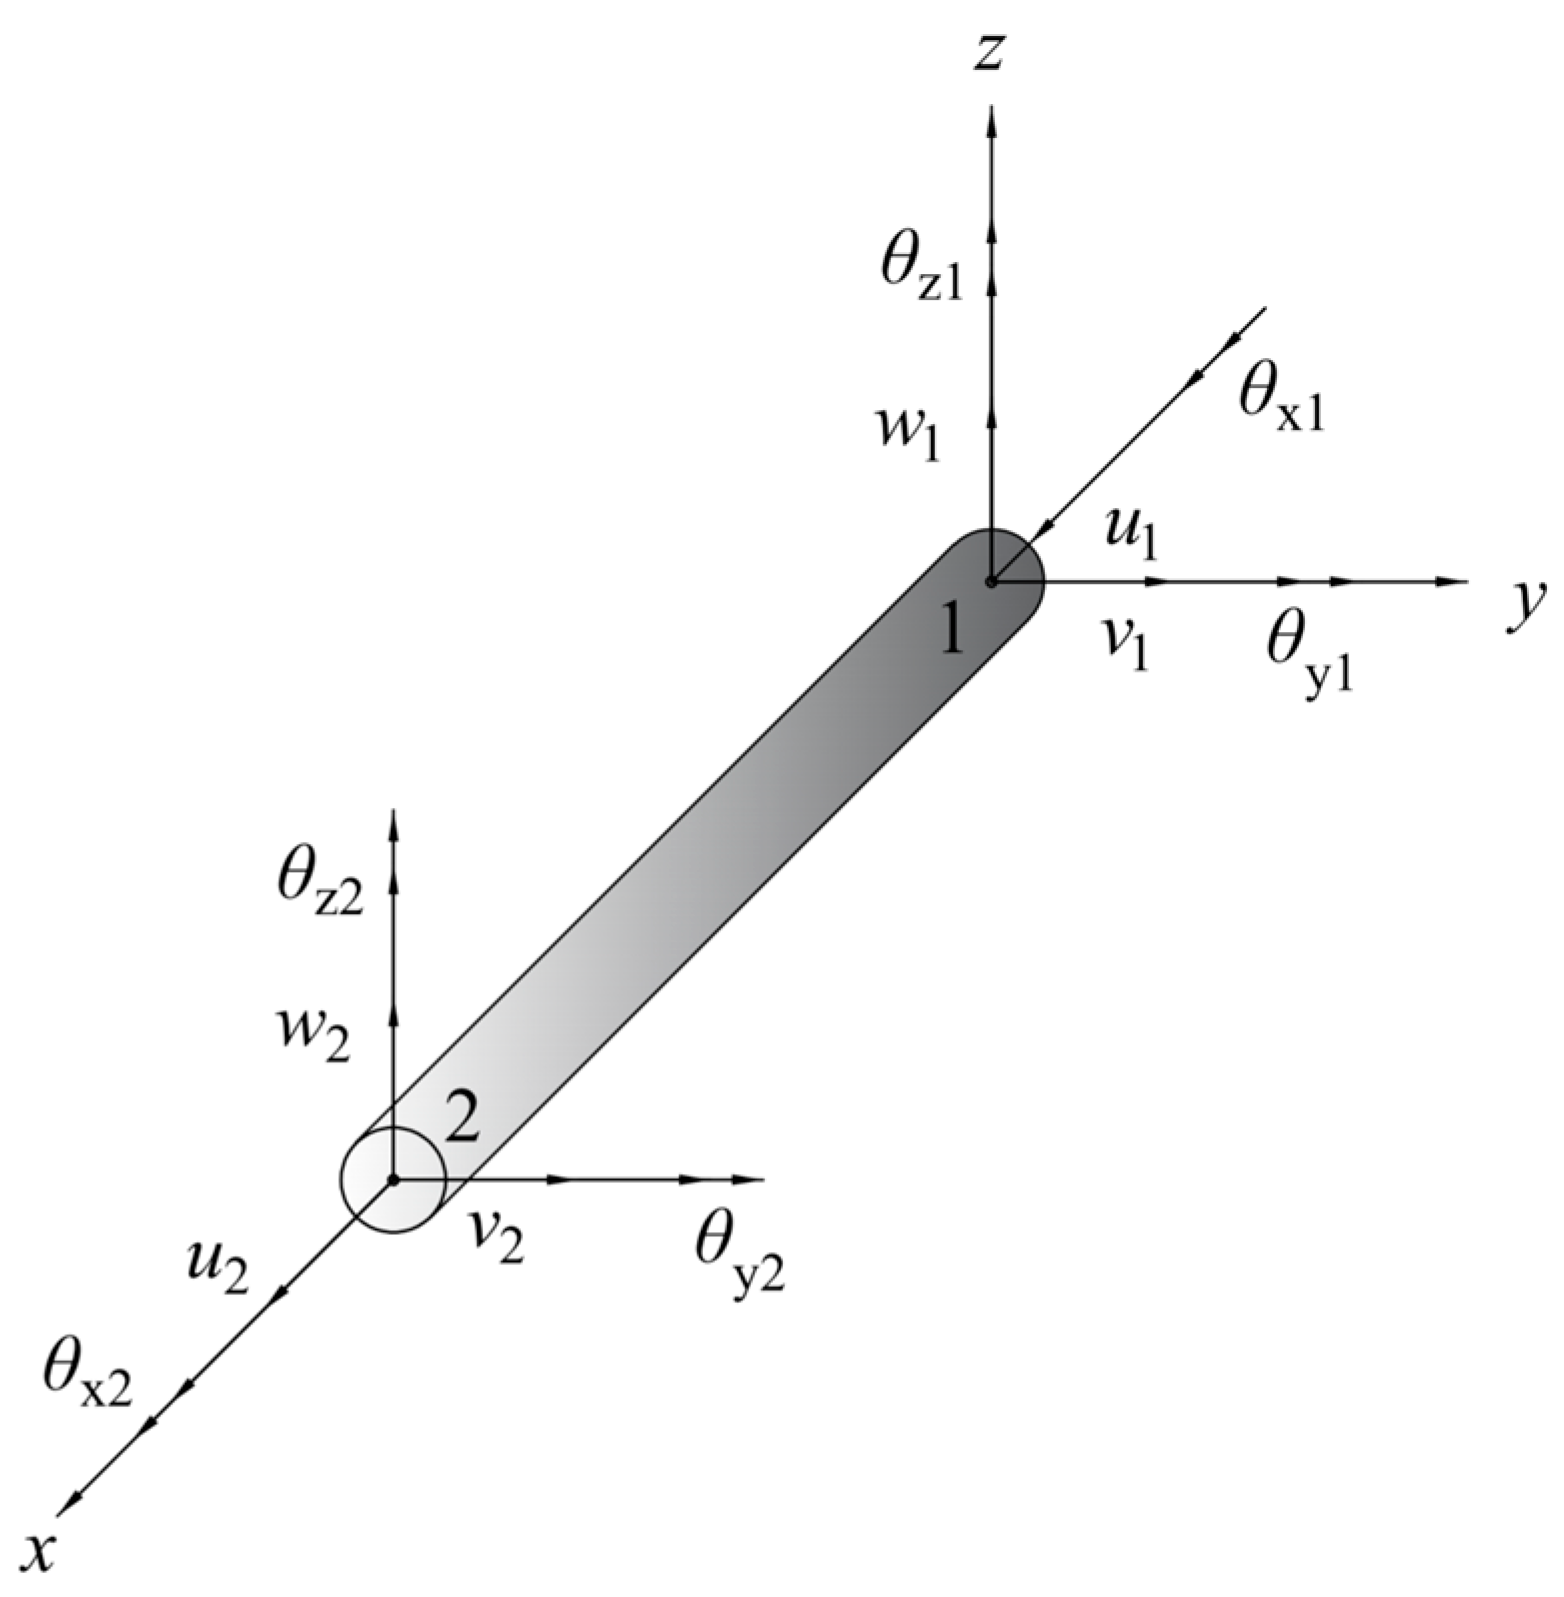
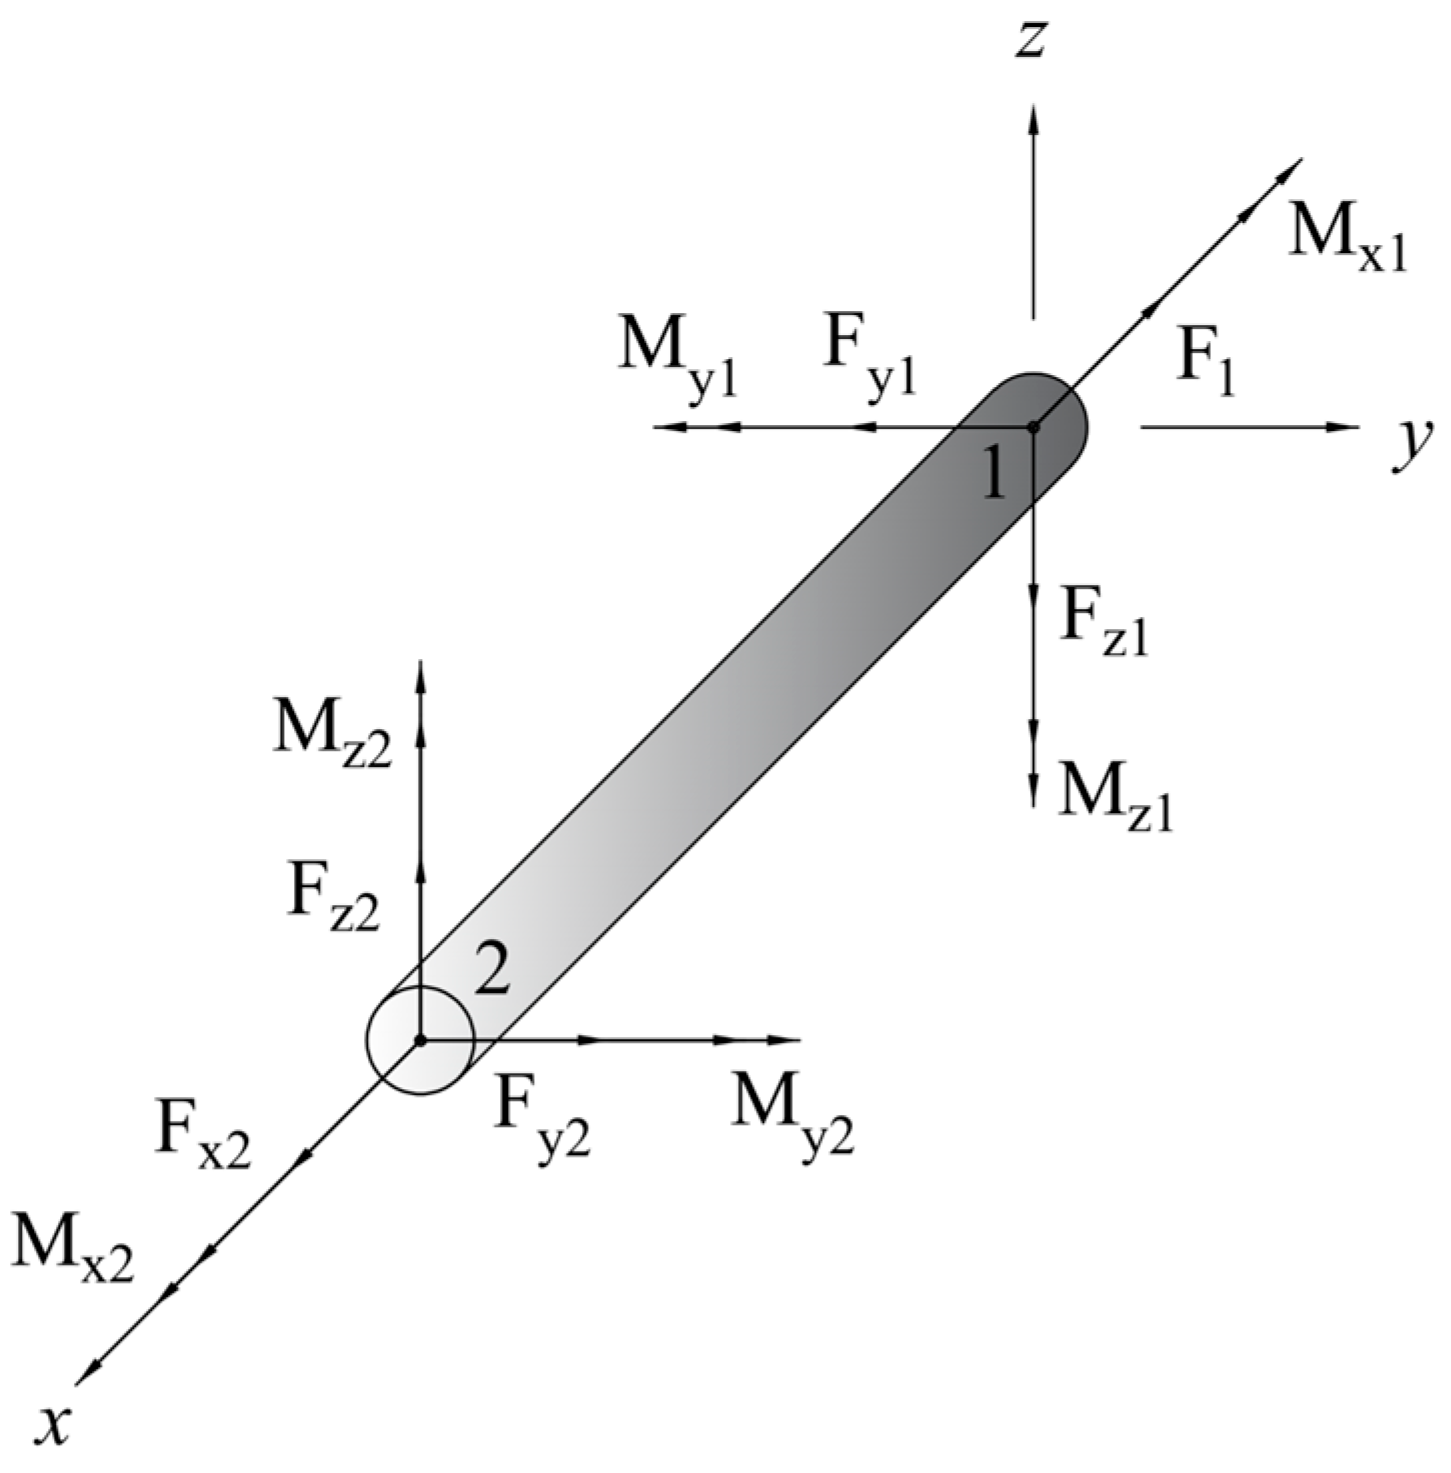
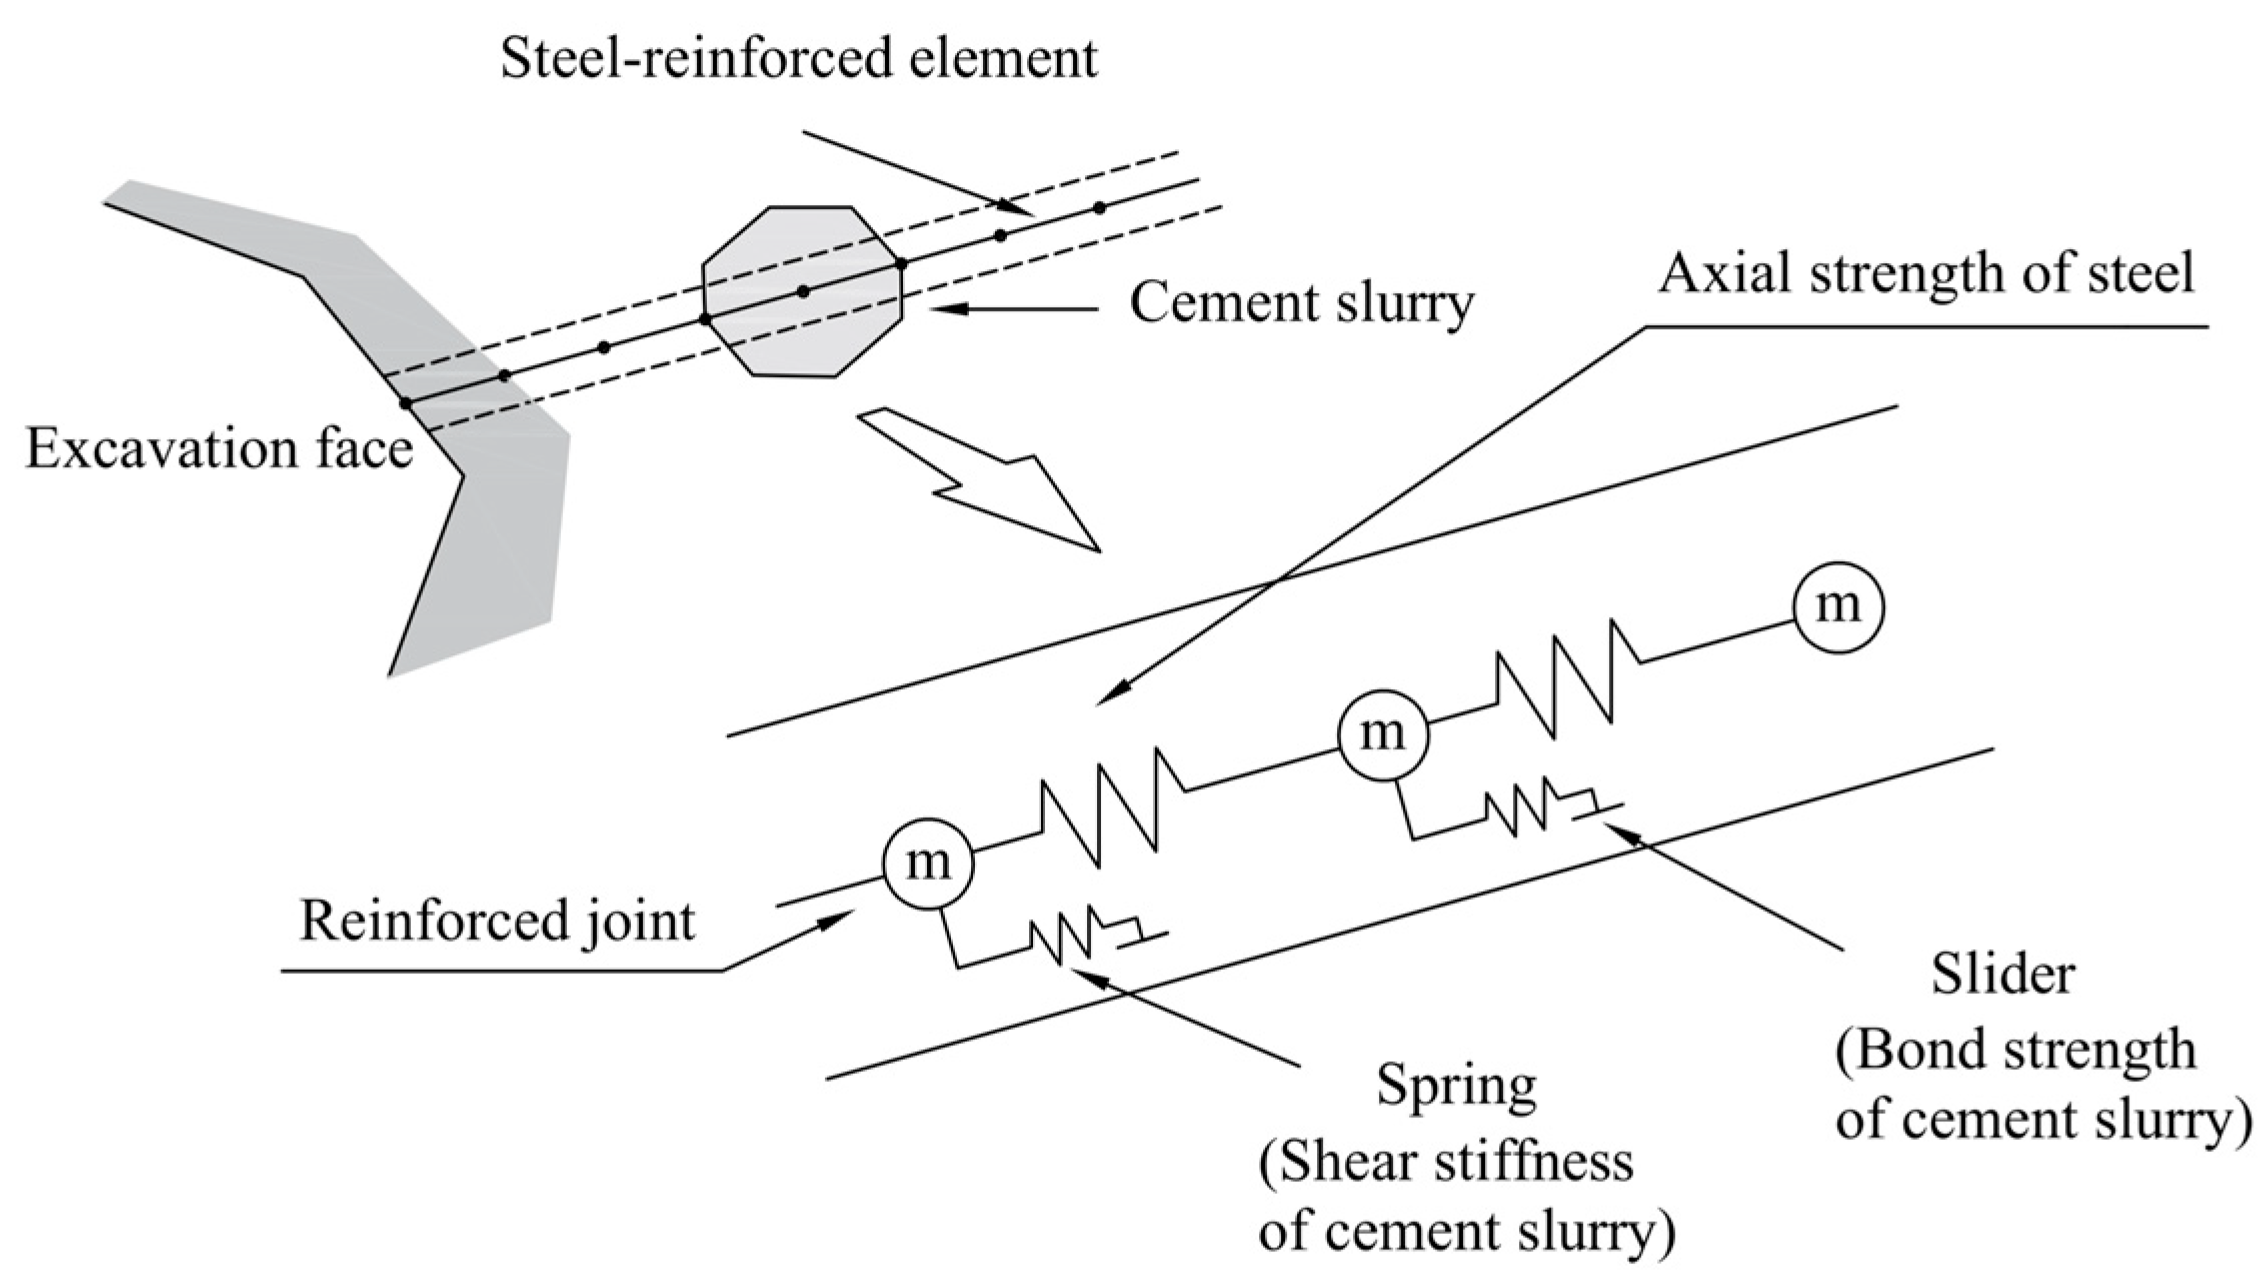
2.1. Simulation Theory
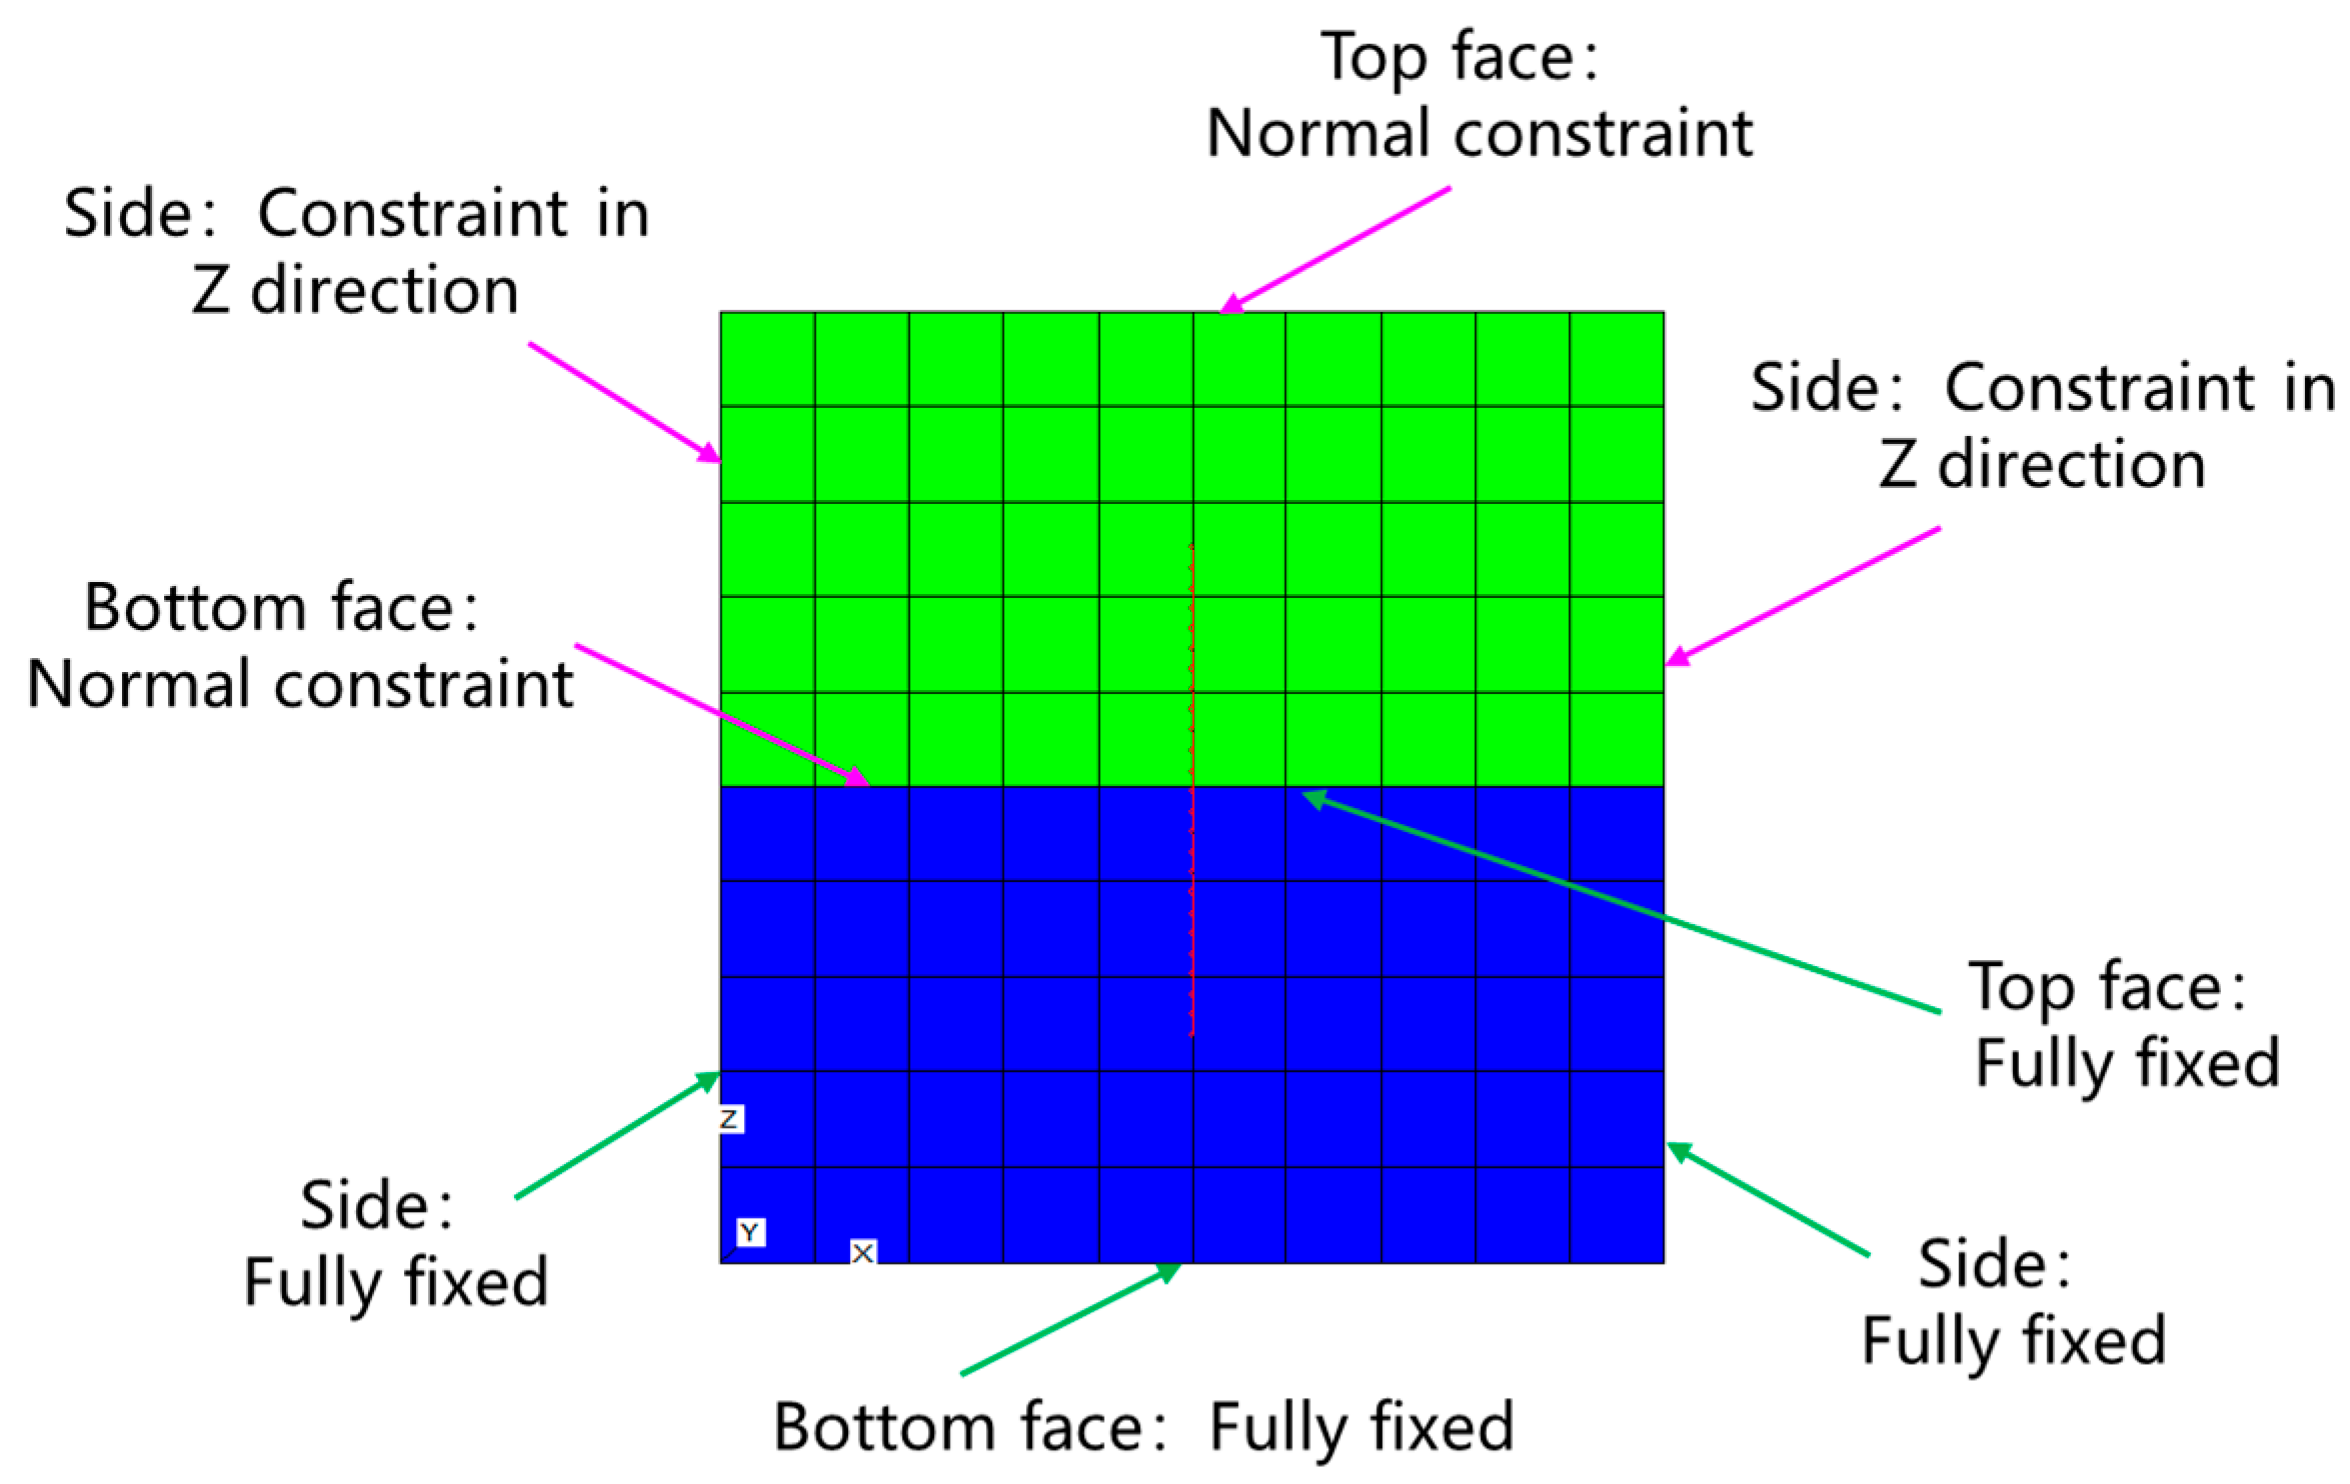
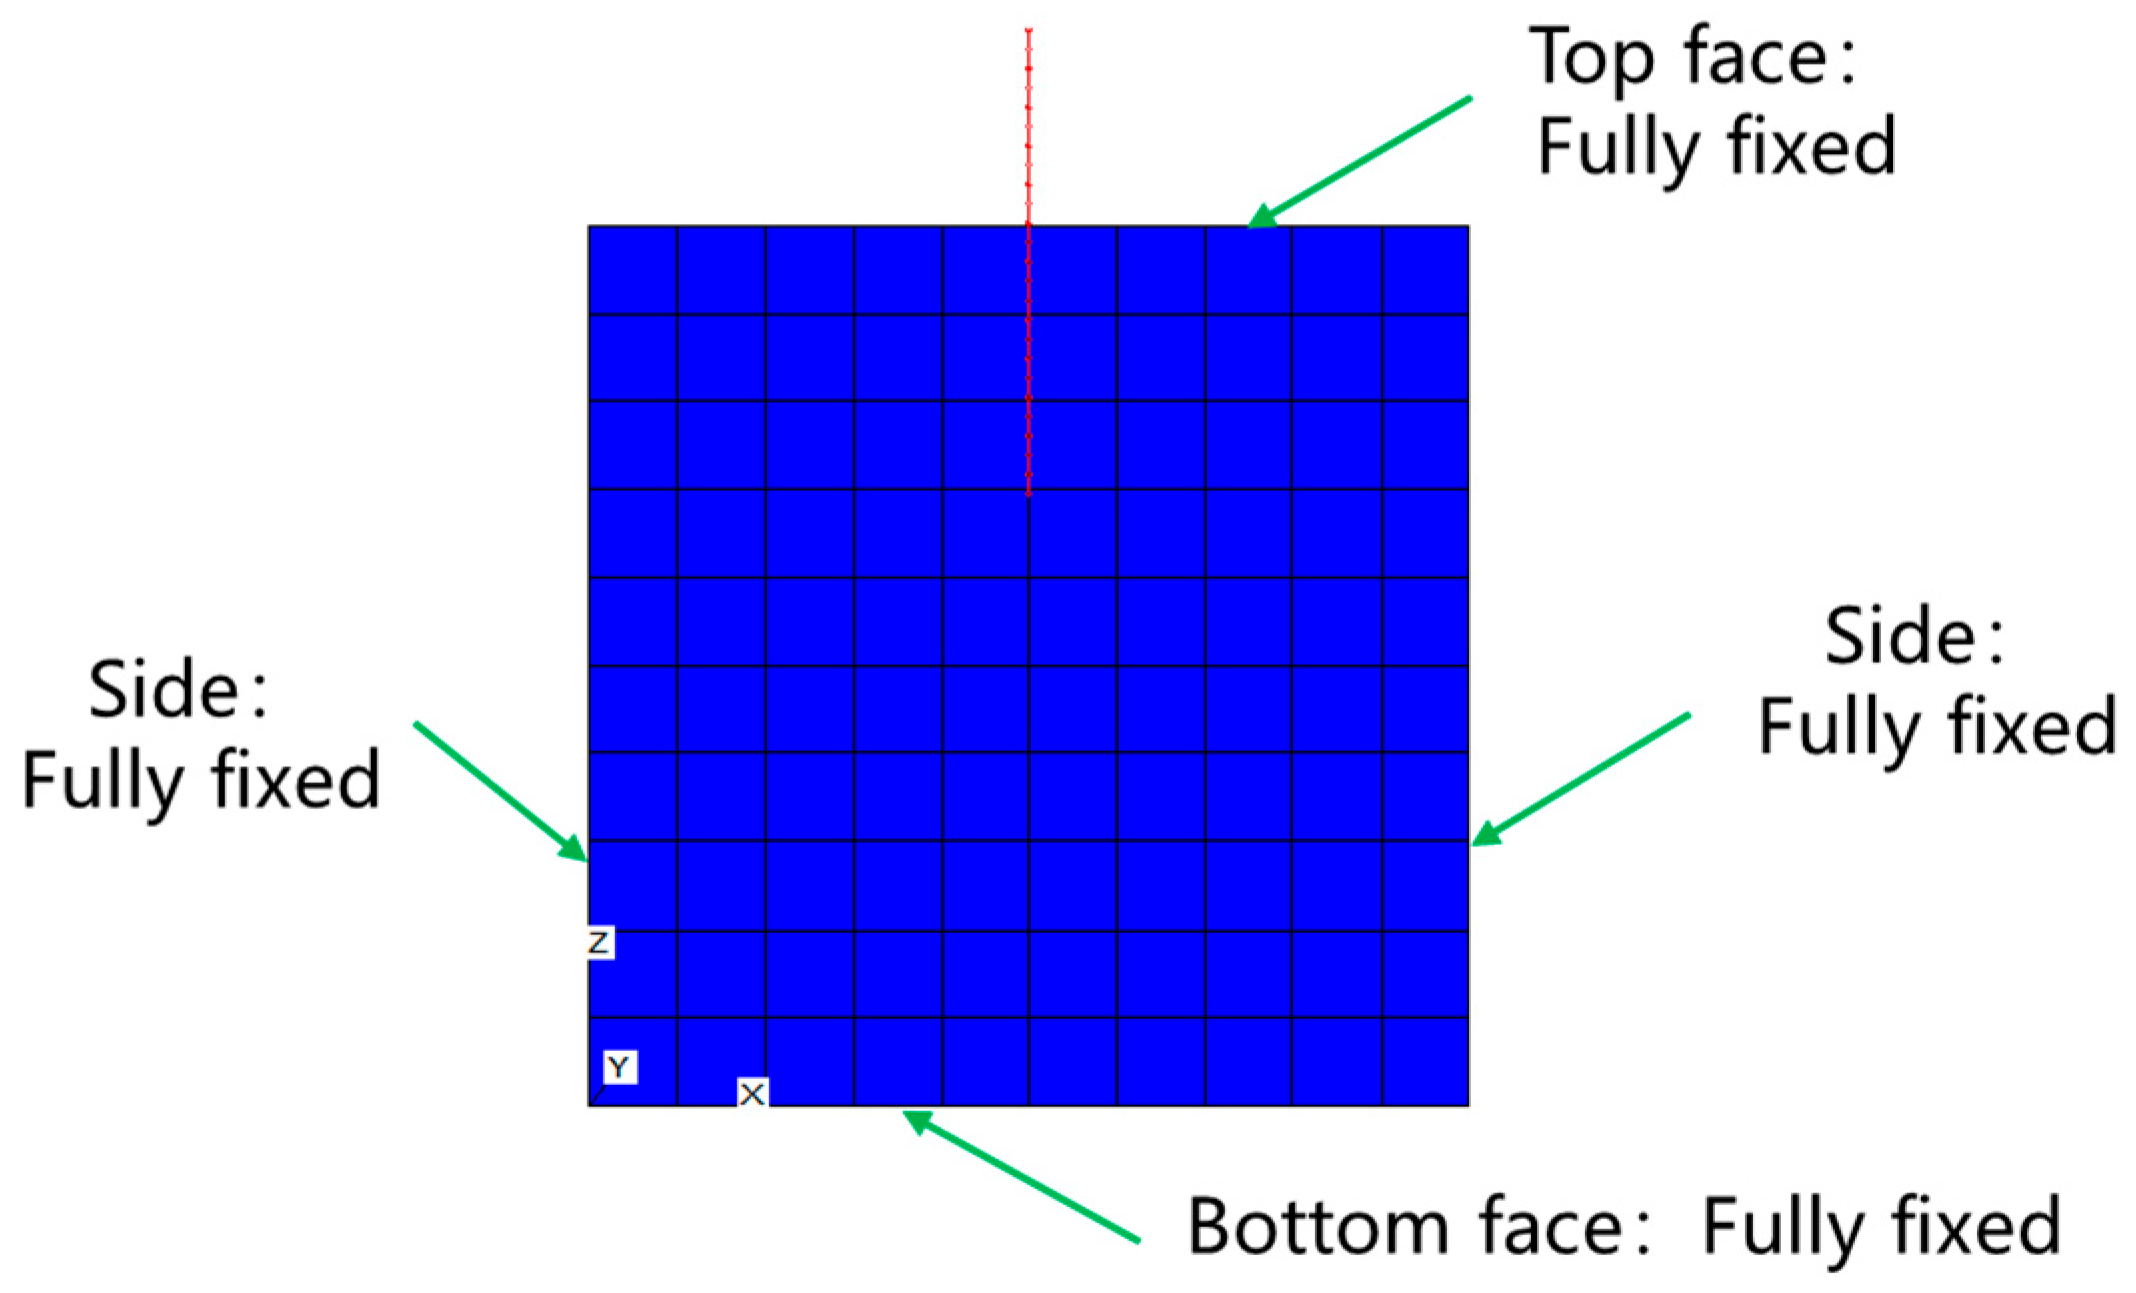
2.2. Pull-Out Simulation of the Yielding Bolt
2.3. Shear Performance Simulation of the Yielding Bolt
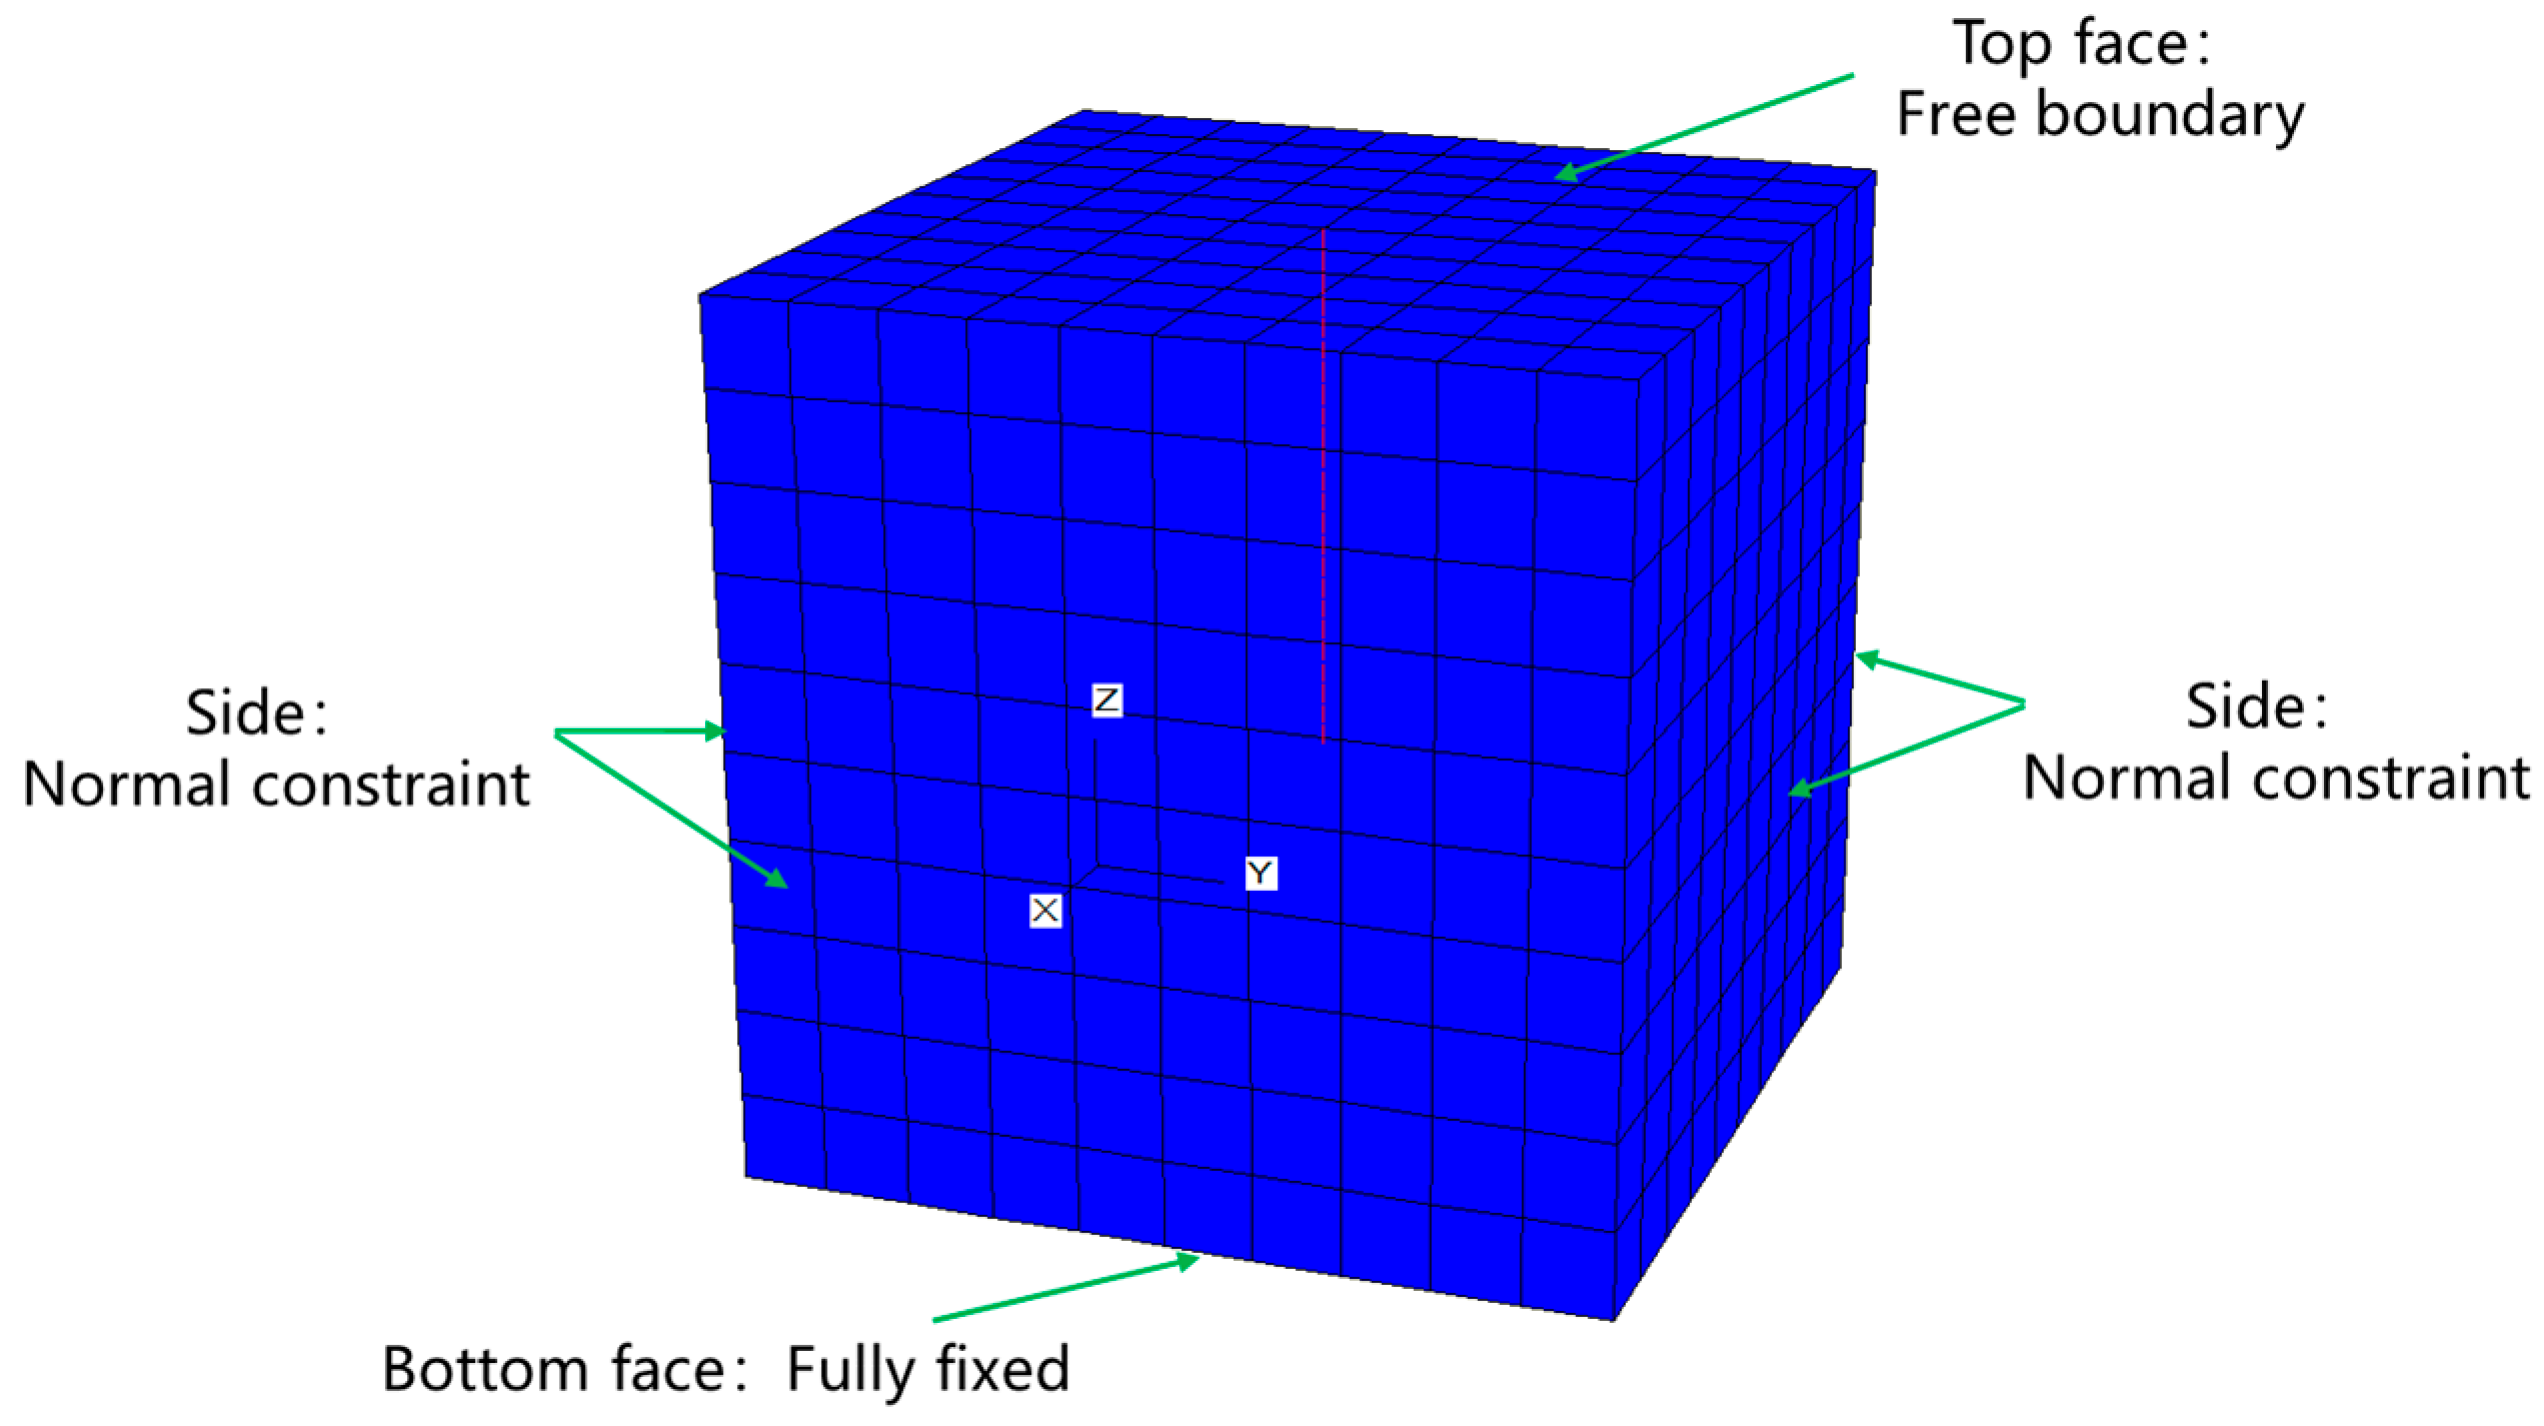
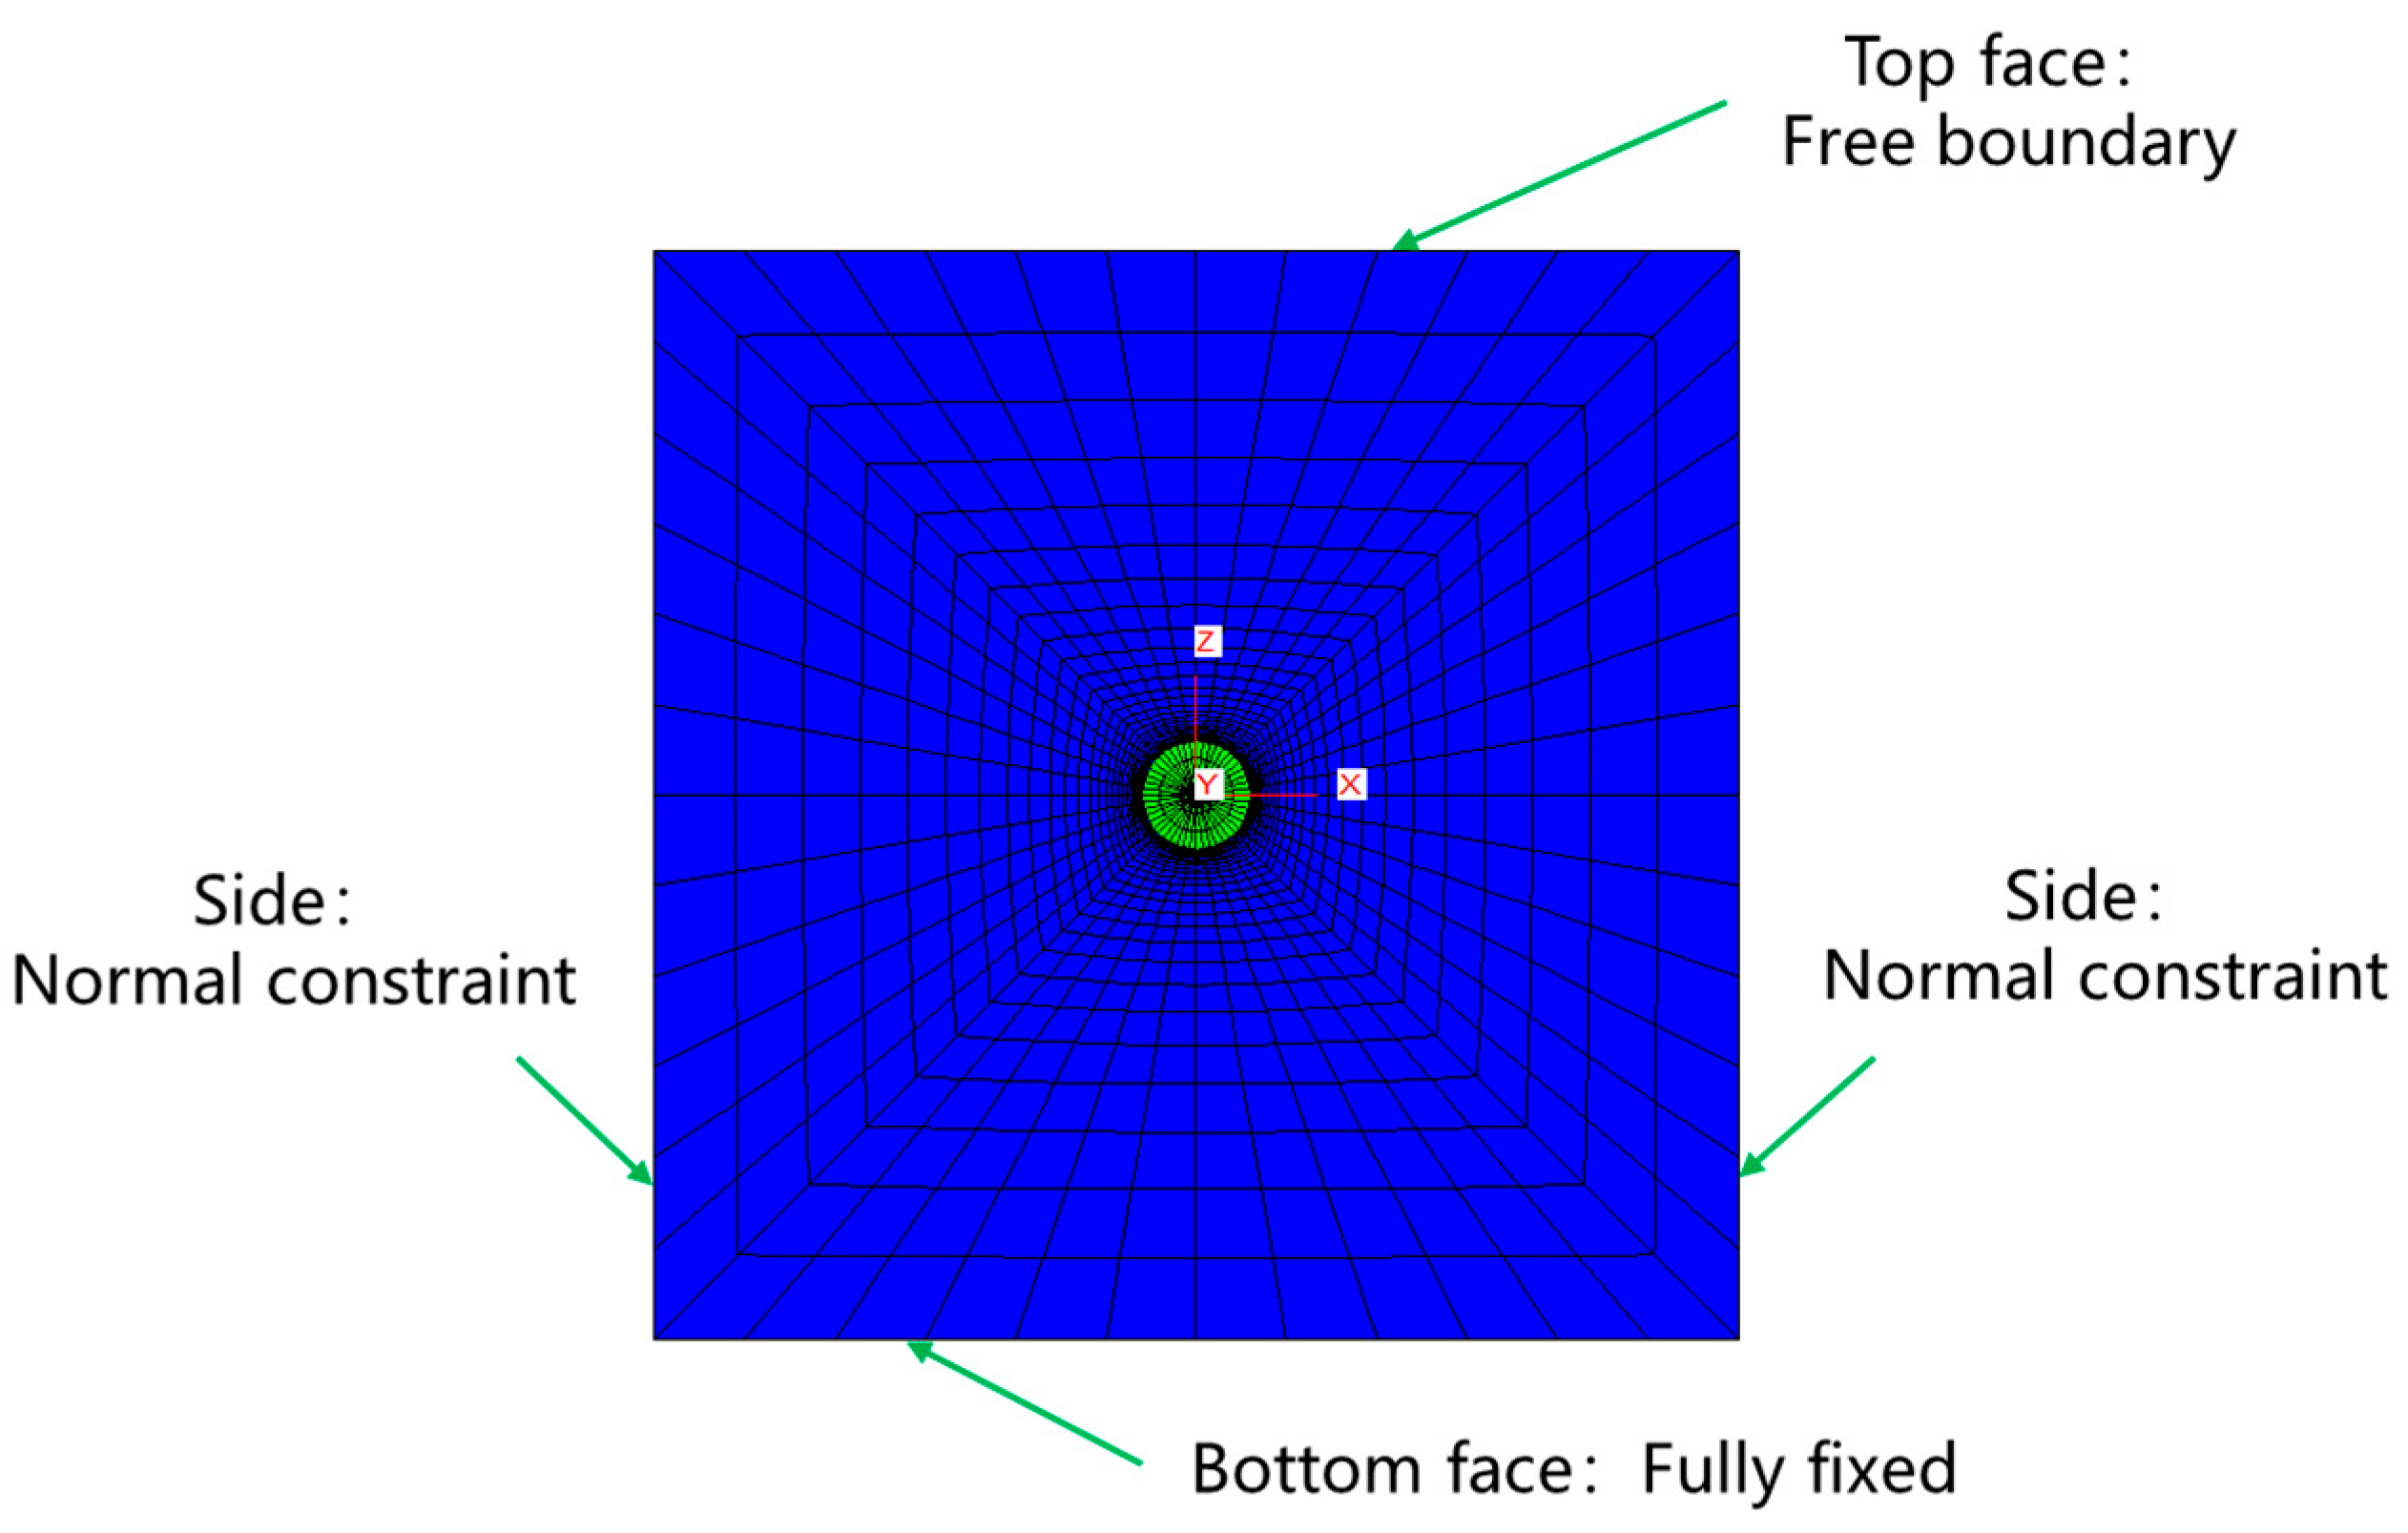
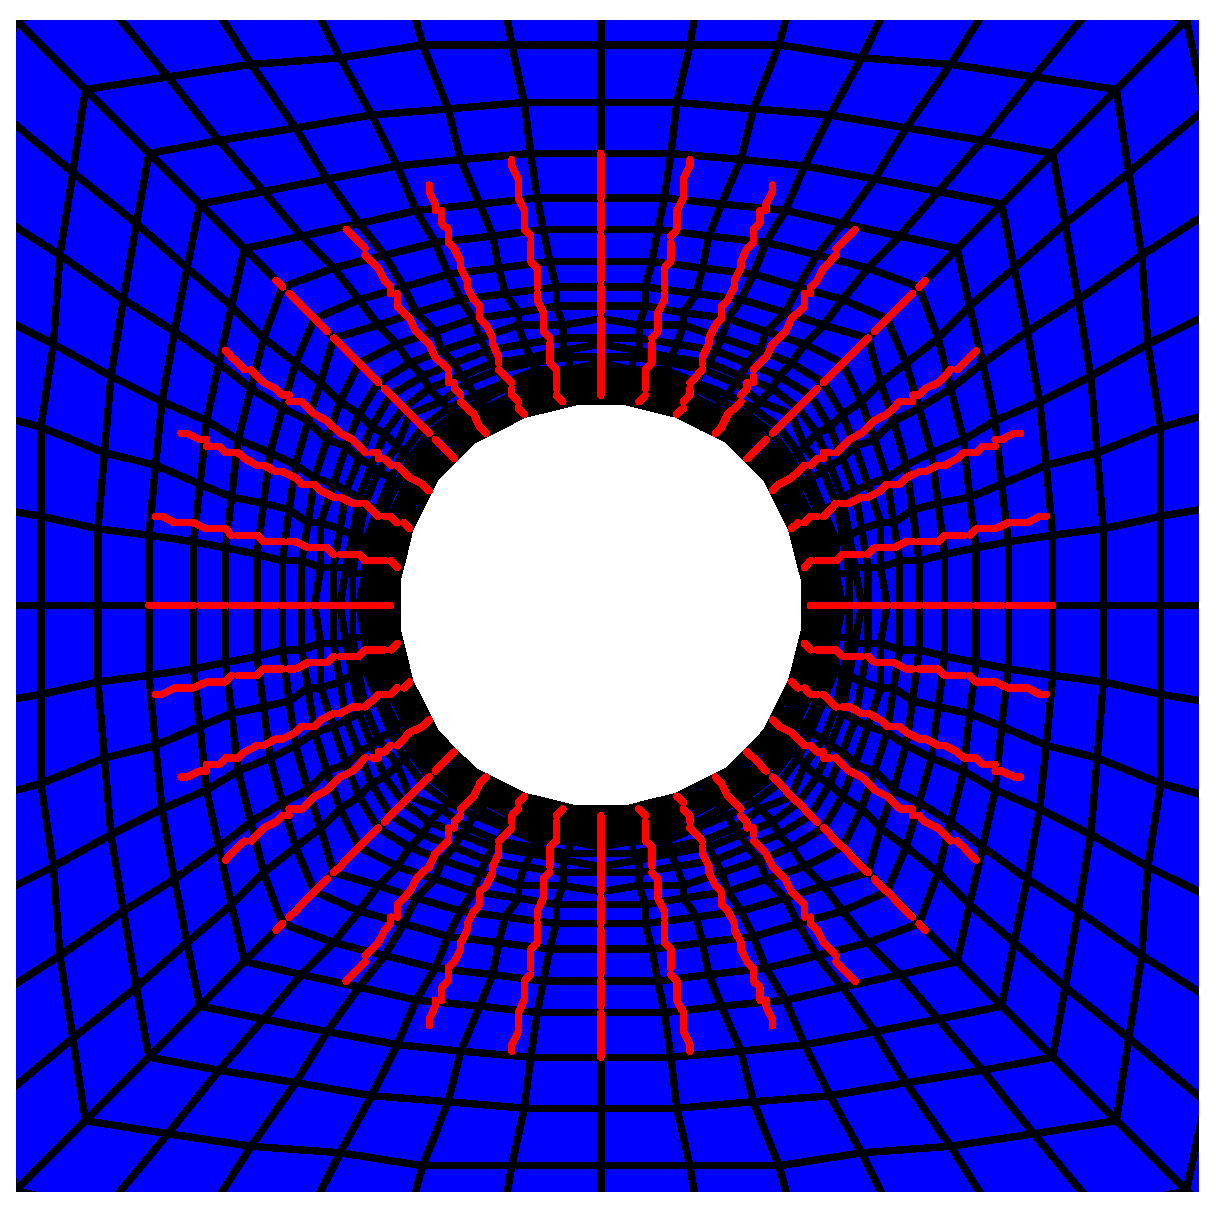
2.4. Simulation of the Soft Rock Tunnel Supported by Bolt
3. Results and Discussion
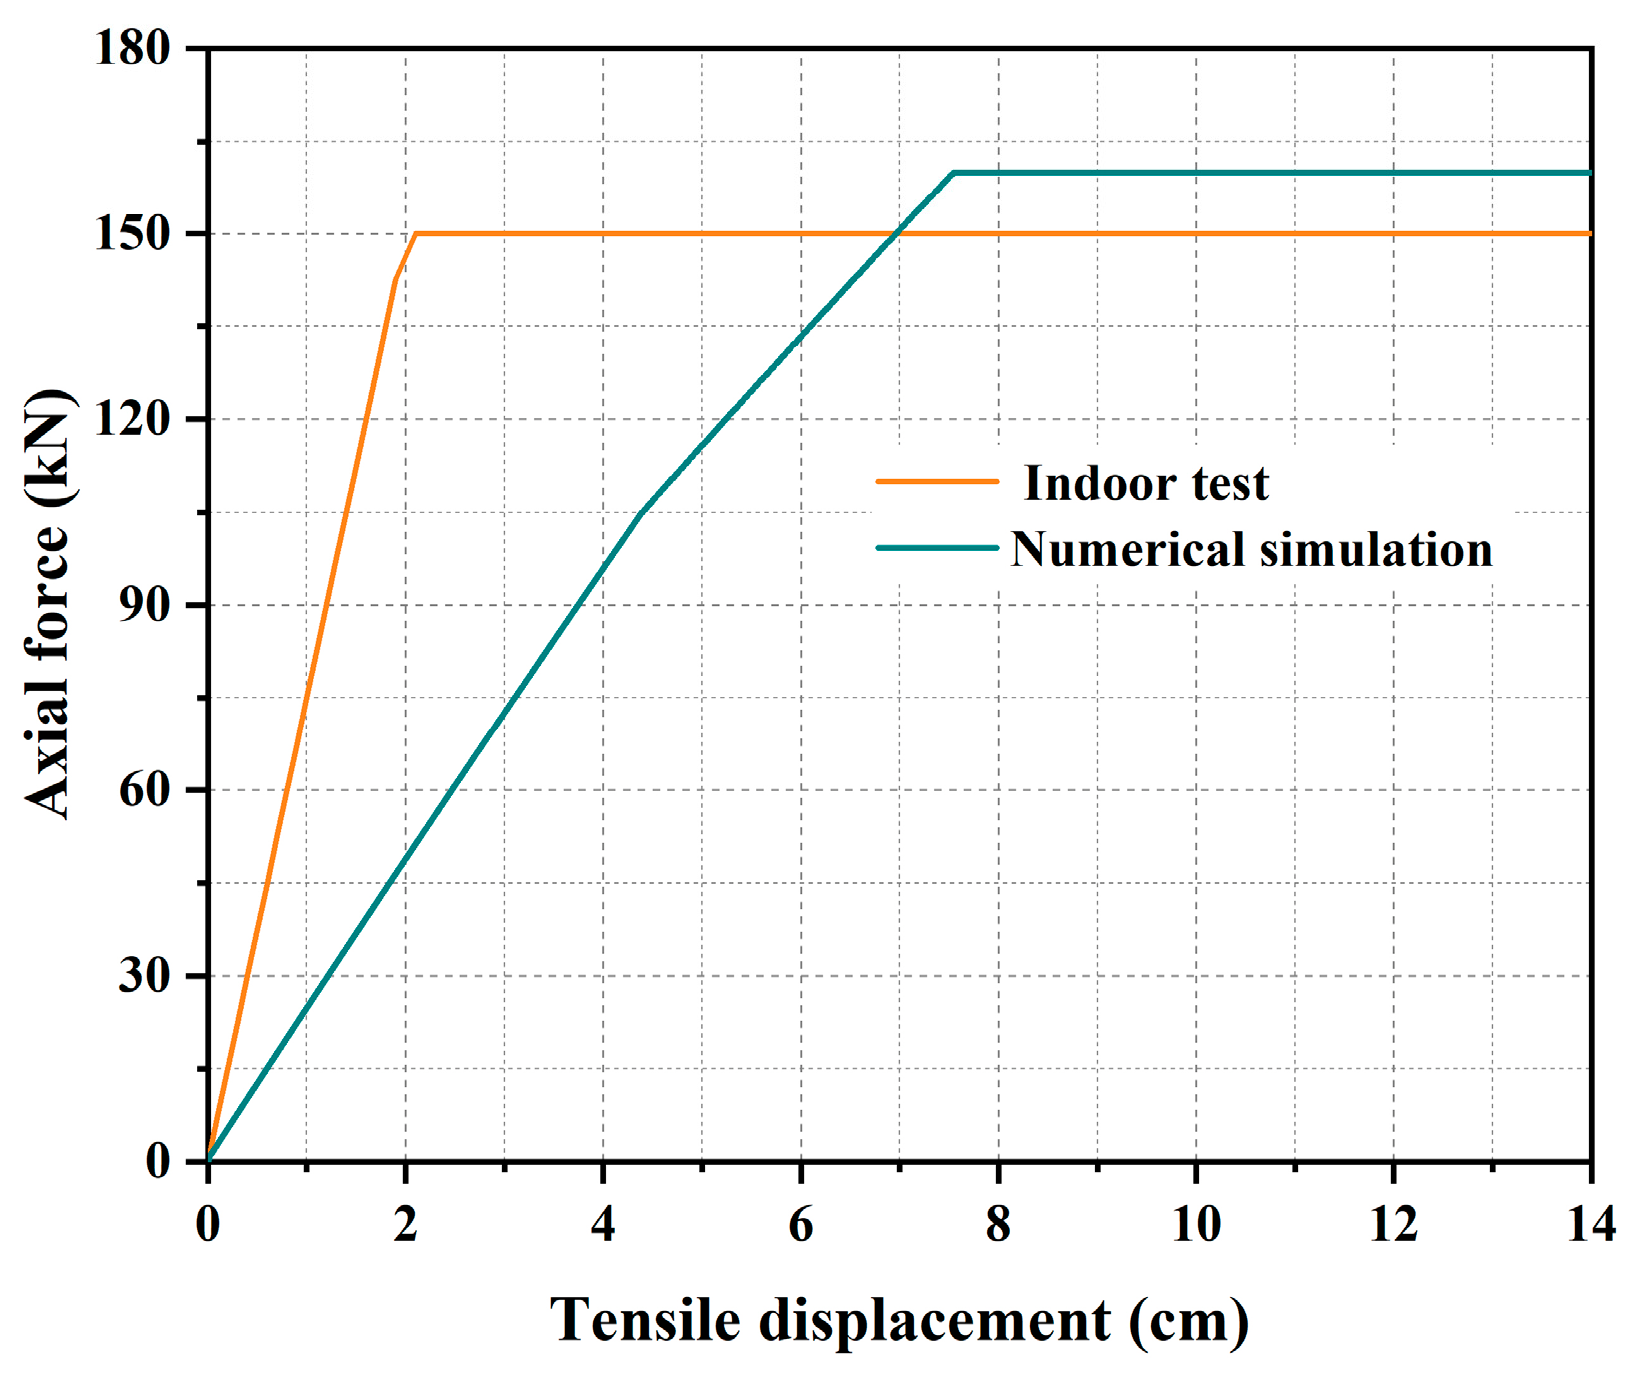
3.1. Feasibility Study of Pull-Out Simulations of Yielding Bolt
3.2. Comparative Analysis of the Bolts’ Mechanical Behavior During Pull-Out Simulation
3.3. Feasibility Study of Shear Performance Simulations of Bolt
3.3.1. Shear Performance Simulation of Bolt
3.3.2. Bending Simulation of Bolt
3.4. Study on the Support Effect of Bolts in Soft Rock Tunnels
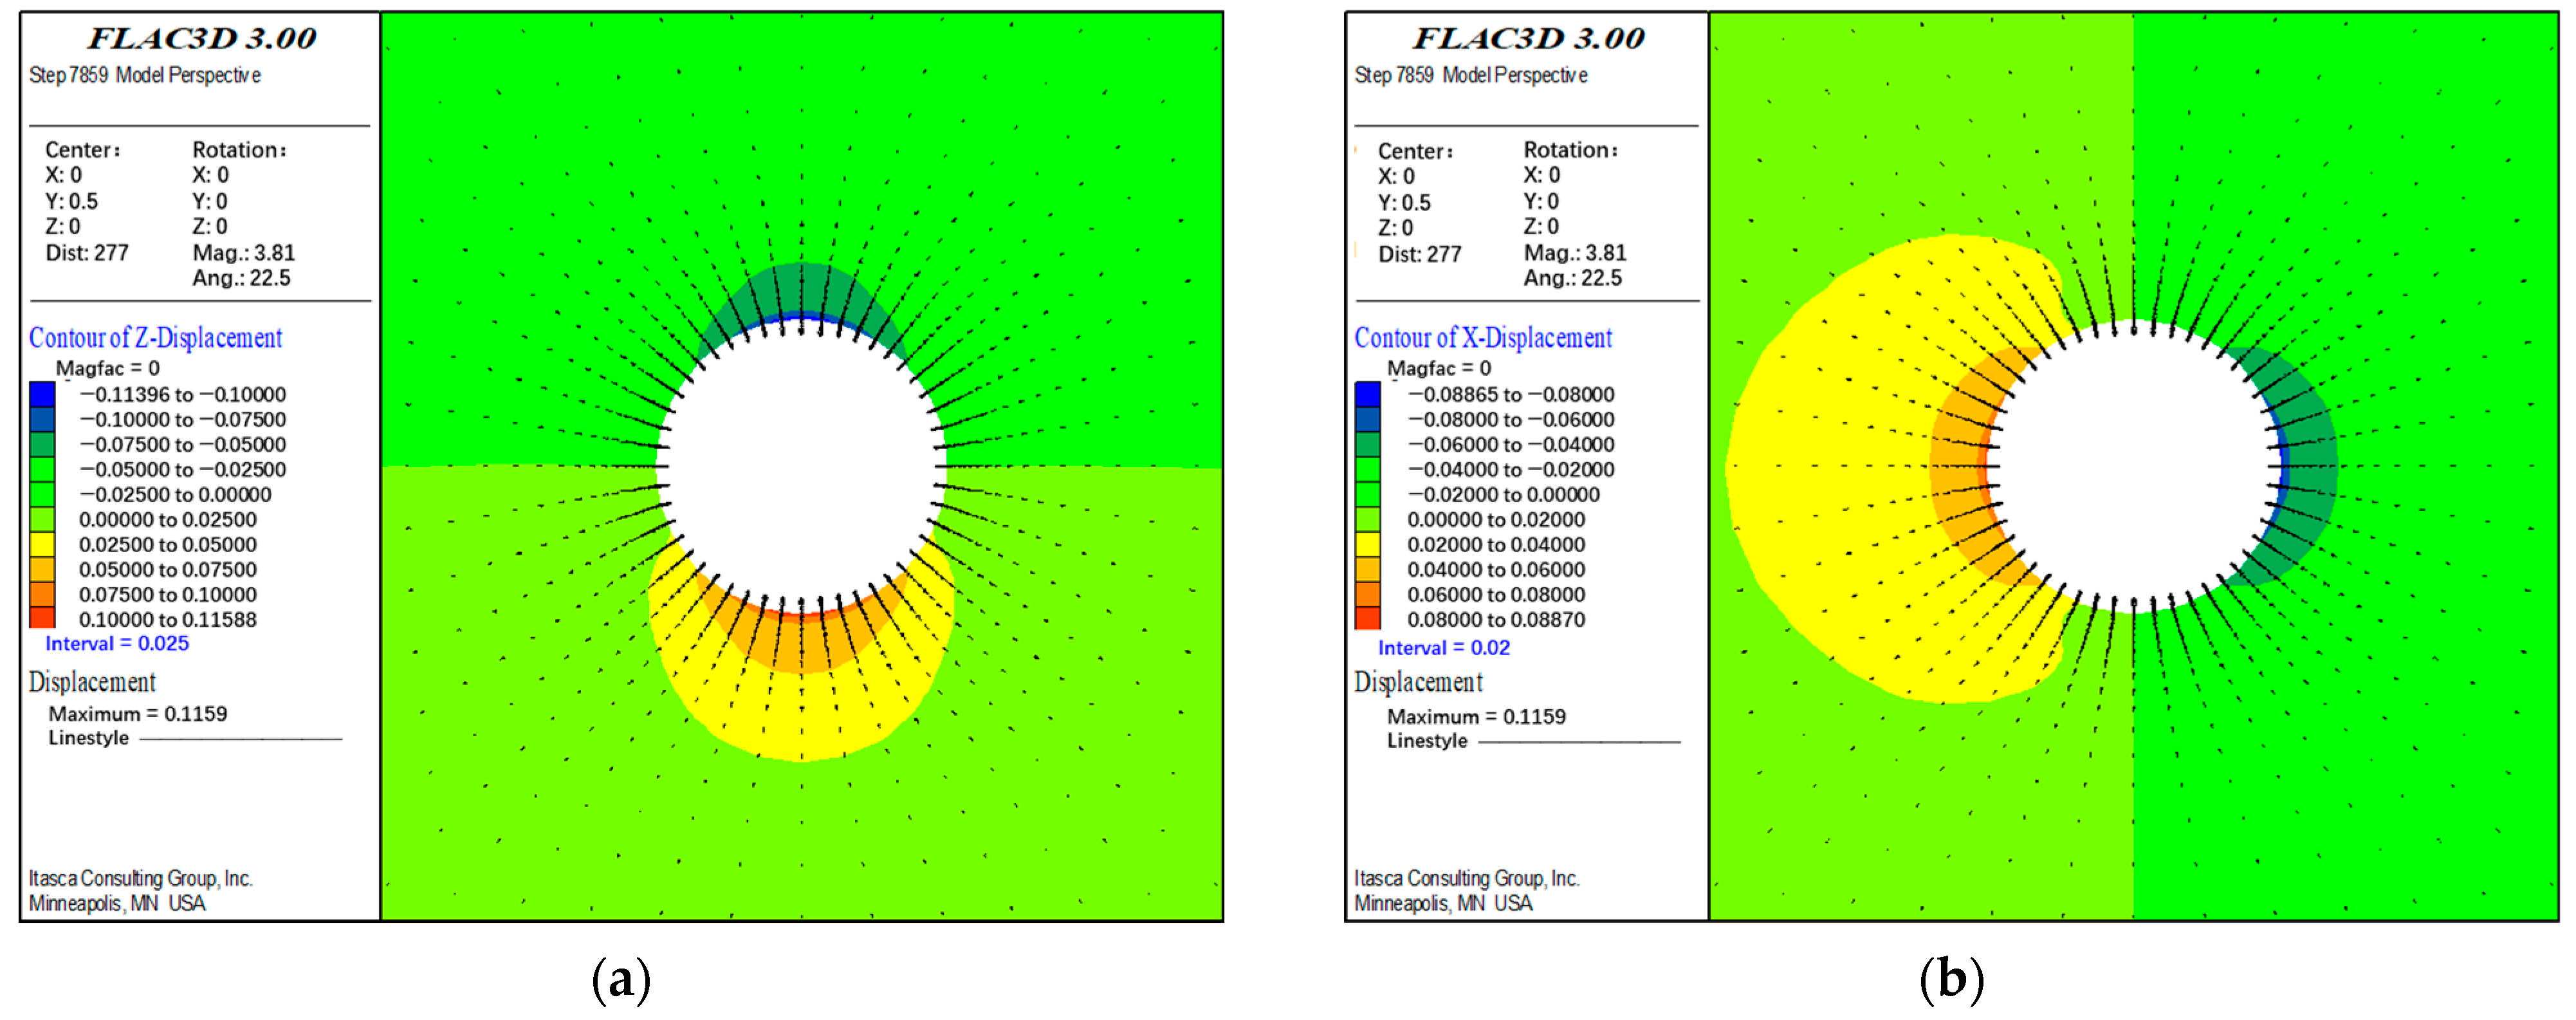
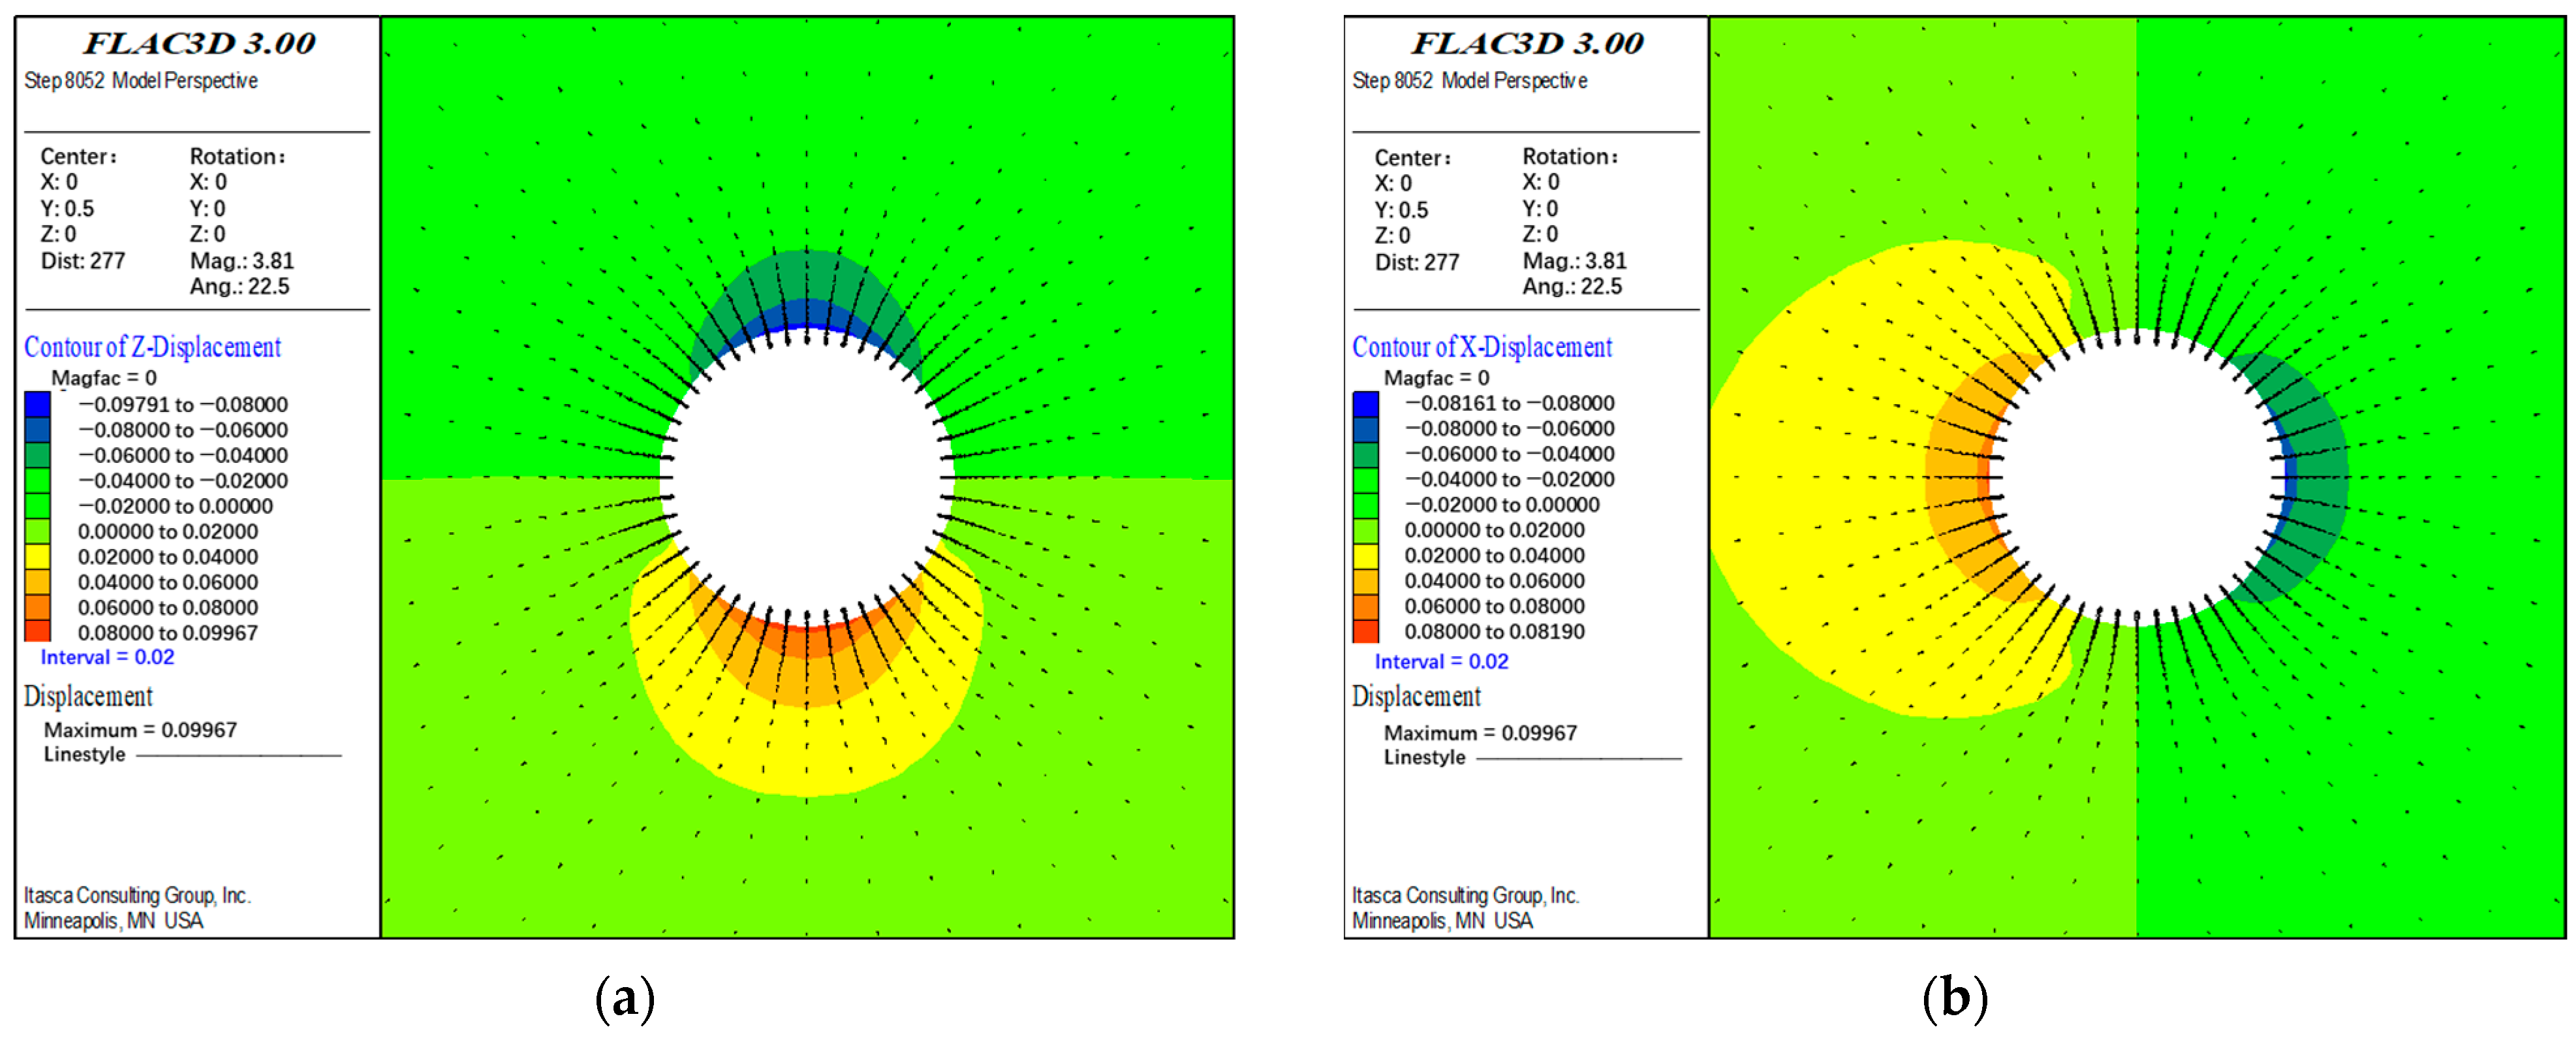
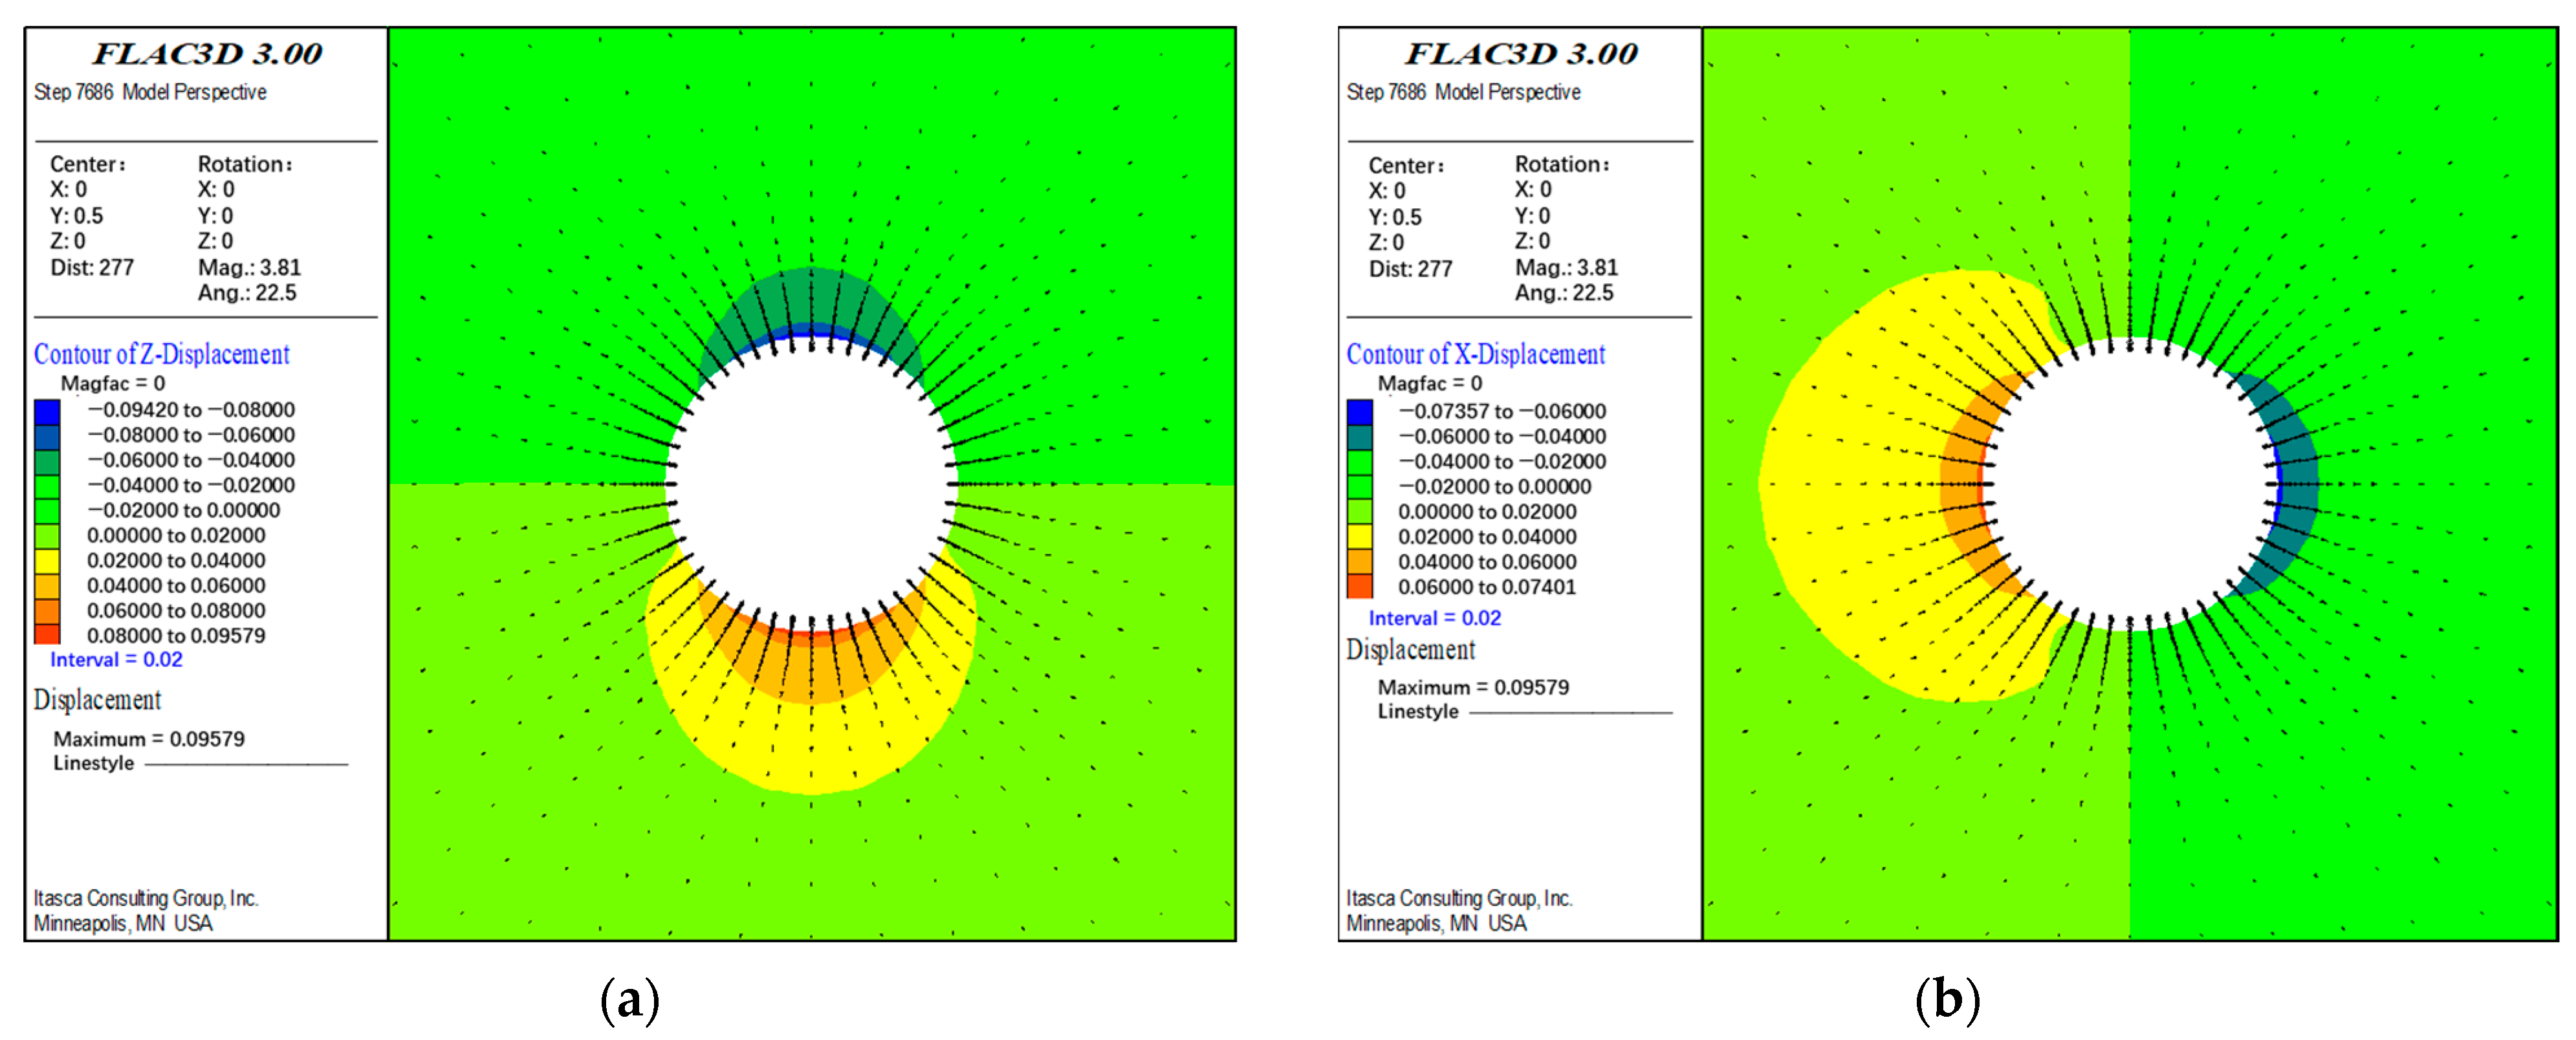
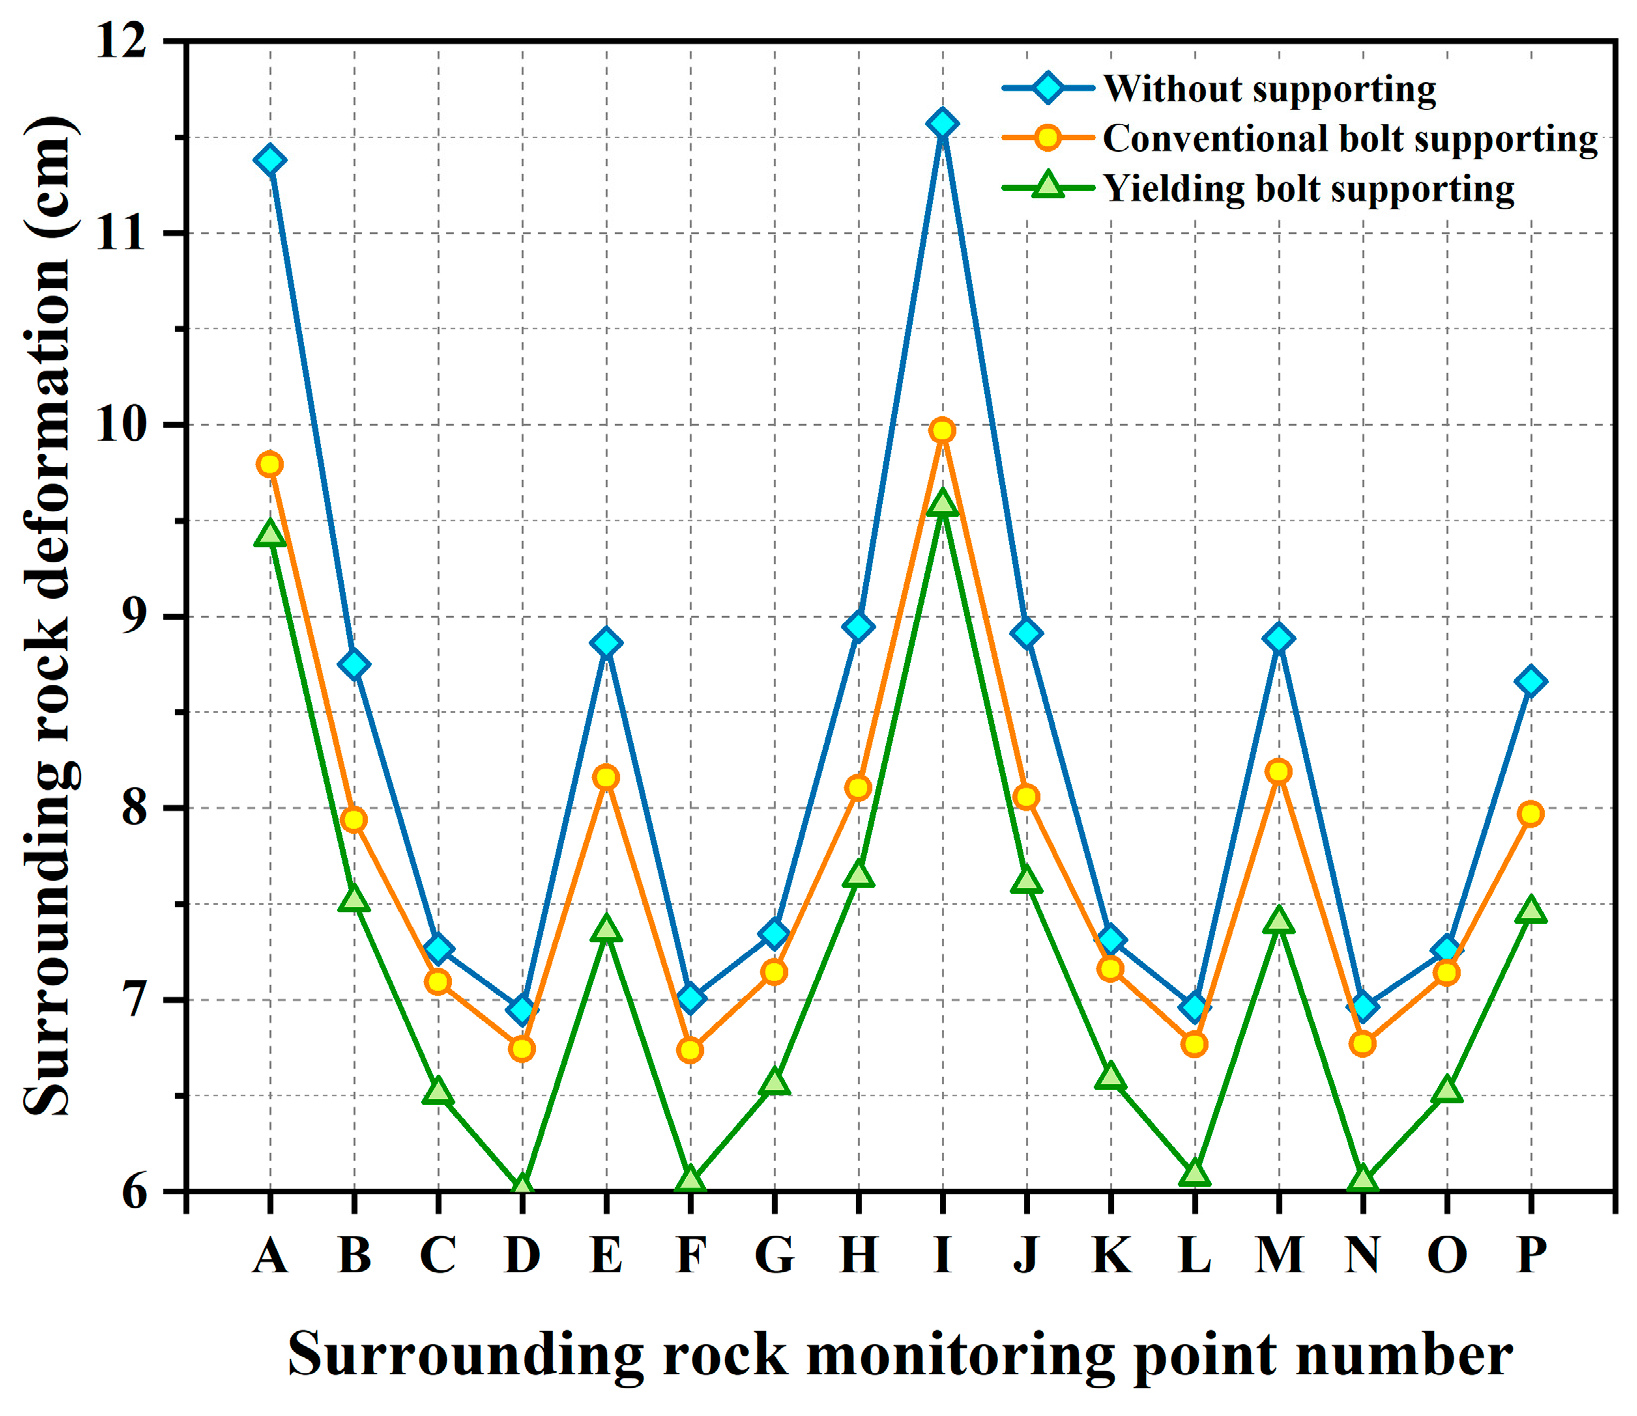
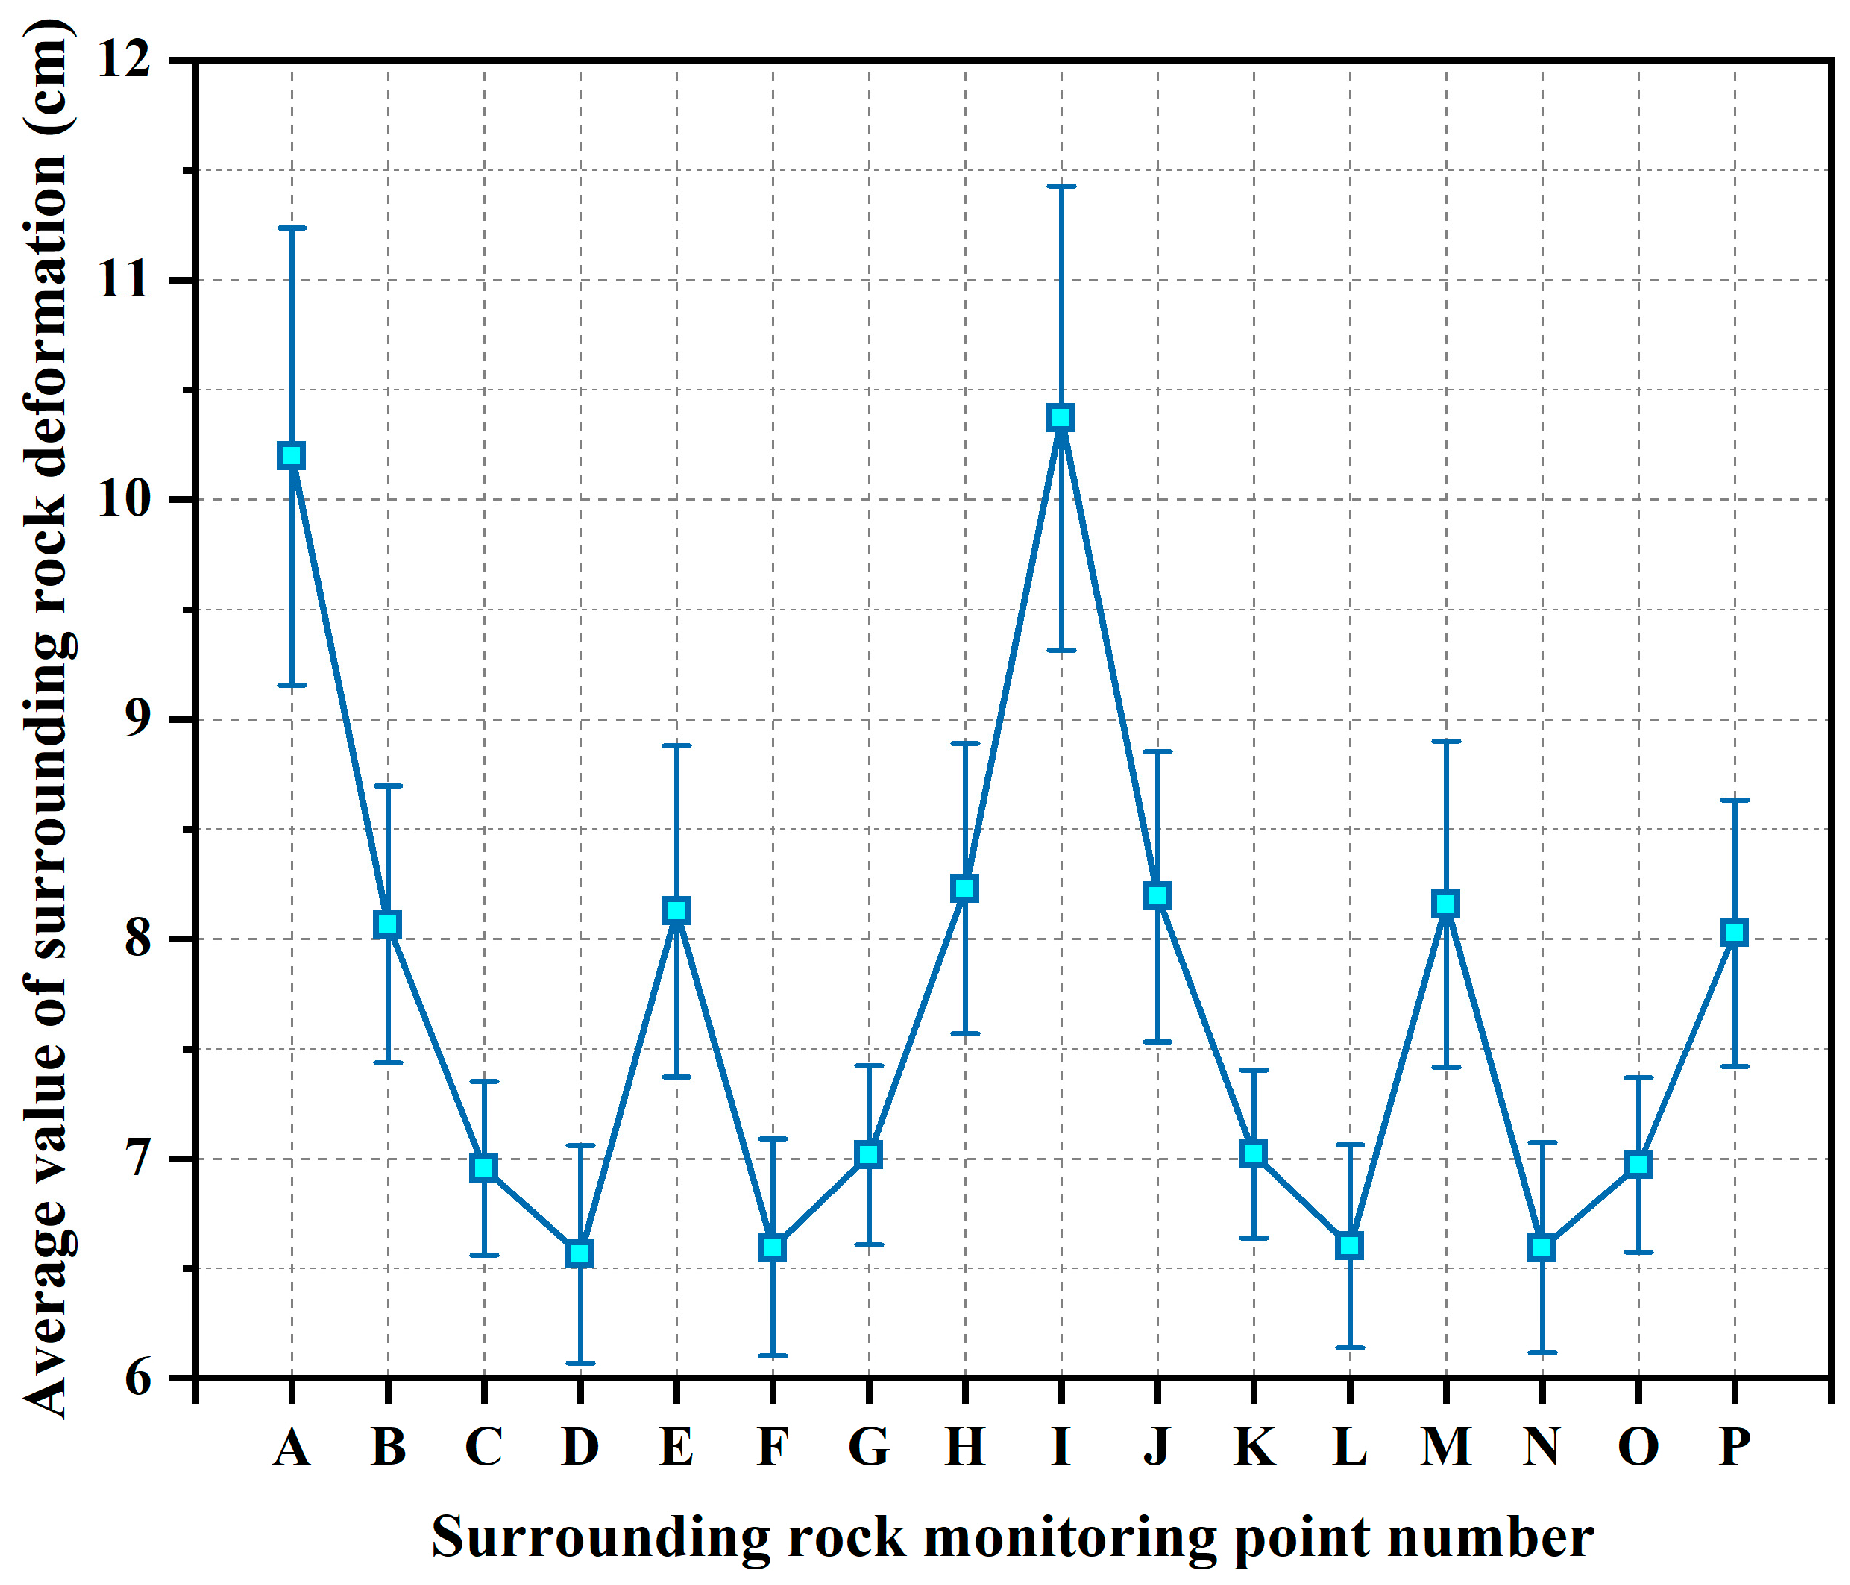
3.4.1. Comparative Analysis of Surrounding Rock Deformation
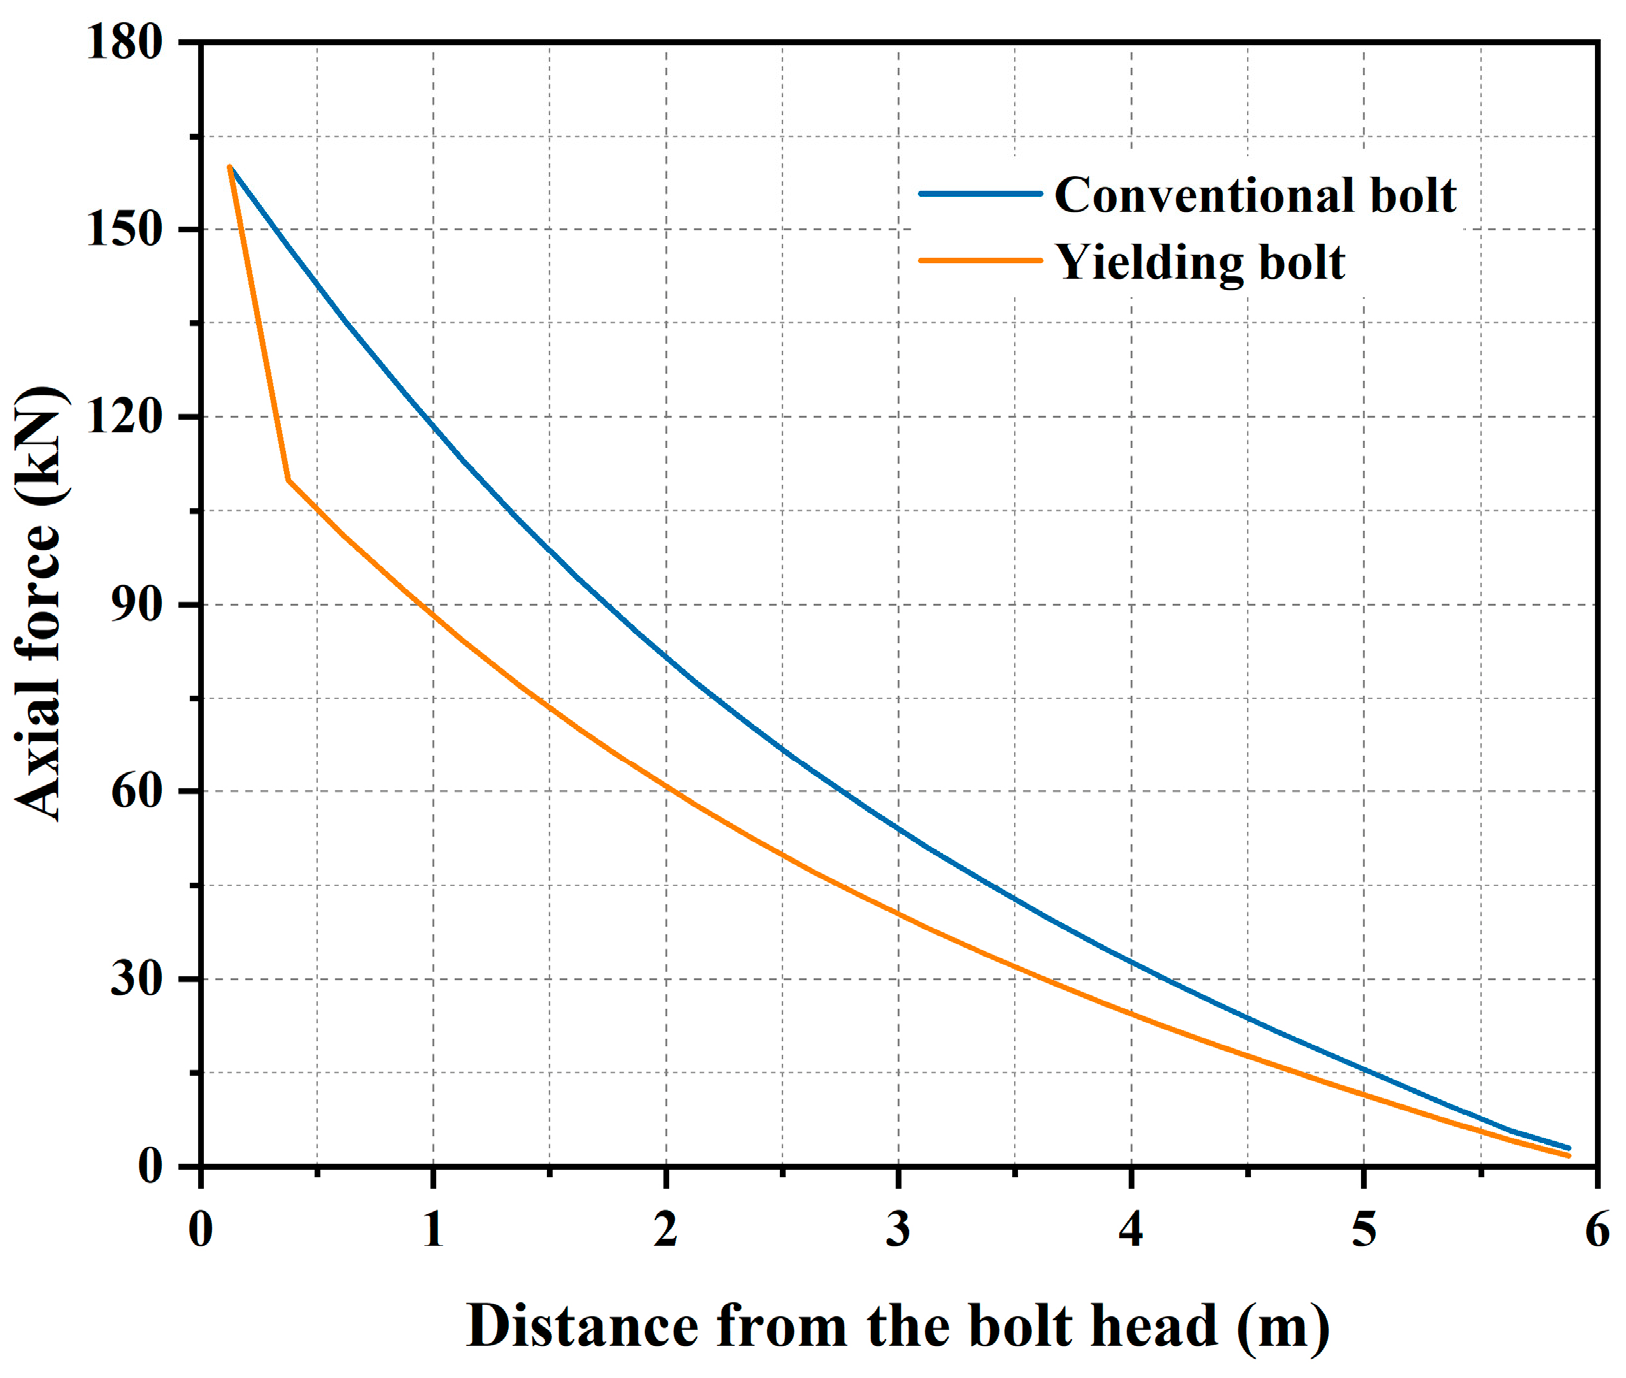
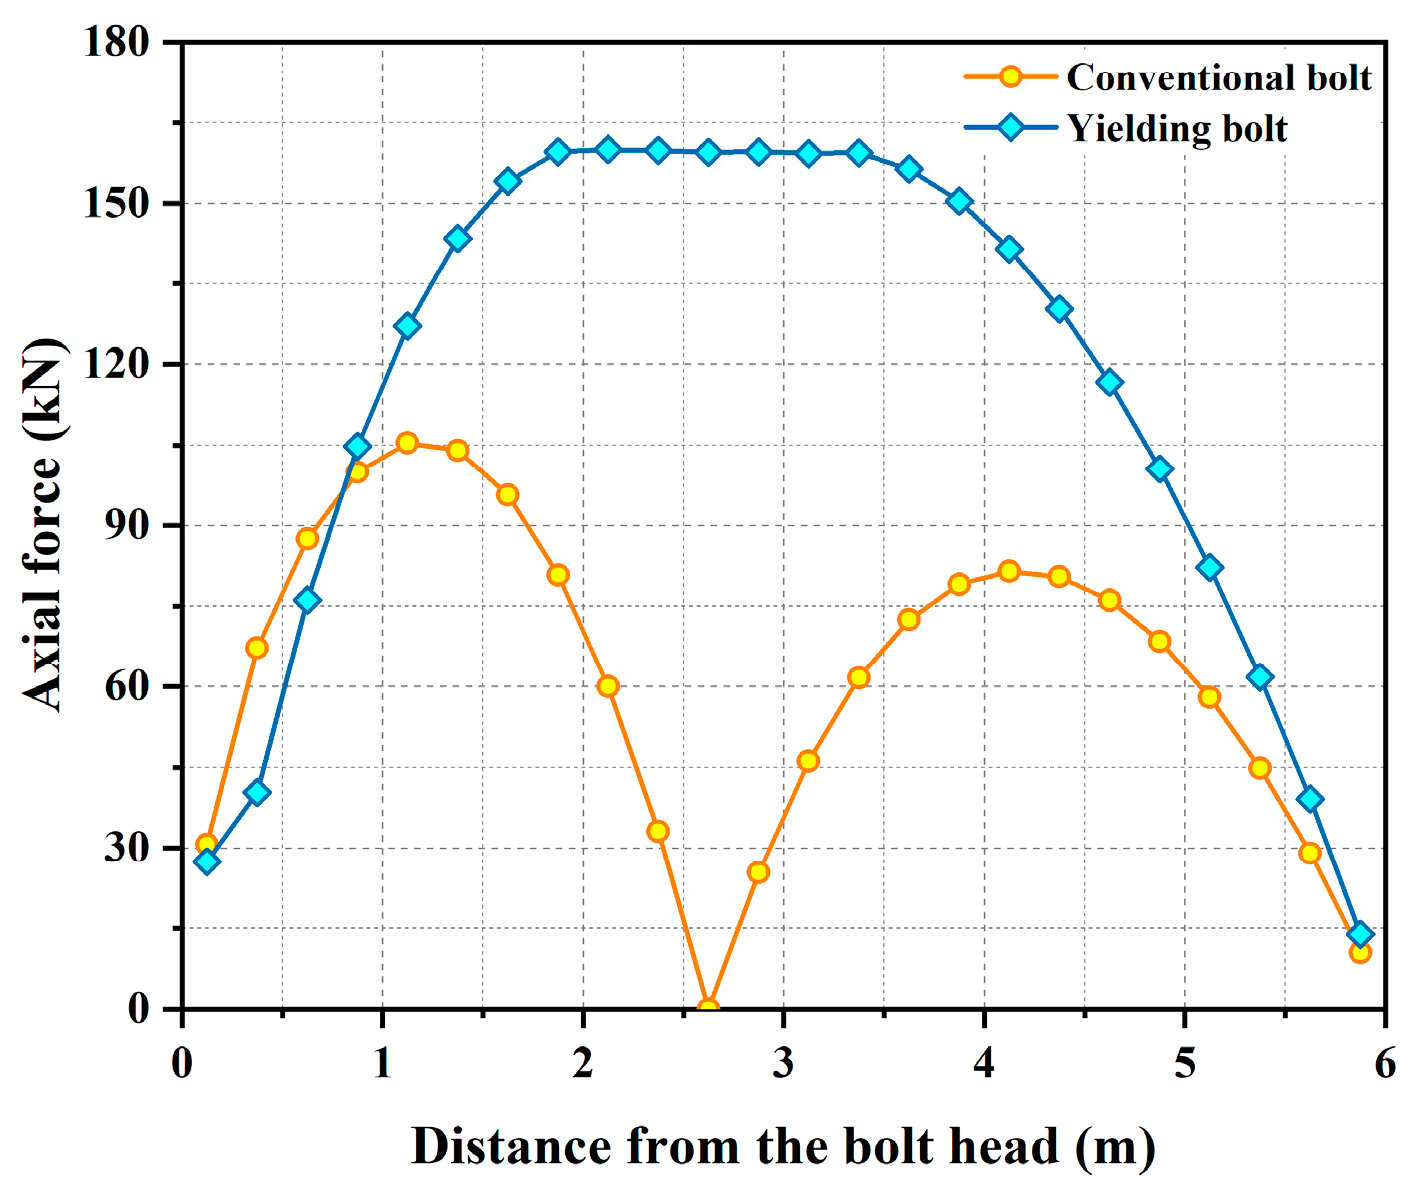
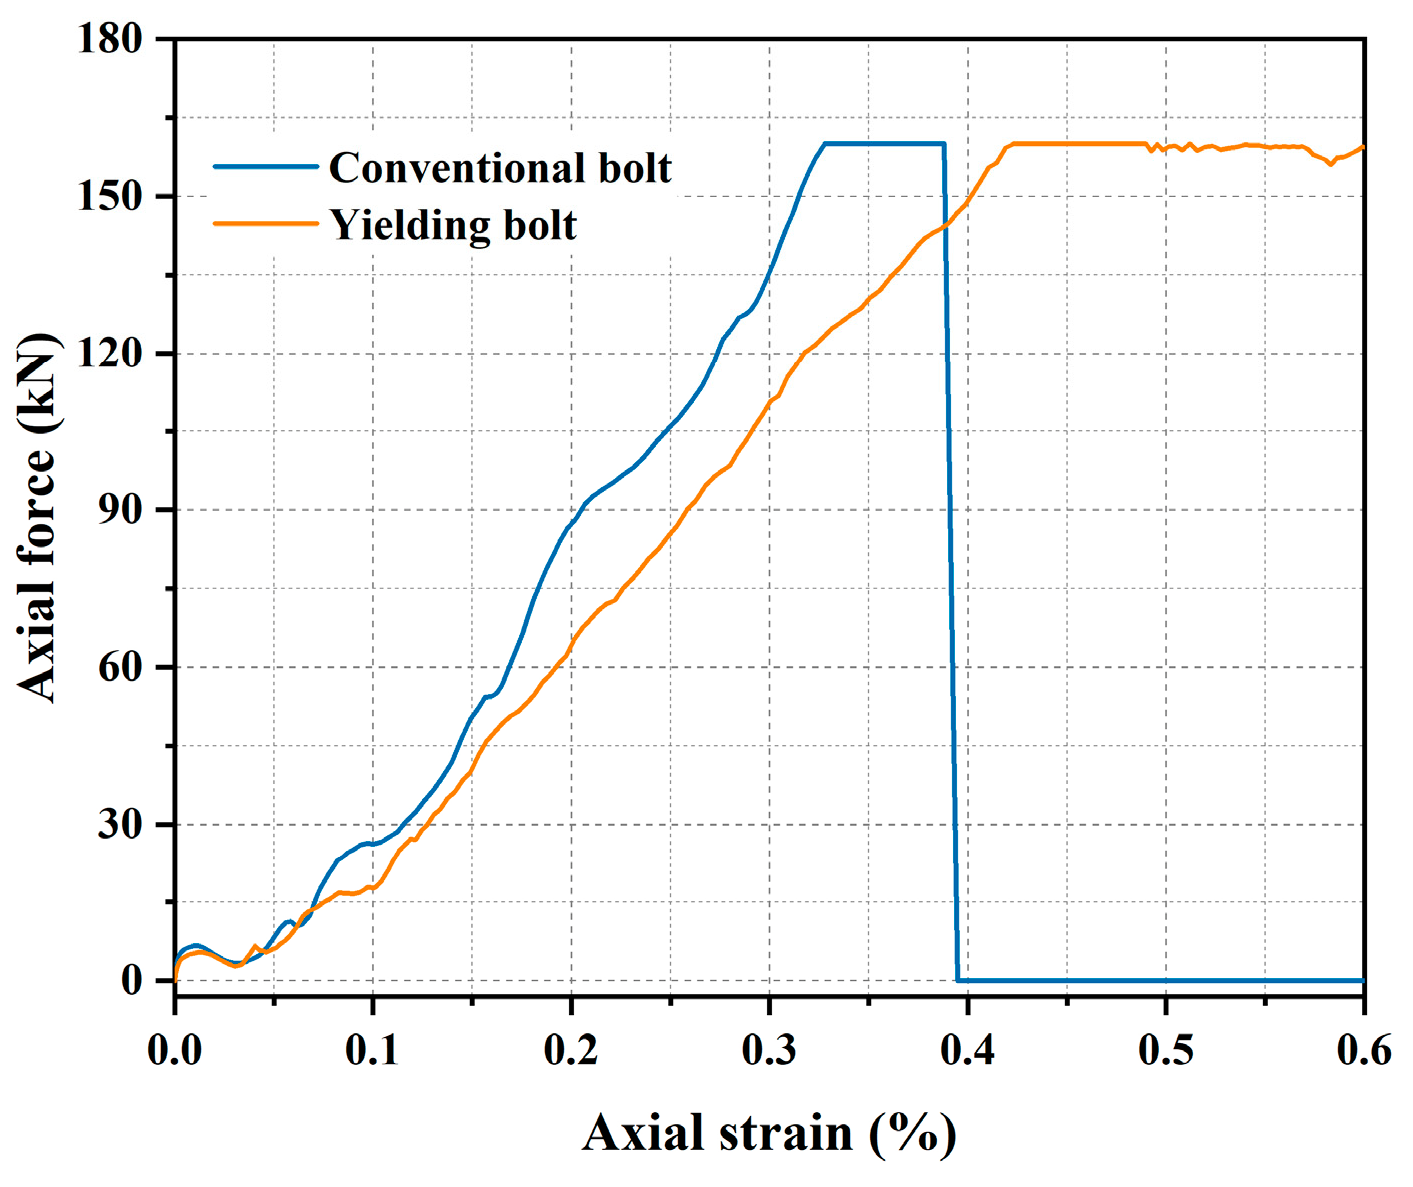
3.4.2. Comparative Analysis of the Mechanical Characteristics of Bolt
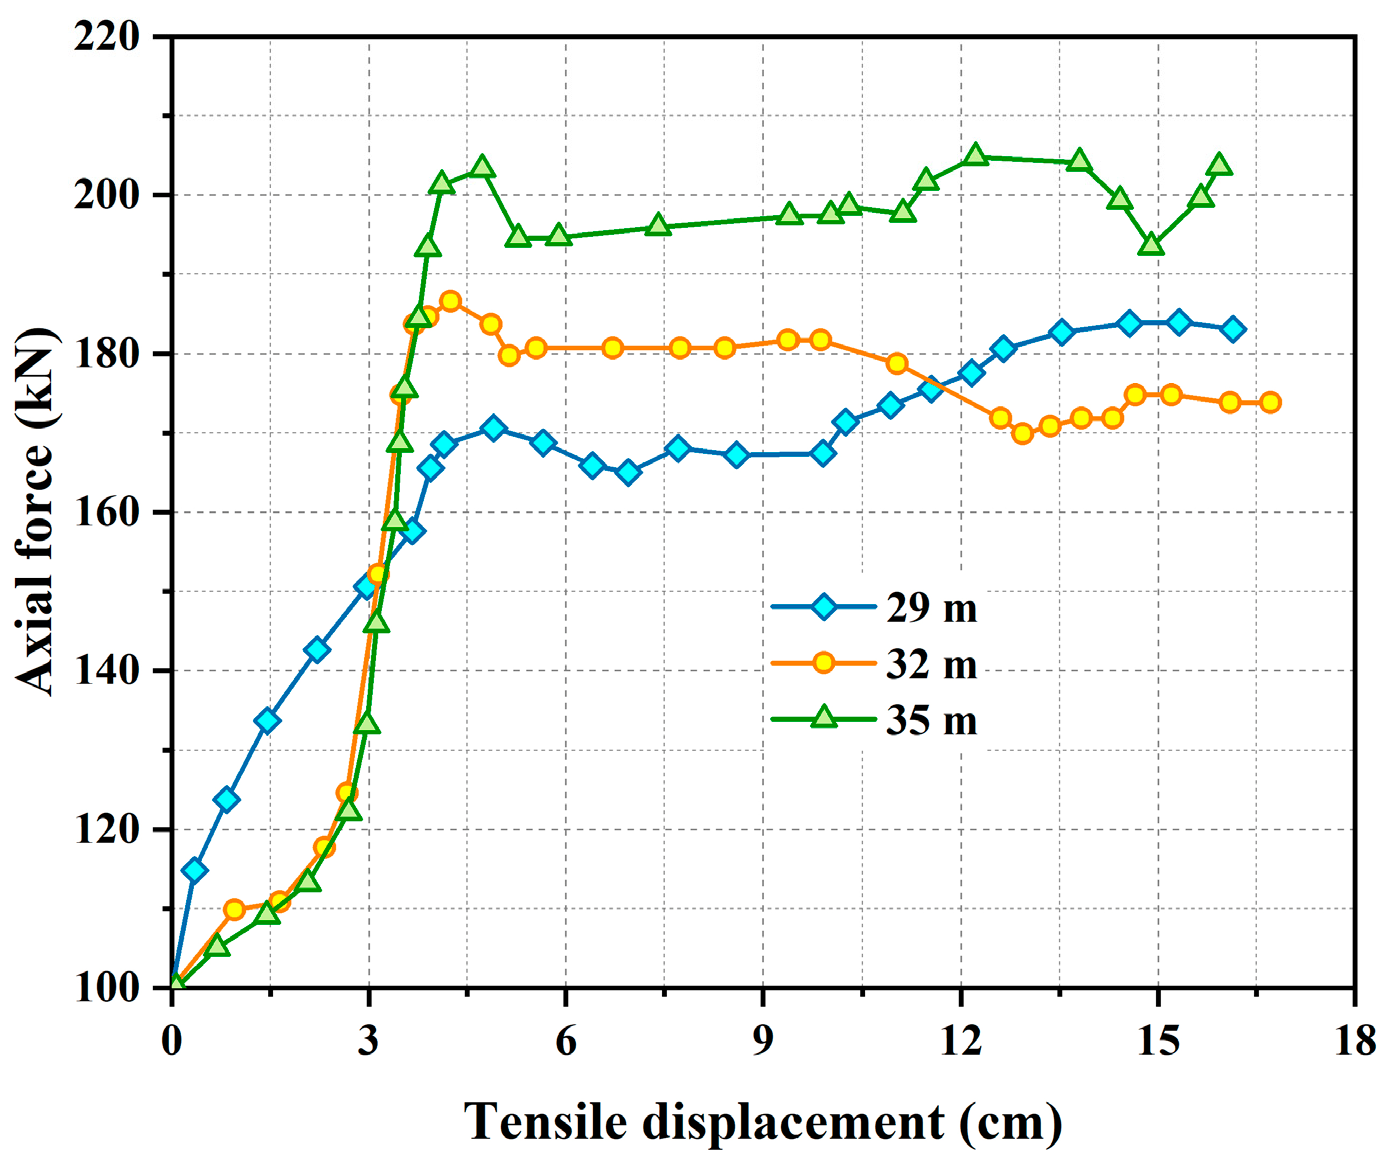
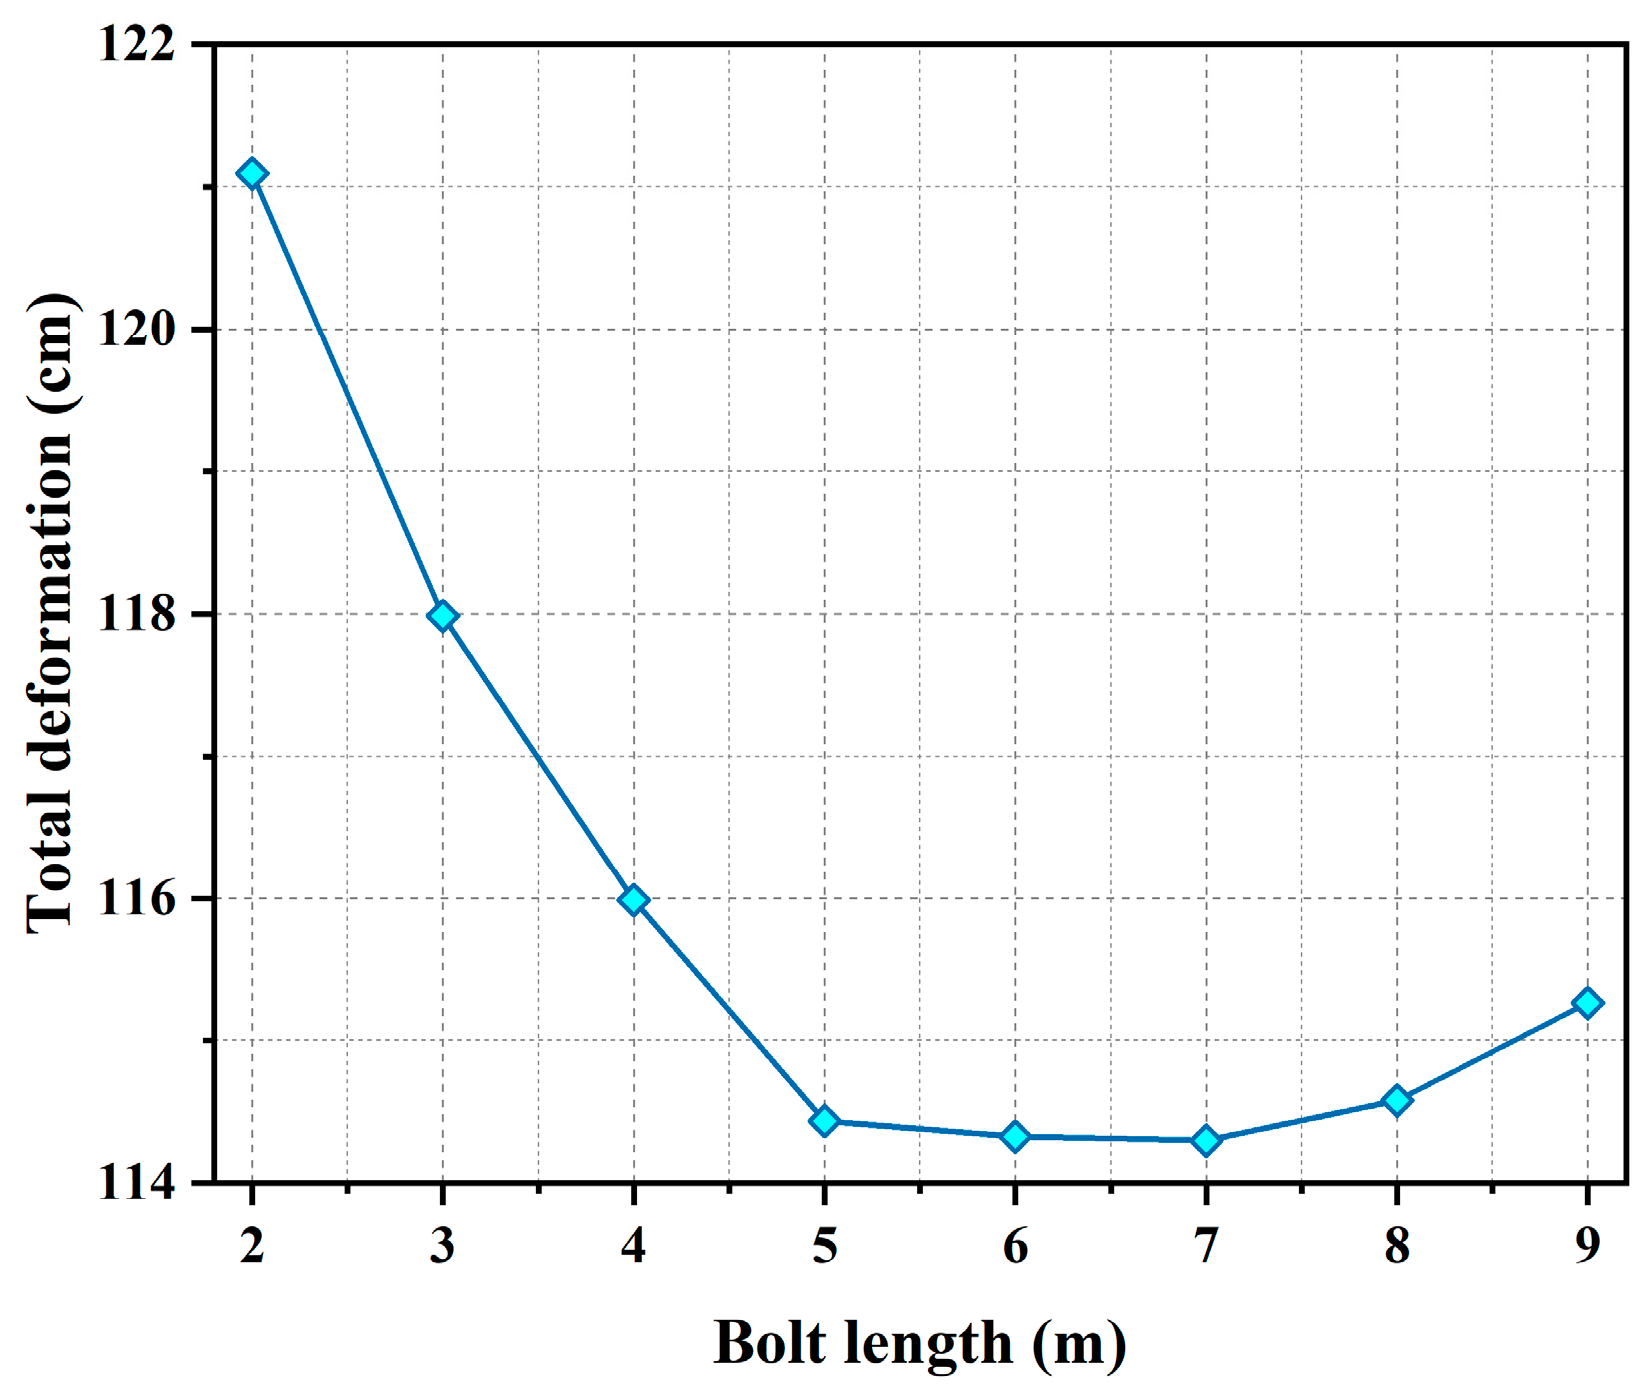
3.5. The Influence of the Yielding Bolt Length on Its Support Effect
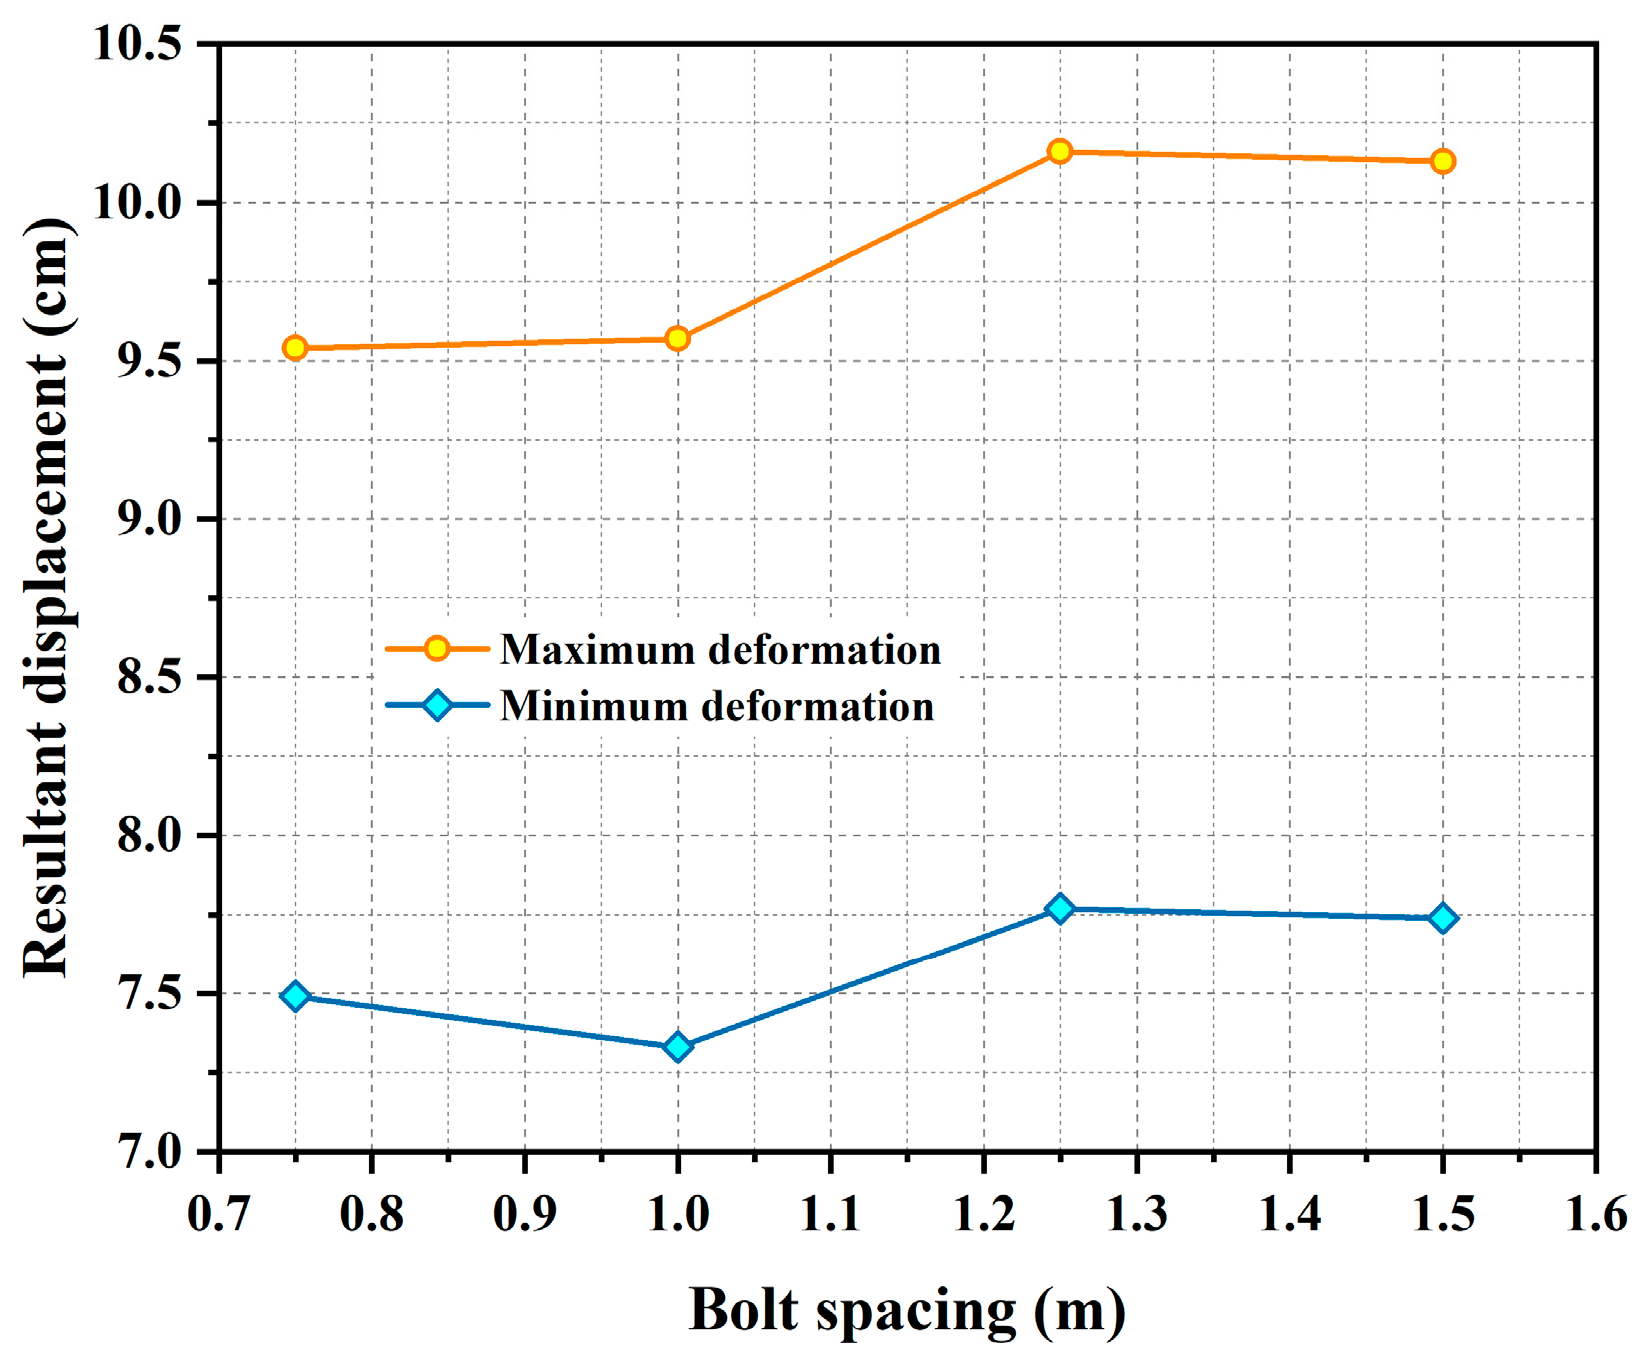
3.6. The Influence of the Yielding Bolt Spacing on Its Support Effect
4. Conclusions
- (1)
- The feasibility of simulating the pull-out tests, shear tests, and support effects of yielding bolts using FLAC3D was verified. The simulation results align with the working mechanism and stress characteristics of yielding bolts, establishing a basis for subsequent numerical simulation research.
- (2)
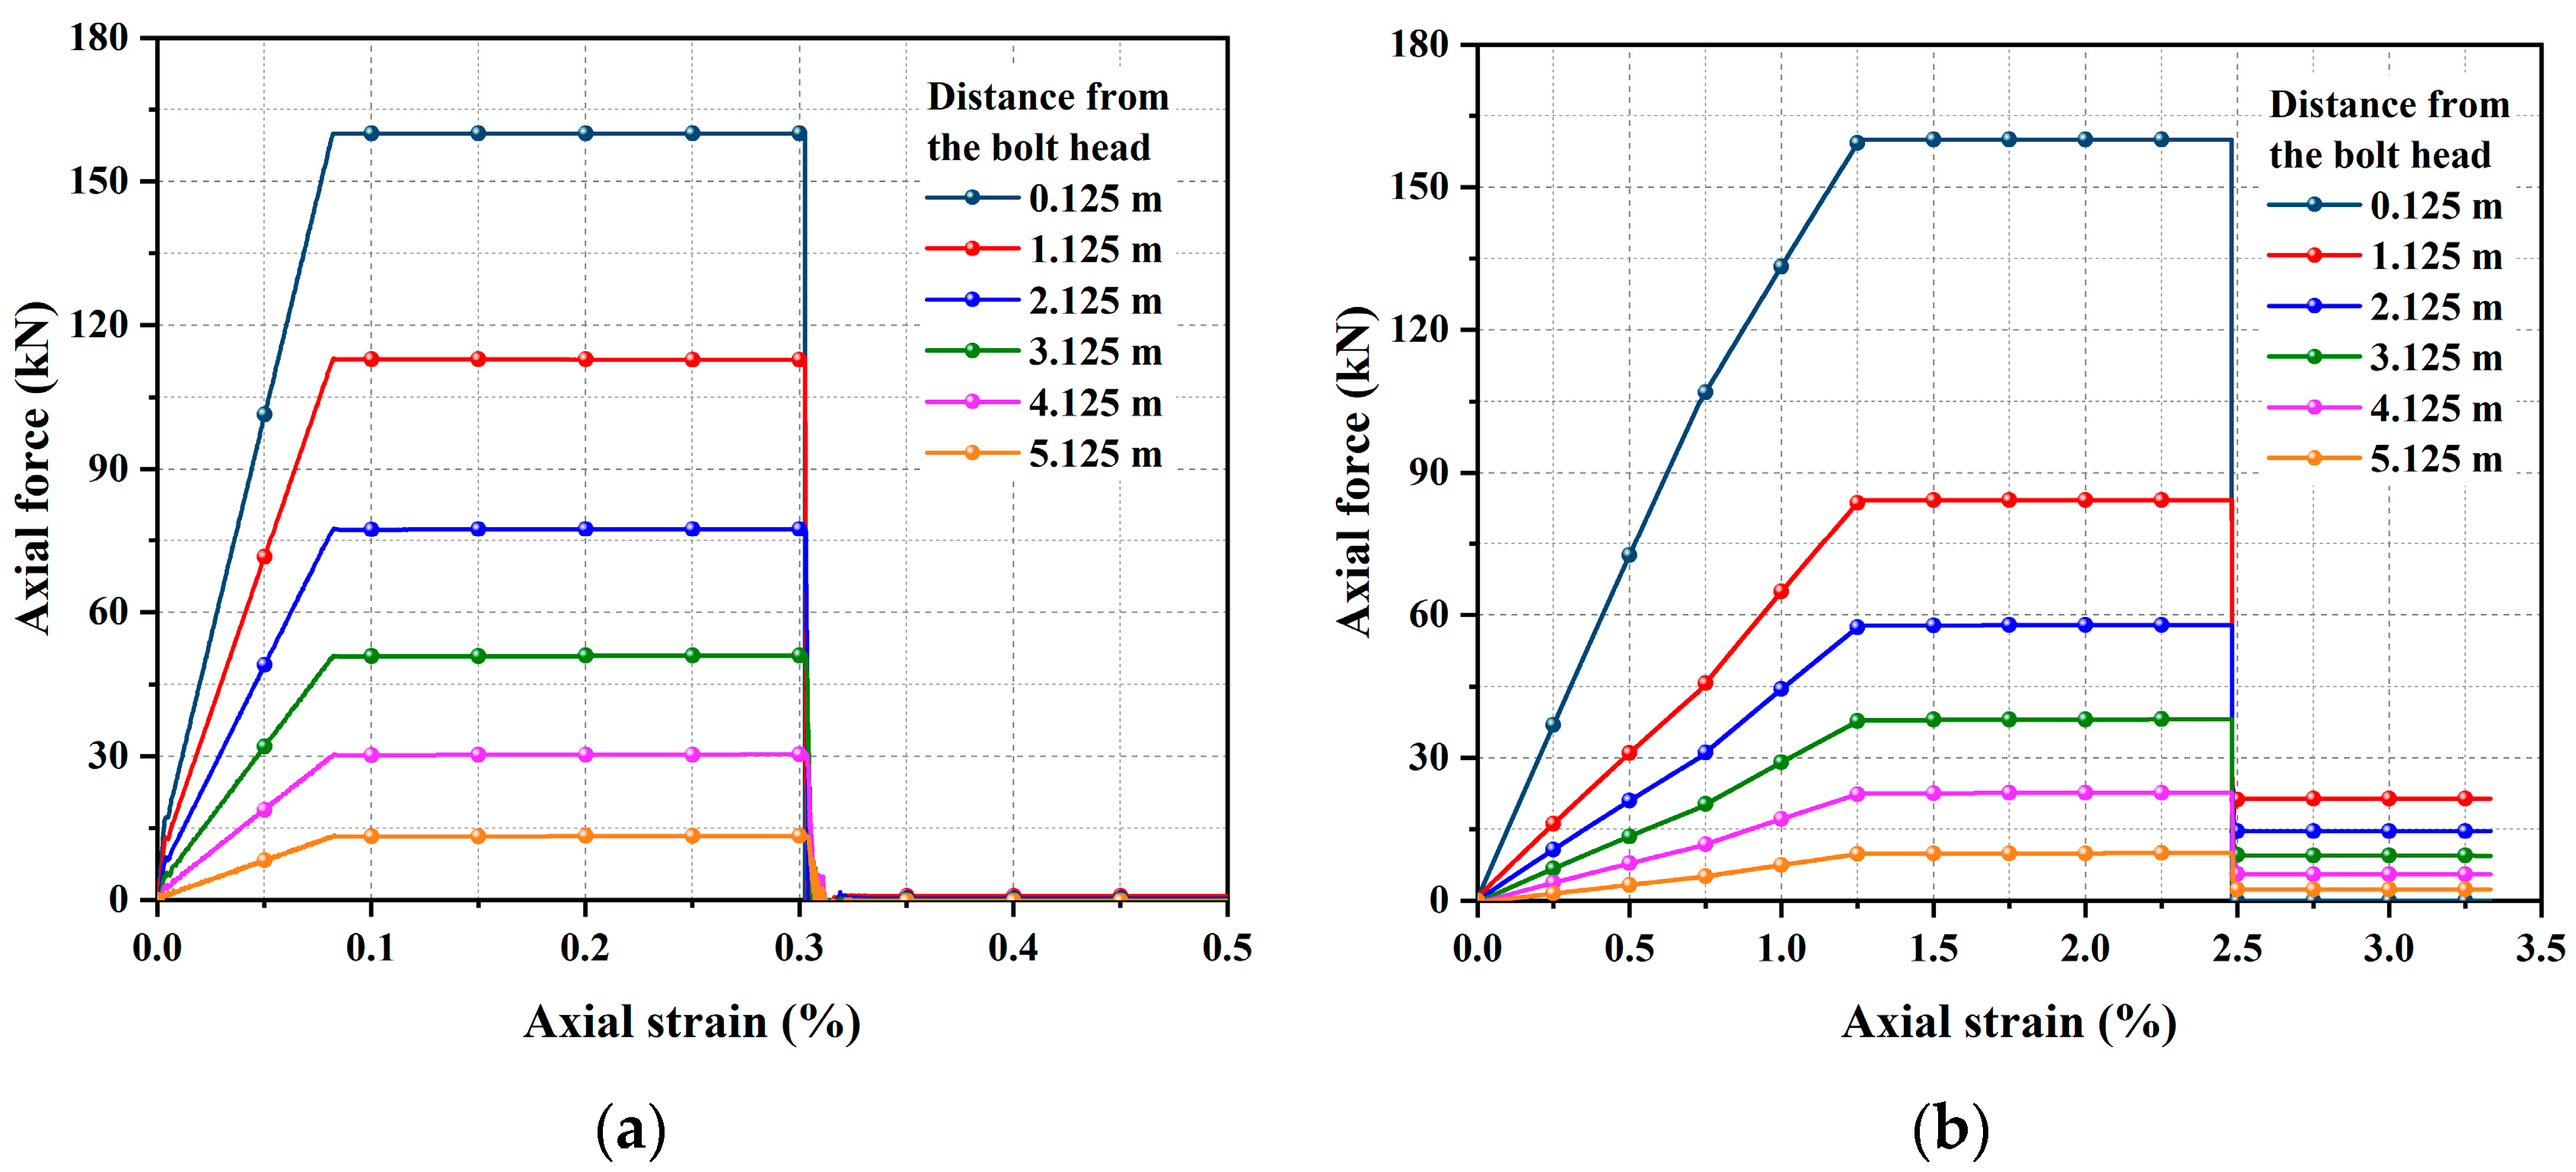
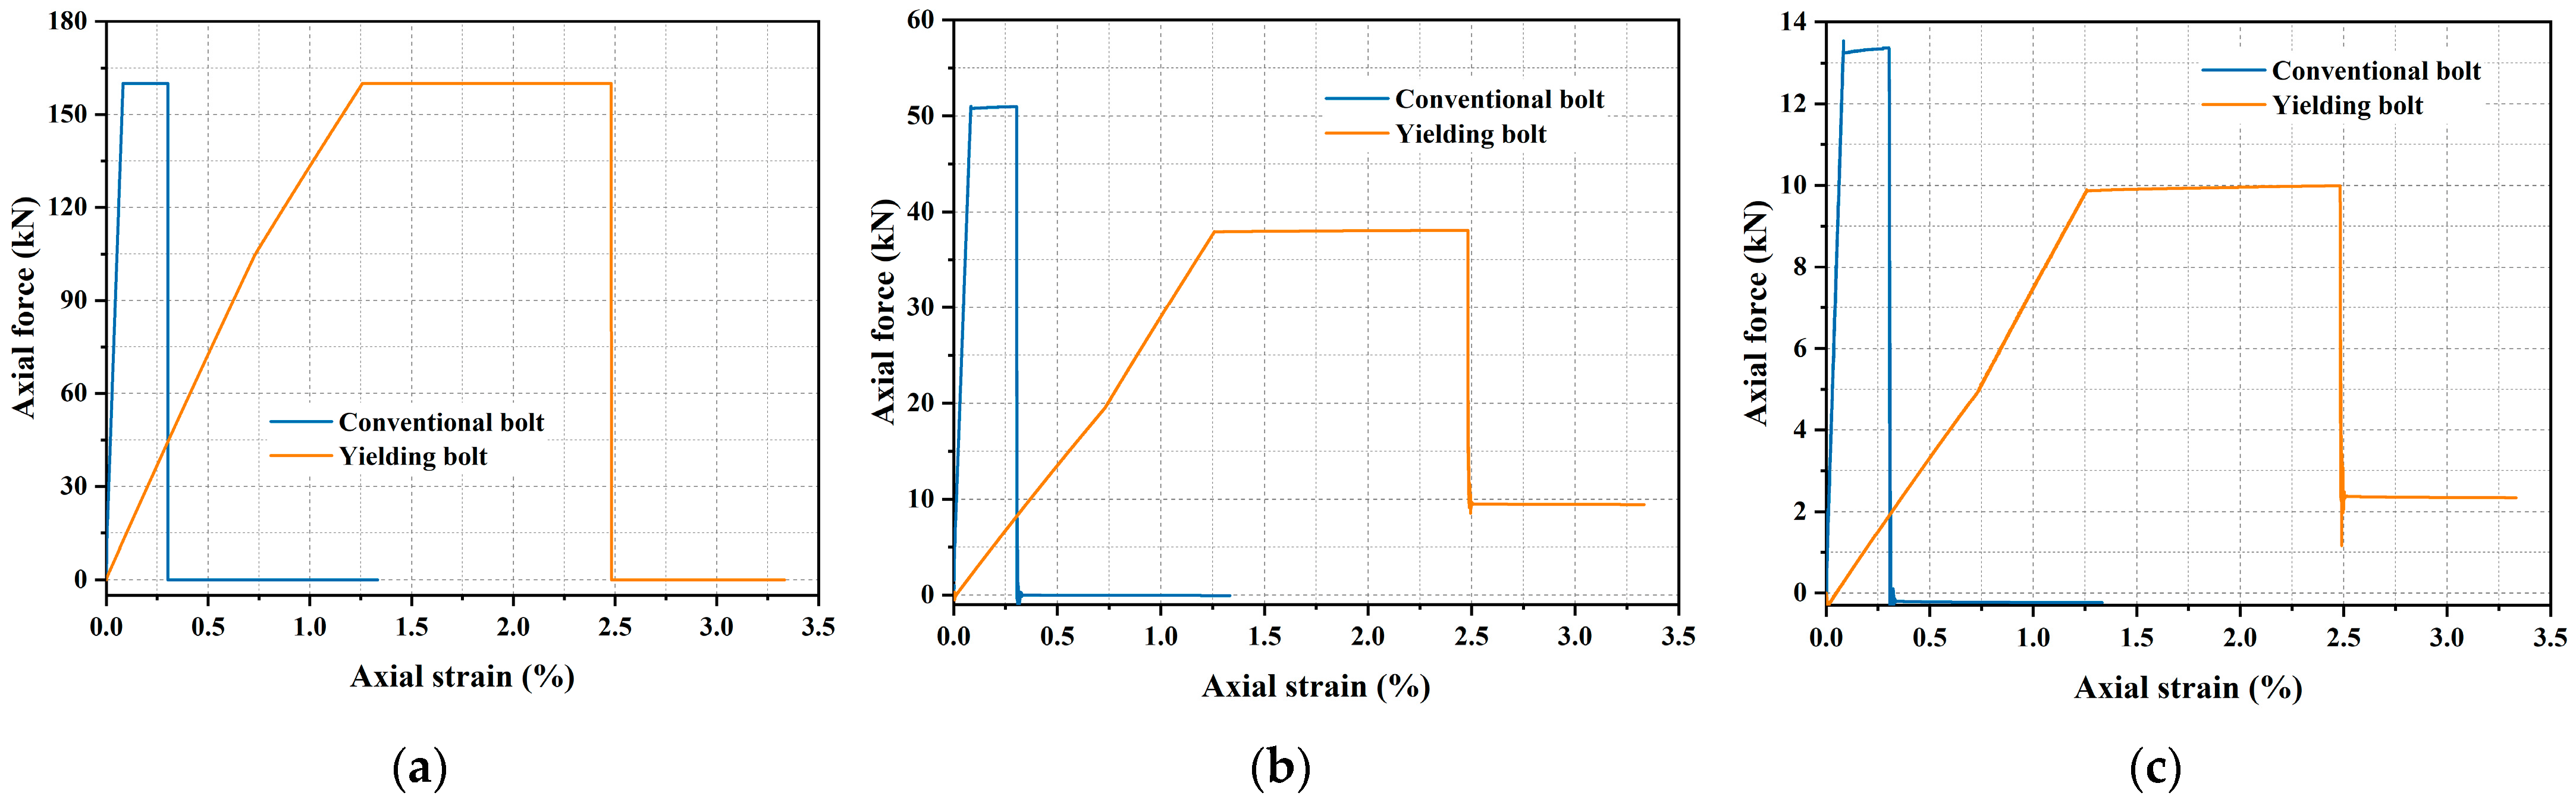
- When subjected to pull-out forces, the maximum axial force at the bolt head decreased gradually toward the inner end of the bolt, with the reduction in the yielding bolts being greater than that of the conventional bolts. As the pull-out force increased, the axial force of the bolt correspondingly increased, with the rate of increase in yielding bolts significantly slower than that of conventional bolts, confirming the high extension rate of yielding bolts.
- (3)
- In the support of a soft rock tunnel, compared to conventional bolts, yielding bolts exhibit a slower rate of reaching yield strength and a longer duration of maintaining yield strength. The central position of the maximum load-bearing capacity of the conventional bolts breaks under tension, resulting in an hourglass-shaped distribution of axial force, whereas yielding bolts can sustain yield strength for an extended period after reaching yield strength, with the axial force displaying a spindle-shaped distribution. The elastic and plastic yielding distance of the yielding bolts are 70.54 mm and 130.65 mm, respectively. The axial force distribution law and yielding distances can provide a theoretical reference basis for engineering applications.
- (4)
- Bolt spacing exerts a greater influence on support effectiveness in soft rock tunnels than bolt length. It was determined that a yielding bolt length of 5 m and a spacing of 1 m × 1 m are the optimal support configuration under the geological conditions discussed in this paper. This optimal support configuration and its determination method can provide a theoretical basis for more complex engineering applications.
Author Contributions
Funding
Institutional Review Board Statement
Informed Consent Statement
Data Availability Statement
Conflicts of Interest
References
- Park, D. Roof Stability Analysis of Cylindrical Tunnels in Hard Soil/Soft Rock with Reduced Tension Strength. Comput. Geotech. 2023, 164, 105838. [Google Scholar] [CrossRef]
- Lin, Q.; Cao, P.; Mao, S.; Ou, C.; Cao, R. Fatigue Behaviour and Constitutive Model of Yellow Sandstone Containing Pre-Existing Surface Crack under Uniaxial Cyclic Loading. Theor. Appl. Fract. Mech. 2020, 109, 102776. [Google Scholar] [CrossRef]
- Zhao, D.; Xia, Y.; Zhang, C.; Tang, C.; Zhou, H.; Liu, N.; Singh, H.K.; Zhao, Z.; Chen, J.; Mu, C. Failure Modes and Excavation Stability of Large-Scale Columnar Jointed Rock Masses Containing Interlayer Shear Weakness Zones. Int. J. Rock Mech. Min. Sci. 2022, 159, 105222. [Google Scholar] [CrossRef]
- Zhao, C.; Liu, J.; Lyu, C.; Chen, W.; Li, X.; Li, Z. Experimental Study on Mechanical Properties, Permeability and Energy Characteristics of Limestone from through-Coal Seam (TCS) Tunnel. Eng. Geol. 2022, 303, 106673. [Google Scholar] [CrossRef]
- Lin, Q.; Cao, P.; Meng, J.; Cao, R.; Zhao, Z. Strength and Failure Characteristics of Jointed Rock Mass with Double Circular Holes under Uniaxial Compression: Insights from Discrete Element Method Modelling. Theor. Appl. Fract. Mech. 2020, 109, 102692. [Google Scholar] [CrossRef]
- Moore, K.S.; Vlachopoulos, N. Effects of Rib Spacing and Grout Annulus on Grouted Rock Bolt Performance Utilizing Fiber Optic Strain Sensing. Appl. Sci. 2024, 14, 2136. [Google Scholar] [CrossRef]
- Lou, J.; Gao, F.; Li, J.; Yuan, G.; Sharifzadeh, M. Effect of Dynamic Loading Conditions on the Dynamic Performance of MP1 Energy-Absorbing Rockbolts: Insight from Laboratory Drop Test. Int. J. Min. Sci. Technol. 2023, 33, 215–231. [Google Scholar] [CrossRef]
- Sharifzadeh, M.; Lou, J.; Crompton, B. Dynamic Performance of Energy-Absorbing Rockbolts Based on Laboratory Test Results. Part I: Evolution, Deformation Mechanisms, Dynamic Performance and Classification. Tunn. Undergr. Space Technol. 2020, 105, 103510. [Google Scholar] [CrossRef]
- Tahmasebinia, F.; Zhang, C.; Canbulat, I.; Vardar, O.; Saydam, S. A Numerical Study of the Behaviour of Fully Grouted Cable Bolts under Static and Dynamic Loading. In Proceedings of the ISRM International Symposium-10th Asian Rock Mechanics Symposium, Singapore, 29 October–3 November 2018. [Google Scholar]
- Tai, Y.; Xia, H.; Huang, S.; Meng, J.; Li, W. The Influence Law of Eccentric Load on the Performance of Yielding Bolt. R. Soc. Open Sci. 2020, 7, 200227. [Google Scholar] [CrossRef]
- Pinazzi, P.C.; Spearing, A.J.S.; Jessu, K.V.; Singh, P.; Hawker, R. Mechanical Performance of Rock Bolts under Combined Load Conditions. Int. J. Min. Sci. Technol. 2020, 30, 167–177. [Google Scholar] [CrossRef]
- Kang, H.; Yuan, G.; Si, L.; Gao, F.; Lou, J.; Yang, J.; Dong, S. Mechanical Behavior and Failure Mechanisms of Rock Bolts Subjected to Static-Dynamic Loads. Int. J. Min. Sci. Technol. 2024, 34, 281–288. [Google Scholar] [CrossRef]
- Guo, Y.; Jiang, F.; Zhou, H.; Xiang, X. The Mechanism of the New-Type Yielding Bolt. Mech. Eng. 2015, 37, 193–196+237. (In Chinese) [Google Scholar] [CrossRef]
- Li, Y.; Tannant, D.D.; Pang, J.; Su, G. Experimental and Analytical Investigation of the Shear Resistance of a Rock Joint Held by a Fully-Grouted Bolt and Subject to Large Deformations. Transp. Geotech. 2021, 31, 100671. [Google Scholar] [CrossRef]
- Sun, C.; Liu, C.; Yuan, J. Mechanical Behavior Analysis of Fully Grouted Bolts under Shear throughout the Entire Elastic–Plastic Process. Eng. Fail. Anal. 2025, 171, 109340. [Google Scholar] [CrossRef]
- Morido-García, G.; De Santos-Berbel, C. Structural Performance of Bolted Lateral Connections in Steel Beams under Bending Using the Component-Based Finite Element Method. Appl. Sci. 2024, 14, 3900. [Google Scholar] [CrossRef]
- Wu, K.; Shao, Z.; Qin, S.; Wei, W.; Chu, Z. A Critical Review on the Performance of Yielding Supports in Squeezing Tunnels. Tunn. Undergr. Space Technol. 2021, 115, 103815. [Google Scholar] [CrossRef]
- Wang, T.; Liu, H.; Kang, M.; Zhao, B.; Shen, J.; Li, Y.; Yang, Y. Study on the Synergistic Effect of Primary Support and Surrounding Rock of Large Buried Depth Tunnel in Soft and Fractured Strata. Appl. Sci. 2024, 14, 2028. [Google Scholar] [CrossRef]
- Sun, Y.; Xu, N.; Xiao, P.; Sun, Z.; Li, H.; Liu, J.; Li, B. Characterizing Large Deformation of Soft Rock Tunnel Using Microseismic Monitoring and Numerical Simulation. J. Rock Mech. Geotech. Eng. 2025, 17, 309–322. [Google Scholar] [CrossRef]
- Deng, P.; Liu, Q.; Liu, B.; Lu, H. Failure Mechanism and Deformation Prediction of Soft Rock Tunnels Based on a Combined Finite–Discrete Element Numerical Method. Comput. Geotech. 2023, 161, 105622. [Google Scholar] [CrossRef]
- Xu, J.; Wen, H.; Sun, C.; Yang, C.; Rui, G. Numerical Simulation of Non-Stationary Parameter Creep Large Deformation Mechanism of Deep Soft Rock Tunnel. Appl. Sci. 2022, 12, 5311. [Google Scholar] [CrossRef]
- Peng, W. FLAC3D Practical Tutorial; China Machine Press: Beijing, China, 2014. (In Chinese) [Google Scholar]
- Li, W.; Wang, L.; Zhang, C.; Yang, X.; Mei, Y.; Shao, X.; Sun, B. Numerical Investigation Study on Tensile-Shear Failure Behavior of Rock Bolts in Inclined Strata Mining Tunnels. Eng. Fail. Anal. 2024, 162, 108393. [Google Scholar] [CrossRef]
- Yan, X.; Liu, Z.; Zhao, Y.; Li, Y.; Chen, W.; Li, M. Experimental and Numerical Study on the Effect of Load Direction on the Bolt Loosening Failure. Eng. Fail. Anal. 2024, 163, 108574. [Google Scholar] [CrossRef]
- Jiang, W.; Xu, G.; Ma, C. Numerical Simulation on Pull-Tests of a Cable by FLAC3D. J. Harbin Inst. Technol. 2009, 41, 129–133. (In Chinese) [Google Scholar]
- Bahrani, N.; Hadjigeorgiou, J. Explicit Reinforcement Models for Fully-Grouted Rebar Rock Bolts. J. Rock Mech. Geotech. Eng. 2017, 9, 267–280. [Google Scholar] [CrossRef]
- Saadat, M.; Taheri, A. A Numerical Study to Investigate the Influence of Surface Roughness and Boundary Condition on the Shear Behaviour of Rock Joints. Bull. Eng. Geol. Environ. 2020, 79, 2483–2498. [Google Scholar] [CrossRef]
- Zhang, S.F.; Feng, J.X.; Han, R. FLAC3D Numerical Simulation Study on the Failure Developing Law of Interface for Geotechnical Prestressed Anchorage Bolt. Adv. Mater. Res. 2013, 671, 50–53. [Google Scholar] [CrossRef]
- Zhang, S.; Jiang, Y.; Zheng, H.; Wu, X.; Chen, H. Shear Characteristics and Damage Mechanisms of the Bolt–Grout Interface under Cyclic Shear Loading. Comput. Part. Mech. 2025; Early Access. [Google Scholar] [CrossRef]
- Li, D.; Ma, S.; Lane, M.; Chang, P.; Crompton, B.; Hagen, S.A. Laboratory Investigations into the Failure Mechanisms of New Yielding and Inflatable Rockbolts Under Axial and Shearing Loading Conditions. Rock Mech. Rock Eng. 2023, 56, 565–587. [Google Scholar] [CrossRef]
- Ma, L.; Xing, L.; Liu, C.; Cui, T.; Qiao, X.; Miao, W.; Kong, P. Research on the Instability Mechanism and Control Technology of Gob-Side Entry in Deep Mines with Soft Rock. Buildings 2025, 15, 19. [Google Scholar] [CrossRef]
- Warren, M.; Antoniou, A.; Stewart, L. A Review of Experimentation and Computational Modeling of Dynamic Bolt Fracture. J. Constr. Steel Res. 2022, 194, 107293. [Google Scholar] [CrossRef]
- Chen, Y.; Wen, G.; Hu, J. Analysis of Deformation Characteristics of Fully Grouted Rock Bolts Under Pull-and-Shear Loading. Rock Mech. Rock Eng. 2020, 53, 2981–2993. [Google Scholar] [CrossRef]
- Wu, X.; Jiang, Y.; Wang, G.; Gong, B.; Guan, Z.; Deng, T. Performance of a New Yielding Rock Bolt Under Pull and Shear Loading Conditions. Rock Mech. Rock Eng. 2019, 52, 3401–3412. [Google Scholar] [CrossRef]
- Shan, Z.; Guo, Q.; Liang, K.; Ji, X.; Chen, L.; Li, L.; Xu, Z. Design Approach and Its Optimization for Bolted Steel Plate Strengthened RC Beams Considering the Effect of Connection Bolt Slip. Structures 2023, 57, 105045. [Google Scholar] [CrossRef]
- Wang, C.; Zheng, X.; Xin, W.; Wang, J.; Liu, L. Investigation of Bolt Support Mechanisms and Parameter Optimization for Hard Roof Control in Underground Mining. Processes 2025, 13, 94. [Google Scholar] [CrossRef]
- Croccolo, D.; De Agostinis, M.; Fini, S.; Khan, M.Y.; Mele, M.; Olmi, G. Optimization of Bolted Joints: A Literature Review. Metals 2023, 13, 1708. [Google Scholar] [CrossRef]
- Ministry of Housing and Urban-Rural Development of the People’s Republic of China. General Administration of Quality Supervision, Inspection and Quarantine of the People’s Republic of China. In Standard for Engineering Classification of Rock Masses; Ministry of Housing and Urban-Rural Development of the People’s Republic of China: Beijing, China, 2014. (In Chinese) [Google Scholar]
- Aygar, E.B. Evaluation of New Austrian Tunnelling Method Applied to Bolu Tunnel’s Weak Rocks. J. Rock Mech. Geotech. Eng. 2020, 12, 541–556. [Google Scholar] [CrossRef]
- Sugimoto, M.; Chen, J.; Sramoon, A. Frame Structure Analysis Model of Tunnel Lining Using Nonlinear Ground Reaction Curve. Tunn. Undergr. Space Technol. 2019, 94, 103135. [Google Scholar] [CrossRef]

| Material | Elasticity Modulus (GPa) | Poisson Ratio | Unit Weight (kN/m3) | Cohesive Force (MPa) | Internal Friction Angle (°) |
|---|---|---|---|---|---|
| Surrounding rock | 4.00 | 0.325 | 21.5 | 0.45 | 33 |
| Yielding Bolt | Length (m) | Cross Sectional Area (m3) | Elasticity Modulus (GPa) | Poisson Ratio | Tensile Failure Strain |
|---|---|---|---|---|---|
| Regular part | 5.5 | 5 × 10⁻⁴ | 200 | 0.25 | 0.1 |
| Yielding element | 0.5 | 5 × 10⁻⁴ | 20 | 0.25 | 0.2 |
| Material | Length (m) | Cross Sectional Area (m3) | Elasticity Modulus (GPa) | Poisson Ratio | Tensile Failure Strain |
|---|---|---|---|---|---|
| Conventional bolt | 6 | 5 × 10⁻⁴ | 200 | 0.25 | 0.1 |
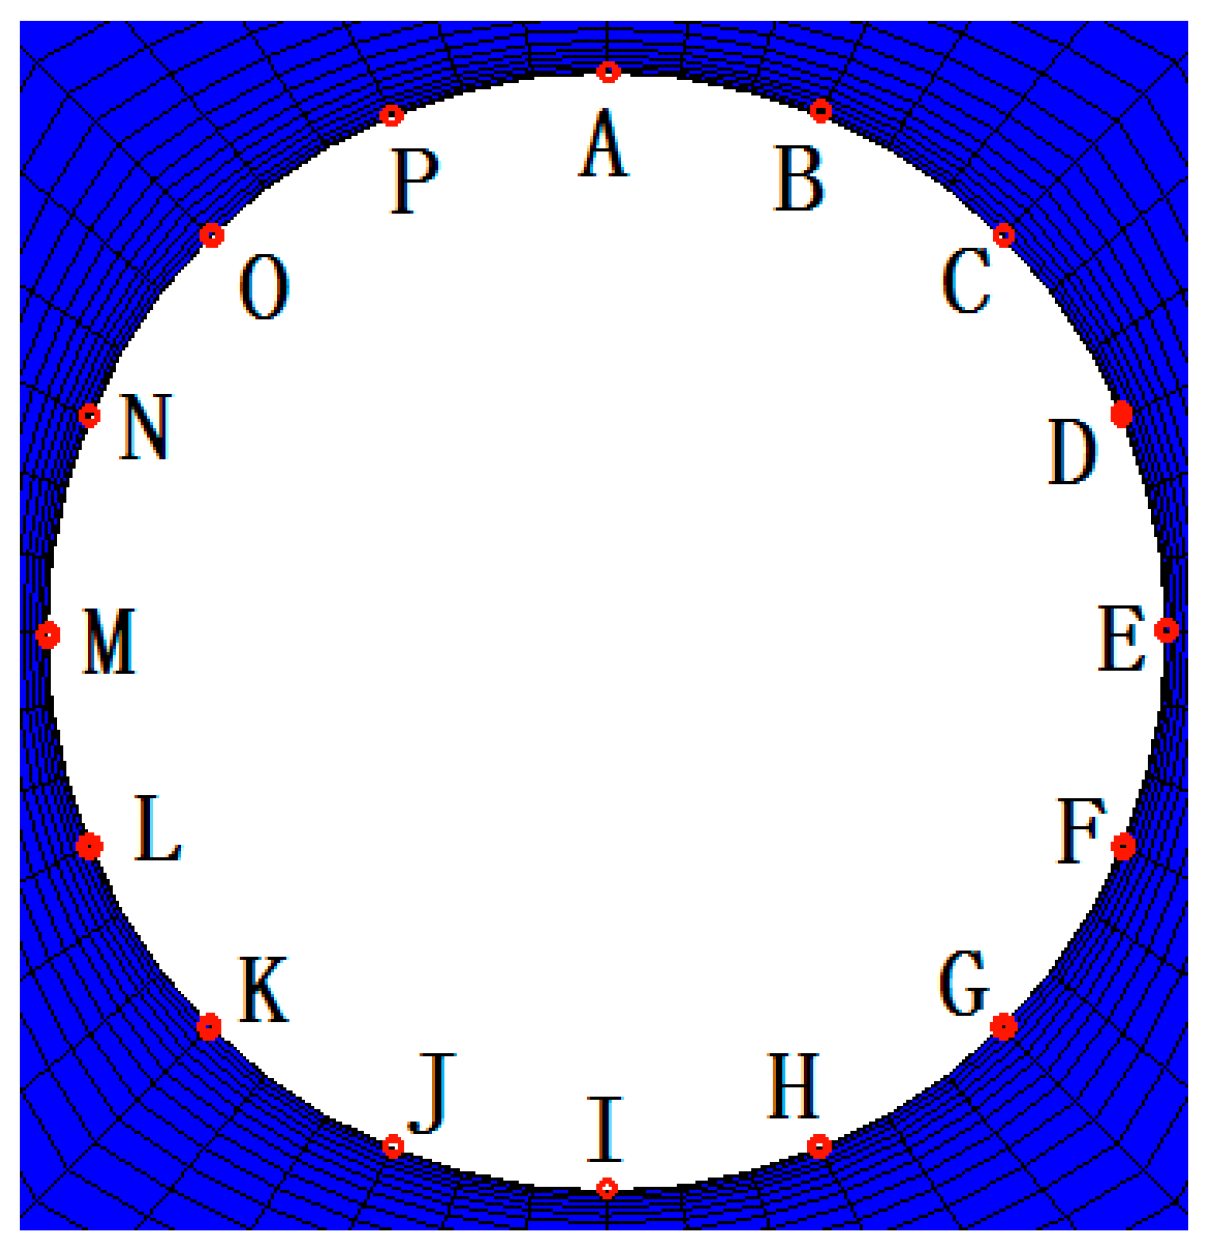
| Monitoring Point | Location |
|---|---|
| A | Arch crown |
| B | Arch shoulder (67.5° to horizontal) |
| C | Arch shoulder (45° to horizontal) |
| D | Arch shoulder (22.5° to horizontal) |
| E | Sidewall (left) |
| F | Arch foot (22.5° to horizontal) |
| G | Arch foot (45° to horizontal) |
| H | Arch foot (67.5° to horizontal) |
| I | Arch base |
| J | Arch foot (67.5°to horizontal) |
| K | Arch foot (45° to horizontal) |
| L | Arch foot (22.5° to horizontal) |
| M | Sidewall (right) |
| N | Arch shoulder (22.5° to horizontal) |
| O | Arch shoulder (45° to horizontal) |
| P | Arch shoulder (67.5° to horizontal) |
| Bolt Length (m) | Deformation (cm) | |||
|---|---|---|---|---|
| Arch Crown | Arch Base | Left Sidewall | Right Sidewall | |
| 2 | 9.99 | 10.23 | 7.67 | 7.64 |
| 3 | 9.68 | 9.83 | 7.49 | 7.48 |
| 4 | 9.45 | 9.65 | 7.42 | 7.38 |
| 5 | 9.39 | 9.58 | 7.39 | 7.33 |
| 6 | 9.42 | 9.58 | 7.40 | 7.36 |
| 7 | 9.41 | 9.60 | 7.42 | 7.37 |
| 8 | 9.43 | 9.63 | 7.44 | 7.43 |
| 9 | 9.49 | 9.68 | 7.48 | 7.47 |
| Bolt Spacing (m) | Deformation (cm) | |||
|---|---|---|---|---|
| Arch Crown | Arch Base | Left Sidewall | Right Sidewall | |
| 0.75 | 9.34 | 9.53 | 7.51 | 7.49 |
| 1 | 9.39 | 9.57 | 7.39 | 7.33 |
| 1.25 | 9.94 | 10.16 | 7.79 | 7.77 |
| 1.5 | 9.92 | 10.13 | 7.77 | 7.74 |
Disclaimer/Publisher’s Note: The statements, opinions and data contained in all publications are solely those of the individual author(s) and contributor(s) and not of MDPI and/or the editor(s). MDPI and/or the editor(s) disclaim responsibility for any injury to people or property resulting from any ideas, methods, instructions or products referred to in the content. |
© 2025 by the authors. Licensee MDPI, Basel, Switzerland. This article is an open access article distributed under the terms and conditions of the Creative Commons Attribution (CC BY) license (https://creativecommons.org/licenses/by/4.0/).
Share and Cite
Zhu, Y.; Chi, M.; Tan, Y.; Zha, E.; Zhang, Y. Numerical Investigation of the Pull-Out and Shear Mechanical Characteristics and Support Effectiveness of Yielding Bolt in a Soft Rock Tunnel. Appl. Sci. 2025, 15, 6933. https://doi.org/10.3390/app15126933
Zhu Y, Chi M, Tan Y, Zha E, Zhang Y. Numerical Investigation of the Pull-Out and Shear Mechanical Characteristics and Support Effectiveness of Yielding Bolt in a Soft Rock Tunnel. Applied Sciences. 2025; 15(12):6933. https://doi.org/10.3390/app15126933
Chicago/Turabian StyleZhu, Yan, Mingbo Chi, Yanyan Tan, Ersheng Zha, and Yuwei Zhang. 2025. "Numerical Investigation of the Pull-Out and Shear Mechanical Characteristics and Support Effectiveness of Yielding Bolt in a Soft Rock Tunnel" Applied Sciences 15, no. 12: 6933. https://doi.org/10.3390/app15126933
APA StyleZhu, Y., Chi, M., Tan, Y., Zha, E., & Zhang, Y. (2025). Numerical Investigation of the Pull-Out and Shear Mechanical Characteristics and Support Effectiveness of Yielding Bolt in a Soft Rock Tunnel. Applied Sciences, 15(12), 6933. https://doi.org/10.3390/app15126933