Article

Importance of CBCT Analysis in the Preoperative Planning of TAD Placement in the Anterior Maxillary Region

1
Department of Dentistry, Faculty of Medical Sciences, University of Kragujevac, 34000 Kragujevac, Serbia
2
Department of Histology and Embryology, Faculty of Medical Sciences, University of Kragujevac, 34000 Kragujevac, Serbia
3
Department of Anatomy, Faculty of Medical Sciences, University of Kragujevac, 34000 Kragujevac, Serbia
4
Department of Physiology, Faculty of Medical Sciences, University of Kragujevac, 34000 Kragujevac, Serbia
*
Author to whom correspondence should be addressed.
Appl. Sci. 2025, 15(12), 6866; https://doi.org/10.3390/app15126866
Submission received: 18 May 2025 / Revised: 15 June 2025 / Accepted: 17 June 2025 / Published: 18 June 2025
(This article belongs to the Special Issue Trends and Prospects of Orthodontic Treatment)

Abstract

:
The precise planning of orthodontic temporary anchorage devices (TADs) in the anterior maxilla is crucial due to anatomical complexity. This study aimed to evaluate the bone parameters for mini-implant placement using cone-beam computed tomography (CBCT). A total of 65 patients aged 15–50 years underwent CBCT analysis. Measurements were taken in three anterior regions (between and adjacent to central/lateral incisors and canines) at four vertical levels (2 mm, 4 mm, 6 mm, and 8 mm from the alveolar crest). Parameters included interdental width (IDW), buccopalatal bone depth (BPD), and distances from ideal implant points (IPPs) to adjacent structures. Descriptive statistics included means, standard deviations, confidence intervals, and frequency distributions. Statistical analysis revealed age-related differences, with subjects aged 21–30 showing higher CP-IPP and IDW values, and those aged 15–20 showing higher BPD values. Gender differences were noted in IDW and BPD, but not in CP-IPP. The most favorable IDW (≥3 mm) was observed in regio 1 at level A, while unfavorable values were found in regio 2′ at levels C and D. Positive correlations between IDW and BPD were found in multiple regions and levels. These results may guide safer and more predictable TAD placement. Considering that radiographic analysis forms the basis of this study, future in vivo studies are needed to confirm the practical impact of the proposed measurements.

1. Introduction

Temporary anchorage devices (TADs), commonly referred to as mini-implants or miniscrews, represent small but effective tools in orthodontics that provide stable support during tooth movement [1]. By facilitating enhanced anchorage control, they contribute to improved treatment efficiency and simplify complex orthodontic mechanics, ultimately allowing for faster and more predictable outcomes [2,3].
In clinical orthodontics, mini-implants placed in the anterior maxilla serve multiple purposes, including the intrusion of over-erupted incisors, midline deviation correction, space closure, and the management of anterior open bite cases [4,5,6]. Additionally, they offer dependable anchorage for managing dental asymmetries and are frequently used to optimize space distribution in preparation for prosthetic restorations [7].
The current literature indicates that orthodontic mini-implants are typically inserted into the buccal interdental bone of the maxillary arch [8]. In certain clinical scenarios, the anterior maxilla represents a necessary site for mini-implant placement. Fortunately, this region often exhibits favorable anatomical features, such as adequate cortical bone thickness and easy surgical access, which make it suitable for such procedures. Nevertheless, it also presents anatomical limitations, most notably the presence of the nasopalatine canal (NPC) in the midline, which contains the nasopalatine nerve and accompanying blood vessels [9].
Accidental damage to the nasopalatine canal during mini-implant insertion may lead to adverse outcomes such as bleeding, altered sensation (paresthesia), or compromised implant stability [10]. In addition to these risks, temporary anchorage devices may also cause soft tissue irritation, injury to nearby anatomical structures, discomfort, bone resorption, and other related complications [11,12].
The risk of complications significantly increases when parameters such as mini-implant diameter, interdental bone width, buccopalatal depth, and tooth angulation are not thoroughly evaluated prior to placement [13,14,15].
Various guidelines have been established to aid in the selection of optimal insertion sites for mini-implants within the buccal interdental region [16,17]. According to these recommendations, a minimum clearance of 1 mm should be maintained from surrounding anatomical structures, including tooth roots and the mucogingival junction. Furthermore, mini-implants should be positioned at least 1 mm apical to the alveolar crest to reduce the risk of root proximity and enhance stability [11]. Placement within the mobile mucosa is associated with a higher failure rate, primarily due to the increased risk of soft tissue irritation and inflammation [18].
The region located 5 mm above the alveolar crest, corresponding to the area of the attached gingiva, is generally considered a safe soft tissue zone for mini-implant insertion [19]. Due to possible anatomical variability among individuals and the existence of mini-implant designs specifically adapted for use in mobile mucosa, bone dimensions were also assessed at greater vertical distances—namely at 6 mm and 8 mm from the alveolar crest [19].
Although current evidence suggests that anatomical landmarks are typically used to guide mini-implant site selection, there is still a lack of sufficient data regarding the relationship between radiographically defined insertion points and clinically visible dental reference structures [16,17].
Due to the restricted and anatomically sensitive nature of the insertion site, orthodontic mini-implants are designed with specific macrostructural features that facilitate mechanical stability and simplify insertion into the bone. These devices commonly exhibit a screw-like configuration and are manufactured in diameters ranging from 1 to 2 mm [11,20]. Unlike conventional dental implants, they are typically shorter—between 6 and 12 mm in length—to accommodate the available bone volume while minimizing the risk of contact with deeper anatomical structures [11].
While effective, temporary anchorage devices (TADs) are not entirely immobile, as they may undergo minor displacement, typically less than 0.5 mm. To reduce the risk of unintended contact with adjacent anatomical structures, a safety margin of 2 mm—1 mm on each side of the implant—is generally recommended [19]. Consistent with this guideline, Schnelle et al. emphasized that a minimum interdental width (IDW) of 3 mm is required to allow safe miniscrew placement [21]. The inadequate evaluation of interdental space may lead to root damage and other complications [7,9,15].
Although a mini-implant length exceeding 5 mm does not seem to have a significant effect on stability, research indicates that implant diameter plays a more critical role in achieving mechanical retention. In contrast to traditional dental implants that stabilize through osseointegration, an orthodontic MI depends on mechanical retention and may show slight mobility within the surrounding bone tissue [11].
Thorough radiographic assessment is essential for accurately determining anatomical conditions suitable for mini-implant placement and for ensuring the optimal biomechanical performance of TADs. Although orthopantomograms (OPGs) are widely used due to their broad availability, affordability, and ability to capture panoramic views of dental structures [22,23], they present notable limitations. These include reduced precision in linear measurements and image distortion, both of which may impair diagnostic accuracy [24,25]. MacDonald et al. [22] demonstrated that cone-beam computed tomography (CBCT) offers markedly better dimensional accuracy for assessing interdental regions. Their findings confirmed the value of CBCT in precisely evaluating interdental bone morphology—an essential aspect of safe TAD placement. In contrast, OPGs have been shown to underestimate critical measurements, potentially resulting in inaccurate estimations of bone width and root proximity [24,25].
Cone-beam computed tomography (CBCT) now serves as a cornerstone in modern orthodontic diagnostics, offering high-resolution, three-dimensional imaging of both dental and skeletal structures [26]. In contrast to traditional two-dimensional radiographs, CBCT provides a detailed visualization of bone density, interdental dimensions, and the spatial relationships of critical anatomical features such as dental roots and the nasopalatine canal (NPC) [27]. Such precision is essential in planning mini-implant placement, as the surrounding bone morphology greatly affects primary stability and helps minimize the risk of complications [19,28,29,30].
Emerging research highlights CBCT as a reliable tool for precisely locating optimal sites for mini-implant placement, owing to its ability to generate cross-sectional images of both the labial and palatal aspects of the alveolar bone [19,31]. Park et al. [32] demonstrated that CBCT significantly improves the accuracy of implant positioning, reduces the likelihood of root contact, and enhances initial stability. Other investigations [33,34] have supported the use of CBCT data in identifying suitable interdental regions for TAD insertion. In addition, CBCT plays a vital role in diagnosing complex orthodontic anomalies—including skeletal malocclusions, compromised airways, and temporomandibular joint disorders—surpassing the diagnostic capacity of conventional imaging techniques [25].
Thanks to its high diagnostic accuracy and lower radiation dose compared to conventional CT, CBCT is widely regarded as the gold standard for orthodontic treatment planning. An additional advantage of CBCT lies in its application for creating patient-specific surgical guides, which assist clinicians in determining optimal mini-implant insertion sites in three dimensions. However, the use of such guides may involve greater financial costs, extended treatment times, and access to advanced equipment [34,35].
Although CBCT is increasingly utilized in orthodontics, there is still a lack of comprehensive data exploring the relationship between the anatomy of the interdental septum and coronal dental landmarks in the context of TAD planning. Most previous radiographic studies have focused primarily on analyzing alveolar bone anatomy to determine safe mini-implant insertion sites, without investigating their spatial relationship to dental parameters. This study aims to fill that gap by presenting an approach that not only defines key morphometric parameters—interdental bone width (IDW) and buccopalatal depth (BPD)—to determine the radiological ideal placement point (IPP), but also examines its spatial relationship to clinically visible dental reference points, such as incisal edges, cusp tips, and contact points. By establishing these relationships, we aim to provide guidance that could potentially facilitate an easier intraoral orientation and more predictable mini-implant insertion for clinicians. This strategy may help identify optimal mini-implant insertion zones in anatomically challenging regions, ultimately minimizing risk and improving procedural predictability. The broader objective is to establish a practical link between radiographically determined sites and easily observable intraoral reference markers. As this is a radiographic analysis, future clinical studies are needed to validate the clinical applicability of these findings and to confirm the safety, success rate, and practical ease of mini-implant placement using dental parameters as intraoral reference points.

2. Materials and Methods

2.1. Study Design

This retrospective cross-sectional study was conducted at the Department of Dentistry, Faculty of Medical Sciences, University of Kragujevac, Serbia, based on CBCT scans obtained between July 2022 and April 2025. This study was approved by the institutional ethics committee (Approval ID: 01-14697) and carried out in accordance with the latest revision of the Declaration of Helsinki. The CBCT scans were originally acquired for various diagnostic and therapeutic purposes, including the evaluation of dental anomalies, pre-surgical planning, and other dental treatments. Among the reviewed cases, certain patients had undergone imaging as part of the clinical preparation for orthodontic mini-implant placement. CBCT scans with motion artifacts, metal interference, or compromised visibility of the anterior maxilla were excluded during the initial screening process. Only those individuals who met the predefined inclusion criteria were selected for further morphometric analysis, ensuring both clinical relevance and methodological consistency.
The inclusion criteria encompassed patients aged 15 to 50 years with fully erupted permanent dentition in the maxillary arch (excluding third molars), the availability of high-resolution CBCT scans, and a confirmed Serbian ethnicity, as recorded in medical documentation. The selected age groups (15–20, 21–30, 31–40, and 40+ years) were defined to represent different growth and remodeling phases relevant to bone morphology and orthodontic treatment planning. This stratification allowed for the assessment of potential age-related anatomical variations that could influence the clinical recommendations for safe and effective TAD placement [36,37]. Similar studies investigating alveolar bone morphology and TAD placement often employ comparable age group stratifications to reflect growth and remodeling phases relevant to orthodontic treatment planning [38].
Given the broad clinical use of orthodontic mini-implants in both younger individuals during the early permanent dentition phase and older adults undergoing pre-prosthetic evaluation, this study was designed to reflect a wide age spectrum for a comprehensive population-based assessment [39,40,41,42].
Patients were excluded if they exhibited clinical or radiographic signs of periodontal disease or had any pathological conditions affecting maxillary hard or soft tissues. Additional exclusion criteria included the presence of anterior malocclusions—such as severe crowding, spacing, or abnormal axial inclinations; retained deciduous teeth; fixed orthodontic appliances; as well as crown-size anomalies like microdontia or macrodontia. To minimize anatomical variability, only individuals with average-sized maxillary incisors were included [43]. All participants (or legal guardians in the case of minors) provided written informed consent. Image evaluation and morphometric measurements were performed by a dentomaxillofacial CBCT expert (M.P. and M.V.).
Two independent observers who made the measurement were blind to the protocol and showed high inter-rater reliability (Pearson’s r = 0.95). The mean value for each parameter was taken for further evaluation.
Sample size estimation was conducted using G*Power software (version 3.1.9.6), applying a one-sample Wilcoxon signed-rank test from the t-test family. The calculation was based on a significance level of 0.05, a statistical power of 95%, and a medium effect size of 0.5, as recommended in the previous literature [30]. The resulting minimum sample size was determined to be 62. Ultimately, 65 patients were included in the study (23 males [35.4%] and 42 females [64.6%]), with a mean age of 29.83 ± 11.14 years. To facilitate subgroup comparisons, participants were classified into four age categories: 15–20, 21–30, 31–40, and over 40 years.

2.2. CBCT Imaging Device and Software Characteristics

All CBCT scans were acquired using the Orthophos XG 3D imaging system (Sirona Dental Systems GmbH, Bensheim, Germany) under two preset protocols: VOL1 HD (85 kV, 6 mA, exposure duration of 14.3 s) and VOL2 HD (85 kV, 10 mA, exposure duration of 5.0 s). The corresponding voxel resolutions were 160 µm and 100 µm, respectively. For each scan, the field of view was standardized to 8 × 8 cm to ensure consistency in image acquisition. Morphometric analysis was carried out using GALAXIS software (version 1.9.4, Sirona Dental Systems GmbH, Bensheim, Germany).

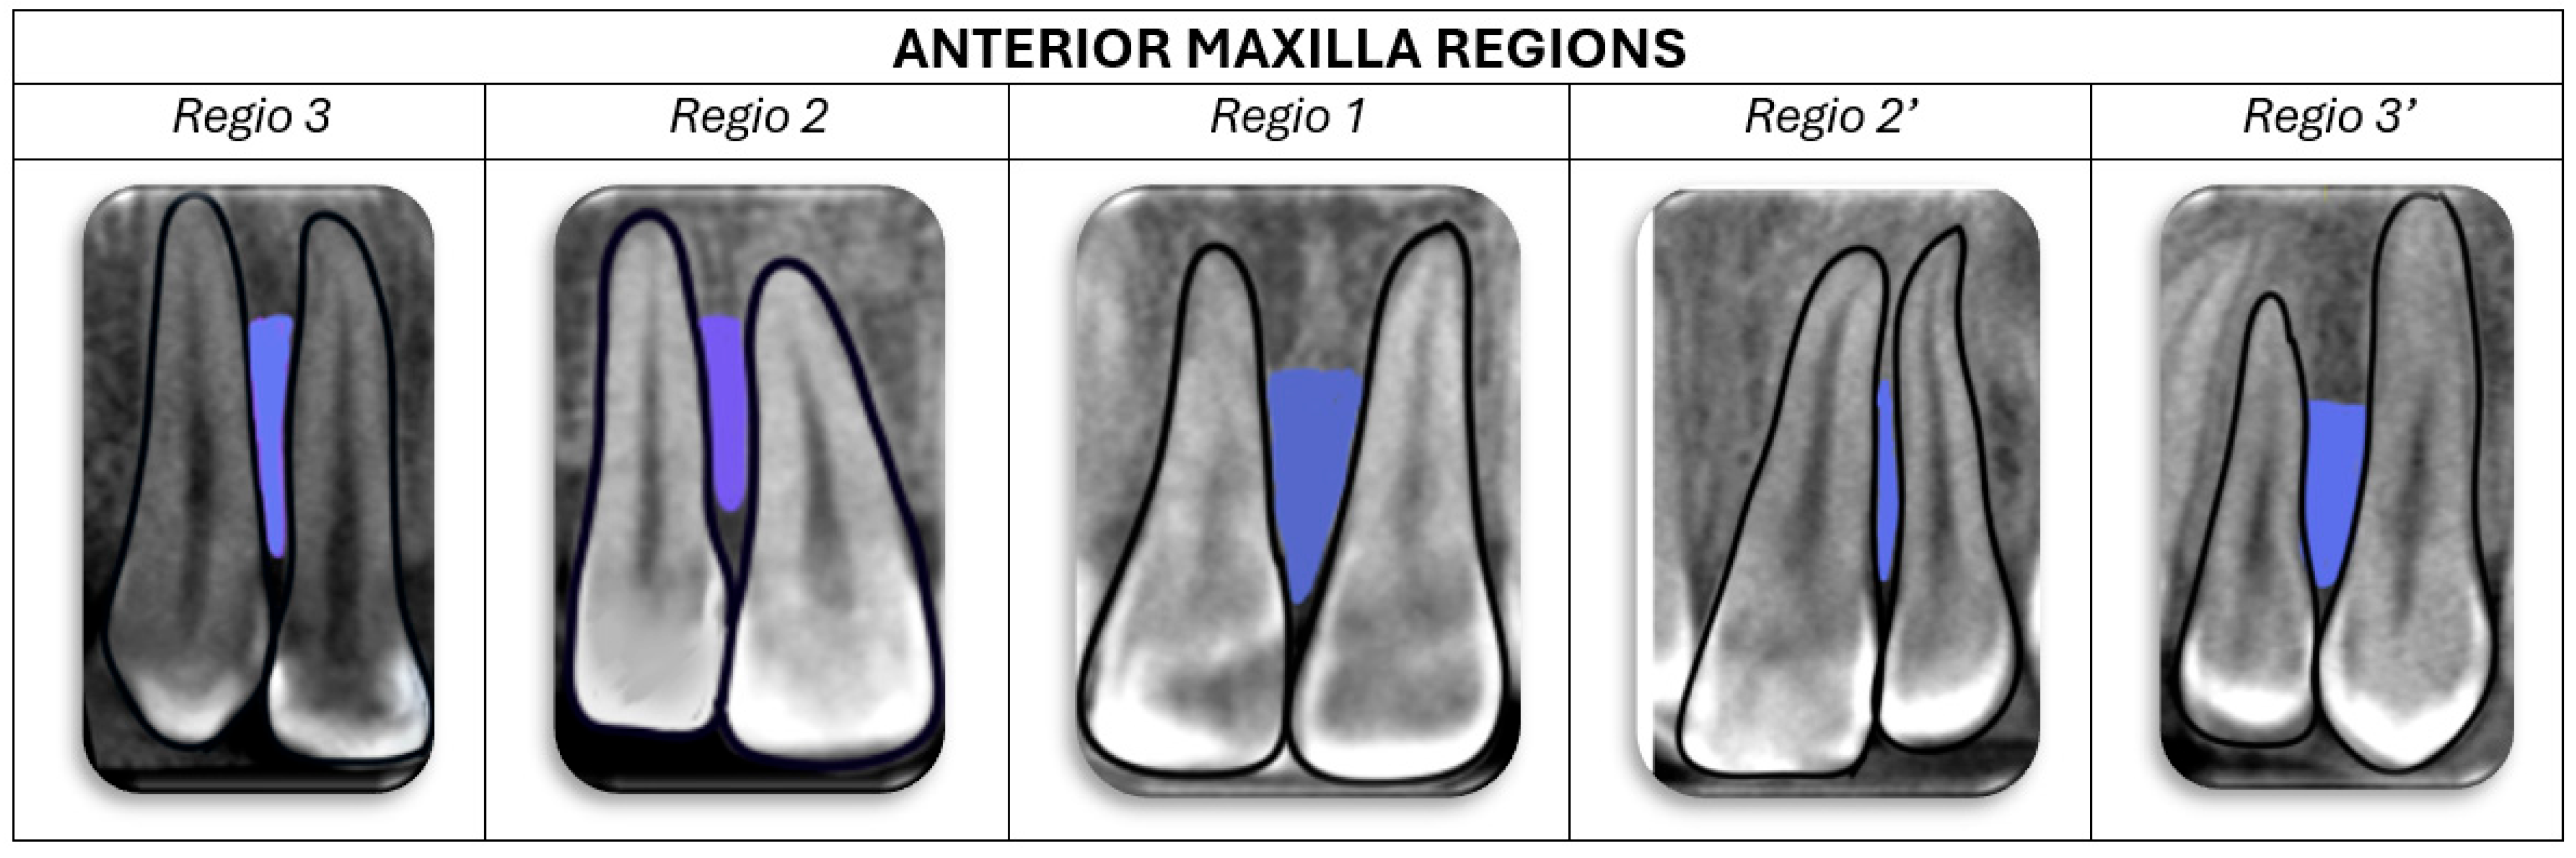
2.3. Morphometric Parameters

In accordance with the study protocol, interdental regions in the anterior maxilla were assessed by identifying specific tooth pairings. The evaluated sites included the following: the space between central incisors (regio 1), between the central and lateral incisors on the right (regio 2) and left side (regio 2′), and between the lateral incisor and canine on the right (regio 3) and left side (regio 3′), as illustrated in Figure 1.
Assessment of IPP was performed using sagittal and axial slices of the CBCT:
  • Sagittal cross-section:
For each interdental region, four horizontal reference levels were defined on the sagittal CBCT sections (Figure 2), corresponding to vertical distances from the alveolar crest:
  • Level A—8 mm from the alveolar crest;
  • Level B—6 mm from the alveolar crest;
  • Level C—4 mm from the alveolar crest;
  • Level D—2 mm from the alveolar crest.
Figure 2. Sagittal CBCT view with the marked levels of interest. The linear measurements were made at the levels of 8 mm (level A), 6 mm (level B), 4 mm (level C), and 2 mm (level D) from the alveolar crest.
Applsci 15 06866 g002
2.
Axial cross-section:
  • Buccopalatal depth (BPD)—the linear distance between buccal and palatal cortical plates (Figure 3).
* In regio 1, due to the presence of the nasopalatine canal (NPC), BPD was specifically assessed from the buccal wall of the NPC to the buccal cortical surface of the anterior maxilla (Figure 4).
Figure 3. The definition of the morphometric parameters of interest on CBCT images of the interdental space of the anterior segment of the maxilla. Axial cross-section: Selected morphometric parameters for analyses: IDW (yellow) is the smallest mesiodistal interdental distance; BPD (green) is the distance between the cortical layer of the buccal to the palatal plate, measured perpendicularly through the middle of the IDW.
Applsci 15 06866 g003
  • Interdental width (IDW)—the narrowest mesiodistal distance between the roots of adjacent teeth (Figure 3).
Measurements were performed at all four reference levels (A–D).
For the purposes of this study, an IDW of ≥3 mm was considered clinically acceptable, based on the guideline that a minimum clearance of 1 mm is needed on each side of a 1 mm diameter mini-implant to prevent contact with neighboring anatomical structures [21] (Figure 5).

2.4. Relationship Between Radiological Ideal Placement Point (IPP) and Dental Structures

After determining the BPD and IDW values, the next step was to identify the ideal placement point (IPP) for mini-implant insertion. The IPP was defined as the midpoint of the evaluated interradicular space at each level, in accordance with the previously established safety guidelines by Poggio et al. [30].
Subsequently, on sagittal CBCT slices, linear distances were measured from the IPP to three clinically visible reference points: (1) the midpoint of the incisal edge of the mesial tooth (M1), (2) the corresponding point on the distal tooth (M2), and (3) the contact point (CP) between the two adjacent crowns.
* In regio 1, 2, and 2′, both M1 and M2 were identified at the intersection between the tooth’s long axis and its incisal edge. In regio 3 and 3′, M2 was defined by the cusp tip of the canine tooth (Figure 6).

2.5. Statistical Analysis

Descriptive statistics for continuous variables included calculation of the mean, standard deviation, minimum and maximum values, and 95% confidence intervals. Categorical variables were expressed as frequencies or percentages. The Kolmogorov–Smirnov test was applied to assess the normality of data distribution. Depending on the distribution characteristics, either parametric tests (independent t-test, one-way ANOVA) or non-parametric alternatives (Mann–Whitney U test, Kruskal–Wallis test) were used. Pearson’s correlation coefficient was employed to evaluate the relationships between continuous variables. Statistical significance was set at p < 0.05. All analyses were conducted using SPSS software (version 23.0; IBM Corp., Armonk, NY, USA) (Figure 7).

3. Results

A total of 157 CBCT scans were initially reviewed, out of which 65 fulfilled all inclusion criteria and were selected for detailed morphometric assessment.
  • Interclass Correlation
The interclass correlation coefficient was determined for the variables which were measured from the same points but among different teeth. In Table 1, we provide the interclass correlations with 95% confidence intervals, along with the mean differences between the two examiners that performed measurements of the variables of interest. We grouped measurements into four groups based on the similarity of the measurement points: contact point (CP), ideal implant points (IPPs), interdental width (IDW), and buccopalatal depth (BPD). All measurements showed excellent reliability (ICC value > 0.9).
  • Demographics and Group Classification
Among the 65 participants who met the eligibility requirements, 23 were male (35.4%) and 42 were female (64.6%), as shown in Table 1. The distribution of genders was considered adequate for evaluating clinically relevant parameters across both sexes. The average age of the included individuals was 29.83 ± 11.14 years. For comparative purposes, the patients were divided into four age-based categories. The descriptive presentation of the subjects included in the analysis is presented in Table 2.
  • Statistical Differences Between the Groups
Statistically significant differences between age categories were identified for multiple variables, including BPD at level D in regio 2′, and IDW at level D in regio 1, as well as levels C and D in regio 2′. Variations related to age were also noted in the linear distances from the IPP: specifically, C1–IPP measurements in regio 1, 2, 2′, and 3′, C2–IPP in regio 1 and 2′, and CP–IPP across all evaluated regions. Gender-based differences were found in regio 1, particularly in BPD values at levels A, B, and C, and in IDW at level D. All statistically relevant comparisons are presented in Table 3, color-coded by the different vertical and horizontal measurements. It is important to emphasize that the age group 21–30 had the highest CP-IPP values and 15–20 had the lowest values, while there were no gender-related significant differences between the different regions. IDW also showed the highest values among the age group 21–30, the lowest among 15–20, and only one value showed a significant difference in gender (males had a higher median value than females). BPD showed opposite results, where significantly lower values were seen among the 21–30 group and the highest values were among the 15–20 group, with the male gender found to have higher values. This proves that morphometric values may depend on gender and age group.
  • Descriptive Data on Mean Interdental Width and Buccopalatal Depth
The mean interdental width (IDW) values recorded at each measurement level for both the right and left quadrants are summarized in Figure 8, while the corresponding buccopalatal depth (BPD) values are displayed in Figure 9. Interdental width had the highest values at level A between all observed teeth both on the left and right;and it exceeded favorable values of 3 mm at levels A and B between the central incisors and on both the left and right between the lateral incisor and canine. The most favorable IDW results—defined as widths exceeding 3 mm—were observed in regio 1 at level A (87.7%). In contrast, regio 2′ demonstrated the lowest proportion of patients with an adequate IDW, with only 4.6% showing values above 3 mm at levels C and D, as indicated in Table 4. The mean values for the IPP considering the length of M1, M2, and CP can be seen in Figure 10 and Figure 11.
  • Correlation Analysis
The mean interdental width (IDW) values and corresponding buccopalatal depth (BPD) values are displayed in Figure 8 and Figure 9. We wanted to examine the existence of a correlation between IDW and BPD in different regio and levels on the same side. Pearson correlation found significantly positive but weak correlations between them at regio 1 (levels C and D) and regio 2 (levels B and C). A significant positive and strong correlation was found at regio 3 (levels A and B) and moderate correlation at levels C and D. A significant positive and weak correlation was found at regio 3′ (levels A, B, C, D) (Table 5). We can expect that at the mentioned regions, an increasing value of IDW on a certain level is followed by an increasing value of BPD at that level.

4. Discussion

This study highlighted the significance of sufficient bone volume as a prerequisite for the successful placement of temporary anchorage devices (TADs). Limited interdental space between adjacent tooth roots often complicates the insertion process, making precise preoperative planning essential [20]. Fortunately, many of these challenges—such as the risk of root perforation—can be addressed through detailed radiological assessment. Cone-beam computed tomography (CBCT) enables the detailed three-dimensional evaluation of the dentomaxillofacial complex, with broad diagnostic applications including the assessment of bone morphology and its dimensions, the detection of pathological lesions, the evaluation of skeletal asymmetries, and the volumetric analysis of both bone structures and upper airway spaces when clinically indicated [44]. In this context, cone-beam computed tomography (CBCT) remains the most reliable imaging tool for accurate dentofacial analysis, providing the morphometric data required for safe and effective TAD placement [19].
The thickness of soft tissues represents a critical factor influencing the primary stability of orthodontic mini-implants (TADs), particularly with respect to their placement in different regions of the maxilla and mandible. Cha et al. [45] demonstrated that the palatal masticatory mucosa may range from 2.5 to even 4 mm in posterior areas, while buccal gingival tissue is significantly thinner, especially in the anterior maxilla. This variation in soft tissue thickness may affect implant biomechanics, as a thicker mucosal layer can increase the distance to the cortical bone and compromise the quality of initial anchorage. Furthermore, the systematic review by Schwarz et al. [46] revealed a statistically significant difference in buccal gingival thickness between the maxilla and mandible within the esthetic zone, with the mandibular gingiva being approximately 0.16 mm thinner. These findings underscore the importance of considering not only skeletal and anatomical features but also the morphology and thickness of soft tissues when planning TAD placement, particularly in areas with a thin gingiva that may be more prone to recession and implant failure.
At the beginning of the analysis, morphometric parameters were examined across different age and gender groups. In regio 1, significant differences were observed in both buccopalatal depth (BPD) and interdental width (IDW) between male and female subjects. Contrary to the findings reported by Deguchi et al. [14], who did not detect gender-based variations, our study emphasizes the relevance of individualized anatomical characteristics when planning orthodontic treatment.
Moreover, the current study identified age-related differences, whereas Deguchi and colleagues found no such associations [14]. In line with our findings, Dumitrache et al. observed that older patients exhibited reduced BPD in the lateral as well as the anterior maxillary region [47]. This reduction necessitated the use of smaller TADs to ensure secure and effective placement. Our findings revealed that both interdental width (IDW) and CP–IPP distances tend to increase with age, most notably in the deeper measurement levels (C and D). Although patients with periodontal disease were excluded from this study, these age-related changes may result from the gradual remodeling and leveling of the alveolar ridge, a process that naturally occurs over time [48,49]. This anatomical shift should be taken into account when relying on coronal dental landmarks to guide the determination of the ideal insertion point for mini-implants.
Analysis of interdental width (IDW) revealed that the highest mean IDW was found in regio 1 at level A (4.02 mm), followed by level B in the same region (3.45 mm), while the lowest was in regio 2′ level D (1.72 mm), as shown in Figure 8. These observations align with the findings from different studies [50], including those by Lee et al., which highlighted mesiodistal spaces exceeding 3 mm at the 8 mm level in the anterior maxilla [51]. In contrast, Poggio et al. reported the largest IDW values between the central and lateral incisor at the 6 mm level from the alveolar crest. The results of our research did not demonstrate a sufficient amount of IDW at any of the measured levels in these regions (2 and 2′). Accordingly, regio 1, 3, and 3′ showed satisfactory IDW values at levels A and B (over 50% of patients) (Table 4), suggesting that the safest zones regarding sufficient interdental space were between the central incisors and between lateral incisors and canines. Conversely, regions between central and lateral incisors demanded more detailed assessments to avoid complications due to limited bone dimensions.
This study also assessed buccopalatal depth (BPD) across all levels (A, B, C, and D), as shown in Figure 9. The literature suggests that commonly used TAD lengths range from 6 to 12 mm with diameters of 1–2 mm [19]. In the levels with sufficient IDW (A and B), the BPD ranges from 7 to 8 mm; the highest value is observed in regio 2, level A (8.07 mm), while the lowest is in regio 1, level B (7.26 mm). This information is clinically important, as smaller morphometric values of the BPD require shorter TADs of approximately 6–8 mm. Similar conclusions were reported by Purmal et al., emphasizing safe zones in terms of the BPD between the lateral incisors and canines [19]. An additional anatomical limitation that must be considered for MI placement in regio 1 is the NPC. Based on our findings, the TAD diameter placed between the central incisors should not exceed 7 mm in length. This is consistent with the observations of Milanovic and coworkers, who reported a similar bone volume between the buccal cortex and the buccal wall of the nasopalatine canal [52]. Nonetheless, this region necessitates a thorough CBCT evaluation during the planning of an MI placement.
As the IDW values indicate that the interdental placement of MI in the anterior maxilla is safer at more apical levels, another anatomical characteristic that needs to be considered is the soft tissue. The attached gingiva is usually positioned up to 5 mm apical from the alveolar bone crest, which represents the optimal region for MI insertion [19]. In the anterior maxilla, TAD placement is planned near the mucogingival junction (5 mm from the alveolar crest and above), which may lead to the elevated risks of reduced stability, MI loss, and chronic soft tissue inflammation [12,53]. Solutions such as modified screw heads [54], variations in thread design [55], or adjustments to the insertion angle may provide additional stability [56].
The final section of this study included three reference points located on dental structures (midpoint of incisal edge, cusp tips, and contact points). These dental landmarks, when connected to the previously identified IPP, give linear measurements which may contribute to better intraoral orientation and easier and safer MI placement. The evaluated parameters (M1-IPP, M2-IPP, and CP-IPP) showed no significant differences between the left and right sides. The average M1-IPP and M2-IPP measurements were 15.52 mm and 15.02 mm, respectively. The highest mean CP-IPP length was noted in regio 1 (13.3 mm), whereas the lowest was in regio 3′ (12.54 mm). All measurements showed a positive correlation between left and right quadrants. This may be of clinical significance, because measurements from one side of the maxilla can be applied to the opposite side, where some dental landmarks may be absent.
Recent advancements in digital orthodontics emphasize the role of artificial intelligence (AI) and augmented reality (AR) in enhancing diagnostic precision and clinical outcomes. AI-based CBCT analysis has demonstrated high accuracy in identifying edentulous regions and evaluating bone volume, with reported precision levels of up to 96% for the mandible and 83% for the maxilla [57]. Such systems automate anatomical segmentation and suggest optimal implant sites, thereby improving clinical efficiency and reducing human error.
Augmented reality (AR) has also gained attention in guided implantology. Studies report that AR-guided navigation enables improved accuracy in TAD insertion, with mean positional deviations ranging between 0.9 and 1.2 mm and angular deviations around 3.96°, significantly outperforming freehand techniques [58]. Additionally, AR facilitates the enhanced visualization of anatomical landmarks and enables real-time guidance during surgery.
Integrating AI and AR into orthodontic implant planning aligns with current trends in digital dentistry and provides a pathway toward more predictable, efficient, and minimally invasive treatments. Future clinical protocols should explore these technologies as part of the standard workflow in anchorage planning.
Furthermore, digital surgical guide systems represent another emerging technology that could enhance the accuracy of TAD placement. When combined with AI-driven planning and AR navigation, these guides offer the potential for semi- or fully guided insertion protocols based on individualized CBCT-derived anatomical data. Their use may reduce operator variability, prevent root proximity, and improve the reproducibility of implant positioning. Although such technologies are not yet routine in orthodontics, they show promise in bridging the gap between virtual planning and clinical execution [59]. Based on the available public data, we have not identified any studies employing a similar methodological approach for morphometric evaluations. By focusing on these specific points, the research contributes to the existing literature on anterior maxillary anatomy. Using three clinically visible reference points for linear measurements enhances the identification of optimal TAD placement sites, making procedures more predictable.
Unlike previous studies that focused solely on bone dimensions and anatomical safety zones, the present study introduces the novel concept of correlating radiographically defined ideal implant points with readily observable intraoral dental landmarks. This relationship may help clinicians orient more easily during implant placement, especially in anatomically demanding regions.
While the findings hold clinical significance, this study has limitations, including a sample size that despite being statistically justified, may not encompass broader anatomical variations or ethnic differences. Although the study was conducted exclusively on a Serbian population to ensure sample homogeneity, we acknowledge that this may limit the generalizability of the findings to other ethnic groups, as anatomical variability can exist between populations [60]. Therefore, further studies on different ethnic groups are recommended to confirm the broader applicability of the findings. Additionally, this study focused exclusively on radiographic parameters without clinically validating the ideal placement points through actual TAD insertions and follow-ups. The study did not evaluate bone density, which is also important for implant stability. Nonetheless, soft tissue thickness and keratinization were not assessed in this study, representing a limitation that should be addressed in future research. Future studies should incorporate clinical outcomes following mini-implant placement, compare different insertion angles, and consider the dynamic interactions with adjacent teeth and periodontal tissues.

5. Conclusions

In conclusion, this morphometric analysis revealed potential correlations between dental structures and interdental bone characteristics, such as IDW and BPD. While this approach offers valuable guidance for clinicians during TAD planning, individualized radiographic assessments using CBCT remain indispensable. Specifically, certain radiological landmarks, such as the cuspid point, are clinically visible, offering potential reference markers for intraoral evaluations. As this study was based on radiographic data without clinical outcome validation, future research should include in vivo studies to confirm the safety, success rate, and practical applicability of the proposed insertion zones, as well as to explore the reliability of such landmarks in guiding intraoral measurements and implant planning.

Author Contributions

Conceptualization, I.J., P.M., G.R. and A.A.; methodology, I.J., M.S. and A.A.; software, I.J. and A.A.; validation, I.J. and A.A.; formal analysis, I.J., P.M., M.V., N.J., D.S., G.R. and A.A.; investigation, I.J., P.M., M.V., M.Z.S., V.R., D.S., G.R. and A.A.; resources, I.J., G.R. and A.A.; writing—original draft preparation, I.J., P.M., M.V., N.J., D.S., G.R. and A.A.; writing—review and editing, I.J., P.M., M.V., J.M., M.Z.S., N.J., M.S., V.R., D.S., G.R. and A.A.; visualization, I.J., N.J., G.R. and A.A.; project administration, I.J. and A.A.; funding acquisition, D.S. and G.R. All authors have read and agreed to the published version of the manuscript.

Funding

This work was supported by the Faculty of Medical Sciences (JP 05/22), University of Kragujevac, Serbia.

Institutional Review Board Statement

This study was conducted in accordance with the Declaration of Helsinki, and approved by the Institutional Ethics Committee of Faculty of Medical Sciences, University of Kragujevac, Serbia (approval ID 01-14697).

Informed Consent Statement

Patient consent was waived due to scientific purposes.

Data Availability Statement

Data available upon request from authors.

Acknowledgments

This work was supported by the Faculty of Medical Sciences University of Kragujevac, Serbia.

Conflicts of Interest

The authors declare no conflicts of interest.

References

  1. Baxi, S.; Bhatia, V.; Tripathi, A.; Prasad Dubey, M.; Kumar, P.; Mapare, S. Temporary Anchorage Devices. Cureus 2023, 15, e44514. [Google Scholar] [CrossRef]
  2. Cousley, R.R.; Sandler, P.J. Advances in orthodontic anchorage with the use of mini-implant techniques. Br. Dent. J. 2015, 218, E4. [Google Scholar] [CrossRef] [PubMed]
  3. Liu, Y.; Yang, Z.J.; Zhou, J.; Xiong, P.; Wang, Q.; Yang, Y.; Hu, Y.; Hu, J.T. Comparison of Anchorage Efficiency of Orthodontic Mini-implant and Conventional Anchorage Reinforcement in Patients Requiring Maximum Orthodontic Anchorage: A Systematic Review and Meta-analysis. J. Evid. Based Dent. Pract. 2020, 20, 101401. [Google Scholar] [CrossRef] [PubMed]
  4. Marquezan, M.; de Souza, M.M.G.; Araújo, M.T.; Oliveira, D.D. Evaluating the center of resistance of upper incisors by different finite element models. Dent. Press. J. Orthod. 2010, 15, 88–92. [Google Scholar]
  5. Park, H.S.; Kwon, T.G.; Kwon, O.W. Treatment of open bite with microscrew implant anchorage. Am. J. Orthod. Dentofac. Orthop. 2004, 126, 627–636. [Google Scholar] [CrossRef]
  6. Parayaruthottam, P.; Antony, V. Midline Mini-Implant-Assisted True Intrusion of Maxillary Anterior Teeth for Improved Smile Esthetics in Gummy Smile. Contemp. Clin. Dent. 2021, 12, 332–335. [Google Scholar] [CrossRef] [PubMed]
  7. Panaite, T.; Balcos, C.; Savin, C.; Olteanu, N.D.; Karvelas, N.; Romanec, C.; Vieriu, R.M.; Chehab, A.; Zetu, I. Exploring the use, perceptions, and challenges of mini-implants in orthodontic practice: A survey study. Front. Oral Health 2025, 5, 1483068. [Google Scholar] [CrossRef]
  8. Murugesan, A.; Dinesh, S.P.S.; Muthuswamy Pandian, S.; Ashwin Solanki, L.; Alshehri, A.; Awadh, W.; Alzahrani, K.J.; Alsharif, K.F.; Alnfiai, M.M.; Mathew, R.; et al. Evaluation of Orthodontic Mini-Implant Placement in the Maxillary Anterior Alveolar Region in 15 Patients by Cone Beam Computed Tomography at a Single Center in South India. Med. Sci. Monit. 2022, 28, e937949. [Google Scholar] [CrossRef]
  9. Arnaut, A.; Milanovic, P.; Vasiljevic, M.; Jovicic, N.; Vojinovic, R.; Selakovic, D.; Rosic, G. The Shape of Nasopalatine Canal as a Determining Factor in Therapeutic Approach for Orthodontic Teeth Movement-A CBCT Study. Diagnostics 2021, 11, 2345. [Google Scholar] [CrossRef]
  10. Vasiljevic, M.; Milanovic, P.; Jovicic, N.; Vasovic, M.; Milovanovic, D.; Vojinovic, R.; Selakovic, D.; Rosic, G. Morphological and Morphometric Characteristics of Anterior Maxilla Accessory Canals and Relationship with Nasopalatine Canal Type-A CBCT Study. Diagnostics 2021, 11, 1510. [Google Scholar] [CrossRef]
  11. Nanda, R.; Uribe, F. Temporary Anchorage Devices in Orthodontics, 2nd ed.; Mosby Elsevier: St. Louis, MI, USA, 2019. [Google Scholar]
  12. Gurdan, Z.; Szalma, J. Evaluation of the success and complication rates of self-drilling orthodontic mini-implants. Niger. J. Clin. Pract. 2018, 21, 546–552. [Google Scholar] [PubMed]
  13. Mohammed, H.; Wafaie, K.; Rizk, M.Z.; Almuzian, M.; Sosly, R.; Bearn, D.R. Role of anatomical sites and correlated risk factors on the survival of orthodontic miniscrew implants: A systematic review and meta-analysis. Prog. Orthod. 2018, 19, 36. [Google Scholar] [CrossRef]
  14. Deguchi, T.; Nasu, M.; Murakami, K.; Yabuuchi, T.; Kamioka, H.; Takano-Yamamoto, T. Quantitative evaluation of cortical bone thickness with computed tomographic scanning for orthodontic implants. Am. J. Orthod. Dentofac. Orthop. 2006, 129, e7–e12. [Google Scholar] [CrossRef] [PubMed]
  15. Ferrillo, M.; Nucci, L.; Gallo, V.; Bruni, A.; Montrella, R.; Fortunato, L.; Giudice, A.; Perillo, L. Temporary anchorage devices in orthodontics: A bibliometric analysis of the 50 most-cited articles from 2012 to 2022. Angle Orthod. 2023, 93, 591–602. [Google Scholar] [CrossRef]
  16. Chang, C.H.; Lin, L.Y.; Roberts, W.E. Orthodontic bone screws: A quick update and its promising future. Orthod. Craniofac. Res. 2020, 24, 75–82. [Google Scholar] [CrossRef]
  17. Ozdemir, F.; Tozlu, M.; Germec-Cakan, D. Cortical bone thickness of the alveolar process measured with cone-beam computed tomography in patients with different facial types. Am. J. Orthod. Dentofac. Orthop. 2013, 143, 190–196. [Google Scholar] [CrossRef]
  18. Inchingolo, A.M.; Malcangi, G.; Costa, S.; Fatone, M.C.; Avantario, P.; Campanelli, M.; Piras, F.; Patano, A.; Ferrara, I.; Di Pede, C.; et al. Tooth Complications after Orthodontic Miniscrews Insertion. Int. J. Environ. Res. Public Health 2023, 20, 1562. [Google Scholar] [CrossRef] [PubMed]
  19. Purmal, K.; Alam, M.; Pohchi, A.; Abdul Razak, N.H. 3D Mapping of Safe and Danger Zones in the Maxilla and Mandible for the Placement of Intermaxillary Fixation Screws. PLoS ONE 2013, 8, e84202. [Google Scholar] [CrossRef]
  20. Lim, H.J.; Choi, Y.J.; Evans, C.A.; Hwang, H.S. Predictors of initial stability of orthodontic miniscrew implants. Eur. J. Orthod. 2011, 33, 528–532. [Google Scholar] [CrossRef]
  21. Schnelle, M.A.; Beck, F.M.; Jaynes, R.M.; Huja, S.S. A radiographic evaluation of the availability of bone for placement of miniscrews. Angle Orthod. 2004, 74, 832–837. [Google Scholar]
  22. MacDonald, D.; Telyakova, V. An Overview of Cone-Beam Computed Tomography and Dental Panoramic Radiography in Dentistry in the Community. Tomography 2024, 10, 1222–1237. [Google Scholar] [CrossRef] [PubMed]
  23. Caetano, G.R.; Soares, M.Q.; Oliveira, L.B.; Junqueira, J.L.; Nascimento, M.C. Two-dimensional radiographs versus cone-beam computed tomography in planning mini-implant placement: A systematic review. J. Clin. Exp. Dent. 2022, 14, e669–e677. [Google Scholar] [CrossRef] [PubMed]
  24. Abbassy, M.A.; Sabban, H.M.; Hassan, A.H.; Zawawi, K.H. Evaluation of mini-implant sites in the posterior maxilla using traditional radiographs and cone-beam computed tomography. Saudi Med. J. 2015, 36, 1336–1341. [Google Scholar] [CrossRef] [PubMed]
  25. Kapila, S.; Conley, R.S.; Harrell, W.E., Jr. The current status of cone beam computed tomography imaging in orthodontics. Dentomaxillofac. Radiol. 2011, 40, 24–34. [Google Scholar] [CrossRef]
  26. De Grauwe, A.; Ayaz, I.; Shujaat, S.; Dimitrov, S.; Gbadegbegnon, L.; Vande Vannet, B.; Jacobs, R. CBCT in orthodontics: A systematic review on justification of CBCT in a paediatric population prior to orthodontic treatment. Eur. J. Orthod. 2019, 41, 381–389. [Google Scholar] [CrossRef]
  27. Elhammali, N.A.; Gupta, P.; Deb, S.; Chhaparwal, A.; Mohanty, R.; Tiwari, S. RNR Evaluation of anterior maxilla bone condition using CBCT for placing dental implant. Bioinformation 2024, 20, 1038–1041. [Google Scholar] [CrossRef]
  28. DeVos, W.; Casselman, J.; Swennen, G.R. Cone beam computerized tomography (CBCT) imaging of oral and maxillofacial region: A systemic review of literature. Int. J. Oral Maxillofac. Surg. 2009, 38, 609–625. [Google Scholar] [CrossRef]
  29. Wu, Y.; Xu, Z.; Tan, L.; Tan, L.; Zhao, Z.; Yang, P.; Li, Y.; Tang, T.; Zhao, L. Orthodontic mini-implant stability under continuous or intermittent loading: A histomorphometric and biomechanical analysis. Clin. Implant. Dent. Relat. Res. 2015, 17, 163–172. [Google Scholar] [CrossRef]
  30. Poggio, P.M.; Incorvati, C.; Velo, S.; Carano, A. “Safe zones”: A guide for miniscrew positioning in the maxillary and mandibular arch. Angle Orthod. 2006, 76, 191–197. [Google Scholar]
  31. Zago, H.; Navarro, R.L.; Laranjeira, V.; Fernandes, T.M.; Conti, A.C.; Oltramari, P.V. 3-D Evaluation of temporary skeletal anchorage sites in the maxilla. J. Clin. Exp. Dent. 2021, 13, e1131–e1139. [Google Scholar] [CrossRef]
  32. Park, J.; Cho, H.J. Three-dimensional evaluation of interradicular spaces and cortical bone thickness for the placement and initial stability of microimplants in adults. Am. J. Orthod. Dentofac. Orthop. 2019, 136, 314.e1–314.e12. [Google Scholar] [CrossRef] [PubMed]
  33. Leo, M.; Cerroni, L.; Pasquantonio, G.; Condò, S.G.; Condò, R. Temporary anchorage devices (TADs) in orthodontics: Review of the factors that influence the clinical success rate of the mini-implants. Clin. Ter. 2016, 167, e70–e77. [Google Scholar] [PubMed]
  34. Vasoglou, G.; Stefanidaki, I.; Apostolopoulos, K.; Fotakidou, E.; Vasoglou, M. Accuracy of Mini-Implant Placement Using a Computer-Aided Designed Surgical Guide, with Information of Intraoral Scan and the Use of a Cone-Beam CT. Dent. J. 2022, 10, 104. [Google Scholar] [CrossRef] [PubMed]
  35. Suzuki, E.Y.; Suzuki, B. Accuracy of miniscrew implant placement with a 3-dimensional surgical guide. J. Oral Maxillofac. Surg. 2008, 66, 1245–1252. [Google Scholar] [CrossRef]
  36. Zheng, Y.; Zhu, C.; Zhu, M.; Lei, L. Difference in the alveolar bone remodeling between the adolescents and adults during upper incisor retraction: A retrospective study. Sci. Rep. 2022, 12, 9161. [Google Scholar] [CrossRef]
  37. Centeno, A.C.T.; Fensterseifer, C.K.; Chami, V.O.; Ferreira, E.S.; Marquezan, M.; Ferrazzo, V.A. Correlation between cortical bone thickness at mini-implant insertion sites and age of patient. Dent. Press. J. Orthod. 2022, 27, e222098. [Google Scholar] [CrossRef]
  38. Fayed, M.M.; Pazera, P.; Katsaros, C. Optimal sites for orthodontic mini-implant placement assessed by cone beam computed tomography. Angle Orthod. 2010, 80, 939–951. [Google Scholar] [CrossRef]
  39. Hou, Z.; Qu, X.; Hou, L.; Ren, F. Comparison between effects of mini-implant anchorage and face-bow anchorage in orthodontics for children. J. Clin. Pediatr. Dent. 2024, 48, 198–203. [Google Scholar]
  40. Fan, Y.; Han, B.; Zhang, Y.; Guo, Y.; Li, W.; Chen, H.; Meng, C.; Penington, A.; Schneider, P.; Pei, Y.; et al. Natural reference structures for three-dimensional maxillary regional superimposition in growing patients. BMC Oral Health 2023, 23, 655. [Google Scholar]
  41. Sandler, J.; Murray, A.; Thiruvenkatachari, B.; Gutierrez, R.; Speight, P.; O’Brien, K. Effectiveness of 3 methods of anchorage reinforcement for maximum anchorage in adolescents: A 3-arm multicenter randomized clinical trial. Am. J. Orthod. Dentofac. Orthop. 2014, 146, 10–20. [Google Scholar] [CrossRef]
  42. Maino, G.B.; Maino, G.; Dalessandri, D.; Paganelli, C. Orthodontic correction of malpositioned teeth before restorative treatment: Efficiency improvement using Temporary Anchorage Devices (TADs). Orthod. Fr. 2016, 87, 367–373. [Google Scholar] [CrossRef] [PubMed]
  43. Ahmed, N.; Halim, M.S.; Aslam, A.; Ghani, Z.A.; Safdar, J.; Alam, M.K. An Analysis of Maxillary Anterior Teeth Crown Width-Height Ratios: A Photographic, Three-Dimensional, and Standardized Plaster Model’s Study. BioMed Res. Int. 2022, 2022, 4695193. [Google Scholar] [CrossRef] [PubMed]
  44. Mahmoud, Y.M.; Samsudin, A.B.R.; Al-Bayatti, S.; Pattanaik, S.; Gaballah, K.; Badran, S.; Manila, N.; Kamath, V.; Mathew, A.; Shetty, S.R.; et al. A Study on the Association between Skeletal Malocclusion, Upper Airway Cross-Sectional Area, and Upper Airway Volume Using CBCT Scans. Eur. J. Gen. Dent. 2025. [Google Scholar] [CrossRef]
  45. Schwarz, L.; Andrukhov, O.; Rausch, M.A.; Rausch-Fan, X.; Jonke, E. Difference in Buccal Gingival Thickness between the Mandible and Maxilla in the Aesthetic Zone: A Systematic Review and Meta-Analysis. J. Clin. Med. 2024, 13, 1789. [Google Scholar] [CrossRef] [PubMed] [PubMed Central]
  46. Cha, B.K.; Lee, Y.H.; Lee, N.K.; Choi, D.S.; Baek, S.H. Soft tissue thickness for placement of an orthodontic miniscrew using an ultrasonic device. Angle Orthod. 2008, 78, 403–408. [Google Scholar] [CrossRef] [PubMed]
  47. Dumitrache, M.; Grenard, A. Mapping mini-implant anatomic sites in the area of the maxillary first molar with the aid of the NewTom 3G® system. Orthod. Fr. 2010, 81, 287–299. [Google Scholar] [CrossRef]
  48. Ichiki, S.; Muraoka, H.; Hirahara, N.; Ito, K.; Okada, H.; Kaneda, T. Age affects alveolar bone height and width in patients undergoing dental implant treatment: Findings from computed tomography imaging. J. Hard Tissue Biol. 2021, 30, 383–388. [Google Scholar] [CrossRef]
  49. Georgieva, I.; Damyanova, D.M.; Miteva, M. Interdental area in the aesthetic zone of maxilla—Variations of distance between interdental alveolar crest and interdental contact point in relation with age and sex. Int. J. Sci. Res. (IJSR) [Internet] 2017, 6, 566–569. [Google Scholar]
  50. Bittencourt, L.P.; Raymundo, M.V.; Mucha, J.N. The optimal position for insertion of orthodontic miniscrews. Rev. Odontol. 2011, 26, 133–138. [Google Scholar]
  51. Lee, K.J.; Joo, E.; Kim, K.D.; Lee, J.S.; Park, Y.C.; Yu, H.-S. Computed tomographic analysis of tooth-bearing alveolar bone for orthodontic miniscrew placement. Am. J. Orthod. Dentofac. Orthop. 2009, 135, 486–494. [Google Scholar] [CrossRef]
  52. Milanovic, P.; Selakovic, D.; Vasiljevic, M.; Jovicic, N.U.; Milovanović, D.; Vasovic, M.; Rosic, G. Morphological Characteristics of the Nasopalatine Canal and the Relationship with the Anterior Maxillary Bone-A Cone Beam Computed Tomography Study. Diagnostics 2021, 11, 915. [Google Scholar] [CrossRef] [PubMed]
  53. Giudice, A.L.; Rustico, L.; Longo, M.; Oteri, G.; Papadopoulos, M.A.; Nucera, R. Complications reported with the use of orthodontic miniscrews: A systematic review. Korean J. Orthod. 2021, 51, 199–216. [Google Scholar] [CrossRef] [PubMed]
  54. Rai, A.J.; Datarkar, A.N.; Borle, R.M. Customised screw for intermaxillary fixation of maxillofacial injuries. Br. J. Oral Maxillofac. Surg. 2009, 47, 325–326. [Google Scholar] [CrossRef]
  55. Elkolaly, M.A.; Hasan, H.S. MH cortical screws, a revolution aryorthodontic TADs design. J. Orthod. Sci. 2022, 11, 53. [Google Scholar] [CrossRef] [PubMed]
  56. Cozzani, M.; Nucci, L.; Lupini, D.; Dolatshahizand, H.; Fazeli, D.; Barzkar, E.; Naeini, E.; Jamilian, A. The ideal insertion angle after immediate loading in Jeil, Storm, and Thunder miniscrews: A 3D-FEM study. Int. Orthod. 2020, 18, 503–508. [Google Scholar] [CrossRef]
  57. Alqutaibi, A.Y.; Algabri, R.; Ibrahim, W.I.; Alhajj, M.N.; Elawady, D. Dental implant planning using artificial intelligence: A systematic review and meta-analysis. J. Prosthet. Dent. 2024; in press. [Google Scholar]
  58. Deglow, R.; Schröder, A.; Wriedt, S.; Wiechens, B.; Nahles, S. Augmented reality-assisted orthodontic mini-implant placement: A randomized clinical trial. BMC Oral Health 2023, 23, 77. [Google Scholar]
  59. Kim, S.H.; Choi, Y.S.; Hwang, E.H.; Chung, K.R.; Kook, Y.A.; Nelson, G. Surgical positioning of orthodontic mini-implants with guides fabricated on models replicated with cone-beam computed tomography. Am. J. Orthod. Dentofac. Orthop. 2007, 131 (Suppl. 4), S82–S89. [Google Scholar] [CrossRef]
  60. Longo, B.C.; Aquaroni, L.; Zimiani, G.S.; Cléverson, S.O. Black Ethnicity Influences Gingival and Bone Thickness: A Cross-Sectional Study. Int. J. Periodontics Restor. Dent. 2024, 44, 534–543. [Google Scholar] [CrossRef]
Figure 1. The interdental space of interest for mini-implant placement was marked in all regions of the anterior maxilla: regio 1—between the central incisors, regio 2—between the right central and lateral incisor, regio 3—between the right lateral incisor and canine, regio 2′—between the left central and lateral incisor, and regio 3′—between the left lateral incisor and canine.
Applsci 15 06866 g001
Figure 4. This figure presents the buccopalatal depth in regio 1 (between central incisors), measured from the buccal wall of the NPC (marked green) to the buccal cortex of the anterior maxilla, at all examined levels.
Applsci 15 06866 g004
Figure 5. Illustration of the interdental safe zone for mini-implant placement, which is highlighted in green. The danger zone is marked in blue.
Applsci 15 06866 g005
Figure 6. IPP—ideal placement point, M1—midpoint of the incisal edge of the mesial tooth, M2—cusp tips of the distal tooth, CP—coronal part of the contact surface between two teeth.
Applsci 15 06866 g006
Figure 7. Methodological workflow of this study.
Applsci 15 06866 g007
Figure 8. Mean interdental width with marked satisfactory measurements (>3 mm).
Applsci 15 06866 g008
Figure 9. Mean buccopalatal depth measured at each level on the right and left side.
Applsci 15 06866 g009
Figure 10. Mean values with standard deviations for M1-IPP and M2-IPP lengths for each region.
Applsci 15 06866 g010
Figure 11. Mean values with standard deviations for CP-IPP lengths for each region.
Applsci 15 06866 g011
Table 1. Interclass correlation.
Interclass Correlation95% Confidence IntervalMean Difference Between Examiner 1 and Examiner 2Standard Deviation Between Examiner 1 and Examiner 2
Lower BoundUpper Bound
CP0.9810.9660.989−0.0860.166
IPP 0.9900.9840.994−0.0410.121
IDW 0.9460.9130.9670.0110.167
BPD0.9750.9590.984−0.0530.174
Table 2. Distribution of patients by gender and age groups.
Gender
FrequencyPercentValid PercentCumulative Percent
Male2335.435.435.4
Female4264.664.6100.0
Total65100.0100.0
Age groups
15–201726.226.226.2
21–301929.229.255.4
31–401320.020.075.4
40+1624.624.6100.0
Total65100.0100.0
Table 3. Connection between measured variables (only statistically significant with p value less than 0.05), vertical distances (IPP—light blue) in different regions, and horizontal distances (IDW—light green and BPD—light red) on different levels and gender and age group, color-coded.
NMeanStd. Deviation95% Confidence Interval for MeanSig.
Lower BoundUpper Bound
Regio 1
CP-IPP
15–201712.491.1111.9213.060.002
21–301913.671.1513.1114.22
31–401313.991.0813.3414.64
40+1613.151.1812.5213.78
Total6513.301.2412.9913.60
Regio 2
CP-IPP
15–201711.731.4311.0012.470.004
21–301913.431.2712.8214.05
31–401313.081.0812.4313.73
40+1612.711.6111.8513.57
Total6512.741.4912.3713.11
Regio 1
C1-IPP
15–201715.220.8614.7815.660.016
21–301915.871.0615.3616.38
31–401315.841.0715.1916.48
40+1615.270.9714.7515.78
Total6515.551.0215.2915.80
Regio 1
C2-IPP
15–201713.380.8612.9313.820.000
21–301914.830.9814.3515.30
31–401314.720.9614.1415.30
40+1614.241.3813.5114.97
Total6514.281.1913.9914.58
Regio 3
CP-IPP
15–201712.151.1411.5612.730.026
21–301912.800.9612.3413.26
31–401313.220.8212.7313.72
40+1612.620.8312.1813.06
Total6512.671.0012.4212.92
Regio 2
C1—IPP
15–201715.230.8714.7815.670.028
21–301915.980.9515.5216.43
31–401315.980.9415.4116.55
40+1615.310.9414.8115.80
Total6515.620.9715.3815.86
Regio 2′
CP-IPP
15–201711.881.3711.1812.590.003
21–301913.571.1413.0214.12
31–401312.841.2812.0613.61
40+1612.681.3711.9513.41
Total6512.761.4112.4213.11
Regio 2′
C1-IPP
15–201714.971.0714.4215.520.003
21–301916.191.0715.6716.71
31–401315.911.2815.1416.68
40+1615.161.7514.2316.10
Total6515.561.3815.2215.90
Regio 2′
C2-IPP
15–201713.381.0712.8313.940.003
21–301914.941.0614.4215.45
31–401314.650.8914.1115.19
40+1614.461.7013.5515.36
Total6514.351.3414.0214.69
Regio 3′
CP-IPP
15–201712.370.7312.0012.750.043
21–301912.570.9612.1113.04
31–401313.070.8412.5713.58
40+1612.260.5611.9612.56
Total6512.540.8312.3412.75
Regio 3′
C1-IPP
15–201714.760.8614.3215.200.023
21–301915.651.3315.0116.29
31–401315.811.1415.1216.50
40+1614.971.0314.4215.51
Total6515.281.1714.9915.57
Regio 1
IDW
Level D
15–20172.020.531.752.300.025
21–30192.600.632.292.91
31–40132.570.712.143.00
40+162.520.312.352.68
Total652.420.602.272.57
Regio 2′
IDW
Level C
15–20171.800.581.502.100.039
21–30192.240.621.942.54
31–40132.250.621.882.63
40+161.850.441.622.09
Total652.030.601.882.18
Regio 2′
IDW
Level D
15–20171.440.581.151.740.014
21–30191.990.631.682.29
31–40131.930.641.552.32
40+161.520.451.281.76
Total651.720.621.571.87
Regio 1
IDW
Level D
Male232.540.472.342.740.048
Female422.360.662.162.57
Total652.420.592.272.57
Regio 2′
BPD
Level D
15–20177.771.966.768.780.041
21–30196.371.335.737.01
31–40136.851.006.257.45
40+167.051.156.437.66
Total657.001.496.637.37
Regio 1
BPD
Level A
Male237.900.977.498.330.022
Female427.380.827.127.63
Total657.570.917.347.79
Regio 1
BPD
Level B
Male237.560.927.167.960.031
Female427.100.746.877.33
Total657.260.837.057.47
Regio 1
BPD
Level C
Male237.070.856.707.440.032
Female426.690.696.486.91
Total656.830.776.647.02
Table 4. Percentage of patients with IDW over 3 mm at each level (heat map).
RegioLevel%
1A87.7
B73.8
C40.0
D15.4
2A24.6
B18.5
C10.8
D9.2
3A70.8
B53.8
C16.9
D9.2
2′A21.5
B10.8
C4.6
D4.6
3′A70.8
B58.5
C24.6
D10.8
Color shading is used as a heat map to visually highlight percentage distribution, with darker green indicating higher values and lighter shades representing lower values.
Table 5. Pearson correlation between IDW and BPD in each region, with CI.
IDW and BPDP. CorrelationSig.95% Confidence Interval (CI)
Lower BoundUpper Bound
Regio 1 Level C0.2500.045−0.0270.399
Regio 1 Level D0.2620.0350.1180.508
Regio 2 Level B0.2580.038−0.0130.522
Regio 2 Level C0.2680.0310.0190.469
Regio 3 Level A0.6370.0000.4180.782
Regio 3 Level B0.5120.0000.2670.711
Regio 3 Level C0.4690.0000.2290.673
Regio 3 Level D0.4560.0000.1660.668
Regio 3′ Level A0.3630.0030.1160.564
Regio 3′ Level B0.3630.0030.0680.652
Regio 3′ Level C0.2710.029−0.0390.532
Regio 3′ Level D0.2710.029−0.0220.529
Disclaimer/Publisher’s Note: The statements, opinions and data contained in all publications are solely those of the individual author(s) and contributor(s) and not of MDPI and/or the editor(s). MDPI and/or the editor(s) disclaim responsibility for any injury to people or property resulting from any ideas, methods, instructions or products referred to in the content.

