Article

Influence of Coal Bottom Ash as Fine Aggregate Replacement on the Mechanical Properties of Stone Mastic Asphalt

by
Syakirah Afiza Mohammed
1,2,
Suhana Koting
1,*,
Ali Mohammed Babalghaith
3,
Mohd Hafizan Md. Isa
1 and
Faridah Hanim Khairuddin
4
1
Center for Transportation Research, Department of Civil Engineering, University of Malaya, Kuala Lumpur 50603, Malaysia
2
Faculty of Civil Engineering & Technology, Universiti Malaysia Perlis, Perlis 02600, Malaysia
3
Interdisciplinary Research Center for Construction and Building Materials, King Fahd University of Petroleum & Minerals, Dhahran 31261, Saudi Arabia
4
Department of Civil Engineering, Universiti Pertahanan Nasional Malaysia, Kuala Lumpur 57000, Malaysia
*
Author to whom correspondence should be addressed.
Appl. Sci. 2025, 15(12), 6826; https://doi.org/10.3390/app15126826
Submission received: 10 March 2025 / Revised: 12 May 2025 / Accepted: 21 May 2025 / Published: 17 June 2025
(This article belongs to the Special Issue Sustainable Materials for Asphalt Pavements)

Abstract

:
Coal bottom ash (CBA) is a waste produced by burning coal that presents possible hazards to human well-being and the environment. Rapid economic expansion has increased the utilisation of CBA, resulting in a crisis concerning the disposal of this waste. By employing waste as a replacement for natural materials, it is possible to achieve sustainable and environmentally friendly construction. This study assesses the effects of utilising CBA waste as a replacement for fine aggregate in stone mastic asphalt (SMA) pavement. Seven asphalt mixture proportions were designed, each of which employed a different percentage of CBA (0%, 10%, 20%, 30%, 50%, 70%, and 100%) as a fine aggregate replacement. The performance tests conducted in this research were the Cantabro durability test, resilient modulus test, dynamic creep test, and moisture susceptibility test. The findings showed an improvement in the durability and resistance to permanent deformation of the SMA mixtures with 30% and 50% CBA replacement, respectively. However, further increases in the CBA content caused a decrease in the durability and resistance to permanent deformation. Meanwhile, the stiffness and tensile strength ratio (TSR) value decrease with the use of CBA replacement at any percentage. However, the TSR value of the SMA mixtures with 50% or less CBA replacement was more than 80%, which meets the minimum requirement set by JKR. In conclusion, incorporating CBA into SMA mixture has a positive effect on certain mechanical properties, particularly its durability and resistance to permanent deformation at optimal replacement levels, highlighting its potential to be used as a sustainable material in asphalt pavement construction.

1. Introduction

CBA is a coal-combustion byproduct that is created in electricity generation. The specific properties of CBA are determined by elements such as the origin and type of coal that it results from. Coal is classified into four distinct categories: anthracite, bituminous, sub-bituminous, and lignite [1]. This categorisation is based on the coal’s carbon composition, heat energy production, and moisture content, as well as the presence of other chemical components in the coal [2]. With its high carbon concentration, anthracite is often the least suitable for energy production among all coal types. The chemical composition of coal is influenced by its geological formation. Different forms of coal exhibit varied levels of silica oxide (SiO2), alumina oxide (Al2O3), and ferric oxide (Fe2O3), which in turn affect their chemical properties [2,3].
Coal is a precious resource, and the main use of coal is its consumption for electricity generation [4]. To produce electricity in coal power plants, a huge amount of coal is combusted within designated boilers, resulting in the formation of different types of ashes, including fly ash and CBA. Coal-based electricity generation contributes to air pollution through releasing gas emissions and producing ash as a byproduct of the combustion process [5]. CBA refers to coarser particles removed from the furnace bottom, whereas fly ash (FA) is finer ash that is produced and collected at various stages of the burning process [6]. Coal ash waste consists of fly ash and bottom ash, which show different variations in their physical and chemical properties. Fly ash accounts for around 70–80% of the total ash produced by the burning of coal, while bottom ash makes up about 10–20% [7]. There are two types of bottom ash that are obtained based on the boiler that is applied: wet and dry. Typically, the bottom ash consists of particles that fall within the size range of sand and gravel. After grinding and milling, one study found that the particle size distribution of bottom ash changed from a maximum of 9.5 mm to as fine as 300 µm [8].
Bottom ash is sharp-edged and irregular in shape, has a porous texture, and has angular particles. CBA has a particle distribution ranging from the size of fine sand to that of gravel particles. Particles of coal bottom ash that are in the form of fine particles will constitute 50–90% of the overall bottom ash. The specific gravity of bottom ash varies between 1.39 and 2.41. Because of its porous nature, CBA has a high water absorption value ranging from 11.61 to 32.23%. The AASHTO classification system categorises CBA as A-1-a, while the USCS classification system classifies it as well-graded sand [9]. The chemical composition of CBA depends upon the particular type of coal that is employed. The primary mineral elements present in CBA are silicon dioxide (SiO2), aluminium oxide (Al2O3), and iron oxide (Fe2O3) [10]. SiO2 has the highest percentage with 45.3–68.9%, followed by Al2O3 (15.89–29.24%) and Fe2O3 (3.57–19.84%). The total amount of these three chemical oxides was higher than 70% in the CBA used in this study, which means that this ash belongs to ASTM Type F ash [11].
Coal-fired power generation is currently more economically appealing than other options, such as oil and natural gas, particularly in countries with abundant coal reserves like India, the United States of America (US), and China [12]. For example, coal consumption in China was half of the world’s total coal consumption in 2012, followed by the US, India, Japan, the Russian Federation, South Africa, South Korea, Germany, Poland, and Indonesia, with coal consumptions of 11.7%, 8.0%, 3.3%, 2.5%, 2.4%, 2.2%, 2.1%, and 1.4%, respectively [7]. In Malaysia, electricity generation comprises 33% coal and 9% hydro. The percentage of electricity that is generated by coal was expected to increase due to the increase in the gas price [13]. Four coal power plants are operating in Peninsular Malaysia, namely, Kapar in Selangor, Manjung in Perak, Tanjung Bin in Johor, and Jimah in Negeri Sembilan [14]. These plants generate about 40% of Malaysia’s electricity from coal. Due to the high demand for coal, a great amount of industrial waste has been generated. Bottom ash accounts for 100 million metric tonnes (Mt) of the millions of tonnes of coal ash waste that is produced yearly, with the remainder being fly ash [15]. According to the World of Coal Ash (WOCA), coal-fired power stations produce 780 million metric tonnes of CBA, with Asian countries contributing 66% of this amount, followed by Europe and the United States [16]. As the largest producer, China alone produced 395 Mt of coal ash in one year. The United States follows with 118 Mt, India with 105 Mt, Europe with 52.6 Mt, and Africa with 31.1 Mt [17].
Unlike fly ash, which has been widely used as a raw material replacement in the concrete and bricks industry, CBA is still treated as useless solid waste material and is disposed of on open land [18]. At present, bottom ash is dumped at landfills [19,20]. Disposing of CBA in landfills and the open environment may result in the depletion of valuable land and groundwater resources and air contamination [21]. Coal ash waste typically contains trace quantities of heavy metals and metalloids, including lead (Pb), arsenic (As), zinc (Zn), copper (Cu), manganese (Mn), cadmium (Cd), nickel (Ni), chromium (Cr), manganese (Mn), and selenium (Se) [22,23,24]. The concentration of heavy metals in bottom ash is higher than that in fly ash. Under acidic conditions, these elements can be extracted and then pollute the nearby soils, surface water, and groundwater sources [25,26]. Furthermore, in the worst-case scenario, heavy metal contamination can enter the food chain, resulting in a genotoxic effect [27]. With the increment in CBA waste production, the scarcity of land, the costs of operating existing landfills, and the hazardous impact of CBA on humans and the environment, a dire need exists to recycle and utilize CBA [20,28,29]. With the increasing recognition of sustainable pavement, the pavement sector has started incorporating a larger variety of industrial waste and recycled materials into pavement to preserve natural resources [30].
On the other hand, the enormous use of natural aggregates, especially in pavement construction, has led researchers to find other alternative materials to reduce the depletion of natural aggregates. Natural aggregate, a non-renewable source, is the most significant material used in construction, especially pavement construction [31,32]. Base and subbase courses all use natural aggregates, whereas bituminous pavement uses 95% natural aggregates and concrete pavement uses 87%. The aggregate needed for one km of a bituminous mixture’s surface course can surpass 15,000 tonnes [33]. The demand for natural resources has increased due to the increased consumption of raw materials [34]. One possible approach to this issue is to utilise waste materials. Through the replacement of natural aggregates with waste aggregates in asphalt pavement construction, the construction cost of pavement can be reduced, as well as the necessity of extracting aggregates from natural resources. In past and current research, researchers have studied the use of waste materials as aggregate in asphalt mixtures [35]. Some of the materials used were mining waste, recycled concrete, steel slag, palm oil shell, palm oil clinker, recycled asphalt, and glass [34,35,36,37,38,39,40,41,42].
Previous research has revealed that bottom ash exhibits desirable engineering properties that make it suitable for use in construction materials, including as a substitute for aggregates, as a replacement for cement, as a bitumen additive, and as a filler in asphalt pavement [43,44,45]. Although several studies have investigated the potential of CBA as a material substitution in pavement construction, the existing studies on the use of CBA as a fine aggregate replacement in SMA pavement mixtures are limited. Since there is no reference on the optimum percentage of aggregate replacement for an SMA mixture, the percentage of CBA used in this study was up to 100% replacement (0, 10, 20, 30, 50, 70, 100%). The main objective of this study was to examine the impact of using CBA waste as a substitute for fine aggregate on the performance of the resulting SMA mixture.

2. Materials and Methods

2.1. Bitumen, Aggregates, Coal Bottom Ash

Bitumen grade 80/100 was selected to be used in this study. The bitumen used was supplied by Asphalt Technology Sdn Bhd, located in Port Klang, Malaysia. The bitumen used acts as a lubricant during compaction and a visco-elastic binder of high viscosity in service. The properties of bitumen 80/100, such as its penetration, softening point, and viscosity, were tested in accordance with ASTM D 5 [46], ASTM D 36 [47], and ASTM D 4402 [48], and are presented in Table 1. The results indicate that the binder satisfies the standard requirement of binder grade 80/100 with penetration and softening point values ranging from 80 to 100 (0.01 mm) and 45 to 52 °C, respectively. In terms of viscosity, an increase in temperature decreased the viscosity of the binder. At 135 °C and 165 °C, the viscosity of the binder was 263 and 151 mPas, respectively, which satisfy the standard requirements set by JKR.
The crushed aggregates utilised in this study consist of both coarse and fine aggregates, as well as mineral fillers, which range from 20 nominal-size aggregates to quarry dust. All specimens were prepared using a Portland cement mixture with a weight ratio of 2%. Figure 1 depicts the aggregate distribution employed in this study. The SMA20 mixture has been designed using the mid-point distribution of aggregate gradation. The aggregate utilised in this study was obtained from Kajang Rock Quarry Sdn. Bhd, Selangor, Malaysia.
Table 1. Physical properties of binder.
PropertiesBinder Grade 80/100Standard Requirement
Penetration (25 °C, 100 g, 5 s) (0.01 mm) [46]8980–100
Softening point (ring and ball) (°C) [47]4645–52
Viscosity at 135 °C (mPa s) [48]263Max 3000
Viscosity at 165 °C (mPa s) [48]151Max 3000
In order to assess the effect of CBA on pavement performance, the proportion of CBA utilised as a substitute for fine aggregate was varied to different percentages:—0%, 10%, 20%, 30%, 50%, 70%, and 100%—by weight of the total aggregate. The bottom ash was obtained from the Jimah Power Plant, Negeri Sembilan, Malaysia. Table 2 and Table 3 display the basic physical characteristics of the CBA and the concentration of trace elements in the CBA when it was measured on a dry basis, respectively. According to the findings, it was concluded that the CBA had a higher water absorption of 22%, which was greater than the water adsorption value specified in Standard Specification for Road Works: Section 4—Flexible pavement (JKR/SPJ/2008-S4) for fine aggregate [49].
Table 3 displays the concentration of trace elements in the CBA on a dry basis (mg/kg). CBA is a byproduct of coal combustion that contains trace elements, including arsenic (As), barium (Ba), cadmium (Cd), chromium (Cr), lead (Pb), mercury (Hg), selenium (Se), and silver (Ag), among others. According to the Environmental Quality (Scheduled Wastes) Regulation 2005, bottom ash is categorised as scheduled waste SW104. This refers to dust, slag, dross, or ash that contains specific elements such as aluminium, mercury, cadmium, thallium, arsenic, chromium, nickel, vanadium, lead, beryllium, antimony, copper, tellurium, or selenium. However, it does not include slag from iron and steel factories [50]. Table 3 demonstrates that the concentration of all trace elements in the CBA used in this study meet the minimum requirements established by the Malaysian Department of Environment.
Table 2. Physical properties of coal bottom ash.
PropertiesCoal Bottom AshAggregate
Specific gravity (ASTM C128 [51])1.76-
Water absorption (%) (ASTM C128)22.9Max 2
Table 3. Trace elements concentration in coal bottom ash (mg/kg).
Parameter (s)Unit (mg/kg)Maximum LevelStatus
Antimony, SbNd (<1.5)500Pass
Arsenic, As Nd (<1.5)500Pass
Barium, Ba 24210,000Pass
Beryllium, BeNd (<1.5)75Pass
Cadmium, Cd2.2100Pass
Chromium, Cr5.22500Pass
Chromium-VI (CrVI)Nd (<1.5)500Pass
Cobalt, Co6.08000Pass
Copper, Cu10.12500Pass
Lead, Pb4.11000Pass
Mercury, HgNd (<0.1)20Pass
Molybdenum, MoNd (<1.5)3500Pass
Nickel, Ni11.42000Pass
Selenium, SeNd (<0.1)1.0Pass
Silver, AgNd (<0.1)5.0Pass
Thallium (Tl)Nd (<1.5)700Pass
Vanadium (V)11.12400Pass
Zinc12.05000Pass
Nd = not detected.

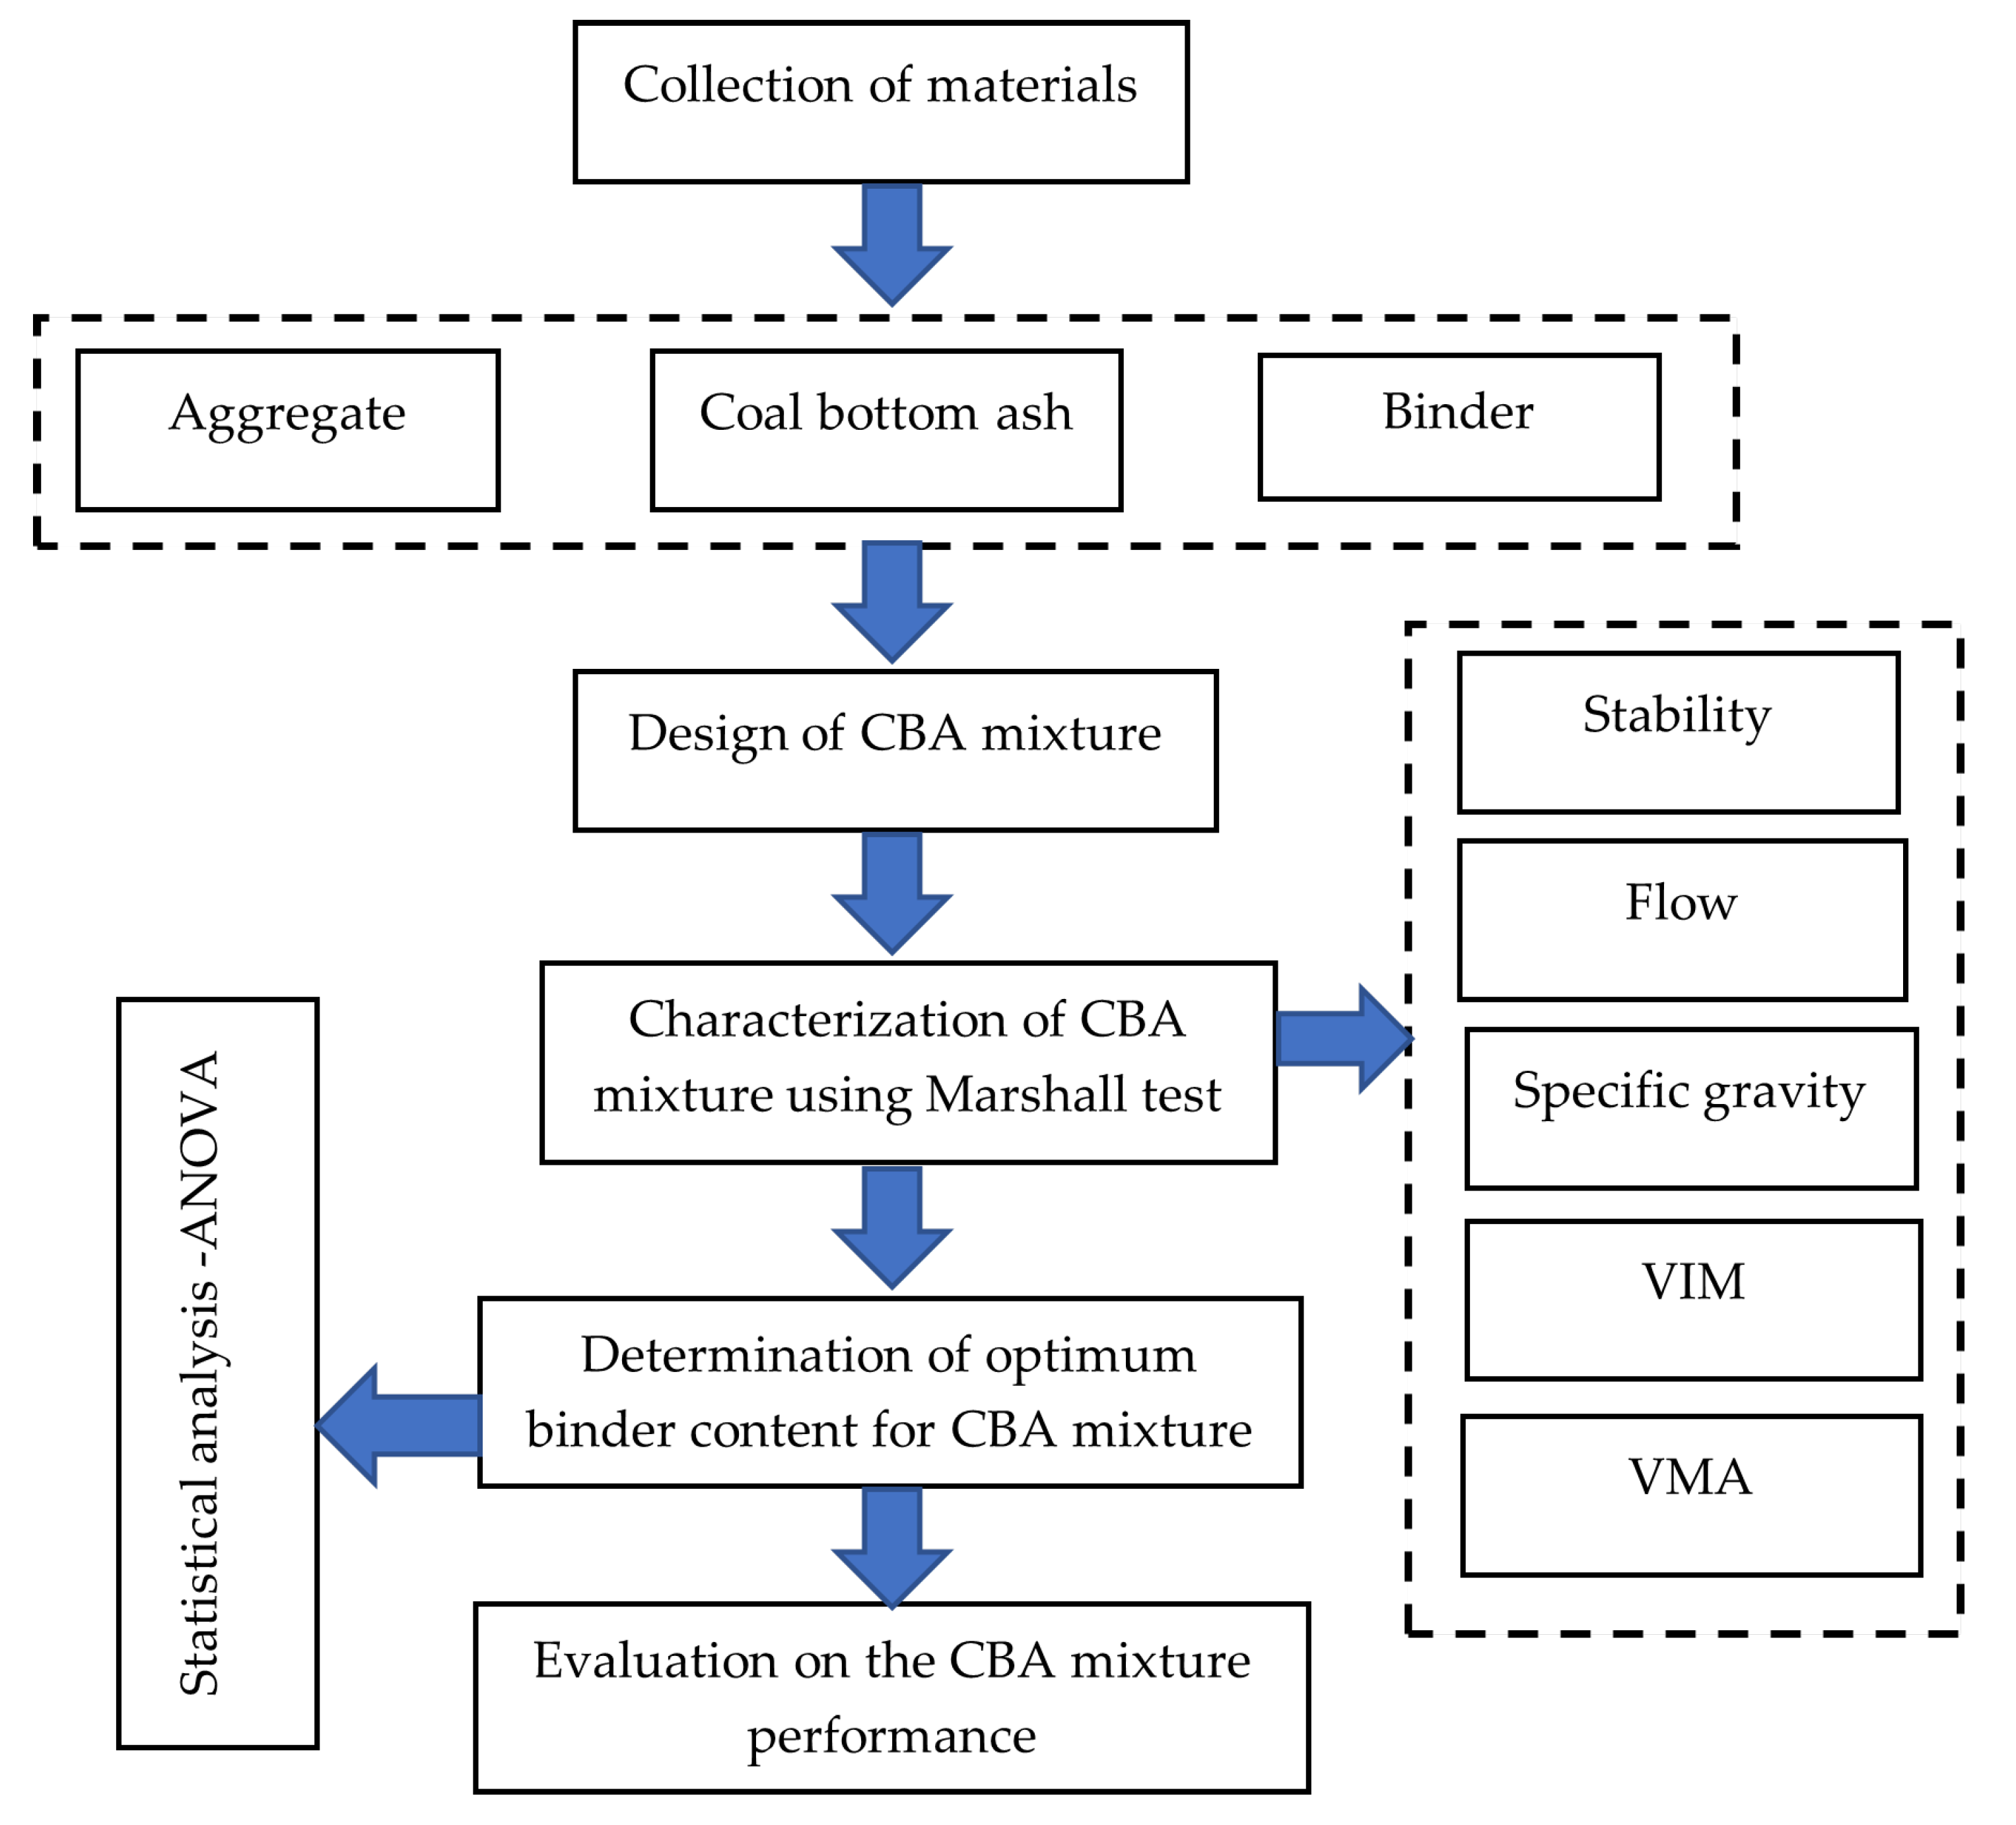
2.2. Experimental Design

The experimental design work was divided into three phases: materials selection, optimum binder content determination, and mixtures performance evaluation. The phases are presented in Figure 2.

2.3. Mix Design

2.3.1. Preparation of Mixture

SMA consists of around 65% coarse aggregate, not less than 8% filler content, and binder in the range of 5–7%. The coarse aggregate creates a structure with strong internal friction and interlocking through direct contact between the particles to withstand shear forces caused by loads. It offers a durable surface that is resistant to cracking and rutting. This research aims to investigate the effect of CBA replacement on the performance of SMA mixture.
CBA mixtures with seven different percentages were prepared for this study, as presented in Table 4. The filler used in this research combines 7% quarry dust and 2% Portland cement. To prepare the samples, it was necessary to adhere to the following stages: (1) The aggregate and CBA were heated in an oven at a temperature of 150 °C for one hour. The total weight of the aggregate and CBA in each sample was 1100 grams. (2) The aggregate was transferred to the pan, and an optimum binder was introduced to the aggregate at a proportion of 5.9%. Subsequently, the mixture was heated to a higher temperature of 160 ± 5 °C. (3) After all aggregates and CBA were thoroughly coated, the mixture was moved to a Marshall mould and spaded 10 and 15 times within and around the mould. (4) Next, a Marshall Compactor was used to compact the mixture by subjecting it to 50 blows on both the top and bottom sides at 140 ± 5 °C. Subsequently, the mixture was allowed to rest in the mould for 24 h at ambient temperature before extrusion. Three replicate SMA mixtures were prepared for each percentage of CBA to determine the optimum binder content.

2.3.2. Optimum Binder Content

Marshall Mix Design, following the guidelines of ASTM D1559 [52], was employed in this study to ascertain the OBC before conducting the performance test. The optimum binder content was determined by calculating the mean of the binder content percentage obtained from the maximum Marshall stability and bulk density, as well as that of the 4% of voids in the total mix. To determine the optimum binder content in this study, seven CBA mixtures, namely CBA-0, CBA-10, CBA-20, CBA-30, CBA-50, CBA-70, and CBA-100, were prepared. The OBC for each mixture was further examined using the statistical analysis method known as one-way ANOVA (analysis of variance), using the Statistical Package for Social Science (SPSS) software version 27.

2.4. Microstructural Analysis (FESEM and EDS)

Field emission scanning electron microscopy (FESEM) was carried out to analyse the surface morphology of the raw coal bottom ash (CBA). In addition, energy dispersive X-ray spectroscopy (EDS) was also conducted on the raw CBA to determine its elemental composition. FESEM imaging and EDS analysis were conducted at an accelerating voltage of 10 kV and a magnification of 5000×. Meanwhile, for the CBA mixture, small, fractured surfaces (dimensions: 5 mm × 10 mm × 10 mm) were selected from the compacted specimens of the CBA mixtures. The samples were analysed using FESEM to examine the interface between the binder and CBA particles, along with the microstructure of the mixture matrix.

2.5. Pavement Performance

The Cantabro test, resilient modulus test, and dynamic creep test were performed on all mixtures to assess the impact of substituting fine aggregate with CBA in SMA pavement.

2.5.1. Cantabro Test

The Cantabro test is a standard method used to quantify mass loss. This method is typically applied to measure porous asphalt mixtures’ particle loss. However, prior studies indicate that it can also be employed to measure the level of abrasiveness in other asphalt concrete mixtures [53]. The abrasive resistance of the asphalt mixes to particle loss is evaluated by the Cantabro test in accordance with ASTM C131 [54]. A cylindrical sample (101.6 mm × 65 ± 1 mm) was inserted into a Loss Angeles drum machine. Each sample was constantly subjected to 300 drum rotations at 30–33 rpm without a steel ball. The final mass of the sample was weighed to the nearest 0.1 g after 300 rotations. The resistance to disintegration is expressed as a percentage of Cantabro loss.
CL = [(A − B)/A) × 100]
where CL is Cantabro loss (%), and A and B are the sample initial weight and sample final weight (grams), respectively.

2.5.2. Resilient Modulus Test

The resilient modulus test was conducted using a UMATTA machine in compliance with the ASTM D4123 standard [55]. The experiment was conducted at a temperature of 25 °C and Poisson’s ratio of 0.35. The sample was put into the loading apparatus and the loading strips were positioned parallel to each other and centred on the vertical diametral plane. The transducers were placed on the sample, and the knurled adjuster displacement transducer was adjusted. Then, a compressive force was applied to the sample, and the recoverable diametral strain was subsequently measured. The stiffness modulus of the samples was determined using the following equation:
Resilient Modulus = [(P (v + 0.27)]/(H × T)]
where P represents the peak load (N); v represents the Poisson’s ratio; T represents the mean of sample thickness (mm), and H denotes the total recoverable deformation along the horizontal axis (mm).

2.5.3. Dynamic Creep Test

The test was conducted using the UMATTA machine in compliance with AS2891.12.1 [56]. The samples were sliced at the upper and lower sections using a diamond saw cutter to achieve a 50 ± 1 mm thickness. A thin layer of silicone grease and graphite flakes was used to coat both sides of the sample. The loading parameters for this study included the use of a haversine wave shape with stress levels of 200 kPa. Additionally, a test temperature of 40 °C was chosen. The load was applied for 0.5 s, followed by a rest interval of 1.5 s. The specimen was terminated either after undergoing 1800 load cycles or when the cumulative strain reached 100,000 µs.

2.5.4. Moisture Susceptibility Test

The moisture susceptibility test evaluates the effects of moisture on asphalt mixtures. The sample preparation followed the Marshall Procedure as outlined in AASHTO T283 [57]. The test focused on assessing the susceptibility of asphalt pavement mixtures to degradation caused by water exposure. This test uses the tensile strength ratio (TSR) as a measure to evaluate the susceptibility of pavement mixtures to water. The samples were required to achieve a minimum TSR of 80% to fulfil the desired outcome. The experiment was performed in a laboratory environment under two different conditions: dry and wet. The samples were maintained at room temperature for 24 h under dry conditions. The samples were immersed in a water bath at a temperature of 60 °C under wet conditions. After a duration of 24 h, both samples were maintained at a temperature of 25 °C ± 1 °C for 2 h. This procedure was implemented to ensure that both samples reached an equivalent temperature and to enable the adjustment of the specimens’ temperature. After reaching the maximum load of the sample, loading continued until a fracture occurred. The ratio of the tensile strength between the wet sample and the dry sample served as an indicator of the sample’s susceptibility to moisture damage. The tensile strength and the tensile strength ratio of the samples were calculated using Equations (3) and (4), respectively.
Tensile Strength (kPa) = [(2000 × P ult)/(π × d × t)]
where Pult represent an applied load to the fail sample (N), t represents the thickness of the sample (mm), and d represents diameter of the sample (mm).
Tensile Strength Ratio = [(Stw/Std) × 100]
where Stw represent the average tensile strength of the wet sample (kPa) and Std represents the average tensile strength of the dry sample (kPa).

2.6. Statistical Analysis (ANOVA)

In this research, two types of analysis of variance were conducted to validate the findings. First, to evaluate whether the variation in the content of CBA produced a significant effect on the optimum binder content value, a one-way analysis of variance (ANOVA) was conducted with a reliability level of 95%. The statistical study employed the null hypothesis, H0, which states that the mean values of the optimum binder content for the different percentages of CBA, represented by µ1, µ2, µ3, µ4, µ5, µ6, and µ7, are all equal. The alternative hypothesis, H1, on the other hand, suggests that these mean values are not all equal. If the obtained P < P alpha (0.05), the null hypothesis is rejected, and the alternative hypothesis is accepted.

3. Results

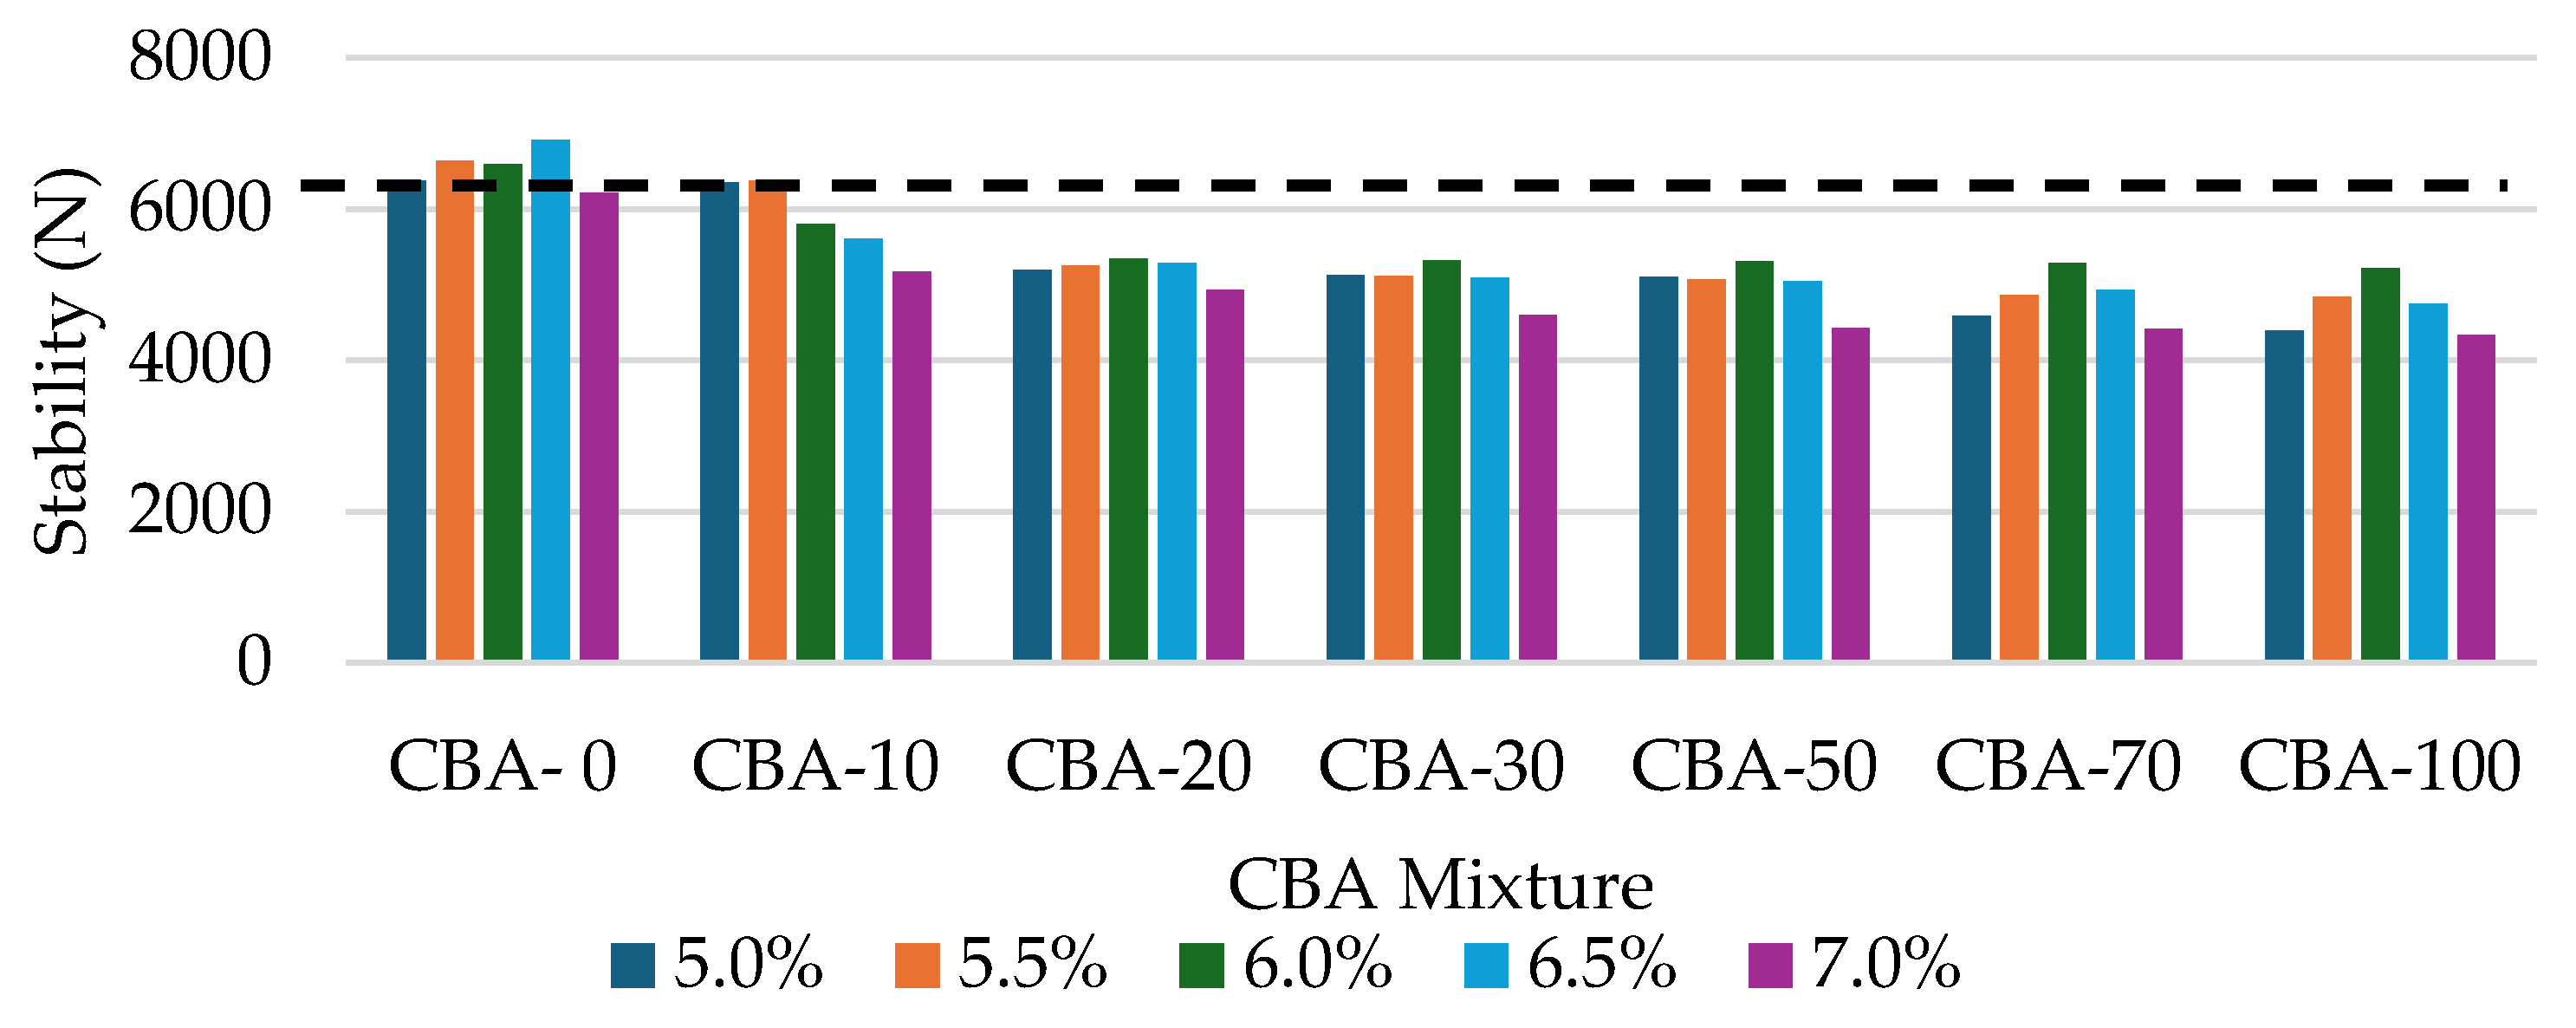
3.1. Marshall Stability vs. CBA Mixture

Marshall stability refers to the highest load that a specimen can withstand during a test conducted at a temperature of 60 °C and a loading rate of 50.8 mm/min before it fails. Figure 3 depicts the relationship between the Marshall’s stability value and the CBA mixture for varying binder concentrations. According to the data, the stability improved as the content of bitumen increased, reaching its optimum value before decreasing with further increases in the bitumen content. The results also indicate that the stability of the CBA mixture was consistently worse than that of the control mixture. The findings demonstrate that the control mixture met the minimum stability criteria of 6.2 kN, as stipulated in the JKR standards for SMA20 [49]. However, in the case of the CBA mixture, only the CBA-10 mixtures containing 5% and 5.5% bitumen content satisfied the specified requirement. Previous studies have shown that stability and flow tests are not the most reliable methods for evaluating the strength of SMA mixtures. Therefore, the results of these tests should be regarded as supporting data rather than as the primary basis for accepting or rejecting a SMA design [58,59].
The decrease in the stability values is attributed to the rough, gritty surface texture of coal bottom ash particles leading to weaker adhesion between the materials. The porous, angular, and irregular nature of coal bottom ash and its sharp edges increase the likelihood of breakage during compaction. This breakage can cause the bonding between the bitumen and aggregate to deteriorate.

3.2. Flow

The flow is a measurement of the asphalt mixture’s capability to withstand incremental settlements and deformation without developing cracks. Figure 4 illustrates the correlation between the flow and the CBA content at different binder percentages. The results indicate that the flow value of the CBA mixture was consistently lower than that of the control mixture. This finding is consistent with prior studies which indicated that the flow rate decreased as the percentage of CBA increased, which is attributed to the interlocking nature of and internal friction between particles of coal bottom ash and aggregate in the mixture [60]. The findings show that all the Marshall flow values of the CBA mixtures met the specified range of 2–4 mm set by JKR.

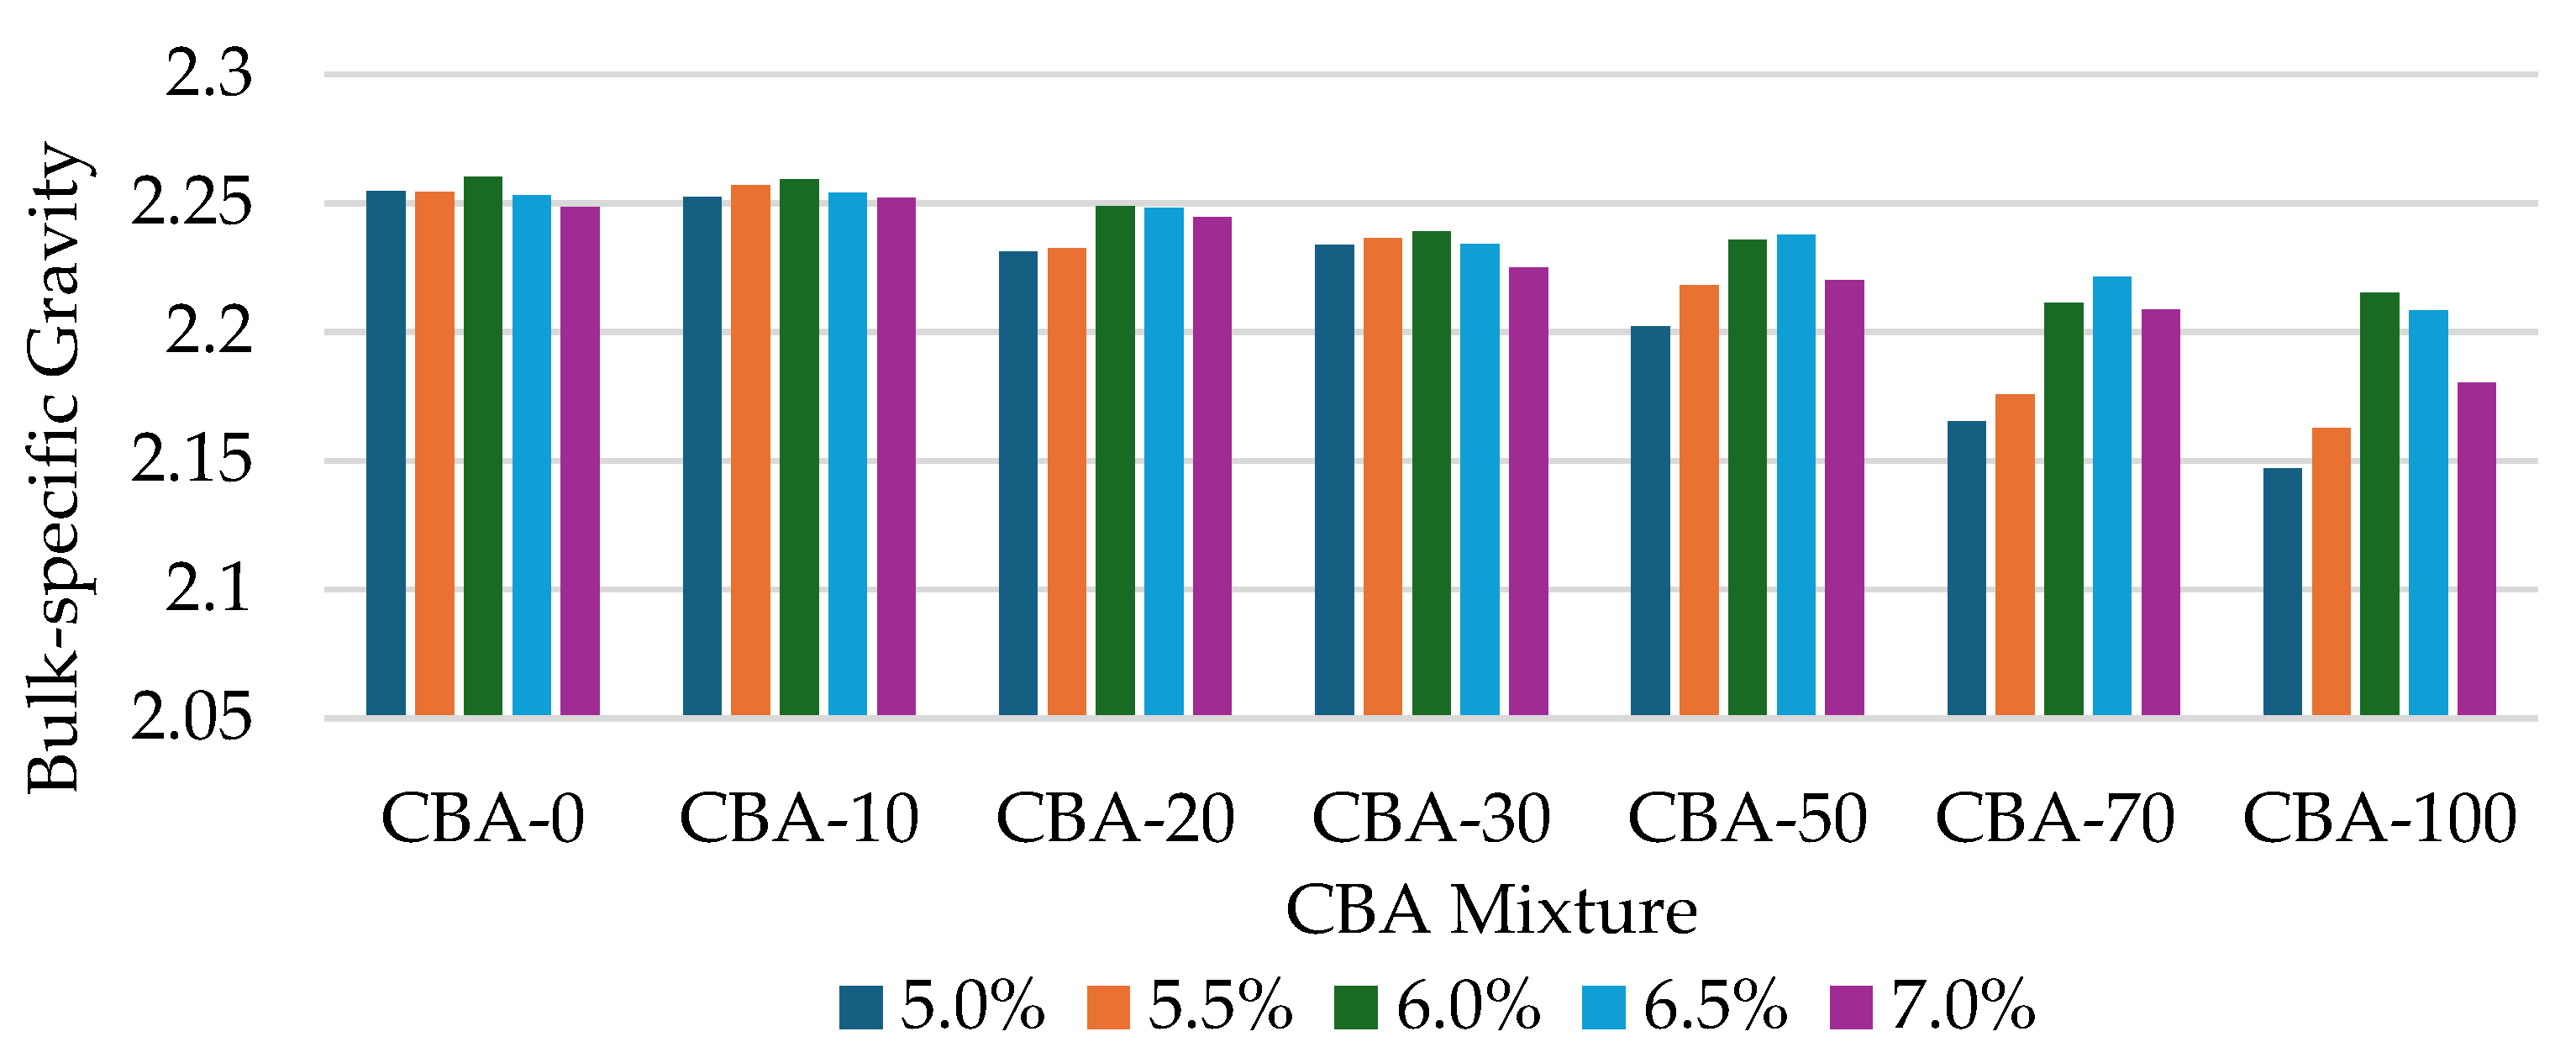
3.3. Bulk-Specific Gravity vs. CBA Mixture

Figure 5 illustrates the correlation between the bulk-specific gravity and the binder content in the CBA mixtures. The findings demonstrated that the bulk-specific gravity and binder content trends were consistent for all mixtures. An increase in binder content results in a higher bulk-specific gravity; however, additional increases in binder content lead to a decrease in the bulk-specific gravity value. An increase in the binder content initially leads to a higher bulk-specific gravity as the bitumen fills the air voids between the aggregate particles [61], resulting in better compaction and density. However, beyond the optimum point, further increases cause a reduction in the bulk-specific gravity because the voids become saturated [62] and excess binder disrupts the aggregate structure, increasing the volume without a proportional increase in mass. Compared to the control mixture, the findings also indicated that an increase in the CBA content resulted in a decrease in the bulk-specific gravity. This reduction in bulk-specific gravity is attributed to the porous texture of the CBA, which has a lower specific gravity than natural aggregates [60].

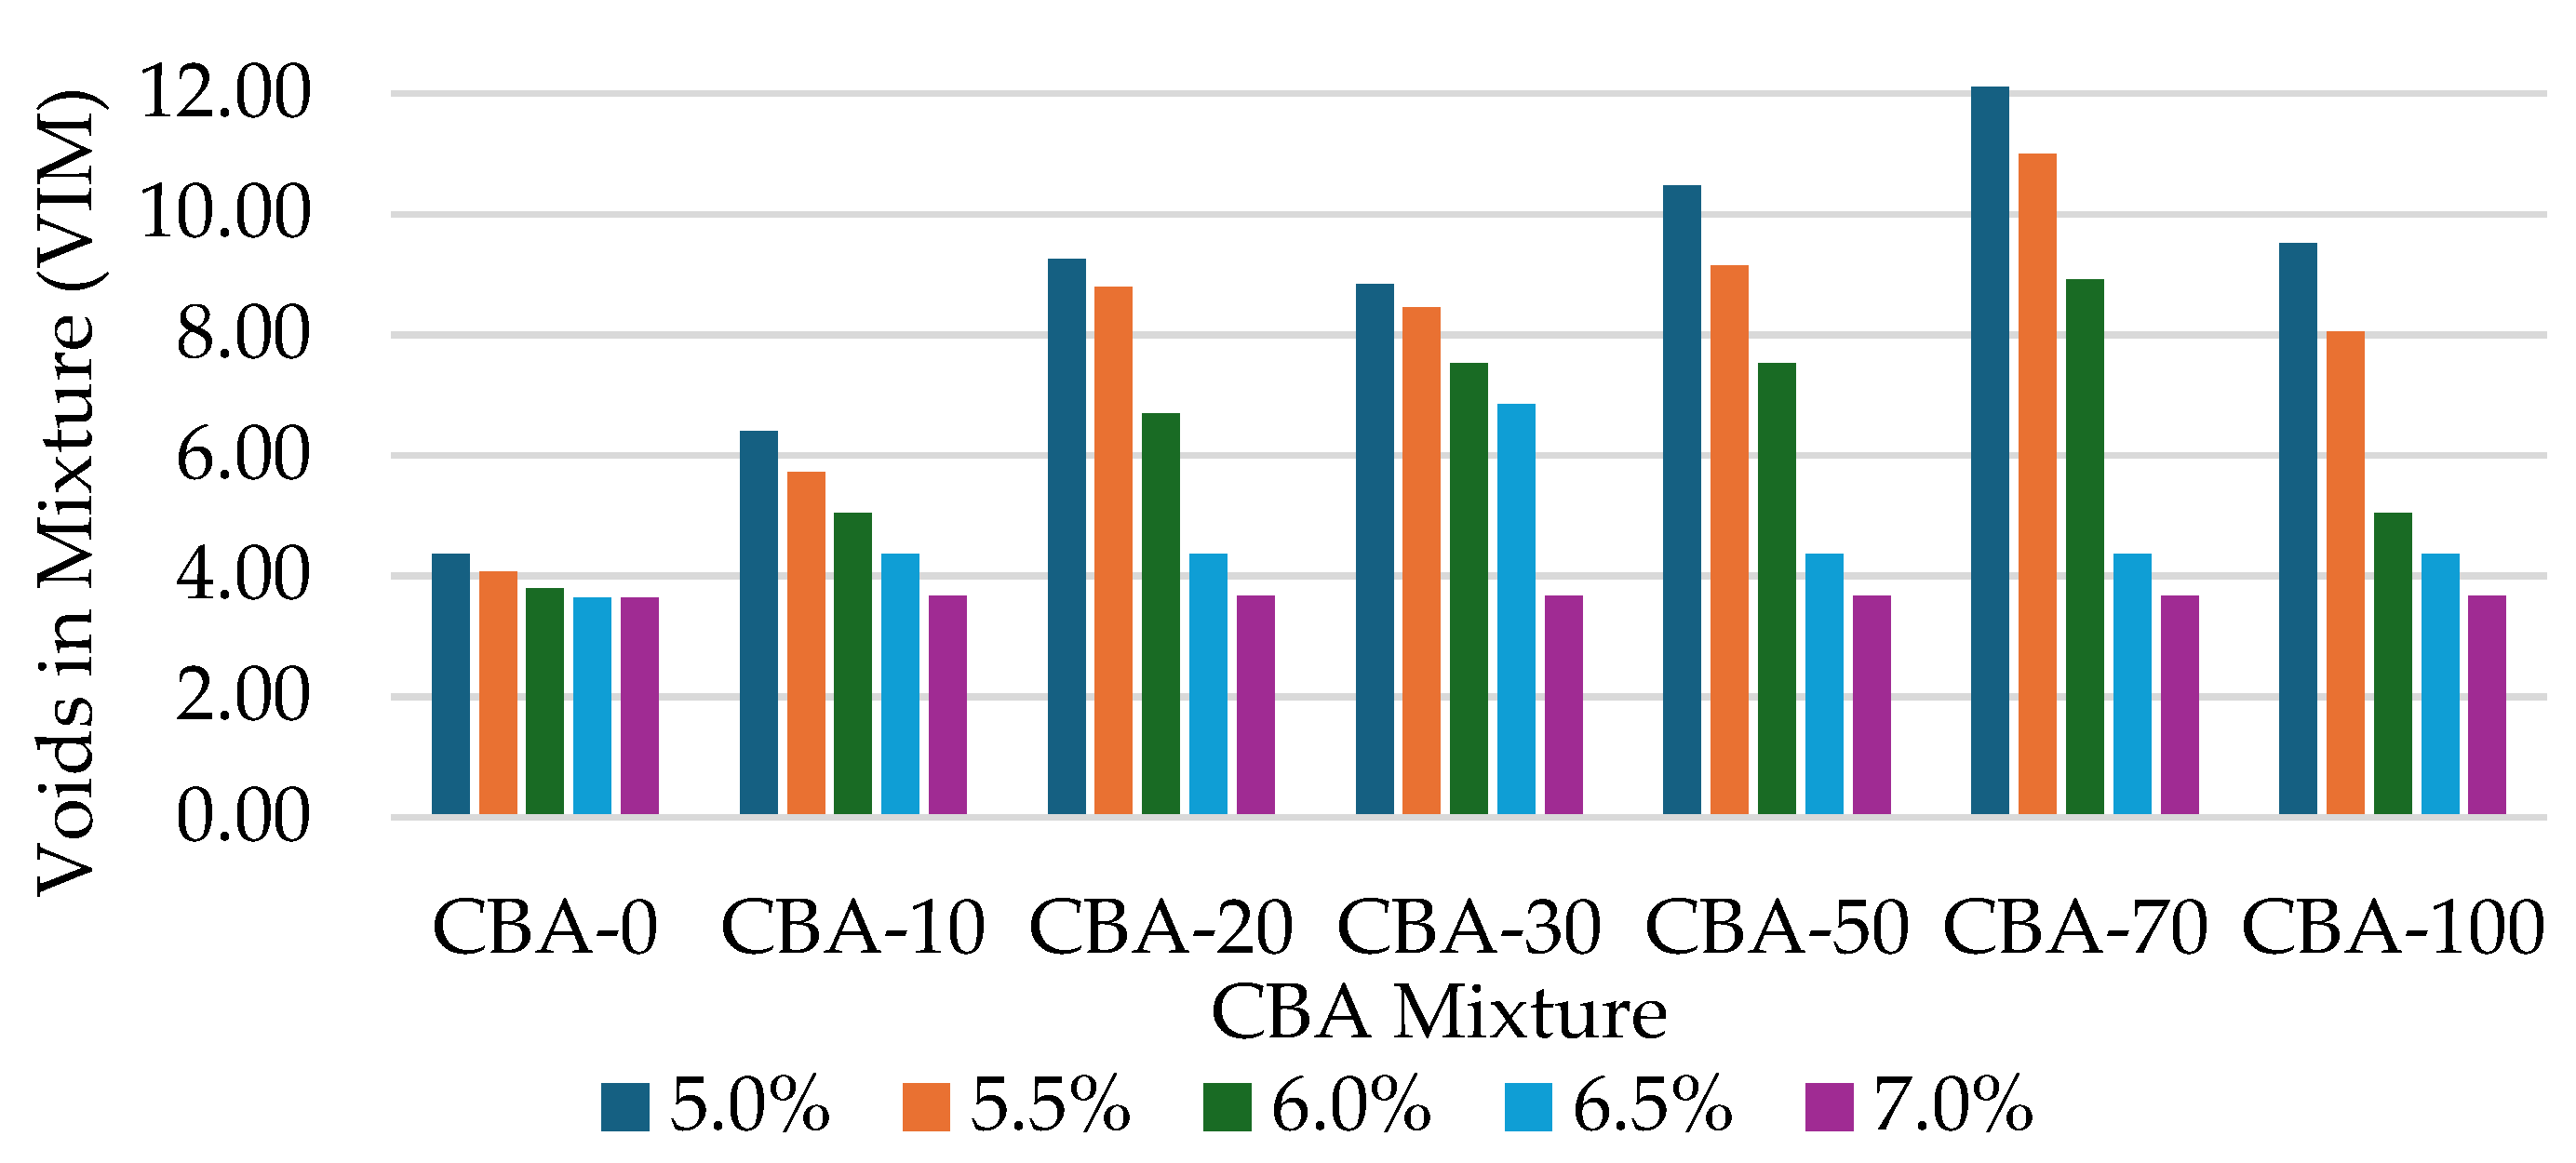
3.4. Voids in Mixture (VIM) vs. CBA Mixture

The presence of air voids in an asphalt mixture will significantly impact its durability [63]. Excessive air gaps may result in cracking due to insufficient binder coverage of the aggregate, while low air voids can lead to increased plastic flow (rutting) and asphalt bleeding. Figure 6 illustrates the relationship between the VIM and the binder content in the different CBA mixtures. For all CBA mixtures, an increased binder content generally resulted in reduced voids in the mixture (VIM). As the binder content increased, the number of air voids in the mixture decreased. This phenomenon arises from the binder’s ability to uniformly coat the aggregate and fill the voids among the aggregate particles. The VIM value rose with increases in the CBA content within the SMA mixture, suggesting a correlation between the VIM and the CBA contents. Adding porous CBA particles increases the absorption of the binder compared to the use of natural aggregate. This is necessary to coat the aggregate and fill the spaces between individual particles.

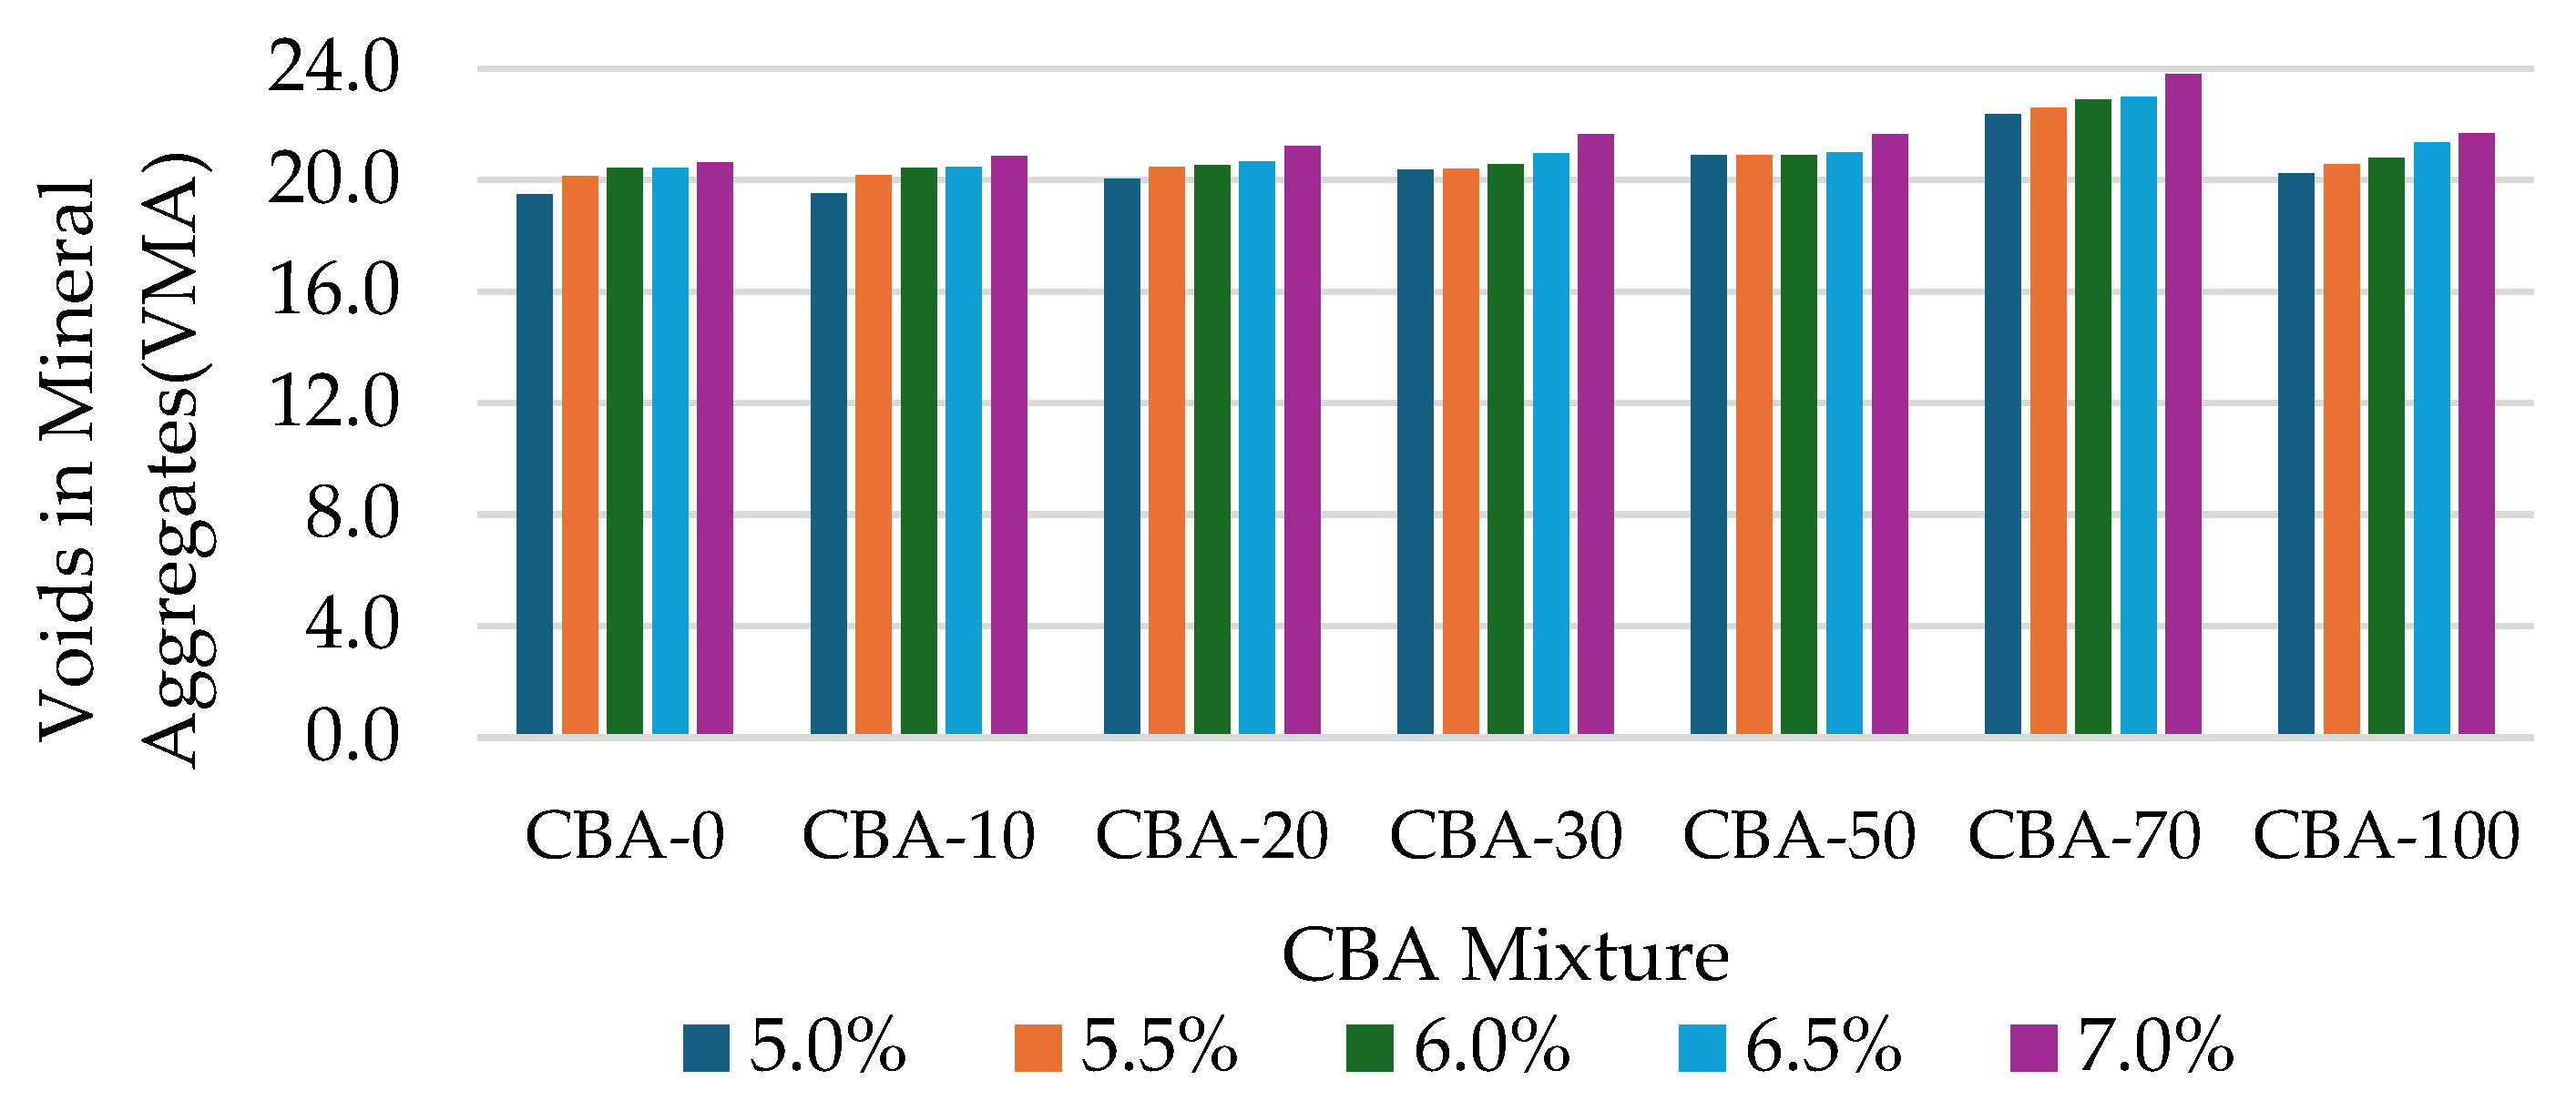
3.5. Void in Mineral Aggregate (VMA)

VMA refers to the volume of void spaces between the aggregate particles in a compacted mix, including the space that will be filled by both bitumen and air. Figure 7 shows the relationship between the VMA and the binder content in the different CBA mixtures. The findings also show that an increase in the CBA causes an increase in the VMA value for CBA mixtures, and a previous study reported that the use of CBA as a fine aggregate replacement increased the VMA value of the mixture [43]. This is because of the additional void spaces that are present due to the irregular shape and size distribution of CBA particles. These void spaces between the aggregate particles contribute to an increase in the VMA. As more CBA is added, it occupies more space within the mixture, potentially leading to higher VMA values up to 70% of CBA replacement. Further increases in the CBA content cause the VMA value to decrease. Excessive CBA content increases the proportion of finer particles, which can fill the voids between larger aggregates more effectively, reducing the overall VMA. Despite the slight drop in the VMA at higher CBA contents, all the VMA values of the CBA mixture are within the acceptable range established by the JKR, with values above 17%.

3.6. Determination of Optimum Binder Content

To determine the OBC, three graphs were produced—stability, bulk-specific gravity, and air void—each of which is plotted against the percentage of binder content. Marshall stability is an important parameter, as it measures the strength of the mixture and its ability to withstand traffic loads. The bulk-specific gravity measures the density and compaction of a mixture, while the VIM quantifies the amount of void space within the mixture. In accordance with the recommendations of the Asphalt Institute, the OBCs were selected in a way to satisfy the following requirements [61,64]:
  • Maximum Marshall stability;
  • Maximum bulk-specific gravity;
  • Median air void (4% for SMA).
Table 5 shows the average optimum binder content for each CBA mixture. The results indicate that the optimum binder content increased with an increase in the CBA content, except for mixtures containing 100% CBA replacement, in which the optimum binder content decreased slightly.
The effect of the CBA on the optimum binder content was evaluated, and the statistical significance of the differences between all mixtures was tested using a one-way analysis of variance (ANOVA). The analysis of variance (ANOVA) results are shown in Table 6. The analysis of variance (ANOVA) results indicate that the difference in the optimum binder content with varying CBA contents is not statistically significant, as the p-value (0.065) exceeds the alpha level of 0.05. This indicates that the differences in the OBC across mixtures with varying CBA percentages were insufficient to produce significant changes in the performance of the mixtures. Minor variations in the OBC did not substantially impact the overall properties of the asphalt mixture, allowing the use of a constant OBC value across all mixtures. In this study, the optimum binder content of the control mixture, which was 5.9%, was utilized in all performance tests.

3.7. Microstructural Characterisation

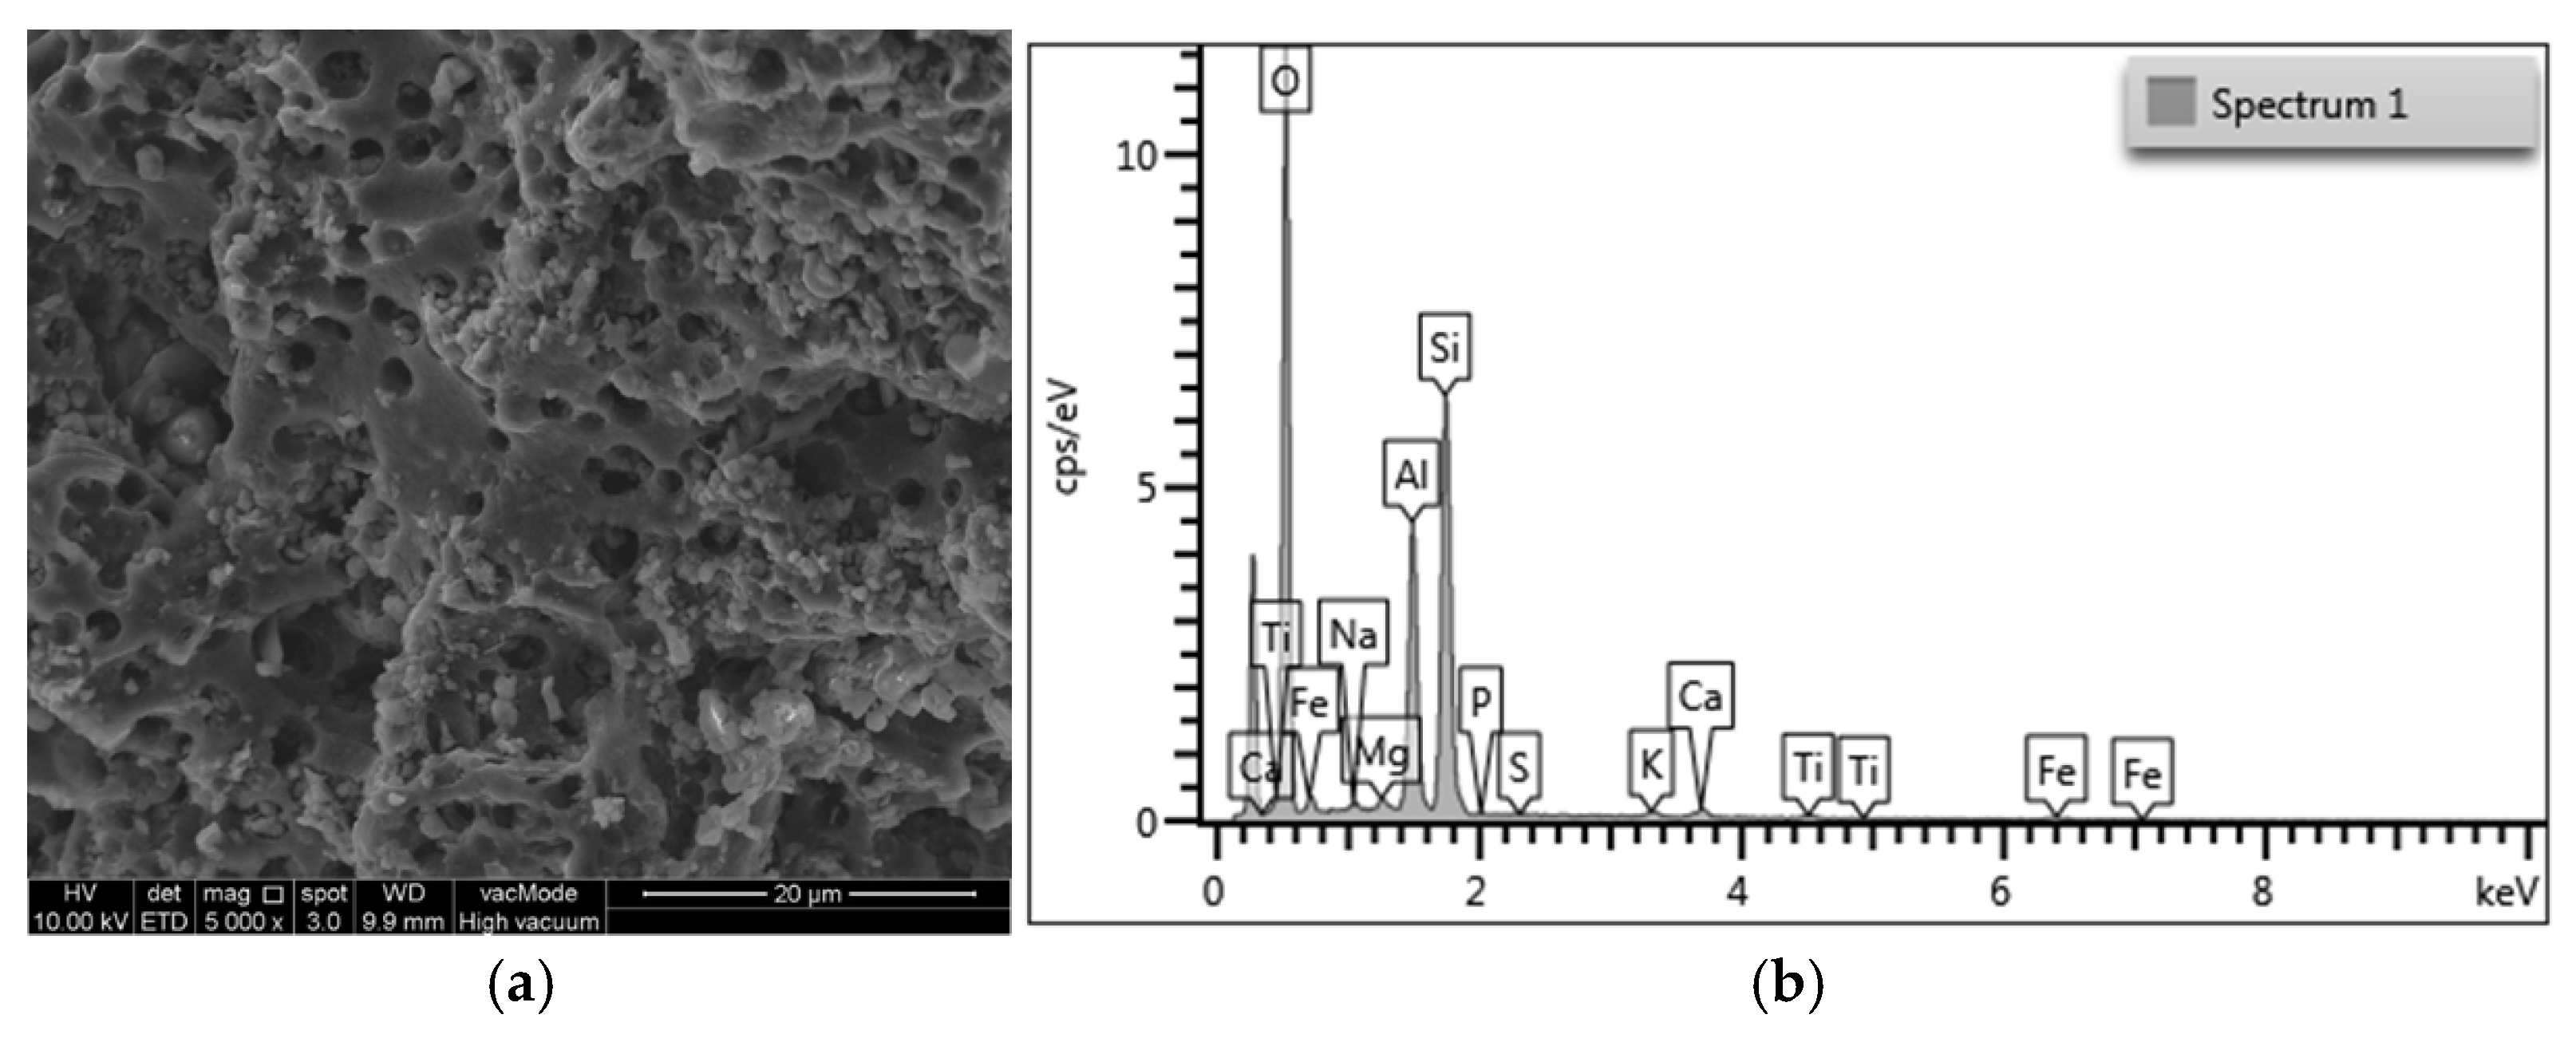
3.7.1. Raw Coal Bottom Ash

Figure 8a,b present the FESEM images of the raw CBA utilized in this study at a magnification of 5000×, along with the EDS spectra of the raw CBA. The CBA particles displayed an irregular and porous surface texture, characterized by sharp edges and angular shapes, as illustrated in Figure 8a. The anticipated morphology was expected to enhance interlocking within the asphalt mixture. The porous structure may contribute to the absorption and bonding characteristics of asphalt. The CBA particles exhibited rough and gritty surface textures. The EDS spectra of the raw CBA indicate the presence of significant elements such as Si, Al, Fe, and Ca. Silicon (Si) and aluminum (Al) were the primary components, confirming the silico-aluminous characteristics of CBA. Trace amounts of additional elements, including Mg, K, and Ti, were detected. These findings align with earlier research and validate that CBA primarily consists of silicon and aluminum oxides [14,28,65].

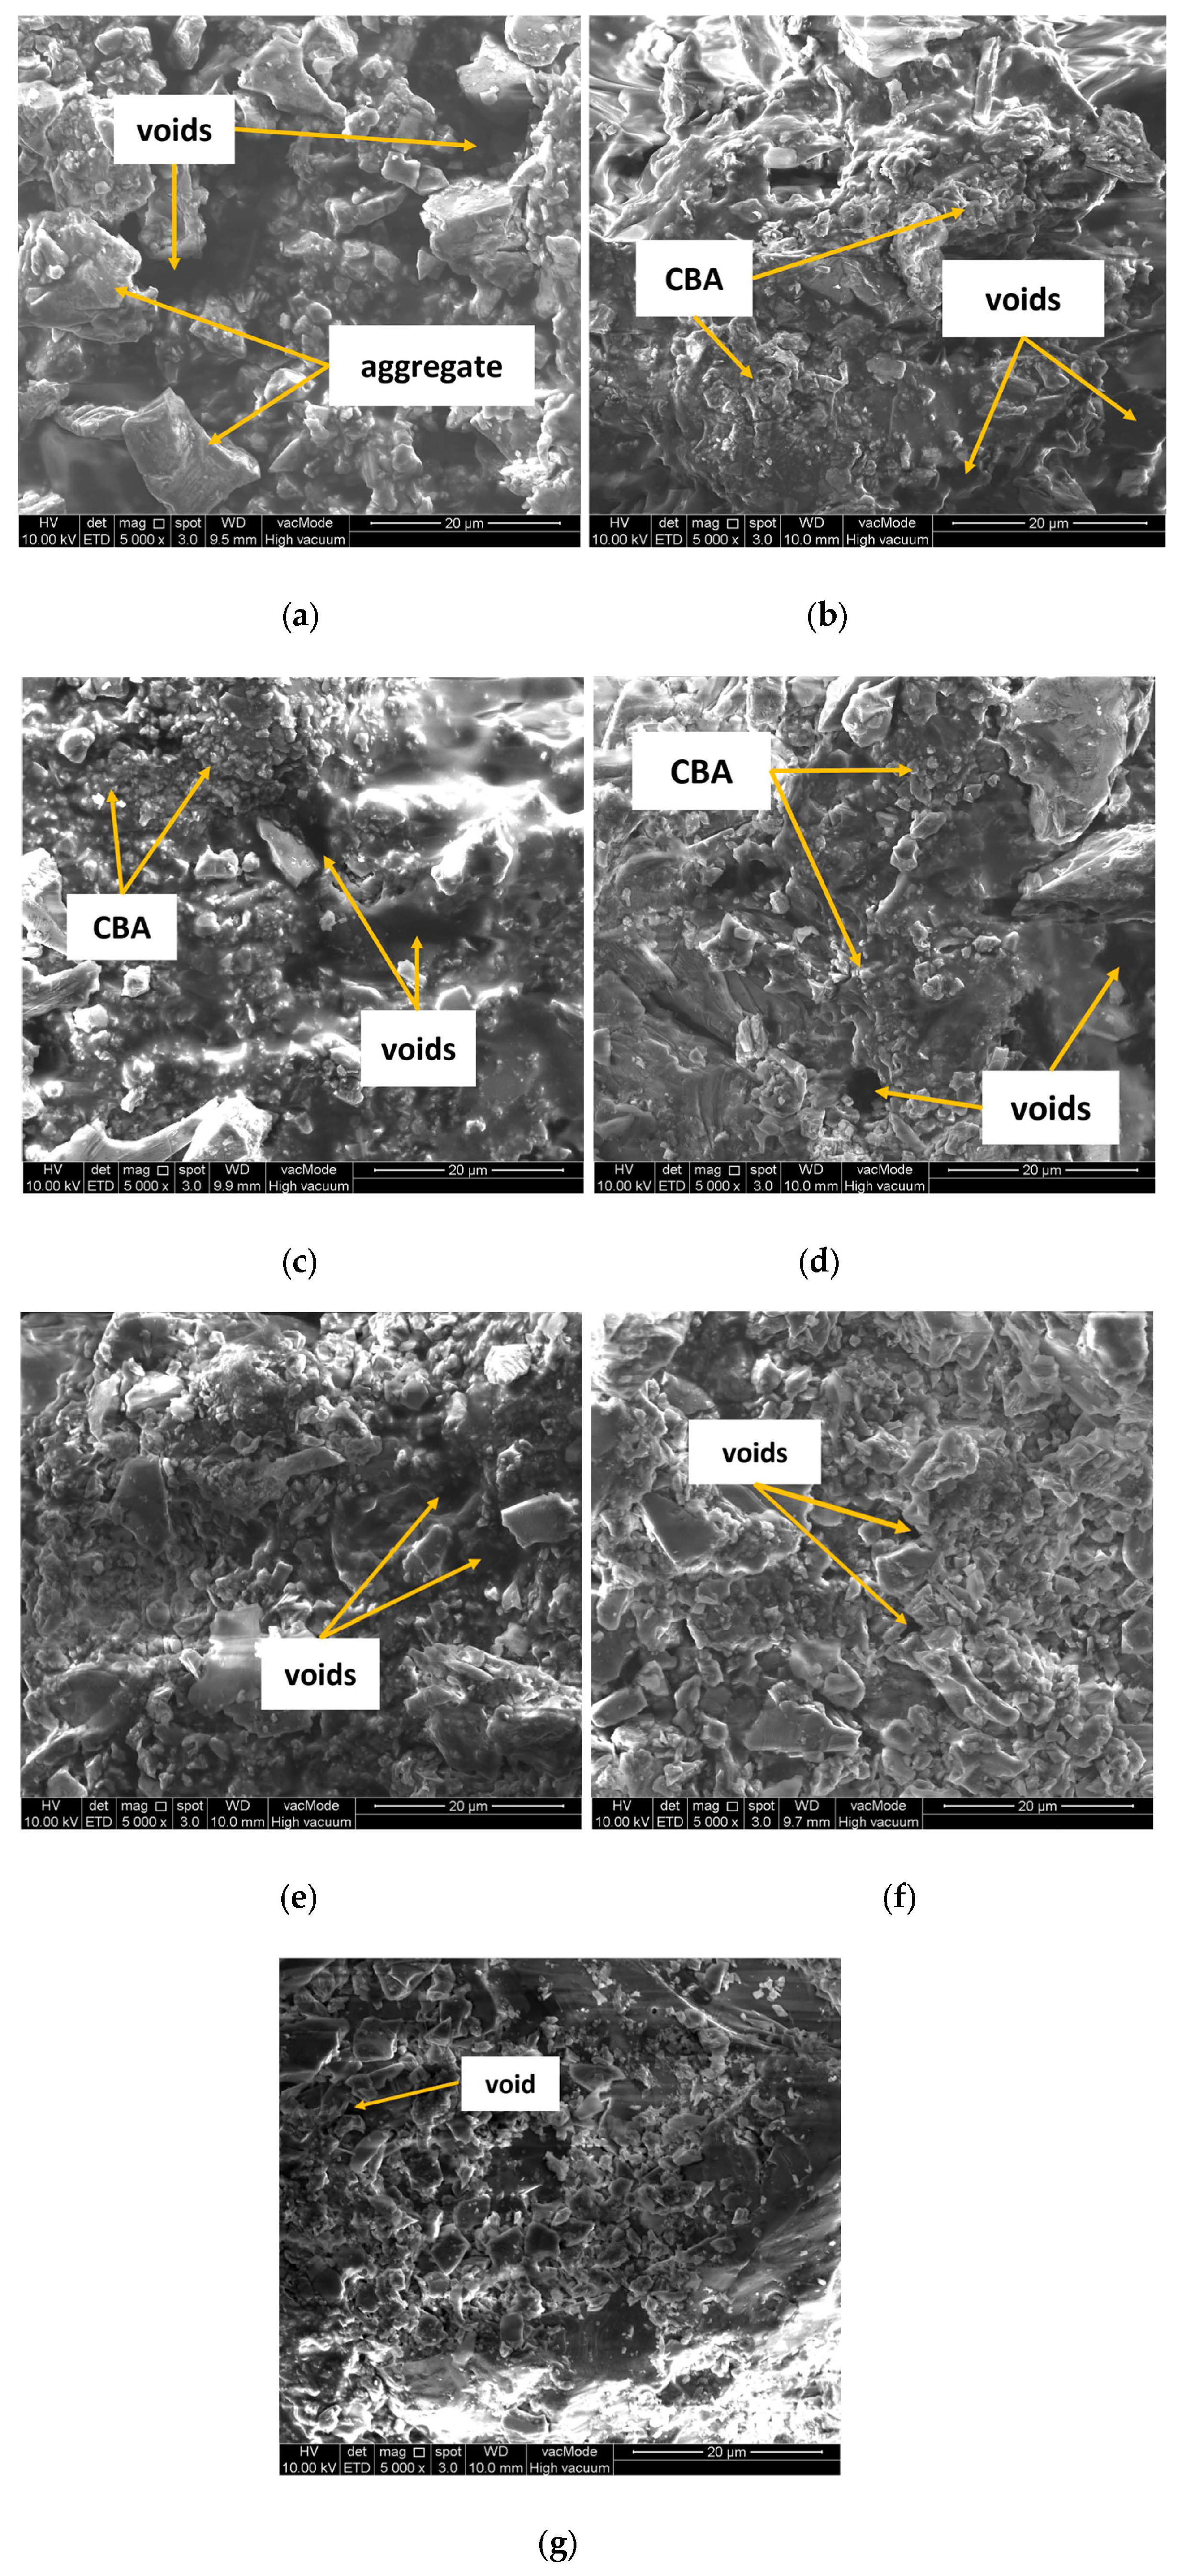
3.7.2. Asphalt Mixture with CBA

Figure 9a–g display the FESEM images of CBA mixtures with different CBA contents. The FESEM analysis reveals that the control mixture (CBA0) (Figure 9a) displays a smooth and continuous bitumen phase that effectively occupies the voids between aggregates, demonstrating strong binder–aggregate adhesion and efficient compaction. At lower CBA contents (CBA10–CBA30) (Figure 9b–d), only a minor surface roughness and a reduction in voids occupied by bitumen are observed. At elevated contents (CBA70 and CBA100) (Figure 9f,g), the CBA particles progressively fill the intergranular voids, leading to a decrease in the volume of the bitumen-filled voids. This is indicated by the visibly rough and jagged surfaces observed in the FESEM micrographs. The rough surface texture, irregular morphology, and high porosity of CBA significantly disrupt the continuity of the bitumen film.

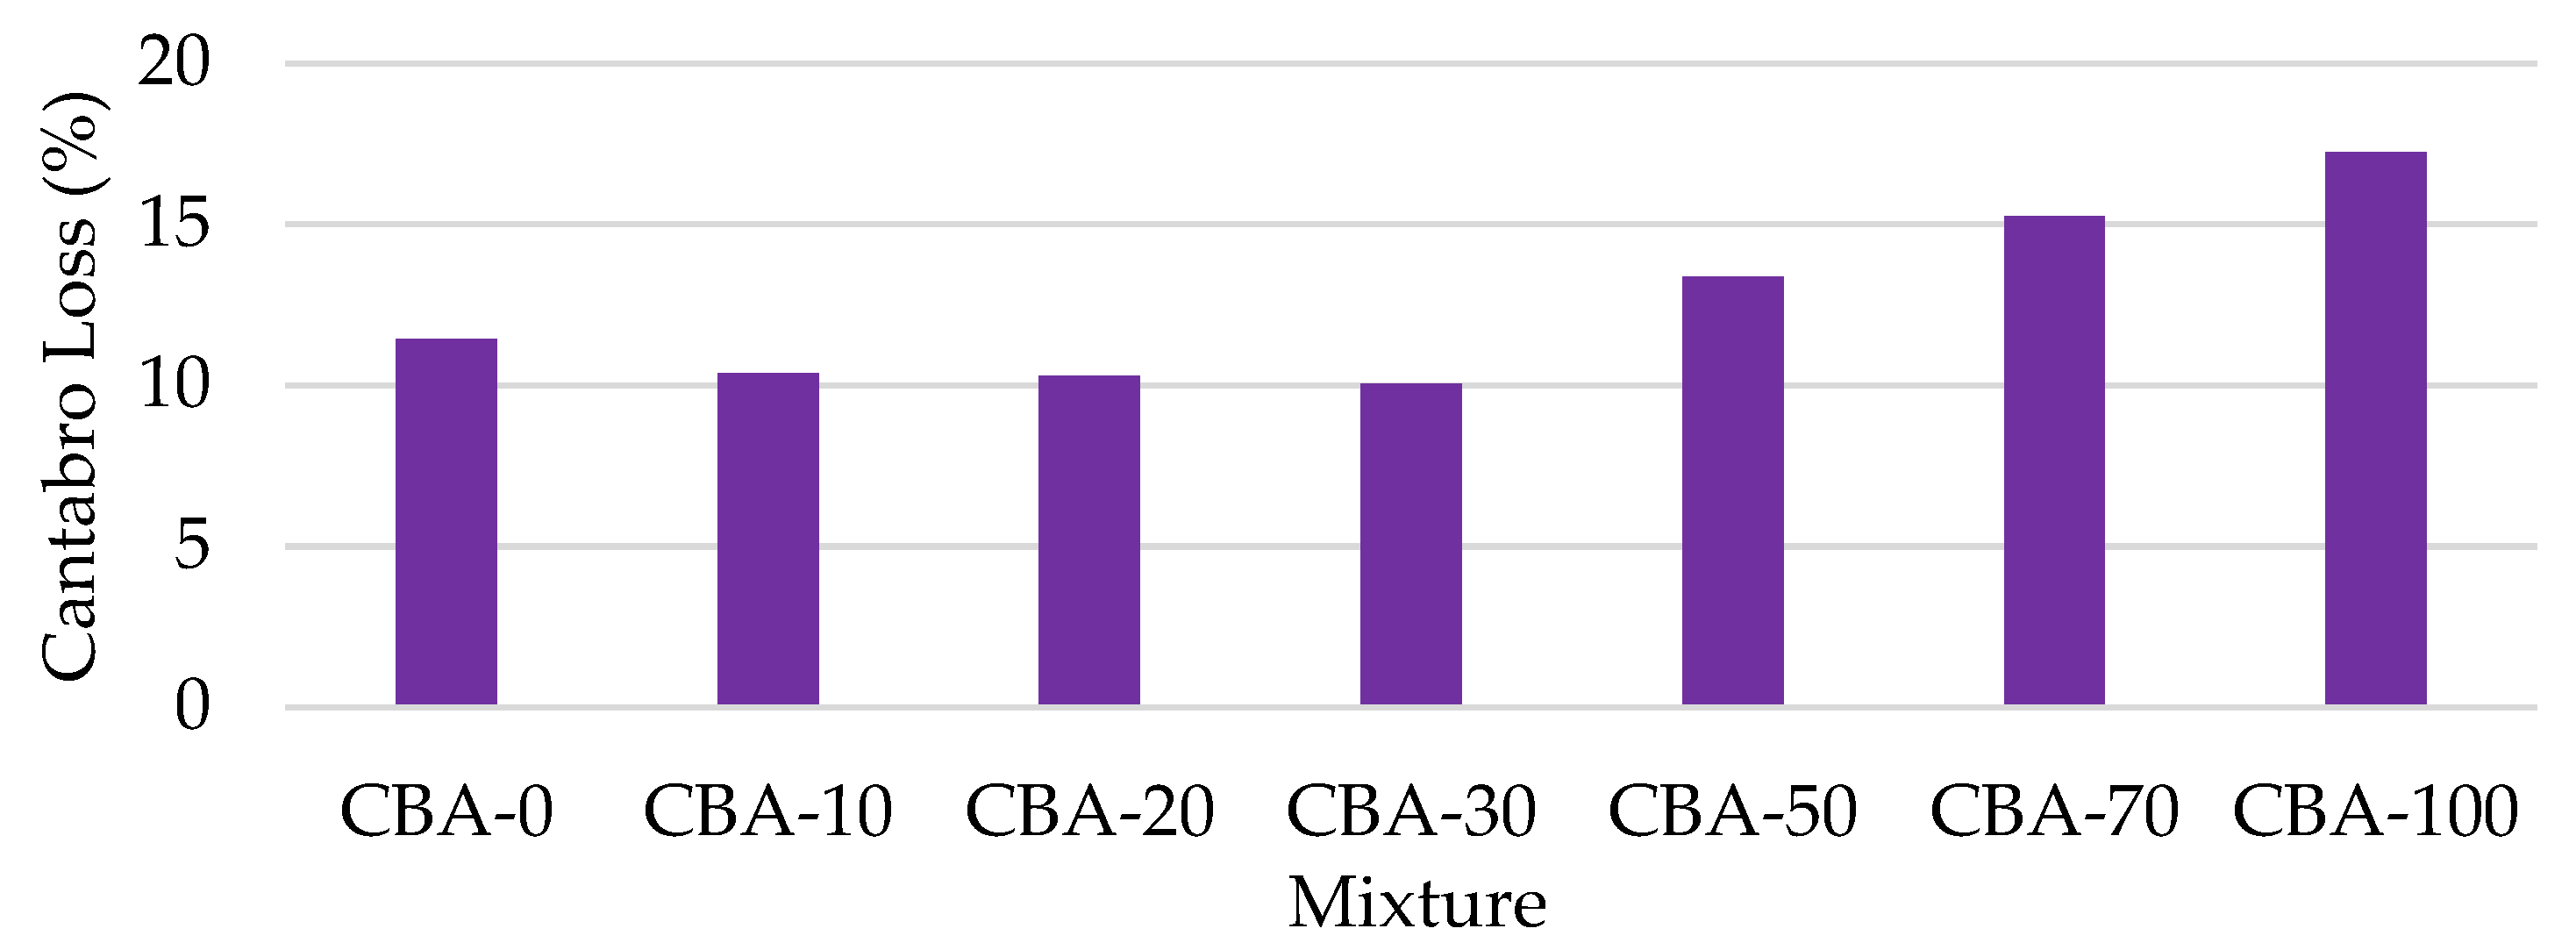
3.8. Cantabro Test Results

Figure 10 illustrates the Cantabro mass loss for the CBA mixture. The results demonstrate that substituting 30% coal bottom ash in an asphalt mixture decreases the Cantabro mass loss, hence enhancing the mixture’s durability. The normalized Cantabro mass loss data in Table 7 show that the mixtures CBA-10–CBA-30 had better resistance to wear and tear than the control mixture CBA-0. This is evident from the fact that the Cantabro mass loss for CBA-10, CBA-20, and CBA-30 decreased by factors of 0.91, 0.90, and 0.88, respectively, in comparison to the Cantabro mass loss of the control mixture. When 30% of the aggregate is substituted with CBA, the porosity of CBA enables the mixture to absorb more bitumen. This absorption enhances the adhesion between the aggregate particles and bitumen, resulting in a stronger and more cohesive mixture. Improved bonding increases the asphalt mixture’s resistance to abrasion and particle dislodging. Consequently, the reduction in Cantabro mass loss indicates better durability. Although there is a slight increase in the void content (attributed to CBA absorbing more bitumen), this increase is insufficient to negatively impact the durability of the mixture.
However, when the CBA content exceeds 30%, the Cantabro mass loss increases significantly, indicating a decrease in durability. The observed reduction in the CBA-50 mixture due to Cantabro mass loss is 13.37%, representing a 1.17-fold increase when compared to the control mixture. Despite the observed rise in the Cantabro value for the CBA-50 mixture, it remains within the acceptable range as specified by the JKR standard. Specifically, the minimum mass loss requirement for a mixture after 300 rotations is 15% [49]. The further increase in the Cantabro mass loss of the CBA mixture was attributed to several reasons. One of the reasons is the excessive bitumen that was absorbed. As the CBA content increases, the absorption of bitumen also rises. The excessive absorption of bitumen reduces the effective bitumen content required to coat the remaining aggregates. This results in an imbalance, causing insufficient bonding among the aggregate particles. Further, the porous nature of CBA contributes to an increase in air voids, resulting in a greater number of gaps within the mixture. This phenomenon reduces the mixture’s density and enhances its susceptibility to damage. Furthermore, the coal bottom ash is lighter and weaker compared to conventional aggregate, and this results in a mixture that is more susceptible to wear, disintegration, and cracking, particularly under traffic loading, further contributing to the increase in the Cantabro mass loss.

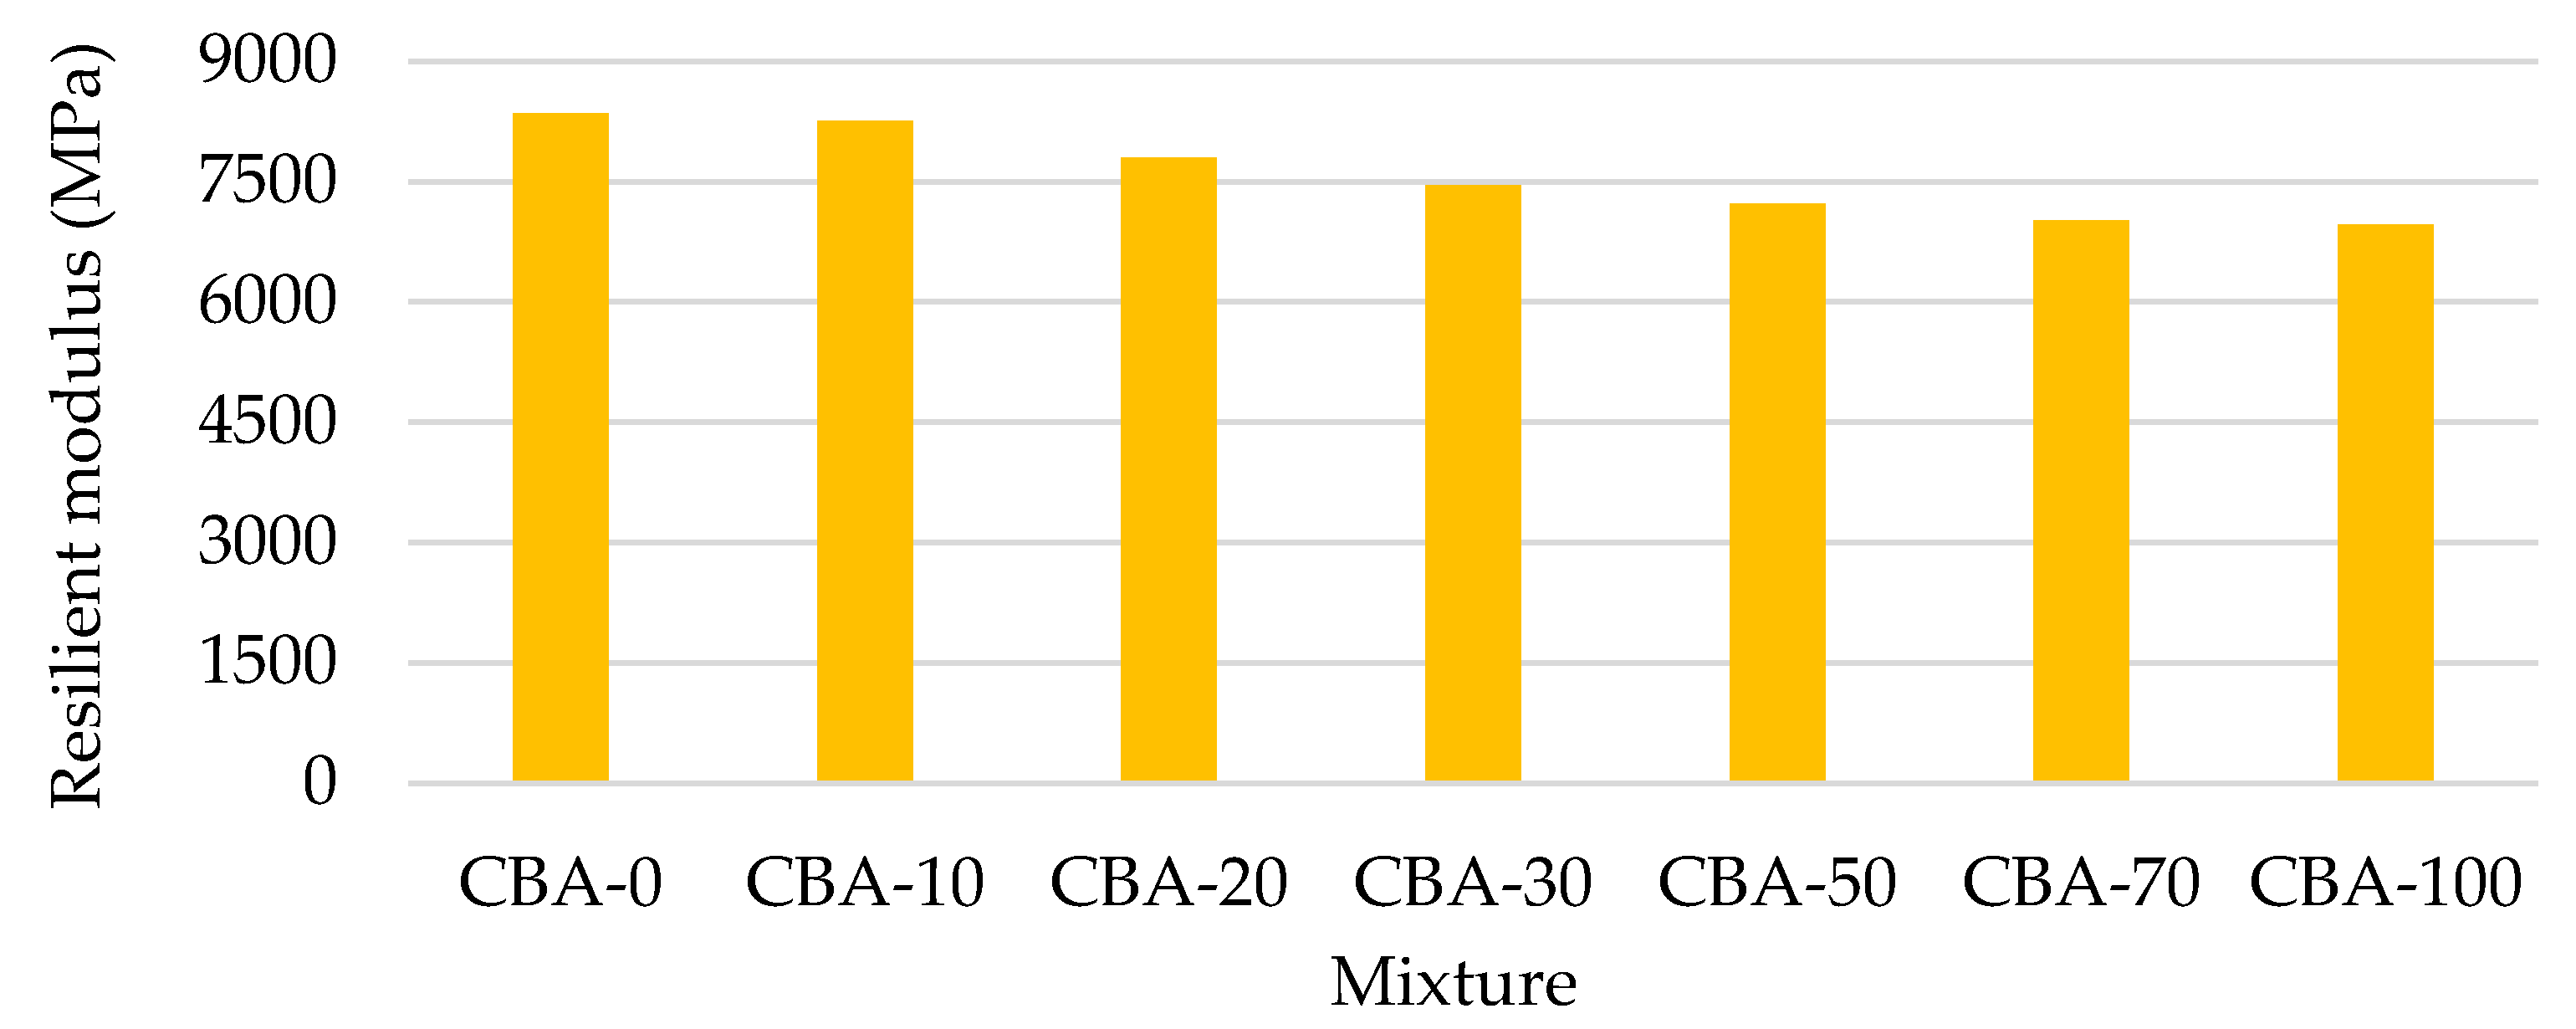
3.9. Resilient Modulus Test Results

Figure 11 illustrates the results of the resilient modulus of the CBA mixture. The results demonstrated a consistent decline in the resilient modulus values as the CBA content increased. The resilient modulus denotes the capacity of a mixture to return to its original shape and properties after the release of a load [66]. The results indicated that the CBA-0 mixture showed the greatest resilient modulus compared to the mixtures with CBA content. The resilient modulus for the CBA-0 mixture was 8351, as shown in Figure 11. It was observed that the resilient modulus of the CBA mixture demonstrates a negative correlation with the increase in CBA content. The decrease in the resilient modulus value in the CBA-10 and CBA-20 mixtures was minimal. According to the normalised data presented in Table 8, the resilient modulus of CBA-10 and CBA-20 decreased by 0.01 (a 1% reduction) and 0.07 (a 7% reduction) compared to the control mixture, respectively.
An increase in the CBA content consistently led to lower resilient modulus values. As presented in Table 8, The CBA-30, CBA-50, CBA-70, and CBA-100 mixtures exhibited a gradual decrease in their resilient modulus values, which was demonstrated by normalised values of 0.89 (11% reduction), 0.86 (14% reduction), 0.84 (16% reduction), and 0.83 (17% reduction), respectively, compared to the control mixture. The resilient modulus, representing the elastic stiffness component, indicated that a lower value implies that increasing the CBA content reduces the elastic stiffness under repeated loads. This phenomenon is due to the high porosity and low density of CBA particles, which decrease the elastic stiffness of the asphalt mixture. The increased porosity reduces the aggregate structure’s density, thereby reducing the mixture’s resilience under repeated loading. Consequently, the mixture demonstrates a decreased resilient modulus, suggesting reduced stiffness.

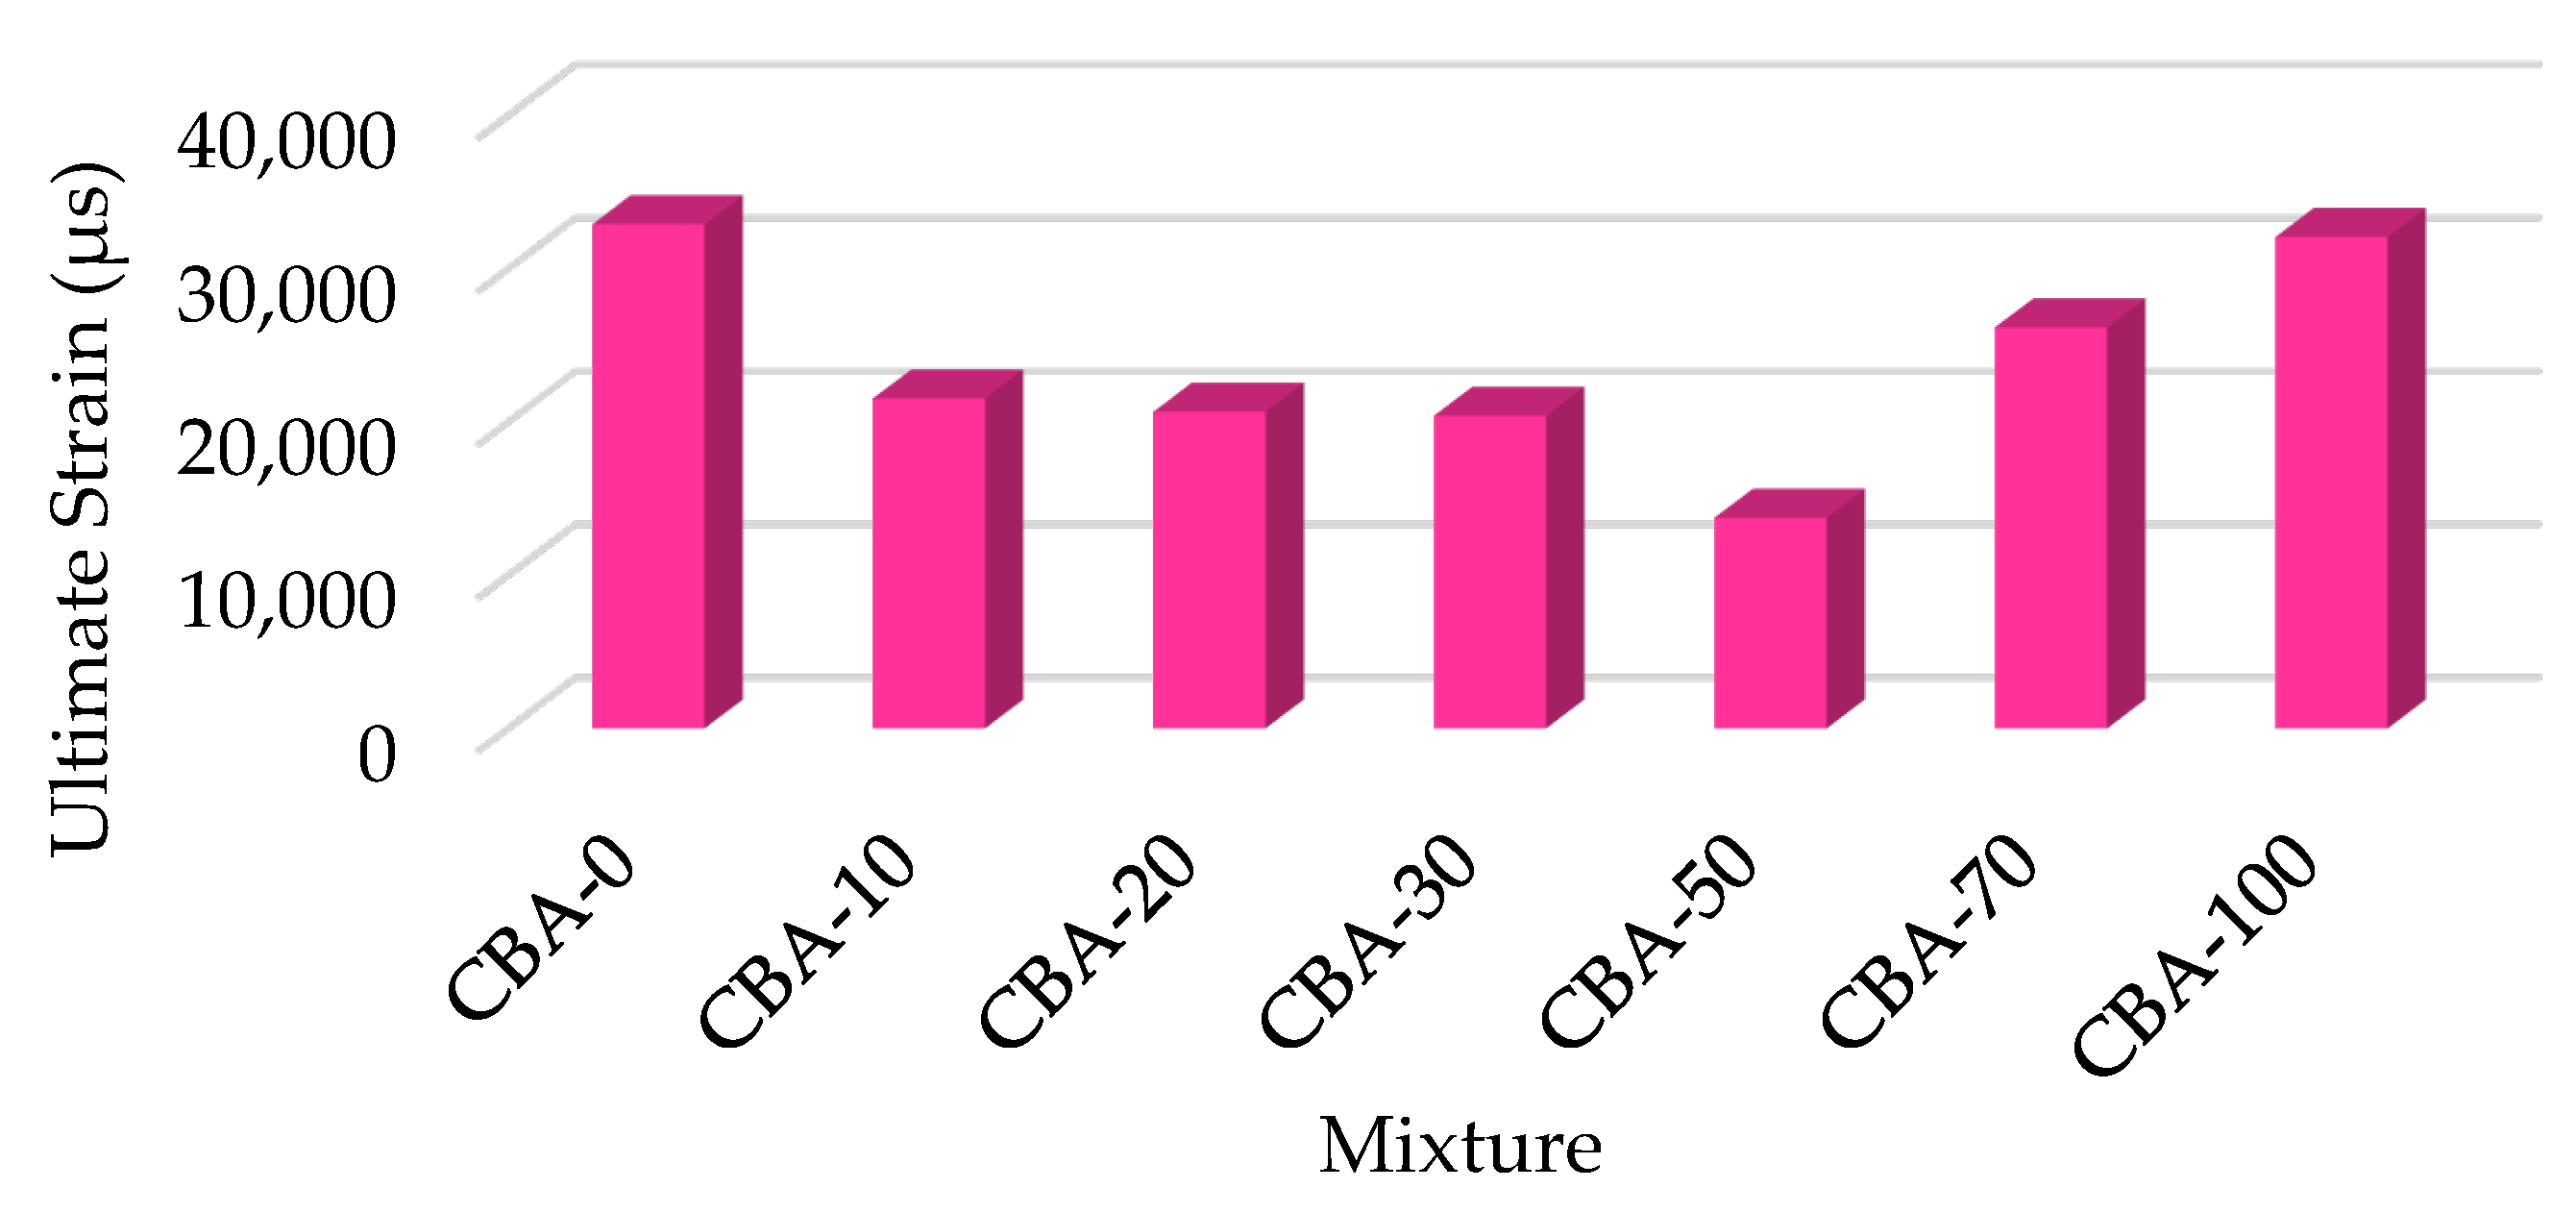
3.10. Dynamic Creep Curve and Ultimate Strain

Figure 12 illustrates the relationship between the accumulated strain and the number of cycles for the CBA mixtures. The results demonstrated a positive correlation between the number of load cycles and the increase in the accumulated permanent strain for all CBA mixtures. The findings indicated that all CBA mixtures reached the secondary phase of the creep curve. The first phase is determined by the recoverable elastic strain resulting from the densification of the mixture, whereas the subsequent phase is associated with the viscoelastic strain arising from cumulative axial strain [67,68]. The CBA mixture did not advance to the tertiary stage in this test, as the sample was terminated either after 1800 load cycles or upon reaching a total strain of 100,000 µs.
Figure 13 presents the results of the ultimate strains for all CBA mixtures. The results indicated that the CBA-0 mixture showed the greatest strain value compared to other mixtures with increased CBA contents. The ultimate strain for the CBA-0 mixture was measured at 32,906 µs. The mixtures with higher cumulative axial strain values demonstrated a reduced capacity to resist rutting [69]. The ultimate strain demonstrated a negative correlation with the increase in CBA content, up to 50% of CBA replacement, as presented in Figure 9. The ultimate strain of the CBA-10 mixture was measured at 21,535 µs, representing 0.65 times the ultimate strain of the control mixture, as tabulated in Table 9. Subsequently, the CBA-20 and CBA-30 mixtures demonstrated a gradual decrease in their ultimate strain values, with normalised values of 0.63 and 0.62 times, respectively, compared to the control mixture.
Table 9 indicates that the CBA-50 mixture demonstrated enhanced resistance to permanent deformation compared to the other CBA mixtures. The ultimate strains recorded at the lowest value for the CBA-50 mixture were measured at 13,747 µs. The measured value was determined to be 0.42 times that of the control mixture. This finding suggests that increasing the proportion of CBA offers the potential to enhance the mixture’s ability to withstand permanent deformation. The reduction in the ultimate strain value is due to enhanced interlocking between the aggregate and CBA particles, which is facilitated by the rough and irregular shape of the CBA. Increased interparticle friction contributes to the stabilization of the mixture, thereby minimizing the strain accumulation during sustained loading. This mixture exhibited reduced ultimate strain, indicating enhanced resistance to permanent deformation in the creep test. The observed patterns of decline began to shift at CBA-70. The ultimate strains recorded for CBA-70 and CBA-100 were 26,170 µs and 32,070 µs, respectively. Even though there were increases in the ultimate strain value for CBA-70 and CBA-100, it is essential to note that the values were still lower than that observed in the CBA-0 mixture.

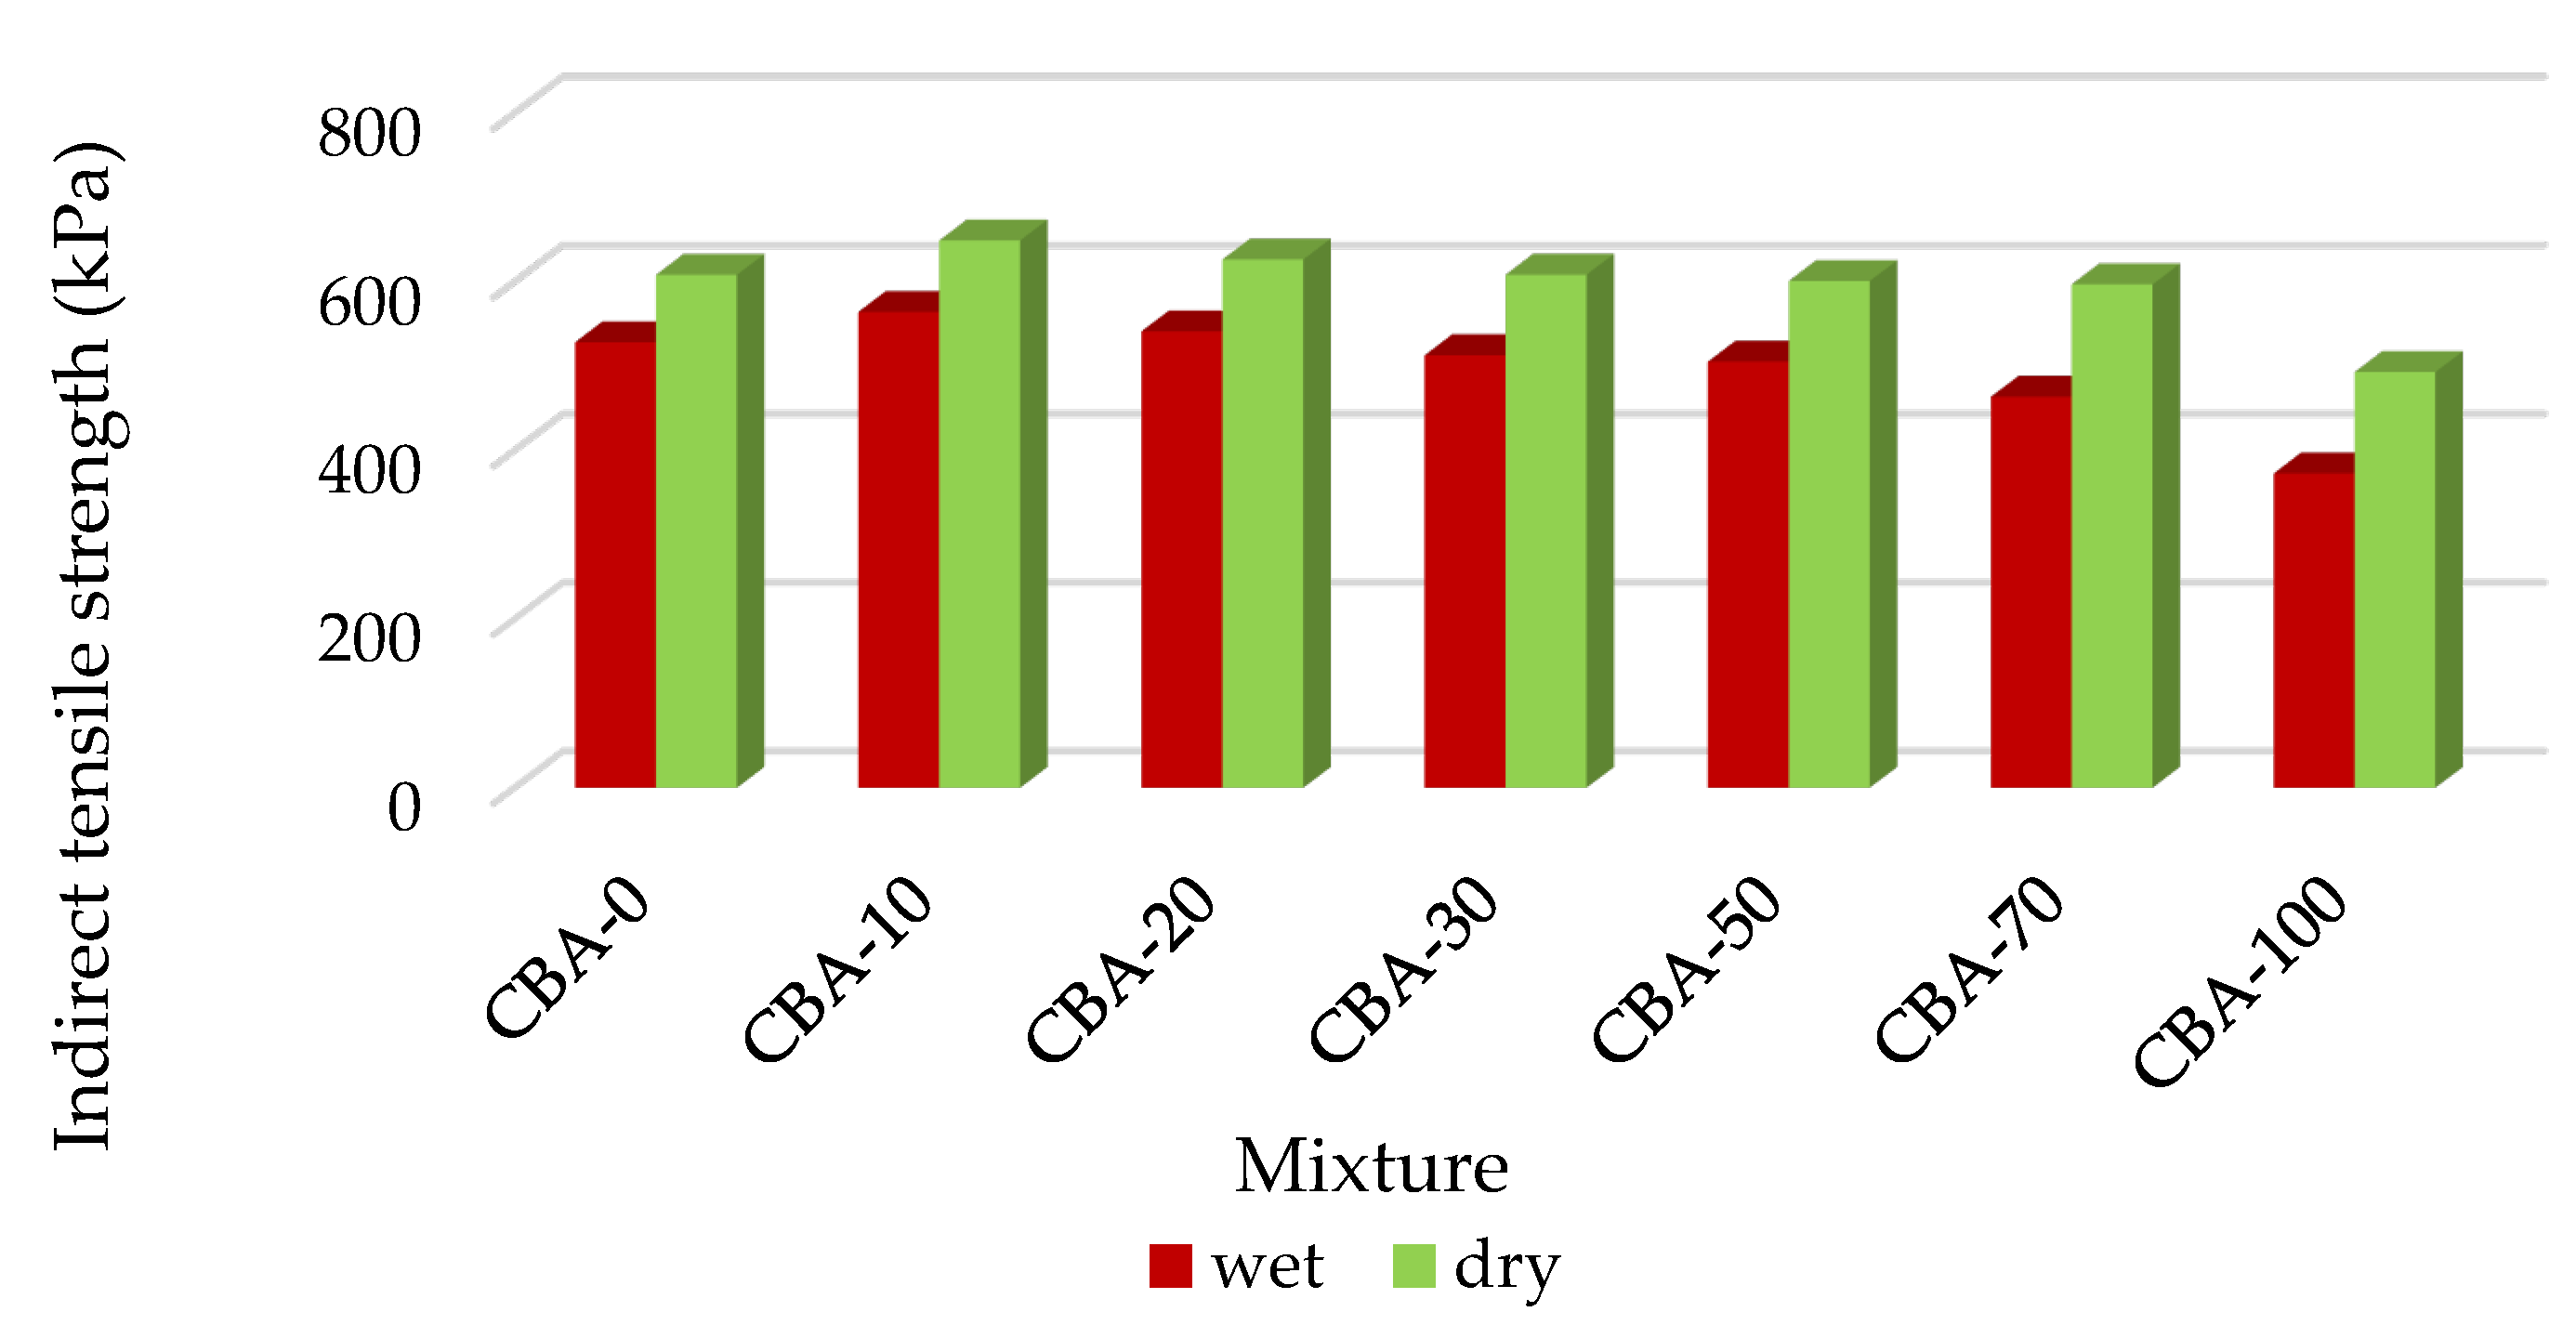
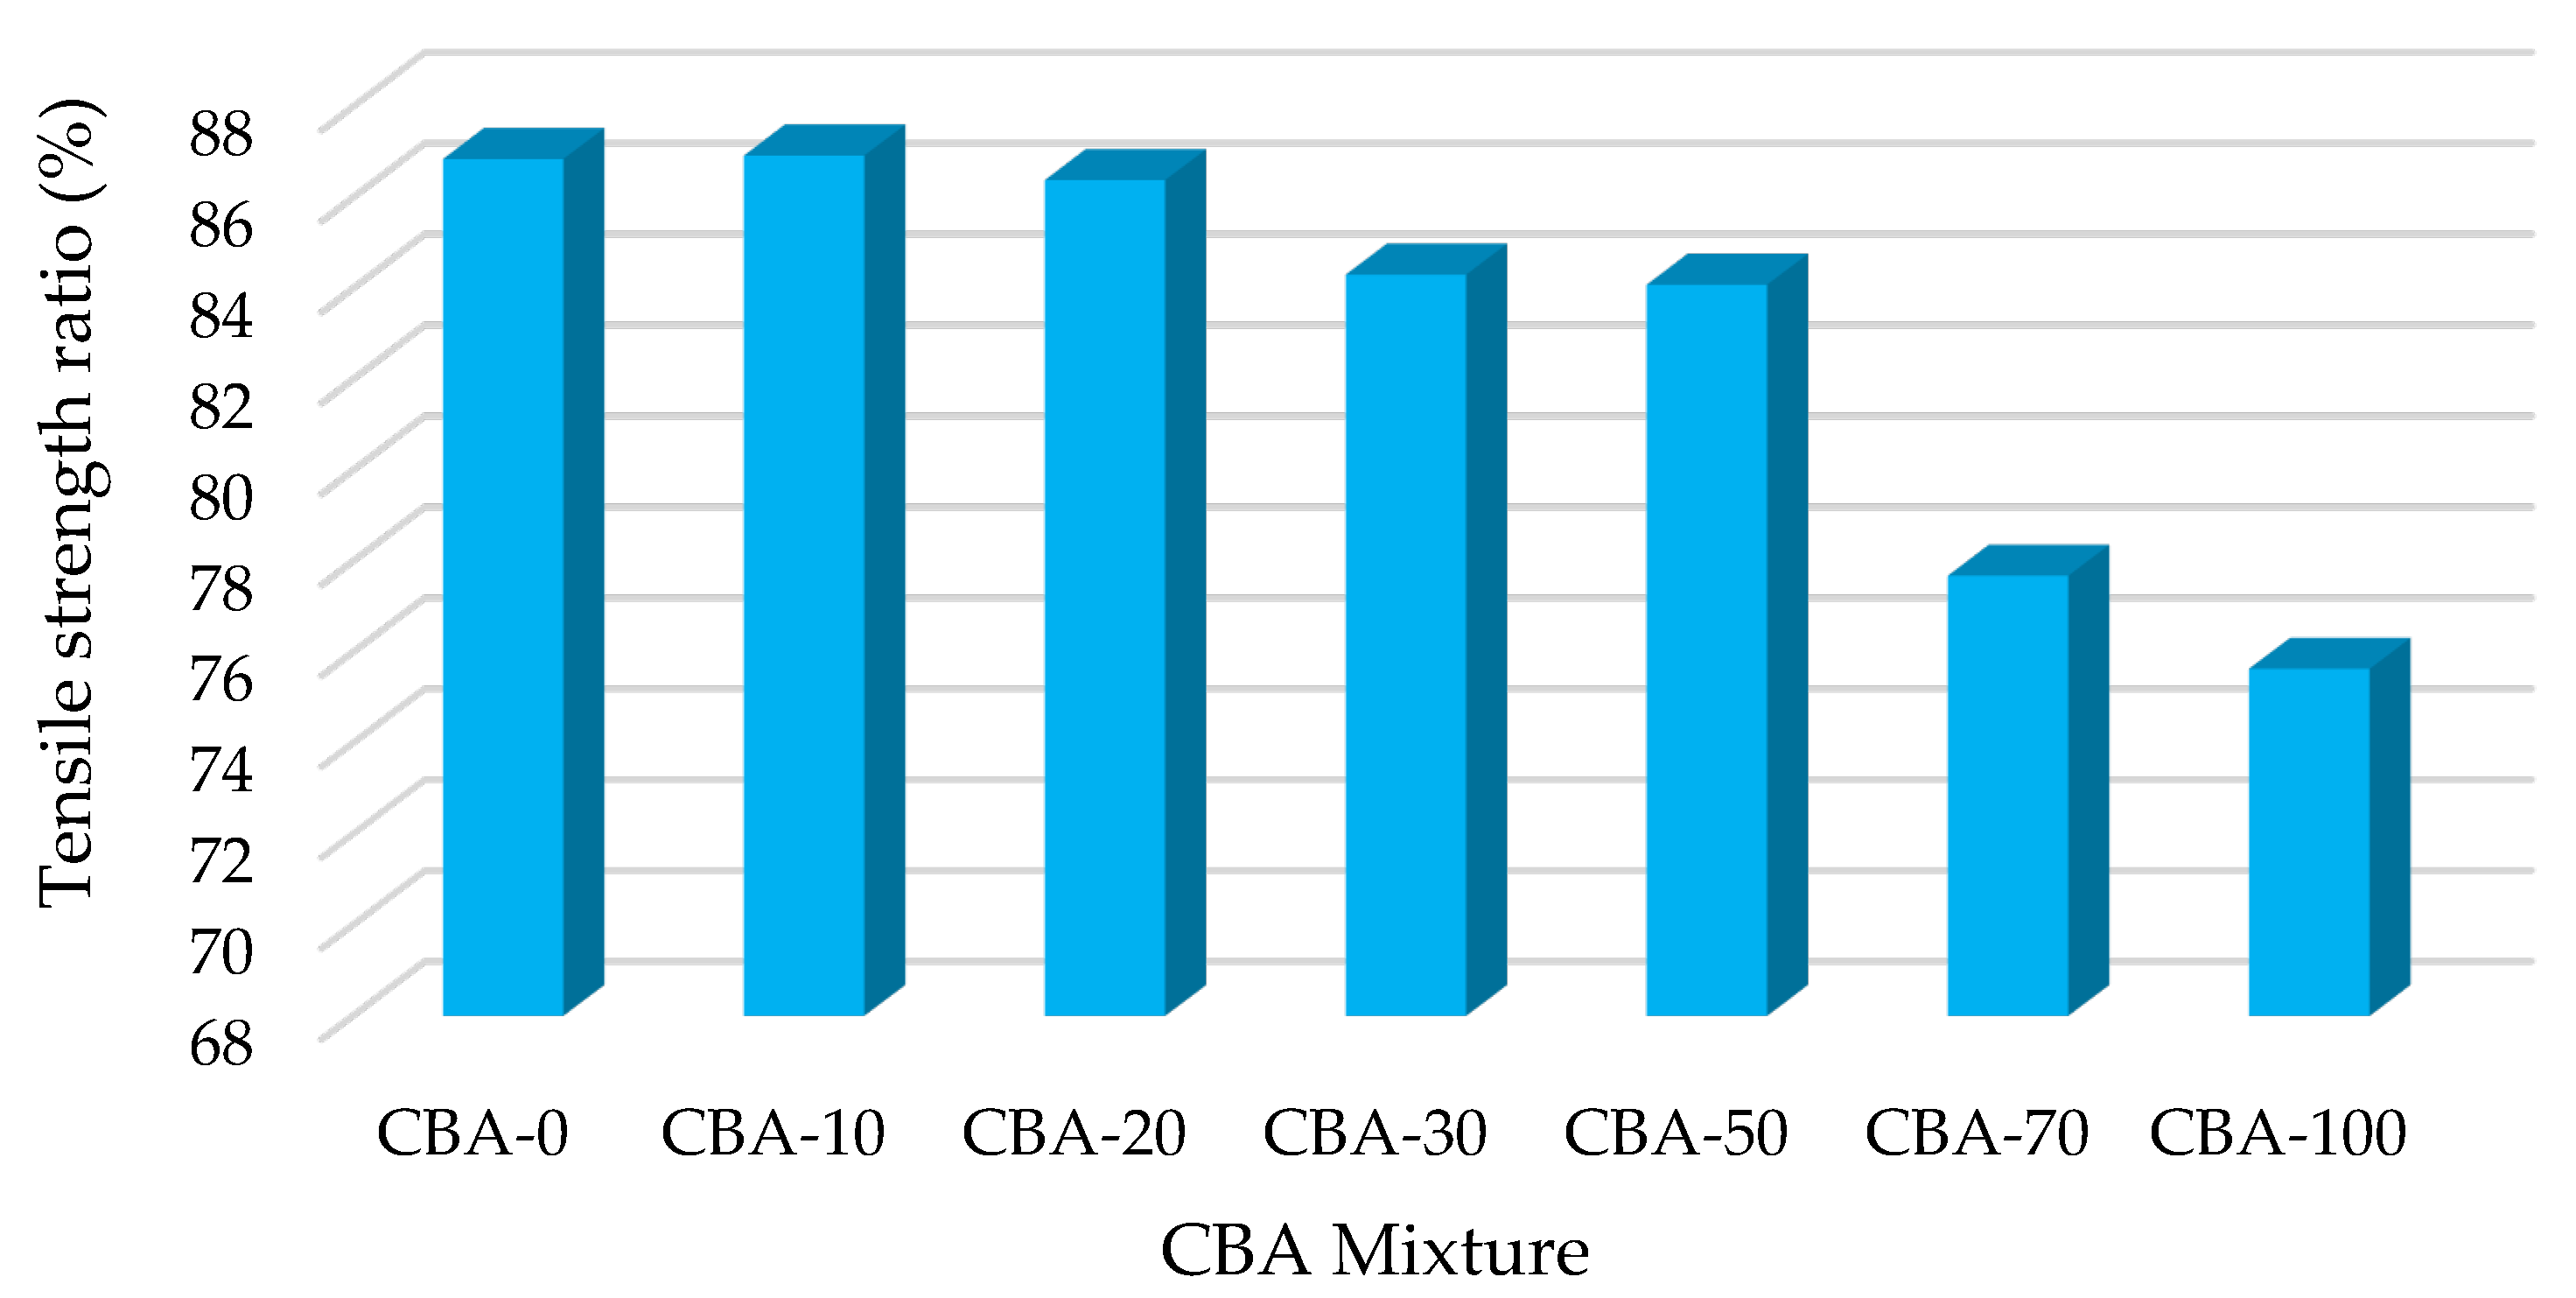
3.11. Moisture Susceptibility Test Results

Moisture susceptibility represents the capacity of an asphalt mixture to resist damaging effects caused by water. The bonds between the aggregates and asphalt binder weaken due to moisture accumulation within the mixture. This situation led to the rapid development of multiple types of strain and deformation, such as rutting, cracking, ravelling, and potholes. Pavement distress is mainly related to the presence of water and leads to costly maintenance solutions. A moisture susceptibility test was conducted to evaluate the tendency of SMA mixtures containing CBA towards moisture-induced deterioration. Figure 14 illustrates the tensile strengths of the CBA mixtures in both unconditioned (dry) and conditioned (wet) states. The results demonstrated that the wet-conditioned CBA mixtures consistently exhibited lower values than the dry-unconditioned CBA mixtures. The presence of water has been shown to reduce the tensile strength of CBA mixtures. The results in Figure 14 indicate that the CBA-10 and CBA-20 mixtures demonstrated higher tensile strengths under both wet and dry conditions than the control mixture. The coarse texture and angular shape of the CBA enhance interlocking and bonding within the asphalt mixture. Previous research indicated a comparable trend in tensile strength, in which the incorporation of up to 20% CBA resulted in an initial increase in tensile strength, followed by a decline with a subsequent rise in CBA content [43].
The tensile strength ratio (TSR) for all CBA mixtures was calculated, with the normalised value being presented in Figure 15 and Table 10, respectively. The data indicate that all CBA mixtures, except for CBA-70 and CBA-100, satisfied the minimum tensile strength ratio (TSR) requirement of 80%, which is recommended by AASHTO T283 and the Malaysian Public Works Department for road construction. The findings demonstrated that the CBA-10 mixture displayed a TSR value similar to that of the control mixture. As the CBA content increases, there is a corresponding decrease in the TSR value. The TSR value of CBA-20 is 86.4%, which is 0.99 times the value of the control mixture. The TSR value for CBA-30 is 84.3%, whereas the TSR value for the CBA-50 mixture is 84.1%. This value indicates a 0.01–0.03% reduction relative to the control mixture. A decrease in the TSR value suggests that the CBA mixture has less ability to resist moisture-induced deterioration [70]. The porous and absorptive characteristics of CBA facilitate increased water infiltration into the mixture. A recent study [71] found that substituting 20% CBA in both hot and warm mix asphalt reduced the TSR value of both mixtures. Previous research [72] observed comparable results when employing CBA as a replacement for fine aggregate in HMA to create the wearing course of an asphalt mixture.

4. Conclusions

The study of the results has led to the following conclusions:
1.
Moderate CBA content enhances durability, as a 30% CBA replacement reduces the Cantabro mass loss. However, a higher CBA content weakens the structure and increases the mass loss;
2.
The resilient modulus of the CBA mixtures decreased as the content of CBA increased. The reduction was minimal, less than 10%, with up to 20% CBA replacement. An increased CBA content resulted in a reduced modulus, which decreased the elastic stiffness of the mixture;
3.
The permanent deformation increased up to 50% CBA replacement. This characteristic of CBA enhances interparticle friction, stabilizing the mixture and diminishing the strain under sustained loading, resulting in improved permanent deformation resistance;
4.
CBA improved the tensile strength of asphalt mixtures in both wet and dry conditions. Up to 50% CBA satisfied the minimum TSR requirement of 80%, but higher CBA contents reduced the moisture resistance.

Author Contributions

Conceptualization, S.A.M.; methodology, S.A.M.; formal analysis, S.A.M. and S.K.; investigation, S.A.M., A.M.B. and F.H.K.; resources, S.K.; writing—original draft preparation, S.A.M.; writing—review and editing, S.A.M., S.K., M.H.M.I.; supervision, S.K.; funding acquisition, S.K., S.A.M., A.M.B., M.H.M.I. and F.H.K. All authors have read and agreed to the published version of the manuscript.

Funding

This research received no external funding.

Institutional Review Board Statement

Not applicable.

Informed Consent Statement

Not applicable.

Data Availability Statement

All data used in this research can be provided upon request.

Acknowledgments

The authors would like to acknowledge the Universiti Malaysia Perlis and Universiti of Malaya.

Conflicts of Interest

The authors declare no conflicts of interest.

References

  1. Kim, R.G.; Li, D.; Jeon, C.H. Experimental investigation of ignition behavior for coal rank using a flat flame burner at a high heating rate. Exp. Therm. Fluid Sci. 2014, 54, 212–218. [Google Scholar] [CrossRef]
  2. Gooi, S.; Mousa, A.A.; Kong, D. A critical review and gap analysis on the use of coal bottom ash as a substitute constituent in concrete. J. Clean. Prod. 2020, 268, 121752. [Google Scholar] [CrossRef]
  3. Antoni; Klarens, K.; Indranata, M.; Al Jamali, L.; Hardjito, D. The use of bottom ash for replacing fine aggregate in concrete paving blocks. MATEC Web Conf. 2017, 138, 01005. [Google Scholar] [CrossRef]
  4. Hower, J.C.; Granite, E.J.; Mayfield, D.B.; Lewis, A.S.; Finkelman, R.B. Notes on contributions to the science of rare earth element enrichment in coal and coal combustion byproducts. Minerals 2016, 6, 32. [Google Scholar] [CrossRef]
  5. Szatyłowicz, E.; Walendziuk, W. Analysis of polycyclic aromatic hydrocarbon content in ash from solid fuel combustion in low-power boilers. Energies 2021, 14, 6801. [Google Scholar] [CrossRef]
  6. Hamada, H.; Alattar, A.; Tayeh, B.; Yahaya, F.; Adesina, A. Sustainable application of coal bottom ash as fine aggregates in concrete: A comprehensive review. Case Stud. Constr. Mater. 2022, 16, e01109. [Google Scholar] [CrossRef]
  7. Yao, Z.T.; Ji, X.S.; Sarker, P.K.; Tang, J.H.; Ge, L.Q.; Xia, M.S.; Xi, Y.Q. Earth-Science Reviews A comprehensive review on the applications of coal fly ash. Earth-Sci. Rev. 2015, 141, 105–121. [Google Scholar] [CrossRef]
  8. Hashemi, S.S.G.; Mahmud, H.B.; Ghuan, T.C.; Chin, A.B.; Kuenzel, C.; Ranjbar, N. Safe disposal of coal bottom ash by solidification and stabilization techniques. Constr. Build. Mater. 2019, 197, 705–715. [Google Scholar] [CrossRef]
  9. Marto, A.; Hassan, M.A.; Makhtar, A.M.; Othman, B.A. Shear Strength Improvement of Soft Clay Mixed with Tanjung Bin Coal Ash. APCBEE Procedia 2013, 5, 116–122. [Google Scholar] [CrossRef]
  10. Topçu, I.B.; Bilir, T. Effect of bottom ash as fine aggregate on shrinkage cracking of mortars. ACI Mater. J. 2010, 107, 48–56. [Google Scholar]
  11. ASTM C618; Standard Specification for Coal Fly Ash and Raw or Calcined Natural Pozzolan for Use in Concrete. ASTM International: West Conshohocken, PA, USA, 2015.
  12. Lior, N. Sustainable energy development: The present (2009) situation and possible paths to the future. Energy 2010, 35, 3976–3994. [Google Scholar] [CrossRef]
  13. Mokhtar, M.M.; Hassim, M.H.; Taib, R.M. Health risk assessment of emissions from a coal-fired power plant using AERMOD modelling. Process Saf. Environ. Prot. 2014, 92, 476–485. [Google Scholar] [CrossRef]
  14. Abubakar, A.U.; Baharudin, K.S. Tanjung Bin Coal Bottom Ash: From Waste to Concrete Material. Adv. Mater. Res. 2013, 705, 163–168. [Google Scholar] [CrossRef]
  15. Ahmaruzzaman, M. A review on the utilization of fly ash. Prog. Energy Combust. Sci. 2010, 36, 327–363. [Google Scholar] [CrossRef]
  16. Heidrich, C.; Feuerborn, H.; Weir, A. Coal Combustion Products: A Global Perspective. World Coal Ash Conf. 2013, 22, 25. [Google Scholar]
  17. Sutcu, M.; Erdogmus, E.; Gencel, O.; Gholampour, A.; Atan, E.; Ozbakkaloglu, T. Recycling of bottom ash and fly ash wastes in eco-friendly clay brick production. J. Clean. Prod. 2019, 233, 753–764. [Google Scholar] [CrossRef]
  18. Pahroraji, M.; Hafez, M.E.; Saman, H.M.; Rahmat, M.N.; Kamaruddin, K. Properties of coal ash foamed brick stabilised with hydrated lime-activated ground granulated blastfurnace slag. Constr. Build. Mater. 2020, 235, 117568. [Google Scholar] [CrossRef]
  19. Rathnayake, M.; Julnipitawong, P.; Tangtermsirikul, S.; Toochinda, P. Utilization of coal fly ash and bottom ash as solid sorbents for sulfur dioxide reduction from coal fired power plant: Life cycle assessment and applications. J. Clean. Prod. 2018, 202, 934–945. [Google Scholar] [CrossRef]
  20. Singh, M.; Siddique, R. Effect of coal bottom ash as partial replacement of sand on workability and strength properties of concrete. J. Clean. Prod. 2016, 112, 620–630. [Google Scholar] [CrossRef]
  21. Singh, N.; Mithulraj, M.; Arya, S. Influence of coal bottom ash as fine aggregates replacement on various properties of concretes: A review. Resour. Conserv. Recycl. 2018, 138, 257–271. [Google Scholar] [CrossRef]
  22. Jayaranjan, M.L.D.; van Hullebusch, E.D.; Annachhatre, A.P. Reuse options for coal fired power plant bottom ash and fly ash. Rev. Environ. Sci. Biotechnol. 2014, 13, 467–486. [Google Scholar] [CrossRef]
  23. Pandey, V.C.; Singh, J.S.; Singh, R.P.; Singh, N.; Yunus, M. Arsenic hazards in coal fly ash and its fate in Indian scenario. Resour. Conserv. Recycl. 2011, 55, 819–835. [Google Scholar] [CrossRef]
  24. Su, T.; Wang, J. Modeling batch leaching behavior of arsenic and selenium from bituminous coal fly ashes. Chemosphere 2011, 85, 1368–1374. [Google Scholar] [CrossRef] [PubMed]
  25. Bashkin, V.N.; Wongyai, K. Environmental fluxes of arsenic from lignite mining and power generation in northern Thailand. Environ. Geol. 2002, 41, 883–888. [Google Scholar]
  26. Jang, J.G.; Ahn, Y.B.; Souri, H.; Lee, H.K. A novel eco-friendly porous concrete fabricated with coal ash and geopolymeric binder: Heavy metal leaching characteristics and compressive strength. Constr. Build. Mater. 2015, 79, 173–181. [Google Scholar] [CrossRef]
  27. Chakraborty, R.; Mukherjee, A. Mutagenicity and genotoxicity of coal fly ash water leachate. Ecotoxicol. Environ. Saf. 2009, 72, 838–842. [Google Scholar] [CrossRef]
  28. Thi, N.N.; Hong, T.P.; Truong, S.B. Utilizing Coal Bottom Ash from Thermal Power Plants in Vietnam as Partial Replacement of Aggregates in Concrete Pavement. J. Eng. 2019, 2019, 3903097. [Google Scholar]
  29. Argiz, C.; Sanjuán, M.Á.; Menéndez, E. Coal Bottom Ash for Portland Cement Production. Adv. Mater. Sci. Eng. 2017, 2017, 6068286. [Google Scholar] [CrossRef]
  30. Xiao, R.; Polaczyk, P.; Zhang, M.; Jiang, X.; Zhang, Y.; Huang, B.; Hu, W. Evaluation of Glass Powder-Based Geopolymer Stabilized Road Bases Containing Recycled Waste Glass Aggregate. Transp. Res. Rec. 2020, 2674, 22–32. [Google Scholar] [CrossRef]
  31. Costa, J.O.; Borges, P.H.R.; Santos, F.A.D.; Bezerra, A.C.S.; Van den bergh, W.; Blom, J. Cementitious binders and reclaimed asphalt aggregates for sustainable pavement base layers: Potential, challenges and research needs. Constr. Build. Mater. 2020, 265, 120325. [Google Scholar] [CrossRef]
  32. Simões, F.; Rios-Davila, F.J.; Paiva, H.; Morais, M.; Ferreira, V.M. Sustainability Evaluation of a Paper and Pulp Industrial Waste Incorporation in Bituminous Pavements. Appl. Sci. 2024, 14, 4846. [Google Scholar] [CrossRef]
  33. Mallick, R.B.; Radzicki, M.; Nanagiri, Y.V.; Veeraragavan, A. The impact of road construction on depletion of natural aggregates and consequence of delay in recycling pavement-key factors in sustainable road construction. Indian Highw. 2013, 41, 61–71. [Google Scholar]
  34. Gorakhki, M.H.; Bareither, C.A. Sustainable reuse of mine tailings and waste rock as water-balance covers. Minerals 2017, 7, 128. [Google Scholar] [CrossRef]
  35. Ramírez-Vargas, J.R.; Zamora-Castro, S.A.; Herrera-May, A.L.; Sandoval-Herazo, L.C.; Salgado-Estrada, R.; Diaz-Vega, M.E. A Review of Sustainable Pavement Aggregates. Appl. Sci. 2024, 14, 16. [Google Scholar] [CrossRef]
  36. Huang, Q.; Qian, Z.; Hu, J.; Zheng, D. Evaluation of Stone Mastic Asphalt Containing Ceramic Waste Aggregate for Cooling Asphalt Pavement. Materials 2020, 13, 2964. [Google Scholar] [CrossRef]
  37. Gautam, P.K.; Kalla, P.; Nagar, R.; Agrawal, R.; Jethoo, A.S. Laboratory investigations on hot mix asphalt containing mining waste as aggregates. Constr. Build. Mater. 2018, 168, 143–152. [Google Scholar] [CrossRef]
  38. Nwakaire, C.M.; Yap, S.P.; Yuen, C.W.; Onn, C.C.; Koting, S.; Babalghaith, A.M. Laboratory study on recycled concrete aggregate based asphalt mixtures for sustainable flexible pavement surfacing. J. Clean. Prod. 2020, 262, 121462. [Google Scholar] [CrossRef]
  39. Omrane, M.; Kenai, S.; Kadri, E.H.; Aït-Mokhtar, A. Performance and durability of self compacting concrete using recycled concrete aggregates and natural pozzolan. J. Clean. Prod. 2017, 165, 415–430. [Google Scholar] [CrossRef]
  40. Alinezhad, M.; Sahaf, A. Investigation of the fatigue characteristics of warm stone matrix asphalt (WSMA) containing electric arc furnace (EAF) steel slag as coarse aggregate and Sasobit as warm mix additive. Case Stud. Constr. Mater. 2019, 11, e00265. [Google Scholar] [CrossRef]
  41. Zawawi, M.N.A.A.; Muthusamy, K.; Majeed, A.P.P.A.; Musa, R.M.; Budiea, A.M.A. Mechanical properties of oil palm waste lightweight aggregate concrete with fly ash as fine aggregate replacement. J. Build. Eng. 2020, 27, 100924. [Google Scholar] [CrossRef]
  42. Babalghaith, A.M.; Koting, S.; Sulong, N.H.R.; Karim, M.R.; AlMashjary, B.M. Performance evaluation of stone mastic asphalt (SMA) mixtures with palm oil clinker (POC) as fine aggregate replacement. Constr. Build. Mater. 2020, 262, 120546. [Google Scholar] [CrossRef]
  43. Yoo, B.S.; Park, D.W.; Vo, H.V. Evaluation of Asphalt Mixture Containing Coal Ash. Transp. Res. Procedia 2016, 14, 797–803. [Google Scholar] [CrossRef]
  44. Colonna, P.; Berloco, N.; Ranieri, V.; Shuler, S.T. Application of Bottom Ash for Pavement Binder Course. Procedia-Soc. Behav. Sci. 2012, 53, 961–971. [Google Scholar] [CrossRef]
  45. Modarres, A.; Ayar, P. Coal waste application in recycled asphalt mixtures with bitumen emulsion. J. Clean. Prod. 2014, 83, 263–272. [Google Scholar] [CrossRef]
  46. ASTM D5; Standard Test Method for Penetration of Bituminous Materials. ASTM International: West Conshohocken, PA, USA, 2013.
  47. ASTM D36; Standard Test Method for Softening Point of Bitumen (Ring-and-Ball Apparatus). ASTM International: West Conshohocken, PA, USA, 2014.
  48. ASTM D4402; Standard Test Method for Viscosity Determination of Asphalt at Elevated Temperatures Using a Rotational Viscometer. ASTM International: West Conshohocken, PA, USA, 2015.
  49. Jabatan Kerja Raya (JKR) Malaysia. Standard Specification for Road Work, Section 4: Flexible Pavement; Malaysian Public Works Department: Kuala Lumpur, Malaysia, 2008. [Google Scholar]
  50. Environmental Quality Council. Environmental Quality (Scheduled Wastes) Regulations 2005; P.U.A 294-2005; Minister of Natural Resources and Environment: Putrajaya, Malaysia, 2005; pp. 2–6. [Google Scholar]
  51. ASTM C128; Standard Test Method for Relative Density (Specific Gravity) and Absorption of Fine Aggregate. ASTM International: West Conshohocken, PA, USA, 2022.
  52. ASTM D1559-89; Standard Test Method for Resistance to Plastic Flow of Bituminous Mixtures Using Marshall Apparatus. ASTM International: West Conshohocken, PA, USA, 1995.
  53. Sangiorgi, C.; Tataranni, P.; Simone, A.; Vignali, V.; Lantieri, C.; Dondi, G. Stone mastic asphalt (SMA) with crumb rubber according to a new dry-hybrid technology: A laboratory and trial field evaluation. Constr. Build. Mater. 2018, 182, 200–209. [Google Scholar] [CrossRef]
  54. ASTM C131; Standard Test Method for Resistance to Degradation of Small-Size Coarse Aggregate by Abrasion and Impact in the Los Angeles Machine. ASTM International: West Conshohocken, PA, USA, 2014.
  55. ASTM D4123; Standard Test Method for Indirect Tension Test for Resilient Modulus of Bituminous Mixtures. ASTM International: West Conshohocken, PA, USA, 1995.
  56. AS 2891.12.1; Methods of Sampling and Testing Asphalt Standards Australia, Method 12.1: Determination of the Permanent Compressive Strain Characteristics of Asphalt-Dynamic Creep Test. ASTM International: West Conshohocken, PA, USA, 1995.
  57. AASHTO T283; Resistance of Compacted Bituminous Mixture to Moisture Induced Damage. American Association of State Highway and Transportation Officials: Washington, DC, USA, 2007.
  58. NAPA. Designing and Constructing SMA Mixtures—State-of-the-Practice; National Asphalt Pavement Association (NAPA): Lanham, MD, USA, 2002; p. 43. [Google Scholar]
  59. Panda, M.; Suchismita, A.; Giri, J. Utilization of Ripe Coconut Fiber in Stone Matrix Asphalt Mixes. Int. J. Transp. Sci. Technol. 2013, 2, 289–302. [Google Scholar] [CrossRef]
  60. Vasudevan, G. Performance on Coal Bottom Ash in Hot Mix Asphalt. Int. J. Res. Eng. Technol. 2013, 2, 24–33. [Google Scholar]
  61. Mashaan, N.S. Use of Waste Tyre Rubber in Enhancing the Mechanical Properties of Stone Mastic Asphalt Mix. Ph.D. Thesis, University of Malaya, Kuala Lumpur, Malaysia, 2016. [Google Scholar]
  62. Babalghaith, A.M.; Koting, S.; Sulong, N.H.R.; Karim, M.R.; Mohammed, S.A.; Ibrahim, M.R. Effect of palm oil clinker (POC) aggregate on the mechanical properties of stone mastic asphalt (SMA) mixtures. Sustainability 2020, 12, 2716. [Google Scholar] [CrossRef]
  63. Wakefield, A. Four Tips for Controlling Asphalt Mix Designs in the Lab and Field; Asphalt Magazine: Lexington, KY, USA, 2020. [Google Scholar]
  64. Ahmadinia, E. Waste Plastic Bottles as Additive for Stone Mastic Asphalt. Master’s Thesis, University of Malaya, Kuala Lumpur, Malaysia, 2012. [Google Scholar]
  65. Muhardi, A.; Marto, A.; Kassim, K.A.; Makhtar, A.M.; Wei, L.F.; Lim, Y.S. Engineering characteristics of Tanjung Bin coal ash. Electron. J. Geotech. Eng. 2010, 15, 1117–1129. [Google Scholar]
  66. Ali, A.H. Influence of Crumb Rubber Modifier on Performance Characteristics of Stone Mastic Asphalt. Master’s Thesis, University of Malaya, Kuala Lumpur, Malaysia, 2013. [Google Scholar]
  67. Gokhale, S.; Choubane, B.; Byron, T.; Tia, M. Rut Initiation Mechanisms in Asphalt Mixtures as Generated Under Accelerated Pavement Testing. Transp. Res. Rec. J. Transp. Res. Board 2008, 1940, 136–145. [Google Scholar] [CrossRef]
  68. Katman, H.Y.; Ibrahim, M.R.; Karim, M.R.; Koting, S.; Mashaan, N.S. Effect of Rubberized Bitumen Blending Methods on Permanent Deformation of SMA Rubberized Asphalt Mixtures. Adv. Mater. Sci. Eng. 2016, 2016, 4395063. [Google Scholar] [CrossRef]
  69. Katman, H.Y.; Ibrahim, M.R.; Karim, M.R.; Mashaan, N.S.; Koting, S. Evaluation of permanent deformation of unmodified and rubber-reinforced SMA asphalt mixtures using dynamic creep test. Adv. Mater. Sci. Eng. 2015, 2015, 247149. [Google Scholar] [CrossRef]
  70. Do, H.S.; Mun, P.H.; Suk keun, R. A study on engineering characteristics of asphalt concrete using filler with recycled waste lime. Waste Manag. 2008, 28, 191–199. [Google Scholar]
  71. Jattak, Z.A.; Hassan, N.A.; Satar, M.K.I.M. Moisture susceptibility and environmental impact of warm mix asphalt containing bottom ash. Case Stud. Constr. Mater. 2021, 15, e00636. [Google Scholar] [CrossRef]
  72. Zeng, M.; Ksaibati, K. Evaluation of moisture susceptibility of asphalt mixtures containing bottom ash. In Proceedings of the Transportation Research Board 82nd Annual Meeting, Washington, DC, USA, 12–16 January 2003; pp. 1–21. [Google Scholar]
Figure 1. SMA20 aggregate gradation.
Applsci 15 06826 g001
Figure 2. Flow chart of experimental work.
Applsci 15 06826 g002
Figure 3. Marshall stability vs CBA mixtures.
Applsci 15 06826 g003
Figure 4. Flow vs. CBA mixtures.
Applsci 15 06826 g004
Figure 5. Bulk-specific gravity vs. CBA mixture.
Applsci 15 06826 g005
Figure 6. Voids in mixture (VIM) vs. CBA mixtures.
Applsci 15 06826 g006
Figure 7. Voids in mineral aggregate (VMA) vs. CBA mixtures.
Applsci 15 06826 g007
Figure 8. (a) FESEM image of raw bottom ash, (b) EDS analysis of raw coal bottom ash.
Applsci 15 06826 g008
Figure 9. FESEM images of SMA mixture containing coal bottom ash at an accelerating voltage of 10 Kv and 5000× magnification: (a) CBA0, (b) CBA10, (c) CBA20, (d) CBA30, (e) CBA50, (f) CBA70, (g) CBA100.
Applsci 15 06826 g009
Figure 10. Cantabro loss for different CBA contents at 300 revolutions.
Applsci 15 06826 g010
Figure 11. Resilient modulus of CBA mixtures.
Applsci 15 06826 g011
Figure 12. Dynamics creep curve for CBA mixtures.
Applsci 15 06826 g012
Figure 13. Ultimate strain for CBA mixtures.
Applsci 15 06826 g013
Figure 14. Tensile strength of CBA mixtures.
Applsci 15 06826 g014
Figure 15. Tensile strength ratio (TSR) of CBA mixtures.
Applsci 15 06826 g015
Table 4. CBA mixture design.
CBA Content (%)CBA MixturesCBA Content (%)
0CBA-0 0
10CBA-1010
20CBA-2020
30CBA-3030
50CBA-5050
70CBA-7070
100CBA-100100
Table 5. Optimum binder content for different CBA contents.
MixtureMaximum Stability
(%)
4% of Air Void, VIM
(%)
Maximum Bulk-Specific Gravity (%) Optimum Binder Content(%)
CBA-104.955.956.795.90
CBA-205.895.476.866.07
CBA-305.355.367.526.08
CBA-505.076.256.926.08
CBA-705.486.126.806.13
CBA-1005.955.816.556.10
Table 6. Analysis of variance (ANOVA) results.
Sum of SquaresdfMean SquareFSig.
Between Groups0.17460.0292.6150.065
Within Groups0.156140.011
Total0.33020
Table 7. Normalized Cantabro loss at 300 revolutions.
CBA Content (%)CBA MixtureNormalized
Control11.431.00
CBA-1010.370.91
CBA-2010.300.90
CBA-3010.060.88
CBA-5013.371.17
CBA-7015.261.33
CBA-10017.231.51
Table 8. Normalized resilient modulus of CBA mixtures.
MixtureCBA Normalized
CBA-083511.00
CBA-1082620.99
CBA-2078030.93
CBA-3074580.89
CBA-5072190.86
CBA-7070190.84
CBA-10069590.83
Table 9. Normalized ultimate strain of CBA mixtures.
MixtureUltimate Strain (µs) Normalized
CBA-032,9061.00
CBA-1021,5350.65
CBA-2020,6670.63
CBA-3020,4000.62
CBA-5013,7470.42
CBA-7026,1700.80
CBA-10032,0700.97
Table 10. Normalized tensile strength ratio (TSR) of CBA mixture.
MixtureTSR (%)Normalized
CBA-086.91.00
CBA-1086.91.00
CBA-2086.40.99
CBA-3084.30.97
CBA-5084.10.97
CBA-7077.70.89
CBA-10075.60.87
Disclaimer/Publisher’s Note: The statements, opinions and data contained in all publications are solely those of the individual author(s) and contributor(s) and not of MDPI and/or the editor(s). MDPI and/or the editor(s) disclaim responsibility for any injury to people or property resulting from any ideas, methods, instructions or products referred to in the content.

